the Creative Commons Attribution 4.0 License.
the Creative Commons Attribution 4.0 License.
 | 21 Nov 2019
Aerosol–cloud closure study on cloud optical properties using remotely piloted aircraft measurements during a BACCHUS field campaign in Cyprus
Radiance Calmer
Gregory C. Roberts
Kevin J. Sanchez
Jean Sciare
Karine Sellegri
David Picard
Mihalis Vrekoussis
Michael Pikridas
In the framework of the EU-FP7 BACCHUS (impact of Biogenic versus Anthropogenic emissions on Clouds and Climate: towards a Holistic UnderStanding) project, an intensive field campaign was performed in Cyprus (March 2015). Remotely piloted aircraft system (RPAS), ground-based instruments, and remote-sensing observations were operating in parallel to provide an integrated characterization of aerosol–cloud interactions. Remotely piloted aircraft (RPA) were equipped with a five-hole probe, pyranometers, pressure, temperature and humidity sensors, and measured vertical wind at cloud base and cloud optical properties of a stratocumulus layer. Ground-based measurements of dry aerosol size distributions and cloud condensation nuclei spectra, and RPA observations of updraft and meteorological state parameters are used here to initialize an aerosol–cloud parcel model (ACPM) and compare the in situ observations of cloud optical properties measured by the RPA to those simulated in the ACPM. Two different cases are studied with the ACPM, including an adiabatic case and an entrainment case, in which the in-cloud temperature profile from RPA is taken into account. Adiabatic ACPM simulation yields cloud droplet number concentrations at cloud base (approximately 400 cm−3) that are similar to those derived from a Hoppel minimum analysis. Cloud optical properties have been inferred using the transmitted fraction of shortwave radiation profile measured by downwelling and upwelling pyranometers mounted on a RPA, and the observed transmitted fraction of solar radiation is then compared to simulations from the ACPM. ACPM simulations and RPA observations shows better agreement when associated with entrainment compared to that of an adiabatic case. The mean difference between observed and adiabatic profiles of transmitted fraction of solar radiation is 0.12, while this difference is only 0.03 between observed and entrainment profiles. A sensitivity calculation is then conducted to quantify the relative impacts of 2-fold changes in aerosol concentration, and updraft to highlight the importance of accounting for the impact of entrainment in deriving cloud optical properties, as well as the ability of RPAs to leverage ground-based observations for studying aerosol–cloud interactions.
- Article
(10590 KB) - Full-text XML
- BibTeX
- EndNote


The influence of aerosol–cloud interactions on the climate is through the first indirect aerosol effect (Twomey, 1974), the second indirect aerosol effect (Albrecht, 1989), and other effects of aerosols on cloud (a comprehensive review is given in Lohmann and Feichter, 2005). As the Intergovernmental Panel on Climate Change (IPCC) report (Boucher et al., 2013) aims to quantify the effective radiative forcing due to aerosol–cloud interactions, discrepancies still remain between observations and model results. Even though the Twomey or cloud-albedo effects might be considered as the most studied, discussions are still ongoing to better understand the correlation between cloud condensation nuclei (CCN), supersaturation (S), updraft (w), cloud droplet number concentration (CDNC), and the impact on cloud albedo depending on the environmental conditions (Hudson and Noble, 2014a; Werner et al., 2014; Cecchini et al., 2017; Sarangi et al., 2018). With the support of 15 years of satellite measurements, calculation of albedo susceptibilities helps to better understand the cloud radiative response due to aerosol–cloud interactions and supports the conclusion that polluted clouds less efficiently change their albedo compared to more pristine clouds for the same change in CDNC (Painemal, 2018). Cloud droplet number concentrations have been the center of interest for satellite retrieval calculations based on cloud optical depth, cloud droplet effective radius, and cloud-top temperature. Nonetheless, a high relative uncertainty is still associated with CDNC (Grosvenor et al., 2018). Bender et al. (2016) also showed disagreement between model and satellite observations for the influence of aerosol loading on cloud albedo. Consequently, climate models tend to overestimate the albedo compared to observations when the contribution of aerosol was considered. Ma et al. (2018) identified steps in satellite retrieval procedures, which led to errors in cloud susceptibilities to aerosols and biased comparison with climate models. More generally, a call for more validation studies in different cloud regimes with in situ data has been expressed (Grosvenor et al., 2018), specifically to provide the whole cloud profile and detailed picture of the causes of differences between in situ measurements, satellite retrievals, and model simulations.
Traditionally, manned aircraft have been used to conduct aerosol–cloud closure studies, where a closure experiment aims to characterize the same parameters of a system with different, independent methods and models to minimize the measurement uncertainties through comparison of derived values (i.e., Weinzierl et al., 2017). Closure studies mainly focus on comparisons between cloud droplet number concentration, obtained from in situ measurements, and calculated from an aerosol–cloud parcel model (ACPM). Conant et al. (2004) presented the first study to achieve a closure within 15 % for cumulus clouds of marine and continental origin during the CRYSTAL-FACE experiment (Key West, Florida, July 2002). Meskhidze et al. (2005) also obtained good agreement, within 30 %, for stratocumulus clouds (CSTRIPE, Monterey, California, July 2003). For a highly polluted environment (ICARTT, Detroit, Michigan, Cleveland, Ohio, 2004), Fountoukis et al. (2007) achieved a closure within 10 % on average. These studies also highlight that cloud droplet number concentrations are more sensitive to aerosol and updraft velocity depending on atmospheric conditions. The aerosol- and updraft-limited regimes for cloud droplet formation were studied with an adiabatic parcel model in Reutter et al. (2009), and a differentiation between the regimes was proposed based on the relative sensitivity ratios (dln CDNC∕dln w and dln CDNC∕dln N). The results of the model were consistent with field observations in clean/polluted environments (Fountoukis et al., 2007; Hudson and Noble, 2014a, b). Previous closure studies on CDNC were only conducted with adiabatic simulations, even if already pointed out in Conant et al. (2004) that (1) the effects of entrainment mixing had to be included for a more comprehensive description of cloud microphysics, and (2) nearly adiabatic profiles were maintained only through the lowest part of the cloud. To address some of the discrepancies in previous studies, a BACCHUS (impact of Biogenic versus Anthropogenic emissions on Clouds and Climate: towards a Holistic UnderStanding) field campaign took place at Mace Head, Ireland, in a clean marine environment in August 2015, coupling ground-based, in situ, and remote-sensing observations with a remotely piloted aircraft system (RPAS) and satellite observations (Sanchez et al., 2017). In this study, cloud droplet number concentration was not measured directly, and the closure study was conducted on cloud optical properties. RPAS measurements of cloud optical properties were more accurately reproduced by an ACPM simulation using a parameterization for entrainment compared to an adiabatic simulation. The present work is based on an analysis that is similar to Sanchez et al. (2017) and further extends aerosol–cloud closures with a sensitivity study on the impacts of aerosol and updraft on cloud optical properties.
Entrainment is well known for influencing the boundary layer and clouds (e.g., Blyth, 1993; Baker, 1992; Carman et al., 2012). Recent works have been published, investigating the role of entrainment and turbulence for broadening the cloud droplet spectra with an adiabatic parcel model (Grabowski and Abade, 2017; Abade et al., 2018), aiming to improve subgrid-scale representation for a large eddy simulation cloud model. Studies of entrainment-mixing mechanisms in cumulus clouds used manned aircraft observations (CIRPAS Twin Otter) to highlight the scale dependence of the mixing processes (Lu et al., 2018). However, as the scale of entrainment processes ranges from kilometers to millimeters, Lu et al. (2014) point out the limitation of a 10 Hz sampling rate with a manned aircraft flying at 50 m s−1 (spatial resolution 5 m). Similar conclusions were also deduced in Burnet and Brenguier (2007) for a resolution scale of 10 m (10 Hz data, manned aircraft Météo-France Merlin IV, NCAR C130) for turbulence and droplet evaporation. In Conant et al. (2004) and Meskhidze et al. (2005), the impact of entrainment was observed; however, the data were screened and only on the case studies approximating adiabatic values were used to show aerosol–cloud closure of cloud droplet number concentrations near cloud base. Remotely piloted aircraft (RPA) bring new possibilities for studying aerosol–cloud interactions and optical cloud properties at higher spatial resolution (i.e., 1.6 m with 10 Hz sampling rate) due to lower airspeed (16 m s−1), which results in a better representation of the cloud.
This study focuses on an aerosol–cloud closure between in-cloud observations of downwelling solar irradiance from RPA and results of an ACPM initialized with RPA and ground-based measurements. The second section introduces the case study observed during the BACCHUS field campaign in Cyprus with a description of the ground-based observations of aerosol number size distribution and CCN, and airborne observations of temperature, relative humidity, vertical wind, particle number, and solar irradiance. The third section of this study focuses on the ACPM and how a parameterization of entrainment mixing is applied to the adiabatic simulation to take into account for the impact of entrainment. The last section highlights the closure on cloud optical properties with a sensitivity study that compares adiabatic profiles from ACPM simulations and the entrainment parameterization.
Cyprus is a highly relevant environment to study aerosols, particularly dust and ice-nucleating particles (e.g., Schrod et al., 2017), as the island is located in the Mediterranean Sea, at the intersection of pollution from Europe and the Middle East, and dust from the Sahara. Cyprus is also impacted by marine aerosols and local anthropogenic emissions. The present study focuses on the BACCHUS field campaign in Cyprus, which took place from 5 March to 2 April 2015. Ground-based instruments, remote sensing, and RPAS activities contributed to the field campaign. A total of 52 scientific flights were conducted with the RPAS platforms corresponding to 38 h of airborne observations. This case study concentrates on 1 d flight measurements and contains all of the necessary elements to study aerosol–cloud interactions by combining the RPA measurements with aerosol and CCN measurements on the ground. The purpose of this case study is to use in situ ground-based and airborne observations to initialize an aerosol–cloud parcel model and compare in situ observations of cloud optical properties to those simulated in the ACPM. The present case study focuses on a RPA flight on 1 April 2015, which measured convective updrafts at cloud base and cloud optical properties of a stratocumulus layer (Fig. 1).
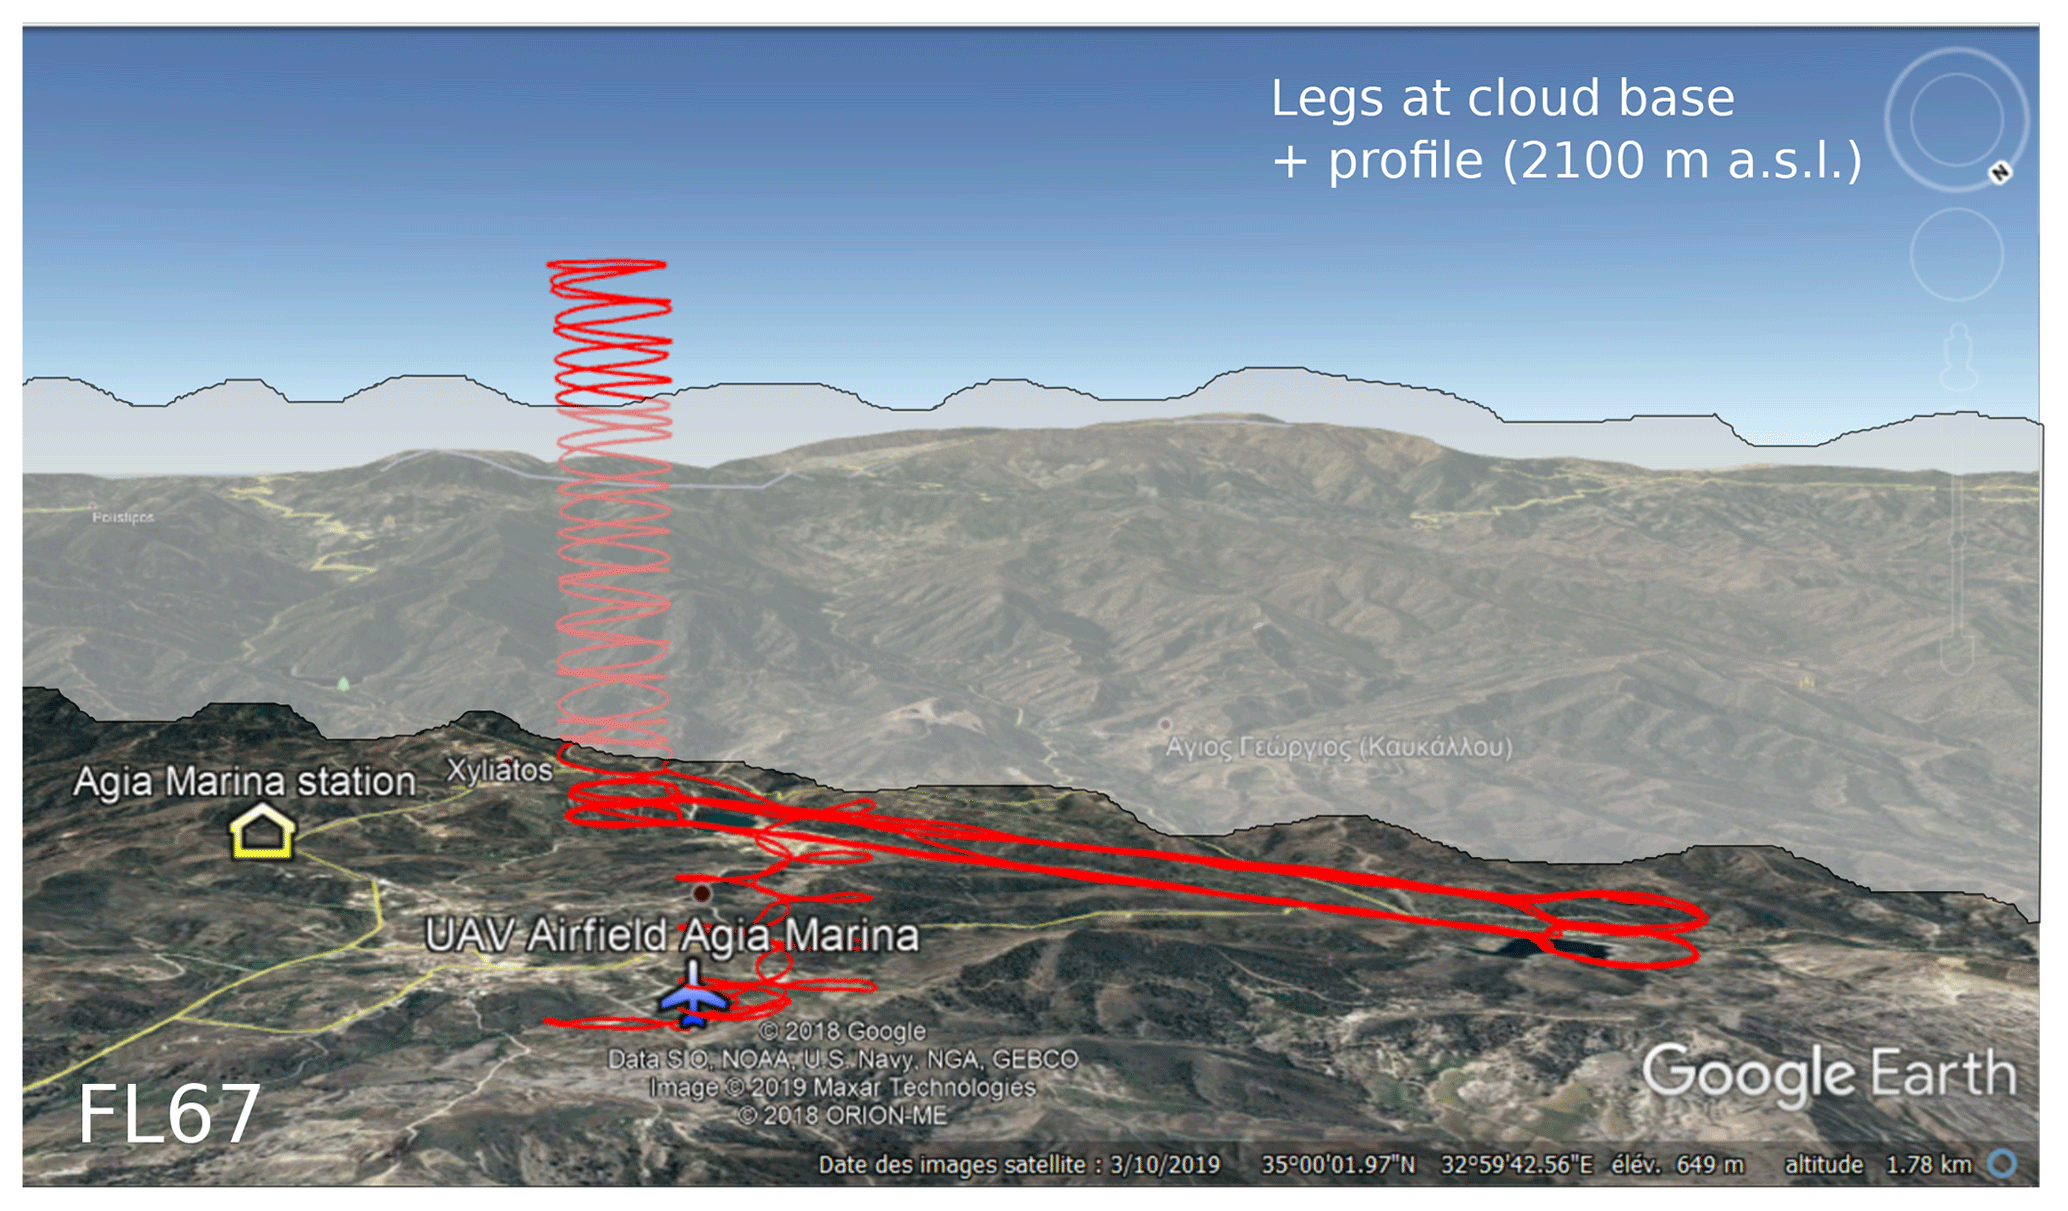
Figure 1Flight plan for the flight (Flight 67), legs at 1000 m a.s.l., profile up to 2100 m a.s.l., and legs at 950 m a.s.l. The approximate location of the stratocumulus layer is overlaid on the flight track.
2.1 Ground-based observations
The Cyprus Atmospheric Observatory at Agia Marina Xyliatou (40 km west of Nicosia; 35.0386∘ N, 33.0577∘ E; 535 m a.s.l., meters above sea level) is operated by the Cyprus Institute and provided complementary measurements of physicochemical properties of aerosols during the BACCHUS field campaign. Atmospheric studies including data from the Agia Marina station in Cyprus have already been published on ozone concentration observations (Kleanthous et al., 2014) and particle matter variability (Pikridas et al., 2018). The station is part of the WMO-GAW regional station, EMEP and AERONET networks. Among the instrumentation installed at the ground-based site, multiple measurement devices provided input to conduct an aerosol–cloud closure study. A miniature CCN instrument provides the number of activated particles at 0.24 % supersaturation (Roberts and Nenes, 2005). A scanning mobility particle sizer (Grimm 5400 SMPS) measures the aerosol number dry size distribution from 10 to 360 nm diameter. An optical particle counter (Grimm OPC 1.108) gives the number of particles per bin for dry sizes between 0.3 and 20 µm (14 bins). A condensation particles counter (CPC, model TSI 3010) counts the total aerosol concentration (particle diameter Dp>10 nm) and is also used to normalize the SMPS measurements. An aerosol chemical speciation monitor (Q-ACSM, Aerodyne Research Inc.) provides the chemical composition of non-refractory submicron aerosol particles with a range from 40 nm to 1 µm diameter. The ground-based measurements were conducted at a site that was 2 km from the RPAS operations.
2.2 Particle size distribution
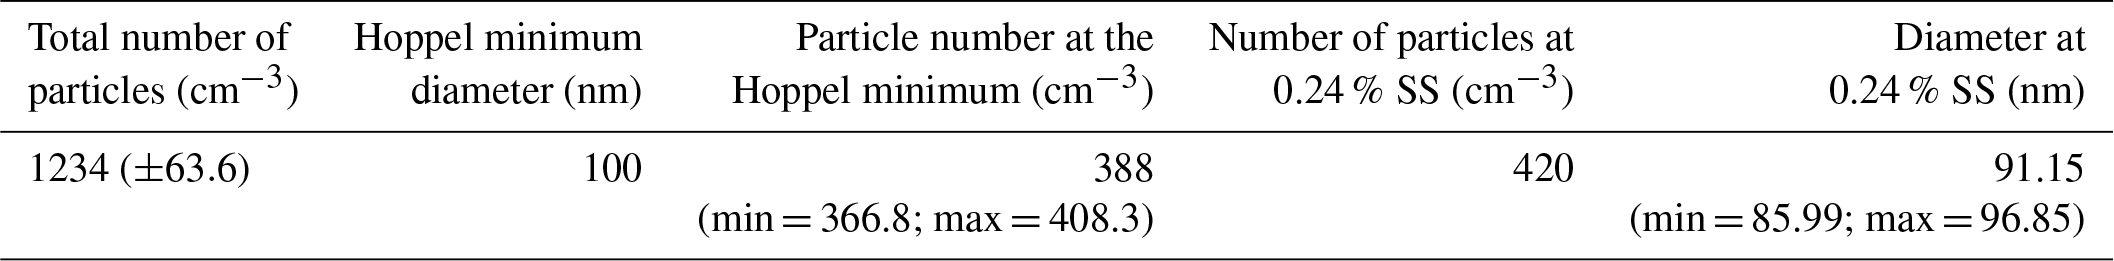
Figure 2 shows the time series of the aerosol particle number distributions for 1 April 2015 measured at the Cyprus Atmospheric Observatory, where the black rectangle represents the period selected to average the aerosol size distribution and the magenta lines represents the time period of the RPA flight (takeoff at 14:00 LT, 11:00 UTC). The aerosol particle number size distribution shows the presence of modes at 50 and 150 nm, with a trough near 100 nm implying cloud-processed aerosol. Figure 3a presents the average size distribution from normalized SMPS, as well as ground-based and RPA OPC measurements. A minimum at 100 nm (known as the Hoppel minimum) is visible in Fig. 3a. OPC concentrations of ground-based and RPA measurements (from surface to cloud base) are within a factor of 2, which is within variability observed at the ground station on 1 April 2015. As the CPC measurements ended on 27 March 2015 (end of the BACCHUS field campaign), no simultaneous measurements of aerosol number concentrations between the CPC and the SMPS are available for the case study day. Therefore, to quantify uncertainties between the integrated SMPS and CPC aerosol concentrations, CPC and SMPS data were compared for a 1-week period (20 to 27 March 2015). The CPC is a reference-counting instrument and used to normalize the integrated SMPS concentration (Wiedensohler et al., 2012). To account for uncertainties associated with the SMPS inversion routines, we compare periods with and without new particle formation events, and the integrated SMPS∕CPC ratio shows a mean value of 0.63±0.16 and 0.65±0.15, respectively. Consequently, we use the minimum ratio (approximately 0.5) as the lowest concentration for the ACPM simulations (Sect. 3.2). On the timescale of hours, the inactivated CCN, or interstitial aerosol, do not change size or critical supersaturation (SS) (Hoppel et al., 1996). The cumulative distribution of particle number (based on SMPS and OPC measurements; Fig. 3b) is used to estimate the number of particles that can grow into cloud droplets at a given diameter. In Fig. 3, the Hoppel minimum diameter at 100 nm corresponds to 388 cm−3 particles that activate to form cloud droplets. Similarly, based on the CCN measurements at the ground station, the CCN concentration at 0.24 % SS corresponds to 420 cm−3, which corresponds to a dry critical diameter of 94.5 nm (Fig. 3b) and is similar to the diameter corresponding to the Hoppel minimum in Fig. 13a. These results suggest that a characteristic in-cloud supersaturation is close to 0.24 % SS. Table 1 summarizes these parameters, diameters, and concentrations. We expect to observe the Hoppel minimum or a break in the aerosol number size distribution at the diameter that corresponds to CCN particles which grow into cloud droplets at cloud base near adiabatic conditions.
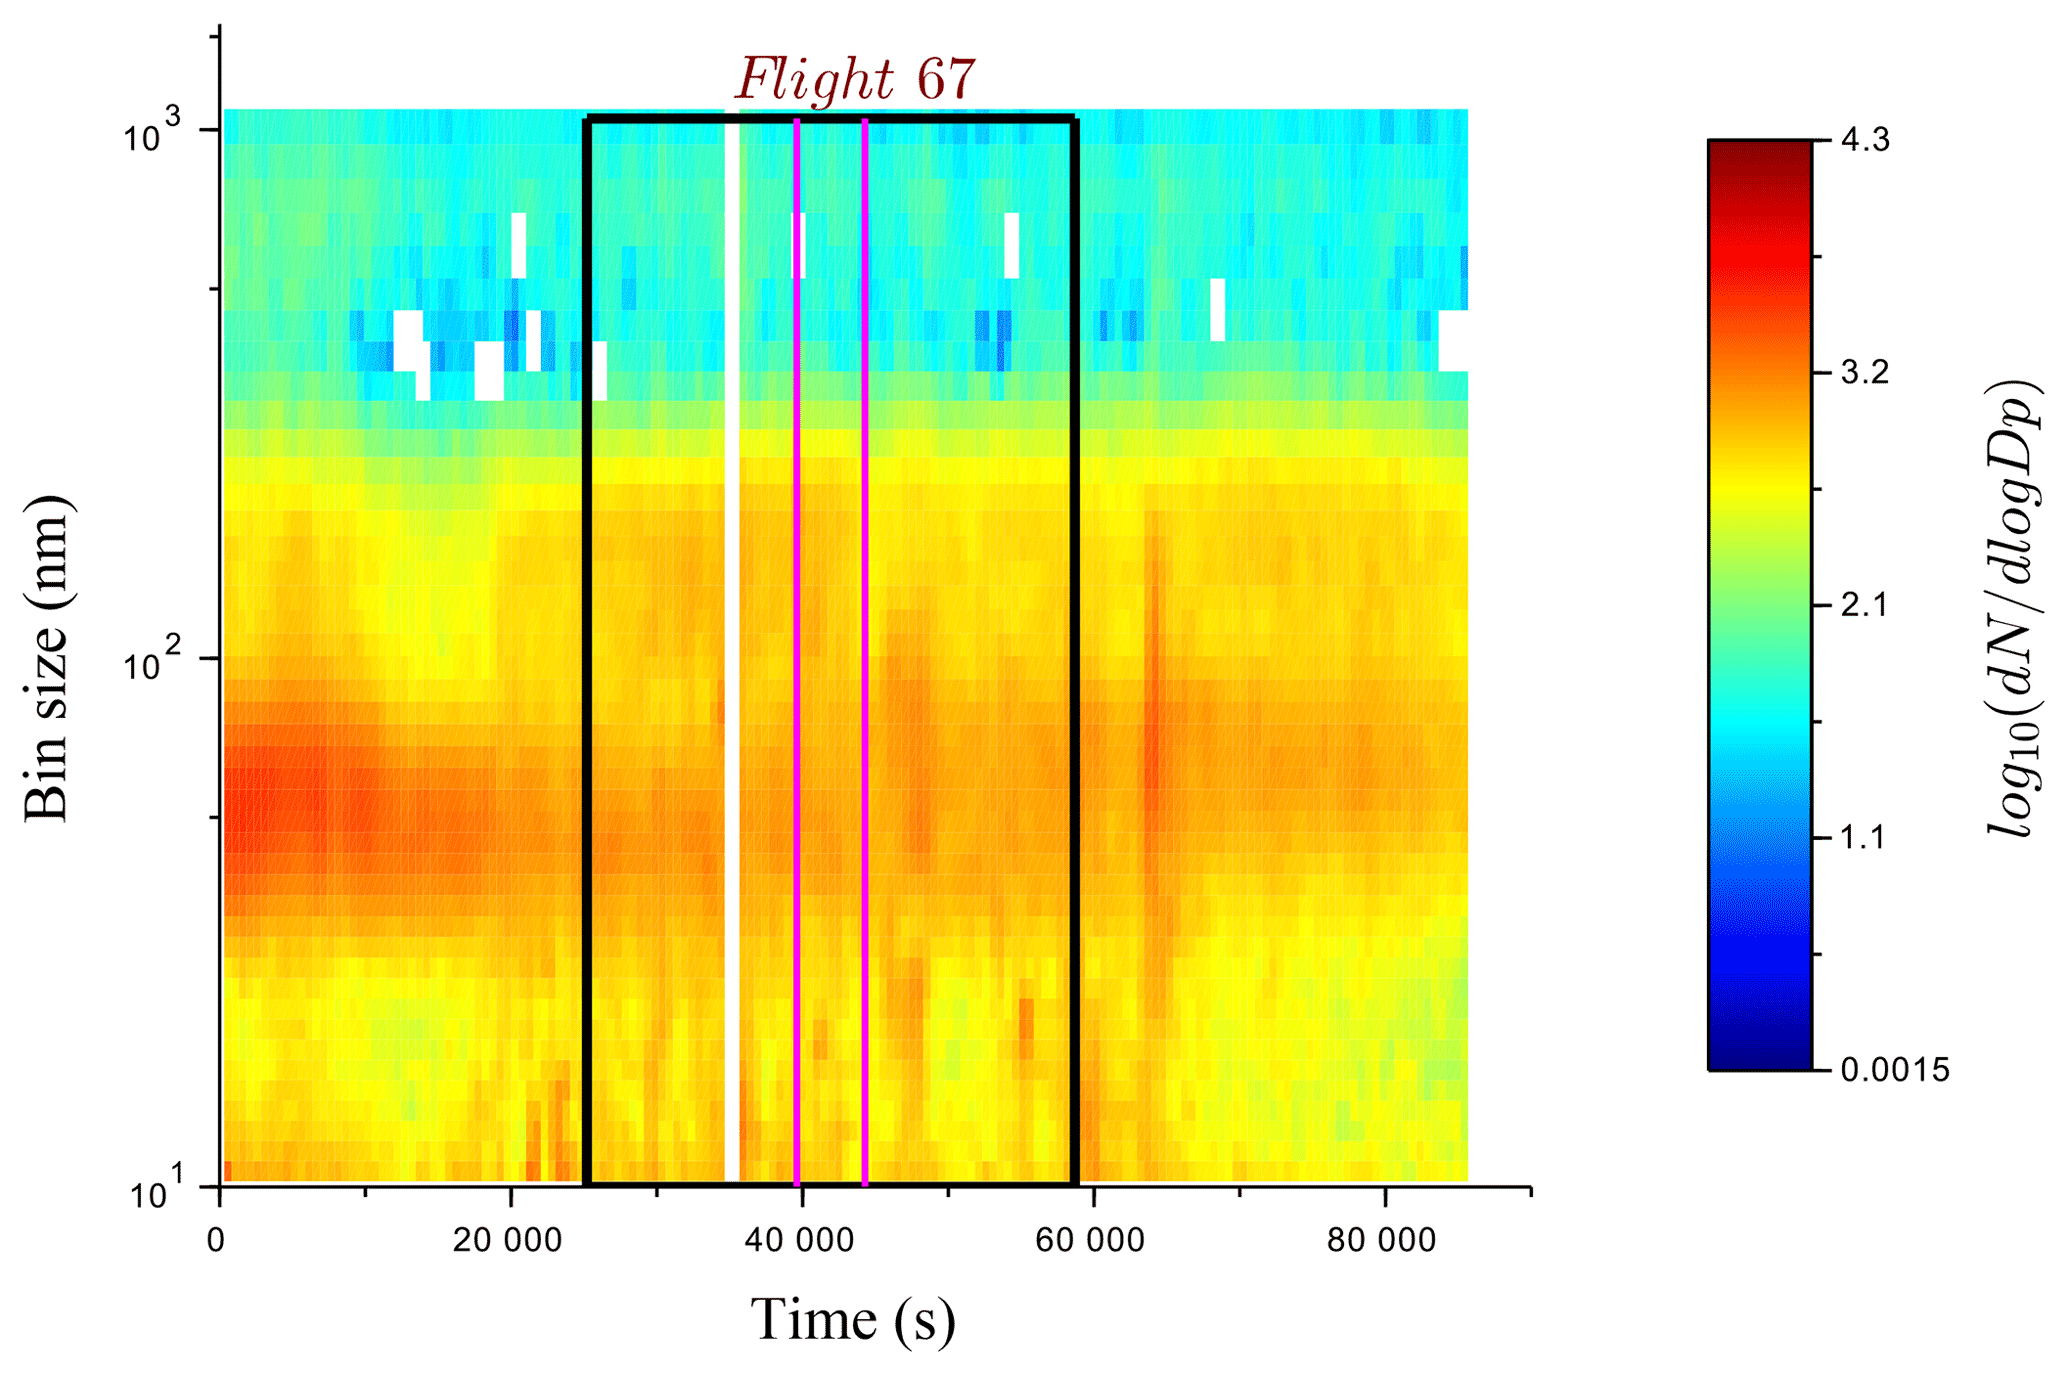
Figure 2Contour plot showing time series of SMPS data from 1 April 2015. The black rectangle represents the selected data for the analysis (8 h) and the magenta lines delimit the flight (Flight 67). Local pollution, which is not representative of the regional aerosol, has been removed (white).
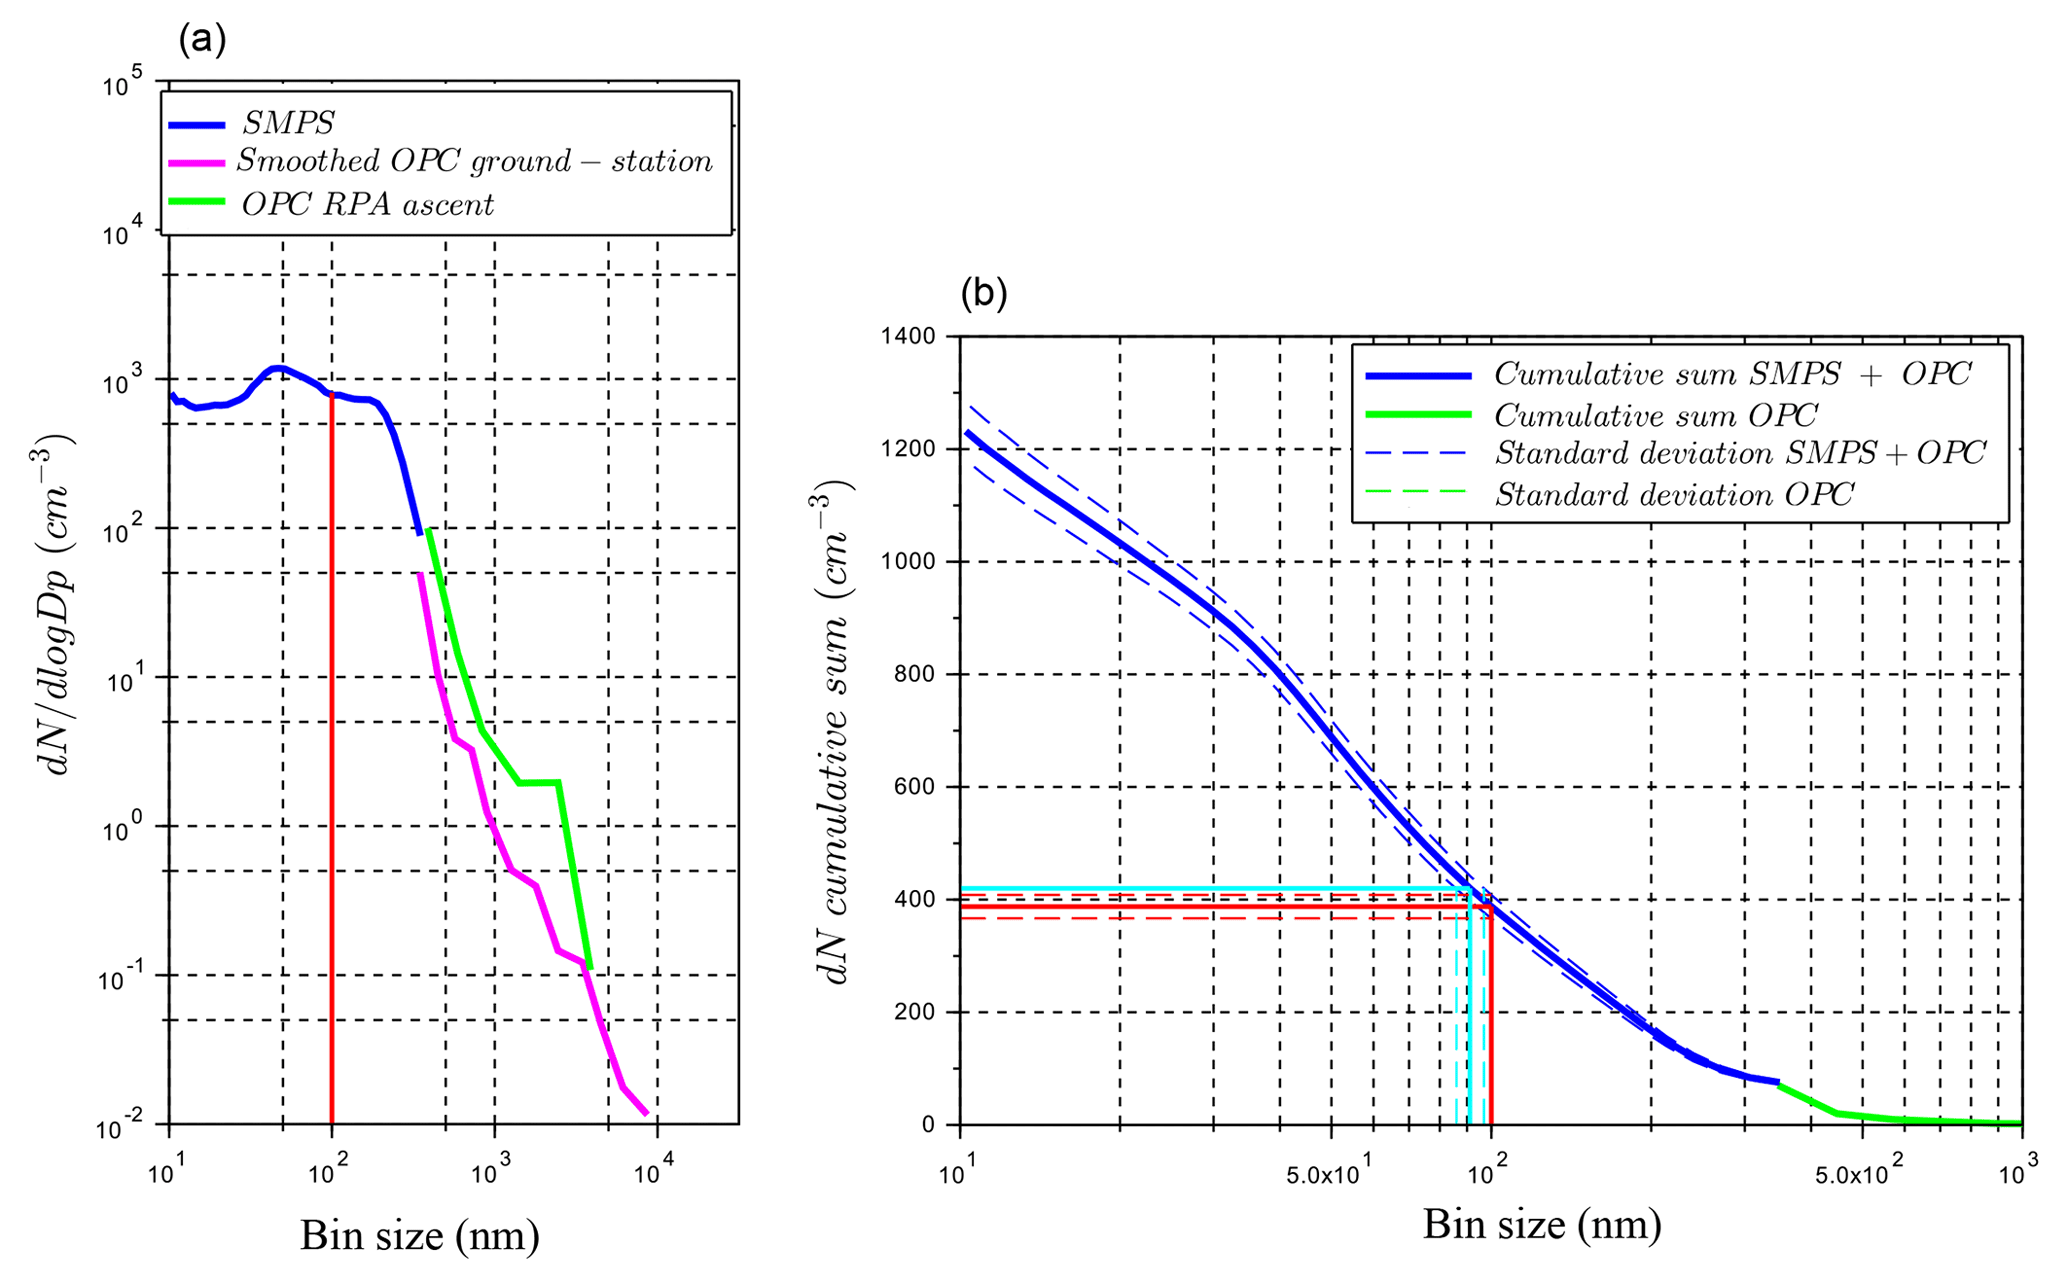
Figure 3(a) Particle size distribution showing combined data from the SMPS (blue), the ground-based OPC (magenta), and the RPA-OPC (green). The red line indicates the Hoppel minimum diameter. (b) Cumulative particle size distribution with a combination of data from the SMPS and the ground-based OPC. The solid red lines indicate the number of particles at the Hoppel minimum diameter (100 nm); the dotted red lines correspond to the associated number of particles for the standard deviation of the cumulative sum. The solid cyan lines correspond to the aerosol diameter for 420 cm −3 particles (SS of 0.24 %), as measured by the CCN instrument. The dotted cyan lines indicate the aerosol diameters for the standard deviation of the cumulative sum. The values are written in Table 1.
Table 1Particle number distribution from SMPS and OPC during the period including the flight. The values are obtained from Fig. 3. The minimum and maximum values are based on the standard deviation of the cumulative sum of the number of particles N.
2.3 RPAS observations
The RPAs are commercially available Skywalker X6 models that have been modified to be equipped with atmospheric measurement instruments (Fig. 4). The wingspan is 1.5 m, and takeoff weight varies between 1.5 and 2.5 kg depending on the mission specific payload. The RPA's autonomous navigation system is the open-source autopilot Paparazzi from Ecole Nationale de l'Aviation Civile (Brisset et al., 2006). All the RPAs measured temperature (IST, Model P1K0.161.6W.Y.010), absolute pressure (All Sensors, Model 15PSI-A-HGRADE-SMINI), and relative humidity (IST, P14 Rapid-W). Measurement errors for the relative humidity and temperature sensors are ±5 % and ±0.5 ∘C, respectively. The RPAs had a video camera attached to the wing (Camsports EVO PRO 2). The Centre National de Recherches Météorologiques (CNRM) group deployed different types of instrumented RPAs. Among them was an aerosol RPA, equipped with an optical particle counter (OPC, Met One Model 212-2, for aerosol size between 0.3 and 3 µm), and a wind RPA, equipped with a five-hole probe (Aeroprobe Corporation) and an inertial navigation system (INS, Lord Sensing Microstrain 3DM-GX4-45) to measure vertical wind near cloud base and pyranometers (LICOR LI-200R pyranometers, from 400 to 1100 nm wavelengths) to measure cloud optical properties. The field to operate the RPAS (35.056429∘ N, 33.055761∘ E; 450 m a.s.l.) was located 1 km north of the Cyprus Atmospheric Observatory instrumented site. A rectangular airspace approximately 2.6×1.7 km2 was used for the flight operations with a ceiling at 2286 m a.s.l. (7500 ft a.s.l.).
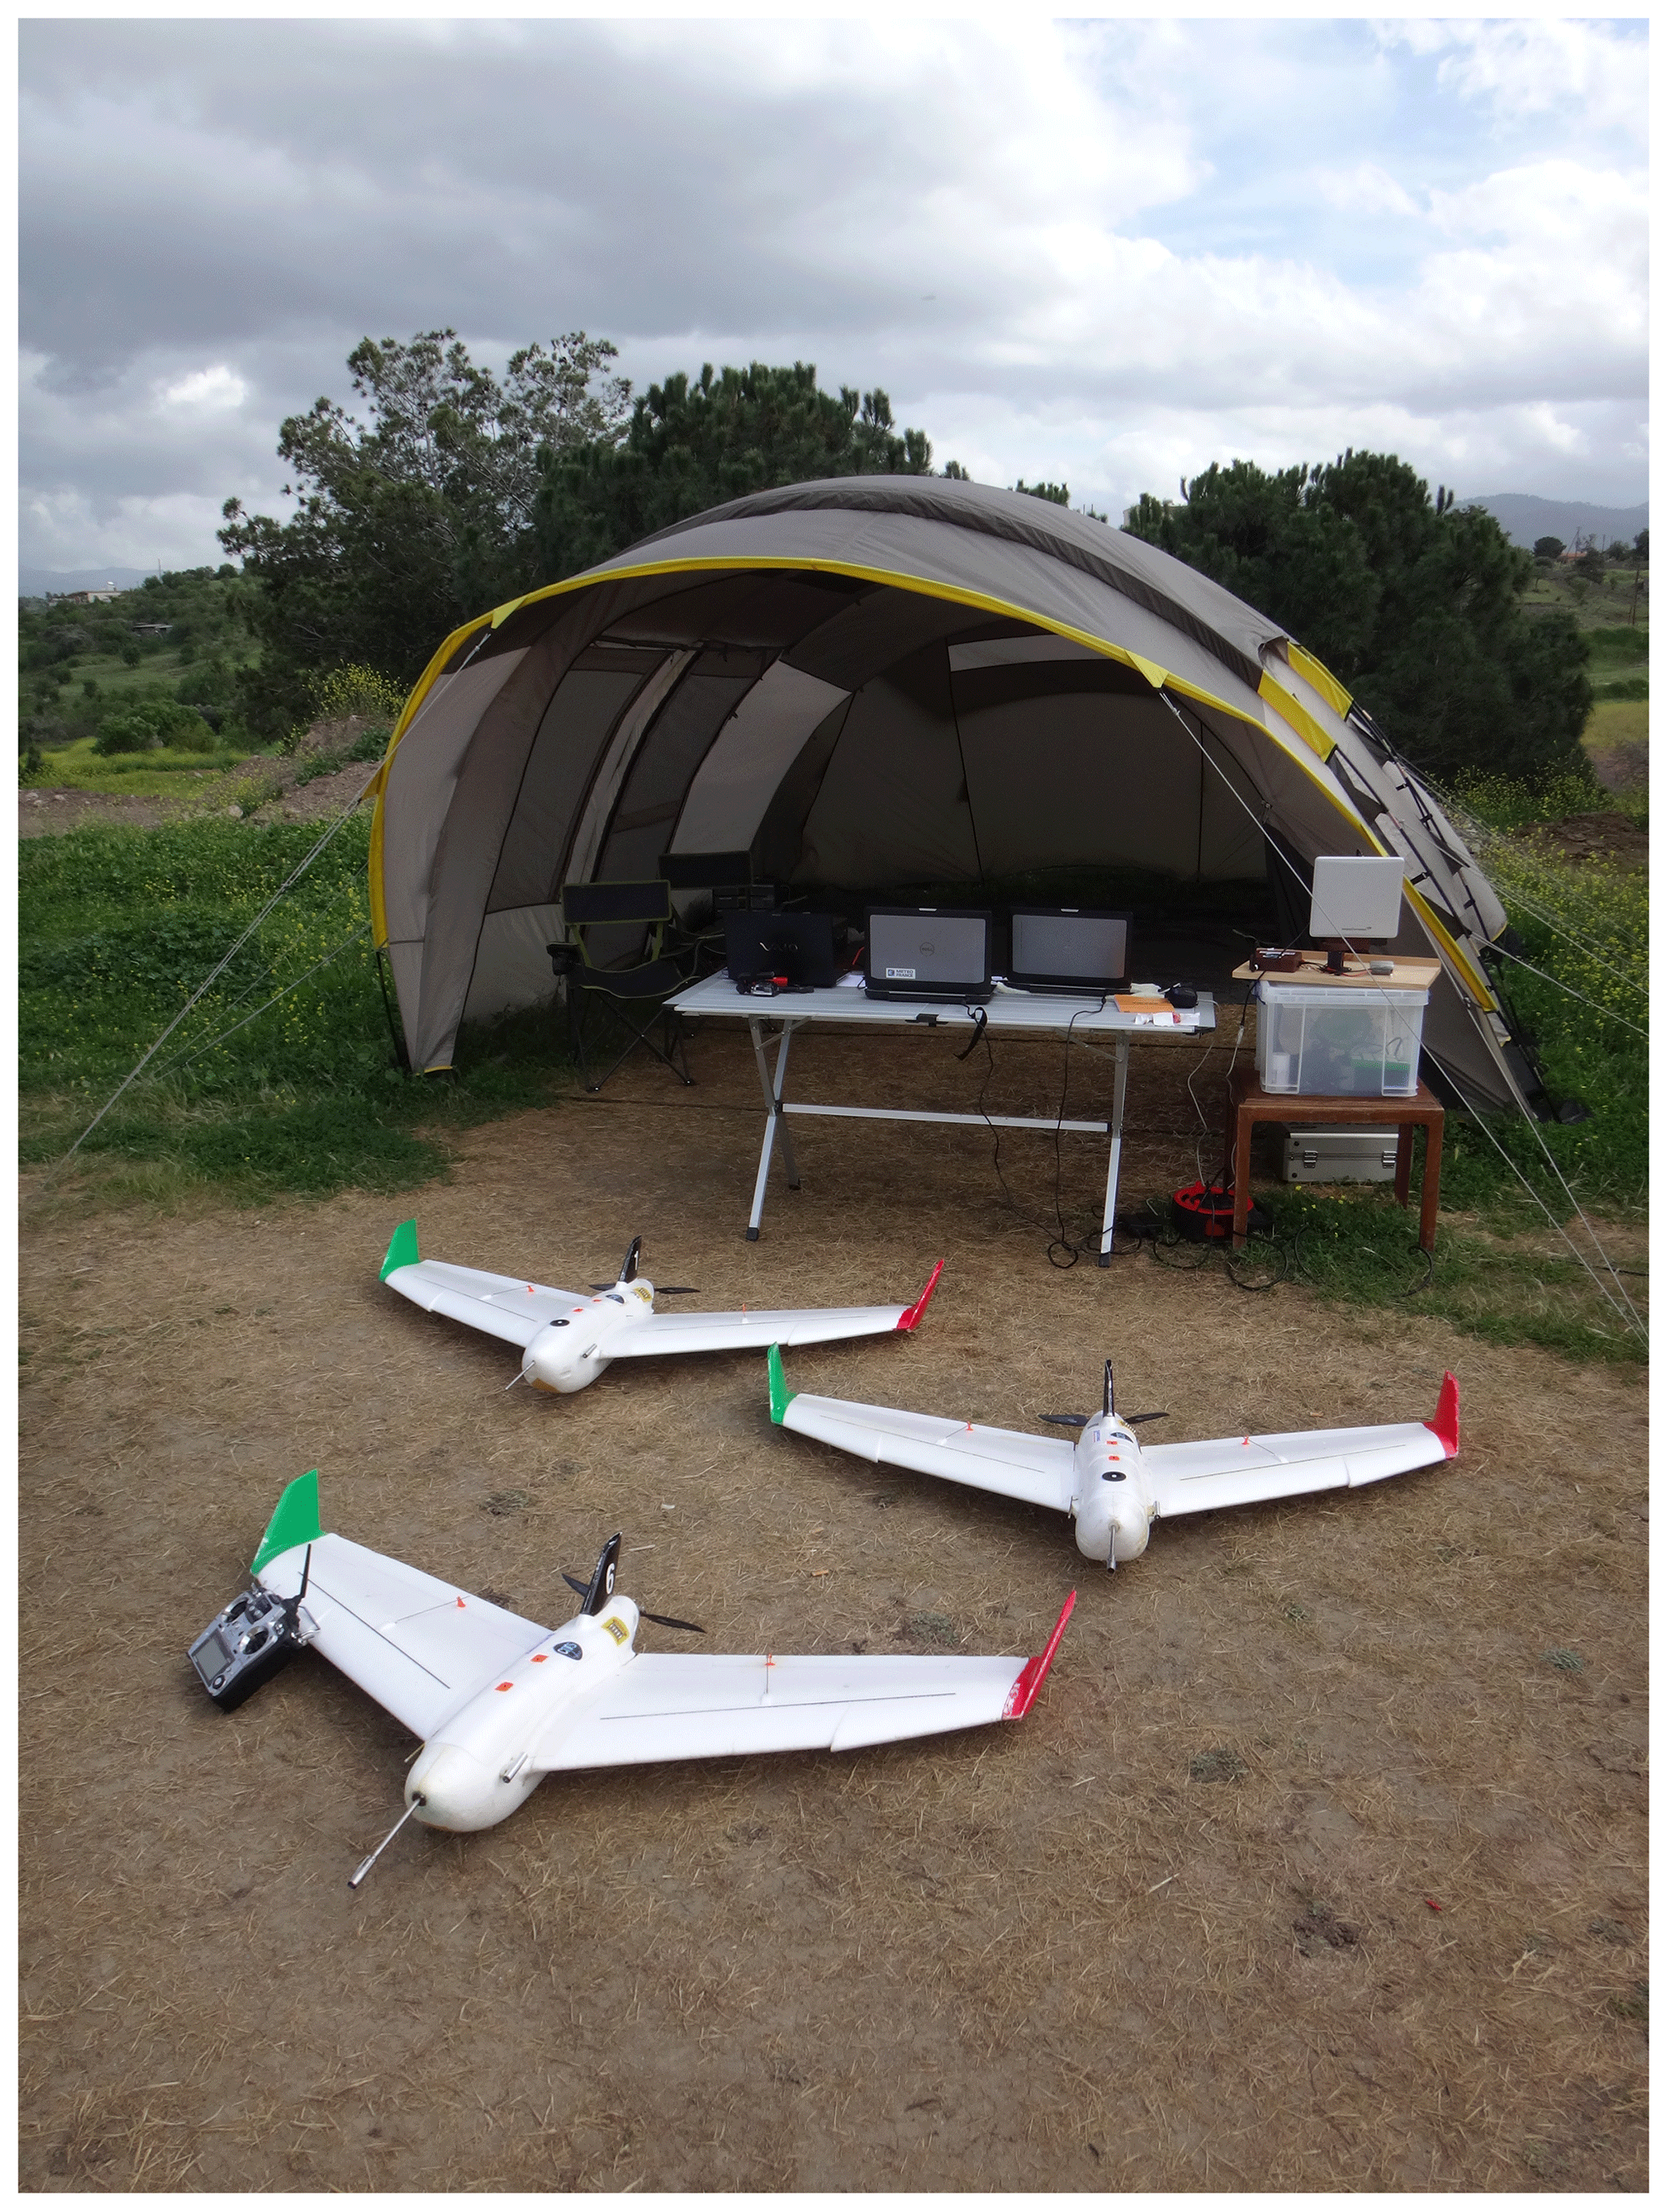
Figure 4Remotely piloted aircraft on the operation field during the BACCHUS field campaign in Cyprus (March 2015).
2.4 Case study: stratocumulus layer
The flight with the wind RPA took place on 1 April 2015 at 11:00 UTC (Flight 67) for a duration of 1 h and 20 min. The flight plan, as shown in Fig. 1, consisted of a first set of 1.5 km straight-and-level legs at 1000 m a.s.l. near cloud base, then a profile up to 2100 m a.s.l. through the stratocumulus layer, and another set of straight-and-level legs at 950 m a.s.l. Figure 5 shows the vertical wind distributions measured by the wind RPA for the two sets of legs before and after the profile through the cloud layer. Even as the altitude of the legs were slightly different (1000 and 950 m a.s.l.) because of an evolving boundary layer, nearly the same vertical wind distributions are obtained before and after the cloud layer sampling. The similarity between the vertical wind distributions demonstrates that the boundary layer dynamics were relatively constant throughout the flight and that the five-hole probe functioned well even after a profile through the cloud layer. Comparing Fig. 5 with vertical wind distributions obtained during the BACCHUS field campaign at Mace Head Research Station in Ireland (Calmer et al., 2018; Sanchez et al., 2017), it is noticeable that the vertical wind distribution for the Cyprus case study is wider than the distributions obtained in Ireland (Cyprus: vertical wind <4 m s−1; Ireland: vertical wind <2 m s−1). The pictures in Fig. 6 captured during the flight by the video camera show the cloud base and cloud top of the stratocumulus layer. By combining information between the video camera and the altitude of the wind RPA, the history of the flight is described in Table 2. Each period is also confirmed by pyranometer measurements (Fig. 7). Broadband shortwave pyranometers mounted on the top and at the bottom of the RPA fuselage provided upwelling and downwelling profiles of solar irradiance. Normalized pyranometer profiles are shown without correction of the oscillations due to the cosine-angle response of direct sunlight on the sensor (Fig. 7). These oscillations are particularly visible on the downwelling pyranometer above the cloud layer. Results highlight the fraction of shortwave radiation of the incoming solar irradiance through the cloud layer. The profiles of cloud-measured optical properties from the RPA are compared in the next section with those of the ACPM. Figure 8 shows the Hybrid Single-Particle Lagrangian Integrated Trajectory (HYSPLIT) model (Stein et al., 2015) run for 3 d ending at 1000 m a.s.l. (altitude of cloud base) over the field site at 12:00 UTC on 1 April 2015. The back-trajectories show air masses originated from the western Mediterranean Basin, with trajectories carrying anthropogenic sources from southern Europe, northern Africa, and Turkey. The aerosol number concentrations are similar to the regional urban background (Reddington et al., 2011) mixed with particles from recent particle formation events and sea salt emissions.
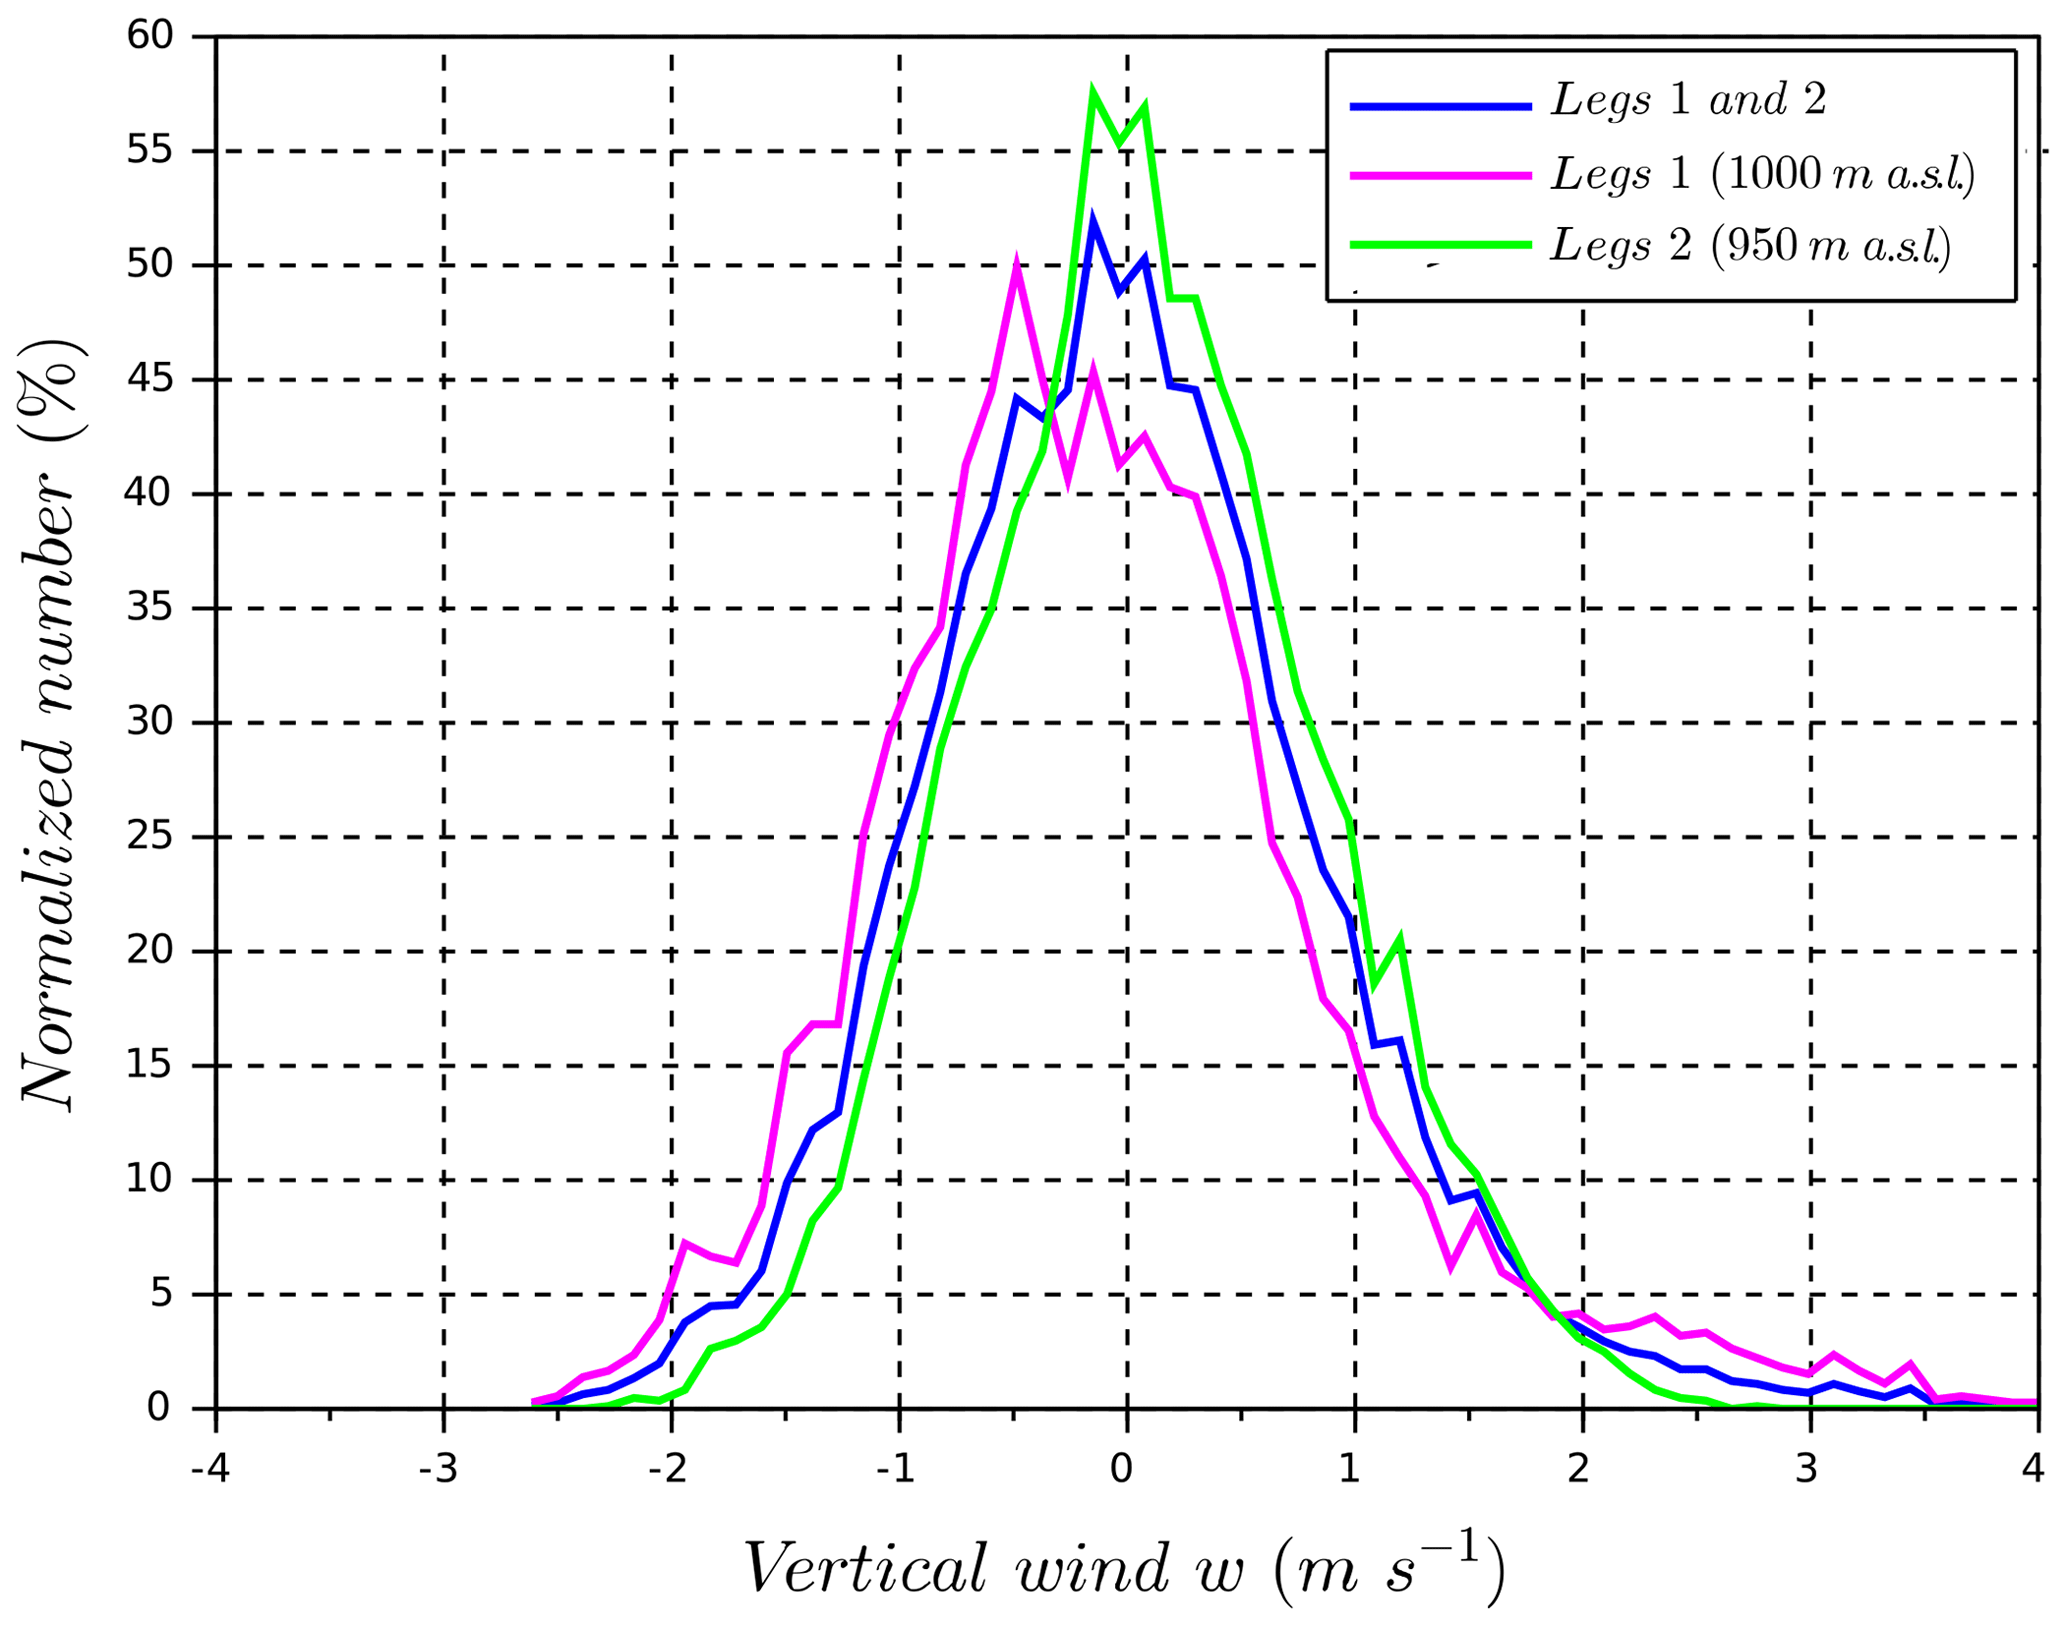
Figure 5Vertical wind distributions from straight-and-level legs near cloud base during the flight.

Figure 6Pictures of the flight from the onboard video camera (Table 2): (a) near cloud base (1000 m a.s.l.) and (b) above clouds (2000 m a.s.l.).
Table 2Profile history from cloud base (1000 m a.s.l.) to the ceiling (2100 m a.s.l.) and down near cloud base again (950 m a.s.l.) during the flight.
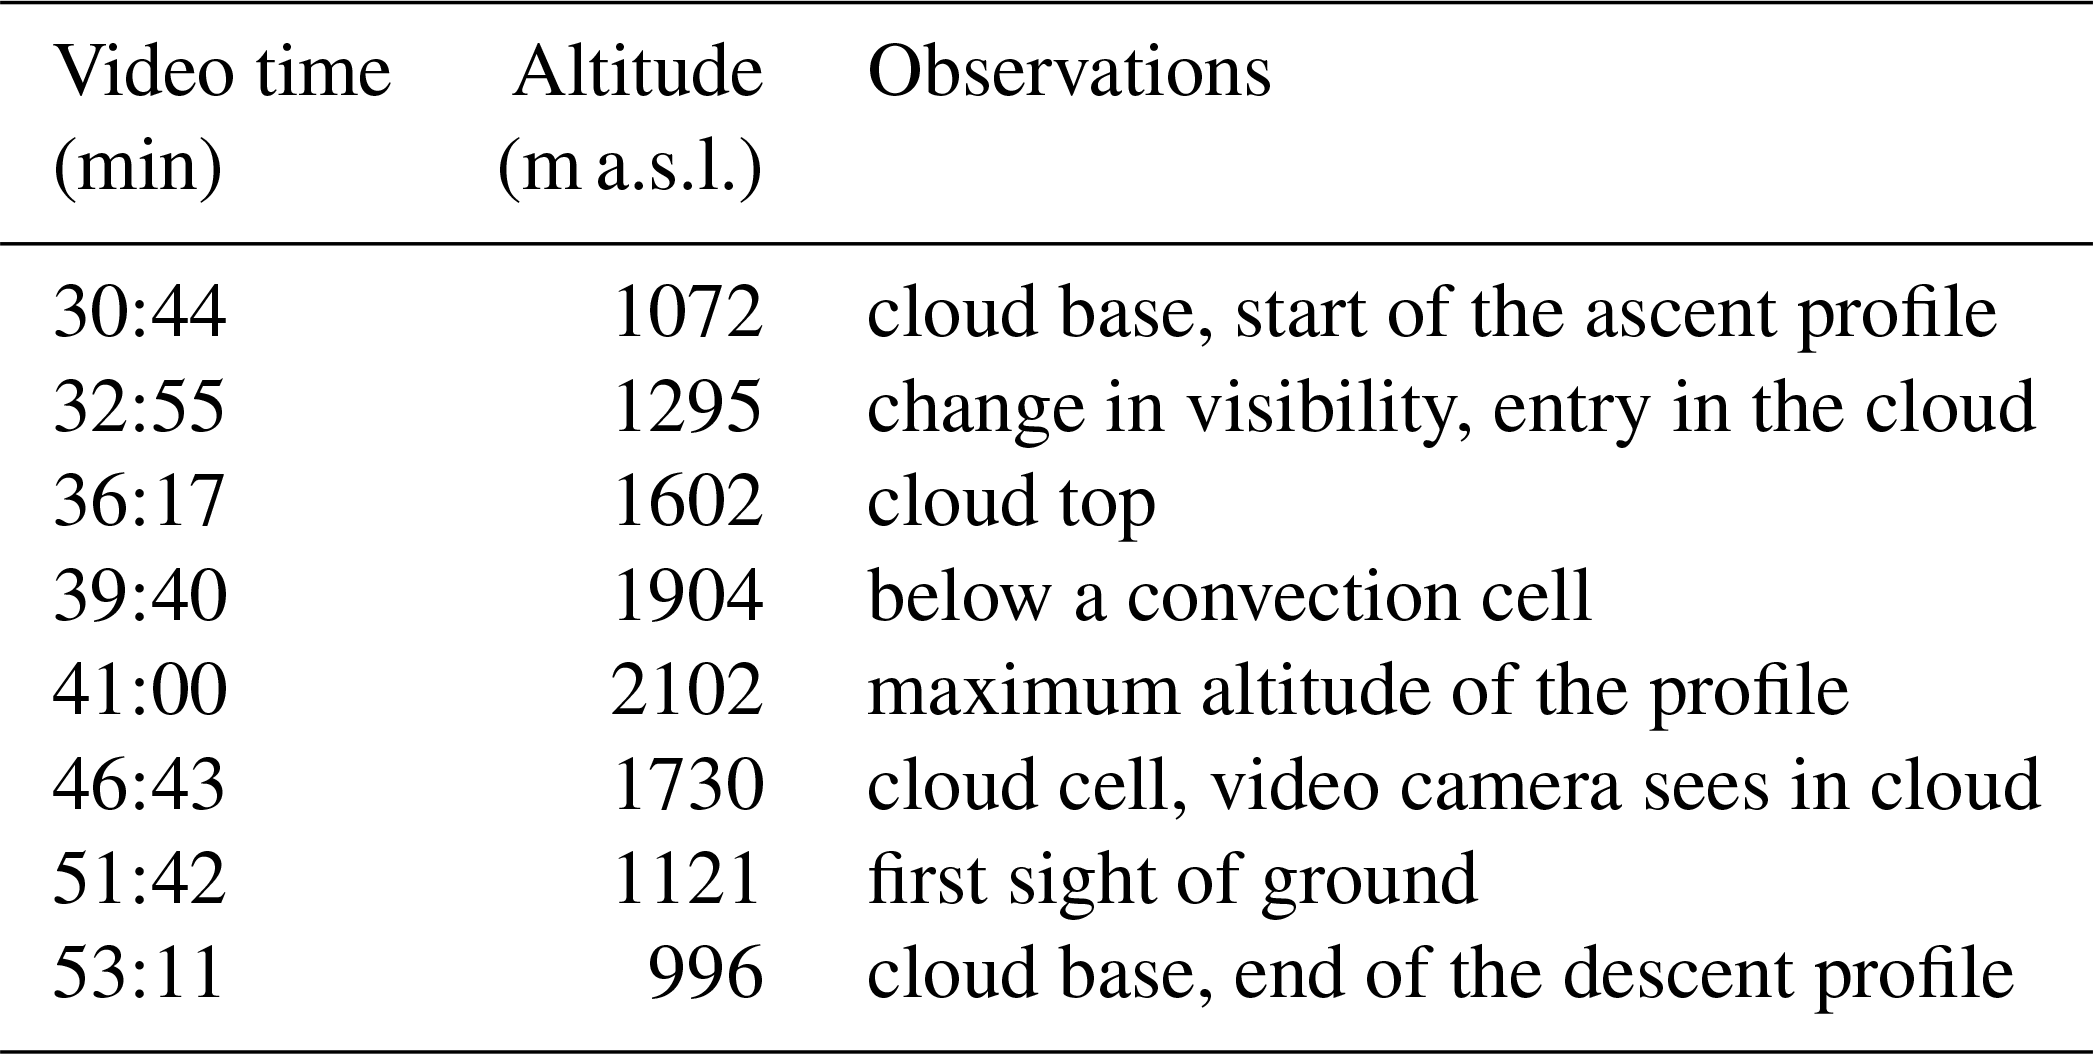
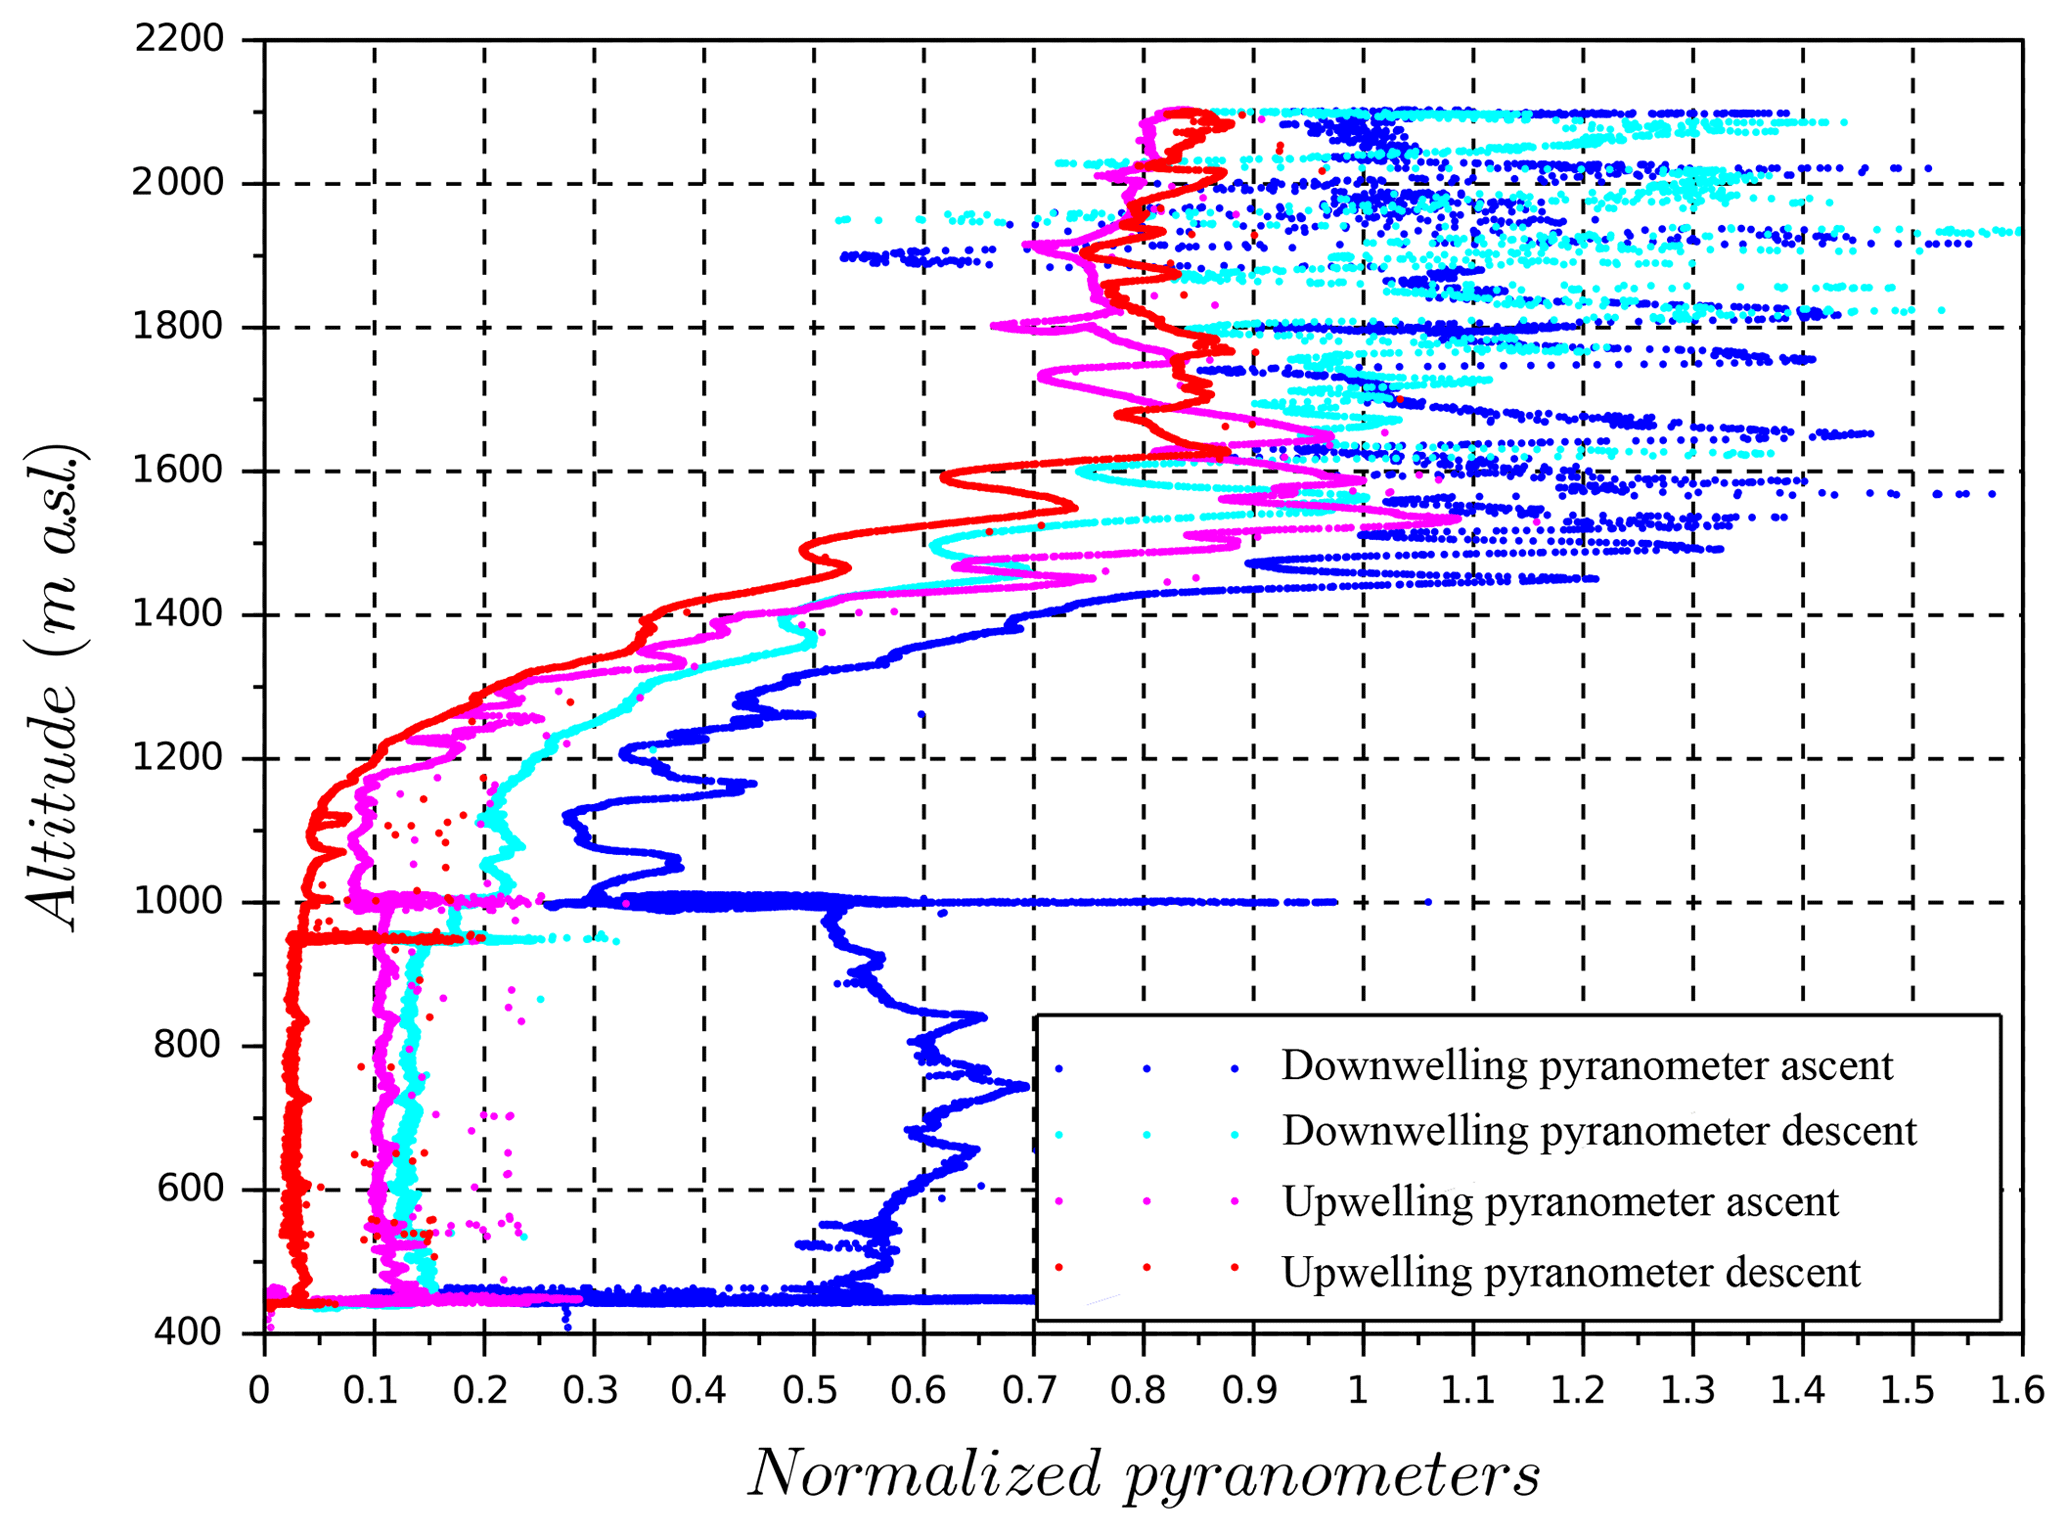
Figure 7Solar irradiance profiles from normalized pyranometer measurements during the flight. The normalization parameter is the measured solar irradiance for clear sky, above the cloud layer, validated from the pyranometer profiles and the video camera (above 1600 m a.s.l.).
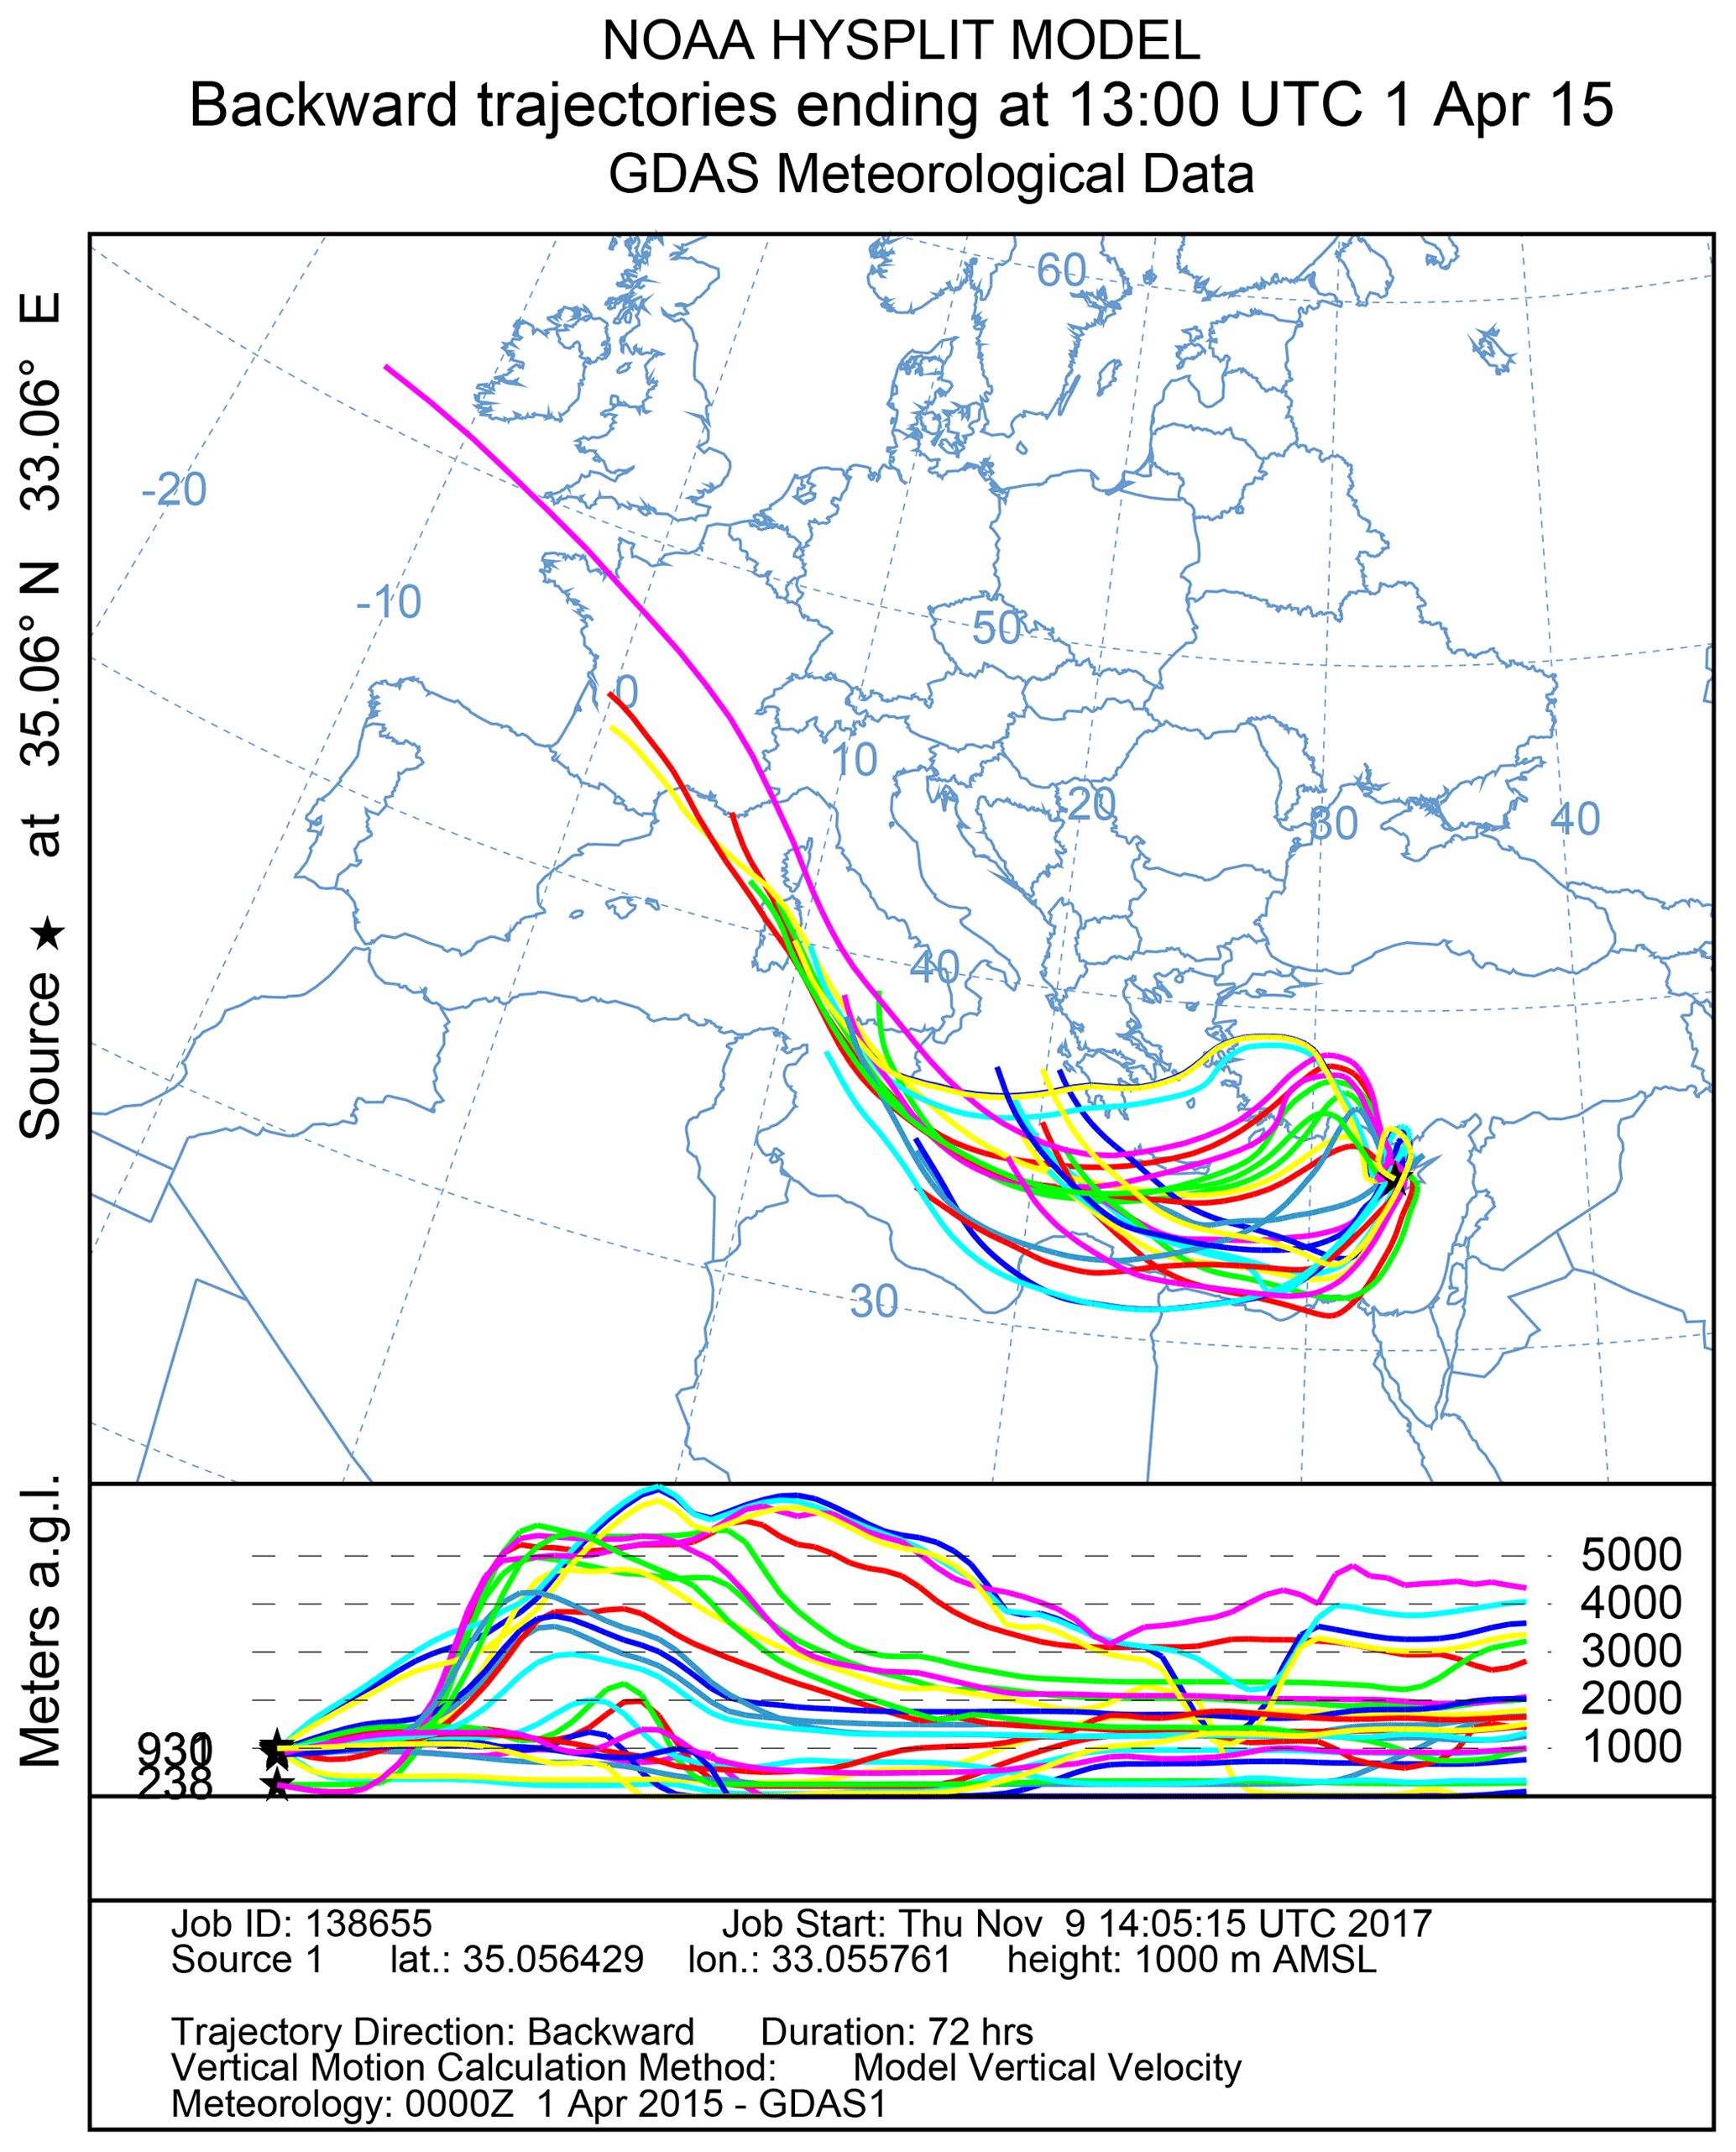
Figure 8HYSPLIT model showing 3 d back-trajectories from 1 April 2015. The black star shows the location of the ground station and RPA operations near Agia Marina Xyliatou in Cyprus.
2.5 RPA vertical profiles
Figure 9 presents ascent profiles of the atmosphere sampled by the wind RPA during the flight. Profiles of temperature and relative humidity during the ascent and the descent of the RPA are similar, particularly in clouds. The temperature in the boundary layer decreases −10.1 ∘C km−1, which is close to a dry adiabatic lapse rate. In clouds, the lapse rate changes to −4.5 ∘C km−1 (Fig. 9a). The relative humidity increases from 75 % at the ground to 100 % at the cloud base (1020 m a.s.l.) and then decreases again at cloud top (Fig. 9b). As mentioned in Sanchez et al. (2017), measurement error for the relative humidity is ±5 %; however, as the sensors are not accurate at RH > 90 %, the measured values have been scaled such that the air inside the cloud is saturated (i.e., RH is 100 %). The in situ measurements have been approximated by linear expressions that serve as input parameters for the ACPM in Sect. 3.2 (magenta lines in Fig. 9). The profile of equivalent potential temperature, which is conserved for changes in the air parcel pressure in Fig. 9c, shows a neutrally buoyant layer below the cloud base, which implies a well-mixed boundary layer. In addition, profiles of aerosol number concentrations (Fig. 10) are measured during an earlier flight on the same day (Flight 65, aerosol RPA, 08:50 UTC, 11:50 LT) and present similar concentrations in the atmospheric boundary layer from the ground to cloud base (1020 m a.s.l.). This observation also confirms a well-mixed boundary layer, such that ground-based CCN and aerosol size distributions are then representative of the aerosol concentrations at cloud base.

Figure 9Meteorologic profiles during the flight: (a) temperature and (b) relative humidity. The magenta curves correspond to the linear best fit implemented in ACPM. (c) Equivalent potential temperature.
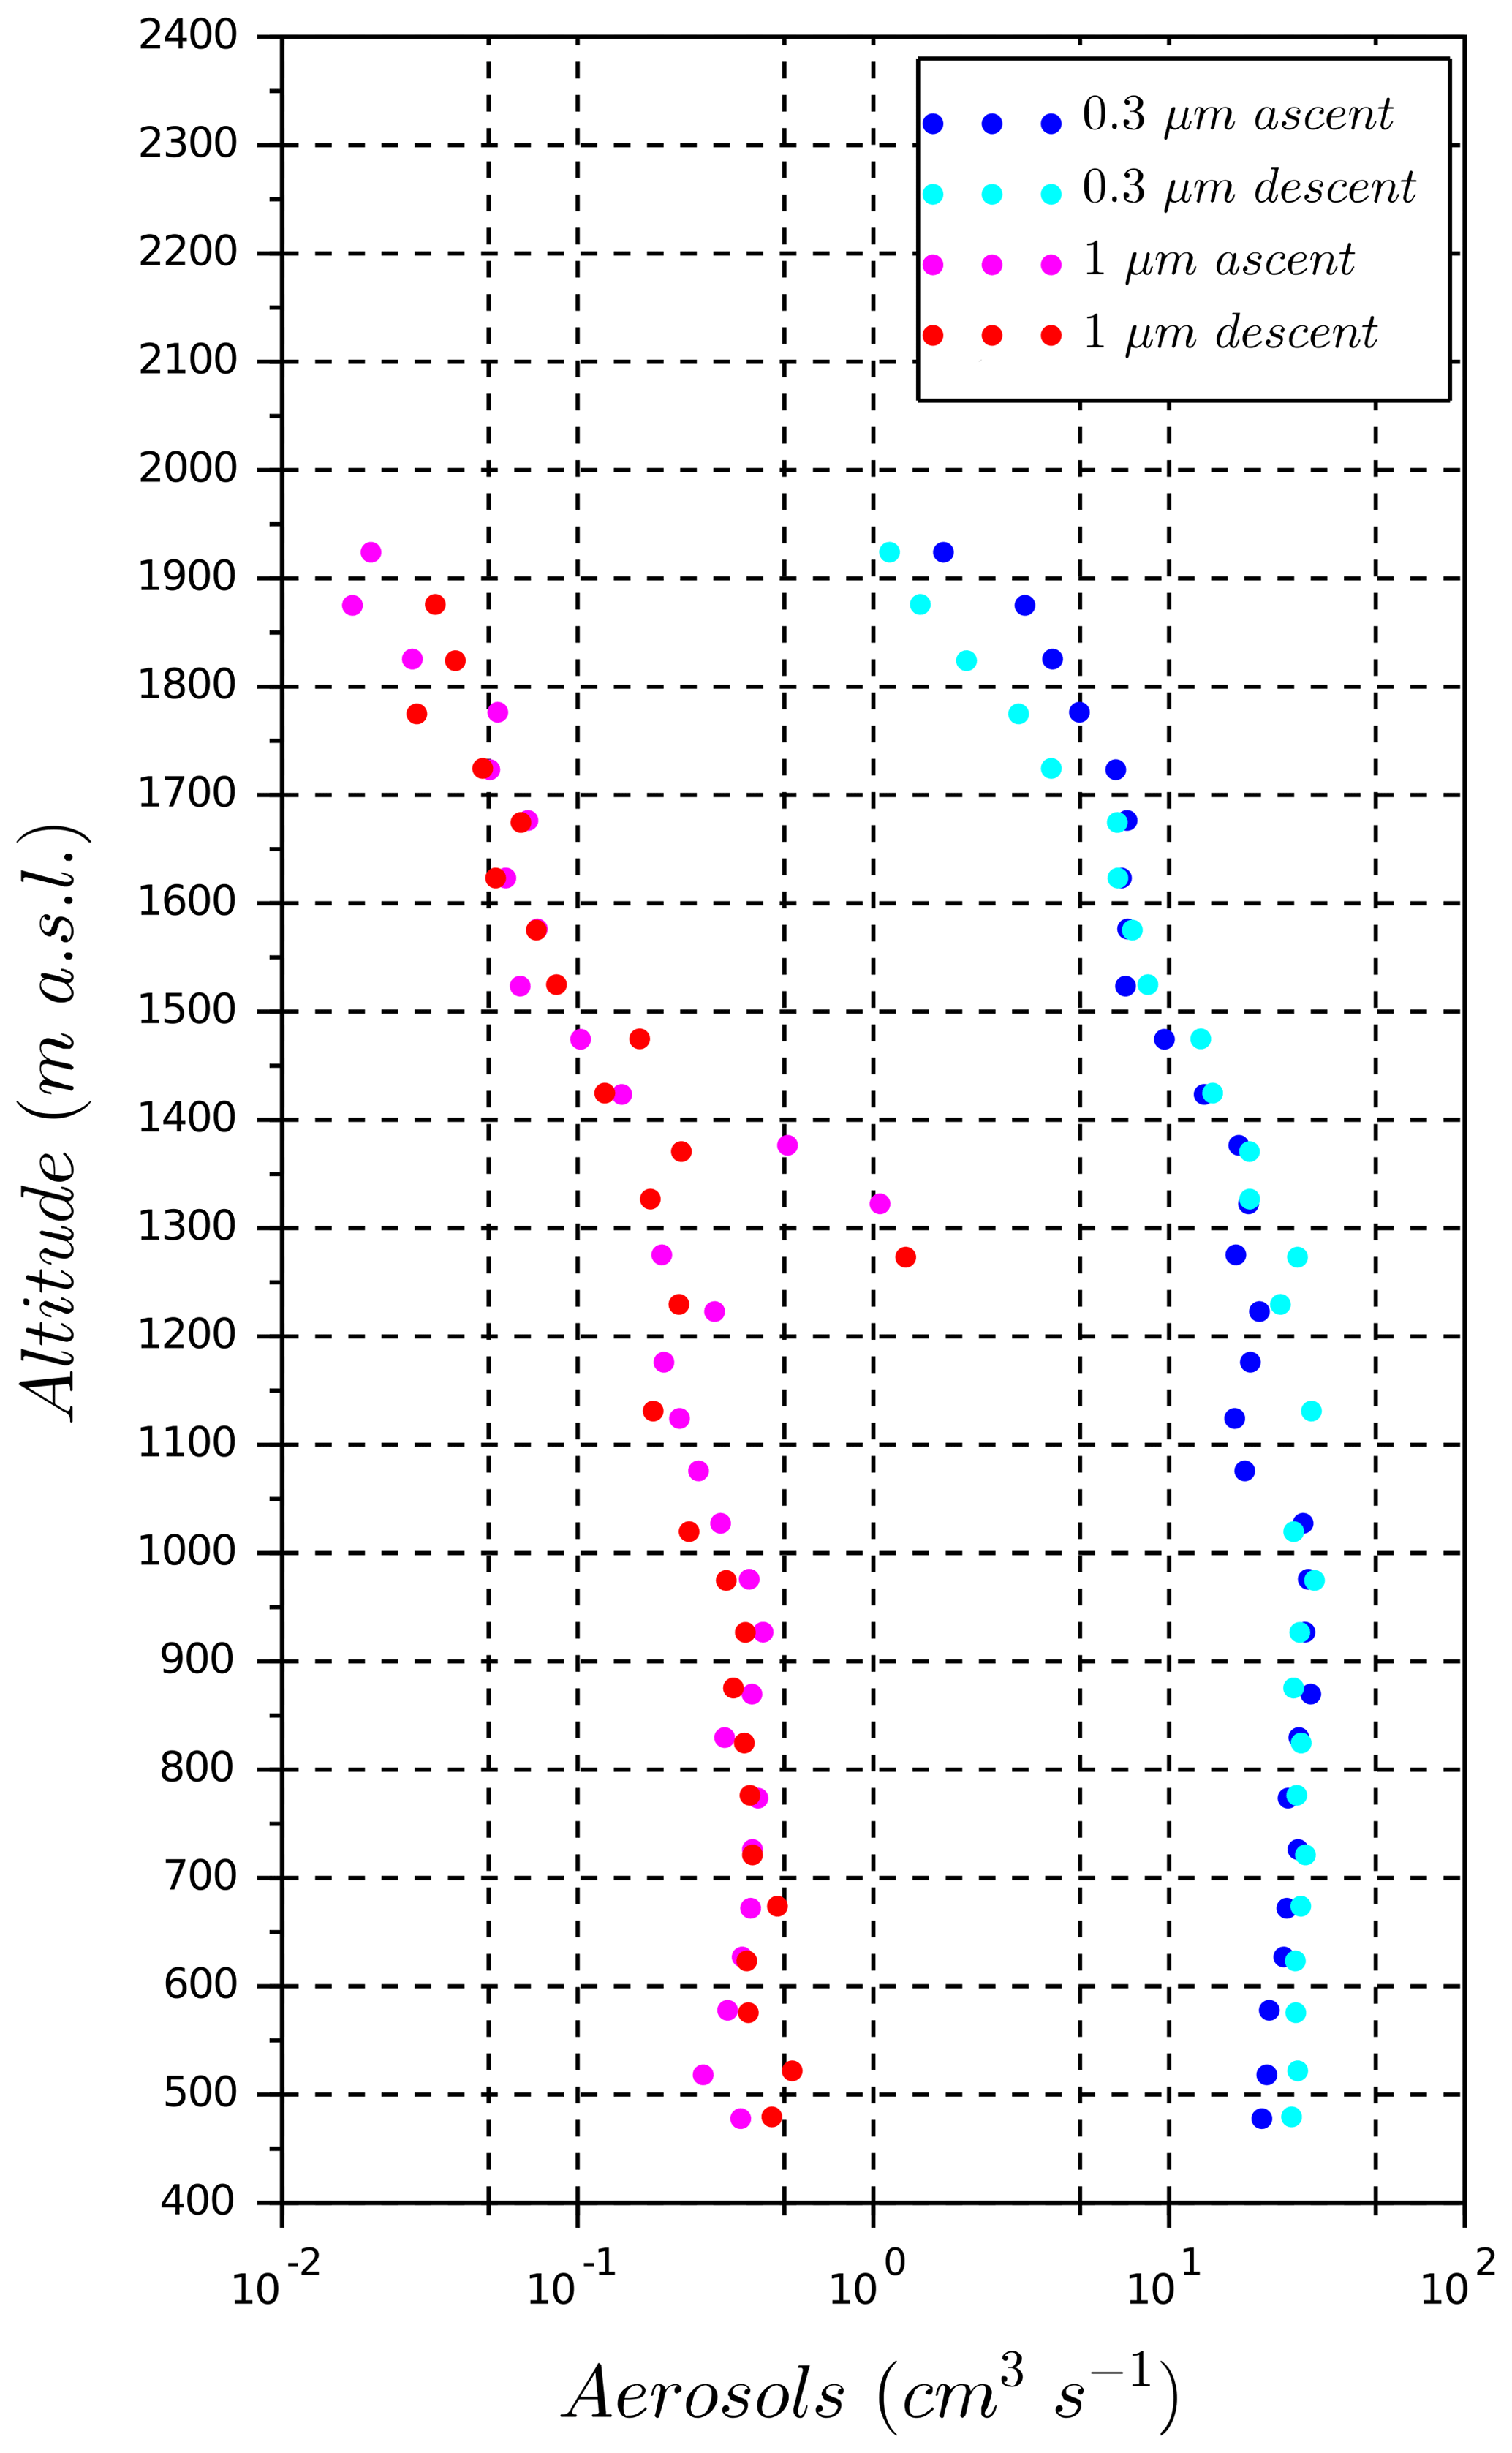
Figure 10Vertical profiles of aerosol number concentration for the number of particles greater than 0.3 µm and greater than 1 µm. Measurements of the aerosol number concentration were conducted during a previous flight (Flight 65), which occurred an hour earlier than the flight considered in this study (Flight 67).
The term “closure” is used in a number of aerosol–cloud interactions studies to evaluate the CDNC obtained from a parcel model based on observations of aerosol and updrafts (Conant et al., 2004; Fountoukis et al., 2007; Kulmala et al., 2011). In the present work, as no direct measurements of CDNC were available, the closure is addressed through the in-cloud fraction of transmitted shortwave radiation profile deduced from the ACPM and measured with the pyranometers. The ACPM is used as a proxy for cloud droplet number concentration. An entrainment parameterization is implemented on the model results to obtain better agreement between the model and observations.
3.1 Description of the ACPM
The 0-D ACPM is based on Russell and Seinfeld (1998) and Russell et al. (1999), where the main equations explicitly described the processes of activation of aerosol particles and the condensation of water vapor on the resulting cloud droplets. The model is designed to be initialized from aircraft-based field observations. The ACPM lifts a parcel of air along a vertical trajectory limited by the observed cloud-top height, at time steps of 0.1 s, to account for kinetic limitations in droplet growth (Chuang et al., 1997). The input aerosol particle distribution is divided into 70 bins that are equally log spaced with a minimum bin edge size of 0.02 µm and a maximum bin edge size of 3.0 µm. The ACPM uses a fixed sectional approach for distinct aerosol populations to calculate particle growth under supersaturated conditions (Russell and Seinfeld, 1998). The model employs a dual-moment (number and mass) algorithm to calculate the particle growth. Liquid water is treated in a moving section representation to have an agreement between the particle number and mass (Russell and Seinfeld, 1998). Deposition is also included but negligible for the study here. The case study focuses on a non-precipitating cloud (i.e., droplet diameter <20 µm); therefore, droplet collision, coalescence and drizzle rates are negligible for the simulated values of liquid water content and cloud droplet number concentration. The equation describing the evolution of the thermodynamic energy of the air parcel is given by the vertical temperature gradient:
where dT is the change in temperature corresponding to the dt time step in the ACPM, w is the updraft, g is the acceleration due to gravity, L is the latent heat of water condensation, ql is the liquid water mixing ratio, and cp is the specific heat of water. Equation (1) relates the updraft with the release of latent heat of a rising air parcel in an adiabatic parcel of air. The vertical velocities (updraft and downdraft) are measured near the cloud base or within the cloud. For the 0-D model, updrafts generate supersaturated conditions in which aerosol particles are activated into cloud droplets. Therefore, the downdrafts are not considered in the simulation.
Evaporation from the entrainment is parameterized and applied to the ACPM results. The measured temperature profile is used to parametrize entrainment. To apply the cloud-top mixing, which corresponds to the dry entrained air from the cloud-top incorporated downward throughout the cloud, a fraction of air at cloud base and a fraction of air above cloud top are mixed, conserving the total water content and the equivalent potential temperature (Sanchez et al., 2017; Wang et al., 2009). The gradient in the conserved variable is nearly linear and is then used to adjust the liquid water content by assuming inhomogeneous mixing. A number of previous studies have shown that stratocumulus cloud-top entrainment specifically results in inhomogeneous mixing (Brenguier et al., 2011; Burnet and Brenguier, 2007; Yum et al., 2015; Painemal and Zuidema, 2011; Pawlowska and Brenguier, 2000; Jia et al., 2019). The fraction of air masses originating from below and above the cloud layer is determined as
where θe,c(z) is the equivalent potential temperature in clouds as a function of height, θe,ent is the equivalent potential temperature of the cloud-top entrained air, θe,CB is the equivalent potential temperature of air at cloud base, and X(z) is the fraction of cloud-top entrained air as a function of height (Sanchez et al., 2017). Then, the entrainment fraction X(z) is given by
Sanchez et al. (2017) illustrates the importance of including entrainment to simulate cloud optical properties using the ACPM. A similar approach to this case study is presented in the following sections.
3.2 Model inputs from ground measurements and RPAs
To initiate the ACPM model, in situ measurements of aerosol size distribution and calculated hygroscopic properties from the ground-station are combined with vertical profiles of temperature and relative humidity and updraft distributions from the RPA. The aerosol size distribution described in Fig. 3 along with the hygroscopicity parameter obtained in Sect. 3.3 are implemented in the ACPM to approximate the CCN spectra at cloud base. The temperature and humidity profiles (Fig. 9, magenta lines) derived from observations of the RPA profile are used as input parameters in the ACPM model. Yet, in the cloud, the temperature and supersaturation are calculated. The ACPM temperature profile in the cloud is moist adiabatic.
In the literature, either a characteristic updraft or a distribution of updrafts is used in ACPM. Conant et al. (2004), Hsieh et al. (2009), Hudson et al. (2012), and Sanchez et al. (2017) have shown that the distribution of updrafts better reproduces cloud microphysical properties, such as the droplet spectral width, than a single-updraft approximation. Consequently, a weighted distribution of the positive vertical winds near cloud base is used as model input (updrafts from 0.1 to 4 m s−1 shown in Fig. 5), resulting in a broader cloud droplet distribution than when using a single updraft. The ACPM model simulates the cloud droplet growth using 40 bins of updrafts between 0 and 4 m s−1 (Sanchez et al., 2016). Each bin corresponds to a maximum supersaturation and a number of CCN activated into cloud droplets. The overall cloud microphysical properties are weighted based on the updraft distribution. The cloud droplet number concentration corresponds to the summation of the number of CCN activated weighted with updraft and is expressed as
where CDNC is the cloud droplet number concentration, i is the bin number, f(wi) is the occurrence of updraft wi at the supersaturation Sci, and NCCN(wi) is the number of activated particles based on the cloud droplet distribution for Sci and wi. CDNC is volume weighted by the factor wi. Results are in line with the case studies (marine environment) presented in Sanchez et al. (2017).
3.3 Aerosol–CCN comparison through the hygroscopicity parameter
The aerosol population observed in our studies is assumed to be internally mixed as the particles generally undergo long-range transport from their source (Fig. 8). To describe the relationship between particle composition and CCN activity, Petters and Kreidenweis (2007) define the hygroscopicity parameter, κ, based on the Köhler theory (Seinfeld and Pandis, 2006). The hygroscopicity parameter, κ, represents a quantitative measure of water-soluble ions on CCN activity.
where Dp is the droplet diameter, Sc is the critical supersaturation, and A is expressed as
where Mw is the molecular weight of water, σw is the solution surface tension, ρw is the water density, R is the universal gas constant, and T is the temperature. κ calculated using the CCN measurement with a critical dry diameter at 100 nm for a supersaturation of 0.24 % gives 0.3. The value of κ calculated from the aerosol size distribution and CCN measurement is compared to κ obtained from chemical constituents measured by the ACSM instrument at the ground station (Fig. 11). From the ratio provided by the ACSM approximated to 50 % ammonium sulfate/organic matter submicron aerosol, κ is estimated to be 0.26. The sulfates are assumed to be in the form of ammonium sulfate, and the organic matter (or insoluble fraction) presented a hygroscopicity of 0.1 based on typical values of observed organic hygroscopicity (Petters and Kreidenweis, 2007, Gunthe et al., 2009, and Prenni et al., 2007). These values are in good agreement and confirm an acceptable coherency between aerosol physical and chemical properties and the CCN measurements.
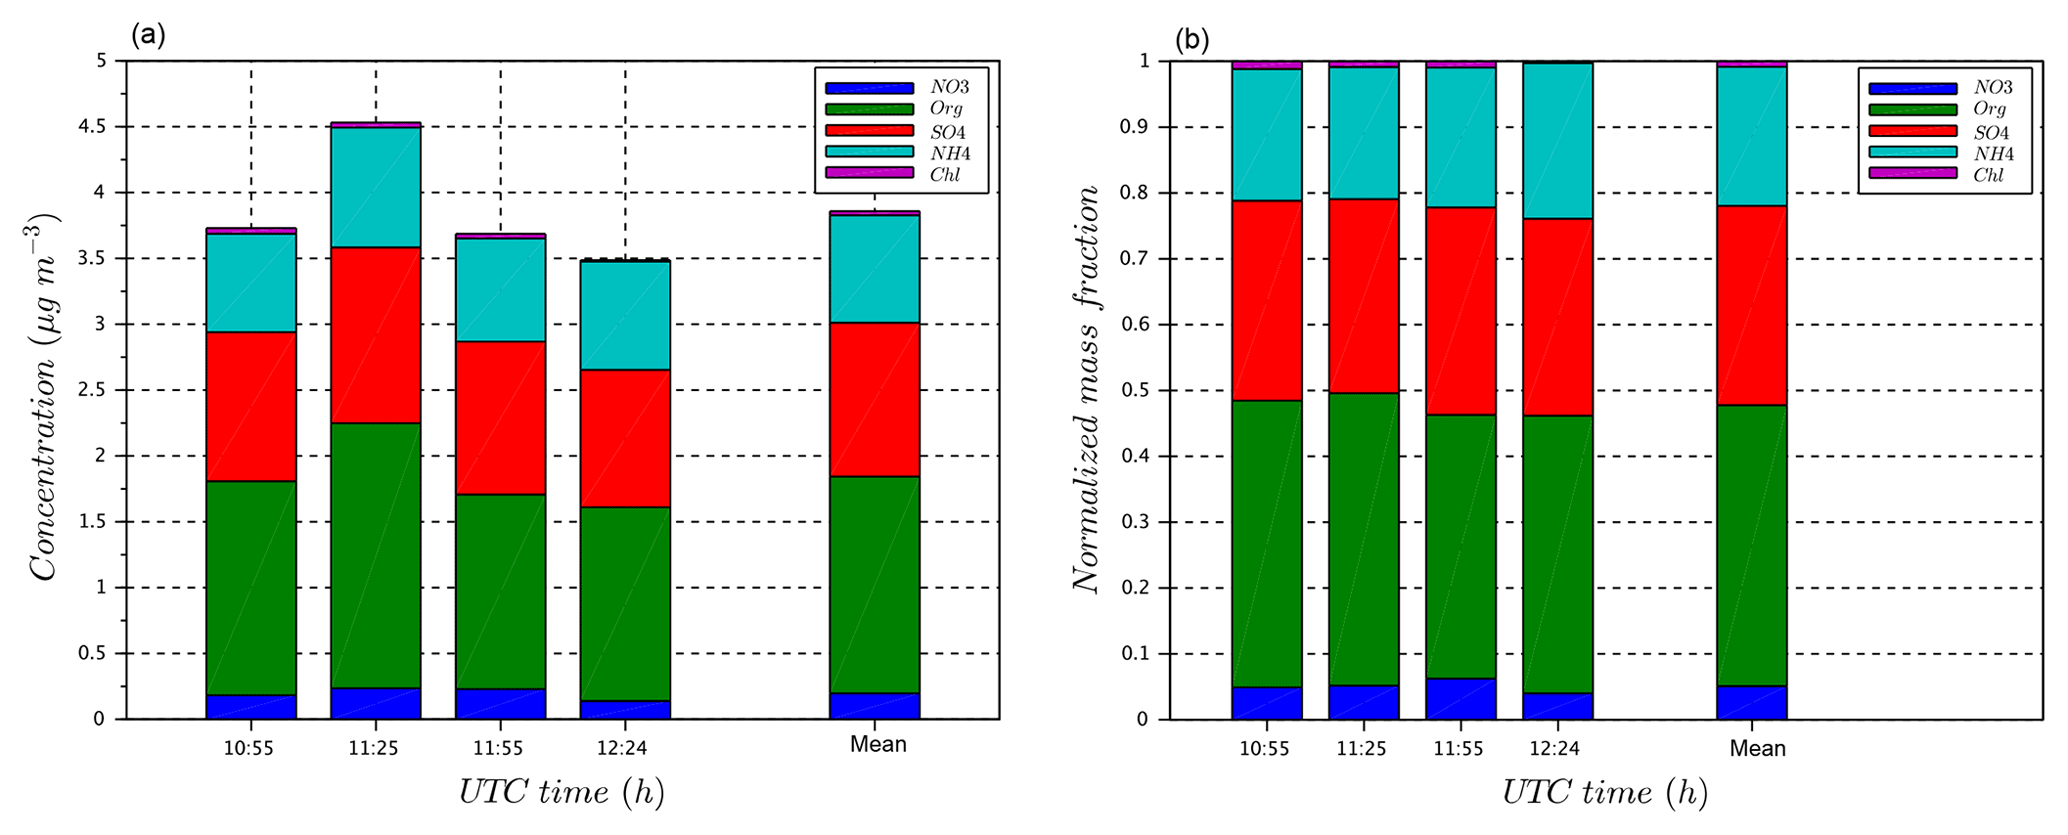
Figure 11(a) Measurements from the Aerosol Chemical Speciation Monitor (ACSM) for the mass concentration of aerosols depending on their chemical composition. The time period covers the flight presently studied. (b) Normalized aerosol mass concentration depending on aerosol chemical composition for the same period.
The purpose of the parcel model is to serve as the link between in situ measurements of aerosol and vertical velocity distributions to the observed cloud microphysical properties. 0-D aerosol parcel models with explicit cloud microphysics are specifically designed to explore droplet growth/evaporation for a given CCN spectrum and updraft distribution. The procedure is to run the 0-D model adiabatically, then use the observations of mixing of the conservative variable to calculate how much water should have evaporated due to cloud entrainment. Figure 12a presents the water vapor content derived from the relative humidity (qv), which is equivalent to the total water content (qt) above and below the cloud, as a function of equivalent potential temperature. The total water content and equivalent potential temperature in an adiabatic parcel are conserved; however, in Fig. 12a, the total water content decreases from 7.5 g kg−1 at cloud base to 6.7 g kg−1 cloud top (R2=0.95). An adiabatic profile would show that the total water content at cloud top would remain unchanged from the cloud base value of 7.5 g kg−1. This indicates that the cloud is not adiabatic. The total water content at cloud top is much lower than the total water content closer to cloud base, suggesting air masses above the cloud top are the source of dry air entrainment, consistent with previous studies of stratocumulus cloud-top entrainment (Wood, 2012). The decrease in water vapor content throughout the cloud is a result of the combination of cloud-top entrainment of dry, warm air and water vapor condensation. In-cloud measurements of equivalent potential temperature are reliable despite the presence of liquid water. Using Eq. (2) and measurements of the equivalent potential temperature throughout the cloud, the fraction of entrained air can be estimated and the in-cloud profile of liquid water content can be calculated. The linear relationship between the simulated total water content and the measured equivalent potential temperature is a result of the cloud reaching a steady state, with air coming from the cloud base and cloud top (Fig. 12a). The reduction in number concentration due to entrainment is driven by the amount of evaporated water as we approximate the evaporation through inhomogeneous mixing (Jacobson et al., 1994). In this study, the inhomogeneous assumption is utilized as a limit for the maximum reduction in cloud optical thickness due to cloud-top entrainment. In addition, the inhomogeneous assumption yields results closer to our observations as it reduces the cloud optical thickness more than homogenous mixing. Figure 12b presents the profiles of liquid water content (LWC) calculated from the ACPM in the case of the adiabatic simulation and when the entrainment parameterization is considered.

Figure 12(a) Total water content qt and equivalent potential temperature θe identify mixing between cloud air and entrained air. (b) Liquid water content in cloud calculated for an adiabatic profile and when the entrainment is considered.
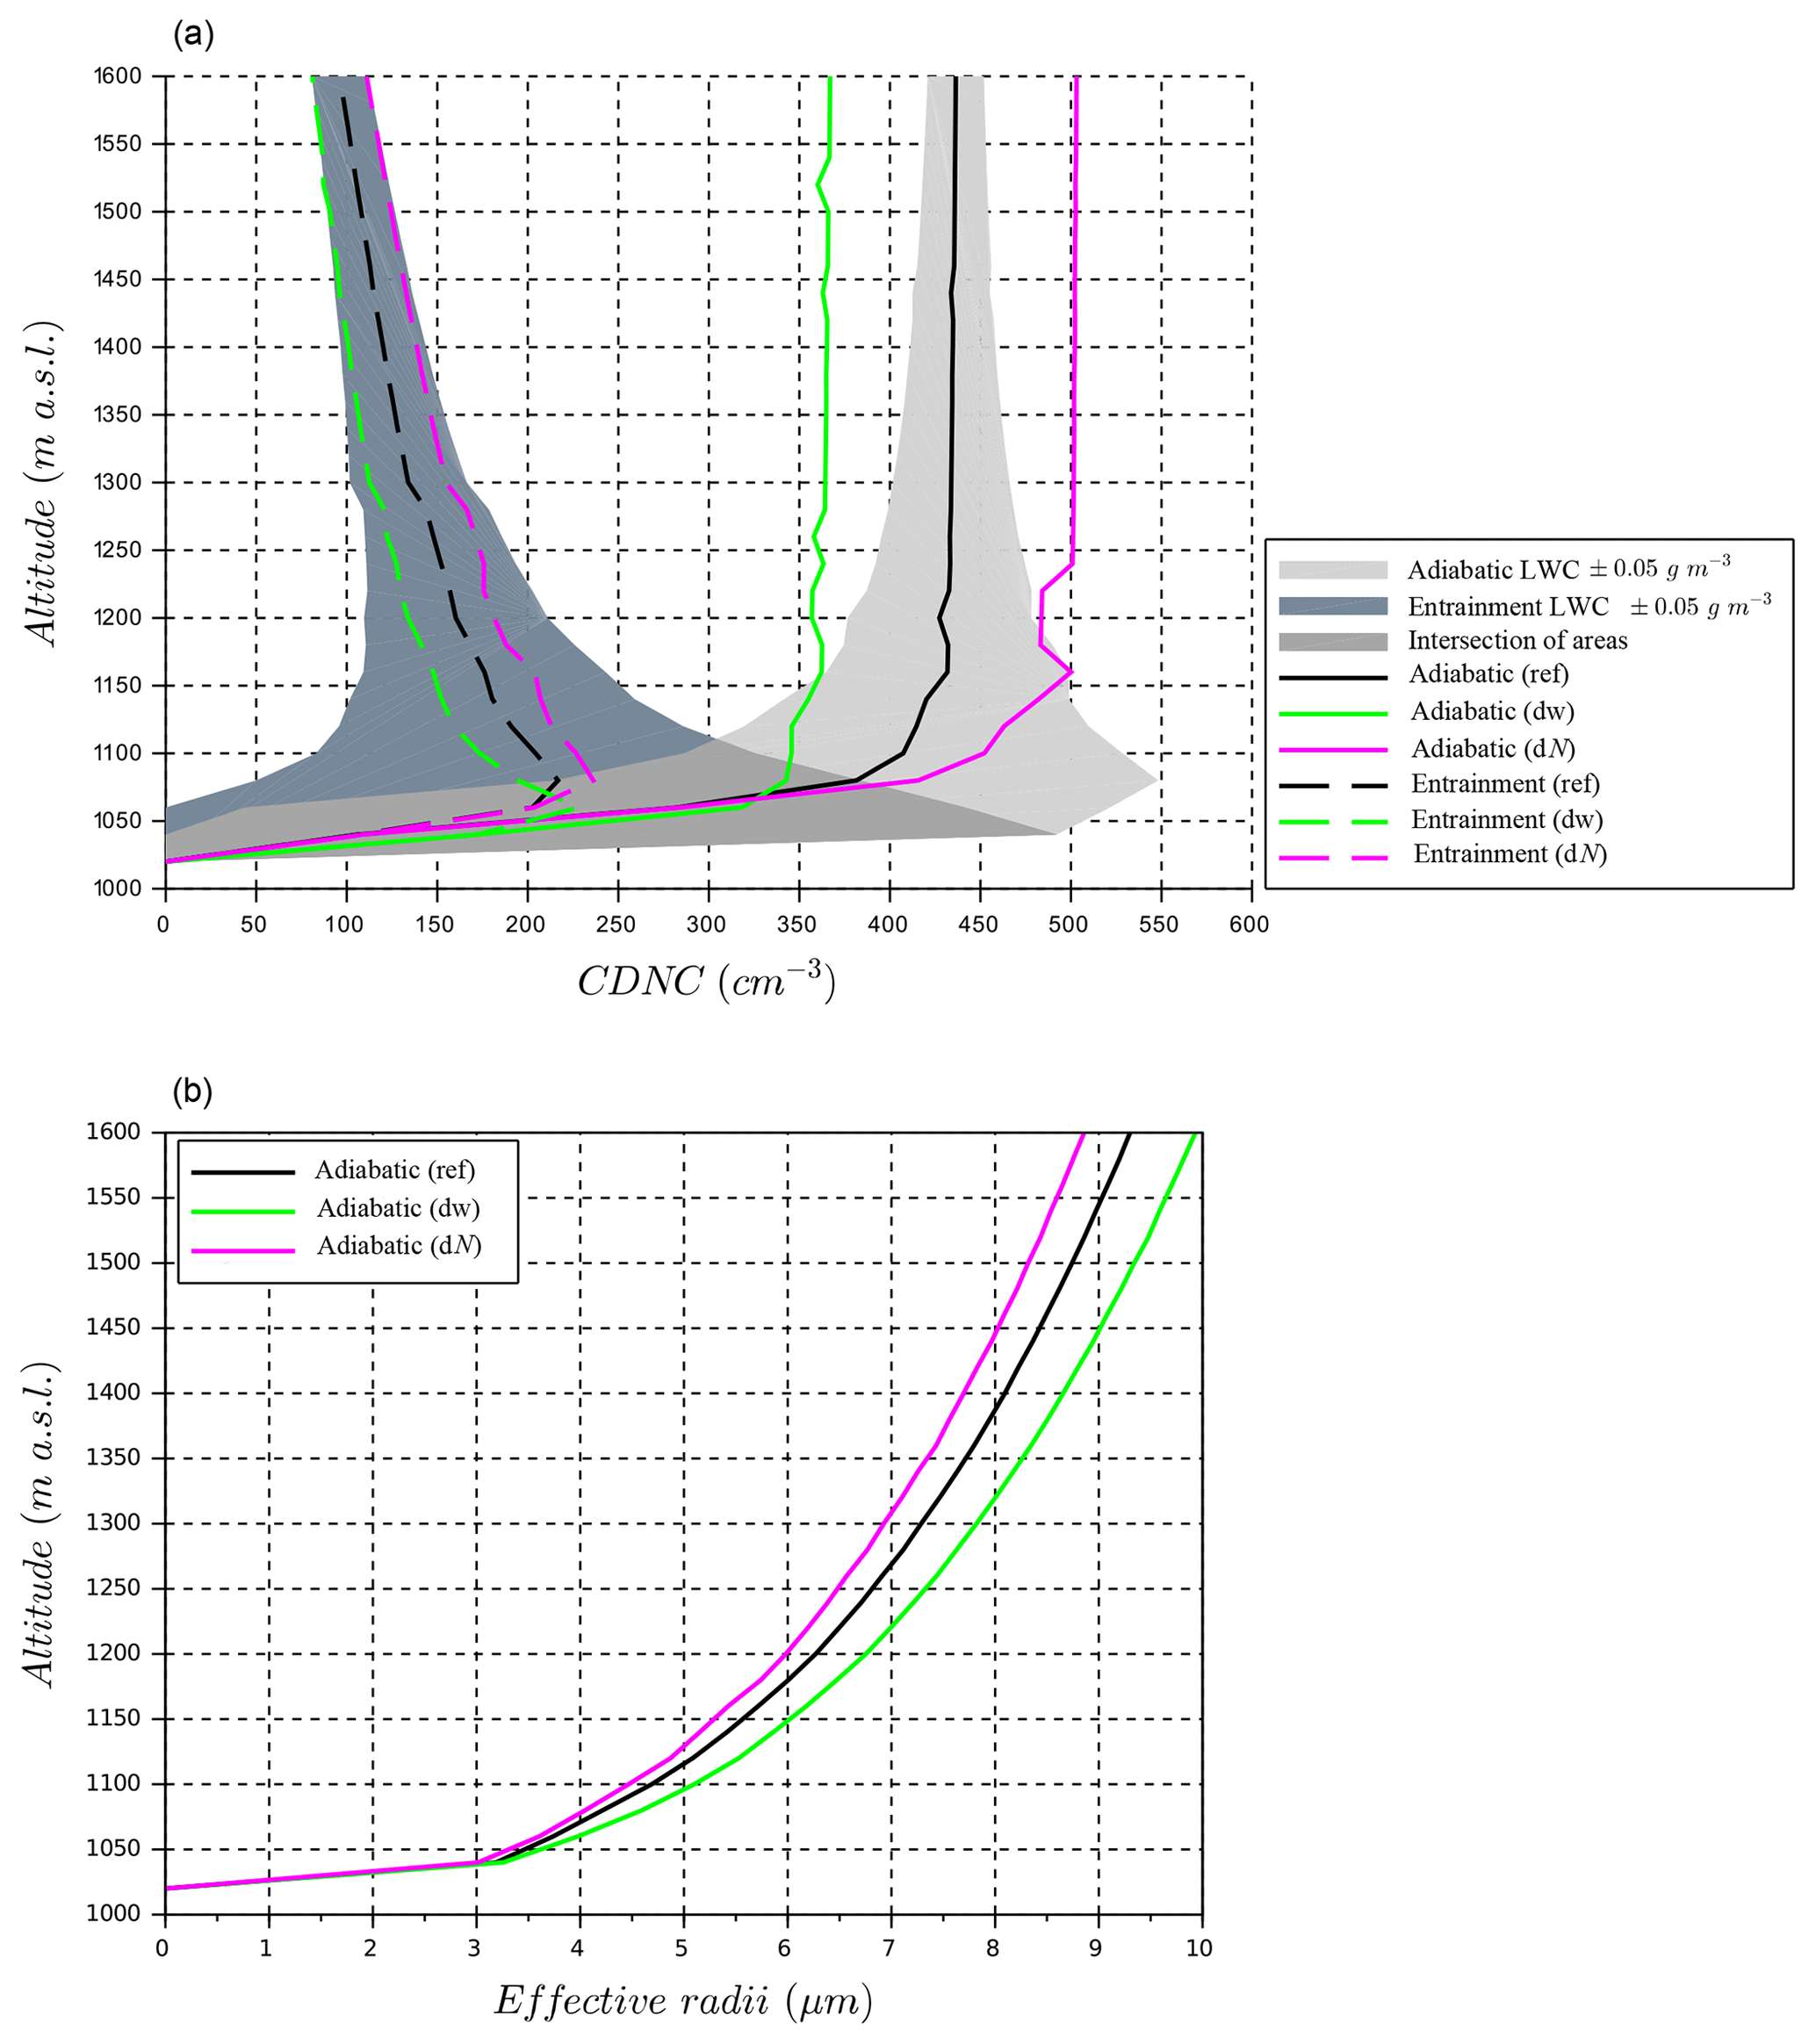
Figure 13(a) Simulated cloud droplet number as function of the cloud height, for the adiabatic and the entrainment cases, with variation of updraft velocity (dw) and particle number (dN). Shaded areas are obtained from a variation of LWC of ±0.05 g m−3 in the calculation of cloud droplet number in the reference case, dark gray for the adiabatic case and light gray for the simulation with the entrainment parameterization. The intermediate gray corresponds to the intersection of the two cases.
4.1 Cloud droplet number concentration
Results of the ACPM for the profile of cloud droplet number concentration and effective radius are presented in Fig. 13. For the adiabatic reference case, CDNC is around 400 cm−3. The adiabatic profile of CDNC is compared to the profile incorporating the entrainment parameterization that forces the model to the observed temperature lapse rate (Eq. 2). Most of the closure studies neglect entrainment (Snider et al., 2003; Conant et al., 2004; Peng et al., 2005), as they investigated aerosol closure and observed that the entrainment did not affect much the results at cloud base. However, for the case studies at Mace Head (Sanchez et al., 2017), the difference between observed and simulated parameters (in this case, the cloud-top temperature) suggested a source of heating in the cloud, and a closer approximation of cloud radiative properties was obtained when the entrainment was included in the model results. The entrainment parameterization approximates the impact of inhomogeneous mixing on CDNC due to evaporation of a subset of the cloud droplet population. For the entrainment case, CDNC reaches highest number concentration a few tens of meters above cloud base and then decreases with altitude, as the inhomogeneous mixing is assumed (Fig. 13a). However, CDNC is very sensitive to the entrainment fraction at cloud base, as the droplets are very small so even a small change in the amount of water evaporated (from entrainment) will cause a large difference in the number concentration. Shaded areas in Fig. 13a highlight the model sensitivity to a small variation of LWC in obtaining cloud droplet number, as the sensitivity of the CDNC profile is a function of LWC. This variation in LWC is obtained based on the mixing line (Fig. 12a) and represents the standard deviation calculated from the difference between the mixing line in clouds and its best fit (0.052 g kg−1). CDNC in the adiabatic profiles varies within ±160 cm−3 near cloud base (approximately 45 % variation relative to the adiabatic reference case). However, variations up to 230 cm−3 are observed for the entrainment profiles near cloud base (approximately 230 % variation relative to the entrainment reference case). Yet, higher in clouds, the impact of LWC variation on CDNC is less pronounced. The peaks of CDNC for the entrainment profile are then sensitive to observed temperature profiles; however, as clouds are optically thin at cloud base, the impact of this sensitivity on overall cloud optical properties is small. Yet, at cloud top, the maximum difference in CDNC between the entrainment and adiabatic ACPM profiles is ∼300 cm−3, which ultimately plays a large role in the overall cloud optical properties. Profiles of direct observations of cloud droplet numbers show a similar large sensitivity at cloud base and a decrease in number with altitude (Roberts et al., 2008; Rauber et al., 2007).
4.2 Cloud optical properties
To study the cloud optical properties, solar irradiance obtained from the pyranometers mounted on the wind RPA is compared to ACPM fraction of transmitted shortwave radiation profiles, which represents the solar irradiance transmission through the cloud layer. The transmission through the cloud layer is approximated by downward integration of the calculation of albedo and subtracting from unity. For example, an infinitely thin cloud has an albedo of zero; therefore, 100 % of incoming solar irradiance is transmitted through the cloud. As the cloud thickens, the albedo increases (but remains less than 1) meaning that more incoming solar irradiance is reflected back to space (Fig. 14). To derive the cloud optical properties from the ACPM, the method presented in Sanchez et al. (2017) is followed here, based on Hansen and Travis (1974) and Stephens (1978). The cloud droplet extinction is proportional to the total droplet surface area and has the form
where r is the radius of the droplet, n(r) is the number of the cloud droplets with a radius of r, and Qext(r) is the Mie efficiency factor. Qext(r) asymptotically approaches 2 for water droplets at large size (r>2 µm; Seinfeld and Pandis, 2006). The cloud optical depth is defined as
where H is the cloud thickness and σext is the cloud droplet extinction calculated from the simulated cloud droplet size distribution (Eq. 7). The cloud albedo is then calculated with τ:
with g the asymmetric scattering parameter. The albedo is estimated based on the cloud optical depth and the asymmetric scattering parameter (approximated as 0.85 based on the Mie scattering calculation).

Figure 14Optical cloud profile, comparison of pyranometer profiles, and model simulations for the normalized transmission, with adiabatic and entrainment processes. Cloud top is at 1600 m a.s.l. Cloud base is at 1020 m a.s.l.
The solar irradiance profile from the RPA, based on the normalized downwelling pyranometer measurements during the descent, is used to compare simulated and observed cloud optical properties (Fig. 14). To facilitate comparison with the model results, the normalized pyranometer is averaged every 50 m (which averages the oscillations related to pitch-and-roll cosine-angle response of the pyranometer). Observations show a sharp gradient in the attenuation of downwelling solar irradiance near cloud top and decrease to approximately 0.2 at cloud bottom. Overlaid in Fig. 14 are model results from the ACPM for adiabatic and entrained cases. In order to compare ACPM and RPA observations, the albedo of the cloud layer is calculated top-down using the profiles of simulated cloud droplet number and size distribution in Fig. 13 to estimate the amount of solar irradiance reflected back to space and subtracted from unity to compare with the downwelling pyranometer profile. The mean difference in the fraction of transmitted shortwave radiation for in situ measurements and adiabatic simulation is 0.3, although when accounting for entrainment, the mean difference is only 0.03. Therefore, comparison between RPA observations and ACPM for adiabatic and entrainment fraction of transmitted shortwave radiation profiles suggests that cloud optical properties are best represented when including entrainment mixing of cloud-top air.
4.3 Sensitivity study on cloud optical properties
In addition to comparing ACPM results between entrainment and adiabatic cases, a sensitivity analysis presented here explores the impact of a change in aerosol particle number concentrations (dN) as well as changes in the updraft distribution (dw) on the cloud optical properties (Pringle et al., 2009; Moore et al., 2013). Profiles of the cloud droplet number and effective radii (Fig. 13) and cloud optical properties (Fig. 14) are also simulated with the inputs of aerosol number concentration multiplied by 2 (dN=2N) and the updraft distribution divided by 2 (). Increasing the aerosol concentrations by a factor of 2 results in an aerosol concentration of ∼2400 cm−3 representing even more polluted conditions. Such an increase in aerosol/CCN concentrations also increases cloud droplet number concentration (Fig. 13a), decreases the effective radii (Fig. 13b), and presents a cloud with a higher albedo. In addition, halving the updraft distribution results in a distribution with maximum vertical wind near 2 m s−1, which also happen to be similar to the updrafts observed in marine stratocumulus cloud layers over Mace Head Research Station, Ireland (Calmer et al., 2018). In this case study of dw, the lower updrafts also result in lower cloud droplet number concentrations with larger effective radii due to lower in-cloud supersaturations (Fig. 13). The lower cloud droplet number and larger effective radii result in lower albedo of the cloud layer and an increase of the fraction of transmitted shortwave radiation (Fig. 14). In the adiabatic case, a decrease of 16 % in cloud droplet number is observed when the updraft distribution is divided by 2 (dw); and an increase of 11 % of droplet number occurs when the number of dry particles is multiplied by 2 (dN). The impact of a change in the droplet spectral width has also been studied using two lognormal droplet distributions with a factor of 2 variation in the standard deviation (σ), while the total number of droplets and liquid water content remains the same as that in the reference case. Factor of 2 changes in updraft distribution cause the fraction of transmitted shortwave radiation to increase by 0.003 in the adiabatic case and 0.005 in the entrainment case, corresponding to an decrease in albedo. Likewise, a factor of 2 increase in aerosol size distribution leads to a −0.002 (adiabatic case) and −0.004 (entrainment case) decrease in the fraction of transmitted shortwave radiation through the cloud (corresponding to a similar net increase in cloud albedo; Fig. 14). A factor of 2 change in the droplet spectral width showed an even smaller difference of 0.002 in the fraction of transmitted shortwave radiation at cloud base. To summarize, factor of 2 variations of N, w, and droplet spectral width correspond to changes within ±0.005 in transmitted shortwave radiation (and albedo) compared to the reference case. Yet, the change in the fraction of transmitted shortwave radiation between adiabatic and entrainment cases is 0.15, corresponding to a factor of 30 change in cloud albedo compared to changes in droplet number, updraft, and spectral width. The impact of entrainment on cloud optical properties has long been known (Boers and Mitchell, 1994), and this study only emphasizes its impact relative to aerosol indirect effect, changes in vertical motion, and cloud droplet spectral width. Extending this analysis further suggests that the sensitivity of cloud optical properties related to entrainment variability also needs to be constrained in order to improve climate models.
The sensitivity of albedo to changes in droplet concentrations was first introduced by Platnick and Twomey (1994), who defined a degree of susceptibility function of cloud optical thickness, effective radius, and liquid water content. Clouds formed in cleaner environments are likely to be of higher susceptibility compared to clouds in polluted areas, which illustrate the link between pollution and cloud albedo proposed by Twomey (1977). Painemal and Minnis (2012) used the same definition of susceptibility to investigate the albedo sensitivity to changes in the cloud microphysics. The increase of albedo susceptibility with LWC was observed for three maritime cloud regimes. Feingold (2003) and McFiggans et al. (2006) used the equation as a representation of the sensitivity of X on Y. Y is a physical property of the cloud (e.g., the effective radius, the cloud droplet number concentration) and X is a meteorological parameter (e.g., updraft, LWC) or property of the dry aerosol (e.g., concentration, size distribution). A similar calculation of sensitivity is used to compare the influence of the particle number and updraft on albedo in the adiabatic and entrainment cases.
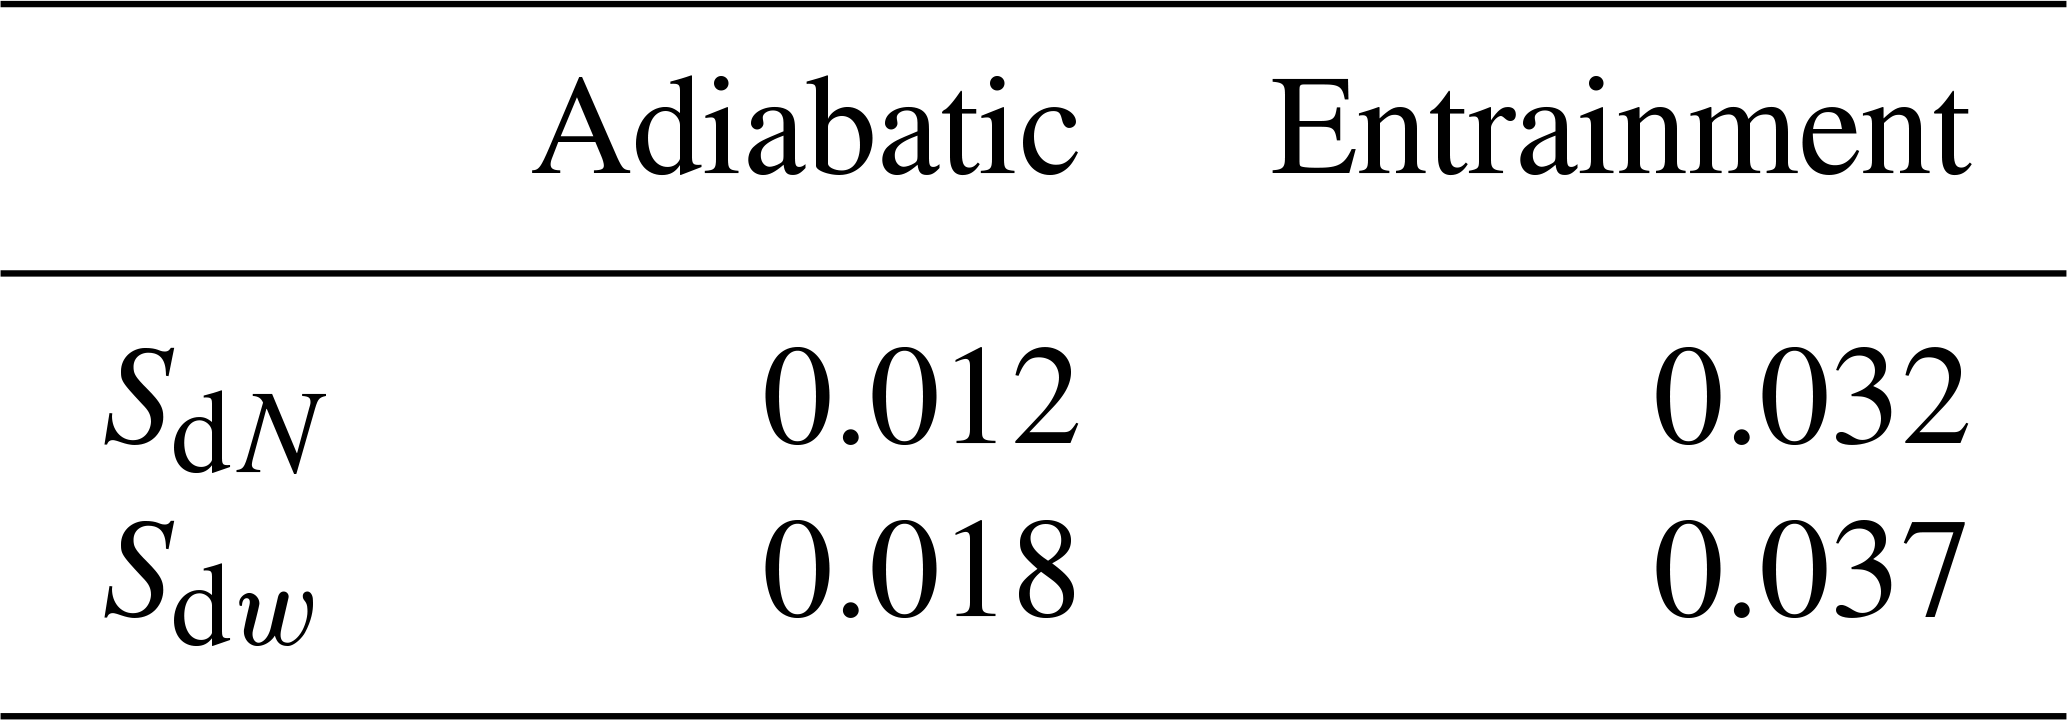
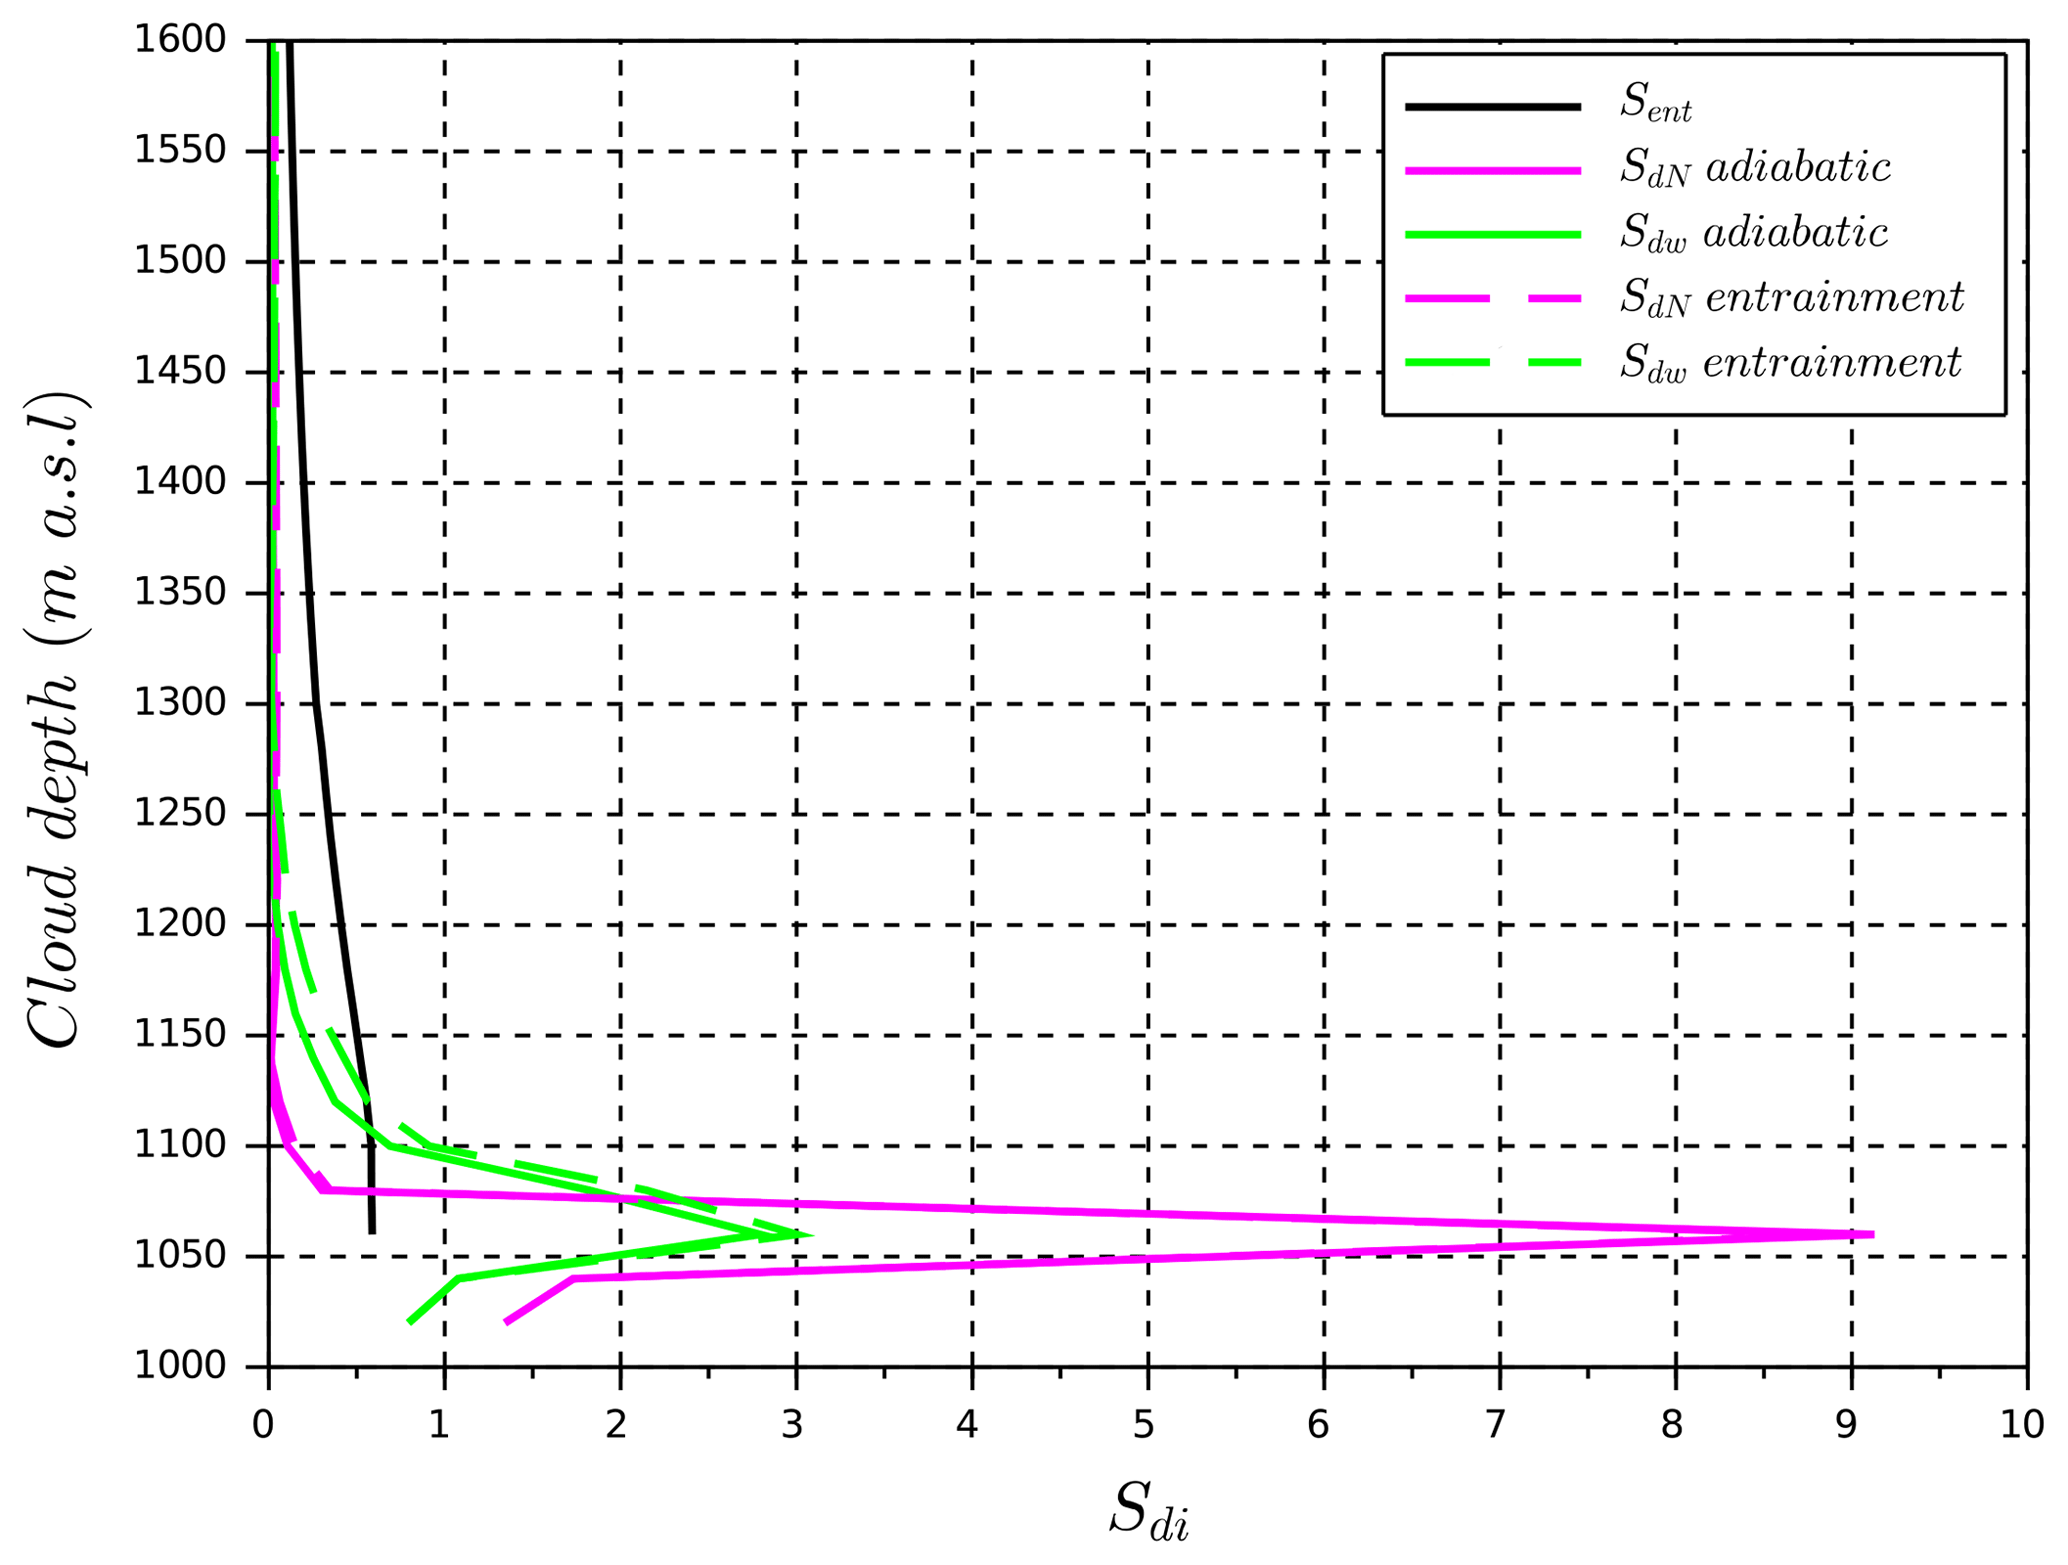
where a is the albedo at cloud top, CDNC is the cloud droplet number at cloud top, ref represents the reference case, and di represents either a variation of the particle number dN or the updraft dw in the adiabatic or the entrainment case. Table 3 summarizes the input values for the sensitivity calculation and results are presented in Table 4. The sensitivity in the reference case between the adiabatic and entrainment cases (0.118) is higher than the other sensitivities, demonstrating a significantly larger importance of the entrainment parameterization on albedo compared to the initial conditions of particle number N or updraft w. Figure 15 shows the calculation of Sdi as a function of the cloud depth. As mentioned in Sect. 4.1, the initial conditions influence mainly the cloud base, and then, higher in clouds, albedo is more sensitive to the entrainment parameterization.
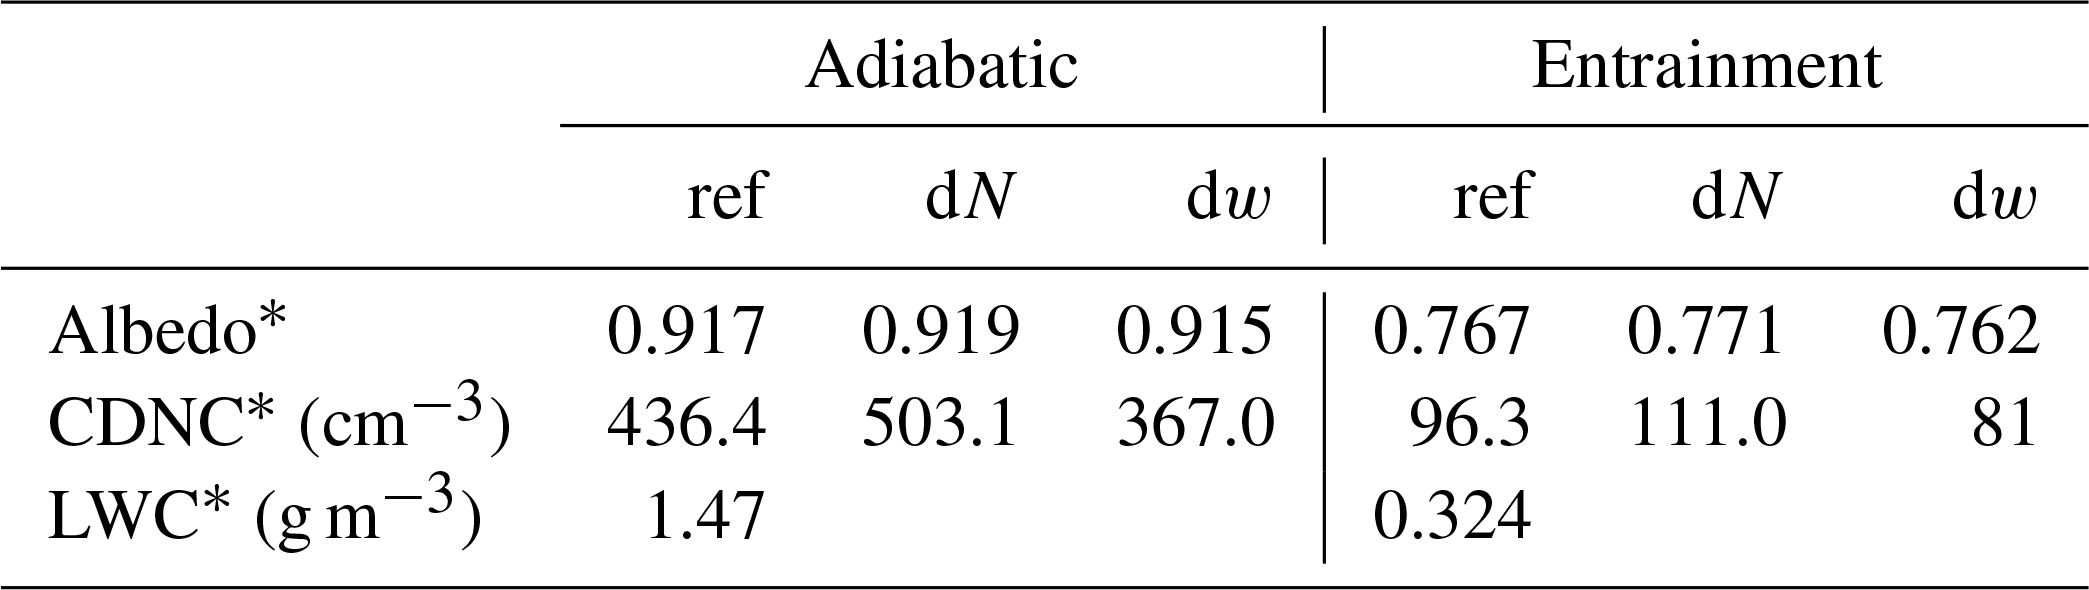
Table 4Results of the sensitivity Sd of albedo for cloud droplet number concentration with variation of aerosol concentration (dN) and updraft (dw) given by Eq. (10). The comparison of sensitivity calculation between adiabatic and entrainment cases at cloud top is .
An aerosol–cloud closure on cloud optical properties is conducted on a case study by comparing measured and simulated shortwave radiation transmission profile. The measurements were conducted for this closure study on 1 d (1 April 2015) of the 1-month BACCHUS field campaign in Cyprus. Ground-based measurements at Cyprus Atmospheric Observatory are combined with RPA observations to initiate an ACPM to compare observed and simulated cloud optical properties. Input parameters of the model include the ground-based aerosol size distribution obtained from combined SMPS and OPC distributions averaged for the studied period as well as the vertical velocity distribution at cloud base as measured by the RPA. Vertical profiles of temperature and relative humidity measured during a RPA flight are implemented in the model. The in-cloud lapse rate is lower than simulated for adiabatic conditions, suggesting cloud-top mixing from above the stratocumulus layer. Two different simulation cases are studied with the ACPM (i.e., an adiabatic case and an entrainment case), where the in-cloud temperature profile is taken into account to calculate the fraction of cloud-top entrained air throughout the cloud. The adiabatic ACPM simulations yield cloud droplet number concentrations (approximately 400 cm−3) that are similar to those derived from the Hoppel minimum analysis (388 cm−3). Cloud optical properties have been observed using the transmitted shortwave radiation profile measured by a downwelling pyranometer. The normalized transmitted shortwave radiation is then compared to simulations from the ACPM and shows a better agreement with the entrainment parameterization rather than with the adiabatic profile. These results highlight the importance of accounting for entrainment in deriving cloud optical properties.
To evaluate the sensitivity of the ACPM results, variation of input parameters are implemented by multiplying the aerosol concentrations by 2 (from 1234 to ∼2400 cm−3; even more polluted conditions) and dividing the updraft distribution by 2 (maximum w from 4 to 2 m s−1; conditions similar to marine environment (Lu et al., 2007; Calmer et al., 2018). For the conditions observed in this case study, a doubling of N increases the maximum cloud droplet number by 11 %, whereas a reduction in w decreases the maximum cloud droplet number by 16 %. The impact on cloud effective radius is relatively small, less than ±1 µm changes in the radius (<7 % in relative changes). The impact of a change in cloud droplet spectral width (σ) is roughly the same as factor of 2 changes in N and w. These changes in cloud microphysical properties by varying N, w, and droplet spectral width lead to variations within ±0.005 in the fraction of transmitted shortwave radiation. In comparison, the change in fraction of transmitted shortwave radiation and albedo related to entrainment is 0.15. The sensitivity calculation Sd of albedo to cloud droplet number concentration shows the significant impact of entrainment mixing compared to those of aerosol concentration and updraft for cloud optical properties. These results are in agreement with the conclusion of closure studies conducted at Mace Head Research Station (Sanchez et al., 2017), whereby the incorporation of a parameterization for entrainment improves the estimate for shortwave radiative flux. The case studies in Cyprus (this study) and at Mace Head illustrate the significance of the entrainment processes in determining cloud optical properties in two different environments. As expected, entrainment mixing decreases the water content in the cloud relative to an adiabatic profile; therefore, not taking into account entrainment leads to a significant overestimation of cloud radiative forcing. As the impact of entrainment mixing on cloud optical properties is relatively large, this study shows that variability in entrainment mixing also needs to be constrained in order to improve climate models. More observations in climatically different regions are needed to understand the relative impact of aerosol, updraft, and entrainment on cloud radiative properties.
All data are available by contacting the corresponding author or through the following link: https://hal.archives-ouvertes.fr/hal-02332534 (Roberts, 2019).
The analysis of the case study was conducted by RC and KJS with the supervision of GCR. The coauthors have contributed to the writing of the manuscript. GCR and RC carried out the RPAS flights. The ACPM was run and interpreted by KJS. KS and DP operated the SMPS, and CPC instruments at the Cyprus Atmospheric Observatory and provided the associated data. GCR operated the miniature CCN counter at the Cyprus Atmospheric Observatory. MP operated the ACSM and was responsible for the ground site at the Cyprus Atmospheric Observatory. MV was in charge of the RPAS regulations in Cyprus during the field campaign. JS and MV hosted the BACCHUS field campaign on behalf of the Cyprus Institute.
The authors declare that they have no conflict of interest.
This article is part of the special issue “BACCHUS – Impact of Biogenic versus Anthropogenic emissions on Clouds and Climate: towards a Holistic UnderStanding (ACP/AMT/GMD inter-journal SI)”. It is not associated with a conference.
The RPAS used for the experiments presented in this work was developed by the Ecole Nationale de l'Aviation Civile (ENAC). The authors acknowledge Météo-France for co-funding the PhD thesis, which led to this analysis. The authors thank the ChArMEx project supported by ADEME, CEA, CNRS-INSU, and Météo-France through the multidisciplinary program MISTRALS. The authors also thank Lynn Russell, from Scripps Institution of Oceanography, University of California, San Diego, CA, for making the ACPM available for this study.
This research has been supported by European Union's Seventh Framework Programme (FP7/2007–2013) project BACCHUS (grant no. 603445).
This paper was edited by Veli-Matti Kerminen and reviewed by James Hudson and one anonymous referee.
Abade, G. C., Grabowski, W. W., and Pawlowska, H.: Broadening of Cloud Droplet Spectra through Eddy Hopping: Turbulent Entraining Parcel Simulations, J. Atmos. Sci., 75, 3365–3379, https://doi.org/10.1175/JAS-D-18-0078.1, 2018. a
Albrecht, B.: Aerosols, cloud microphysics, and fractional cloudiness, Science, 245, 1227–1230, 1989. a
Baker, B. A.: Turbulent Entrainment and Mixing in Clouds: A New Observational Approach, J. Atmos. Sci., 49, 387–404, https://doi.org/10.1175/1520-0469(1992)049<0387:TEAMIC>2.0.CO;2, 1992. a
Bender, F. A.-M., Engström, A., and Karlsson, J.: Factors Controlling Cloud Albedo in Marine Subtropical Stratocumulus Regions in Climate Models and Satellite Observations, J. Climate, 29, 3559–3587, https://doi.org/10.1175/JCLI-D-15-0095.1, 2016. a
Blyth, A. M.: Entrainment in Cumulus Clouds, J. Appl. Meteorol., 32, 626–641, https://doi.org/10.1175/1520-0450(1993)032<0626:EICC>2.0.CO;2, 1993. a
Boers, R. and Mitchell, R. M.: Absorption feedback in stratocumulus clouds Influence on cloud top albedo, Tellus A, 46, 229–241, https://doi.org/10.1034/j.1600-0870.1994.00001.x, 1994. a
Boucher, O., Randall, D., Artaxo, P., Bretherton, C., Feingold, G., Forster, P., Kerminen, V.-M., Kondo, Y., Liao, H., Lohmann, U., Rasch, P., Satheesh, S., Sherwood, S., Stevens, B., and Zhang, X.: Clouds and Aerosols Supplementary Material, Climate Change 2013: The Physical Science Basis. Contribution of Working Group I to the Fifth Assessment Report of the Intergovernmental Panel on Climate Change, edited by: Stocker, T. F., Qin, D., Plattner, G.-K., Tignor, M., Allen, S. K., Boschung, J., Nauels, A., Xia, Y., Bex, V., and Midgley, P. M., Cambridge University Press, Cambridge, UK and New York, NY, USA, available at: http://www.climatechange2013.org (last access: 15 November 2019), 2013. a
Brenguier, J.-L., Burnet, F., and Geoffroy, O.: Cloud optical thickness and liquid water path – does the k coefficient vary with droplet concentration?, Atmos. Chem. Phys., 11, 9771–9786, https://doi.org/10.5194/acp-11-9771-2011, 2011. a
Brisset, P., Drouin, A., Gorraz, M., Huard, P.-S., and Tyler, J.: The Paparazzi Solution, available at: https://hal-enac.archives-ouvertes.fr/hal-01004157 (last access: 15 November 2019), 2006. a
Burnet, F. and Brenguier, J.-L.: Observational Study of the Entrainment-Mixing Process in Warm Convective Clouds, J. Atmos. Sci., 64, 1995–2011, https://doi.org/10.1175/JAS3928.1, 2007. a, b
Calmer, R., Roberts, G. C., Preissler, J., Sanchez, K. J., Derrien, S., and O'Dowd, C.: Vertical wind velocity measurements using a five-hole probe with remotely piloted aircraft to study aerosol–cloud interactions, Atmos. Meas. Tech., 11, 2583–2599, https://doi.org/10.5194/amt-11-2583-2018, 2018. a, b, c
Carman, J. K., Rossiter, D. L., Khelif, D., Jonsson, H. H., Faloona, I. C., and Chuang, P. Y.: Observational constraints on entrainment and the entrainment interface layer in stratocumulus, Atmos. Chem. Phys., 12, 11135–11152, https://doi.org/10.5194/acp-12-11135-2012, 2012. a
Cecchini, M. A., Machado, L. A. T., Andreae, M. O., Martin, S. T., Albrecht, R. I., Artaxo, P., Barbosa, H. M. J., Borrmann, S., Fütterer, D., Jurkat, T., Mahnke, C., Minikin, A., Molleker, S., Pöhlker, M. L., Pöschl, U., Rosenfeld, D., Voigt, C., Weinzierl, B., and Wendisch, M.: Sensitivities of Amazonian clouds to aerosols and updraft speed, Atmos. Chem. Phys., 17, 10037–10050, https://doi.org/10.5194/acp-17-10037-2017, 2017. a
Chuang, P. Y., Charlson, R. J., and Seinfeld, J. H.: Kinetic limitations on droplet formation in clouds, Nature, 390, 594–596, https://doi.org/10.1038/37576, 1997. a
Conant, W. C., VanReken, T. M., Rissman, T. A., Varutbangkul, V., Jonsson, H. H., Nenes, A., Jimenez, J. L., Delia, A. E., Bahreini, R., Roberts, G. C., Flagan, R. C., and Seinfeld, J. H.: Aerosol–cloud drop concentration closure in warm cumulus, J. Geophys. Res.-Atmos., 109, D13204, https://doi.org/10.1029/2003JD004324, 2004. a, b, c, d, e, f
Feingold, G.: Modeling of the first indirect effect: Analysis of measurement requirements, Geophys. Res. Lett., 30, 1997, https://doi.org/10.1029/2003GL017967, 2003. a
Fountoukis, C., Nenes, A., Meskhidze, N., Bahreini, R., Conant, W. C., Jonsson, H., Murphy, S., Sorooshian, A., Varutbangkul, V., Brechtel, F., Flagan, R. C., and Seinfeld, J. H.: Aerosol–cloud drop concentration closure for clouds sampled during the International Consortium for Atmospheric Research on Transport and Transformation 2004 campaign, J. Geophys. Res.-Atmos., 112, D10S30, https://doi.org/10.1029/2006JD007272, 2007. a, b, c
Grabowski, W. W. and Abade, G. C.: Broadening of Cloud Droplet Spectra through Eddy Hopping: Turbulent Adiabatic Parcel Simulations, J. Atmos. Sci., 74, 1485–1493, https://doi.org/10.1175/JAS-D-17-0043.1, 2017. a
Grosvenor, D. P., Sourdeval, O., Zuidema, P., Ackerman, A., Alexandrov, M. D., Bennartz, R., Boers, R., Cairns, B., Chiu, J. C., Christensen, M., Deneke, H., Diamond, M., Feingold, G., Fridlind, A., Hünerbein, A., Knist, C., Kollias, P., Marshak, A., McCoy, D., Merk, D., Painemal, D., Rausch, J., Rosenfeld, D., Russchenberg, H., Seifert, P., Sinclair, K., Stier, P., van Diedenhoven, B., Wendisch, M., Werner, F., Wood, R., Zhang, Z., and Quaas, J.: Remote Sensing of Droplet Number Concentration in Warm Clouds: A Review of the Current State of Knowledge and Perspectives, Rev. Geophys., 56, 409–453, https://doi.org/10.1029/2017RG000593, 2018. a, b
Gunthe, S. S., King, S. M., Rose, D., Chen, Q., Roldin, P., Farmer, D. K., Jimenez, J. L., Artaxo, P., Andreae, M. O., Martin, S. T., and Pöschl, U.: Cloud condensation nuclei in pristine tropical rainforest air of Amazonia: size-resolved measurements and modeling of atmospheric aerosol composition and CCN activity, Atmos. Chem. Phys., 9, 7551–7575, https://doi.org/10.5194/acp-9-7551-2009, 2009. a
Hansen, J. E. and Travis, L. D.: Light scattering in planetary atmospheres, Space Sci. Rev., 16, 527–610, https://doi.org/10.1007/BF00168069, 1974. a
Hoppel, W. A., Frick, G. M., and Fitzgerald, J. W.: Deducing droplet concentration and supersaturation in marine boundary layer clouds from surface aerosol measurements, J. Geophys. Res.-Atmos., 101, 26553–26565, https://doi.org/10.1029/96JD02243, 1996. a
Hsieh, W., Nenes, A., Flagan, R., Seinfeld, J., Buzorius, G., and Jonsson, H.: Parameterization of cloud droplet size distributions: comparison with parcel models and observations, J. Geophys. Res.-Atmos., 114, D11205, https://doi.org/10.1029/2008JD011387, 2009. a
Hudson, J. G. and Noble, S.: CCN and Vertical Velocity Influences on Droplet Concentrations and Supersaturations in Clean and Polluted Stratus Clouds, J. Atmos. Sci., 71, 312–331, https://doi.org/10.1175/JAS-D-13-086.1, 2014a. a, b
Hudson, J. G. and Noble, S.: Low-altitude summer/winter microphysics, dynamics, and CCN spectra of northeastern Caribbean small cumuli, and comparisons with stratus, J. Geophys. Res.-Atmos., 119, 5445–5463, https://doi.org/10.1002/2013JD021442, 2014b. a
Hudson, J. G., Noble, S., and Jha, V.: Cloud droplet spectral width relationship to CCN spectra and vertical velocity, J. Geophys. Res.-Atmos., 117, D11211, https://doi.org/10.1029/2012JD017546, 2012. a
Jacobson, M. Z., Turco, R. P., Jensen, E. J., and Toon, O. B.: Modeling coagulation among particles of different composition and size, Atmos. Environ., 28, 1327–1338, https://doi.org/10.1016/1352-2310(94)90280-1, 1994. a
Jia, H., Ma, X., and Liu, Y.: Exploring aerosol–cloud interaction using VOCALS-REx aircraft measurements, Atmos. Chem. Phys., 19, 7955–7971, https://doi.org/10.5194/acp-19-7955-2019, 2019. a
Kleanthous, S., Vrekoussis, M., Mihalopoulos, N., Kalabokas, P., and Lelieveld, J.: On the temporal and spatial variation of ozone in Cyprus, Sci. Total Environ., 476–477, 677—687, https://doi.org/10.1016/j.scitotenv.2013.12.101, 2014. a
Kulmala, M., Asmi, A., Lappalainen, H. K., Baltensperger, U., Brenguier, J.-L., Facchini, M. C., Hansson, H.-C., Hov, Ø., O'Dowd, C. D., Pöschl, U., Wiedensohler, A., Boers, R., Boucher, O., de Leeuw, G., Denier van der Gon, H. A. C., Feichter, J., Krejci, R., Laj, P., Lihavainen, H., Lohmann, U., McFiggans, G., Mentel, T., Pilinis, C., Riipinen, I., Schulz, M., Stohl, A., Swietlicki, E., Vignati, E., Alves, C., Amann, M., Ammann, M., Arabas, S., Artaxo, P., Baars, H., Beddows, D. C. S., Bergström, R., Beukes, J. P., Bilde, M., Burkhart, J. F., Canonaco, F., Clegg, S. L., Coe, H., Crumeyrolle, S., D'Anna, B., Decesari, S., Gilardoni, S., Fischer, M., Fjaeraa, A. M., Fountoukis, C., George, C., Gomes, L., Halloran, P., Hamburger, T., Harrison, R. M., Herrmann, H., Hoffmann, T., Hoose, C., Hu, M., Hyvärinen, A., Hõrrak, U., Iinuma, Y., Iversen, T., Josipovic, M., Kanakidou, M., Kiendler-Scharr, A., Kirkevåg, A., Kiss, G., Klimont, Z., Kolmonen, P., Komppula, M., Kristjánsson, J.-E., Laakso, L., Laaksonen, A., Labonnote, L., Lanz, V. A., Lehtinen, K. E. J., Rizzo, L. V., Makkonen, R., Manninen, H. E., McMeeking, G., Merikanto, J., Minikin, A., Mirme, S., Morgan, W. T., Nemitz, E., O'Donnell, D., Panwar, T. S., Pawlowska, H., Petzold, A., Pienaar, J. J., Pio, C., Plass-Duelmer, C., Prévôt, A. S. H., Pryor, S., Reddington, C. L., Roberts, G., Rosenfeld, D., Schwarz, J., Seland, Ø., Sellegri, K., Shen, X. J., Shiraiwa, M., Siebert, H., Sierau, B., Simpson, D., Sun, J. Y., Topping, D., Tunved, P., Vaattovaara, P., Vakkari, V., Veefkind, J. P., Visschedijk, A., Vuollekoski, H., Vuolo, R., Wehner, B., Wildt, J., Woodward, S., Worsnop, D. R., van Zadelhoff, G.-J., Zardini, A. A., Zhang, K., van Zyl, P. G., Kerminen, V.-M., S Carslaw, K., and Pandis, S. N.: General overview: European Integrated project on Aerosol Cloud Climate and Air Quality interactions (EUCAARI) – integrating aerosol research from nano to global scales, Atmos. Chem. Phys., 11, 13061–13143, https://doi.org/10.5194/acp-11-13061-2011, 2011. a
Lohmann, U. and Feichter, J.: Global indirect aerosol effects: a review, Atmos. Chem. Phys., 5, 715–737, https://doi.org/10.5194/acp-5-715-2005, 2005. a
Lu, C., Liu, Y., Zhu, B., Yum, S. S., Krueger, S. K., Qiu, Y., Niu, S., and Luo, S.: On Which Microphysical Time Scales to Use in Studies of Entrainment-Mixing Mechanisms in Clouds, J. Geophys. Res.-Atmos., 123, 3740–3756, https://doi.org/10.1002/2017JD027985, 2018. a
Lu, C.-S., Liu, Y.-G., and Niu, S.-J.: Entrainment-mixing parameterization in shallow cumuli and effects of secondary mixing events, Chinese Sci. Bull., 59, 896–903, https://doi.org/10.1007/s11434-013-0097-1, 2014. a
Lu, M.-L., Conant, W. C., Jonsson, H. H., Varutbangkul, V., Flagan, R. C., and Seinfeld, J. H.: The Marine Stratus/Stratocumulus Experiment (MASE): Aerosol-cloud relationships in marine stratocumulus, J. Geophys. Res.-Atmos., 112, D10209, https://doi.org/10.1029/2006JD007985, 2007. a
Ma, P.-L., Rasch, P. J., Chepfer, H., Winker, D. M., and Ghan, S. J.: Observational constraint on cloud susceptibility weakened by aerosol retrieval limitations, Nat. Commun., 9, 2640, https://doi.org/10.1038/s41467-018-05028-4, 2018. a
McFiggans, G., Artaxo, P., Baltensperger, U., Coe, H., Facchini, M. C., Feingold, G., Fuzzi, S., Gysel, M., Laaksonen, A., Lohmann, U., Mentel, T. F., Murphy, D. M., O'Dowd, C. D., Snider, J. R., and Weingartner, E.: The effect of physical and chemical aerosol properties on warm cloud droplet activation, Atmos. Chem. Phys., 6, 2593-2649, https://doi.org/10.5194/acp-6-2593-2006, 2006. a
Meskhidze, N., Nenes, A., Conant, W., and Seinfeld, J.: Evaluation of a new cloud droplet activation parameterization with in situ data from CRYSTAL-FACE and CSTRIPE, J. Geophys. Res., 110, 1–10, https://doi.org/10.1029/2004JD005703, 2005. a, b
Moore, R. H., Karydis, V. A., Capps, S. L., Lathem, T. L., and Nenes, A.: Droplet number uncertainties associated with CCN: an assessment using observations and a global model adjoint, Atmos. Chem. Phys., 13, 4235–4251, https://doi.org/10.5194/acp-13-4235-2013, 2013. a
Painemal, D.: Global Estimates of Changes in Shortwave Low-Cloud Albedo and Fluxes Due to Variations in Cloud Droplet Number Concentration Derived From CERES-MODIS Satellite Sensors, Geophys. Res. Lett., 45, 9288–9296, https://doi.org/10.1029/2018GL078880, 2018. a
Painemal, D. and Minnis, P.: On the dependence of albedo on cloud microphysics over marine stratocumulus clouds regimes determined from Clouds and the Earth's Radiant Energy System (CERES) data, J. Geophys. Res.-Atmos., 117, https://doi.org/10.1029/2011JD017120, 2012. a
Painemal, D. and Zuidema, P.: Assessment of MODIS cloud effective radius and optical thickness retrievals over the Southeast Pacific with VOCALS-REx in situ measurements, J. Geophys. Res.-Atmos., 116, D24206, https://doi.org/10.1029/2011JD016155, 2011. a
Pawlowska, H. and Brenguier, J.-L.: Microphysical properties of stratocumulus clouds during ACE-2, Tellus B, 52, 868–887, https://doi.org/10.1034/j.1600-0889.2000.00076.x, 2000. a
Peng, Y., Lohmann, U., and Leaitch, R.: Importance of vertical velocity variations in the cloud droplet nucleation process of marine stratus clouds, J. Geophys. Res.-Atmos., 110, D21213, https://doi.org/10.1029/2004JD004922, 2005. a
Petters, M. D. and Kreidenweis, S. M.: A single parameter representation of hygroscopic growth and cloud condensation nucleus activity, Atmos. Chem. Phys., 7, 1961–1971, https://doi.org/10.5194/acp-7-1961-2007, 2007. a, b
Pikridas, M., Vrekoussis, M., Sciare, J., Kleanthous, S., Vasiliadou, E., Kizas, C., Savvides, C., and Mihalopoulos, N.: Spatial and temporal (short and long-term) variability of submicron, fine and sub-10 µm particulate matter (PM1, PM2.5, PM10) in Cyprus, Atmos. Environ., 191, 79–93, https://doi.org/10.1016/j.atmosenv.2018.07.048, 2018. a
Platnick, S. and Twomey, S.: Determining the Susceptibility of Cloud Albedo to Changes in Droplet Concentration with the Advanced Very High Resolution Radiometer, J. Appl. Meteorol., 33, 334–347, https://doi.org/10.1175/1520-0450(1994)033<0334:DTSOCA>2.0.CO;2, 1994. a
Prenni, A. J., Petters, M. D., Kreidenweis, S. M., Demott, P. J., and Ziemann, P. J.: Cloud droplet activation of secondary organic aerosol, J. Geophys. Res. (Atmospheres), 112, D10223, https://doi.org/10.1029/2006JD007963, 2007. a
Pringle, K. J., Carslaw, K. S., Spracklen, D. V., Mann, G. M., and Chipperfield, M. P.: The relationship between aerosol and cloud drop number concentrations in a global aerosol microphysics model, Atmos. Chem. Phys., 9, 4131–4144, https://doi.org/10.5194/acp-9-4131-2009, 2009. a
Rauber, R. M., Stevens, B., Ochs, H. T., Knight, C., Albrecht, B. A., Blyth, A. M., Fairall, C. W., Jensen, J. B., Lasher-Trapp, S. G., Mayol-Bracero, O. L., Vali, G., Anderson, J. R., Baker, B. A., Bandy, A. R., Burnet, E., Brenguier, J.-L., Brewer, W. A., Brown, P. R. A., Chuang, R., Cotton, W. R., Di Girolamo, L., Geerts, B., Gerber, H., Göke, S., Gomes, L., Heikes, B. G., Hudson, J. G., Kollias, P., Lawson, R. R., Krueger, S. K., Lenschow, D. H., Nuijens, L., O'Sullivan, D. W., Rilling, R. A., Rogers, D. C., Siebesma, A. P., Snodgrass, E., Stith, J. L., Thornton, D. C., Tucker, S., Twohy, C. H., and Zuidema, P.: Rain in Shallow Cumulus Over the Ocean: The RICO Campaign, B. Am. Meteorol. Soc., 88, 1912–1928, https://doi.org/10.1175/BAMS-88-12-1912, 2007. a
Reddington, C. L., Carslaw, K. S., Spracklen, D. V., Frontoso, M. G., Collins, L., Merikanto, J., Minikin, A., Hamburger, T., Coe, H., Kulmala, M., Aalto, P., Flentje, H., Plass-Dülmer, C., Birmili, W., Wiedensohler, A., Wehner, B., Tuch, T., Sonntag, A., O'Dowd, C. D., Jennings, S. G., Dupuy, R., Baltensperger, U., Weingartner, E., Hansson, H.-C., Tunved, P., Laj, P., Sellegri, K., Boulon, J., Putaud, J.-P., Gruening, C., Swietlicki, E., Roldin, P., Henzing, J. S., Moerman, M., Mihalopoulos, N., Kouvarakis, G., Ždímal, V., Zíková, N., Marinoni, A., Bonasoni, P., and Duchi, R.: Primary versus secondary contributions to particle number concentrations in the European boundary layer, Atmos. Chem. Phys., 11, 12007–12036, https://doi.org/10.5194/acp-11-12007-2011, 2011. a
Reutter, P., Su, H., Trentmann, J., Simmel, M., Rose, D., Gunthe, S. S., Wernli, H., Andreae, M. O., and Pöschl, U.: Aerosol- and updraft-limited regimes of cloud droplet formation: influence of particle number, size and hygroscopicity on the activation of cloud condensation nuclei (CCN), Atmos. Chem. Phys., 9, 7067–7080, https://doi.org/10.5194/acp-9-7067-2009, 2009. a
Roberts, G.: BACCHUS_Cyprus_Campaign.zip, available at: https://hal.archives-ouvertes.fr/hal-02332534, last access: 18 November 2019. a
Roberts, G. C. and Nenes, A.: A Continuous-Flow Streamwise Thermal-Gradient CCN Chamber for Atmospheric Measurements, Aerosol Sci. Tech., 39, 206–221, https://doi.org/10.1080/027868290913988, 2005. a
Roberts, G. C., Ramana, M. V., Corrigan, C., Kim, D., and Ramanathan, V.: Simultaneous observations of aerosol-cloud-albedo interactions with three stacked unmanned aerial vehicles, P. Natl. Acad. Sci. USA, 105, 7370–7375, https://doi.org/10.1073/pnas.0710308105, 2008. a
Russell, L. M. and Seinfeld, J. H.: Size- and Composition-Resolved Externally Mixed Aerosol Model, Aerosol Sci. Tech., 28, 403–416, https://doi.org/10.1080/02786829808965534, 1998. a, b, c
Russell, L. M., Seinfeld, J. H., Flagan, R. C., Ferek, R. J., Hegg, D. A., Hobbs, P. V., Wobrock, W., Flossmann, A. I., O'Dowd, C. D., Nielsen, K. E., and Durkee, P. A.: Aerosol dynamics in ship tracks, J. Geophys. Res.-Atmos., 104, 31077–31095, https://doi.org/10.1029/1999JD900985, 1999. a
Sanchez, K. J., Russell, L. M., Modini, R. L., Frossard, A. A., Ahlm, L., Corrigan, C. E., Roberts, G. C., Hawkins, L. N., Schroder, J. C., Bertram, A. K., Zhao, R., Lee, A. K. Y., Lin, J. J., Nenes, A., Wang, Z., Wonaschütz, A., Sorooshian, A., Noone, K. J., Jonsson, H., Toom, D., Macdonald, A. M., Leaitch, W. R., and Seinfeld, J. H.: Meteorological and aerosol effects on marine cloud microphysical properties, J. Geophys. Res.-Atmos., 121, 4142–4161, https://doi.org/10.1002/2015JD024595, 2016. a
Sanchez, K. J., Roberts, G. C., Calmer, R., Nicoll, K., Hashimshoni, E., Rosenfeld, D., Ovadnevaite, J., Preissler, J., Ceburnis, D., O'Dowd, C., and Russell, L. M.: Top-down and bottom-up aerosol–cloud closure: towards understanding sources of uncertainty in deriving cloud shortwave radiative flux, Atmos. Chem. Phys., 17, 9797–9814, https://doi.org/10.5194/acp-17-9797-2017, 2017. a, b, c, d, e, f, g, h, i, j, k, l
Sarangi, C., Kanawade, V. P., Tripathi, S. N., Thomas, A., and Ganguly, D.: Aerosol-induced intensification of cooling effect of clouds during Indian summer monsoon, Nat. Commun., 9, 3754, https://doi.org/10.1038/s41467-018-06015-5, 2018. a
Schrod, J., Weber, D., Drücke, J., Keleshis, C., Pikridas, M., Ebert, M., Cvetković, B., Nickovic, S., Marinou, E., Baars, H., Ansmann, A., Vrekoussis, M., Mihalopoulos, N., Sciare, J., Curtius, J., and Bingemer, H. G.: Ice nucleating particles over the Eastern Mediterranean measured by unmanned aircraft systems, Atmos. Chem. Phys., 17, 4817–4835, https://doi.org/10.5194/acp-17-4817-2017, 2017. a
Seinfeld, J. and Pandis, S.: Atmospheric chemistry and physics, from air pollution to climate change, John Wiley and Sons, New York, USA, ISBN 978-0-471-72018-8, 2006. a, b
Snider, J. R., Guibert, S., Brenguier, J.-L., and Putaud, J.-P.: Aerosol activation in marine stratocumulus clouds: 2. Köhler and parcel theory closure studies, J. Geophys. Res.-Atmos., 108, 8629, https://doi.org/10.1029/2002JD002692, 2003. a
Stein, A. F., Draxler, R. R., Rolph, G. D., Stunder, B. J. B., Cohen, M. D., and Ngan, F.: NOAA's HYSPLIT Atmospheric Transport and Dispersion Modeling System, B. Am. Meteorol. Soc., 96, 2059–2077, https://doi.org/10.1175/BAMS-D-14-00110.1, 2015. a
Stephens, G. L.: Radiation Profiles in Extended Water Clouds. II: Parameterization Schemes, J. Atmos. Sci., 35, 2123–2132, https://doi.org/10.1175/1520-0469(1978)035<2123:RPIEWC>2.0.CO;2, 1978. a
Twomey, S.: Pollution and the planetary albedo, Atmos. Environ., 8, 1251–1256, https://doi.org/10.1016/0004-6981(74)90004-3, 1974. a
Twomey, S.: The Influence of Pollution on the Shortwave Albedo of Clouds, J. Atmos. Sci., 34, 1149–1152, https://doi.org/10.1175/1520-0469(1977)034<1149:TIOPOT>2.0.CO;2, 1977. a
Wang, J., Daum, P. H., Yum, S. S., Liu, Y., Senum, G. I., Lu, M.-L., Seinfeld, J. H., and Jonsson, H.: Observations of marine stratocumulus microphysics and implications for processes controlling droplet spectra: Results from the Marine Stratus/Stratocumulus Experiment, J. Geophys. Res.-Atmos., 114, D18210, https://doi.org/10.1029/2008JD011035, 2009. a
Weinzierl, B., Ansmann, A., Prospero, J. M., Althausen, D., Benker, N., Chouza, F., Dollner, M., Farrell, D., Fomba, W. K., Freudenthaler, V., Gasteiger, J., Groß, S., Haarig, M., Heinold, B., Kandler, K., Kristensen, T. B., Mayol-Bracero, O. L., Müller, T., Reitebuch, O., Sauer, D., Schäfler, A., Schepanski, K., Spanu, A., Tegen, I., Toledano, C., and Walser, A.: The Saharan Aerosol Long-Range Transport and Aerosol–Cloud-Interaction Experiment: Overview and Selected Highlights, B. Am. Meteorol. Soc., 98, 1427–1451, https://doi.org/10.1175/BAMS-D-15-00142.1, 2017. a
Werner, F., Ditas, F., Siebert, H., Simmel, M., Wehner, B., Pilewskie, P., Schmeissner, T., Shaw, R. A., Hartmann, S., Wex, H., Roberts, G. C., and Wendisch, M.: Twomey effect observed from collocated microphysical and remote sensing measurements over shallow cumulus, J. Geophys. Res.-Atmos., 119, 1534–1545, https://doi.org/10.1002/2013JD020131, 2014. a
Wiedensohler, A., Birmili, W., Nowak, A., Sonntag, A., Weinhold, K., Merkel, M., Wehner, B., Tuch, T., Pfeifer, S., Fiebig, M., Fjäraa, A. M., Asmi, E., Sellegri, K., Depuy, R., Venzac, H., Villani, P., Laj, P., Aalto, P., Ogren, J. A., Swietlicki, E., Williams, P., Roldin, P., Quincey, P., Hüglin, C., Fierz-Schmidhauser, R., Gysel, M., Weingartner, E., Riccobono, F., Santos, S., Grüning, C., Faloon, K., Beddows, D., Harrison, R., Monahan, C., Jennings, S. G., O'Dowd, C. D., Marinoni, A., Horn, H.-G., Keck, L., Jiang, J., Scheckman, J., McMurry, P. H., Deng, Z., Zhao, C. S., Moerman, M., Henzing, B., de Leeuw, G., Löschau, G., and Bastian, S.: Mobility particle size spectrometers: harmonization of technical standards and data structure to facilitate high quality long-term observations of atmospheric particle number size distributions, Atmos. Meas. Tech., 5, 657–685, https://doi.org/10.5194/amt-5-657-2012, 2012. a
Wood, R.: Stratocumulus Clouds, Mon. Weather Rev., 140, 2373–2423, https://doi.org/10.1175/MWR-D-11-00121.1, 2012. a
Yum, S. S., Wang, J., Liu, Y., Senum, G., Springston, S., McGraw, R., and Yeom, J. M.: Cloud microphysical relationships and their implication on entrainment and mixing mechanism for the stratocumulus clouds measured during the VOCALS project, J. Geophys. Res.-Atmos., 120, 5047–5069, https://doi.org/10.1002/2014JD022802, 2015. a