the Creative Commons Attribution 4.0 License.
the Creative Commons Attribution 4.0 License.
 | 20 Nov 2019
Dominant patterns of summer ozone pollution in eastern China and associated atmospheric circulations
Zhicong Yin
Bufan Cao
Huijun Wang
Surface ozone has been severe during summers in the eastern parts of China, damaging human health and flora and fauna. During 2015–2018, ground-level ozone pollution increased and intensified from south to north. In North China and the Huanghuai region, the O3 concentrations were highest. Two dominant patterns of summer ozone pollution were determined, i.e., a south–north covariant pattern and a south–north differential pattern. The anomalous atmospheric circulations composited for the first pattern manifested as a zonally enhanced East Asian deep trough and as a western Pacific subtropical high, whose western ridge point shifted northward. The local hot, dry air and intense solar radiation enhanced the photochemical reactions to elevate the O3 pollution levels in North China and the Huanghuai region; however, the removal of pollutants was decreased. For the second pattern, the broad positive geopotential height anomalies at high latitudes significantly weakened cold air advection from the north, and those extending to North China resulted in locally high temperatures near the surface. In a different manner, the western Pacific subtropical high transported sufficient water vapor to the Yangtze River Delta and resulted in a locally adverse environment for the formation of surface ozone. In addition, the most dominant pattern in 2017 and 2018 was different from that in previous years, which is investigated as a new feature.
- Article
(9089 KB) - Full-text XML
-
Supplement
(587 KB) - BibTeX
- EndNote


High levels of ozone occur both in the stratosphere and at the ground level. Stratospheric ozone forms a protective layer that shields us from the Sun's harmful ultraviolet radiation. However, surface ozone is an air pollutant and has harmful effects on people and the environment, such as damaging human lungs (Day et al., 2017) and destroying agricultural crops and forest vegetation (Yue et al., 2017). Worldwide, polluted ozone events are more frequent and stronger in China than those that have taken place in Japan, South Korea, Europe and the United States (Lu et al., 2018). Due to their close relationship with anthropogenic emissions (Li et al., 2018), the high O3 concentrations in China are mainly observed in urban regions, such as in North China (NC, Fig. 1b), the Yangtze River Delta (YRD) and the Pearl River Delta (PRD), where rapid development has occurred in recent decades (Wang et al., 2017). An increase in surface ozone levels was found in China in 2016 and 2017 relative to 2013 and 2014 (Lu et al., 2018). The O3 pollution levels in Beijing–Tianjin–Hebei (part of NC) were the most severe in China (Wang et al., 2006; Shi et al., 2015), and this situation has been getting worse. The O3 concentrations in North China underwent a significant increase in the period of 2005–2015, with an average rate of 1.13±0.01 ppbv yr−1 (Ma et al., 2016). Although far away from the anthropogenic emissions, the summer (June–July–August, JJA) O3 on the highest mountain over NC (Mount Tai) increased significantly by 2.1 ppbv yr−1 from 2003 to 2015 (Sun et al., 2016). The O3 levels generally presented increasing trends from 2012 to 2015 in the YRD (Tong et al., 2017), e.g., the O3 concentrations in Shanghai (a megacity) increased by 67 % from 2006 to 2015 (Gao et al., 2017). In the PRD region, O3 increased by 0.86 ppbv yr−1 from 2006 to 2011 (Li et al., 2014). Furthermore, ozone pollution is projected to increase in the future over eastern China (Wang et al., 2013).

Figure 1Distribution of the (a) mean values and (b) maximum values of MDA8 (unit: µg m−3) at the observation sites in summer from 2015 to 2018. The black boxes in panels (a) and (b) indicate the locations of North China and the Huanghuai region (NCH), North China (NC), Yangtze River Delta (YRD), and Pearl River Delta (PRD).
Although deep stratospheric intrusions may elevate surface ozone levels (Lin et al., 2015), the main source of surface ozone is the photochemical reactions between the oxides of nitrogen (NOx) and volatile organic compounds (VOCs), i.e., NOx + VOC = O3. The concentrations of NOx and VOC are fundamental drivers impacting ozone production and are sensitive to the regime of ozone formation, i.e., NOx-limited or VOC-limited regimes (Jin and Holloway, 2015). The changes in fine particulate matter are also a pervasive factor for the variation in ozone concentration. Employing the GEOS-Chem chemical transport model, Li et al. (2018) found that rapid decreases in fine particulate matter levels significantly stimulated ozone production in NC by slowing down the aerosol sink of hydro-peroxy radicals. In addition, the meteorological conditions also influenced the ozone levels via modulation of the photochemical episodes and removal effects (Yin et al., 2019; Lu et al., 2019). Intense solar radiation accelerated chemical O3 production (Tong et al., 2017). A severe heat wave in the YRD contributed to high O3 concentrations in 2013 (Pu et al., 2017). Winds had an impact on the O3 and its precursors at downwind locations (Doherty et al., 2013). Local meteorological influences are always related to specific large-scale atmospheric circulations. The changes in the East Asian summer monsoon led to 2 %–5 % interannual variations in surface O3 concentrations over central eastern China (Yang et al., 2014). Continental anticyclones created sunny and calm weather, which are favorable conditions for O3 production in NC (Ding et al., 2013; Yin et al., 2019). Due to the associated transport of pollution from inland, tropical cyclones are often related to the evaluation of surface O3 levels in the coastal areas of the PRD (Ding et al., 2004). Based on a case study in 2014, further studies showed that a strong western Pacific subtropical high (WPSH) was unfavorable for the formation of O3 in South China (Zhao and Wang, 2017); however, the physical mechanisms to impact O3 in North China were still not sufficiently explained. Thus, in addition to human activities and secondary aerosol processes, the impacts of atmospheric circulations and meteorological conditions must be systematically studied to improve understanding of the O3 pollution in North China.
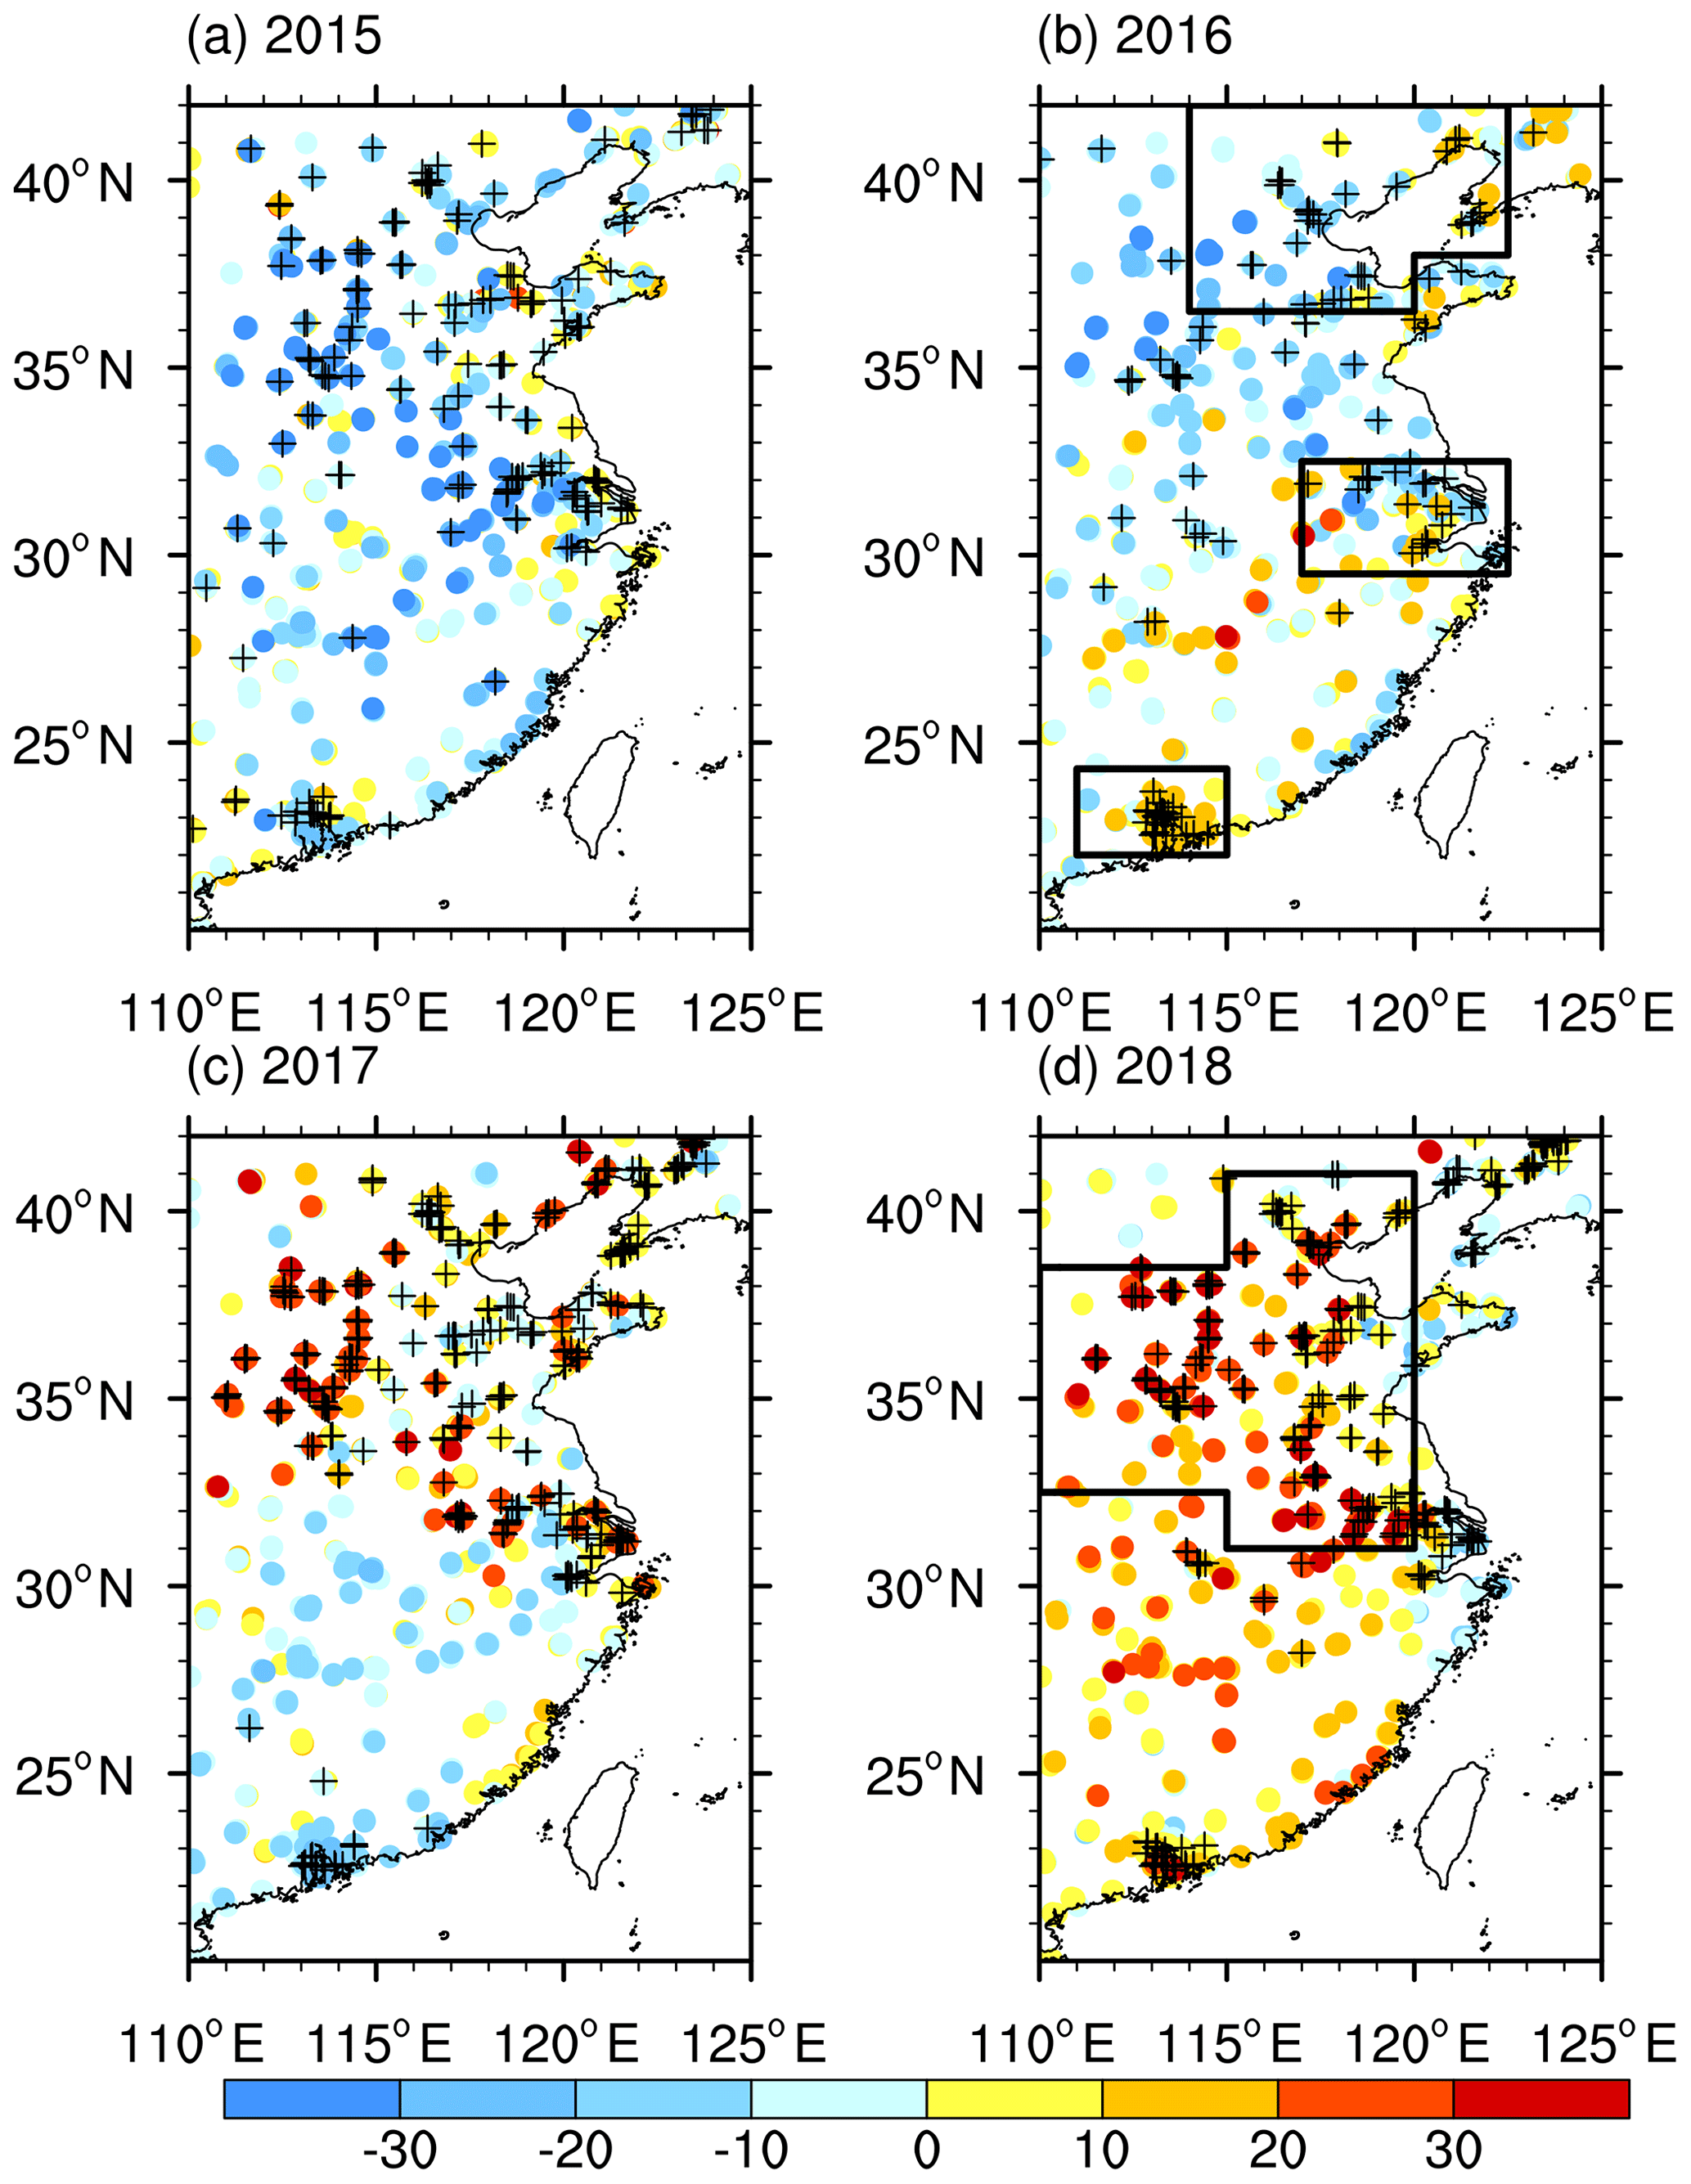
Figure 2Anomalies of the summer mean MDA8 (unit: µg m−3) in 2015 (a), 2016 (b), 2017 (c) and 2018 (d), relative to the mean during 2015–2018. The black pluses indicate that the maximum MDA8 was larger than 265 µg m−3. The black boxes in (b) indicate the locations of NC, YRD and PRD, while that in panel (d) is the NCH area.
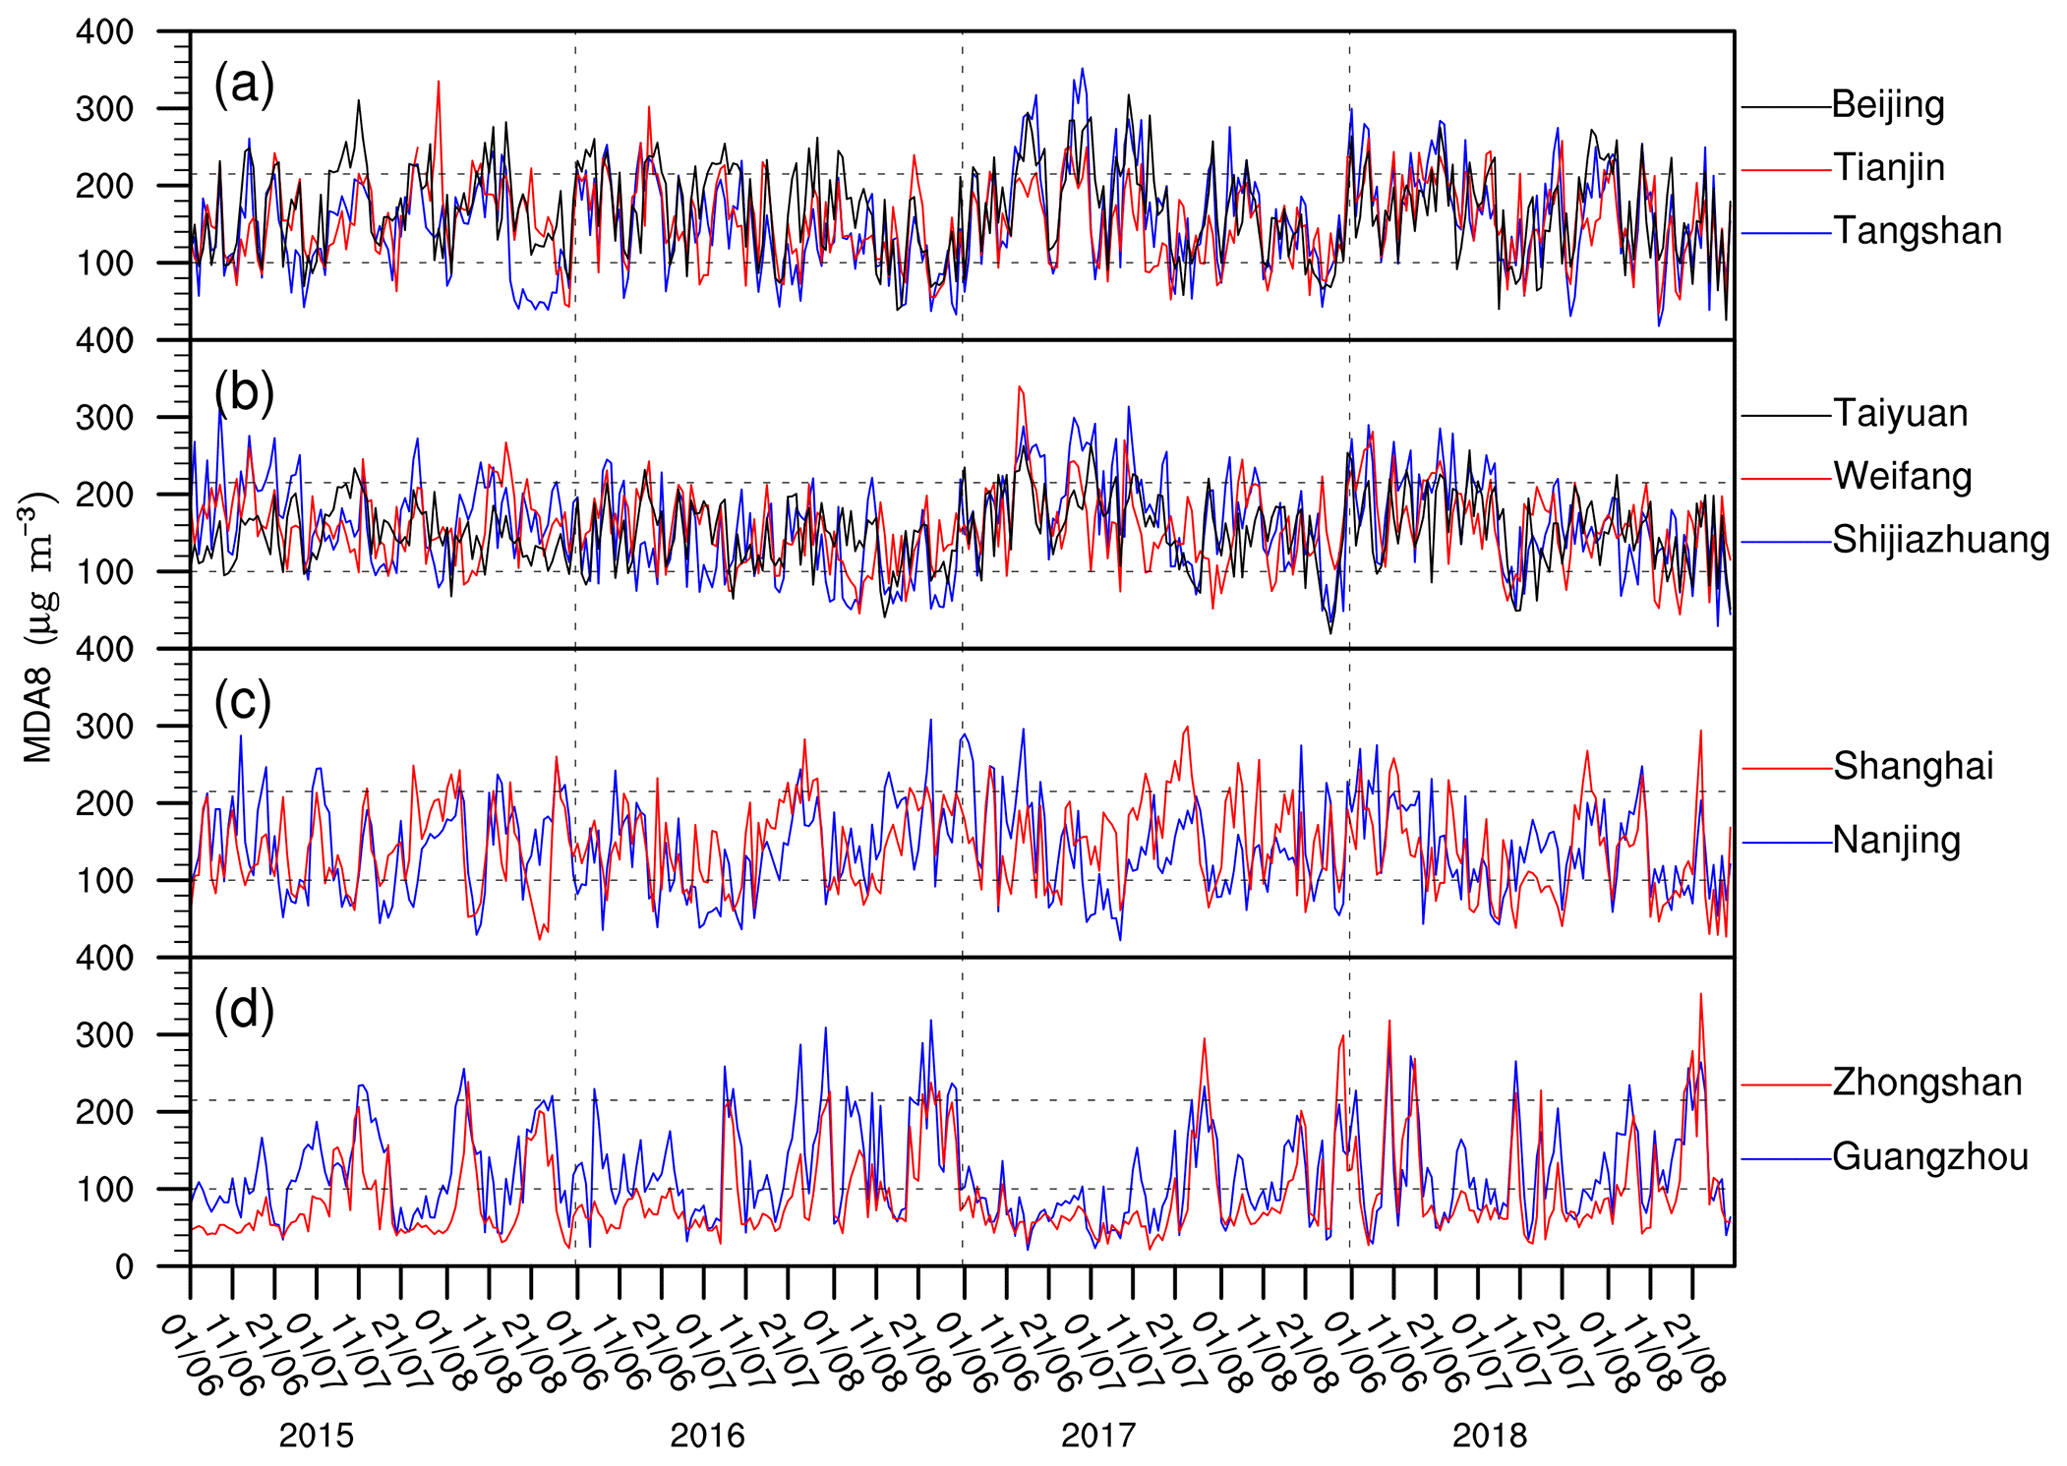
Figure 3Variations in MDA8 (unit: µg m−3) of polluted cities from 2015 to 2018, including (a) Beijing (the capital of China), Tianjin, and Tangshan near the capital city; (b) Taiyuan, Weifang, and Shijiazhuang in the south of NCH; (c) Shanghai and Nanjing in the YRD; and (d) Zhongshan and Guangzhou in the PRD. The cities in (a)–(d) are located from north to south and are illustrated in Fig. S2. The horizontal dashed lines indicate the value of 100 and 215 µg m−3.
Since 2015, O3 measurements in eastern China were steadily and widely implemented, but the O3 weather studies mainly focused on meteorological elements (e.g., temperature, precipitation etc.) and several synoptic processes (Xu et al., 2017; Xiao et al., 2018; Pu et al., 2017). The dominant patterns of daily ozone in summer in eastern China are still unclear. In this study, we built upon the previous literature analyzing ozone and meteorological influences. Thanks to the availability of more ozone observations made by the Chinese government since 2015, providing us with more information to analyze than was available in earlier studies, e.g., Zhao and Wang (2017). The findings of this study basically help us to understand the varying features of daily surface ozone pollution in eastern China and its relationship with large-scale atmospheric circulations.

Figure 4The first EOF pattern (PAT1: a, b) and second EOF pattern (PAT2: c, d) of MDA8 in summer from 2015 to 2018, including the spatial pattern (a, c) and time coefficient (b, d). The black boxes in (a) and (c) are the North China and Huanghuai region (NCH), North China (NC), Yangtze River Delta (YRD), and Pearl River Delta (PRD). The EOF analysis is applied to the daily MDA8 anomalies at 868 stations to extract the changed features of the original data on a daily timescale. The percentages in panels (b) and (d) are the variance contributions of the first and second EOF mode. The horizontal dashed lines indicate one standard deviation, and the vertical lines separate the years.
Nationwide hourly O3 concentration data taken since May 2014 are publicly available at http://beijingair.sinaapp.com/, last access: 24 February 2019. Since the severe air pollution events in 2013, the air pollution issues gained more attentions from the Chinese government and society, which aided the start of the extensive construction of operational monitoring stations of atmospheric components and resulted in continuously increasing number of sites (Fig. S1 in the Supplement). The number of sites in eastern China (22–42∘ N, 110–125∘ E) was 677, 937, 937, 995 and 1007 from 2014 to 2018. It is obvious that the data in 2014 were deficient, while the observations were broadly distributed in eastern China and continuously achieved since 2015. Thus, the summer O3 data from 2015 to 2018 were processed (e.g., unifying the sites and eliminating the missing value), and 868 sites in eastern China were employed here to reveal some new features of surface ozone pollution and associated anomalous atmospheric circulations. Generally, severe air pollution occurred more frequently in cites than in rural areas; therefore, the monitoring sites of atmospheric components mostly gathered around the urban areas, indicating the results of this study were more suitable for urban O3 pollution. The maximum daily average 8 h concentration of ozone (MDA8) is the maximum of the running 8 h mean O3 concentration during an entire 24 h day. According to the Technical Regulation on Ambient Air Quality Index of China (the Ministry of Environmental Protection of China, 2012), MDA8 is generally used to represent the daily O3 conditions. The MDA8 ∈ [0, 100], (100, 160], (160, 215], (215, 265], (265, 800] µg m−3 corresponds to “excellent”, “good”, “lightly polluted”, “moderately polluted”, “heavily polluted” levels of air quality in China.
The ERA-Interim data used here include the geopotential height (Z) at 850 and 500 hPa; zonal and meridional wind, relative humidity, vertical velocity, and air temperature from the surface to 100 hPa; surface air temperature (SAT) and wind; downward solar radiation at the surface; and low and medium cloud cover and precipitation (Dee et al., 2011). Because the maximum photochemical activity often occurred in the afternoon (Wang et al., 2010), the daytime data were calculated by the 6-hourly reanalysis (including Z, wind, relative humidity, vertical velocity, air temperature and cloud cover) and 3-hourly data (precipitation and downward solar radiation) to composite the daytime atmospheric circulations and daytime meteorological conditions. The “daytime” of the ERA-Interim variables was defined as 05:00–17:00 (Beijing time; 21:00–09:00 UTC).
The empirical orthogonal function (EOF) analysis is a widely used statistical method in meteorology to reconstruct the original variables into several irrelevant patterns (Wilks, 2011). The EOF analysis, applied to the daily anomalies (MDA8 anomalies at 868 stations in this study), extracted the relative change features of the original data on a daily timescale. The orthogonal modes included spatial and temporal coefficients and contained information of some proportion (variance contributions) from the original fields. A significance test must be executed to confirm whether the decomposed patterns had physical meaning. In this study, we used the test method form North et al. (1982). That is, if the eigenvalue (λ) satisfied the condition of , the eigenvalue λi was significantly separated. We performed this significance test on the selected patterns from EOF decompositions and confirmed that these dominant patterns in this study were all significant. The aforementioned EOF analysis programs were finished by the NCAR command language.
During 2015–2018, summer surface ozone pollution was severe in China, especially in the economically developed regions. Spatially, the JJA mean MDA8 increased from south to north in eastern China (Fig. 1a). To the south of 28∘ N (i.e., South China), the mean MDA8 was mostly lower than 100 µg m−3 and lower than the O3 pollution in North China and in the Huanghuai area (NCH, Fig. 1a). It is notable that, although the values of MDA8 in the PRD were not as large as those in NCH, they were higher relative to those in the surrounding areas. The mean MDA8 was above 110 µg m−3 to the north of 32∘ N (i.e., the NCH area), within this area the large values of MDA8 centered on the Beijing–Tianjin–Hebei region and in western Shandong province exceeded 150 µg m−3. In the transitional zone, i.e., between 28 and 32∘ N, the MDA8 varied from 100 to 120 µg m−3. Surface O3 pollution was closely linked to the anthropogenic emissions that dispersed and concentrated in the large cities (Fu et al., 2012), which was similar to the haze pollution (Yin et al., 2015). In the megacity cluster, the photochemical regime for ozone formation is combination of NOx-limited and VOC-limited regimes (Jin and Holloway, 2015). In the YRD and PRD, high levels of MDA8 were scattered around the large cities. Due to high emissions of NOx both in large and small cities in the NCH region, the high-level O3 values were contiguous, indicating extensive surface O3 pollution (Fig. 1). Furthermore, the maximum values of MDA8 for four summers were extracted to evaluate the severest levels of O3 pollution (Fig. 1b). To the north of 30∘ N, the maximum MDA8 at most sites was above 265 µg m−3 (i.e., the threshold of heavily O3 pollution in China), indicating that heavy O3 pollution had occurred. The observed summer MDA8 anomalies in eastern China also presented evident interannual differences (Fig. 2). The number of sites with maximum MDA8 > 265 µg m−3 in NCH (YRD) was 94 (35), 55 (22), 180 (58) and 160 (46) from 2015 to 2018 (Fig. 2). The summer mean MDA8 in the PRD was not as high as that in NC and the YRD (Fig. 1a), but maximum O3 concentrations that exceeded 265 µg m−3 could also be observed in certain large cities of the PRD in each year (Fig. 2).
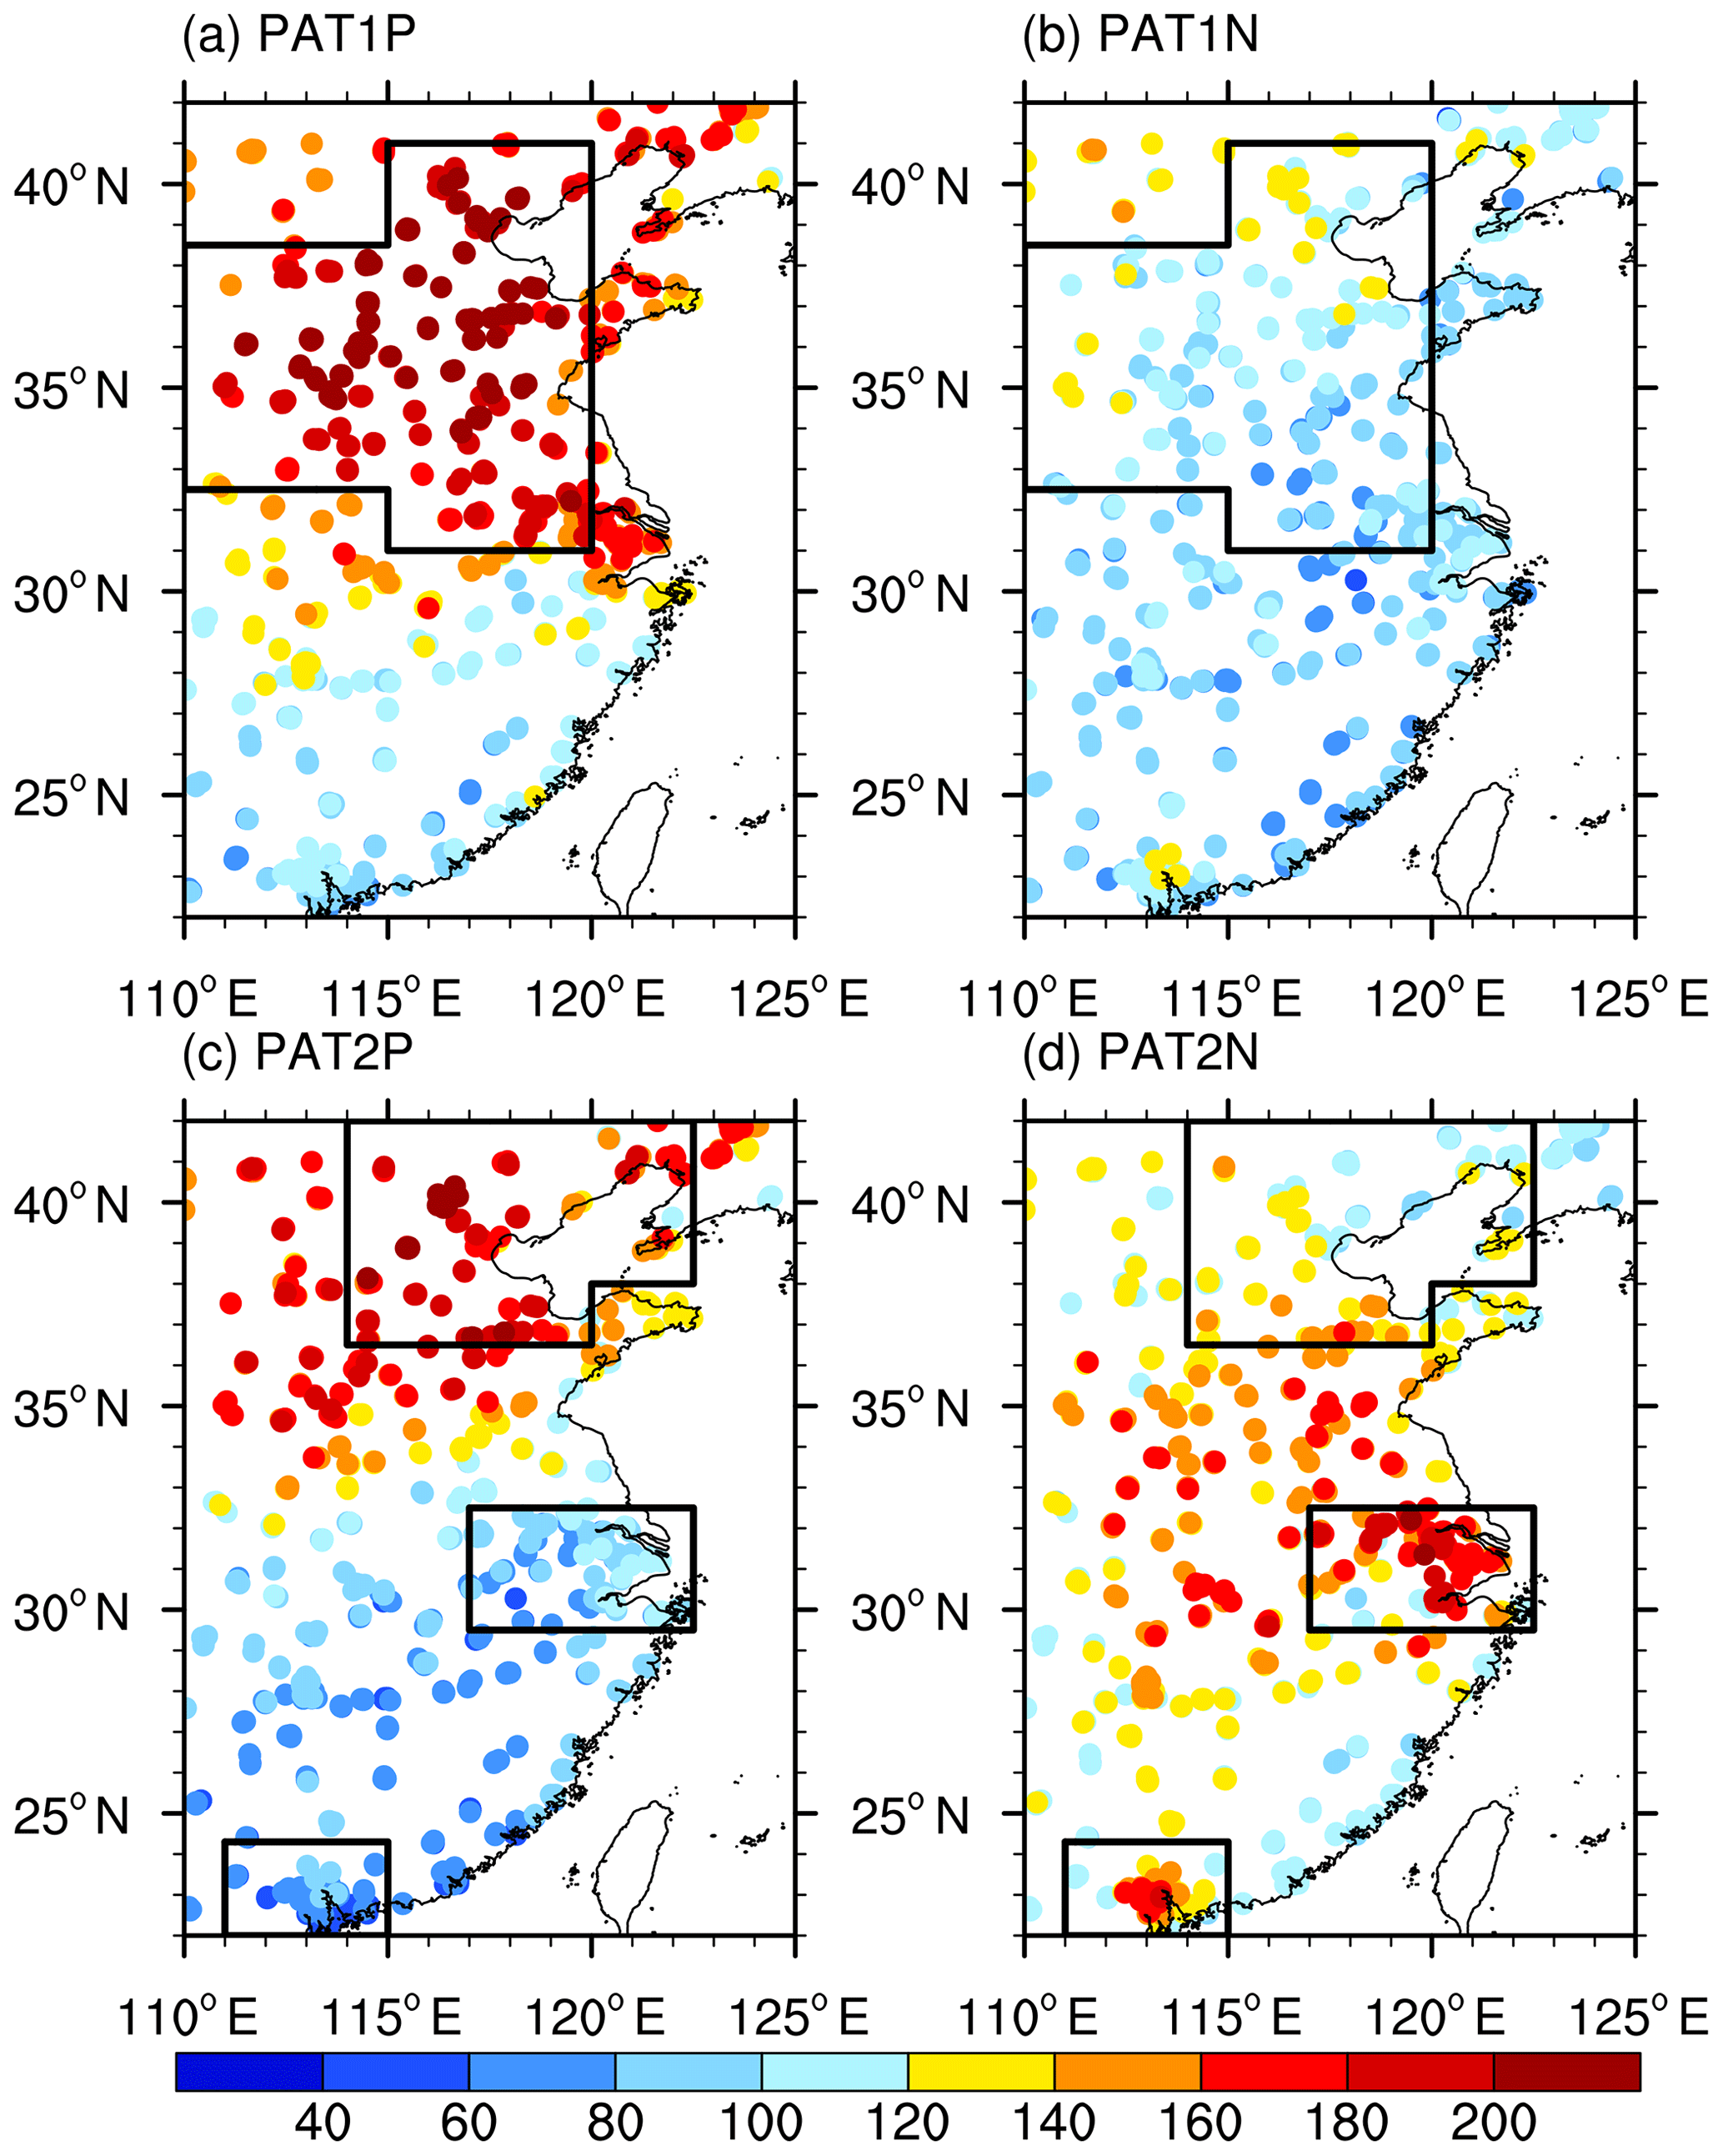
Figure 5Composites of the MDA8 (unit: µg m−3) for PAT1 (a, b) and PAT2 (c, d) in summer from 2015 to 2018. Panels (a) and (c) are composited when the time coefficient of EOF1 and EOF2 is greater than one standard deviation, while panels (b) and (d) are composited when the time coefficient is less than a standard deviation. The black box in panels (a)–(b) indicates the location of NCH, while those in panels (c)–(d) are the NH, YRD and PRD areas.
A total of 10 cities with O3 pollution were chosen to investigate the temporal variations, including Beijing (capital of China), Tangshan, and Tianjin near the capital city; Shijiazhuang, Weifang and Taiyuan in the south of NCH; Nanjing and Shanghai in the YRD; and Guangdong and Zhongshan in the PRD (Fig. S2). These cities had large populations and were with high levels of O3 pollution. In Beijing, Tianjin and Tangshan, the MDA8 values were nearly always above 100 µg m−3 and frequently exceeded 215 µg m−3 (Fig. 3a). The percentage of non-O3-polluted days (< 100 µg m−3) and moderately O3-polluted days (>215 µg m−3) were 14.9 % and 15.5 % for the mean MDA8 of these three cities. The former percentage indicates that more than 85 % of O3 concentrations exceeded the health threshold (i.e., the upper limit excellent level), and the latter means that in more than 15 % of summer days O3 concentrations moderately damaged human health in the Beijing–Tianjin–Hebei region. The maximum MDA8 in the north of Hebei province (e.g., Tangshan in Fig. 3a) and in eastern Shandong province (e.g., Weifang in Fig. 3b) even exceeded 320 µg m−3, which badly injured the health of local citizens. In Shijiazhuang, Weifang and Taiyuan, the MDA8 levels were lower than those in Beijing and Tianjin during 2015–2016 but dramatically increased to levels comparable to those of Beijing and Tianjin in 2017 and 2018 (Fig. 3a, b). In Nanjing and Shanghai, the MDA8 did not show a clear increasing trend (Fig. 3c). Similar to the distribution of the mean MDA8, the maximum MDA8 to the south of 30∘ N was lower by comparison. Although approximately 60 % of summer days were non-O3-polluted in the cities of Guangzhou and Zhongshan (Fig. 3d), heavily polluted O3 pollution also occurred in the PRD (Fig. 1b).
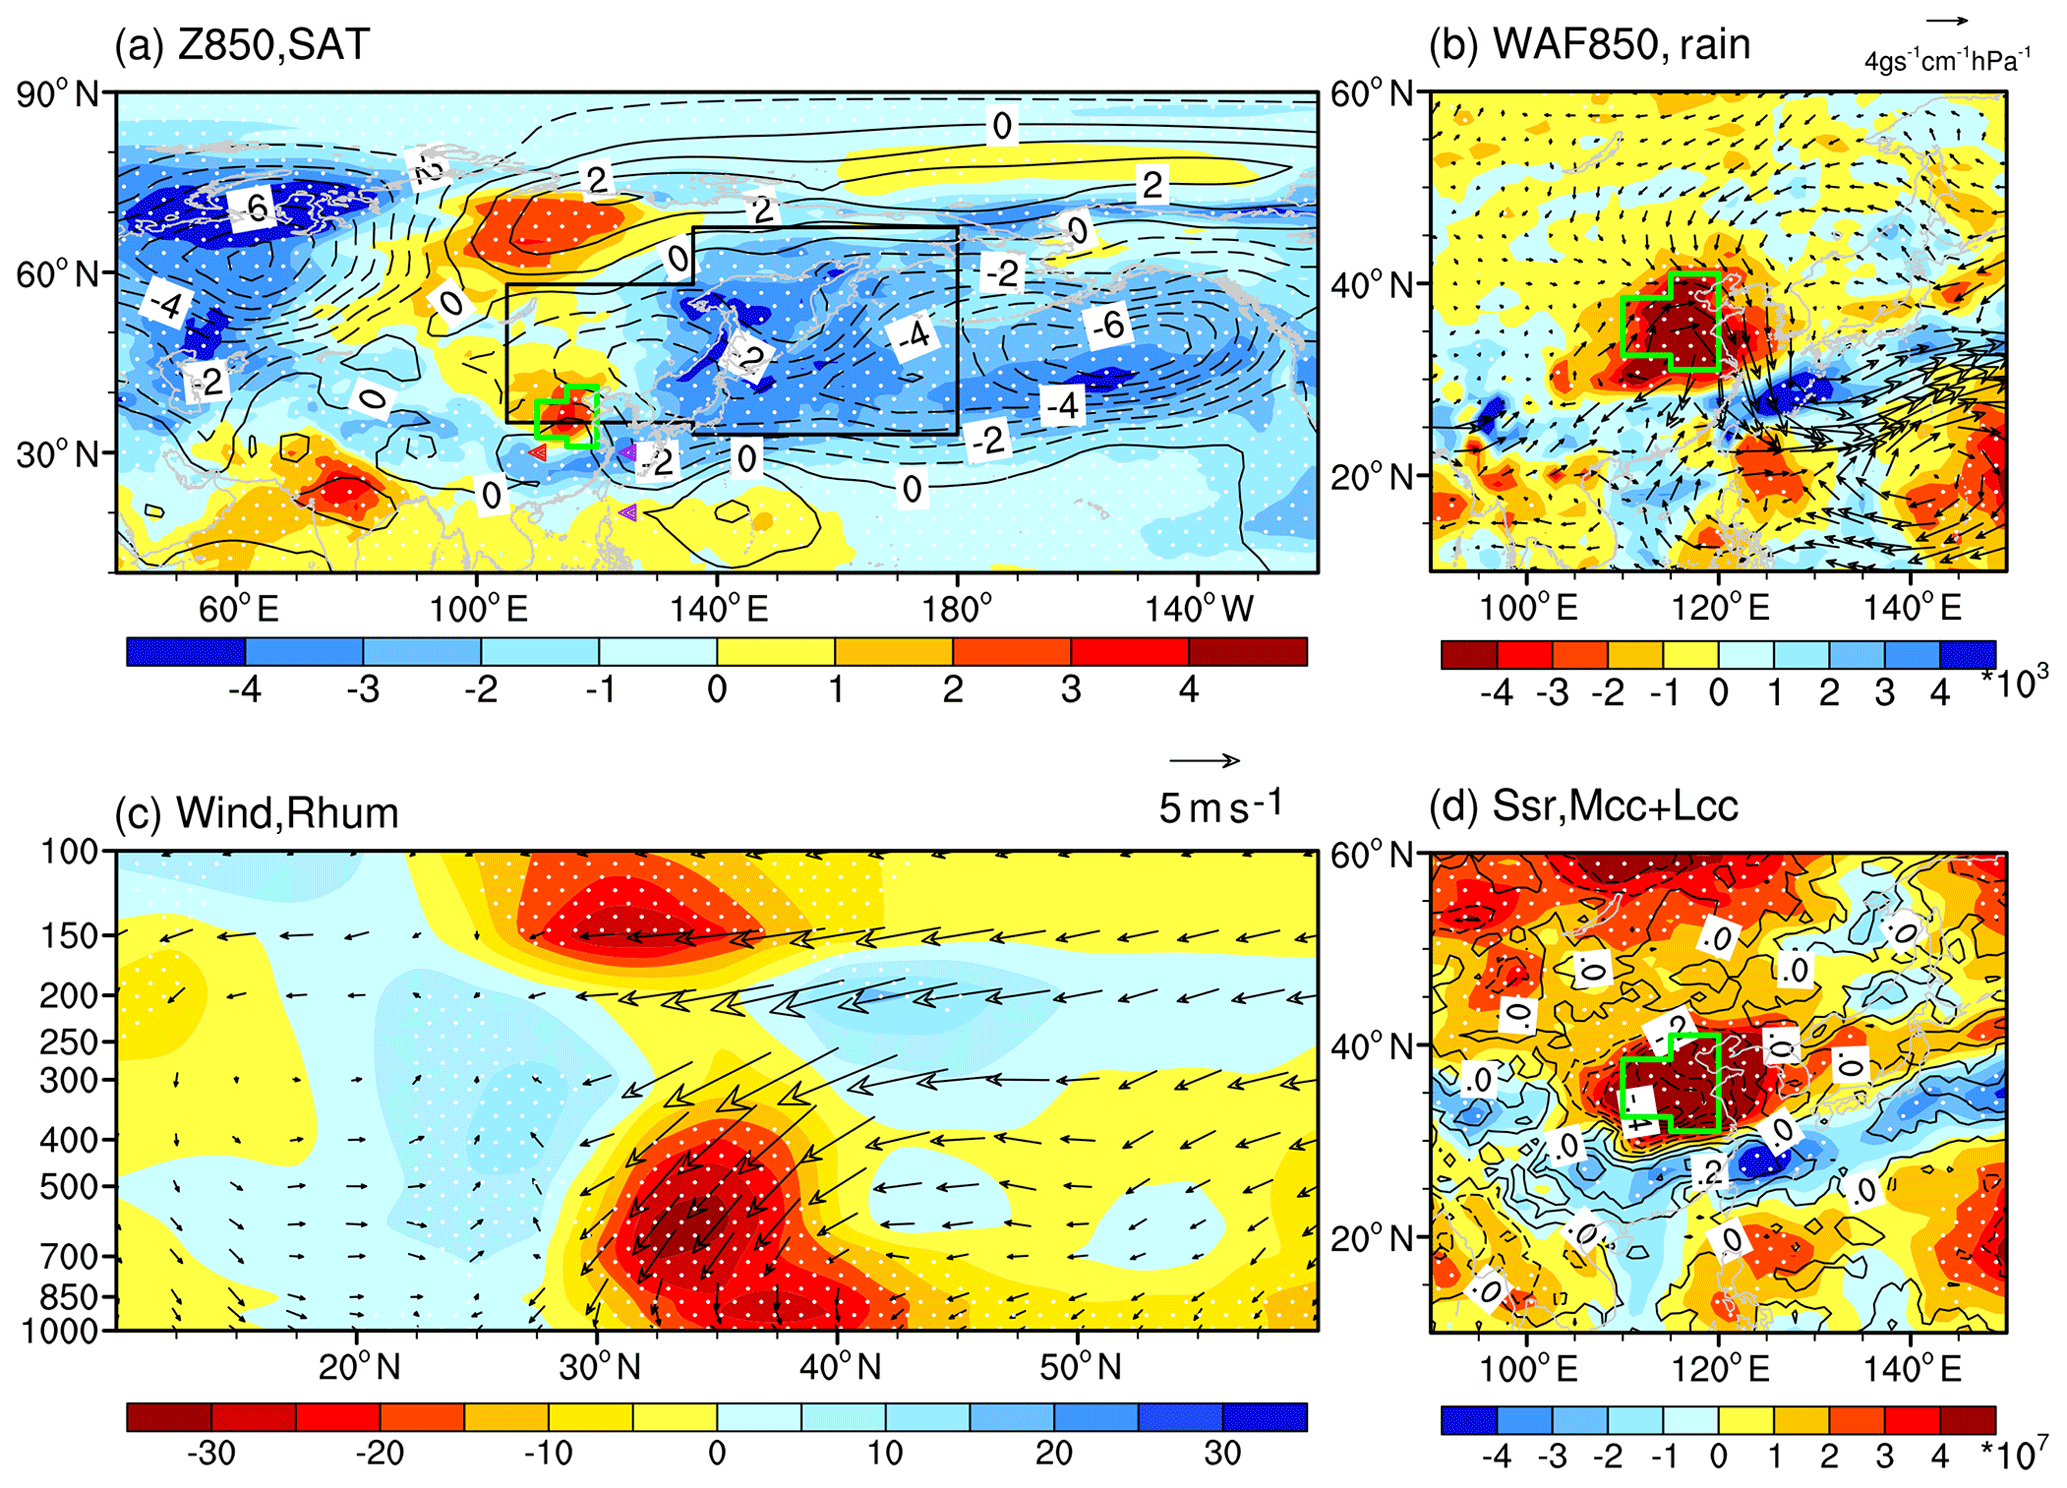
Figure 6Differences of the daytime atmospheric circulations (i.e., PAT1P minus PAT1N): (a) geopotential height at 850 hPa (unit: 10gpm, contours) and surface air temperature (unit: K, shading), (b) water vapor flux (unit: g s−1 cm−1 hPa−1) at 850 hPa (arrows) and precipitation (unit: mm, shading), (c) 100–120∘ E mean wind (unit: m s−1, arrows) and relative humidity (unit: %, shading), and (d) downward solar radiation at the surface (unit: 107 J m−2, shading) and the sum of low and medium cloud cover (unit: 1, contours). The white dots indicate that the shading was above the 95 % confidence level. The green boxes in panels (a), (b) and (d) show the NCH region, and the black box in panel (a) indicates the location of the East Asian trough. The purple triangles in panel (a) indicate the data used to calculate the WPSH1, while the red triangle represents the western ridge point of WPSH.

Figure 7Differences of the daytime atmospheric circulations (i.e., PAT2P minus PAT2N): (a) geopotential height at 500 hPa (unit: 10 gpm, contours) and surface air temperature (unit: K, shading), (b) water vapor flux (unit: g s−1 cm−1 hPa−1) at 850 hPa (arrows) and precipitation (unit: mm, shading), (c) 100–120∘ E mean wind (unit: m s−1, arrows) and relative humidity (unit: %, shading), and (d) downward solar radiation at the surface (unit: 107 J m−2, shading) and the sum of low and medium cloud cover (unit: 1, contours). The white dots indicate that the shading was above the 95 % confidence level. The green boxes in panels (a), (b) and (d) are the NC and YRD regions, and the black box in panel (a) indicates the location of the East Asian trough. The purple triangles in panel (a) indicate the data used to calculate the WPSH2.
Considering the characteristics of the observed MDA8 mentioned above, the EOF approach was used to explore the dominant patterns of summer ozone pollution in eastern China (Fig. 4). The percentages of variance contribution for the first three patterns were 21.5 %, 15.5 % and 8 %. The significance test of the EOF eigenvalues confirmed that the first three patterns were significantly separated. Approximately 37 % of the variability in the original data was contained in the first two patterns; therefore, they were defined as the dominant patterns of surface ozone pollution on a daily timescale. In the first EOF pattern (PAT1), the observed MDA8 at different sites changed similarly and the center of the variation was located in the NCH area (Fig. 4a). The time series of EOF1 showed that the ozone pollution during 2017–2018 was more serious than that in 2015 and 2016 (Fig. 4b). In contrast, the second EOF pattern (PAT2), showed notable south–north difference, with centers in the NC and YRD regions (Fig. 4c). The time coefficient of PAT2 did not show an obvious increasing trend (Fig. 4d). The positive (P) and negative (N) phases of PAT1 (PAT1P, PAT1N) and PAT2 (PAT2P, PAT2N) are defined by the events that are greater than one standard deviation and less than a standard deviation, respectively (Fig. 4b, d).
Figure 4 illustrates the EOF results for the dominant patterns of surface ozone, while Fig. 5 shows the MDA8 composites, broken down into the positive and negative phases. The ozone concentrations for the PAT1P classification (Fig. 5a) were generally greater than those for PAT1N (Fig. 5b). Most of the MDA8 values in the NCH region were > 160 µg m−3 and < 120 µg m−3 for PAT1P and PAT1N, respectively (Fig. 5a, b). For the second pattern, the PAT2P appeared as a diminishing pattern from the north to the south (Fig. 5c); however, there were high concentrations of ozone pollution in the YRD and PRD under PAT2N conditions (Fig. 5d). Therefore, the centers of O3 variation were NCH for the PAT1 and NC and the YRD for the PAT2.
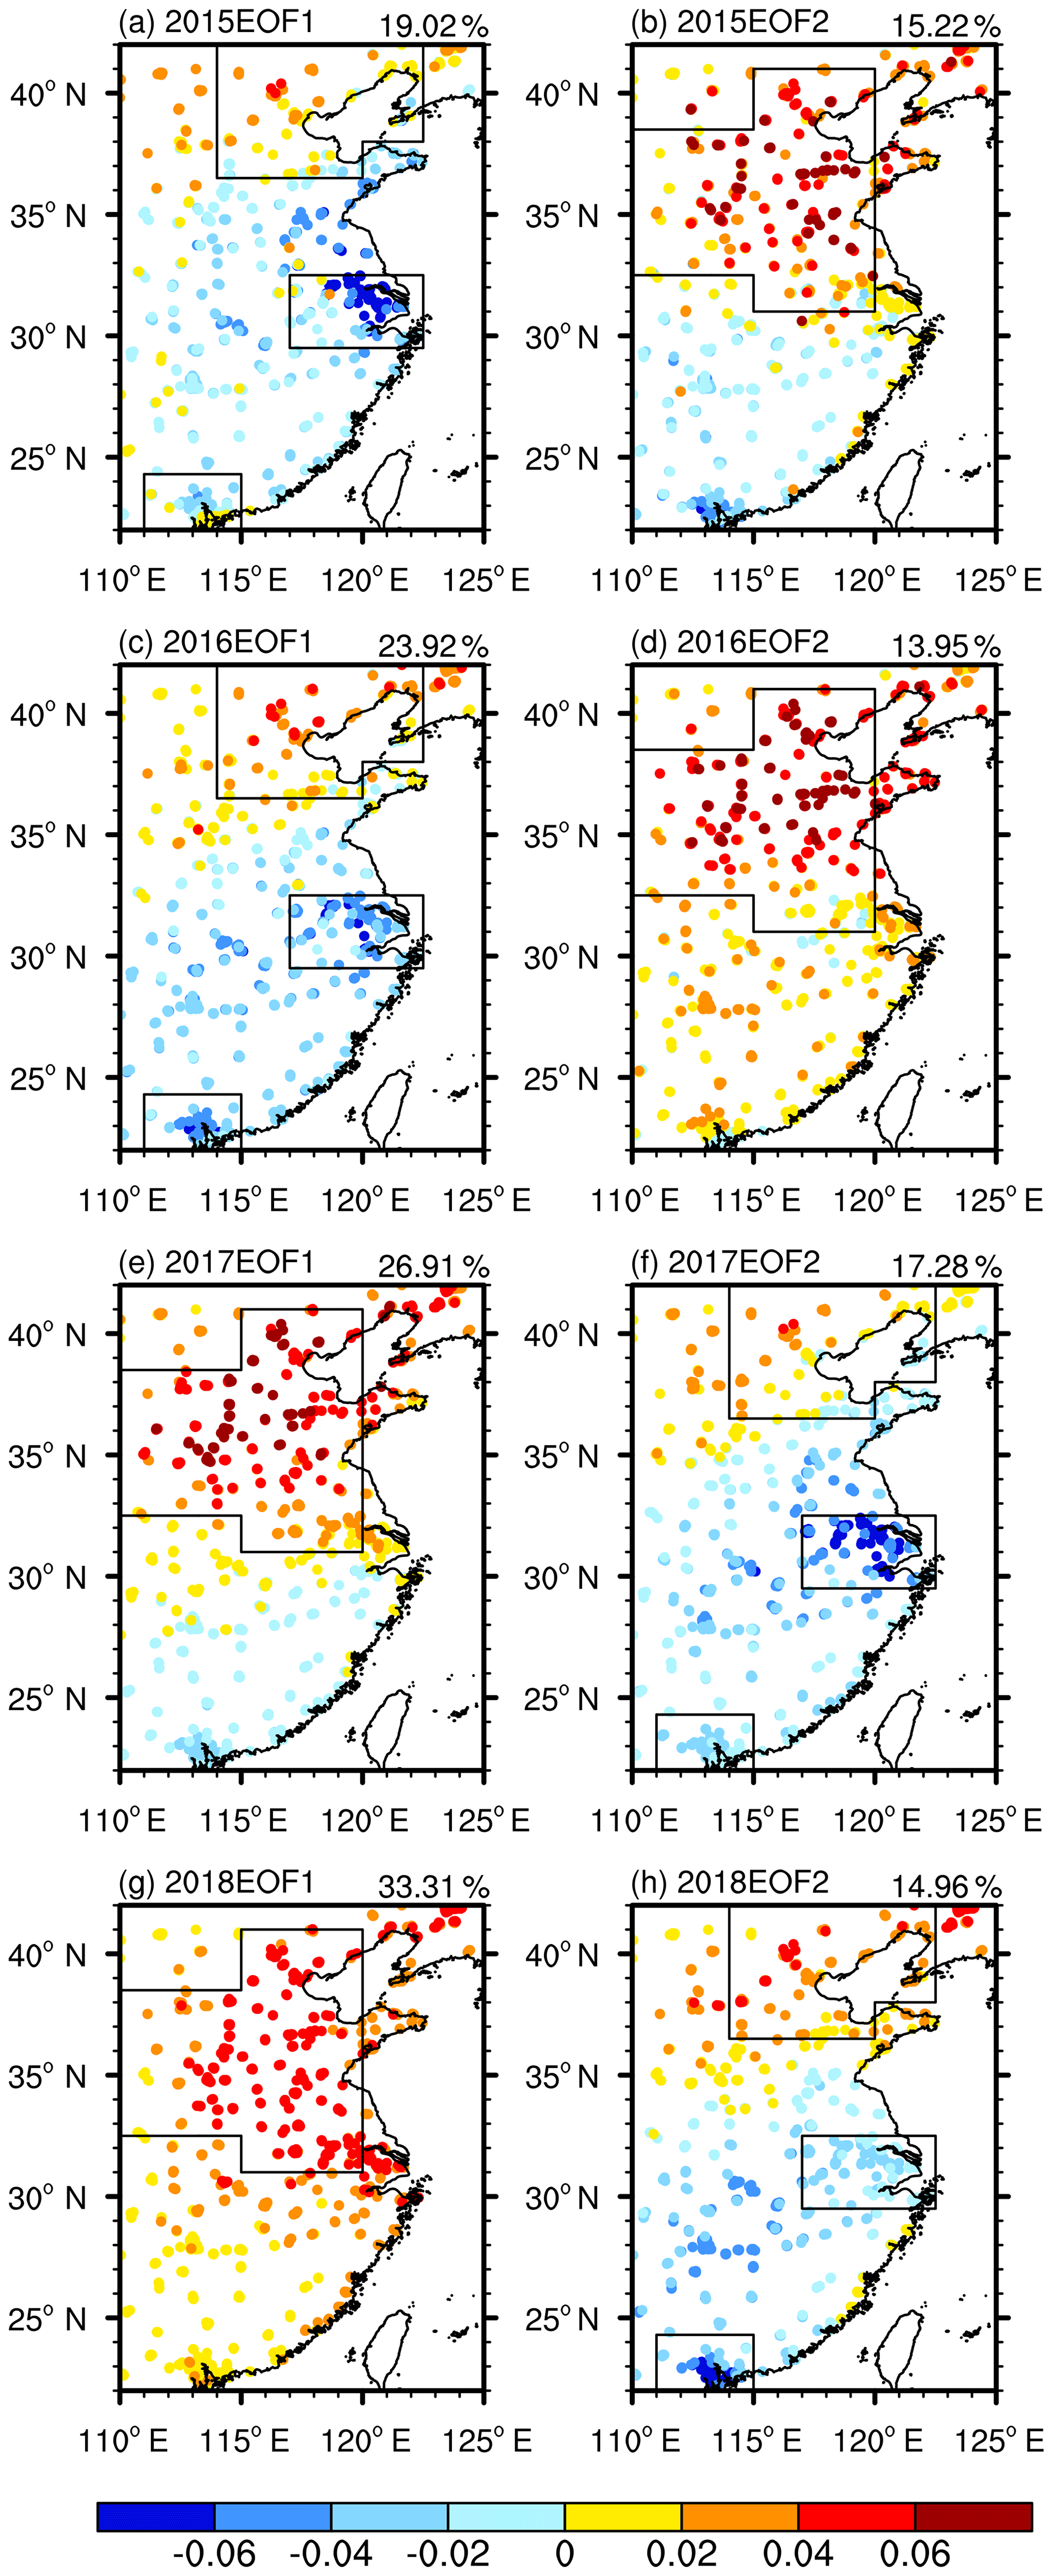
Figure 8The first (a, c, e, g) and second (b, d, f, h) EOF spatial patterns of MDA8 in summer in 2015 (a, b), 2016 (c, d), 2017, (e, f) and 2018 (g, h). The percentage number in panels (a, c, e, g) and (b, d, f, h) are the variance contributions of the first and second EOF mode; the black boxes in panels (a, c, f, h) indicate the location of NCH, YRD and PRD, respectively.The black boxes in panel (b, d, e, g) indicated the location of NH.
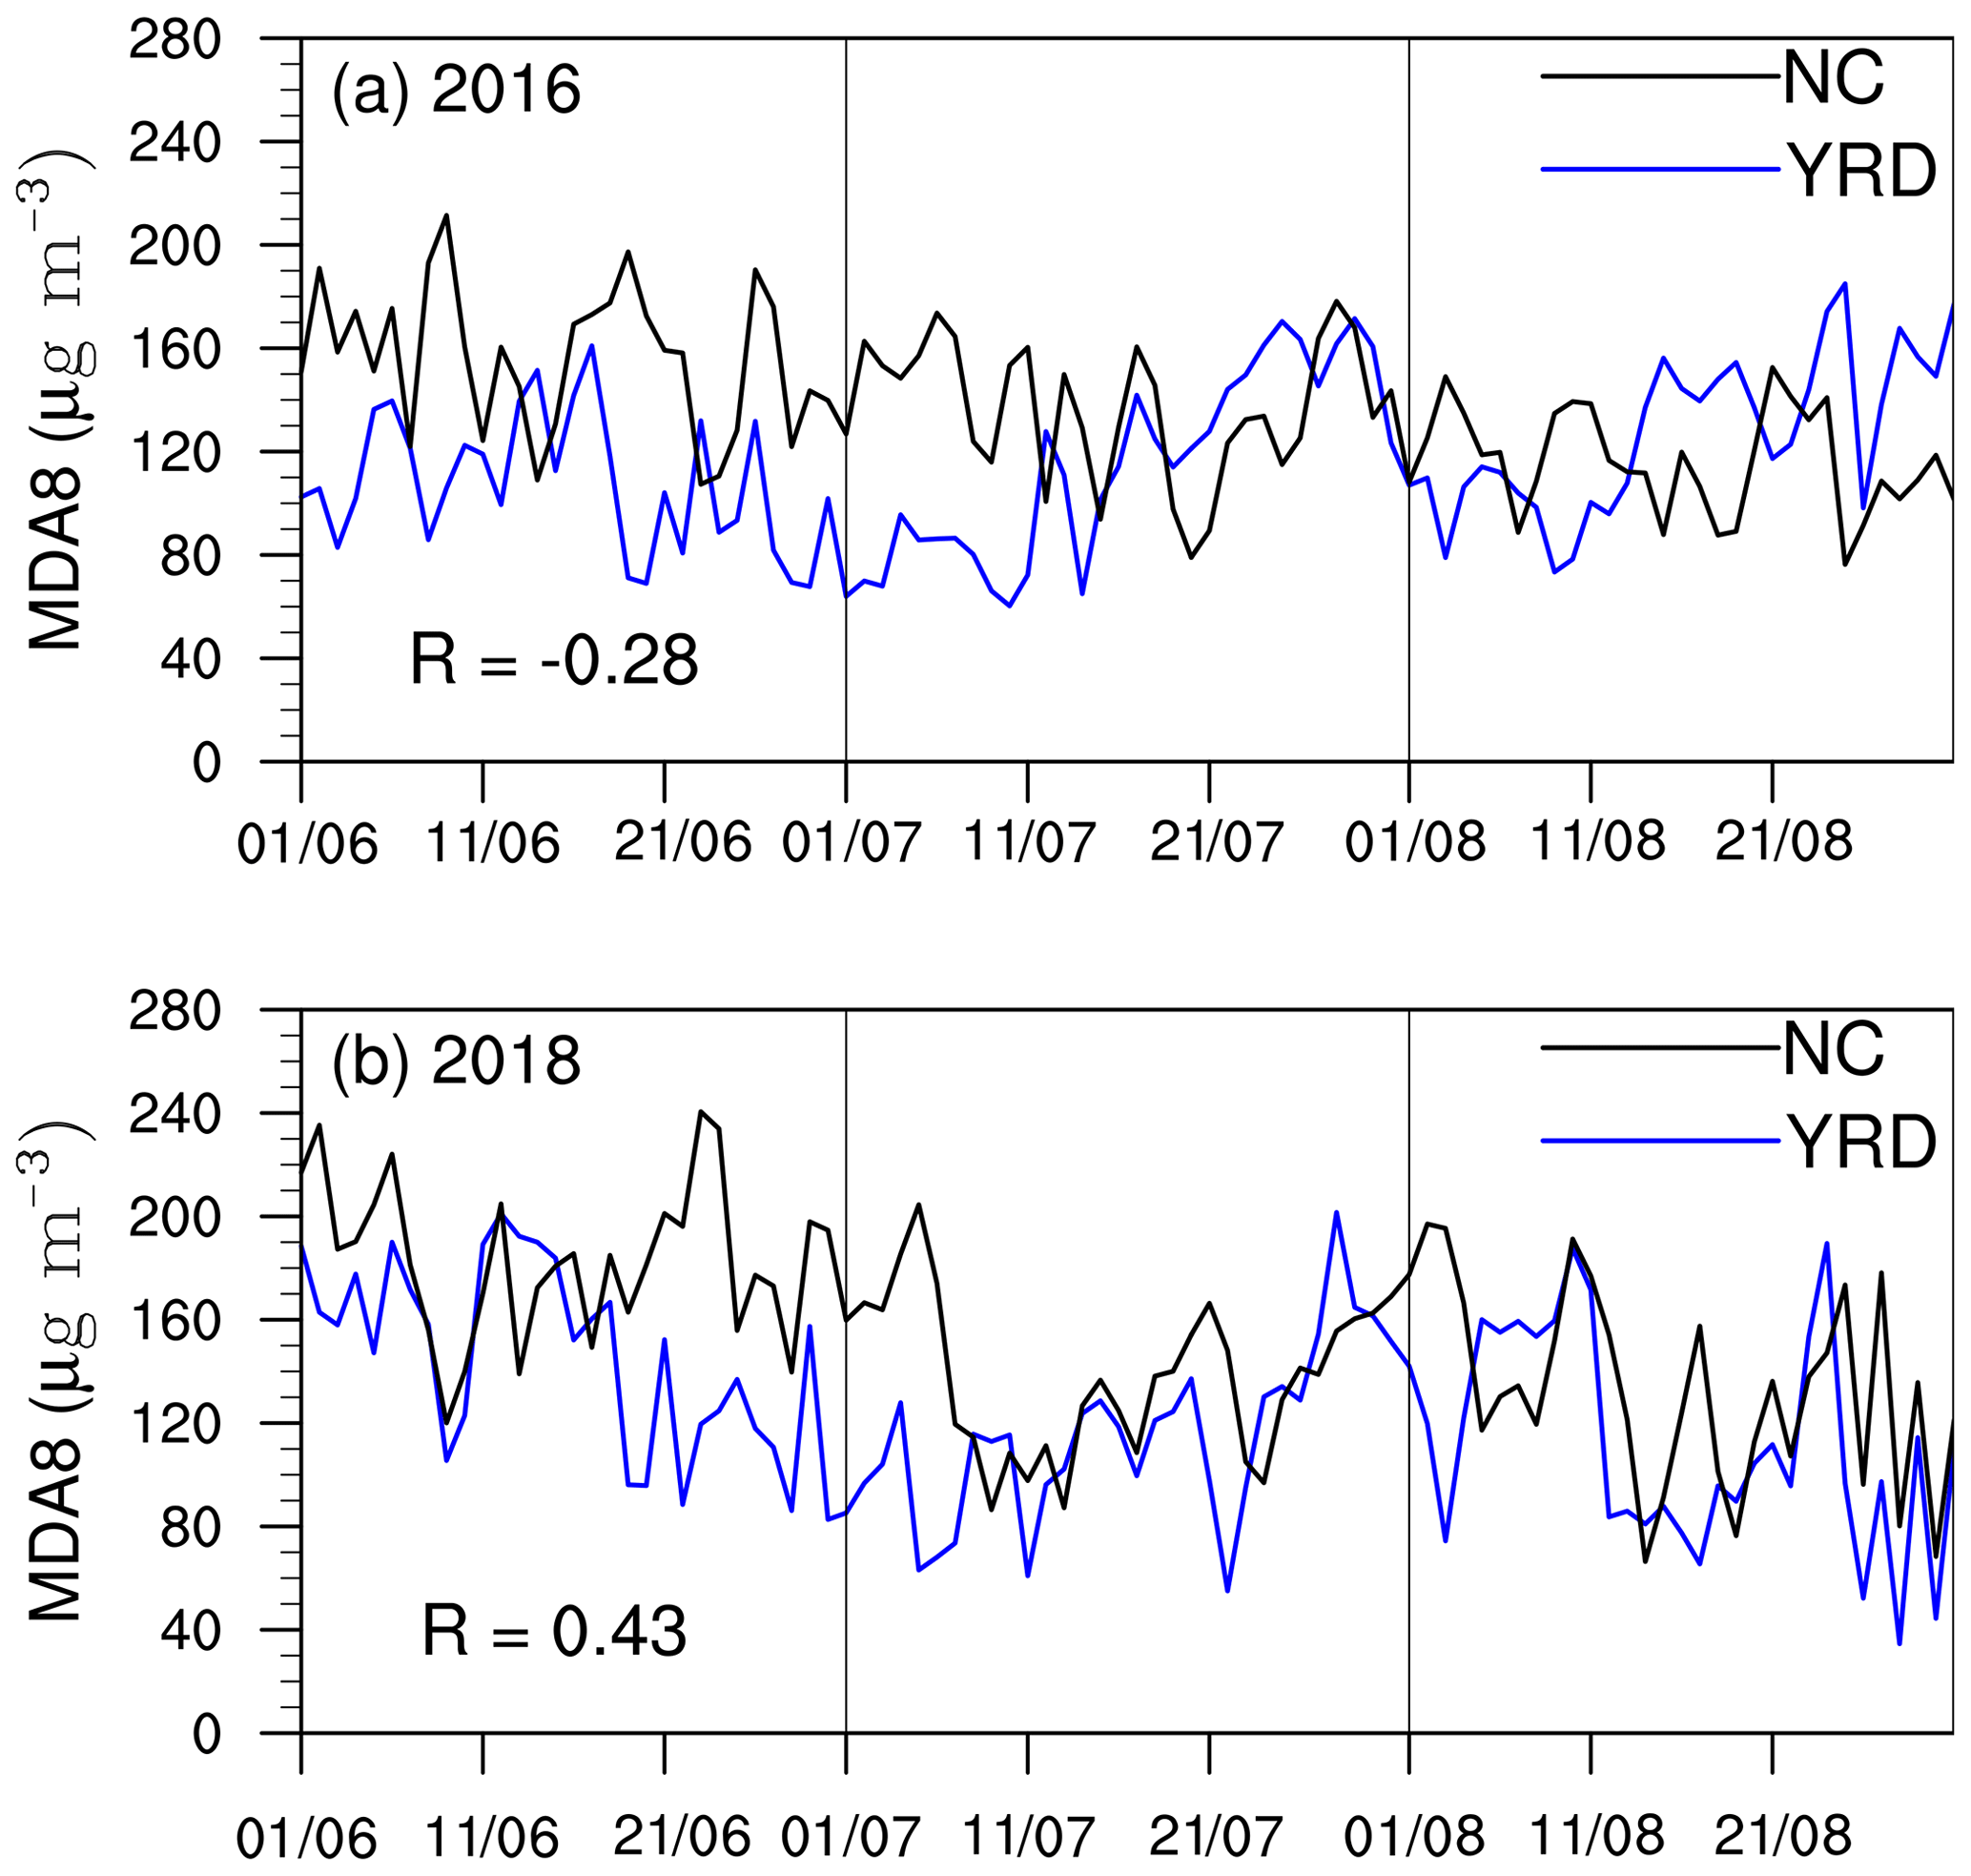
Figure 9Variations in the MDA8 (unit: µg m−3) of NC (black) and the YRD (blue) in 2016 (a) and 2018 (b). The MDA8 was calculated as an average for all available sites in the NC and YRD regions.
In eastern China, despite economic production and human activity steadily increasing over the 4 years of study, we assume the emissions of ozone precursors to be relatively stable on a daily timescale. In contrast, the daily variations in MDA8 evidently can be seen in Fig. 3. Therefore, the impacts of daily meteorological conditions significantly contributed to the domain patterns of daily O3 concentrations and their variations. Anomalous daytime atmospheric circulations associated with PAT1 (PAT1P composite minus PAT1N composite) and PAT2 (PAT2P composite minus PAT2N composite) are shown Figs. 6 and 7. For the first pattern, the largest O3 differences between the PAT1P and PAT1N were within the NCH region (Fig. 5a, b). The correlation coefficient between the time series of PAT1 and the NCH-averaged MDA8 was 0.97 (Table 1). Thus, the effects of the anomalous atmospheric circulations mainly acted on the photochemical reactions near the surface in NCH and the removal of pollutants. As can be seen in Fig. 6a, there were negative Z850 anomalies over the Ural Mountains. Over the broad region from eastern Eurasia to the northern Pacific, the anomalous atmospheric circulations were located zonally, i.e., positive Z850 in the tropical zone, cyclonic anomalies at the middle to high latitudes and positive anomalies in the polar region (Fig. 6a). The East Asian deep trough was enhanced and extended to northeastern China and Japan. The intensity of the East Asian deep trough (i.e., the negative area-averaged Z850) positively correlated with the time series of PAT1 (EAT, Table 1), with a correlation coefficient of 0.28 (above the 99 % confidence level). In accordance with the deep positive height anomalies to the north of Lake Baikal (centering at 53.5∘ N, 107∘ E), which also extended southward to the edge of the Tibetan Plateau (Fig. 6a), cold air was transported to the lower latitudes. However, local anticyclonic circulation over NCH prevented the cold air from arriving in the NCH region (Fig. 6b).
Table 1Correlation coefficients between the time series of PAT1 (PAT2) and the key indices of atmospheric circulations and meteorological conditions. “” indicates that the correlation coefficients were above the 99 % confidence level.
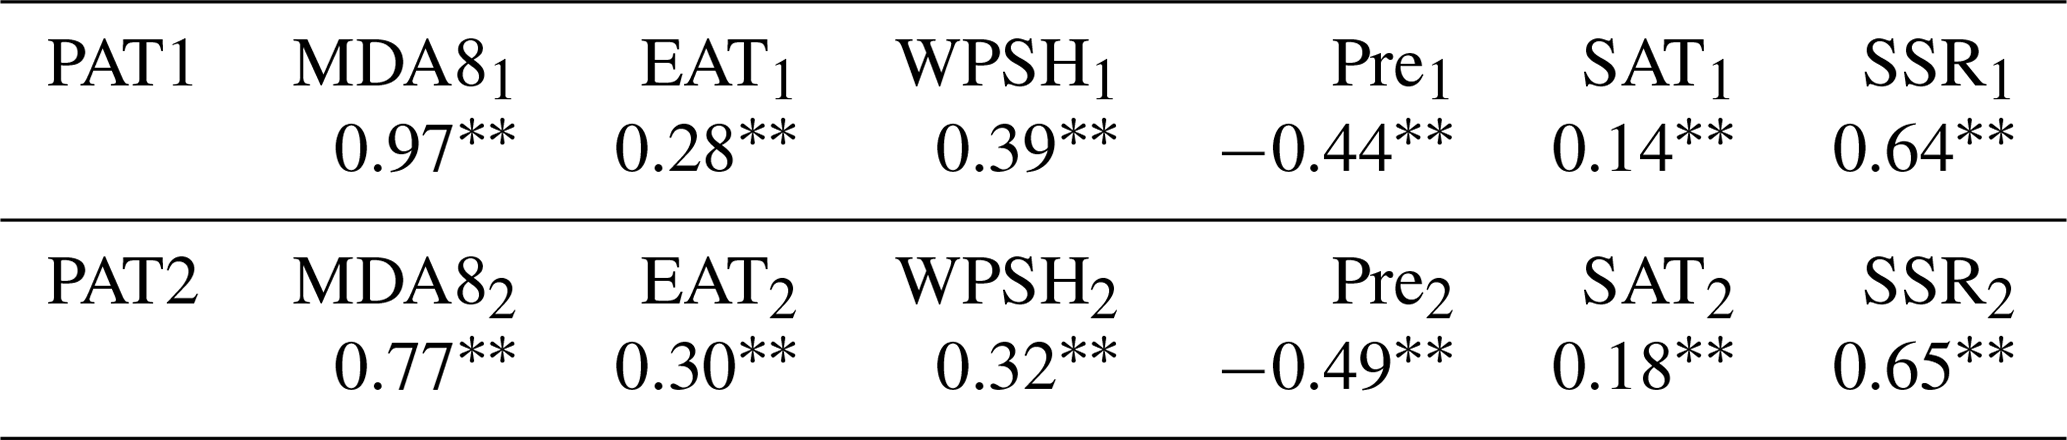
MDA81 is the NCH area-averaged MDA8, while the MDA82 is the MDA8 difference between NC and YRD. EAT1 and EAT2 indicate the intensity of the East Asian deep trough and were calculated as the mean −Z850 shown in the black boxes in Figs. 5 and 6, respectively. WPSH1 () and WPSH2 () represent the location of WPSH. Pre1, SAT1 and SSR1 were calculated as the NCH area-averaged precipitation, SAT and downward solar radiation at the surface, respectively. Pre2, SAT2 and SSR2 are the differences in the NC and YRD area-averaged precipitation, SAT and downward solar radiation at the surface, respectively.
Influenced by the enhanced East Asian deep trough, the main body of WPSH shifted southward (compared to its climate status in summer). The location of WPSH () also showed a positive correlation with the time series of PAT1 (R=0.39, Table 1). However, the western ridge point of WPSH was more northward and westward than normal (being indicated by ) and occupied the NCH area, which was significant with the time series of PAT1 (R=0.24, above the 99 % confidence level). Although the local anomalous anticyclone over the east of China seemingly delivered water vapor to North China (Fig. 6b), the channel of moisture was already cut off in the ocean at low latitudes by the positive and zonal anomalies in the tropical regions (Fig. 6a) and resulted in a dry environment in NCH from the surface to 400 hPa (Fig. 6c). Furthermore, the associated descending motions (Fig. 6c) not only corresponded to the warmer surface air temperature (Fig. 6a) but also suppressed the development of convective activity (indicated by less low and medium cloud, Fig. 6d). The correlation coefficients between the time series of PAT1 and NCH-averaged precipitation, SAT, and downward solar radiation at the surface were −0.44, 0.14 and 0.45, respectively, all of which exceeded the 99 % significance test (Table 1). The large-scale atmospheric circulations led to days with high temperatures near the surface (Fig. 6a), less precipitation (Fig. 6b), a dry environment (Fig. 6c) and intense solar radiation (Fig. 6d), which substantially enhanced the generation of ozone in NCH but weakened the removal of the pollutants.
For PAT2, the largest O3 differences (PAT2P composite minus PAT2N composite) were observed in the NC and YRD regions (Figs. 4c, 5c, d). The correlation coefficient between the time series of PAT2 and the MDA8 difference between NC and the YRD was 0.77 (Table 1). The impacts of atmospheric circulations on the photochemical reactions and removal effects in the above two areas are analyzed in Fig. 7. It is notable that the signals of atmospheric circulations were clearer in the lower troposphere (i.e., 850 hPa) for PAT1 (Fig. 6a); however, the signals for PAT2 could be recognized both in the lower troposphere and mid-troposphere (Fig. 7a). Due to the broad positive Z500 anomalies at high latitudes in Eurasia, the subjacent surface air temperatures significantly increased, indicating weak cold air advection from the north (Fig. 7a). Moreover, there were positive Z500 anomalies from the Chukchi Peninsula (centering at about at 66.5∘ N, 180∘ E) to northeastern China. In summer, anomalous anticyclonic circulations at the middle and high latitudes generally led to significantly positive SAT anomalies (Fig. 7a). The East Asian deep trough was stronger (R=0.3) but was limited to the Sea of Japan.
Extruded by the East Asian deep trough and cyclonic anomalies from the Siberian plains to the YRD, the WPSH moved southward and exhibited southwest–northeast orientation (Fig. 7a). The location of WPSH () was positively correlated with the time series of PAT2 (R=0.32, Table 1). The southwest–northeast distribution of WPSH aided water vapor transportation to the YRD region (Fig. 7b–c). Combined with significant upward air flow (Fig. 7c), more clouds formed at the medium and low levels (Fig. 7d), and precipitation was enhanced in the YRD region (Fig. 7b). A moist, cool environment, weak solar radiation and wet deposition reduced the ozone concentration in the YRD region. On the other hand, a sinking motion (Fig. 7c) and less cold air advection from the north (Fig. 7a) both resulted in a temperature increase in NC (Fig. 7a). There was divergence of water vapor and lower cloud cover over NC, resulting in dry, hot and sunny weather (Fig. 7b, d). Under such meteorological conditions, the generation of surface O3 was accelerated but the removal processes were slowed down, and thus higher MDA8 was observed in NC. The differences in precipitation, SAT and downward solar radiation at the surface between the NC and YRD regions were calculated and their correlation coefficients with the time series of PAT2 were −0.46, 0.18 and 0.62, respectively (Table 1). The significant correlations indicated that the differences in meteorological conditions between NC and YRD regions, associated with the aforementioned anomalous atmospheric circulations, largely contributed to O3 PAT2.
At present, the fine particulate matter decreased in the summers in eastern China, and ground-level ozone pollution became the major air challenge in the summers in the east of China (Li et al., 2018). The highest O3 concentrations were observed in North China and in the Huanghuai region, which are located north of 32∘N. The O3-contaminated air occurred for 85 % of summer days in Beijing and Tianjin. In the south, the surface O3 pollution was also severe, both in the Yangtze River and Pearl River delta regions. Meteorological conditions had significant impacts on the evident daily fluctuation of MDA8. To reveal their detailed relationships, the dominant patterns of summer ozone pollution and associated atmospheric circulations were analyzed in this study.
The MDA8 of the first prominent pattern changed synergistically in the east of China, especially in North China and the Huanghuai region. An enhanced East Asian deep trough and western Pacific subtropical high were zonally distributed and prevented the northward transportation of moisture. The northward-shifted western ridge point of the western Pacific subtropical high accelerated the photochemical reactions via hot, dry air and intense solar radiation but weakened the removal of pollutants. The second pattern of ozone pollution showed remarkable south–north differences. Broad positive geopotential height anomalies at high latitudes significantly decreased cold air advection from the north and thus increased the surface air temperature. These positive anomalies also extended to North China and resulted in locally warmer air near the surface. On the other hand, the southwest–northeast oriented western Pacific subtropical high transported sufficient water vapor to the Yangtze River Delta. Consequently, a local moist, cool environment without intense sunlight reduced the formation of surface ozone.
In addition to evident interannual differences of MDA8 anomalies (Fig. 2), the dominant spatial patterns of MDA8 anomalies in each year were also different (Fig. 8). Although the relative variance contributions of the spatial coefficients varied, the first two EOF patterns of MDA8 were always PAT1 and PAT2 in different years, indicating that the extracted dominant patterns were reliable and steady. Sorting by the variance contribution, the dominant patterns were PAT2 and PAT1 in 2015 and 2016 (Fig. 8a–d); however, they are PAT1 and PAT2 in the two subsequent years (Fig. 8e–h). The first EOF pattern in 2014 revealed by Zhao and Wang (2017) was similar to PAT2; however, the most dominant pattern changed to PAT1 in the last 2 years of the study (2017 and 2018). In 2016 and 2018, the variance contribution of the first pattern was almost twice that of the second pattern. The dominant pattern of 2016 was PAT2 (explaining approximately 24 % of the variance, Fig. 8c), while in 2018 this changed to PAT1, with nearly 34 % variance contributions (Fig. 8g). In 2016, the MDA8 values in NC and the YRD were nearly out of phase (Fig. 9a) and the correlation coefficient between them was −0.28 (above the 99 % confidence level). In contrast, this correlation coefficient was 0.43 in 2018 (Fig. 9b), indicating similar change features between the MDA8 levels of NC and the YRD. The dominant patterns of ozone concentrations were decomposed with the observed data from 2015 to 2018. With the increase in O3 observations, increasingly reliable dominant patterns and the reasons for the variation in dominant patterns might be revealed in the future.
In this study, we mainly emphasized the contribution of the meteorological impacts and assumed the emissions of ozone precursors were relatively stable on a daily timescale. Observational and modeling studies suggested that photochemical production of ozone in the NC, YRD and PRD regions was a transitional regime (i.e., both reductions of NOx and VOC would reduce O3), which would influence the concentrations of surface ozone (Jin and Holloway, 2015). There is no doubt that human activity was the fundamental driver of air pollution, even on a daily timescale, thus the joint effects of the daily meteorological conditions and anthropogenic emissions (including the photochemical regimes) needed to be discussed in future work. Lu et al. (2019) found that the observed 2017 surface ozone increases relative to 2016 in China are largely due to hotter and drier weather conditions, while changes in domestic anthropogenic emissions alone would have led to ozone decreases in 2017 basing on their GEOS-Chem experiments. The simultaneous large-scale atmospheric circulations on an interannual scale and their possible preceding climate drivers, e.g., sea ice and sea surface temperature, are still unclear. Research related to climate variability has always needed long-term data. To get around the problem of the data time span, Yin et al. (2019) developed an ozone weather index using data from 1979 to 2017 and demonstrated the contributions of Arctic sea ice in May to O3 pollution in North China. According to the results, attention to surface pollution should be strengthened and the weather and climate component should be taken into account when making decisions about control measures.
Hourly O3 concentration data are supported by the website: http://beijingair.sinaapp.com, last access: 24 February 2019 (Ministry of Environmental Protection of China, 2018). Atmospheric circulation datasets are downloaded from http://www.ecmwf.int/en/research/climate-reanalysis/era-interim (ERA-Interim, 2019).
The supplement related to this article is available online at: https://doi.org/10.5194/acp-19-13933-2019-supplement.
ZY and HW designed the research. BC and ZY plotted most of the figures and analysis. ZY prepared the paper with contributions from all co-authors.
The authors declare that they have no conflict of interest.
This research has been supported by the National Natural Science Foundation of China (grant nos. 41421004, 91744311 and 41705058), and the funding of the Jiangsu Innovation and Entrepreneurship team.
This paper was edited by Bryan N. Duncan and reviewed by two anonymous referees.
Day, D. B., Xiang, J. B., Mo, J. H., Li, F., Chung, M., Gong, J. C., Weschler, C. J., Ohman-Strickland, P. A., Sundell, J., Weng, W. G., Zhang, Y. P., and Zhang J.: Association of Ozone Exposure with Cardiorespiratory Pathophysiologic Mechanisms in Healthy Adults, JAMA Intern. Med., 177, 1344–1353, https://doi.org/10.1001/jamainternmed.2017.2842, 2017.
Dee, D. P., Uppala, S. M., Simmons, A. J., Berrisford, P., Poli, P., Kobayashi, S., Andrae, U., Balmaseda, M. A., Balsamo, G., Bauer, P., Bechtold, P., and Beljaars, A. C. M.: The ERAInterim reanalysis: configuration and performance of the data assimilation system, Q. J. Roy. Meteor. Soc., 137, 553–597, https://doi.org/10.1002/qj.828, 2011.
Ding, A. J., Fu, C. B., Yang, X. Q., Sun, J. N., Zheng, L. F., Xie, Y. N., Herrmann, E., Nie, W., Petäjä, T., Kerminen, V. M., and Kulmala, M.: Ozone and fine particle in the western Yangtze River Delta: an overview of 1 yr data at the SORPES station, Atmos. Chem. Phys., 13, 5813–5830, https://doi.org/10.5194/acp-13-5813-2013, 2013.
Ding, A. J., Wang, T., Zhao, M., Wang, T. J., and Li, Z. K.: Simulation of sea-land breezes and a discussion of their implications on the transport of air pollution during a multi-day ozone episode in the Pearl River Delta of China, Atmos. Environ., 38, 6737–6750, 2004.
Doherty, R. M., Wild, O., Shindell, D. T., Zeng, G., MacKenzie, I. A., Collins, W. J., Fiore, A. M., Stevenson, D. S., Dentener, F. J., Schults, M. G., Hess, P., Derwent, R. G., and Keating, T. J.: Impacts of climate change on surface ozone and intercontinental ozone pollution: A multi-model study, J. Geophys. Res.-Atmos., 118, 3744–3763, https://doi.org/10.1002/jgrd.50266, 2013.
ERA-Interim: Reanalysis data, available at: http://www.ecmwf.int/en/research/climate-reanalysis/era-interim, last access date: 27 January 2019.
Fu, J. S., Dong, X., Gao, Y., Wong, D. C., and Lam, Y. F.: Sensitivity and linearity analysis of ozone in East Asia: the effects of domestic emission and intercontinental transport, J. Air Waste Manage., 62, 1102–1114, 2012
Gao, W., Tie, X. X., Xu, J. M., Huang, R. J., Mao, X. Q., Zhou, G. Q., and Chang, L. Y.: Long-term trend of O3 in a mega City (Shanghai), China: Characteristics, causes, and interactions with precursors, Sci. Total Environ., 603/604, 425–433, https://doi.org/10.1016/j.scitotenv.2017.06.099, 2017.
Jin, X. M. and Holloway, T.: Spatial and temporal variability of ozone sensitivity over China observed from the Ozone Monitoring Instrument, J. Geophys. Res.-Atmos., 120, 7229–7246, https://doi.org/10.1002/2015JD023250, 2015.
Li, J. F., Lu, K. D., Lv, W., Li, J., Zhong, L. J., Ou, Y. B., Chen, D. H., Huang, X., and Zhang, Y. H.: Fast increasing of surface ozone concentrations in Pearl River Delta characterized by a regional air quality monitoring network during 2006–2011, J. Environ. Sci., 26, 23–36, https://doi.org/10.1016/S1001-0742(13)60377-0, 2014.
Li, K., Jacob, D. J., Liao, H., Shen, L., Zhang, Q., and Bates, K. H.: Anthropogenic drivers of 2013–2017 trends in summer surface ozone in China, P. Natl. Acad. Sci. USA, 116, 422–427, https://doi.org/10.1073/pnas.1812168116, 2018.
Lin, M. Y., Fiore, A. M., Horowitz, L. W., Langford, A. O., Oltmans, S. J., Tarasick, D., and Rieder, H. E.: Climate variability modulates western US ozone air quality in spring via deep stratospheric intrusions, Nat. Commun., 6, 7105–7105, https://doi.org/10.1038/ncomms8105, 2015.
Lu, X., Hong, J. Y., Zhang, L., Cooper, O. R., Schultz, M. G., Xu, X. B., Wang, T., Gao, M., Zhao, Y. H., and Zhang, Y. H.: Severe surface ozone pollution in China: A global perspective, Environ. Sci. Technol. Lett., 5, 487–494, https://doi.org/10.1021/acs.estlett.8b00366, 2018.
Lu, X., Zhang, L., Chen, Y., Zhou, M., Zheng, B., Li, K., Liu, Y., Lin, J., Fu, T.-M., and Zhang, Q.: Exploring 2016–2017 surface ozone pollution over China: source contributions and meteorological influences, Atmos. Chem. Phys., 19, 8339–8361, https://doi.org/10.5194/acp-19-8339-2019, 2019.
Ma, Z. Q., Xu, J., Quan, W. J., Zhang, Z. Y., Lin, W. L., and Xu, X. B.: Significant increase of surface ozone at a rural site, north of eastern China, Atmos. Chem. Phys., 16, 3969–3977, https://doi.org/10.5194/acp-16-3969-2016, 2016.
North, G. R., Bell, T. L., Cahalan, R. F., and Moeng, F. J.: Sampling errors in the estimation of empirical orthogonal functions, Mon. Weather Rev., 110, 699–706, 1982
Pu, X., Wang, T. J., Huang, X., Melas, D., Zanis, P., Papanastasiou, D. K., and Poupkou, A.: Enhanced surface ozone during the heat wave of 2013 in yangtze river delta region, china, Sci. Total Environ., 603, 807–816, https://doi.org/10.1016/j.scitotenv.2017.03.056, 2017.
Shi, C. Z., Wang, S. S., Liu, R., Zhou, R., Li, D. H., Wang, W. X., Li, Z. Q., Cheng, T. T., and Zhou, B.: A study of aerosol optical properties during ozone pollution episodes in 2013 over Shanghai, China, Atmos. Res., 153, 235–249, https://doi.org/10.1016/j.atmosres.2014.09.002, 2015.
Sun, L., Xue, L. K., Wang, T., Gao, J., Ding, A. J., Cooper, O. R., Lin, M. Y., Xu, P. J., Wang, Z., Wang, X. F., Wen, L., Zhu, Y. H., Chen, T. S., Yang, L. X., Wang, Y., Chen, J. M., and Wang, W. X.: Significant increase of summertime ozone at Mount Tai in Central Eastern China, Atmos. Chem. Phys., 16, 10637–10650, https://doi.org/10.5194/acp-16-10637-2016, 2016.
The Ministry of Environmental Protection of China: Technical Regulation on Ambient Air Quality Index, China Environmental Science Press, China, available at: http://beijingair.sinaapp.com (last access: 24 February 2019), 2012.
Tong, L., Zhang, H. L., Yu, J., He, M. M., Xu, N. B., Zhang, J. J., Qian, F. Z., Feng, J. Y., and Xiao, H.: Characteristics of surface ozone and nitrogen oxides at urban, suburban and rural sites in Ningbo, China, Atmos. Res., 187, 57–68, https://doi.org/10.1016/j.atmosres.2016.12.006, 2017.
Wang, T., Ding, A., Gao, J., and Wu, W. S.: Strong ozone production in urban plumes from Beijing, China, Geophys. Res. Lett., 33, 320–337, https://doi.org/10.1029/2006GL027689, 2006.
Wang, T., Nie, W., Gao, J., and Xue, L. K.: Air quality during the 2008 Beijing Olympics: secondary pollutants and regional impact, Atmos. Chem. Phys., 10, 7603–7615, https://doi.org/10.5194/acp-10-7603-2010, 2010.
Wang, T., Xue, L. K., Brimblecombe, P., Lam, Y. F., Li, L., and Zhang, L.: Ozone pollution in China: A review of concentrations, meteorological influences, chemical precursors, and effects, Sci. Total Environ., 575, 1582–1596, https://doi.org/10.1016/j.scitotenv.2016.10.081, 2017.
Wang, Y. X., Shen, L. L., Wu, S. L., Mlckley, L., He, J. W., and Hao, J. M.: Sensitivity of surface ozone over China to 2000–2050 global changes of climate and emissions, Atmos. Environ., 75, 372–382, https://doi.org/10.1016/j.atmosenv.2013.04.045, 2013.
Wilks, D. S.: Statistical Methods in the Atmospheric Sciences, Academic press, 563–507, 2011.
Xiao, Z., Wang, Z., Pan, W., Wang, Y., and Yang, S.: Sensitivity of extreme temperature events to urbanization in the pearl river delta region, Asia-Pacific, J. Atmos. Sci., 55, 373–386, 2018.
Xu, Z., Huang, X., Nie, W., Chi, X., Xu, Z., Zheng, L., Sun, P., and Ding, A.: Influence of synoptic condition and holiday effects on vocs and ozone production in the Yangtze river delta region, china, Atmos. Environ., 168, 112–124, 2017
Yang, Y., Liao, H., and Li, J. P.: Impacts of the East Asian summer monsoon on interannual variations of summertime surface-layer ozone concentrations over China, Atmos. Chem. Phys., 14, 6867–6879, https://doi.org/10.5194/acp-14-6867-2014, 2014.
Yin, Z. C., Wang, H. J., and Guo, W. L.: Climatic change features of fog and haze in winter over North China and Huang-Huai Area, Sci. China. Earth. Sci., 58, 1370–1376, 2015.
Yin, Z. C., Wang, H. J., Li, Y. Y., Ma, X. H., and Zhang, X. Y.: Links of Climate Variability among Arctic sea ice, Eurasia teleconnection pattern and summer surface ozone pollution in North China, Atmos. Chem. Phys., 19, 3857–3871, https://doi.org/10.5194/acp-19-3857-2019, 2019.
Yue, X., Unger, N., Harper, K., Xia, X., Liao, H., Zhu, T., Xiao, J., Feng, Z., and Li, J.: Ozone and haze pollution weakens net primary productivity in China, Atmos. Chem. Phys., 17, 6073–6089, https://doi.org/10.5194/acp-17-6073-2017, 2017.
Zhao, Z. J. and Wang, Y. X.: Influence of the west pacific subtropical high on surface ozone daily variability in summertime over eastern china, Atmos. Environ., 170, 197–204, https://doi.org/10.1016/j.atmosenv.2017.09.024, 2017.