the Creative Commons Attribution 4.0 License.
the Creative Commons Attribution 4.0 License.
 | 01 Feb 2019
Open fires in Greenland in summer 2017: transport, deposition and radiative effects of BC, OC and BrC emissions
Nikolaos Evangeliou
Arve Kylling
Sabine Eckhardt
Viktor Myroniuk
Kerstin Stebel
Ronan Paugam
Sergiy Zibtsev
Andreas Stohl
Highly unusual open fires burned in western Greenland between 31 July and 21 August 2017, after a period of warm, dry and sunny weather. The fires burned on peatlands that became vulnerable to fires by permafrost thawing. We used several satellite data sets to estimate that the total area burned was about 2345 ha. Based on assumptions of typical burn depths and emission factors for peat fires, we estimate that the fires consumed a fuel amount of about 117 kt C and emitted about 23.5 t of black carbon (BC) and 731 t of organic carbon (OC), including 141 t of brown carbon (BrC). We used a Lagrangian particle dispersion model to simulate the atmospheric transport and deposition of these species. We find that the smoke plumes were often pushed towards the Greenland ice sheet by westerly winds, and thus a large fraction of the emissions (30 %) was deposited on snow- or ice-covered surfaces. The calculated deposition was small compared to the deposition from global sources, but not entirely negligible. Analysis of aerosol optical depth data from three sites in western Greenland in August 2017 showed strong influence of forest fire plumes from Canada, but little impact of the Greenland fires. Nevertheless, CALIOP (Cloud-Aerosol Lidar with Orthogonal Polarization) lidar data showed that our model captured the presence and structure of the plume from the Greenland fires. The albedo changes and instantaneous surface radiative forcing in Greenland due to the fire emissions were estimated with the SNICAR model and the uvspec model from the libRadtran radiative transfer software package. We estimate that the maximum albedo change due to the BC and BrC deposition was about 0.007, too small to be measured. The average instantaneous surface radiative forcing over Greenland at noon on 31 August was 0.03–0.04 W m−2, with locally occurring maxima of 0.63–0.77 W m−2 (depending on the studied scenario). The average value is up to an order of magnitude smaller than the radiative forcing from other sources. Overall, the fires burning in Greenland in the summer of 2017 had little impact on the Greenland ice sheet, causing a small extra radiative forcing. This was due to the – in a global context – still rather small size of the fires. However, the very large fraction of the emissions deposited on the Greenland ice sheet from these fires could contribute to accelerated melting of the Greenland ice sheet if these fires become several orders of magnitude larger under future climate.
- Article
(5700 KB) - Full-text XML
-
Supplement
(39255 KB) - BibTeX
- EndNote


In August 2017 public media reported unprecedented fire events in western Greenland (BBC News, 2017; New Scientist Magazine, 2017). These events were documented with airborne photographs (SERMITSIAQ, 2017) and satellite images (NASA, 2017b) and raised public concerns about the effects of climate change and possible impacts of soot emissions on ice melting. Historically, wildfires have occurred infrequently on Greenland, because three-quarters of the island is covered by a permanent ice sheet and permafrost is found on most of the ice-free land (Abdalati and Steffen, 2001). Permafrost, or permanently frozen soil, lies under an “active” soil layer several meters thick that thaws seasonally. But in certain areas, where the permafrost layer starts melting, it can expose peat, a material consisting of only partially decomposed vegetation that forms in wetlands over the course of hundreds of years or longer. Peatlands, also known as bogs and moors, are the earliest stage in the formation of coal. Globally, the amount of carbon stored in peat exceeds that stored in vegetation and is similar in size to the current atmospheric carbon pool (Turetsky et al., 2014). When peatlands dry, they are often affected by fires burning into the peat layers. Peat fires are difficult to extinguish and they often burn until all the organic matter is consumed. Smoldering peat fires already are the largest fires on Earth in terms of their carbon footprint (Turetsky et al., 2014). For Greenland, it has been suggested that degradation of peat will accelerate towards 2080 (Daanen et al., 2011) and that the area affected by the fires in August 2017 is particularly vulnerable to permafrost thawing (Daanen et al., 2011).
Fires in the high northern latitudes release significant amounts of CO2, CH4, N2O, black carbon (BC) and organic carbon (OC), and their emissions are often transported into Arctic regions (Cofer III et al., 1991; Hao et al., 2016; Hao and Ward, 1993; Shi et al., 2015). While BC is the most strongly light-absorbing component of the atmospheric aerosol (Bond et al., 2013), a portion of OC compounds has shown strong absorption towards shorter wavelengths of the electromagnetic spectrum (UV), therefore defined as brown carbon (BrC) (Andreae and Gelencsér, 2006; Chakrabarty et al., 2010). BC is formed by the incomplete combustion of fossil fuels, biofuels and biomass (Bond et al., 2013). BrC is emitted from smoldering fires or solid fuel combustion (Bond, 2001), from pyrolysis of biomass (Mukai and Ambe, 1986) and from biogenic emissions of humic substances (Limbeck et al., 2003). Due to their particulate nature, both BC and OC are important for human health (Lelieveld et al., 2015) and climate impacts (Myhre et al., 2013). BC has an atmospheric lifetime of 3–11 days (Bond et al., 2013), while BrC lifetimes are estimated at 5–7 days (Jo et al., 2016), thus facilitating transport over long distances (Forster et al., 2001; Stohl et al., 2006). BC, OC and BrC from midlatitude sources can thus reach remote areas such as the Arctic. They absorb solar radiation in the atmosphere (Feng et al., 2013; Hansen and Nazarenko, 2004), have a significant impact on cloud formation, decrease surface albedo when deposited on ice and snow and can accelerate melting processes (Hansen and Nazarenko, 2004; Wu et al., 2016). This raises particular concerns about the effect of fires burning in the immediate vicinity of the Greenland ice sheet. If a large fraction of the BC emitted by such fires is deposited on the ice, these fires may be extremely effective in further enhancing the already accelerating melting of the Greenland ice sheet (AMAP, 2017). BC, OC and BrC emissions from such high-latitude fires may also have a substantial effect on the albedo of sea ice.
Here we study transport and deposition of BC, OC and BrC over the Greenland ice sheet from the fires that occurred in western Greenland in August 2017, which likely represent the largest fires that have occurred on Greenland in modern times (Fig. S1 in the Supplement). Since the fires occurred in an area entirely lacking ground-based observations, we use satellite data and a Lagrangian atmospheric dispersion model for our study. Finally, we evaluate the changes in the albedo of the Greenland ice sheet from the respective deposition of BC and BrC and present instantaneous radiative forcing calculations for these two atmospheric constituents released from the 2007 fires in Greenland.
2.1 Definition of burned area
Remote sensing has been useful for delineating fire perimeters, characterizing burn severity and planning post-fire restoration activities in different regions. The use of satellite imaging is particularly important for fire monitoring in remote areas due to difficult ground access. The method that is presented in this section has been already used to calculate burned area in the highly contaminated radioactive forests of Chernobyl (Evangeliou et al., 2014, 2015, 2016). Coordinates of fire locations (hot spots) were downloaded from FIRMS (Fire Information for Resource Management System; NASA, 2017a). For the mapping of the burned area, Sentinel-2A images were used. To delineate fire perimeters and define burn severity precisely, we used Landsat 8 Operational Land Imager (OLI) (resolution: 30 m × 30 m) together with Sentinel-1A (resolution: 30 m × 30 m) and Sentinel-2A images (resolution: 30 m × 30 m) (see Table 1) by applying the differenced normalized burn ratio (dNBR) (Key and Benson, 2006):
Normalized burn ratios for pre-fire (NBRpre-fire) and post-fire (NBRpost-fire) images from Sentinel-2A can be calculated using radiances for near-infrared and shortwave infrared bands (bands 8 (NIR) and 12 (SWIR2) at 0.835 and 2.202 µm, respectively):
The methodology of applying a dNBR index to assess the impact of fires has been used in forests of the northern and western United States (French et al., 2008; Key and Benson, 2006) and elsewhere (Escuin et al., 2008; Sunderman and Weisberg, 2011). The burned severity mosaics were created using Sentinel-2A images corrected for atmospheric scattering (see Chavez, 1988). Pre- and post-fire images were used to create cloudless mosaics for the area where the Greenland fires burned. A maximum value composite procedure (Holben, 1986) was used to select pixels from each band that were not cloud covered and have a high value of normalized difference vegetation index. To avoid spurious burn severity values, manually delineated fire perimeters were applied and all areas outside were classified as unburned. We have used common dNBR severity levels (Key and Benson, 2006) that are presented in Fig. 1. The occasionally dense cloud cover was the main obstacle in reconstructing fire dynamics. As an independent source of information, active fires from MODIS satellite product MCD14DL (Giglio et al., 2003) are plotted in Supplement Fig. S2.
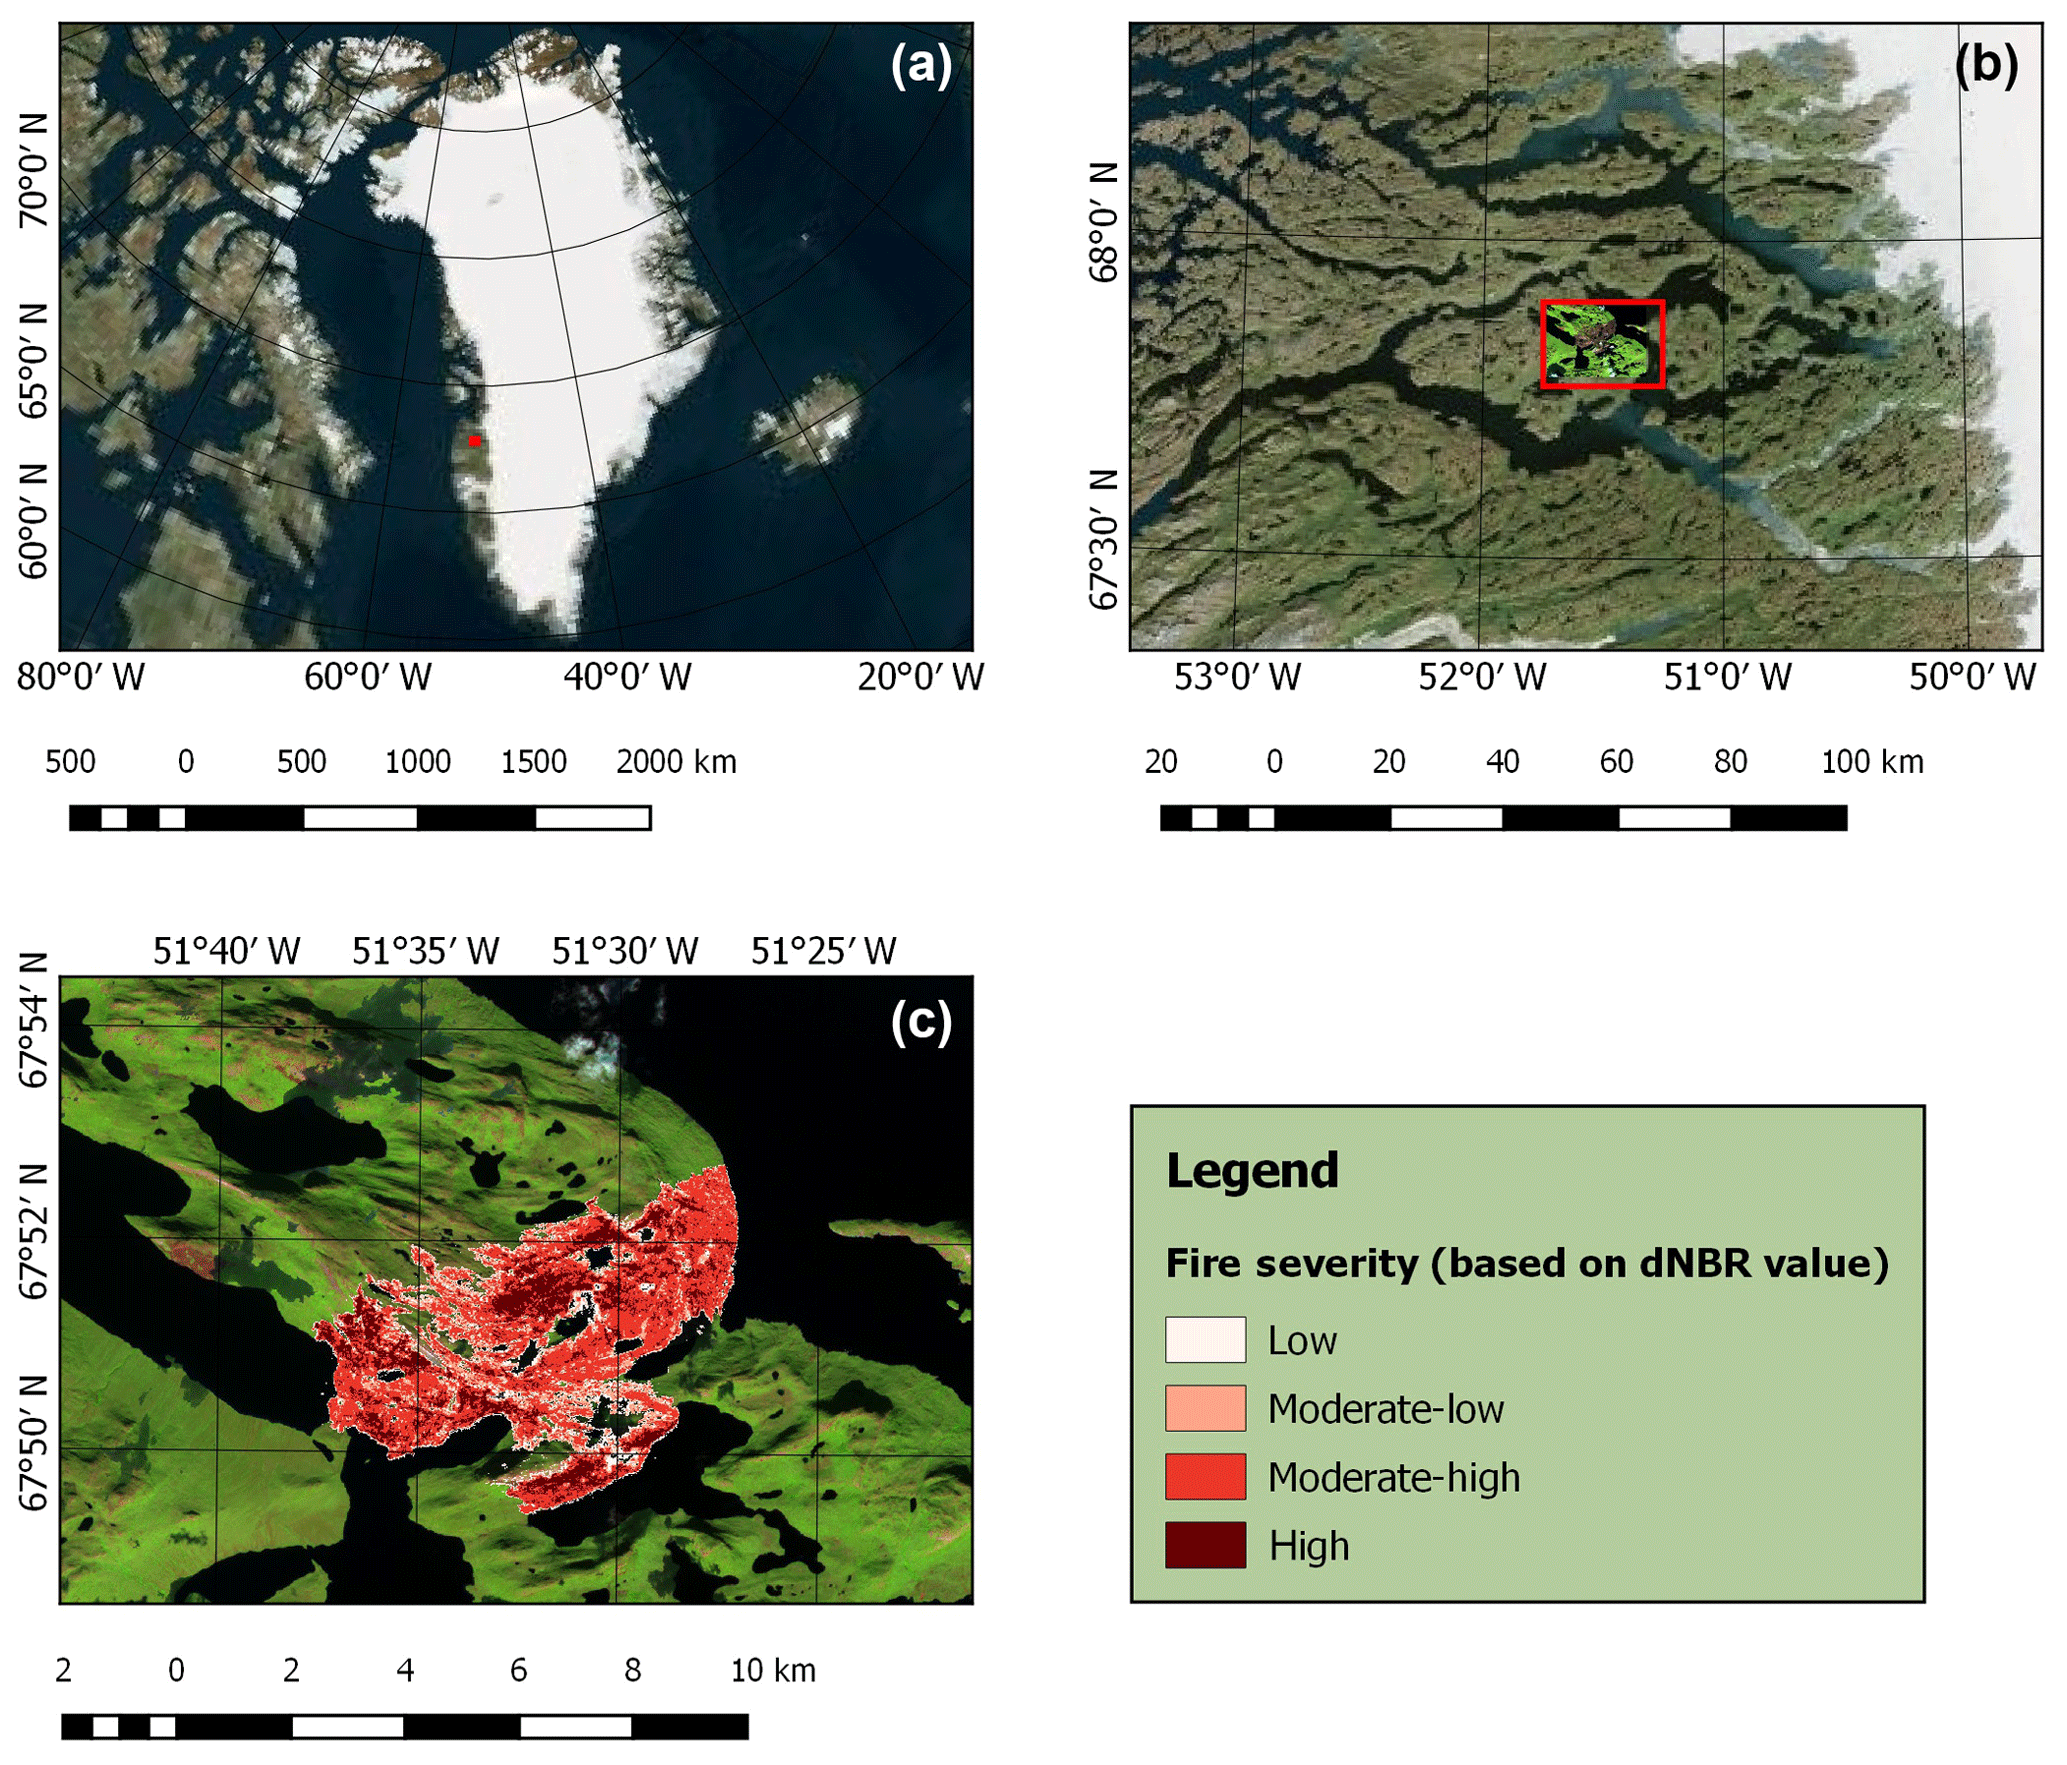
Figure 1Map of Greenland (a) and close-up map marked with fire location (b) and burned area classification (c) in terms of fire severity according to Sentinel-2A images for fires burning in Greenland in August 2017. To delineate fire perimeters, both Landsat 8 OLI and Sentinel-1A–2A data were used (Table 1).
2.2 Injection altitudes, assumptions on biomass consumption and emissions factors
Injection heights into the atmosphere of the emitted smoke were simulated with version 2 of the plume rise model (PRM; Paugam et al., 2015) which is implemented in the Global Fire Assimilation System (GFAS) emission inventory (Rémy et al., 2017). The model (hereafter referred to as PRMv2) is a further development of PRM (Freitas et al., 2007, 2010) and has already been used in previous studies of fire events (Evangeliou et al., 2015, 2016). The model simulates a profile of smoke detrainment for every single fire, from which two metrics are extracted: (i) a detrainment layer (i.e., in which the detrainment rate is >50 % of its global maximum) and (ii) an injection height (InjH, the top of the detrainment layer). Instead of using the GFAS product, which uses the same statistics as in the PRMv2 InjH calculation, we ran the model for every detected fire, assuming a 6 h persistence and using the same conversion factor as Kaiser et al. (2012) to estimate the biomass consumption. PRMv2 mass detrainment profiles are then time-integrated and extracted at spatial resolution with a 500 m vertical mesh to estimate the 3-D distribution of biomass burning smoke injection into the atmosphere. Figure S3 shows for all fires recorded in the MODIS fire product (Justice et al., 2002) during the fire period (31 July–21 August 2017) the horizontal distribution of the median height of the emitted smoke and its integration over the longitude (right panel). Fires in Greenland showed a maximum injection height of around 2 km, but according to PRMv2 the majority of the emissions (90 %) remained below 800 m. Low injection heights mostly inside the daytime planetary boundary layer are quite typical of smoldering fires, including peat fires (Ferguson et al., 2003) such as those burning in Greenland (see below). For modeling the dispersion of BC, OC and BrC released from the Greenland fires, the emission profiles from PRMv2 were ingested into the Lagrangian particle dispersion model FLEXPART (see Sect. 2.3).
Wildfires in boreal peatlands in the Canadian Arctic and in Alaska typically have (shallow) burn depths of 1–10 cm and consume 20–30 t C ha−1 (Benscoter and Wieder, 2003; Shetler et al., 2008). The consumed carbon is often re-sequestered in 60–140 years after the fire (Turetsky et al., 2011; Wieder et al., 2009). Given that fire return intervals can be as short as 100–150 years in subhumid continental peatlands (Wieder et al., 2009) and may exceed 2000 years in humid climates (Lavoie and Pellerin, 2007), northern peatlands are generally resilient to wildfires (Magnan et al., 2012). For example, in peatlands of northern Russia, organic matter available for combustion has been estimated to be 121.8 t C ha−1 for forested lands and 21.3 t C ha−1 for non-forested lands (Smirnov et al., 2015). Accordingly, a severe wildfire that burned within an afforested peatland in the Scottish Highlands during the summer of 2006 had a mean depth of burn of 17.5±2.0 cm (range: 1–54 cm) and a carbon loss of 96±15 t C ha−1 (Davies et al., 2013). In contrast, tropical peatlands can have deep burn depths of 40–50 cm and release an average of 300–450 t C ha−1 (Page et al., 2015; Reddy et al., 2015). In the present study, we assume an average amount of organic fuel available for combustion for the Greenland peat fires of August 2017 of 100 t C ha−1, guided by values suggested in Smirnov et al. (2015).
Estimation of the emissions of BC, OC and BrC, (kg), was based on the following formula (Seiler and Crutzen, 1980; Urbanski et al., 2011) using the calculated burned area A (ha) and a number of assumptions:
Here, FL is the mass of the fuel available for combustion (kg C ha−1); α is the dimensionless combustion completeness, which was adopted from Hao et al. (2016) for litter and duff fuels (50 %). EF is the emission factor (kg kg−1), which was assumed to be 0.20 g kg−1 for BC and 6.23 g kg−1 for OC for peatland fires (Akagi et al., 2011). Emission factors for BrC are rarely reported, as BrC is only a fraction of OC. To the best of our knowledge, the only reported emission factors in the literature for BrC are from forest fires in the United States (Aurell and Gullett, 2013) estimated to be 1.0–1.4 g kg−1 (value used here: 1.2 g kg−1). Fuel consumption is calculated as the product of burned area, fuel loading and combustion completeness ().
2.3 Atmospheric modeling
The emissions of BC, OC and BrC obtained from Eq. (1) were fed to the Lagrangian particle dispersion model FLEXPART version 10.3 (Pisso et al., 2019) to simulate transport and deposition. This model was originally developed for calculating the dispersion of radioactive material from nuclear emergencies, but since then it has been used for many other applications (e.g., Fang et al., 2014; Stohl et al., 2011, 2013). The model has a detailed description of particle dispersion in the boundary layer and a convection scheme to simulate particle transport in clouds (Forster et al., 2007). The model was driven by hourly operational analyses from the European Centre for Medium-Range Weather Forecasts (ECMWF). Concentration and deposition fields were recorded in a global domain of spatial resolution with 3-hourly outputs. To capture the spatiotemporal variability of BC, OC and BrC over the Greenland ice sheet, a nested domain with resolution was used. The simulations accounted for wet and dry deposition, assuming a particle density of 1500 kg m−3 and a logarithmic size distribution with an aerodynamic mean diameter of 0.25 µm and a standard deviation of 0.3 (Hu et al., 2018; Long et al., 2013). The wet deposition scheme considers below-cloud and in-cloud scavenging separately based on cloud liquid water and cloud ice content, precipitation rate and cloud depth from ECMWF, as described in Grythe et al. (2017).
To compare BC and OC concentrations in Greenland due to the emissions of the Greenland fires to those due to emissions occurring elsewhere, we used the so-called “retroplume” mode of FLEXPART for determining the influence of other sources. For only a few receptor points, this mode is computationally more efficient than forward simulations. Computational particles were tracked 30 days back in time from four receptor regions: northwestern (−62 to E, 72 to 83∘ N), southwestern (−62 to E, 61 to 72∘ N), northeastern (−42 to E, 72 to 83∘ N) and southeastern Greenland (−42 to E, 61 to 72∘ N). The retroplume mode allowed identification of the origin of BC and OC through calculated footprint emission sensitivities (often also called source–receptor relationships) that express the sensitivity of the BC and OC surface concentrations at the receptor to emissions on the model output grid. If these emissions are known, BC and OC concentrations at the receptor can be calculated as the product of the emission flux and the emission sensitivity. Also, detailed source contribution maps can be calculated, showing which regions contributed to the simulated concentration. For the anthropogenic emissions, we used the ECLIPSE (Evaluating the Climate and Air Quality Impacts Of Short-Lived Pollutants) version 5 (Klimont et al., 2017) emission data set. For the biomass burning emissions outside Greenland, we used operational CAMS GFAS emissions (Kaiser et al., 2012). To the best of our knowledge, actual gridded emissions of BrC are not yet available.
Table 1Start and end date of releases, source of data, type of sensor, burned area and daily increment of burned area, fuel consumption and calculated BC emissions from Eq. (1) during the Greenland fires in 2017.
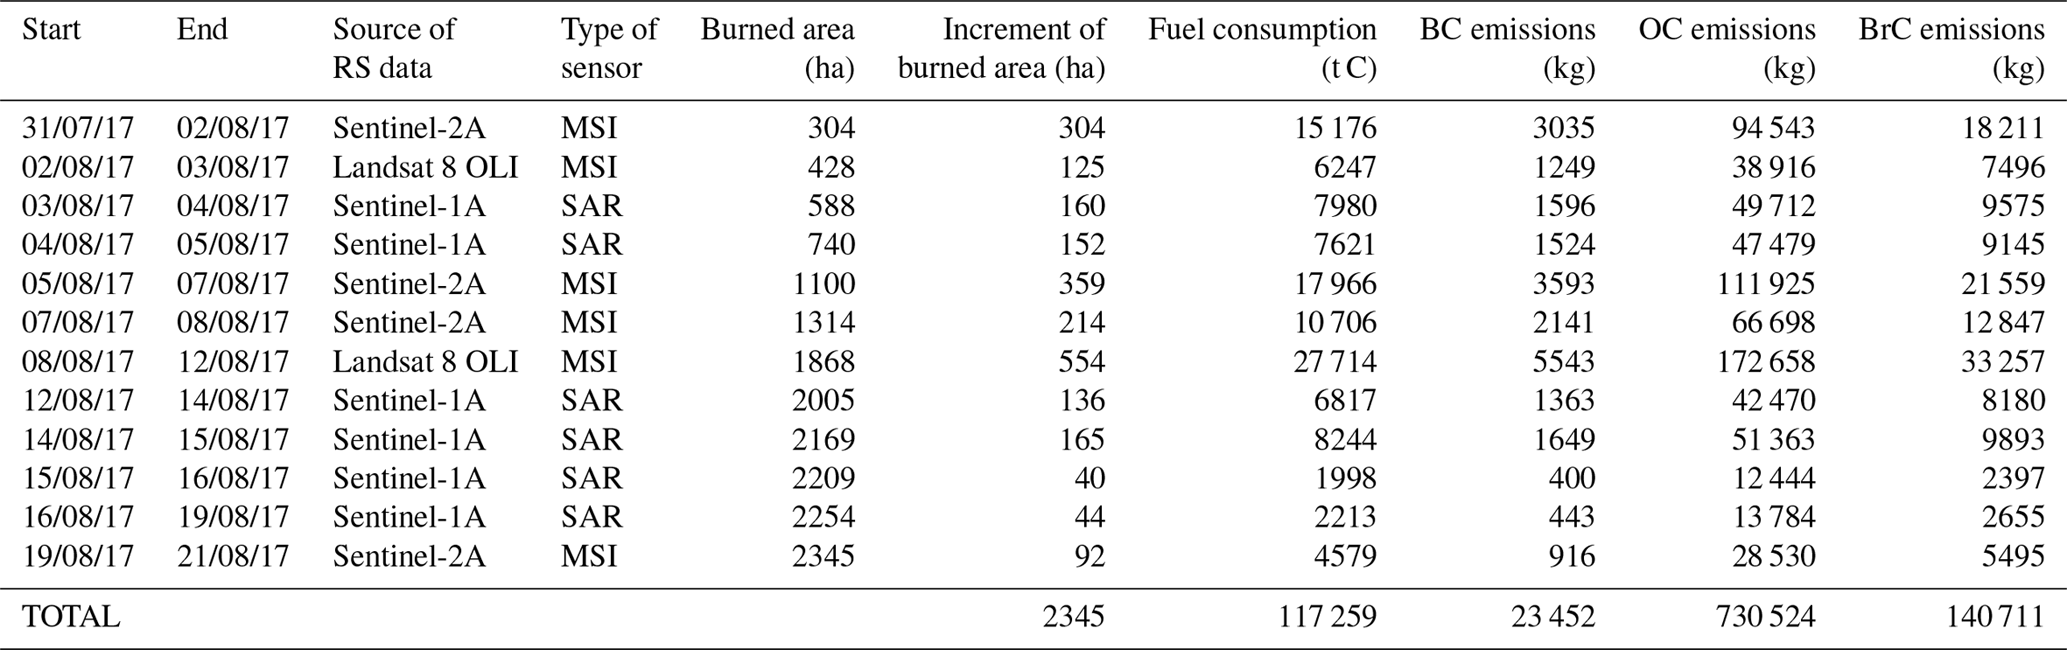
RS – remote sensing. MSI – multispectral images. SAR – synthetic aperture radar.
2.4 Instantaneous radiative forcing (IRF) calculations
The IRF of the emitted substances of interest was calculated using the uvspec model from the libRadtran radiative transfer software package (http://www.libradtran.org/doku.php, last access: 17 December 2018) (Emde et al., 2016; Mayer and Kylling, 2005). The radiative transfer equation was solved in the independent pixel approximation using the DISORT model in pseudospherical geometry with improved treatment of peaked phase functions (Buras et al., 2011; Dahlback and Stamnes, 1991; Stamnes et al., 1988). Radiation absorption by gases was taken from the Kato et al. (1999) parameterization modified as described in the libRadtran documentation and Wandji Nyamsi et al. (2015). External mixture of aerosols was assumed; i.e., BC and BrC were treated in isolation of other aerosol types that may also have been present in the plume. This assumption likely leads to underestimates of the radiative impacts, at least for BC (Jacobson, 2001), in the atmosphere as coating, for example, can enhance its radiative effects. However, these assumptions should have little impact on the more important albedo calculations (see below). For snow-covered surfaces, deposited BC and BrC were assumed to reside in the uppermost 5 mm. Below 5 mm the snow was assumed to be without any impurities. The albedo of the snow was calculated with the SNICAR model (http://snow.engin.umich.edu/info.html, last access: 17 December 2018) in a two-layer configuration (Flanner et al., 2007, 2009).
The IRF was calculated for three scenarios: (a) BC-only, (b) BC and BrC and (c) BC and BrC, for which all OC is considered to be BrC. The BC-only scenario demonstrates the impact of BC alone, while the two other scenarios provide an estimate of the additional impact of BrC in the plume, with the last scenario considered to be a maximum estimate. We calculated both the bottom-of-the-atmosphere (BOA) and top-of-the-atmosphere (TOA) instantaneous radiative forcing (IRF) due to the Greenland fires at resolution. The IRF includes both the effects of BC and BrC in the atmosphere and deposited in snow. Note that the IRF does not include any semi-direct or indirect effects. We show IRF for cloudy conditions, which represents the possible radiative effects of BC and BrC due to the 2017 fires with respect to the actual meteorological situation. Liquid and ice water clouds were adopted from ECMWF.
2.5 Remote sensing of the smoke plume
To confirm the presence of the emitted substances from the Greenland fires and elsewhere in the atmosphere over Greenland, we used the AERONET (AErosol RObotic NETwork) data (Holben et al., 1998). AERONET provides globally distributed observations of spectral aerosol optical depth (AOD), inversion products and precipitable water in diverse aerosol regimes. We chose data from three stations that were close to the 2017 fires and for which cloud-free data exist for most of the simulated period, namely Kangerlussuaq (50.62∘ W–66.99∘ N), Narsarsuaq (45.52∘ W–61.16∘ N) and Thule (68.77∘ W–76.51∘ N). Their locations are shown in Fig. S2. We used Level 2.0 AOD data (fine- and coarse-mode AOD at 500 nm and total AOD at 400 nm) from the AERONET version 3 direct-sun spectral deconvolution algorithm (SDA version 4.1) product (downloaded on 20 July 2018) for the simulated period (31 July to 31 August 2017).
To examine in particular the vertical depth of the smoke, we used data from the CALIOP (Cloud-Aerosol Lidar with Orthogonal Polarization) lidar on the CALIPSO (Cloud-Aerosol Lidar and Infrared Pathfinder Satellite Observations) platform (Winker et al., 2009). CALIOP provides profiles of backscatter at 532 and 1064 nm, as well as the degree of the linear polarization of the 532 nm signal. For altitudes below 8.3 km lidar profiles at 532 nm are available with a vertical resolution of 30 m. We have utilized the level 1 data products (version 3.40) of total attenuated backscatter at 532 nm. This signal responds to aerosols (like BC, OC and BrC) as well as water and ice clouds, which in most cases can be distinguished based on their differences in optical properties. The data were downloaded from the ICARE Data and Services Center (http://www.icare.univ-lille1.fr/, last access: 17 December 2018).
3.1 Indications of early permafrost degradation and fuel availability
Table 1 reports burned areas in August 2017 calculated for Greenland. In total, 2345 ha burned between 31 July and 21 August 2017 (Fig. 1). We estimate that about 117 kt of carbon was consumed by these fires. The area burned is not large compared to the global area burned each year (464 million ha), or the areas burned in boreal North America (2.6 million ha) or boreal Asia (9.8 million ha) (Randerson et al., 2012), but it is still highly unusual for Greenland.
It is not yet known how these fires started. Fires on carbon-rich soils can be initiated by an external source, e.g., lightning, flaming wildfire and firebrand, or self-heating. The fires burned relatively close to the town of Sisimiut, so it is quite possible that humans started the fires. Self-heating is another possibility as porous solid fuels can undergo spontaneous exothermic reactions in oxidative atmospheres at low temperatures (Drysdale, 2011; Restuccia et al., 2017b). This process starts by slow exothermic oxidation at ambient temperature, causing a temperature increase, which is determined by the imbalance between the rate of heat generation and the rate of heat losses (Drysdale, 2011). Fire initiated by self-heating ignition is a well-known hazard for many natural materials (Fernandez Anez et al., 2015; Restuccia et al., 2017a; Wu et al., 2015) and can also occur in natural soils (Restuccia et al., 2017b). Southwestern Greenland was under anticyclonic influence during the last week of July, and according to the MODIS EOSDIS Worldview tool, direct sunshine occurred for 8 consecutive days before the fires started at the end of July 2017. It might be possible that this long period of almost continuous insolation at these latitudes in July heated the soil enough to self-ignite. In any case, the continuous sunshine had dried the soil, making it susceptible to fire.
The fact that these fires were burning for about 3 weeks but spread relatively slowly compared to above-ground vegetation fires indicates that the main fuel was probably peat. The predominant vegetation in western Greenland varies from carbon-rich Salix glauca low shrubs (mean canopy height: 95 cm), mainly at low-altitude south-facing slopes with deep soils and ample moisture, to dwarf shrubs and thermophilous graminoid vegetation (Arctic steppe) at higher altitudes (Jedrzejek et al., 2013). In addition, the observed smoke was nearly white, indicating damp fuel, such as freshly thawed permafrost, which produces smoke rich in OC aerosol (Stockwell et al., 2016).
Literally no fires should be expected in Greenland, since there is little available fuel as it has been suggested by global models and validated by observations (Daanen et al., 2011; Stendel et al., 2008); the only way to provide substantial amounts of fuel in Greenland is permafrost degradation. However, it has been suggested that significant permafrost loss in Greenland may occur only by the end of the 21st century (Daanen et al., 2011; Stendel et al., 2008). The fires in 2017 might indicate that significant permafrost degradation has occurred sooner than expected.
3.2 Transport and deposition of BC in Greenland
We estimate that about 23 t of BC and 731 t of OC, including 141 t of BrC, was released from the Greenland fires in August 2017 (Table 1). According to the FLEXPART model simulations, these emissions were transported and deposited as shown in Fig. 2. Due to the low injection altitude of the releases within the boundary layer, transport was relatively slow, and thus the emitted substances initially remained quite close to their source. Slow transport was also favored by mostly anticyclonic influence during the first half of August. It seems that even though katabatic winds from the Greenland ice sheet occasionally transported the plume westwards, most of the time the large-scale circulation pushed the plume back towards Greenland (see animations in the Supplement). Consequently, a large fraction of the emitted substances were deposited in southwestern Greenland. On 3 August a small portion of the emitted BC, OC and BrC (0.5, 16.1 and 3.1 t, respectively) were lifted higher into the atmosphere and were transported to the east and deposited in the middle of the ice sheet over the course of the following 2 days (4 and 5 August). From 5 to 8 August, when the fires were particularly intense, the emitted aerosols were transported to the south, where they were deposited on the southern part of the ice sheet and close to the coastline. At the same time, another branch of the plume was moving to the north depositing BC, OC and BrC over Greenland's western coastline up to 80∘ N. Around 10 August, the plume circulated north and then eastwards in the northwestern sector of the anticyclone, and the emitted aerosols were deposited on the northern part of the ice sheet until 13 August. From around 16 August, a cyclone approached from the northwest and the smoke was briefly transported directly eastwards along the southern edge of the cyclone (see animations in the Supplement). Strong rain associated with the cyclone's frontal system appears to have largely extinguished the fire by 17 or 18 August, although smaller patches may have continued smoldering for a few more days before they also died out. The exact fire behavior after 16 August is difficult to determine because of frequent dense cloud cover. However, satellite imagery on 21 August shows no smoke anymore in the area where the fires had burned.
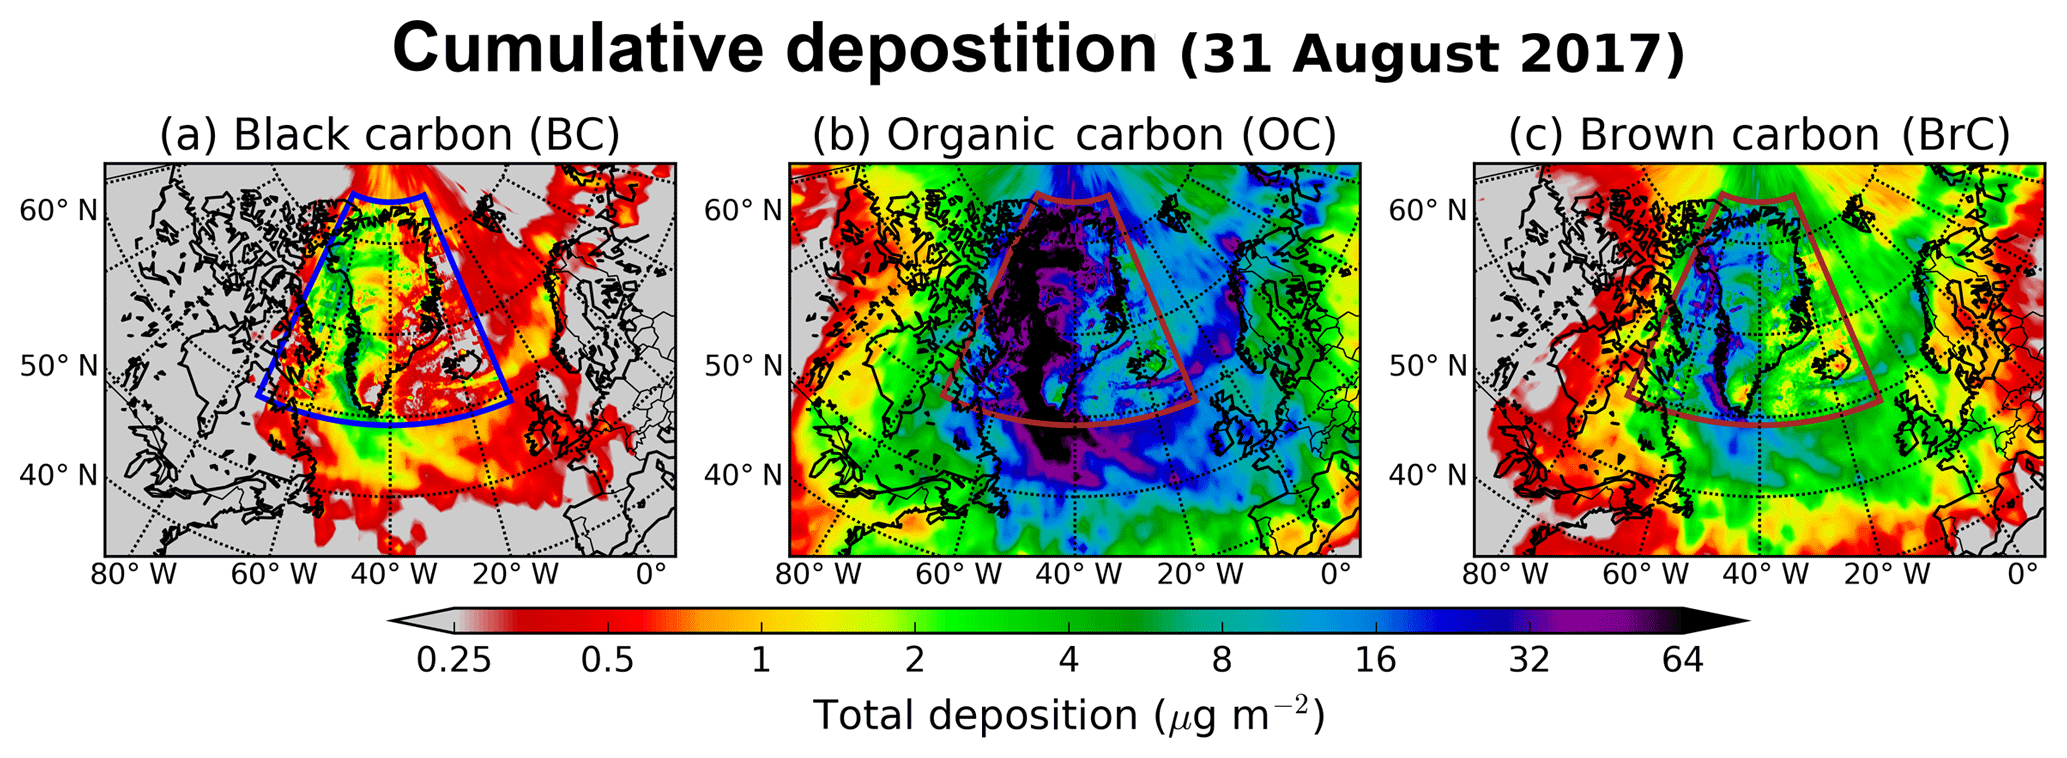
Figure 2Total (wet and dry) deposition of (a) BC, (b) OC and (c) BrC (in µg m−2) from the Greenland fires until 31 August 2017. The colored rectangle depicts the nested high-resolution domain.
The total deposition of BC, OC and BrC from the fires in Greenland was estimated to be 9, 280 and 54 t, respectively, or about 39 % of the total emissions. About 7 t of BC, 218 t of OC and 42 t of BrC were deposited on snow- or ice-covered surfaces, which is equivalent to 30 % of the total emissions. Most of the rest was deposited in the Baffin Bay between Greenland and Canada and in the Atlantic Ocean. With 30 % of the emissions deposited on snow or ice surfaces, Greenland fires may have a relatively large efficiency for causing albedo changes on the Greenland ice sheet.
By comparison, the respective BC deposition on snow and ice surfaces over Greenland from global emissions of BC (from ECLIPSEv5) was only 0.4 % (39 kt) of the total emissions. Even the total deposition of BC in the Arctic (>67∘ N) was only about 3 % (215 kt). This indicates the high relative potential of Greenland fires to pollute the cryosphere (on a per unit emission basis), likely also giving them a particularly high radiative forcing efficiency. Considering that the projected rise of Greenland temperatures is expected to result in further degradation of the permafrost (Daanen et al., 2011) and, hence, likely resulting in more and larger peat fires on Greenland, this constitutes a potentially important climate feedback which could accelerate melting of the glaciers and ice sheet of Greenland and enhance Arctic warming.
We also calculated the concentration of the deposited carbon aerosols in Greenland snow (Fig. 3) by taking the ratio of deposited quantities and the amount of water deposited by rain or snowfall during the same time period (31 July to 31 August 2017). As expected, snow concentrations show the same general patterns as the simulated deposition with the highest concentrations obtained close to the source (western side of Greenland). High snow concentrations were also computed in some regions of the ice sheet due to relatively intense precipitation events. By contrast, dry deposition (example for BC) over the ice sheets was low (Fig. S4). Dry deposition was only responsible for a major fraction of the deposition in regions where the plume was transported during dry weather, and in most of these regions total deposition was low. A notable exception is the region close to the fires, where dry deposition was relatively important due to the generally dry weather when the fires were burning. It can be also ascribed to the fact that dry deposition occurs in the quasi-laminar sublayer close to the surface. A fraction of the aerosols can be quickly deposited close to the sources before they are transported to higher altitudes and away from the sources (Bellouin and Haywood, 2014). The average calculated snow concentration of BC on the ice sheet was estimated to be <1 ng g−1, but in some areas snow concentrations reached up to 3 ng g−1. These higher values are substantial considering that measured concentrations of BC in snow typically range up to 16 ng g−1 in most of Greenland (Doherty et al., 2010) or from 1 to 17 ng g−1 in summer 2012 and from 3 to 43 ng g−1 in summer 2013 (Polashenski et al., 2015) and up to 15 ppb C (ng g−1) during preindustrial times (from 1740 to 1870) on average (Legrand et al., 2016). OC concentrations in snow were 2 ng g−1 (ppb C), on average, with local maxima of 10 ng g−1. They are lower than those measured in snow over several places in Antarctica (23–928 ppb C) (Antony et al., 2011; Grannas et al., 2004; Legrand et al., 2013; Lyons et al., 2007), in Greenland (400–580 ppb C) (Grannas et al., 2004) or in the Alps (70–304 ppb C) (Legrand et al., 2013). Snow BrC was estimated to be even less; though, to the best of our knowledge, no available measurements exist in the relevant literature so far.
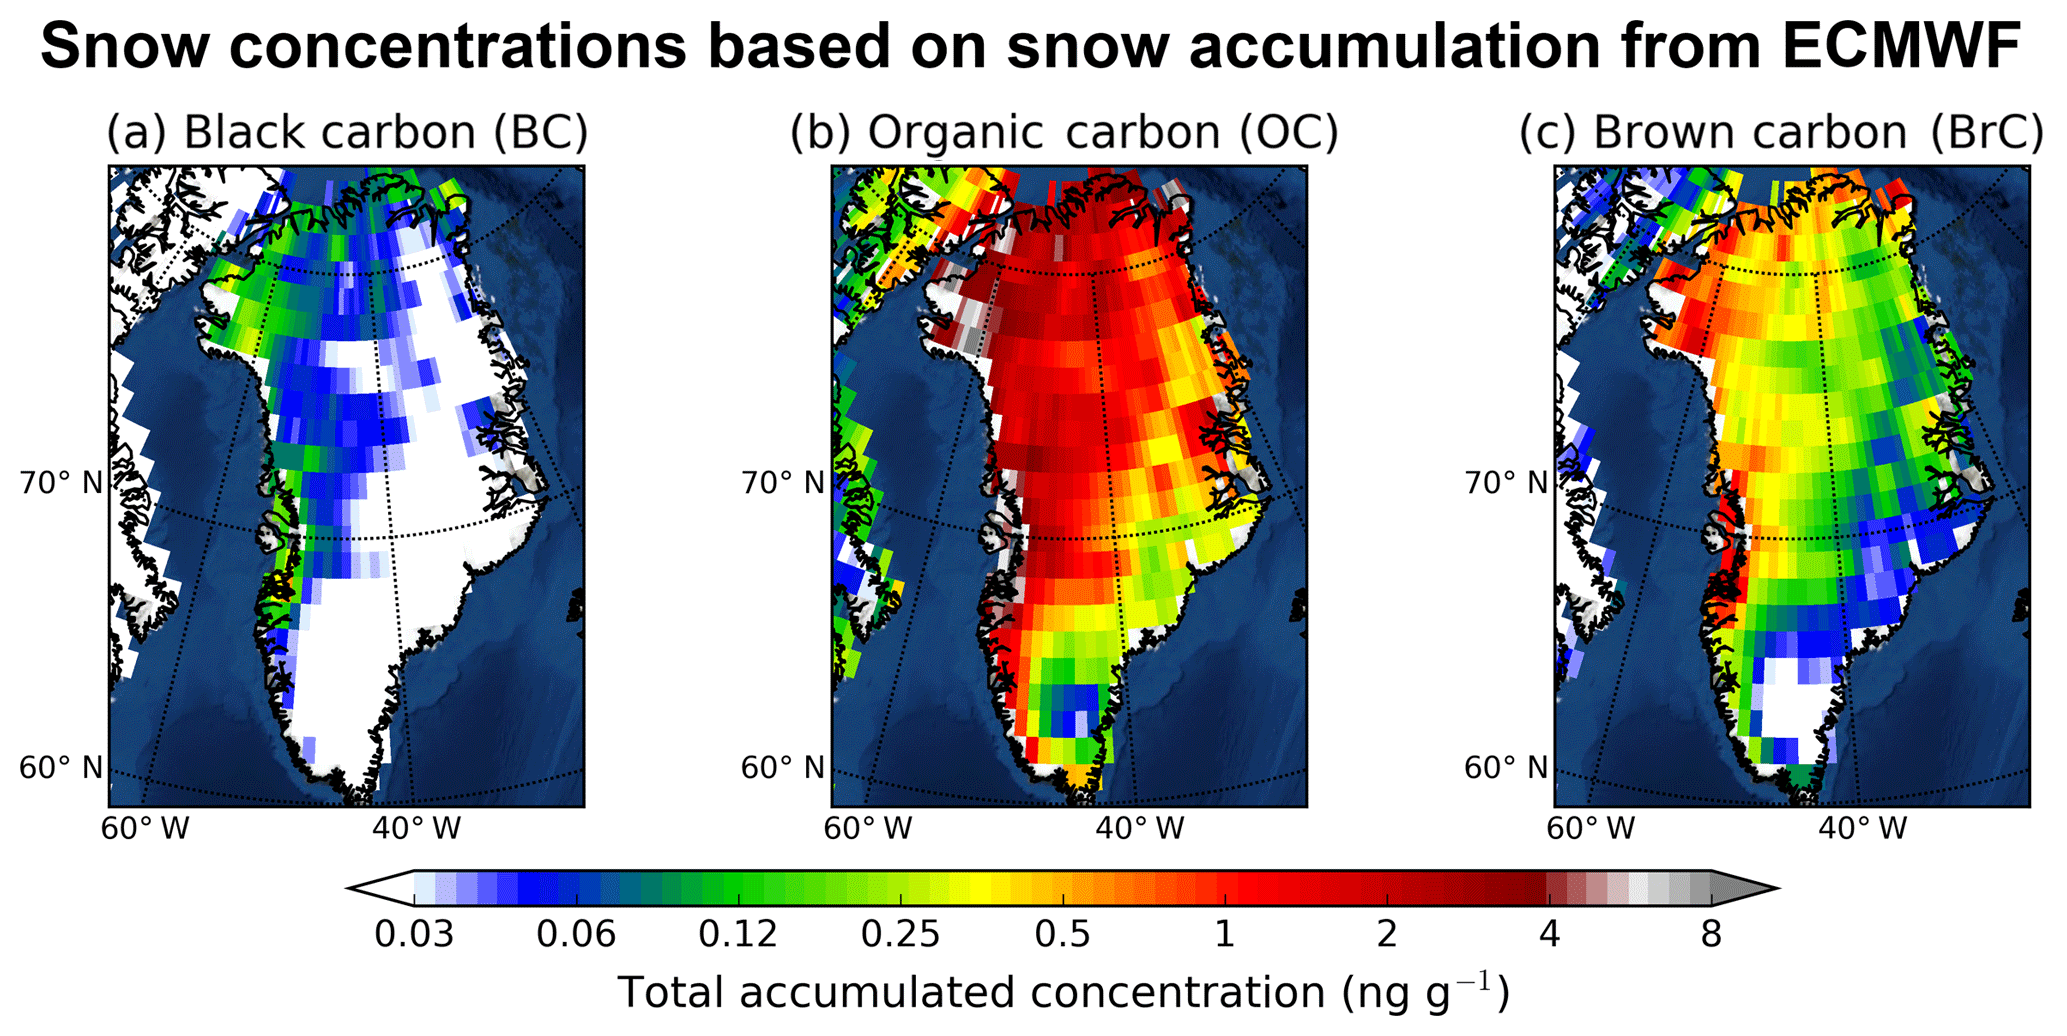
Figure 3Calculated snow concentrations of (a) BC, (b) OC and (c) BrC over Greenland based on the modeled deposition and the snow precipitation (large-scale and convective) adopted from the operational ECMWF data that were used in our simulation (see Sect. 2.3).
It has been reported that the size of rapidly coagulated aerosol particles produced by different types of fires ranges between 0.1 and 10 µm, but more than 90 % of the mass lies between 0.1 and 1 µm (e.g., Conny and Slater, 2002; Long et al., 2013; Zhuravleva et al., 2017, and many others). Therefore, we simulated the Greenland fires with an aerodynamic mean diameter of 0.25 µm for BC, OC and BrC and a logarithmic standard deviation of 0.3 (see Sect. 2.3) because all these substances have more or less the same lifetimes (Bond et al., 2013; Jo et al., 2016; Lim et al., 2003). To examine the sensitivity of deposition in the Greenland ice sheet from the Greenland fires of 2017 to the particle size distribution used in the model, we simulated the same event for particles with aerodynamic mean diameters of 0.1, 0.25, 0.5, 1, 2, 4 and 8 µm and calculated the relative standard deviation of deposition normalized against the aerodynamic mean diameter of 0.25 µm that was our basic assumption. The results are shown in Fig. S5 for BC. The use of different size distributions for the BC particles produced from the 2017 fires created a relative uncertainty on the deposited mass of BC in the Greenland ice sheet, which ranges from 10 % to 30 % in 86 % of the sheet's surface to up to 50 % in the rest of the sheet's surface. As expected, the calculated uncertainty is sensitive to the use of larger particles for BC; though BC particles larger than 1 µm are rather rare in peat fires (Hosseini et al., 2010; Leino et al., 2014).
3.3 Impact from other emissions in the Northern Hemisphere
In summertime 2017, intense wildfires were reported in British Columbia, Western Canada (NASA, 2017c), and fires also burned at midlatitudes in Eurasia, as is typical during spring and summer (Hao et al., 2016). Previous studies of wildfires have shown that the produced energy can be sufficient to loft smoke above the boundary layer by supercell convection (Fromm et al., 2005), even up to stratospheric altitudes (Leung et al., 2007). As a result, emitted aerosols can become subject to long-range transport over long distances (Forster et al., 2001; Stohl et al., 2007). To examine the impact of these fires in Greenland, average footprint emission sensitivities were calculated for four compartments of Greenland (northwestern, southwestern, northeastern and southeastern Greenland) for the period 31 July to 31 August 2017, and the results are shown in Fig. S6 together with the active fires in the Northern Hemisphere from 10 July to 31 August 2017 adopted from the MODIS satellite product (MCD14DL) (Giglio et al., 2003). As can be seen in Fig. S6, fires in Alaska and in Western Canada might have affected BC, OC and BrC concentrations in Greenland, as the corresponding emission sensitivities are the highest in North America. In contrast, emissions from fires in Eurasia seem to have affected Greenland less.
Using gridded emissions for BC and OC, the contribution of both biomass burning and anthropogenic sources to surface concentrations in the four different regions over Greenland (northwestern, northeastern, southwestern and southeastern Greenland; Fig. S7) was calculated (see Sect. 2.3). Fires affected the northern part of Greenland more than the southern part, with an average BC concentration of about 30 ng m−3, almost twice the respective average for southern Greenland (≈16 ng m−3). OC-simulated concentrations were much higher that those of BC, with an average concentration of 945 ng m−3 in northern Greenland, while the respective concentrations in the southern part were about 490 ng m−3. About one-third of BC and OC originated from wildfires in Eurasia and the rest from North America, where the year 2017 appears to have been a particularly high fire year. The anthropogenic contribution to surface concentrations of BC and OC over Greenland was between 14 % and 50 % of the total contribution from all biomass burning sources (Fig. S7), similar to what has been suggested previously for the Arctic in summer (Winiger et al., 2017). The anthropogenic contribution is larger in southern Greenland than in northern Greenland, due to the shorter distance from the main emission areas of North America and western Europe, but it remains much lower than the biomass burning contribution. The concentrations of BC and OC that are calculated for the studied fire period (31 July to 31 August 2017) are relatively high compared to those reported previously. For instance, von Schneidemesser et al. (2009) observed an annual average BC concentration of 20 ng m−3 at Summit Station (Greenland) in 2006, while Massling et al. (2015) reported a summer average BC concentration of 11 ng m−3 at Station Nord (Greenland) between May 2011 and August 2013. As regards OC, average concentrations of its water soluble part were measured in 2006 between 194 and 730 ng m−3 in Summit Station, Greenland (Anderson et al., 2008), showing a large decreasing trend compared to previous years (Dibb et al., 2002). We attribute this difference in the calculated concentrations to more active fires during 2017 in Greenland than in previous years (see Fig. S1).
As an example of the importance of northern hemispheric biomass burning emissions for the air over Greenland, we present time series of surface BC concentrations in northwestern, northeastern, southwestern and southeastern Greenland from the fires in Greenland and from all the other wildfire emission sources occurring outside Greenland (Northern Hemisphere) for the same period of time (Fig. 4). The calculated dosages (concentrations summed over a specific time period) for the same time period were also computed. The fires in Greenland affected mainly its western part with concentrations that reached up to 4.8 ng m−3 (southwestern Greenland on 10 August) and 4.4 ng m−3 (northwestern Greenland on 12 August), while BC concentrations in the eastern part remained significantly lower (Fig. 4). These concentrations are substantial considering that the observed surface BC concentrations in Greenland in summer are usually below 20 ng m−3 (Massling et al., 2015). Surface BC due to wildfires occurring outside Greenland was also low most of the time in the studied period (up to 10 ng m−3 at maximum) except for a large peak between 19 and 23 August that mainly affected northern Greenland (Fig. 4). The concentrations during this episodic peak were as high as 27 ng m−3. During the same period, the contribution from anthropogenic emissions was also a few ng m−3 (Fig. 4). BC dosages for the simulation period (31 July–10 August 2017) in western Greenland due to the Greenland fires were about 1 order of magnitude smaller than dosages from fires elsewhere but of the same order of magnitude as BC originating from anthropogenic emissions.
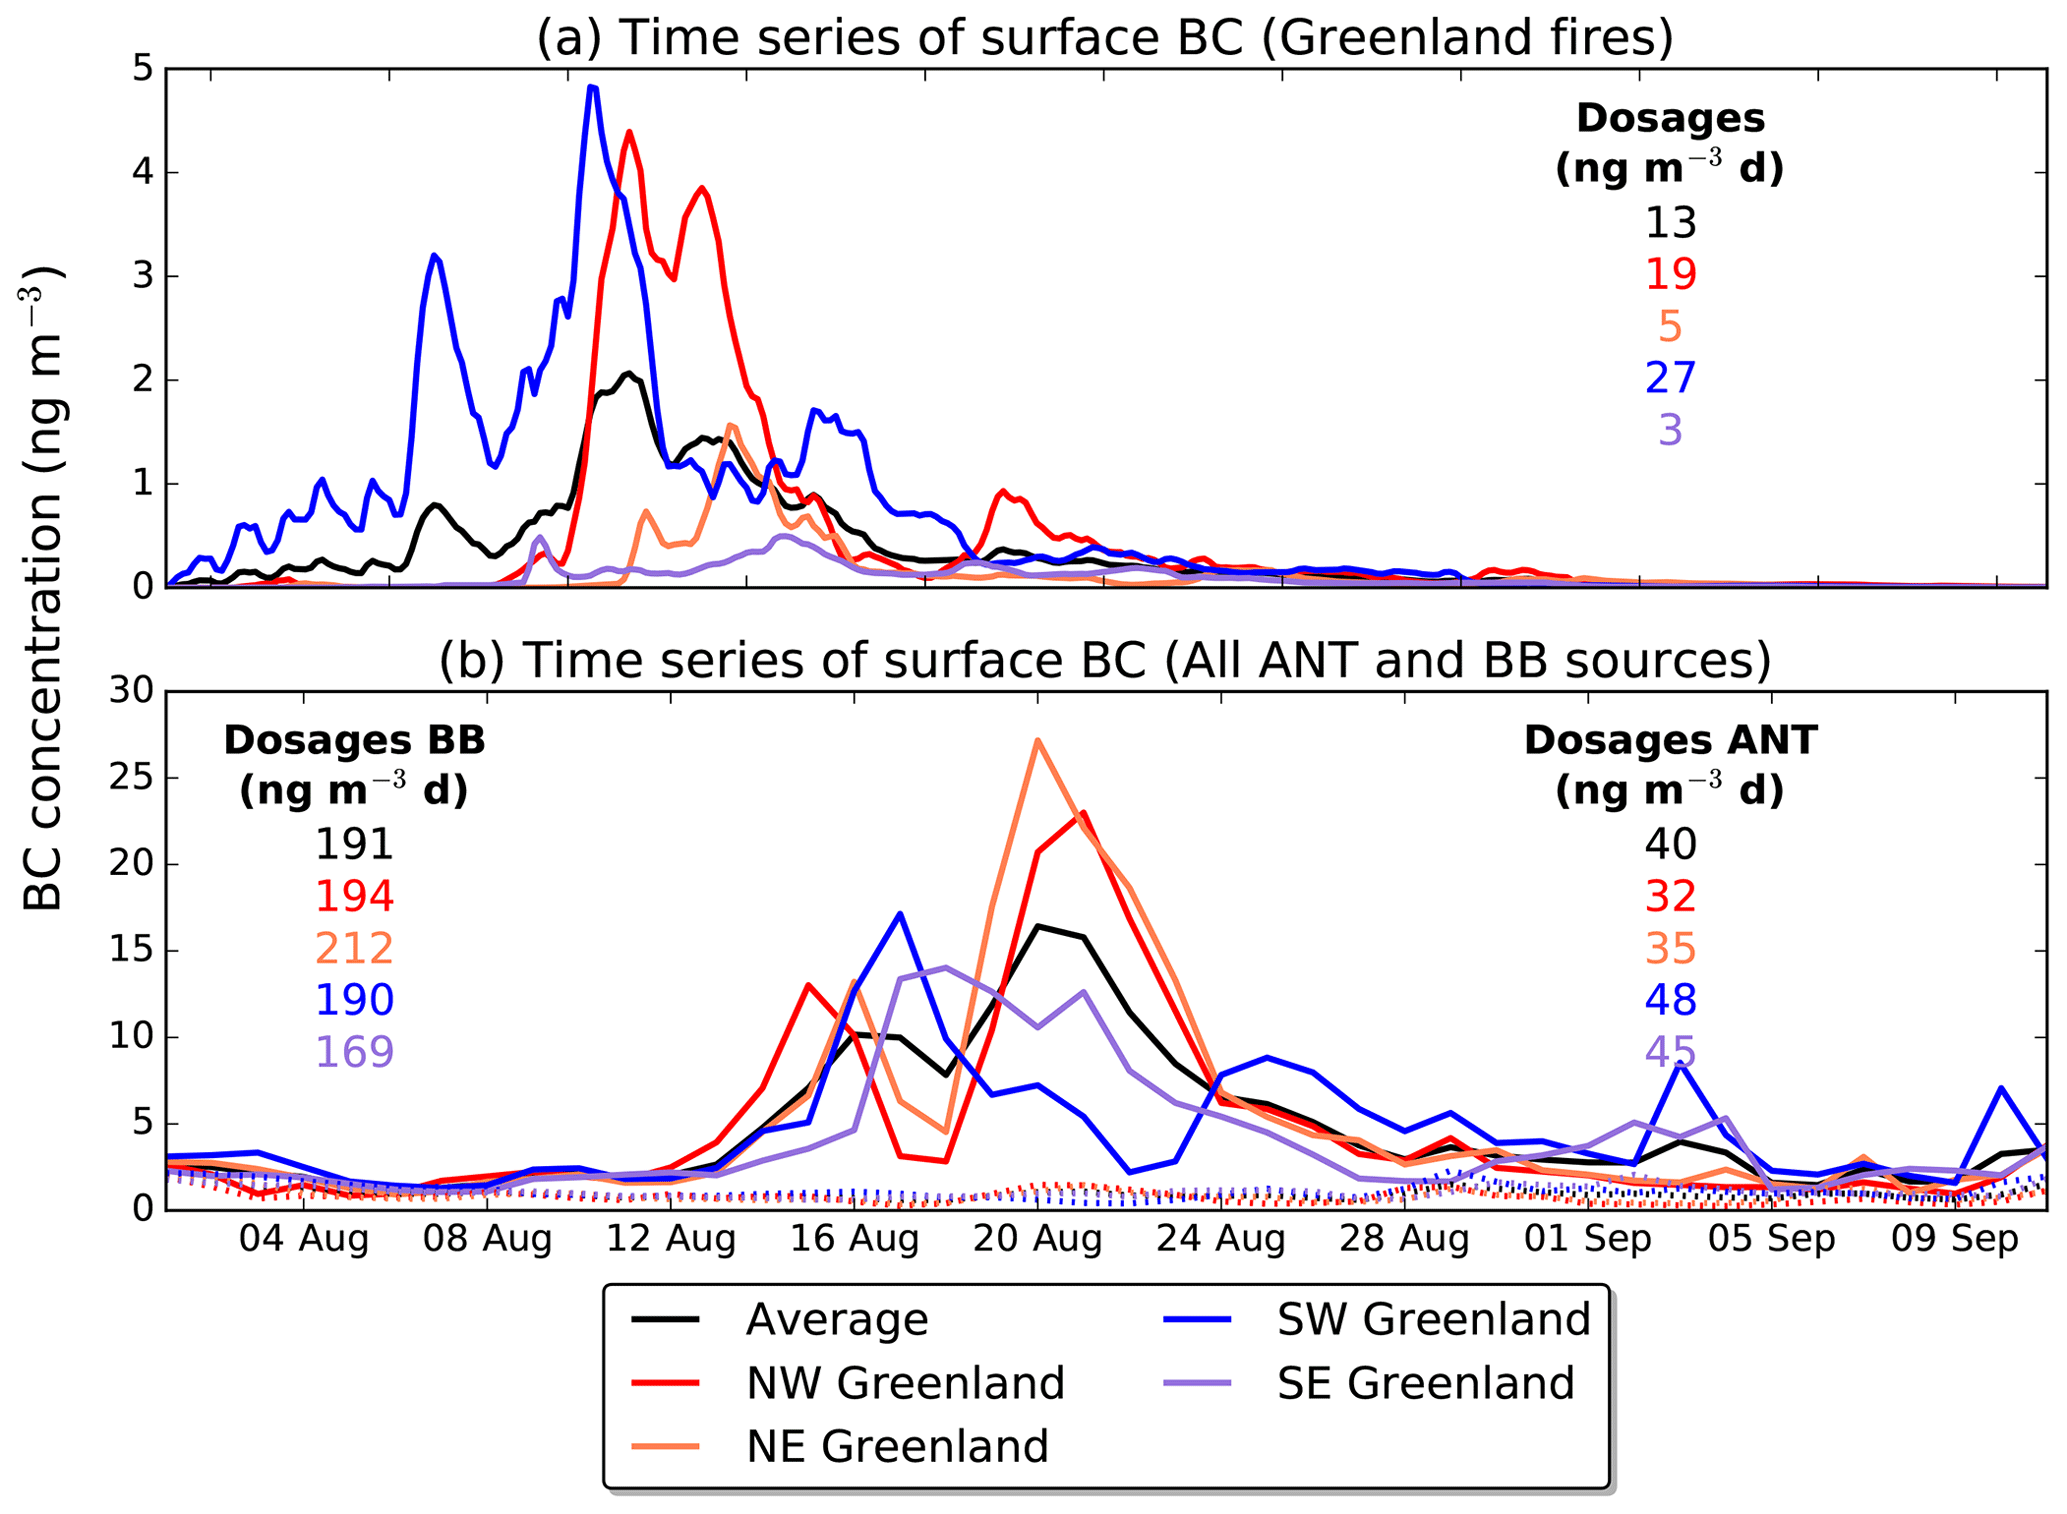
Figure 4(a) Time series of surface BC concentrations in northwestern, northeastern, southwestern and southeastern Greenland from the summer 2017 fires in western Greenland. (b) Time series of surface BC concentrations in northwestern, northeastern, southwestern and southeastern Greenland from global anthropogenic (ANT; dashed lines) and biomass burning (BB; solid lines) emissions for the same period. The numbers represent the respective dosages (time-integrated concentrations) for the time period shown. The color codes are reported in the legend.
4.1 An evaluation attempt
There are few observations available that can be used to evaluate our model results. We use the AERONET and CALIOP data for some qualitative comparisons. We present only BC here, but similar plots can be generated for OC, considering that we used the same scavenging coefficients as for BC to represent the similar lifetimes of BC and OC (Bond et al., 2013; Jo et al., 2016; Lim et al., 2003). Contours of simulated vertical distribution of BC and column-integrated simulated BC from fires inside and outside Greenland are plotted together with time series of measured AOD (fine- and coarse-mode AOD at 500 nm and total AOD at 400 nm) for the AERONET stations Kangerlussuaq, Narsarsuaq and Thule (Fig. 5). It can be seen that observed AOD variations were in very good agreement with the variation of simulated column-integrated BC from fires outside Greenland (mainly in Canada), confirming that the transport of these fire plumes was well captured by FLEXPART. Good examples are the peaks at Kangerlussuaq on 24 August, at Narsarsuaq on 19 August and at Thule on 21 August (Fig. 5) that are attributed to the Canadian fires. The simulated contribution of the Greenland fires to simulated BC burdens was negligible by comparison, except at Kangerlussuaq in the beginning of August when the Greenland fire emissions were the highest. This station is less than 100 km away from where the fires burned, but not in the main direction of the BC plume transport. It seems the period of simulated fire influence corresponds to a small increase of the observed AOD values of up to 20 % (Fig. 5).
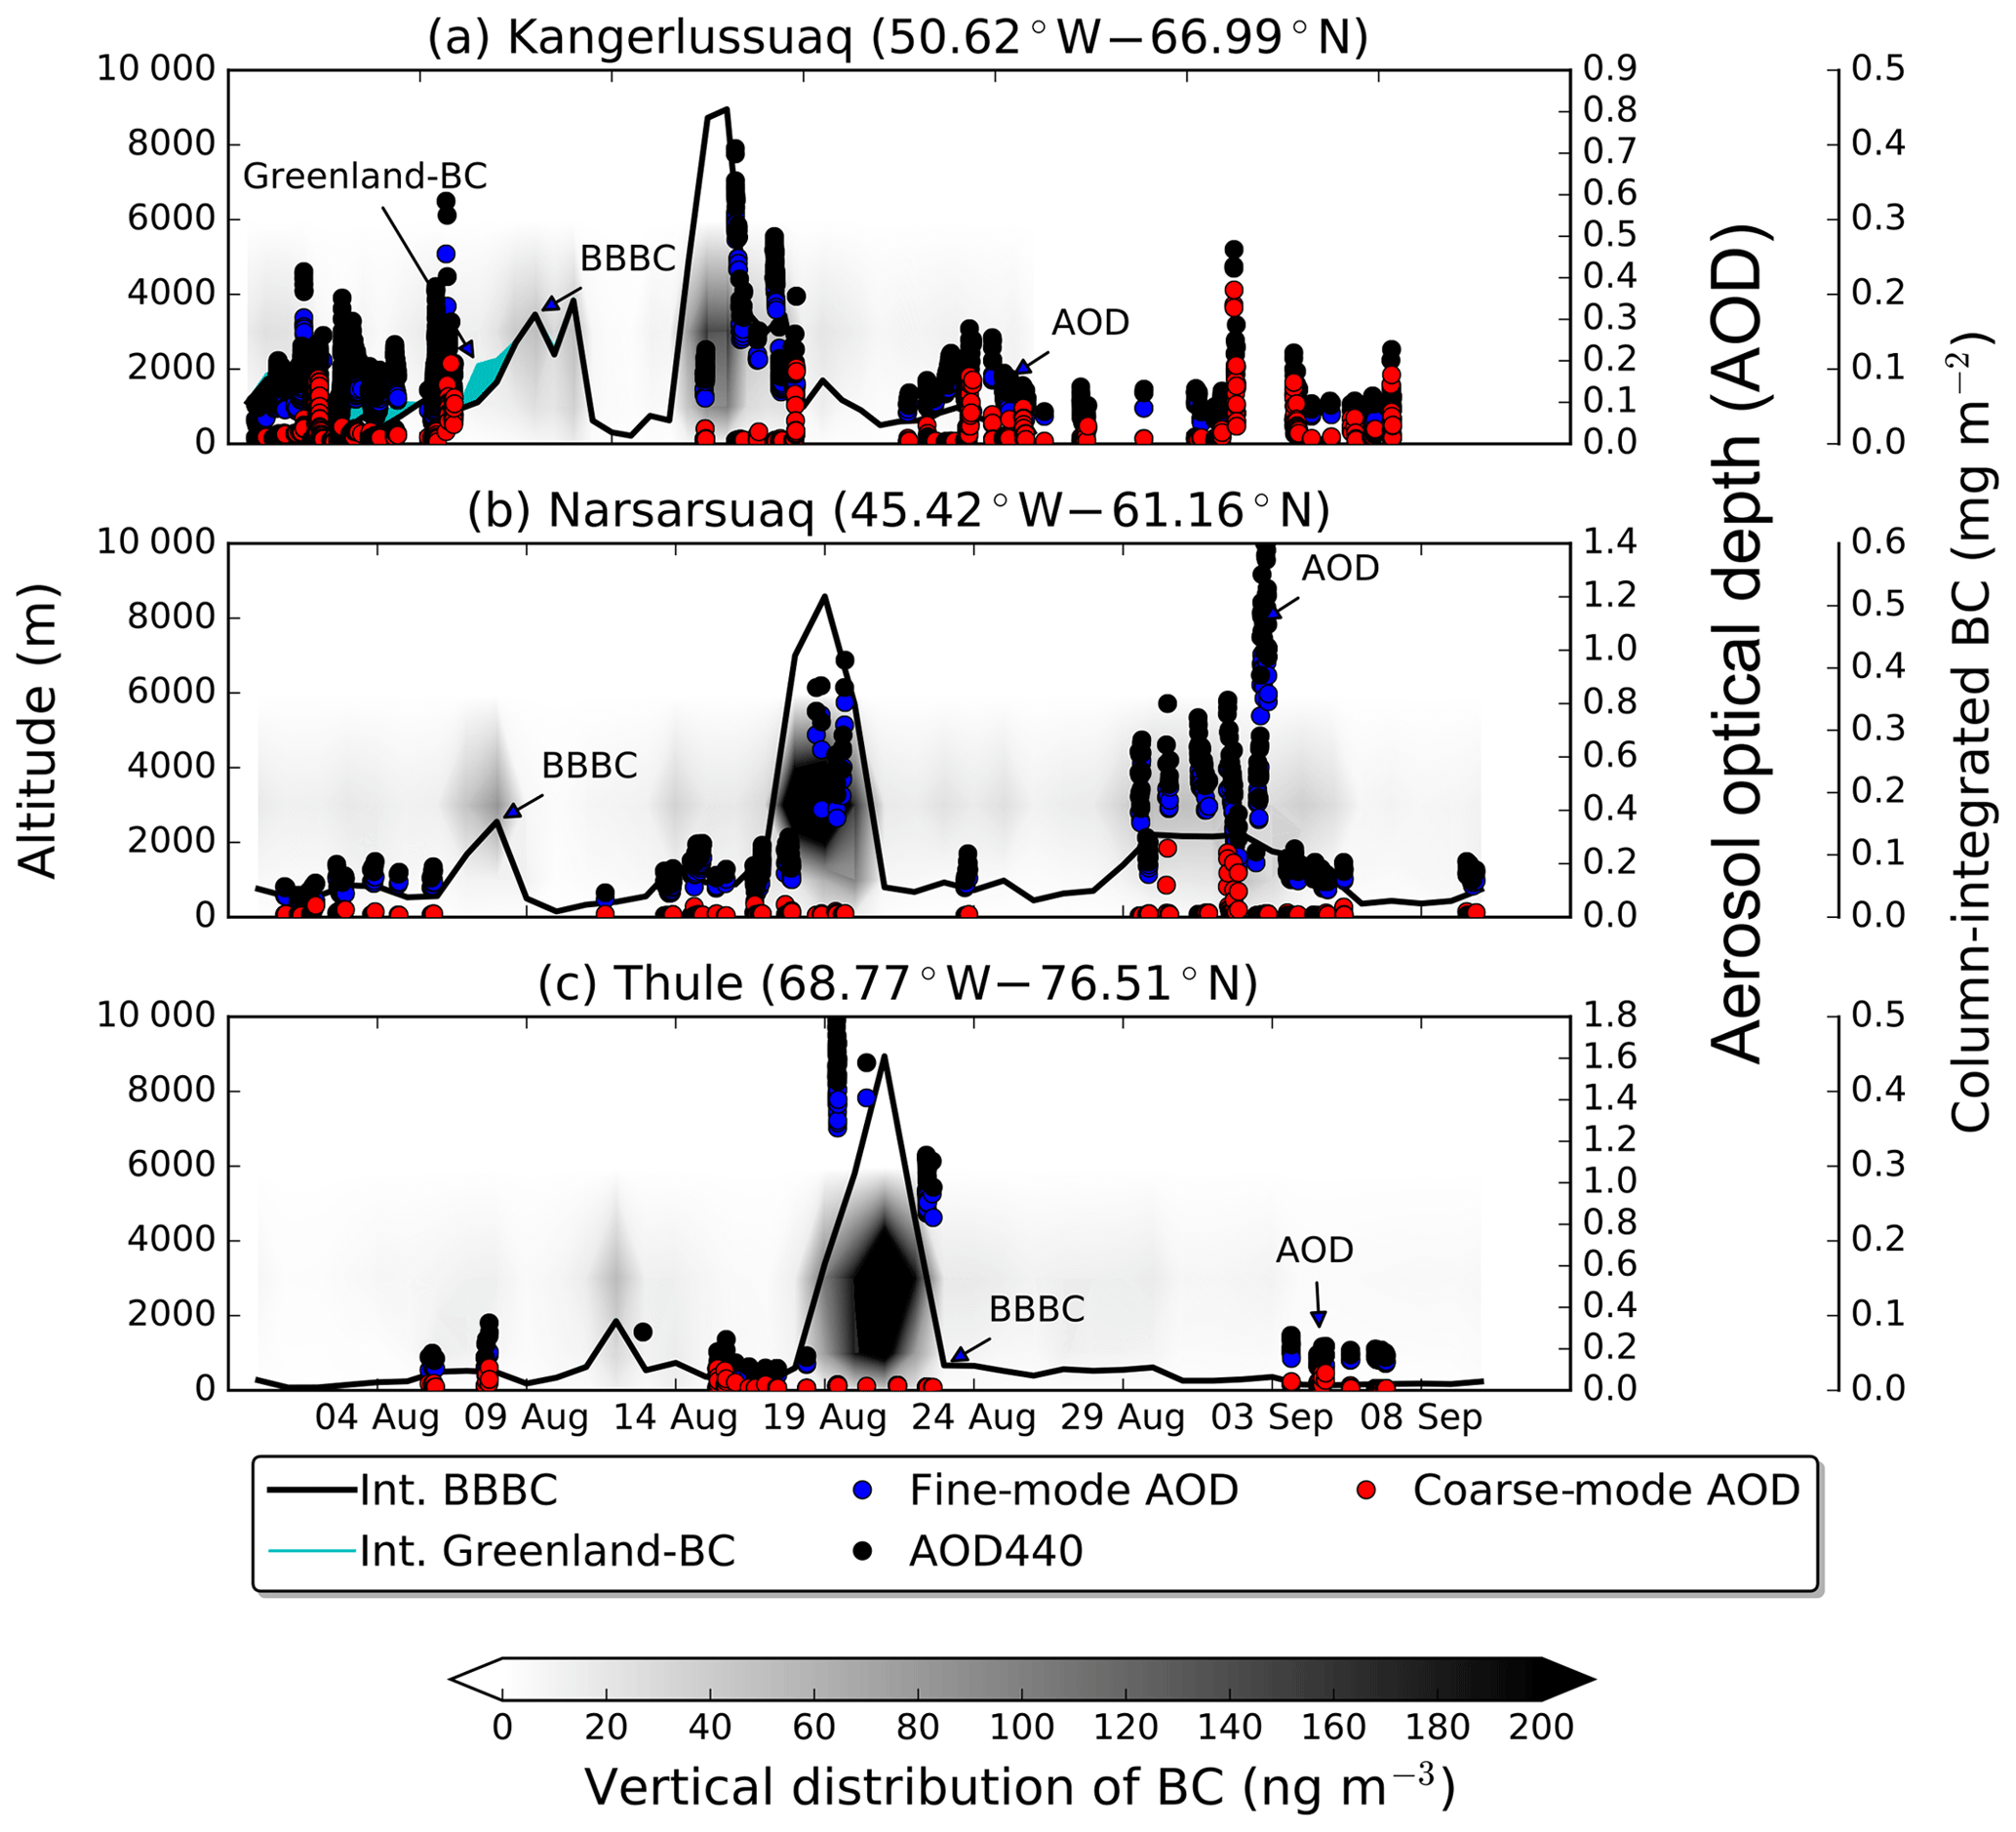
Figure 5Contour plot of the vertical distribution of simulated BC (altitude a.g.l. shown on left y axis) as a function of time (x axis) and time series of column-integrated simulated BC (extended right axis) from fires burning outside Greenland (black line) and Greenland fires (cyan stacked area). Column-integrated BC from anthropogenic sources was extremely small and it is not plotted here. Time series for fine-mode (blue) and coarse-mode (red) AOD at 500 nm and total AOD at 400 nm (black) correspond to the right y axis. The three panels show results for stations (a) Kangerlussuaq, (b) Narsarsuaq and (c) Thule (sorted from the closest to the farthest station).
To evaluate the smoke plume's vertical extent, we used the CALIOP data. These data were only available from 5 August 2017 onward and frequent dense cloud cover inhibited lidar observations at the altitudes below the clouds. High aerosol backscatter was only found in the close vicinity of the fires. Figure 6a shows NASA's EOSDIS view of the plume on 14 August 2017 at 06:00 UTC (available at https://worldview.earthdata.nasa.gov/?p=geographic&l= MODIS_Aqua_CorrectedReflectance_TrueColor(hidden), MODIS_Terra_CorrectedReflectance_TrueColor,MODIS_ Fires_Terra,MODIS_Fires_Aqua,Reference_Labels(hidden) ,Reference_Features,Coastlines&t=2017-08-14&z=3&v=-54.13349998138993,66.35888052399868,-50.32103113049877,69.08420005412792, last access: 31 January 2019), when a clear smoke signal was recorded. A CALIOP overpass through the edge of the plume allows its vertical structure to be studied. Increased attenuated backscatter is found below ∼1.5 km above sea level between 52 and 51∘ E (Fig. 6b; black line denotes the orography). Figure 6c (red line) shows that the CALIOP overpass transects the simulated plume of the Greenland fires directly. Notice that the simulated plume also agrees very well with the smoke as seen in NASA's EOSDIS picture (Fig. 6a). The vertical distribution of simulated BC as a function of longitude is illustrated in Fig. 6d. It corresponds very well to the vertical distribution of aerosols observed by CALIOP (Fig. 6b). In particular, the smoke resides at altitudes below 1.5 km and at exactly the same location both in the simulations and observations.
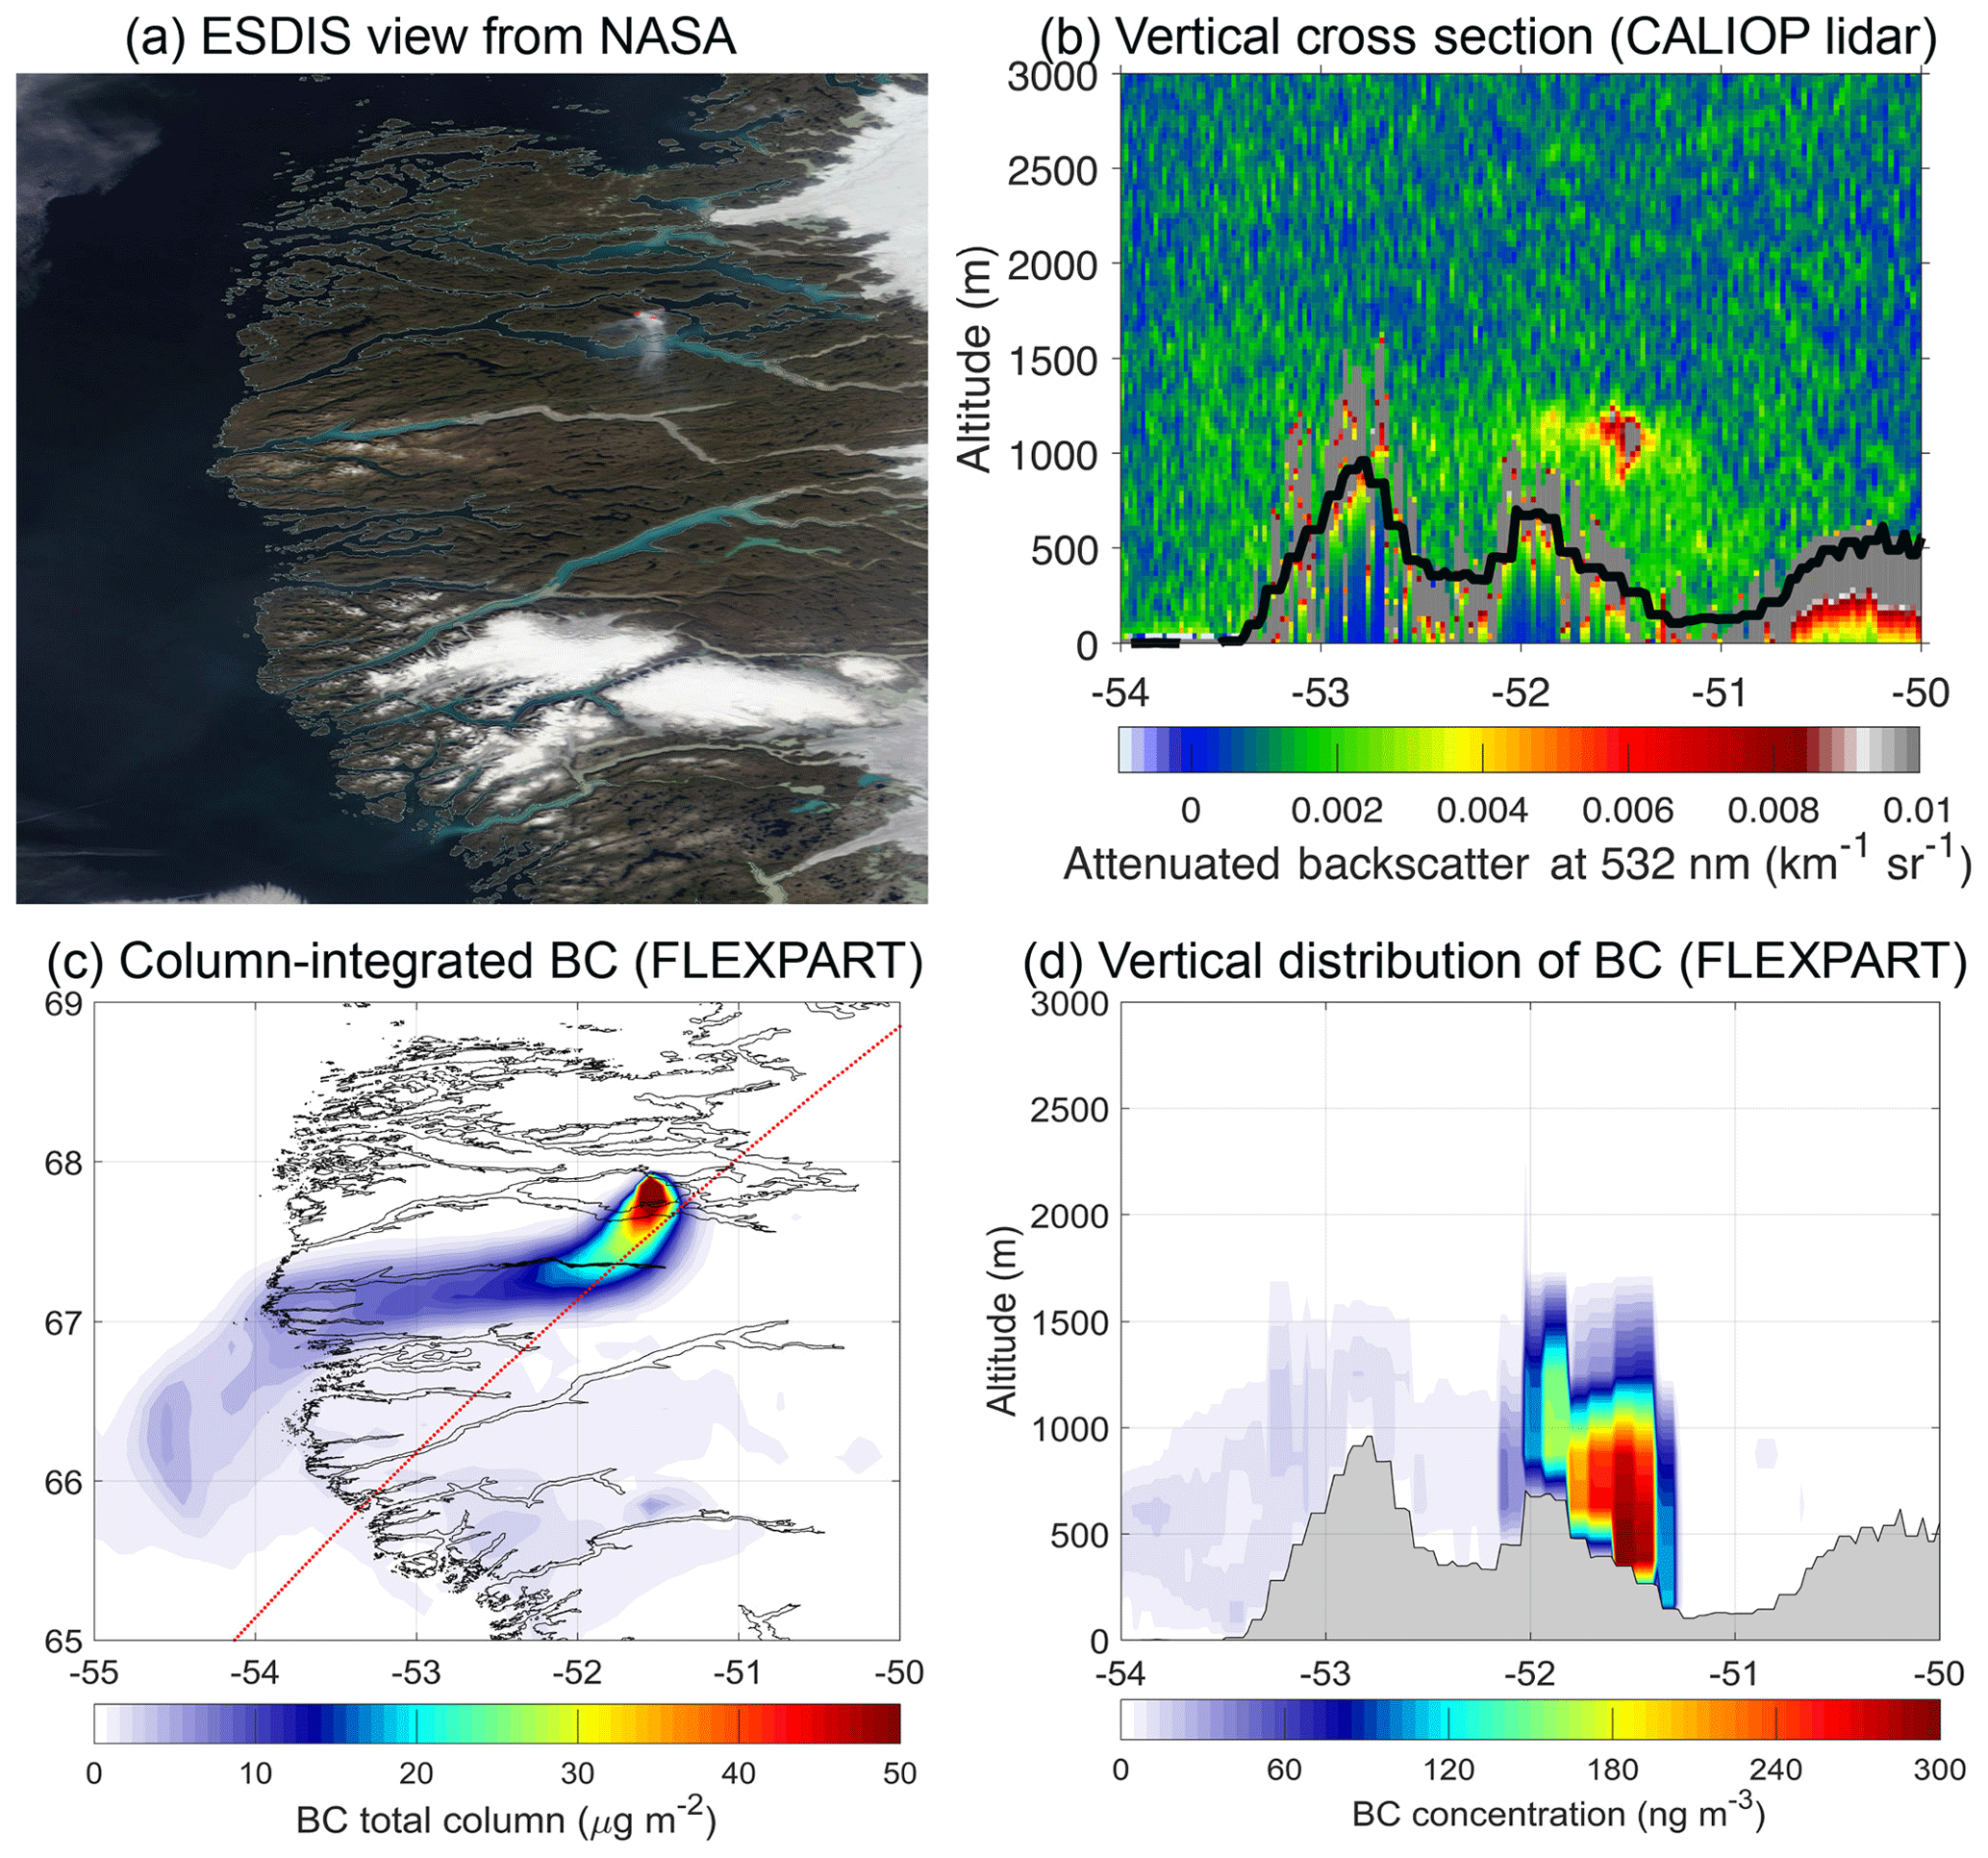
Figure 6(a) Worldview application from the NASA Goddard Space Flight Center Earth Science Data and Information System (EOSDIS) project on 14 August 2017. (b) Vertical cross section along satellite's route (red line in c) of total attenuated backscatter at a wavelength of 532 nm obtained from the CALIOP lidar on 14 August 2017 at 06:00 UTC (black line denotes the orography of the area). (c) Column-integrated BC concentration simulated with FLEXPART (red line shows the path of the satellite). (d) Vertical distribution of BC concentrations with longitude as seen with FLEXPART (grey area denotes the orography of the area).
4.2 Instantaneous radiative forcing and albedo effects
BOA IRF due to (a) BC-only, (b) BC and BrC and (c) BC and BrC when all OC was assumed to be BrC (extreme scenario) for noon on 31 August 2017 is depicted in Fig. 7a–c. This day is shown because almost all the aerosols emitted by the fires had been deposited, thus giving a high IRF via albedo reduction due to snow contamination. The IRF is the largest over ice close to the fire site and at locations where relatively large amounts of BC and BrC were deposited. For BC-only, the maximum BOA (TOA) IRF is 0.63 W m−2 (0.59 W m−2), and the average is 0.03 W m−2 (0.03 W m−2). Including BrC slightly increases the maximum BOA (TOA) IRF to 0.65 W m−2 (0.61 W m−2), while the change in the average IRF values is negligible. For the extreme BrC scenario, the maximum BOA (TOA) IRF is 0.77 W m−2 (0.71 W m−2) and the average is 0.04 W m−2 (0.06 W m−2). So, including BrC in our analysis increases BOA IRF by only 20 %, even for the extreme scenario.
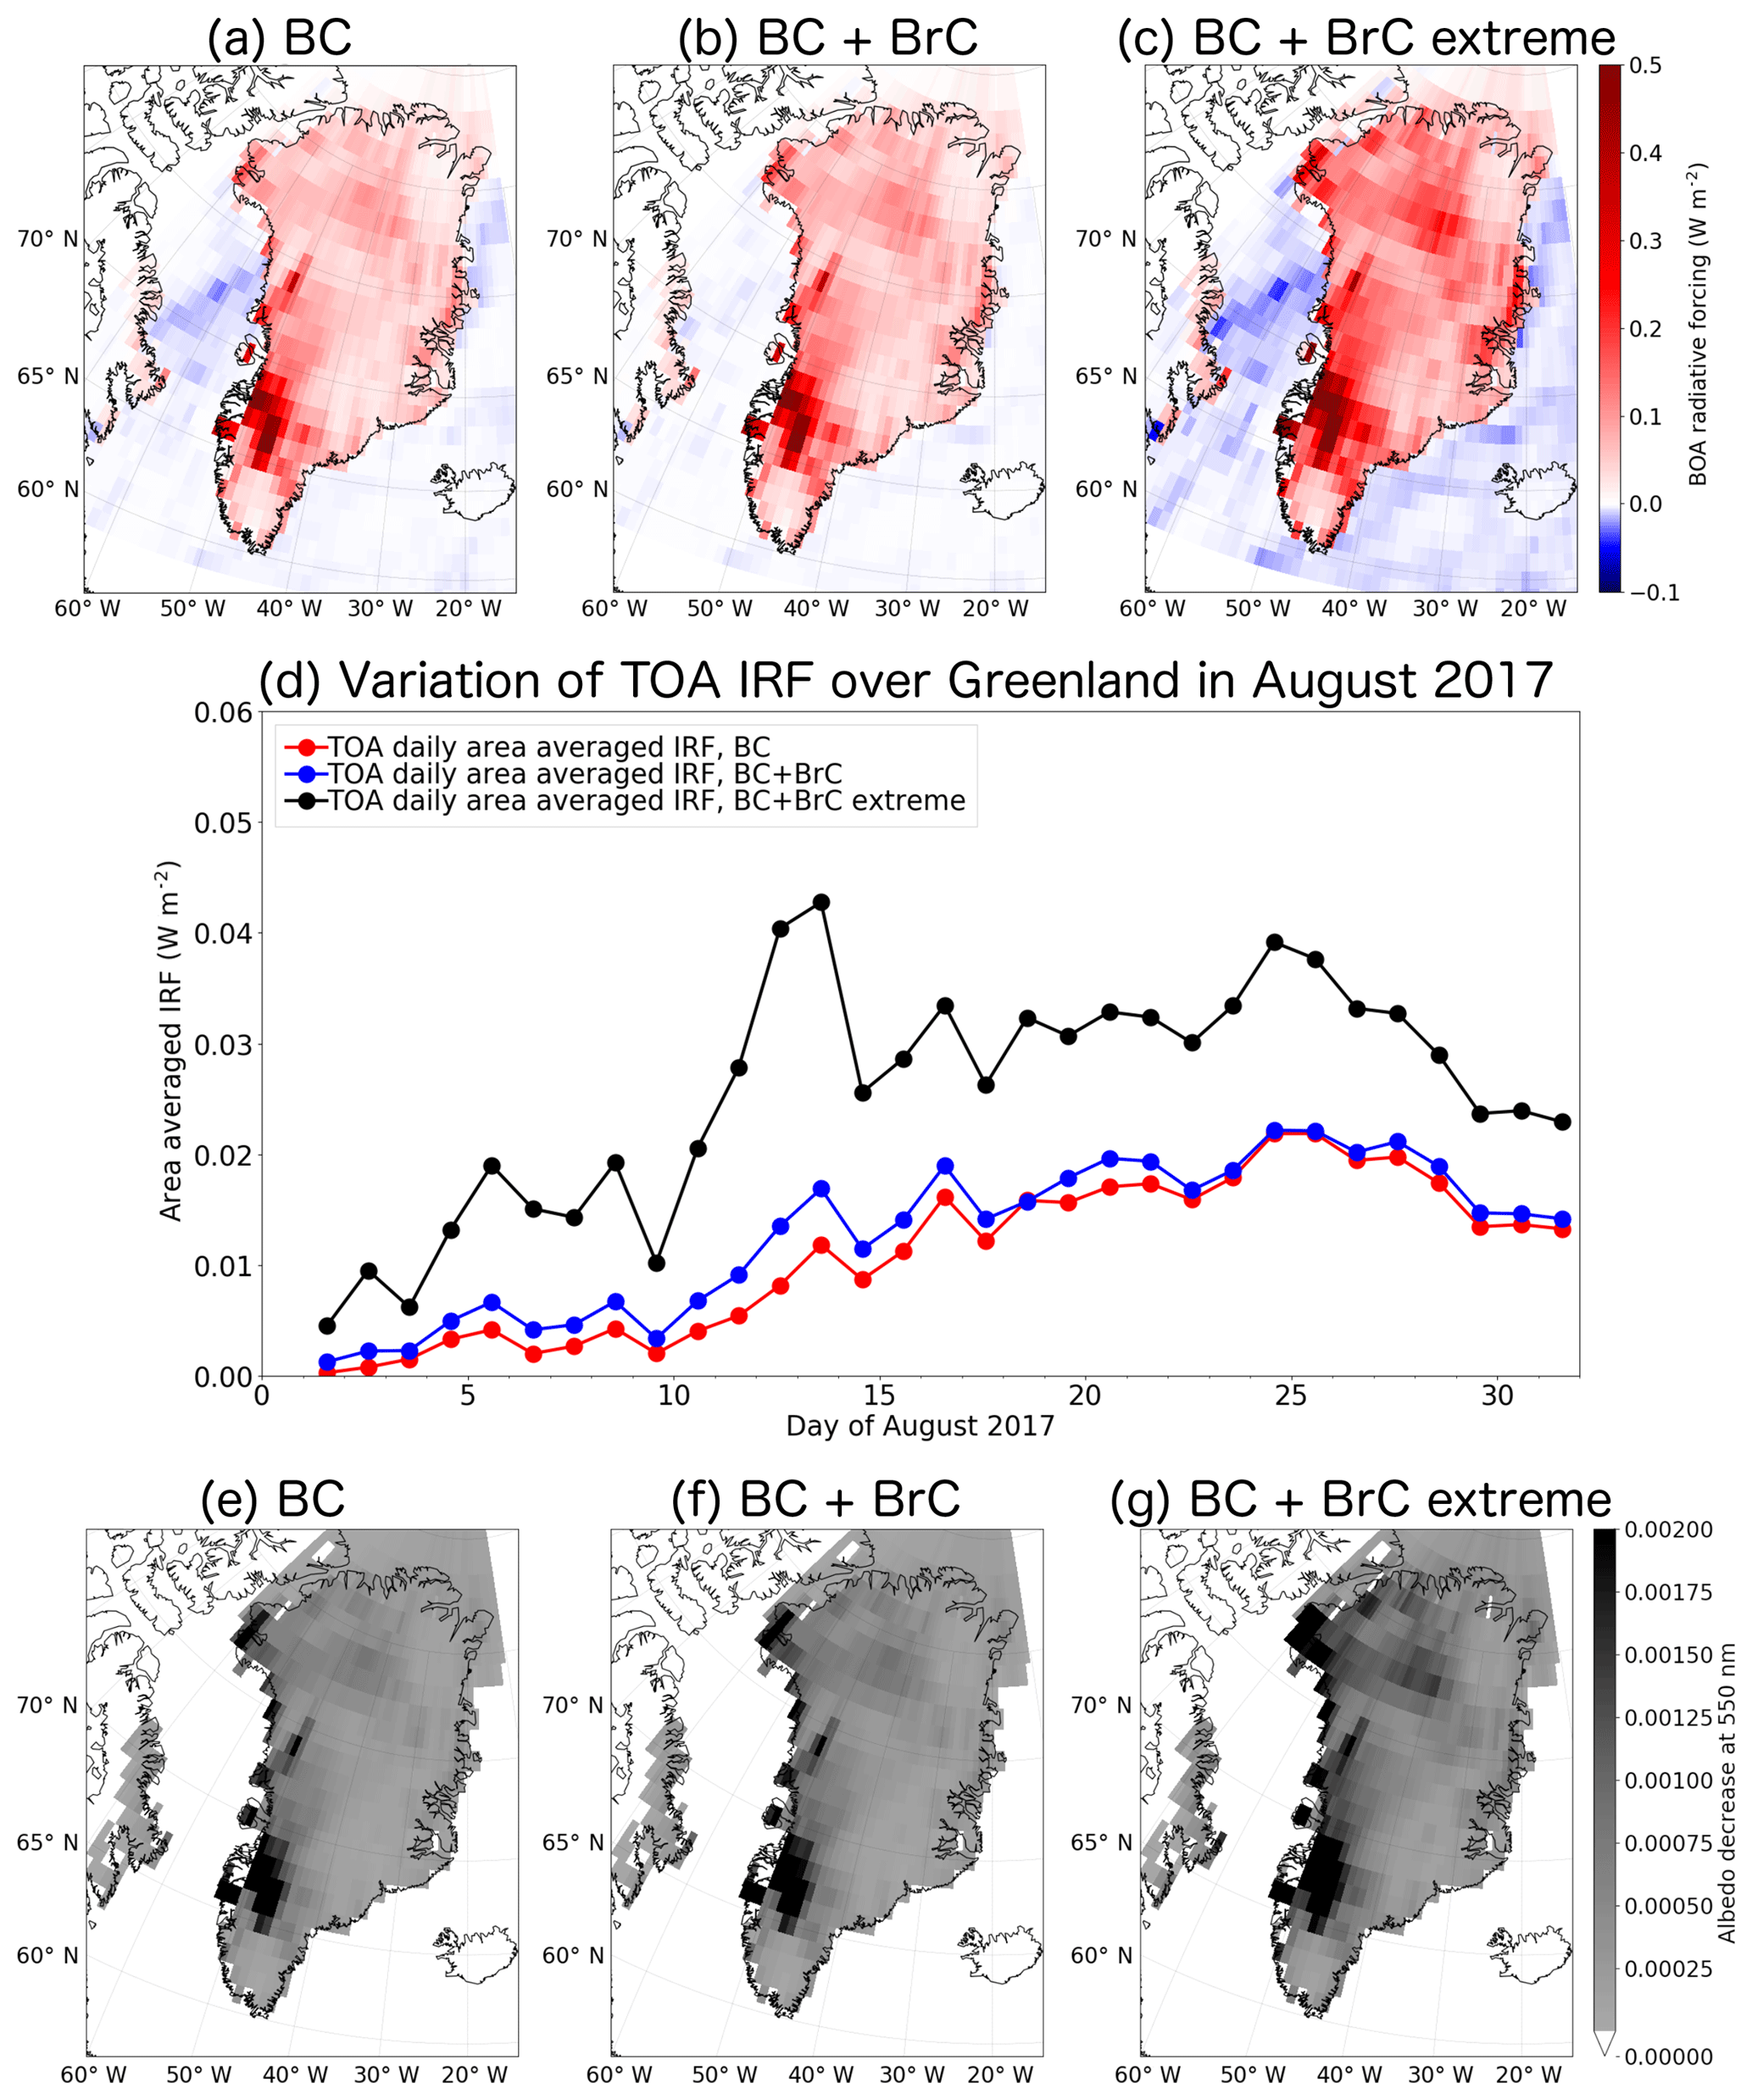
Figure 7The instantaneous direct BOA RF due to (a) BC-only, (b) BC and BrC and (c) BC and BrC when OC was assumed to be all BrC (extreme case) from the Greenland fire for cloudy conditions on 31 August 2017. (d) Daily variation of the TOA IRF over Greenland in August 2017 for the three studied scenarios. Albedo reduction at 550 nm due to (e) BC-only, (f) BC and BrC and (g) BC and BrC when OC was assumed to be all BrC (extreme case). Note that the maximum albedo change due to deposited smoke is 0.00585 (BC-only), 0.00590 (BC+BrC) and 0.00670 (BC+BrC extreme).
The IRF depends on the optical properties of the smoke from the fire, which are not known. Hence, a sensitivity analysis was performed in which the single scattering albedo (SSA) was perturbed in contrast to a “medium case” (Fig. S8a) that was adopted from the SNICAR model (Flanner et al., 2007, 2009) and was used for the discussion in the previous paragraph. To estimate the uncertainty due to the choice of BC optical properties, additional calculations were made by scaling the SSA (red solid lines in Fig. S8a). The choices of these scaled SSA values were based on the SSA reported for various modified combustion efficiencies (MCEs) by Pokhrel et al. (2016).
Pokhrel et al. (2016) reported an MCE of 0.9 for peatland. As such, our adopted SSA may be considered low (compare black solid line and red line with upward-pointing triangles). Figure S8b shows the IRF as BC is deposited for the three cases. It suggests that the IRF ranges between 40 % and 130 % of our above-assumed medium-case values for realistic variation of the aerosol optical properties.
Figure 7d depicts the temporal behavior of the cloudy TOA IRF averaged over Greenland (daily averages) for BC-only (red line), for BC and BrC (blue line) and for BC and BrC, when all OC is assumed to be BrC (black line; extreme case scenario). The daily averaged IRF is seen to increase as the plume from the fires spreads out and starts to decline after the fires were extinguished at the end of the month. The fact that the reduction towards the end of August is relatively slow is caused by the effect of the albedo reduction, which persists until clean snow covers the polluted snow. Overall, albedo reduction dominates the total IRF averaged over Greenland for the period of study, contributing between 85 % (in the beginning of the study period) and 99 % (at the end of the study period) and increasing in relative importance with time as atmospheric BC and BrC are removed. The largest IRF differences between the BC-only case IRF and the two BC+BrC cases occur when there is still smoke in the air, and the lowest IRF differences occur after 15 August. This indicates that BrC is most important for the IRF when it is airborne, even in the extreme scenario. However, for the latter, the impact is also large after 15 August due to a further albedo decrease of about 0.001 compared to the case where only BC was considered.
According to Hansen et al. (2005) the TOA IRF of BC approximates the adjusted radiative forcing (RF) as reported by Myhre et al. (2013). In their Table 8.4, Myhre et al. (2013) estimated the global averaged RF due to BC between the years 1750 and 2011 to be +0.40 (+0.05 to +0.80) W m−2. Skeie et al. (2011) estimated a global mean radiative forcing of 0.35 W m−2 due to fossil fuel and biofuel increases between 1750 and 2000. For Greenland, Skeie et al. (2011) found the RF to be less than about 0.2 W m−2. This number may be compared to our area averaged IRF estimate due to the Greenland fire. For cloudy conditions the TOA IRF over Greenland due to the Greenland fires is about a factor of 4 to 10 smaller compared with the RF over Greenland due to BC from all global anthropogenic sources reported in Skeie et al. (2011).
The albedo reduction at 550 nm for the three scenarios (BC-only, BC+BrC and BC+BrC extreme) is shown in Fig. 7e–g. The maximum albedo change was about 0.006 when only BC was considered. Adding BrC from the most extreme scenario, the maximum albedo change was calculated to be 0.007. This albedo change has an impact on IRF, but it is too small to be measured by satellites. For example, MODIS albedo estimates have been compared to in situ albedo measurements in Greenland by Stroeve et al. (2005). They found that the root mean square error between MODIS and in situ albedo values was ±0.04 for high-quality flagged MODIS albedo retrievals. Unmanned aerial vehicle (UAV) measurements over Greenland made by Burkhart et al. (2017) have uncertainties of similar magnitude. Also, Polashenski et al. (2015) reported that the albedo reduction due to aerosol impurities on the Greenland ice sheet in the 2012–2014 period is relatively small (mean 0.003), though episodic aerosol deposition events can reduce albedo by 0.01–0.02. The albedo changes due to BC and BrC from the Greenland fires are generally an order of magnitude smaller (Fig. 7e–g) and thus too small to be detected by present UAV and satellite instruments and retrieval methods (Warren, 2013).
We studied atmospheric transport, deposition and impact of BC, BrC and OC emitted as a result of unusual open fires burning in Greenland between 31 July and 21 August 2017. Our conclusions can be summarized below.
-
The fires burned on peatlands that became vulnerable by permafrost thawing. The region where the fires burned was identified previously as being susceptible to permafrost melting; however, large-scale melting was expected to occur only towards the end of the 21st century. The 2017 fires show that at least in some locations substantial permafrost thawing is already occurring now.
-
The total area burned was about 2345 ha. We estimate that the fires consumed a fuel amount of about 117 kt C and emitted about 23.5 t of BC and 731 t of OC, including 141 t of BrC.
-
The Greenland fires were small compared to fires burning at the same time in North America and Eurasia, but a large fraction of BC, OC and BrC emissions (30 %) was deposited on the Greenland ice sheet.
-
Measurements of aerosol optical depth at three sites in western Greenland in August 2017 were strongly influenced by forest fires in Canada burning at the same time, but the Greenland fires had an observable impact, doubling the column-integrated BC concentrations at the closest station.
-
A comparison of the simulated BC releases in FLEXPART with the vertical cross section of total attenuated backscatter (at 532 nm) from CALIOP lidar showed that the spatiotemporal evolution and particularly the top height of the plume was captured by the model.
-
We estimate that the maximum albedo change due to the BC deposition from the Greenland fires to be about 0.006, whereas adding deposited BrC increases albedo to 0.007 at maximum, which is too small to be measured. The average instantaneous BOA radiative forcing over Greenland at noon on 31 August was between 0.03 and 0.04 W m−2 for the three scenarios (BC-only, BC+BrC and BC+BrC extreme), with locally occurring maxima of 0.63, 0.65 and 0.77 W m−2, respectively. The average value when only BC was considered is up to an order of magnitude smaller than the radiative forcing due to BC from other sources.
-
We conclude that the fires burning in Greenland in the summer of 2017 had a small impact on the Greenland ice sheet, causing almost negligible extra radiative forcing. This was due to the – in a global context – still rather small size of the fires.
The very large fraction of the emissions deposited on the Greenland ice sheet (30 %) makes these fires very efficient climate forcers on a per unit emission basis. Thus, while the fires in 2017 were still relatively small on a global scale, if the expected future warming of the Arctic (IPCC, 2013) produces more and larger fires in Greenland (Keegan et al., 2014), this could indeed cause substantial albedo changes and thus contribute to accelerated melting of the Greenland ice sheet.
All data used for the present publication can be obtained from the corresponding author upon request.
The supplement related to this article is available online at: https://doi.org/10.5194/acp-19-1393-2019-supplement.
NE performed the simulations and analyses, wrote the paper and coordinated the paper. AK performed the radiation calculations and wrote parts of the paper. VM and SZ performed GIS analysis for the burned area calculations. RP made all the runs for the injection height calculations using the PRMv2 model. KS analyzed satellite data for AOD and CALIOP. SE and AS coordinated and commented on the manuscript. All authors contributed to the final version of the paper.
The authors declare that they have no conflict of interest.
This study was partly supported by the Arctic Monitoring and Assessment
Programme (AMAP) and was conducted as part of the Nordic Centre of Excellence
eSTICC (Nordforsk 57001). We acknowledge the use of imagery from the NASA
Worldview application
(https://worldview.earthdata.nasa.gov/, last acces: 20 December 2018) operated by the NASA Goddard Space Flight Center Earth Science
Data and Information System (EOSDIS) project. We thank Brent Holben and local
site managers for their effort in establishing and maintaining the AERONET
sites used in this investigation. We thank NASA and CNES engineers and scientists
for making CALIOP data available. The lidar data were downloaded from the
ICARE Data and Service Center.
Edited by: Alma
Hodzic
Reviewed by: three anonymous referees
Abdalati, W. and Steffen, K.: Greenland Ice Sheet melt extent: 1979–1999, J. Geophys. Res.-Atmos., 106, 33983–33988, https://doi.org/10.1029/2001JD900181, 2001.
Akagi, S. K., Yokelson, R. J., Wiedinmyer, C., Alvarado, M. J., Reid, J. S., Karl, T., Crounse, J. D., and Wennberg, P. O.: Emission factors for open and domestic biomass burning for use in atmospheric models, Atmos. Chem. Phys., 11, 4039–4072, https://doi.org/10.5194/acp-11-4039-2011, 2011.
AMAP: Snow, Water, Ice and Permafrost. Summary for Policy-makers, Arctic Monitoring and Assessment Programme (AMAP), Oslo, Norway, available at: https://www.amap.no/documents/doc/Snow-Water-Ice-and-Permafrost.-Summary-for-Policy-makers/1532, last access: 27 November 2017.
Anderson, C. H., Dibb, J. E., Griffin, R. J., Hagler, G. S. W., and Bergin, M. H.: Atmospheric water-soluble organic carbon measurements at Summit, Greenland, Atmos. Environ., 42, 5612–5621, https://doi.org/10.1016/j.atmosenv.2008.03.006, 2008.
Andreae, M. O. and Gelencsér, A.: Black carbon or brown carbon? The nature of light-absorbing carbonaceous aerosols, Atmos. Chem. Phys., 6, 3131–3148, https://doi.org/10.5194/acp-6-3131-2006, 2006.
Antony, R., Mahalinganathan, K., Thamban, M., and Nair, S.: Organic carbon in antarctic snow: Spatial trends and possible sources, Environ. Sci. Technol., 45, 9944–9950, https://doi.org/10.1021/es203512t, 2011.
Aurell, J. and Gullett, B. K.: Emission factors from aerial and ground measurements of field and laboratory forest burns in the southeastern U.S.: PM2.5, black and brown carbon, VOC, and PCDD/PCDF, Environ. Sci. Technol., 47, 8443–8452, https://doi.org/10.1021/es402101k, 2013.
BBC News: “Unusual” Greenland wildfires linked to peat, available at: http://www.bbc.com/news/science-environment-40877099, last access: 6 September 2017.
Bellouin, N. and Haywood, J.: Aerosols: Climatology of Tropospheric Aerosols, 2nd Edn., Elsevier, 2014.
Benscoter, B. W. and Wieder, R. K.: Variability in organic matter lost by combustion in a boreal bog during the 2001 Chisholm fire, Can. J. Forest Res., 33, 2509–2513, https://doi.org/10.1139/x03-162, 2003.
Bond, T. C.: Spectral dependence of visible light absorption by carbonaceous particles emitted from coal combustion, Geophys. Res. Lett., 21, 4075–4078, https://doi.org/10.1029/2001GL013652, 2001.
Bond, T. C., Doherty, S. J., Fahey, D. W., Forster, P. M., Berntsen, T., Deangelo, B. J., Flanner, M. G., Ghan, S., Kärcher, B., Koch, D., Kinne, S., Kondo, Y., Quinn, P. K., Sarofim, M. C., Schultz, M. G., Schulz, M., Venkataraman, C., Zhang, H., Zhang, S., Bellouin, N., Guttikunda, S. K., Hopke, P. K., Jacobson, M. Z., Kaiser, J. W., Klimont, Z., Lohmann, U., Schwarz, J. P., Shindell, D., Storelvmo, T., Warren, S. G., and Zender, C. S.: Bounding the role of black carbon in the climate system: A scientific assessment, J. Geophys. Res.-Atmos., 118, 5380–5552, https://doi.org/10.1002/jgrd.50171, 2013.
Buras, R., Dowling, T., and Emde, C.: New secondary-scattering correction in DISORT with increased efficiency for forward scattering, J. Quant. Spectrosc. Ra., 112, 2028–2034, https://doi.org/10.1016/j.jqsrt.2011.03.019, 2011.
Burkhart, J. F., Kylling, A., Schaaf, C. B., Wang, Z., Bogren, W., Storvold, R., Solbø, S., Pedersen, C. A., and Gerland, S.: Unmanned aerial system nadir reflectance and MODIS nadir BRDF-adjusted surface reflectances intercompared over Greenland, The Cryosphere, 11, 1575–1589, https://doi.org/10.5194/tc-11-1575-2017, 2017.
Chakrabarty, R. K., Moosmüller, H., Chen, L.-W. A., Lewis, K., Arnott, W. P., Mazzoleni, C., Dubey, M. K., Wold, C. E., Hao, W. M., and Kreidenweis, S. M.: Brown carbon in tar balls from smoldering biomass combustion, Atmos. Chem. Phys., 10, 6363–6370, https://doi.org/10.5194/acp-10-6363-2010, 2010.
Chavez, P. S.: An improved dark-object subtraction technique for atmospheric scattering correction of multispectral data, Remote Sens. Environ., 24, 459–479, https://doi.org/10.1016/0034-4257(88)90019-3, 1988.
Cofer III, W. R., Levine, J. S., Winstead, E. L., and Stocks, B. J.: New estimates of nitrous oxide emissions from biomass burning, Nature, 349, 689–691, https://doi.org/10.1038/349689a0, 1991.
Conny, J. and Slater, J.: Black carbon and organic carbon in aerosol particles from crown fires in the Canadian boreal forest, J. Geophys. Res., 107, 4116, https://doi.org/10.1029/2001JD001528, 2002.
Daanen, R. P., Ingeman-Nielsen, T., Marchenko, S. S., Romanovsky, V. E., Foged, N., Stendel, M., Christensen, J. H., and Hornbech Svendsen, K.: Permafrost degradation risk zone assessment using simulation models, The Cryosphere, 5, 1043–1056, https://doi.org/10.5194/tc-5-1043-2011, 2011.
Dahlback, A. and Stamnes, K.: A new spherical model for computing the radiation field available for photolysis and heating at twilight, Planet. Space Sci., 39, 671–683, https://doi.org/10.1016/0032-0633(91)90061-E, 1991.
Davies, G. M., Gray, A., Rein, G., and Legg, C. J.: Peat consumption and carbon loss due to smouldering wildfire in a temperate peatland, Forest Ecol. Manag., 308, 169–177, https://doi.org/10.1016/j.foreco.2013.07.051, 2013.
Dibb, J. E., Arsenault, M., Peterson, M. C., and Honrath, R. E.: Fast nitrogen oxide photochemistry in Summit, Greenland snow, Atmos. Environ., 36, 2501–2511, https://doi.org/10.1016/S1352-2310(02)00130-9, 2002.
Doherty, S. J., Warren, S. G., Grenfell, T. C., Clarke, A. D., and Brandt, R. E.: Light-absorbing impurities in Arctic snow, Atmos. Chem. Phys., 10, 11647–11680, https://doi.org/10.5194/acp-10-11647-2010, 2010.
Drysdale, D.: An Introduction to Fire Dynamics, 3rd Edn., John Wiley & Sons, Ltd., 2011.
Emde, C., Buras-Schnell, R., Kylling, A., Mayer, B., Gasteiger, J., Hamann, U., Kylling, J., Richter, B., Pause, C., Dowling, T., and Bugliaro, L.: The libRadtran software package for radiative transfer calculations (version 2.0.1), Geosci. Model Dev., 9, 1647–1672, https://doi.org/10.5194/gmd-9-1647-2016, 2016.
Escuin, S., Navarro, R., and Fernández, P.: Fire severity assessment by using NBR (Normalized Burn Ratio) and NDVI (Normalized Difference Vegetation Index) derived from LANDSAT TM/ETM images, Int. J. Remote Sens., 29, 1053–1073, https://doi.org/10.1080/01431160701281072, 2008.
Evangeliou, N., Balkanski, Y., Cozic, A., Hao, W. M., and Møller, A. P.: Wildfires in Chernobyl-contaminated forests and risks to the population and the environment: A new nuclear disaster about to happen?, Environ. Int., 73, 346–358, https://doi.org/10.1016/j.envint.2014.08.012, 2014.
Evangeliou, N., Balkanski, Y., Cozic, A., Hao, W. M., Mouillot, F., Thonicke, K., Paugam, R., Zibtsev, S., Mousseau, T. A., Wang, R., Poulter, B., Petkov, A., Yue, C., Cadule, P., Koffi, B., Kaiser, J. W., Møller, A. P., and Classen, A. T.: Fire evolution in the radioactive forests of Ukraine and Belarus: Future risks for the population and the environment, Ecol. Monogr., 85, 49–72, https://doi.org/10.1890/14-1227.1, 2015.
Evangeliou, N., Zibtsev, S., Myroniuk, V., Zhurba, M., Hamburger, T., Stohl, A., Balkanski, Y., Paugam, R., Mousseau, T. A., Møller, A. P., and Kireev, S. I.: Resuspension and atmospheric transport of radionuclides due to wildfires near the Chernobyl Nuclear Power Plant in 2015: An impact assessment., Sci. Rep.-UK, 6, 26062, https://doi.org/10.1038/srep26062, 2016.
Fang, X., Thompson, R. L., Saito, T., Yokouchi, Y., Kim, J., Li, S., Kim, K. R., Park, S., Graziosi, F., and Stohl, A.: Sulfur hexafluoride (SF6) emissions in East Asia determined by inverse modeling, Atmos. Chem. Phys., 14, 4779–4791, https://doi.org/10.5194/acp-14-4779-2014, 2014.
Feng, Y., Ramanathan, V., and Kotamarthi, V. R.: Brown carbon: a significant atmospheric absorber of solar radiation?, Atmos. Chem. Phys., 13, 8607–8621, https://doi.org/10.5194/acp-13-8607-2013, 2013.
Ferguson, S. A., Collins, R. L., Ruthford, J., and Fukuda, M.: Vertical distribution of nighttime smoke following a wildland biomass fire in boreal Alaska, J. Geophys. Res., 108, 4743, https://doi.org/10.1029/2002JD003324, https://doi.org/10.1029/2002JD003324, 2003.
Fernandez Anez, N., Garcia Torrent, J., Medic Pejic, L. and Grima Olmedo, C.: Detection of incipient self-ignition process in solid fuels through gas emissions methodology, J. Loss Prevent. Proc., 36, 343–351, https://doi.org/10.1016/j.jlp.2015.02.010, 2015.
Flanner, M. G., Zender, C. S., Randerson, J. T., and Rasch, P. J.: Present-day climate forcing and response from black carbon in snow, J. Geophys. Res.-Atmos., 112, 1–17, https://doi.org/10.1029/2006JD008003, 2007.
Flanner, M. G., Zender, C. S., Hess, P. G., Mahowald, N. M., Painter, T. H., Ramanathan, V., and Rasch, P. J.: Springtime warming and reduced snow cover from carbonaceous particles, Atmos. Chem. Phys., 9, 2481–2497, https://doi.org/10.5194/acp-9-2481-2009, 2009.
Forster, C., Wandinger, U., Wotawa, G., James, P., Mattis, I., Althausen, D., Simmonds, P., O'Doherty, S., Jennings, S. G., Kleefeld, C., Schneider, J., Trickl, T., Kreipl, S., Jäger, H., and Stohl, A.: Transport of boreal forest fire emissions from Canada to Europe, J. Geophys. Res., 106, 22887, https://doi.org/10.1029/2001JD900115, 2001.
Forster, C., Stohl, A., and Seibert, P.: Parameterization of convective transport in a Lagrangian particle dispersion model and its evaluation, J. Appl. Meteorol. Clim., 46, 403–422, https://doi.org/10.1175/JAM2470.1, 2007.
Freitas, S. R., Longo, K. M., Chatfield, R., Latham, D., Silva Dias, M. A. F., Andreae, M. O., Prins, E., Santos, J. C., Gielow, R., and Carvalho Jr., J. A.: Including the sub-grid scale plume rise of vegetation fires in low resolution atmospheric transport models, Atmos. Chem. Phys., 7, 3385–3398, https://doi.org/10.5194/acp-7-3385-2007, 2007.
Freitas, S. R., Longo, K. M., Trentmann, J., and Latham, D.: Technical Note: Sensitivity of 1-D smoke plume rise models to the inclusion of environmental wind drag, Atmos. Chem. Phys., 10, 585–594, https://doi.org/10.5194/acp-10-585-2010, 2010.
French, N., Kasischke, E., Hall, R., Murphy, K., Verbyla, D., Hoy, E., and Allen, J.: Using Landsat data to assess fire and burn severity in the North American boreal forest region: an overview and summary of results, Int. J. Wildland Fire, 17, 443–462, https://doi.org/10.1071/WF08007, 2008.
Fromm, M., Bevilacqua, R., Servranckx, R., Rosen, J., Thayer, J. P., Herman, J., and Larko, D.: Pyro-cumulonimbus injection of smoke to the stratosphere: Observations and impact of a super blowup in northwestern Canada on 3–4 August 1998, J. Geophys. Res.-Atmos., 110, 1–17, https://doi.org/10.1029/2004JD005350, 2005.
Giglio, L., Descloitres, J., Justice, C. O., and Kaufman, Y. J.: An enhanced contextual fire detection algorithm for MODIS, Remote Sens. Environ., 87, 273–282, https://doi.org/10.1016/S0034-4257(03)00184-6, 2003.
Grannas, A. M., Shepson, P. B., and Filley, T. R.: Photochemistry and nature of organic matter in Arctic and Antarctic snow, Global Biogeochem. Cy., 18, GB1006, https://doi.org/10.1029/2003GB002133, 2004.
Grythe, H., Kristiansen, N. I., Groot Zwaaftink, C. D., Eckhardt, S., Ström, J., Tunved, P., Krejci, R., and Stohl, A.: A new aerosol wet removal scheme for the Lagrangian particle model FLEXPART v10, Geosci. Model Dev., 10, 1447–1466, https://doi.org/10.5194/gmd-10-1447-2017, 2017.
Hansen, J. and Nazarenko, L.: Soot climate forcing via snow and ice albedos, P. Natl. Acad. Sci. USA, 101, 423–428, https://doi.org/10.1073/pnas.2237157100, 2004.
Hansen, J., Sato, M., Ruedy, R., Nazarenko, L., Lacis, A., Schmidt, G. A., Russell, G., Aleinov, I., Bauer, M., Bauer, S., Bell, N., Cairns, B., Canuto, V., Chandler, M., Cheng, Y., Del Genio, A., Faluvegi, G., Fleming, E., Friend, A., Hall, T., Jackman, C., Kelley, M., Kiang, N., Koch, D., Lean, J., Lerner, J., Lo, K., Menon, S., Miller, R., Minnis, P., Novakov, T., Oinas, V., Perlwitz, J., Perlwitz, J., Rind, D., Romanou, A., Shindell, D., Stone, P., Sun, S., Tausnev, N., Thresher, D., Wielicki, B., Wong, T., Yao, M., and Zhang, S.: Efficacy of climate forcings, J. Geophys. Res.-Atmos., 110, 1–45, https://doi.org/10.1029/2005JD005776, 2005.
Hao, W. M. and Ward, D. E.: Methane production from global biomass burning, J. Geophys. Res.-Atmos., 98, 20657–20661, https://doi.org/10.1029/93JD01908, 1993.
Hao, W. M., Petkov, A., Nordgren, B. L., Corley, R. E., Silverstein, R. P., Urbanski, S. P., Evangeliou, N., Balkanski, Y., and Kinder, B. L.: Daily black carbon emissions from fires in northern Eurasia for 2002–2015, Geosci. Model Dev., 9, 4461–4474, https://doi.org/10.5194/gmd-9-4461-2016, 2016.
Holben, B. N.: Characteristics of maximum-value composite images from temporal AVHRR data, Int. J. Remote Sens., 7, 1417–1434, https://doi.org/10.1080/01431168608948945, 1986.
Holben, B. N., Eck, T. F., Slutsker, I., Tanré, D., Buis, J. P., Setzer, A., Vermote, E., Reagan, J. A., Kaufman, Y. J., Nakajima, T., Lavenu, F., Jankowiak, I., and Smirnov, A.: AERONET – A Federated Instrument Network and Data Archive for Aerosol Characterization, Remote Sens. Environ., 66, 1–16, https://doi.org/10.1016/S0034-4257(98)00031-5, 1998.
Hosseini, S., Li, Q., Cocker, D., Weise, D., Miller, A., Shrivastava, M., Miller, J. W., Mahalingam, S., Princevac, M., and Jung, H.: Particle size distributions from laboratory-scale biomass fires using fast response instruments, Atmos. Chem. Phys., 10, 8065–8076, https://doi.org/10.5194/acp-10-8065-2010, 2010.
Hu, Y., Fernandez-Anez, N., Smith, T. E. L., and Rein, G.: Review of emissions from smouldering peat fires and their contribution to regional haze episodes, Int. J. Wildland Fire, 27, 293–312, https://doi.org/10.1071/WF17084, 2018.
IPCC: Climate Change 2013: The Physical Science Basis. Contribution to the Fifth Assessment Report of the Intergovernmental Panel on Climate Change, edited by: Stocker, T. F., Qin, D., Plattner, G.-K., Tignor, M. M. B., Allen, S. K., Boschung, J., Nauels, A., Xia, Y., Bex, V., and Midgley, P. M., Cambridge University Press, 2013.
Jacobson, M. Z.: Strong radiative heating due to the mixing state of black carbon in atmospheric aerosols, Nature, 409, 695–697, https://doi.org/10.1038/35055518, 2001.
Jedrzejek, B., Drees, B., Daniëls, F. J. A., and Hölzel, N.: Vegetation pattern of mountains in West Greenland – a baseline for long-term surveillance of global warming impacts, Plant Ecol. Divers., 6, 405–422, https://doi.org/10.1080/17550874.2013.802049, 2013.
Jo, D. S., Park, R. J., Lee, S., Kim, S.-W., and Zhang, X.: A global simulation of brown carbon: implications for photochemistry and direct radiative effect, Atmos. Chem. Phys., 16, 3413–3432, https://doi.org/10.5194/acp-16-3413-2016, 2016.
Justice, C. O., Giglio, L., Korontzi, S., Owens, J., Morisette, J. T., Roy, D., Descloitres, J., Alleaume, S., Petitcolin, F., and Kaufman, Y.: The MODIS fire products, Remote Sens. Environ., 83, 244–262, https://doi.org/10.1016/S0034-4257(02)00076-7, 2002.
Kaiser, J. W., Heil, A., Andreae, M. O., Benedetti, A., Chubarova, N., Jones, L., Morcrette, J.-J., Razinger, M., Schultz, M. G., Suttie, M., and van der Werf, G. R.: Biomass burning emissions estimated with a global fire assimilation system based on observed fire radiative power, Biogeosciences, 9, 527–554, https://doi.org/10.5194/bg-9-527-2012, 2012.
Kato, S., Ackerman, T. P., Mather, J. H., and Clothiaux, E. E.: The k-distribution method and correlated-k approximation for a shortwave radiative transfer model, J. Quant. Spectrosc. Ra., 62, 109–121, https://doi.org/10.1016/S0022-4073(98)00075-2, 1999.
Keegan, K. M., Albert, M. R., Mcconnell, J. R., and Baker, I.: Climate change and forest fires synergistically drive widespread melt events of the Greenland Ice Sheet, P. Natl. Acad. Sci. USA, 111, 7964–7967, https://doi.org/10.1073/pnas.1405397111, 2014.
Key, C. H. and Benson, N. C.: Landscape assessment: Sampling and analysis methods, USDA For. Serv. Gen. Tech. Rep. RMRS-GTR-164-CD, June, 1–55, https://doi.org/10.1002/app.1994.070541203, 2006.
Klimont, Z., Kupiainen, K., Heyes, C., Purohit, P., Cofala, J., Rafaj, P., Borken-Kleefeld, J., and Schöpp, W.: Global anthropogenic emissions of particulate matter including black carbon, Atmos. Chem. Phys., 17, 8681–8723, https://doi.org/10.5194/acp-17-8681-2017, 2017.
Lavoie, C. and Pellerin, S.: Fires in temperate peatlands (southern Quebec): past and recent trends, Can. J. Botany, 85, 263–272, https://doi.org/10.1139/B07-012, 2007.
Legrand, M., Preunkert, S., Jourdain, B., Guilhermet, J., Faïn, X., Alekhina, I., and Petit, J. R.: Water-soluble organic carbon in snow and ice deposited at Alpine, Greenland, and Antarctic sites: a critical review of available data and their atmospheric relevance, Clim. Past, 9, 2195–2211, https://doi.org/10.5194/cp-9-2195-2013, 2013.
Legrand, M., McConnell, J., Fischer, H., Wolff, E. W., Preunkert, S., Arienzo, M., Chellman, N., Leuenberger, D., Maselli, O., Place, P., Sigl, M., Schüpbach, S., and Flannigan, M.: Boreal fire records in Northern Hemisphere ice cores: a review, Clim. Past, 12, 2033–2059, https://doi.org/10.5194/cp-12-2033-2016, 2016.
Leino, K., Riuttanen, L., Nieminen, T., Väänänen, R., Pohja, T., Keronen, P., Järvi, L., Aalto, P. P., Virkkula, A., Kerminen, V. M., Petäjä, T., Kulmala, M., Nieminen, T., Dal Maso, M., and Virkkula, A.: Biomass-burning smoke episodes in Finland from eastern European wildfires, Boreal Environ. Res., 19, 275–292, 2014.
Lelieveld, J., Evans, J. S., Fnais, M., Giannadaki, D., and Pozzer, A.: The contribution of outdoor air pollution sources to premature mortality on a global scale, Nature, 525, 367–371, https://doi.org/10.1038/nature15371, 2015.
Leung, F. Y. T., Logan, J. A., Park, R., Hyer, E., Kasischke, E., Streets, D., and Yurganov, L.: Impacts of enhanced biomass burning in the boreal forests in 1998 on tropospheric chemistry and the sensitivity of model results to the injection height of emissions, J. Geophys. Res.-Atmos., 112, 1–15, https://doi.org/10.1029/2006JD008132, 2007.
Lim, H. J., Turpin, B. J., Russell, L. M., and Bates, T. S.: Organic and elemental carbon measurements during ACE-Asia suggest a longer atmospheric lifetime for elemental carbon, Environ. Sci. Technol., 37, 3055–3061, https://doi.org/10.1021/es020988s, 2003.
Limbeck, A., Kulmala, M., and Puxbaum, H.: Secondary organic aerosol formation in the atmosphere via heterogeneous reaction of gaseous isoprene on acidic particles, Geophys. Res. Lett., 30, 4–7, https://doi.org/10.1029/2003GL017738, 2003.
Long, C. M., Nascarella, M. A., and Valberg, P. A.: Carbon black vs. black carbon and other airborne materials containing elemental carbon: Physical and chemical distinctions, Environ. Pollut., 181, 271–286, https://doi.org/10.1016/j.envpol.2013.06.009, 2013.
Lyons, W. B., Welch, K. A., and Doggett, J. K.: Organic carbon in Antarctic snow, Geophys. Res. Lett., 34, 2–5, https://doi.org/10.1029/2006GL028150, 2007.
Magnan, G., Lavoie, M., and Payette, S.: Impact of fire on long-term vegetation dynamics of ombrotrophic peatlands in northwestern Québec, Canada, Quaternary Res., 77, 110–121, https://doi.org/10.1016/j.yqres.2011.10.006, 2012.
Massling, A., Nielsen, I. E., Kristensen, D., Christensen, J. H., Sørensen, L. L., Jensen, B., Nguyen, Q. T., Nøjgaard, J. K., Glasius, M., and Skov, H.: Atmospheric black carbon and sulfate concentrations in Northeast Greenland, Atmos. Chem. Phys., 15, 9681–9692, https://doi.org/10.5194/acp-15-9681-2015, 2015.
Mayer, B. and Kylling, A.: Technical note: The libRadtran software package for radiative transfer calculations – description and examples of use, Atmos. Chem. Phys., 5, 1855–1877, https://doi.org/10.5194/acp-5-1855-2005, 2005.
Mukai, H. and Ambe, Y.: Characterization of a humic acid-like brown substance in airborne particulate matter and tentative identification of its origin, Atmos. Environ., 20, 813–819, https://doi.org/10.1016/0004-6981(86)90265-9, 1986.
Myhre, G., Shindell, D., Bréon, F.-M., Collins, W., Fuglestvedt, J., Huang, J., Koch, D., Lamarque, J.-F., Lee, D., Mendoza, B., Nakajima, T., Robock, A., Stephens, G., Takemura, T., and Zhang, H.: Anthropogenic and Natural Radiative Forcing, in Climate Change 2013: The Physical Science Basis. Contribution of Working Group I to the Fifth Assessment Report of the Intergovernmental Panel on Climate Change, edited by: Stocker, T. F., Qin, D., Plattner, G.-K., Tignor, M., Allen, S. K., Boschung, J., Nauels, A., Xia, Y., Bex, V., and Midgley, P. M., Cambridge University Press, Cambridge, United Kingdom and New York, NY, USA, 659–740, 2013.
NASA: FIRMS. Web Fire Mapper, available at: https://firms.modaps.eosdis.nasa.gov/firemap/, last access: 5 September 2017a.
NASA: Roundtable: The Greenland Wildfire, available at: https://earthobservatory.nasa.gov/blogs/earthmatters/2017/08/10/roundtable-the-greenland-wildfire/, last access: 6 September 2017b.
NASA: Wildfires Continue to Beleaguer Western Canada, available at: https://www.nasa.gov/image-feature/goddard/2017/wildfires-continue-to-beleaguer-western-canada, last access: 29 October 2017c.
New Scientist Magazine: Largest ever wildfire in Greenland seen burning from space, available at: https://www.newscientist.com/article/2143159-largest-ever-wildfire-in-greenland-seen-burning-from-space/, last access: 6 September 2017.
Page, S. E., Siegert, F., Rieley, J. O., Boehm, H.-D. V., Jada, A., and Limin, S.: The amount of carbon released from peat and forest fires in Indonesia during 1997, Nature, 420, 61–65, https://doi.org/10.1038/nature01131, 2015.
Paugam, R., Wooster, M., Atherton, J., Freitas, S. R., Schultz, M. G., and Kaiser, J. W.: Development and optimization of a wildfire plume rise model based on remote sensing data inputs – Part 2, Atmos. Chem. Phys. Discuss., 15, 9815–9895, https://doi.org/10.5194/acpd-15-9815-2015, 2015.
Pisso, I., Sollum, E., Grythe, H., Kristiansen, N., Cassiani, M., Eckhardt, S., Arnold, D., Morton, D., Thompson, R. L., Groot Zwaaftink, C. D., Evangeliou, N., Sodemann, H., Haimberger, L., Henne, S., Brunner, D., Burkhart, J. F., Fouilloux, A., Brioude, J., Philipp, A., Seibert, P., and Stohl, A.: The Lagrangian particle dispersion model FLEXPART version 10.3, Geosci. Model Dev. Discuss., https://doi.org/10.5194/gmd-2018-333, in review, 2019.
Pokhrel, R. P., Wagner, N. L., Langridge, J. M., Lack, D. A., Jayarathne, T., Stone, E. A., Stockwell, C. E., Yokelson, R. J., and Murphy, S. M.: Parameterization of single-scattering albedo (SSA) and absorption Ångström exponent (AAE) with EC∕OC for aerosol emissions from biomass burning, Atmos. Chem. Phys., 16, 9549–9561, https://doi.org/10.5194/acp-16-9549-2016, 2016.
Polashenski, C. M., Dibb, J. E., Flanner, M. G., Chen, J. Y., Courville, Z. R., Lai, A. M., Schauer, J. J., Shafer, M. M., and Bergin, M.: Neither dust nor black carbon causing apparent albedo decline in Greenland's dry snow zone: Implications for MODIS C5 surface reflectance, Geophys. Res. Lett., 42, 9319–9327, https://doi.org/10.1002/2015GL065912, 2015.
Randerson, J. T., Chen, Y., Van Der Werf, G. R., Rogers, B. M., and Morton, D. C.: Global burned area and biomass burning emissions from small fires, J. Geophys. Res.-Biogeo., 117, G04012, https://doi.org/10.1029/2012JG002128, 2012.
Reddy, A. D., Hawbaker, T. J., Wurster, F., Zhu, Z., Ward, S., Newcomb, D., and Murray, R.: Quantifying soil carbon loss and uncertainty from a peatland wildfire using multi-temporal LiDAR, Remote Sens. Environ., 170, 306–316, https://doi.org/10.1016/j.rse.2015.09.017, 2015.
Rémy, S., Veira, A., Paugam, R., Sofiev, M., Kaiser, J. W., Marenco, F., Burton, S. P., Benedetti, A., Engelen, R. J., Ferrare, R., and Hair, J. W.: Two global data sets of daily fire emission injection heights since 2003, Atmos. Chem. Phys., 17, 2921–2942, https://doi.org/10.5194/acp-17-2921-2017, 2017.
Restuccia, F., Ptak, N., and Rein, G.: Self-heating behavior and ignition of shale rock, Combust. Flame, 176, 213–219, https://doi.org/10.1016/j.combustflame.2016.09.025, 2017a.
Restuccia, F., Huang, X., and Rein, G.: Self-ignition of natural fuels: Can wildfires of carbon-rich soil start by self-heating?, Fire Safety J., 91, 828–834, https://doi.org/10.1016/j.firesaf.2017.03.052, 2017b.
Seiler, W. and Crutzen, P. J.: Estimates of gross and net fluxes of carbon between the biosphere and the atmosphere from biomass burning, Climatic Change, 2, 207–247, https://doi.org/10.1007/BF00137988, 1980.
SERMITSIAQ: Se billeder: Naturbrand udvikler kraftig røg, available at: http://sermitsiaq.ag/se-billeder-naturbrand-udvikler-kraftig-roeg, last Access: 6 September 2017 (in Danish).
Shetler, G., Turetsky, M. R., Kane, E., and Kasischke, E.: Sphagnum mosses limit total carbon consumption during fire in Alaskan black spruce forests, Can. J. Forest Res., 38, 2328–2336, https://doi.org/10.1139/X08-057, 2008.
Shi, Y., Matsunaga, T., Saito, M., Yamaguchi, Y., and Chen, X.: Comparison of global inventories of CO2 emissions from biomass burning during 2002–2011 derived from multiple satellite products, Environ. Pollut., 206, 479–487, https://doi.org/10.1016/j.envpol.2015.08.009, 2015.
Skeie, R. B., Berntsen, T., Myhre, G., Pedersen, C. A., Ström, J., Gerland, S., and Ogren, J. A.: Black carbon in the atmosphere and snow, from pre-industrial times until present, Atmos. Chem. Phys., 11, 6809–6836, https://doi.org/10.5194/acp-11-6809-2011, 2011.
Smirnov, N. S., Korotkov, V. N., and Romanovskaya, A. A.: Black carbon emissions from wildfires on forest lands of the Russian Federation in 2007–2012, Russ. Meteorol. Hydro+., 40, 435–442, https://doi.org/10.3103/S1068373915070018, 2015.
Stamnes, K., Tsay, S.-C., Wiscombe, W., and Jayaweera, K.: Numerically stable algorithm for discrete-ordinate-method radiative transfer in multiple scattering and emitting layered media, Appl. Optics, 27, 2502, https://doi.org/10.1364/AO.27.002502, 1988.
Stendel, M., Christensen, J. H., and Petersen, D.: Arctic Climate and Climate Change with a Focus on Greenland, Adv. Ecol. Res., 40, 13–43, https://doi.org/10.1016/S0065-2504(07)00002-5, 2008.
Stockwell, C. E., Jayarathne, T., Cochrane, M. A., Ryan, K. C., Putra, E. I., Saharjo, B. H., Nurhayati, A. D., Albar, I., Blake, D. R., Simpson, I. J., Stone, E. A., and Yokelson, R. J.: Field measurements of trace gases and aerosols emitted by peat fires in Central Kalimantan, Indonesia, during the 2015 El Niño, Atmos. Chem. Phys., 16, 11711–11732, https://doi.org/10.5194/acp-16-11711-2016, 2016.
Stohl, A., Andrews, E., Burkhart, J. F., Forster, C., Herber, A., Hoch, S. W., Kowal, D., Lunder, C., Mefford, T., Ogren, J. A., Sharma, S., Spichtinger, N., Stebel, K., Stone, R., Ström, J., Tørseth, K., Wehrli, C., and Yttri, K. E.: Pan-Arctic enhancements of light absorbing aerosol concentrations due to North American boreal forest fires during summer 2004, J. Geophys. Res.-Atmos., 111, 1–20, https://doi.org/10.1029/2006JD007216, 2006.
Stohl, A., Berg, T., Burkhart, J. F., Fjǽraa, A. M., Forster, C., Herber, A., Hov, Ø., Lunder, C., McMillan, W. W., Oltmans, S., Shiobara, M., Simpson, D., Solberg, S., Stebel, K., Ström, J., Tørseth, K., Treffeisen, R., Virkkunen, K., and Yttri, K. E.: Arctic smoke – record high air pollution levels in the European Arctic due to agricultural fires in Eastern Europe in spring 2006, Atmos. Chem. Phys., 7, 511–534, https://doi.org/10.5194/acp-7-511-2007, 2007.
Stohl, A., Prata, A. J., Eckhardt, S., Clarisse, L., Durant, A., Henne, S., Kristiansen, N. I., Minikin, A., Schumann, U., Seibert, P., Stebel, K., Thomas, H. E., Thorsteinsson, T., Tørseth, K., and Weinzierl, B.: Determination of time- and height-resolved volcanic ash emissions and their use for quantitative ash dispersion modeling: the 2010 Eyjafjallajökull eruption, Atmos. Chem. Phys., 11, 4333–4351, https://doi.org/10.5194/acp-11-4333-2011, 2011.
Stohl, A., Klimont, Z., Eckhardt, S., Kupiainen, K., Shevchenko, V. P., Kopeikin, V. M., and Novigatsky, A. N.: Black carbon in the Arctic: the underestimated role of gas flaring and residential combustion emissions, Atmos. Chem. Phys., 13, 8833–8855, https://doi.org/10.5194/acp-13-8833-2013, 2013.
Stroeve, J., Box, J. E., Gao, F., Liang, S., Nolin, A., and Schaaf, C.: Accuracy assessment of the MODIS 16-day albedo product for snow: Comparisons with Greenland in situ measurements, Remote Sens. Environ., 94, 46–60, https://doi.org/10.1016/j.rse.2004.09.001, 2005.
Sunderman, S. O. and Weisberg, P. J.: Remote sensing approaches for reconstructing fire perimeters and burn severity mosaics in desert spring ecosystems, Remote Sens. Environ., 115, 2384–2389, https://doi.org/10.1016/j.rse.2011.05.001, 2011.
Turetsky, M. R., Donahue, W. F.m and Benscoter, B. W.: Experimental drying intensifies burning and carbon losses in a northern peatland, Nat. Commun., 2, 514, https://doi.org/10.1038/ncomms1523, 2011.
Turetsky, M. R., Benscoter, B., Page, S., Rein, G., van der Werf, G. R., and Watts, A.: Global vulnerability of peatlands to fire and carbon loss, Nat. Geosci., 8, 11–14, https://doi.org/10.1038/ngeo2325, 2014.
Urbanski, S. P., Hao, W. M., and Nordgren, B.: The wildland fire emission inventory: western United States emission estimates and an evaluation of uncertainty, Atmos. Chem. Phys., 11, 12973–13000, https://doi.org/10.5194/acp-11-12973-2011, 2011.
von Schneidemesser, E., Schauer, J. J., Hagler, G. S. W., and Bergin, M. H.: Concentrations and sources of carbonaceous aerosol in the atmosphere of Summit, Greenland, Atmos. Environ., 43, 4155–4162, https://doi.org/10.1016/j.atmosenv.2009.05.043, 2009.
Wandji Nyamsi, W., Arola, A., Blanc, P., Lindfors, A. V., Cesnulyte, V., Pitkänen, M. R. A., and Wald, L.: Technical Note: A novel parameterization of the transmissivity due to ozone absorption in the k-distribution method and correlated-k approximation of Kato et al. (1999) over the UV band, Atmos. Chem. Phys., 15, 7449–7456, https://doi.org/10.5194/acp-15-7449-2015, 2015.
Warren, S. G.: Can black carbon in snow be detected by remote sensing?, J. Geophys. Res.-Atmos., 118, 779–786, https://doi.org/10.1029/2012JD018476, 2013.
Wieder, R. K., Scott, K. D., Kamminga, K., Vile, M. A., Vitt, D. H., Bone, T., Xu, B., Benscoter, B. W., and Bhatti, J. S.: Postfire carbon balance in boreal bogs of Alberta, Canada, Glob. Change Biol., 15, 63–81, https://doi.org/10.1111/j.1365-2486.2008.01756.x, 2009.
Winiger, P., Andersson, A., Eckhardt, S., Stohl, A., Semiletov, I. P., Dudarev, O. V., Charkin, A., Shakhova, N., Klimont, Z., Heyes, C., and Gustafsson, Ö.: Siberian Arctic black carbon sources constrained by model and observation, P. Natl. Acad. Sci. USA, 114, E1054–E1061, https://doi.org/10.1073/pnas.1613401114, 2017.
Winker, D. M., Vaughan, M. A., Omar, A., Hu, Y., Powell, K. A., Liu, Z., Hunt, W. H., and Young, S. A.: Overview of the CALIPSO mission and CALIOP data processing algorithms, J. Atmos. Ocean. Tech., 26, 2310–2323, https://doi.org/10.1175/2009JTECHA1281.1, 2009.
Wu, D., Huang, X., Norman, F., Verplaetsen, F., Berghmans, J., and Van Den Bulck, E.: Experimental investigation on the self-ignition behaviour of coal dust accumulations in oxy-fuel combustion system, Fuel, 160, 245–254, https://doi.org/10.1016/j.fuel.2015.07.050, 2015.
Wu, G. M., Cong, Z. Y., Kang, S. C., Kawamura, K., Fu, P. Q., Zhang, Y. L., Wan, X., Gao, S. P., and Liu, B.: Brown carbon in the cryosphere: Current knowledge and perspective, Adv. Clim. Chang. Res., 7, 82–89, https://doi.org/10.1016/j.accre.2016.06.002, 2016.
Zhuravleva, T. B., Kabanov, D. M., Nasrtdinov, I. M., Russkova, T. V., Sakerin, S. M., Smirnov, A., and Holben, B. N.: Radiative characteristics of aerosol during extreme fire event over Siberia in summer 2012, Atmos. Meas. Tech., 10, 179–198, https://doi.org/10.5194/amt-10-179-2017, 2017.