the Creative Commons Attribution 4.0 License.
the Creative Commons Attribution 4.0 License.
 | 14 Nov 2019
A typical weather pattern for ozone pollution events in North China
Cheng Gong
Hong Liao
Ground-level observations, reanalyzed meteorological fields and a 3-D global chemical and transport model (GEOS-Chem) were applied in this study to investigate ozone (O3) pollution events (OPEs) in North China (36.5–40.5∘ N, 114.5–119.5∘ E) during 2014–2017. Ozone pollution days (OPDs) were defined as days with maximum daily averaged 8 h (MDA8) concentrations over North China larger than 160 µg m−3, and OPEs were defined as periods with 3 or more consecutive OPDs. Observations showed that there were 167 OPDs and 27 OPEs in North China during 2014–2017, in which 123 OPDs and 21 OPEs occurred from May to July. We found that OPEs in North China occurred under a typical weather pattern with high daily maximum temperature (Tmax), low relative humidity (RH), anomalous southerlies and divergence in the lower troposphere, an anomalous high-pressure system at 500 hPa, and an anomalous downward air flow from 500 hPa to the surface. Under such a weather pattern, chemical production of O3 was high between 800 and 900 hPa, which was then transported downward to enhance O3 pollution at the surface. A standardized index I_OPE was defined by applying four key meteorological parameters, including Tmax, RH, meridional winds at 850 hPa (V850) and zonal winds at 500 hPa (U500). I_OPE can capture approximately 80 % of the observed OPDs and OPEs, which has implications for forecasting OPEs in North China.
- Article
(8318 KB) - Full-text XML
-
Supplement
(1205 KB) - BibTeX
- EndNote


Ground-level ozone (O3) is generated by photochemical reactions involving nitrogen oxides (NOx) and volatile organic compounds (VOCs) (Finlayson-Pitts and Pitts, 1997; Sillman, 1999). Enhanced surface O3 concentrations increase premature mortality (e.g., Bell et al., 2006; Anenberg et al., 2010; Lelieveld et al., 2015; Nuvolone et al., 2018) and reduce crop yields (e.g., Fuhrer et al., 1997; Krupa et al., 1998; Ainsworth et al., 2012; Mills et al., 2018). O3 pollution events (OPEs) occur frequently in megacities with sufficient O3 precursors during summertime when solar radiation is strong (Solomon et al., 2000; T. Wang et al., 2006; T. J. Wang et al., 2006; Roy et al., 2008; Carro-Calvo et al., 2017; Fix et al., 2018). As a result, the formation mechanisms of and prevention strategies for ground-level O3 have been a focus in many countries around the world.
Ozone concentrations are influenced by meteorological parameters. High temperature can change O3 concentrations by accelerating O3 chemical production rates and enhancing natural emissions such as biogenic emissions and NOx from soil (Jacob and Winner, 2009). Bloomer et al. (2009) analyzed observed O3 from 1987 to 2007 across the rural eastern US and showed that as temperature increased by 1 K, O3 concentrations increased by an average of 3.2 ppbv prior to 2002 but increased by an average of 2.2 ppbv after 2002 because of the reduction in anthropogenic NOx emissions. Rasmussen et al. (2012) used observed O3 and temperature in the eastern US during 1988–2009 to characterize the sensitivity of summertime O3 to temperature. These authors showed that the sensitivities were 3–6 ppbv K−1 over the northeast, 3–4 ppbv K−1 over the Great Lakes and 3–6 ppbv K−1 over the Middle Atlantic states. Relative humidity (RH) is also found to be an important parameter for O3 formation. Zhang et al. (2015) showed that values of RH for days with the top 10 % O3 concentrations were lower compared to those for days with bottom 10 % O3 concentrations by examining continuous observations of O3 and meteorological parameters in Guangzhou from March 2013 to February 2014. Kavassalis and Murphy (2017) reported a negative correlation between summertime O3 concentrations and RH on the basis of observed O3 and RH from 1987 to 2015 at 101 rural sites in the US. Moreover, cloud fraction influences O3 concentrations by changing the near-surface solar radiation and hence photochemical reaction rates. Jeong and Park (2013) showed, by using a 3-D global chemical and transport model (GEOS-Chem), that the increases in O3 concentration in East Asia from 1985–1989 to 2002–2006 could be explained in part by the decreases in cloud cover.
In addition to the local meteorological parameters, O3 concentrations are also influenced dynamically by large-scale circulations. By analyzing 11 years of ozonesonde data, Zhou et al. (2013) showed that the interannual variability of O3 over Hong Kong was closely associated with the East Asian monsoon; circulations during monsoon season influence the transport of continental pollutants to Hong Kong. By using the GEOS-Chem model, Yang et al. (2014) examined the interannual variation in summertime O3 and found a positive correlation between the strength of the East Asian summer monsoon and summertime O3 concentration averaged over China because of the monsoon-driven variations in transboundary transport. Liao et al. (2017) carried out composite analysis on observed surface O3 concentrations in the Yangtze River Delta (YRD) during 2013–2016 for 10 typical circulation types identified by the automated Lamb weather type approach (Jenkinson and Collison, 1977). These authors found that O3 concentrations in the YRD were high under the influence of westerlies, which occur frequently in summer associated with the subtropical high. Under such conditions, high temperatures and strong solar radiation in the YRD, together with the transport of biogenic VOCs from the mountain areas of Anhui and Zhejiang provinces, led to high O3 levels in the YRD. Zhao and Wang (2017) reported that the daily variability of West Pacific subtropical high (WPSH) can influence the daily variability of surface-layer O3 over eastern China in summer of 2014–2016. They found, by using observed O3 and reanalyzed data, that O3 concentrations decreased in South China and increased in North China during days with a high WPSH-I index, which is an indicator of the intensity of WPSH at the 500 hPa level. A strong WPSH leads to moist, cloudy weather and low temperatures in South China and dry, sunny weather in North China.
Previous studies also reported that OPEs are influenced by meteorological conditions. Zhang et al. (2017), utilizing 30 years of O3 observations and meteorological variables over the US, showed that O3 extreme days (location-specific 95th percentile) overlapped with 32 % of temperature extreme days, along with low RH and low wind speed. By using both observations and a regional chemistry–climate model, Pu et al. (2017) showed that a heat wave event in YRD during the summer of 2013 led to a severe O3 pollution episode with a peak O3 concentration of 160.5 ppbv as a result of the accelerated chemical reaction, low cloud fraction and stagnant conditions. By using the GEOS-Chem model and observed O3 concentrations, Zhang and Wang (2016) showed that extreme drought events also led to three high O3 episodes (with peak concentrations of 70 ppbv) in October 2010 in the southeastern US, by the enhanced emissions of biogenic isoprene from water-stressed plants. Moreover, regional transport of O3 and precursors (such as NOx and isoprene) are important for OPEs. For example, Whaley et al. (2015) used the GEOS-Chem model with tagged O3 to identify the sources of O3 for 15 OPEs in Toronto during 2004–2007 and found that O3 in the northeastern US contributed 26 % to O3 in Toronto during OPEs. They also used the GEOS-Chem adjoint model to examine the sensitivities of O3 concentrations during OPEs in Toronto to emissions of precursors in different regions and found a strong sensitivity to the southern Ontario and US fossil fuel NOx emissions and natural isoprene emissions. Currently, previous studies on OPEs in China were focused on one single observational site or a few episodes (e.g., Z. Wang et al., 2006; Shen et al., 2015; K. Li et al., 2017), and few studies have systematically examined OPEs in a regional scope, especially for North China (36.5–40.5∘ N, 114.5–119.5∘ E), where the highest O3 peak concentrations were observed (Wang et al., 2017).
The scientific goals of this work are as follows: (1) to characterize the frequencies and intensities of OPEs in North China, (2) to identify key meteorological parameters that can be used to define a typical weather pattern for OPEs in North China, and (3) to quantify the contributions of different chemical and physical processes to OPEs under such a typical weather pattern. Integrated process rate (IPR) analysis is a widely used method to quantify the contributions of different processes to O3 (Gonçalves et al., 2009; Jiang et al., 2012; Li et al., 2012). In Sect. 2, observed O3 concentrations, reanalyzed meteorological data, a model description and the IPR analysis method are briefly introduced. Section 3 presents the observed frequency and intensity of OPEs in North China during 2014 to 2017. Section 4 describes the key meteorological parameters that lead to OPEs and the definition of a standardized index to represent a typical weather pattern for OPEs. Section 5 examines how the typical weather pattern leads to OPEs by IPR analysis in the GEOS-Chem model.
2.1 Observed ground-level O3 concentrations
The ground-level hourly O3 concentrations are obtained from the national air quality monitoring network of China (http://datacenter.mee.gov.cn/websjzx/queryIndex.vm, last access: 8 November 2019), which was established in 2012 by the Ministry of Environment Protection of China. O3 concentrations from this network have units of µg m−3. Under the conditions of 25 ∘C and 1013.25 hPa, 1 µg m−3 of O3 is approximately 0.5 ppbv. Hourly O3 concentrations are available from 1582 sites during 2014–2017. For each site, the maximum daily 8 h average concentration (MDA8) of O3 is calculated by utilizing an 8 h moving average window for each day. To ensure data quality, the 8 h moving window has to contain more than 6 h valid observations and the number of days with valid O3 MDA8 has to be more than 15 for each month. As a result, 740 among the 1582 sites in China (62 sites among the 101 sites in North China: 36.5–40.5∘ N, 114.5–119.5∘ E), Fig. S1 in the Supplement) are selected and used in this study. The spatial distribution of these selected sites and the region of North China are shown in Fig. 1.
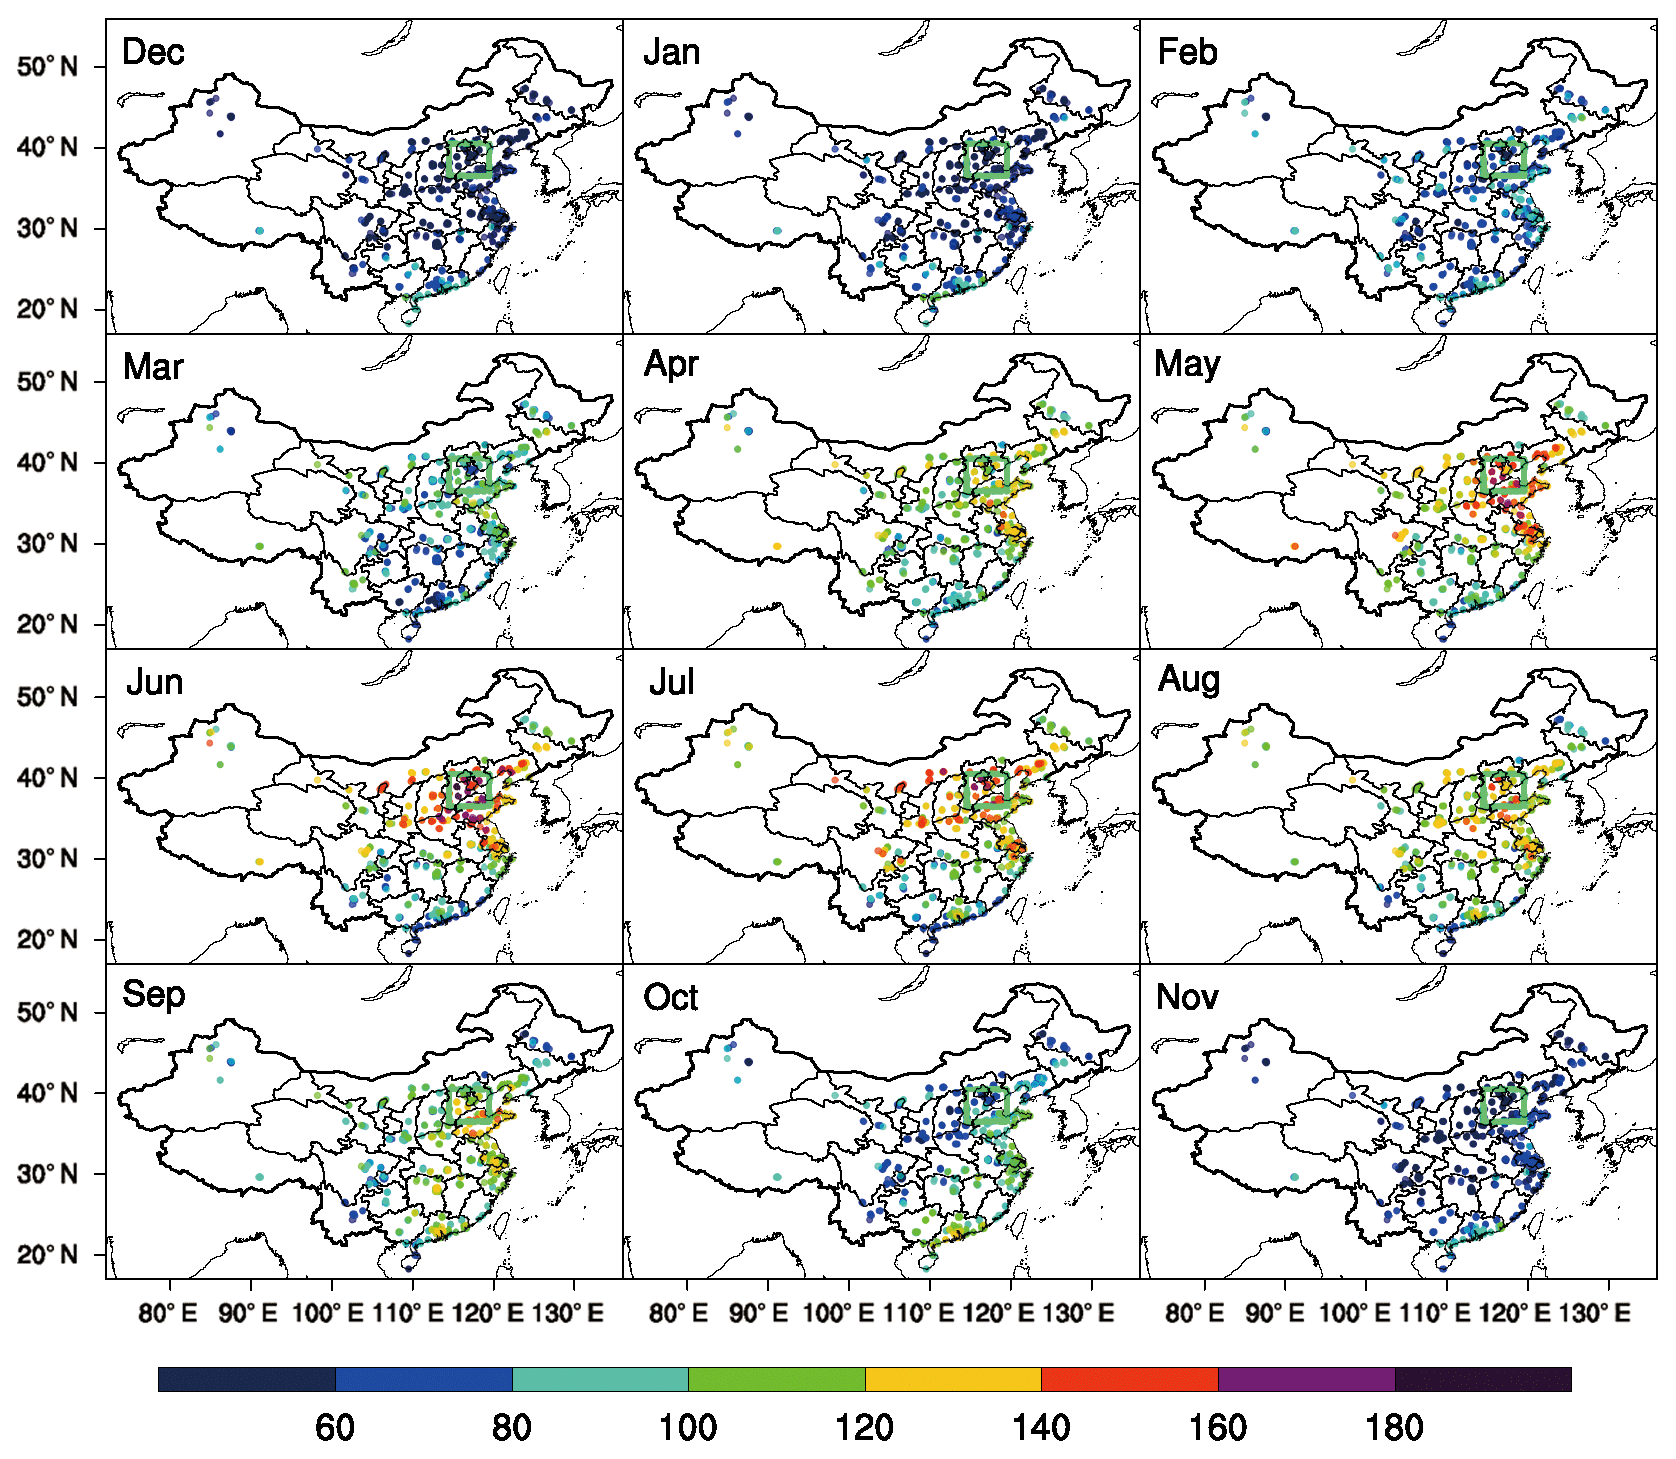
Figure 1Monthly MDA8 O3 concentrations (µg m−3) averaged over 2014–2017 at 740 observational sites. The solid green lines indicate the North China region.
The China National Ambient Air Quality Standard (GB3095-2012) states that O3 concentration exceeds the national air quality standard if the MDA8 O3 concentration of a location is higher than 160 µg m−3. In this study, we aim to investigate O3 pollution over a large area rather than at a single site; we define O3-polluted days in North China as the days with MDA8 O3 concentrations averaged over North China exceeding 160 µg m−3. We also define an ozone episode in North China as three or more consecutive days of regional O3 pollution.
2.2 Reanalyzed meteorological fields
Meteorological fields are taken from Version 2 of Modern Era Retrospective-analysis for Research and Application (MERRA2), which was generated from the NASA Global Modeling and Assimilation Office (GMAO) by using the Version 5 data assimilation system (DAS) of the Goddard Earth Observing System Model. Compared with the first version of MERRA, MERRA2 has assimilated more observations and made many improvements and updates in DAS. The original MERRA2 data have a horizontal resolution of 0.5∘ latitude by 0.625∘ longitude and 72 vertical layers (Molod et al., 2015). The GEOS-Chem model has the same horizontal resolution over the nested domain but the GEOS-Chem support team has lumped the 72 vertical layers into 47 layers to save computational resources. The lumped vertical levels are within the 32nd model layer (about 190 hPa) and the top of atmosphere (about 0.01 hPa). The temporal resolution for surface meteorological parameters (such as 2 m air temperature) is 1 h and that for atmospheric meteorological parameters (such as relative humidity and wind) is 3 h. To investigate the key meteorological factors that lead to OPEs, daily maximum 2 m temperature (Tmax), daily mean relative humidity (RH) at the surface, and daily averaged meridional and zonal winds at 850 and 500 hPa (U850, V850, U500 and V500, where westerlies and southerlies have positive values) during 2014–2017 are utilized. In addition, due to the lack of geopotential heights in the MERRA2 dataset, daily mean geopotential heights at 850 and 500 hPa from the National Center for Environmental Prediction (NCEP) and National Center for Atmospheric Research (NCAR) global reanalysis at a resolution of 2.5∘ latitude by 2.5∘ longitude are utilized. The daily time series of a meteorological parameter x at a specific model grid cell over the months of May to July in the years 2014–2017 is standardized by
where xi indicates the parameter x on day i, n is the total number of days over the months of May to July in 2014–2017, si indicates the standard deviation of the daily time series and [xi] is the standardized anomaly for parameter x on day i.
2.3 GEOS-Chem model
The hourly O3 concentrations from the months of May to July for 2014–2017 are simulated by the nested version of the 3-D global chemical transport model (GEOS-Chem, version 11-01) driven by the MERRA2 reanalysis meteorological data. Over the nested domain (11∘ S–55∘ N, 60–150∘ E), the model resolution is the same as that of the MERRA2 dataset, as described above. Concentrations of all tracers in lateral boundaries are provided by the global GEOS-Chem simulation with 2∘ latitude by 2.5∘ longitude horizontal resolution.
The GEOS-Chem model employs a fully coupled NOx–Ox–hydrocarbon–aerosol chemistry mechanism (Bey et al., 2001; Park et al., 2003; Pye et al., 2009) to simulate concentrations of gas-phase pollutants (such as NOx and O3) and aerosols (including sulfate, nitrate, ammonium, OC and BC, sea salt, and mineral dust). The LINOZ scheme is used for stratospheric O3 chemistry (McLinden et al., 2000). The vertical mixing in planetary boundary layers (PBL) is calculated by a nonlocal scheme (Lin and McElroy, 2010). The anthropogenic emissions of CO, SO2, NOx, NH3 and VOCs in the simulated domain are obtained from MEIC emission inventory, which includes emissions from industry, power, residential and transportation sectors from 2014 to 2017 (M. Li et al., 2017; Zheng et al., 2018). The biogenic emissions in GEOS-Chem employ the MEGAN v2.1 biogenic emissions with updates from Guenther et al. (2012).
2.4 IPR analysis method
Five major processes that influence O3 concentrations include net chemical production, horizontal advection, vertical advection, dry deposition and diffusion (vertical PBL mixing process in the GEOS-Chem model). Integrated process rate (IPR) analysis is used to evaluate the daily relative contributions of individual processes to an OPE in the studied domain by using the following formula (Gonçalves et al., 2009):
where PCi is the percentage contribution of process i to O3 mass in the specific domain and abs(PCi) is the absolute value of PCi. n is the total number of processes (n is 5 in our analysis). PCi (%) is the relative contribution of process i to O3 mass. It is noted that the sum of process contributions (PCi(%)) is not 100 %, but the sum of the absolute values of PCi(%) equals 100 %. The IPR analysis method has been applied to identify the key processes contributing to extreme air pollution episodes as well as the interannual and decadal variations (Mu and Liao, 2014; Lou et al., 2015; Shu et al., 2016).
3.1 Spatiotemporal distributions of surface layer O3
Figure 1 shows the monthly mean MDA8 O3 concentrations averaged over 2014–2017 at the 740 observational sites. The MDA8 O3 values show obvious seasonal variations in eastern China. The monthly mean MDA8 O3 values at most sites in eastern China were lower than 100 µg m−3 from November to March, while the values were generally high from April to October, especially in North China and the YRD region. North China had the highest MDA8 O3 concentrations from May to July. In June, the most polluted month, the MDA8 O3 concentrations at 40 % (25/62) of observational sites in North China exceeded 160 µg m−3, in which four sites (two sites in Baoding, one in Hengshui and the other in Zibo) even exceeded 180 µg m−3.
Figure 2a shows the seasonal and interannual variations in MDA8 O3 concentrations averaged over all 62 sites in North China. The MDA8 O3 concentrations in North China peaked in June and had relatively high values from May to July. In 2016 and 2017, a secondary peak of concentration showed up in September, but it is difficult to conclude whether this was a general or accidental feature with the limited 4 years of data. With respect to the interannual variation, MDA8 O3 concentrations in most months exhibited an increasing trend from 2014 to 2017. The MDA8 O3 concentration over North China reached the highest value of 182 µg m−3 in June 2017. This increasing trend indicates that the strict emission reduction measures in China in recent years had little effect on O3 pollution in North China.
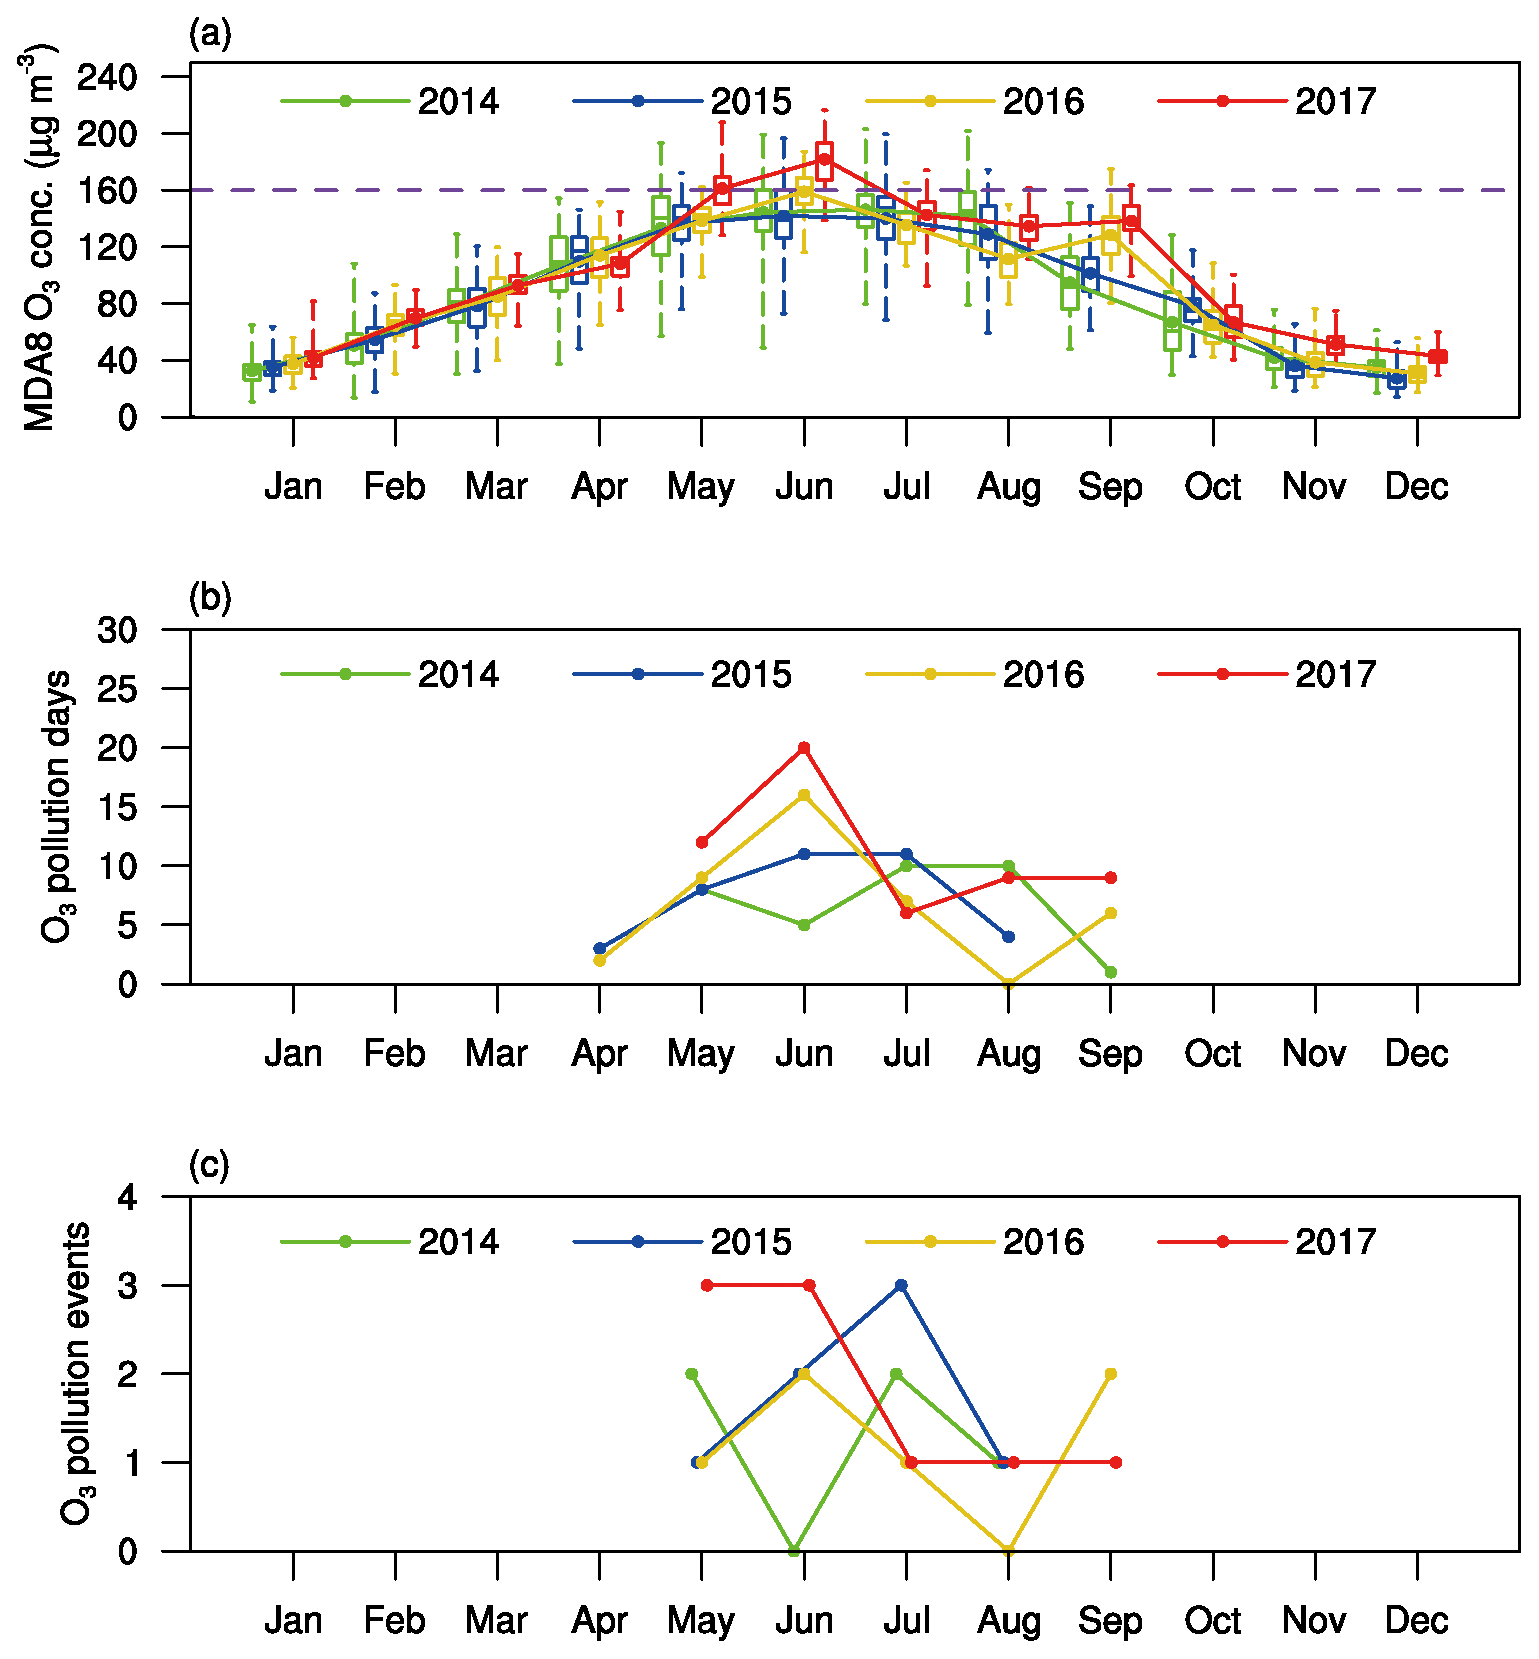
Figure 2(a) Monthly variation in MDA8 O3 concentration (µg m−3) averaged over North China for 2014 to 2017. The boxes indicate the maximum and minimum MDA8 O3 concentrations for 62 observational sites in North China. Dotted solid lines denote the averaged values in North China. The dashed purple line indicates the threshold of 160 µg m−3 for O3-polluted days. (b) Monthly variation in O3-polluted days in North China for 2014–2017. (c) Monthly variation in the number of ozone polluted events (OPEs) in North China for 2014–2017.
3.2 Ozone-polluted days and the frequency of OPEs
Figure 2b shows the O3-polluted days in North China (the days with an average MDA8 O3 concentration over North China exceeding 160 µg m−3) in different months of 2014–2017. From 2014 to 2017, there were 167 O3-polluted days in North China, in which 123 d (70 %) occurred in the months of May to July. In 2014, July and August had the highest number of O3-polluted days (10 d). In 2015–2017, the number of O3-polluted days was the highest in June and kept increasing. Ozone-polluted days in North China had values of 11, 16 and 20 d in June of 2015, 2016 and 2017, respectively.
Figure 2c shows the number of OPEs in North China in each month of 2014–2017. An O3 pollution event in North China is defined as three or more consecutive days of O3 pollution. There were 27 OPEs in the studied time period, and 21 of these OPEs occurred in May to July. Except for June 2014, North China suffered 1–3 OPEs per month in the months of May to July of 2014–2017. As shown above, O3 pollution in North China was the worst from May to July. The 21 OPEs in these 3 months of 2014–2017 are further analyzed in the following sections.
3.3 Intensities of OPEs in North China
Figure 3 shows the mean and maximum MDA8 O3 concentrations as well as the duration of 21 OPEs over the months of May to July in the years 2014–2017 in North China. The averaged MDA8 O3 concentration for OPEs is 193.0 µg m−3, indicating high intensities of OPEs. The maximum MDA8 O3 concentrations for a single day during OPEs can even reach 243.8 µg m−3, and over half of the episodes (11 of 21) have at least one day where MDA8 O3 concentrations exceed 200 µg m−3. Moreover, OPEs last for many consecutive days. The mean duration of OPEs is 4.3 d, while some episodes can last for 1 week or longer (e.g., the episodes starting from 16 June 2016 and 14 June 2017). Understanding the kind of weather pattern that leads to these long-lasting OPEs with high O3 concentrations is quite necessary.

Figure 3Mean (blue bars) and maximum (red bars) MDA8 O3 concentrations (µg m−3) averaged over North China for each of the 21 OPEs that occurred during the months of May to July of 2014–2017. The dotted yellow line indicates the persistence (days) of each OPE.
4.1 Composited weather pattern for OPEs
Figure 4 shows the composited weather pattern for 21 OPEs identified in North China (36.5–40.5∘ N, 114.5–119.5∘ E) during the months of May to July of 2014–2017. We examine the composited Tmax, RH, winds, and surface level pressure (SLP) at the surface; winds and geopotential height at 850 hPa; winds and geopotential height at 500 hPa; and vertical pressure velocity and divergence. All these daily parameters in the months of May to July of 2014–2017 are standardized by utilizing Eq. (1). During OPEs, positive Tmax anomalies (Fig. 4d) and negative RH anomalies (Fig. 4e) occur in North China, indicating hot and dry weather conditions at the surface. The wind and pressure fields show a similar pattern at the surface (Fig. 4c) and at 850 hPa (Fig. 4b). Anomalous southerlies prevail in North China, accompanied by anomalous high pressure in the east and anomalous low pressure in the west. At the 500 hPa altitude, North China is under the influence of an anomalous anticyclone (high pressure) (Fig. 4a), which causes high temperature and low RH at the surface.

Figure 4Composites of (a) wind field and geopotential height at 500 hPa, (b) wind field and geopotential height at 850 hPa, (c) surface wind field and SLP, (d) Tmax at the surface, (e) RH at the surface, (f) pressure–latitude cross section of vertical pressure velocity (ω, positive value indicates downward air flow), and (g) pressure–latitude cross section of divergence (positive value indicates divergence) for the 21 OPEs in North China. The data shown are composited over the standardized time series during the months of May to July of 2014–2017 (see Sect. 2.2). The solid green lines indicate North China. The red vectors in (a)–(c) and black dots in (a)–(g) are significant winds and parameters at 95 % confidence.The cross sections are averaged over the longitudes of 114.5–119.5∘ E.
The composited pressure–latitude cross sections of vertical velocity and divergence for 21 OPEs from 1000 to 500 hPa averaged over 114.5 to 119.5∘ E, the west and east boundary of North China, are shown in Fig. 4f and g, respectively. Except for the north of 39∘ N under 850 hPa, North China shows a downward airflow anomaly from 1000 to 500 hPa during OPEs, which is a typical feature of the high-pressure system. In fact, the upward anomaly under 850 hPa in the northern domain is a fake signal because the elevation sharply increases to approximately 1000 m at the Yan Mountains to the north of 39∘ N, which leads to the surface pressure being lower than 900 hPa (∼1000 m) or even 850 hPa (∼1500 m). As a result, the vertical velocity under 850 hPa for the reanalyzed dataset is unreliable to the north of 39∘ N. Figure 4g shows the divergence anomaly during OPEs in North China. Strong divergence occurs between 950 and 850 hPa. The anomalous downward flow transports air to the lower troposphere and leads to the anomalous divergence.
4.2 Correlations between meteorological parameters and O3 concentrations
To identify the key meteorological factors associated with the MDA8 O3 concentrations in North China, we examine the correlation coefficients between the MDA8 O3 concentration averaged over North China and the meteorological parameters, including daily Tmax and daily mean RH; planetary boundary layer height (PBLH); surface level pressure (SLP); and meridional and zonal wind speed at 1000 hPa (U1000, V1000), 850 hPa (U850, V850), and 500 hPa (U500, V500). These parameters at each grid cell are standardized as described in Sect. 2.2. Figure 5 shows the correlation coefficients between daily MDA8 O3 concentration in North China and the 10 standardized meteorological parameters. MDA8 O3 concentrations in North China exhibit positive correlation with Tmax (Fig. 5a), PBLH (Fig. 5c), V1000 (Fig. 5f), and V850 (Fig. 5h) in the vicinity of North China and with U500 (Fig. 5i) and V500 (Fig. 5j) in the north and west of North China, respectively. MDA8 O3 in North China has a negative correlation with RH (Fig. 5b), SLP (Fig. 5d), U500 (Fig. 5i) and V500 (Fig. 5j). MDA8 O3 is found to have a weak correlation with U1000 (Fig. 5e) and U850 (Fig. 5g). It should be noted that some meteorological factors are closely related. For instance, previous studies have revealed that PBLH is positively correlated with surface temperature (Zhang et al., 2013) but negatively correlated with SLP (Seidel et al., 2010; Guo et al., 2016). Winds at 1000 and 850 hPa are usually highly correlated and show similar patterns. As a result, four meteorological factors are selected to represent the key meteorological conditions for high MDA8 O3 concentrations: Tmax represents the thermal condition, RH indicates the humidity condition, 850 hPa meridional winds indicate circulation in the lower atmosphere and 500 hPa zonal winds describe the dominate large-scale circulation.
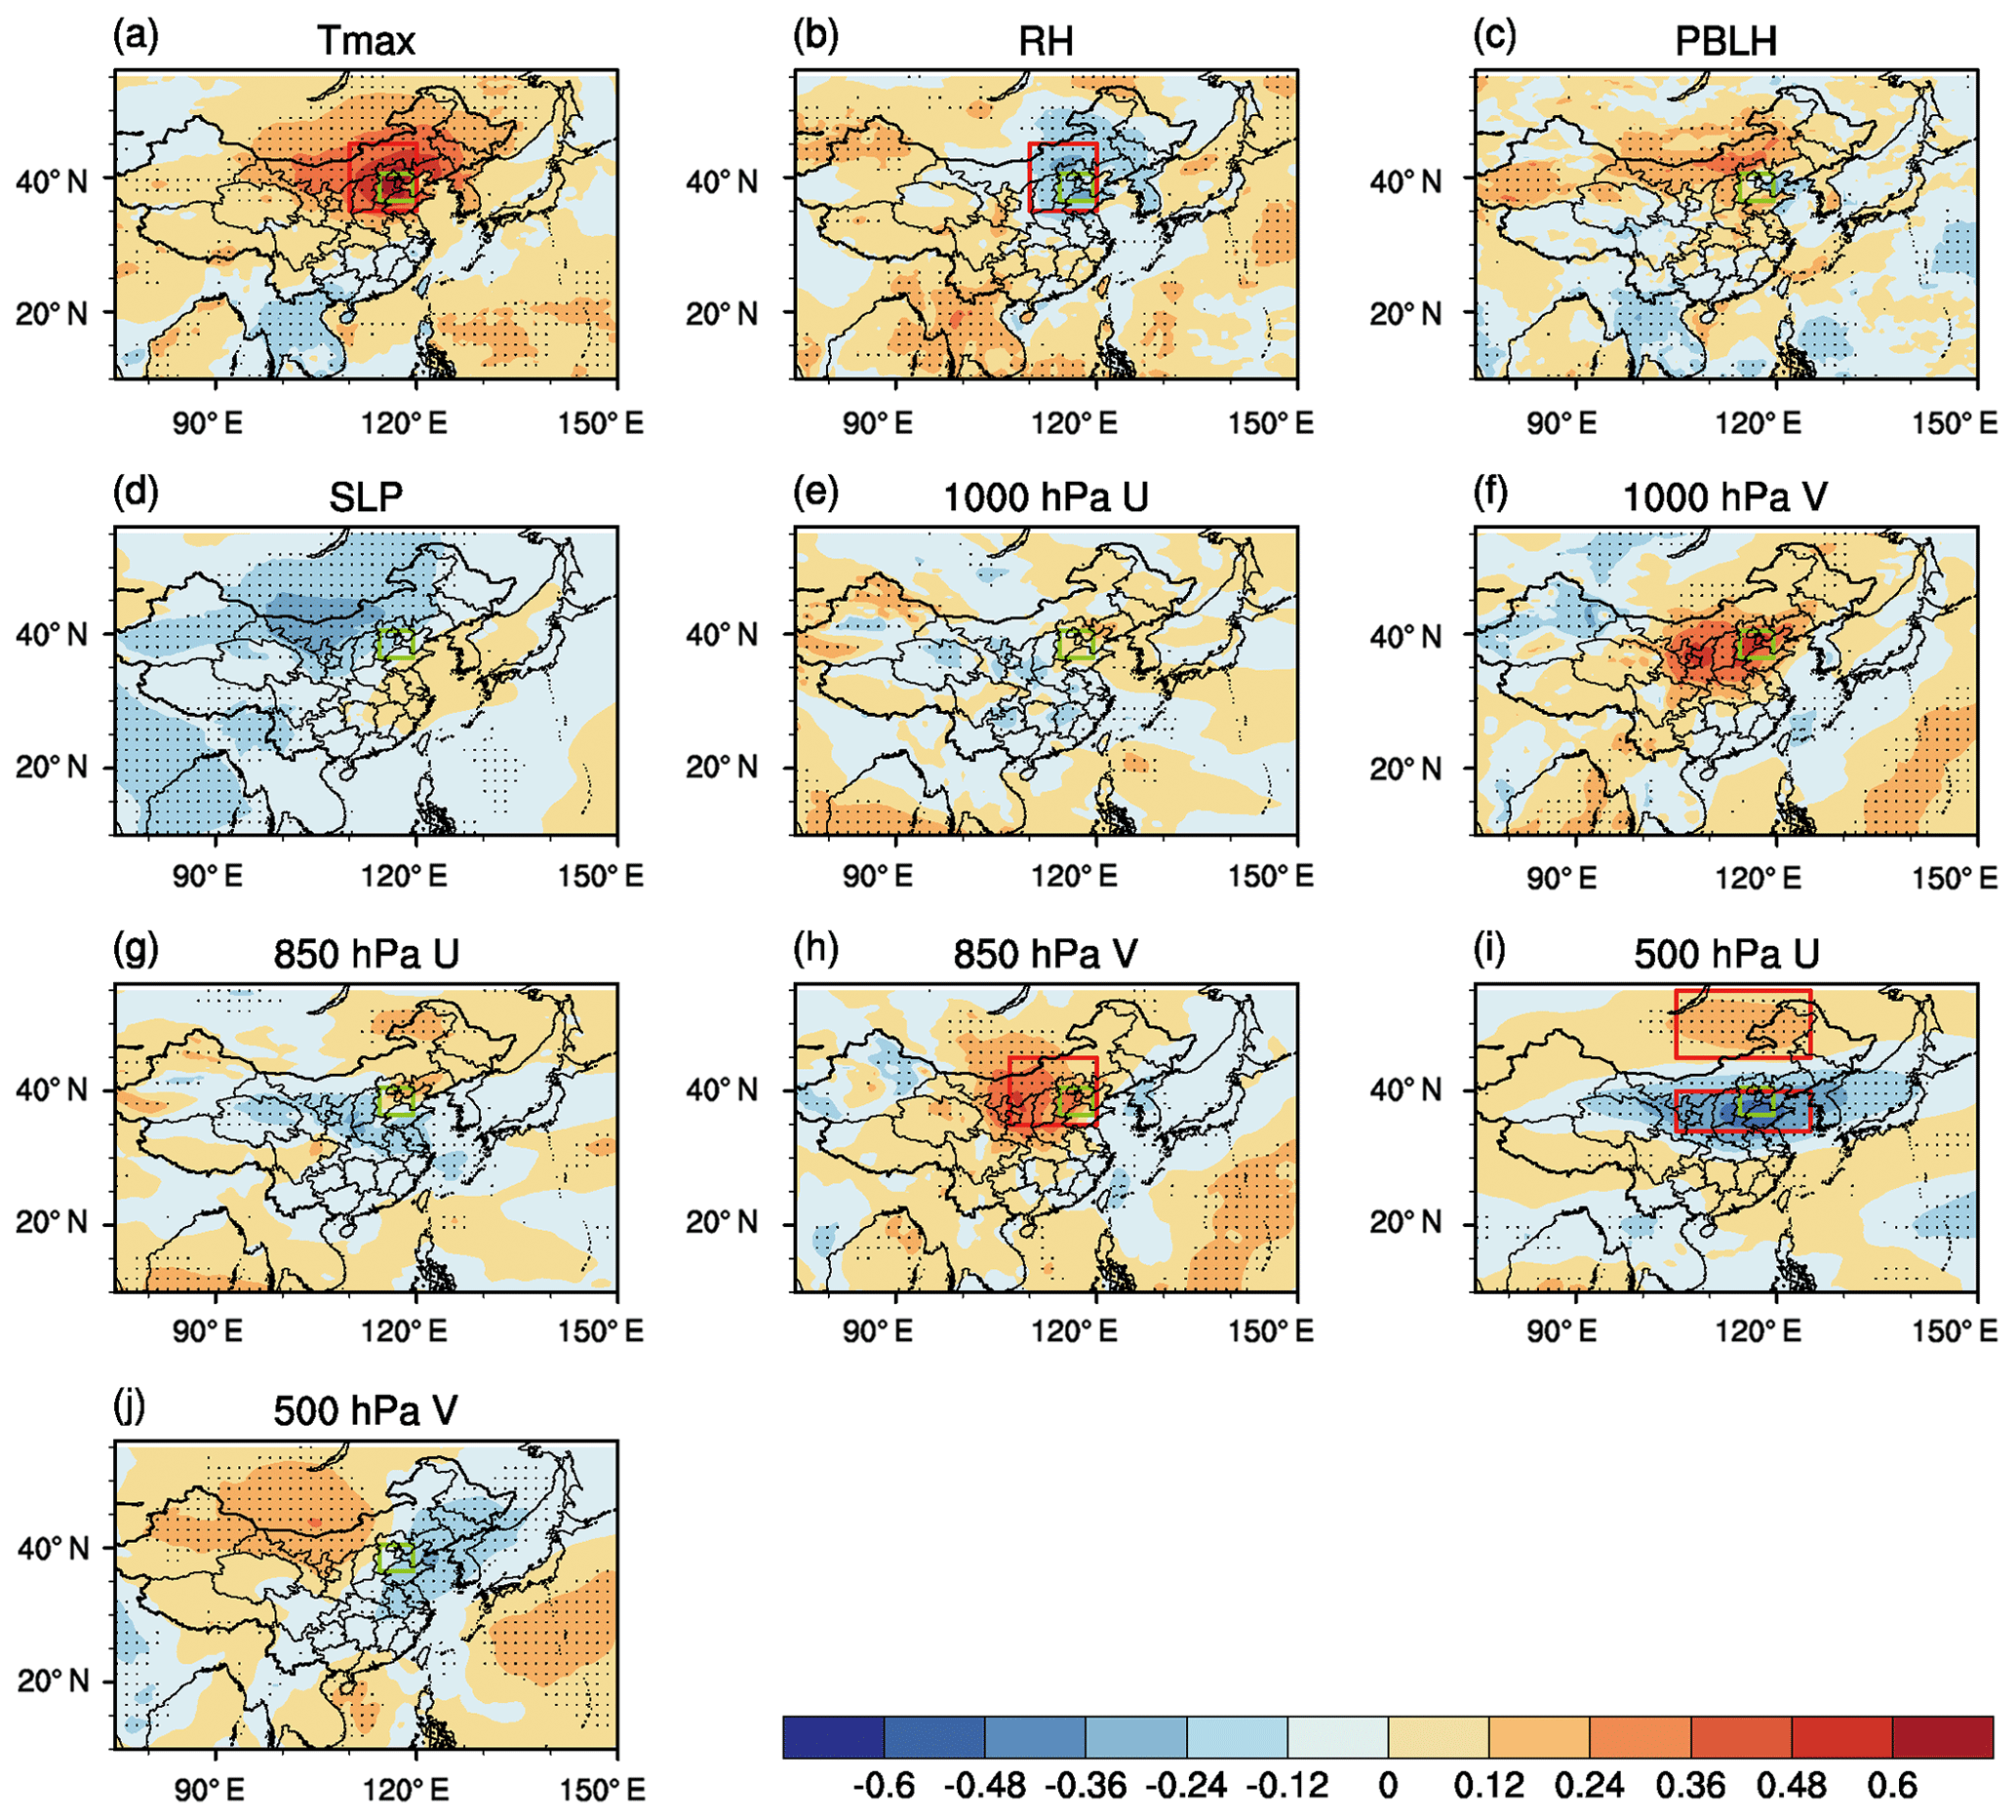
Figure 5Correlation coefficients for the months of May to July of 2014–2017 between daily regional mean MDA8 O3 concentrations in North China and daily mean (a) 2 m Tmax at the surface, (b) RH at the surface, (c) planetary boundary layer height, (d) surface level pressure, (e) meridional winds at 1000 hPa, (f) zonal winds at 1000 hPa, (g) meridional winds at 850 hPa, (h) zonal winds at 850 hPa, (i) meridional winds at 500 hPa and (j) zonal winds at 500 hPa in Asia. Correlation coefficients with black dots are statistically significant above the 95 % confidence level. The red rectangles in (a), (b), (h) and (i) denote the regions for calculating index_Tmax, index_RH, index_V850 and index_U500, respectively (see Sect. 4.3). The green rectangle indicates the region of North China.
4.3 Definition of I_OPE
As described above, the weather pattern associated with high MDA8 O3 concentrations in North China can be characterized by high Tmax and low RH at the surface, anomalous southerlies in the lower atmosphere, and anomalous high pressure at the 500 hPa level. We can then define an index I_OPE to represent such a weather pattern and to examine how many O3-polluted days and OPEs in North China occurred under such a weather pattern. For a specific day, I_OPE is defined as follows:
where x indicates Tmax, RH, V850 or U500, and the square bracket indicates standardization. The four index_x values are calculated by
where i and j indicate latitude and longitude of the grid cell, respectively. Tmaxi,j, for example, is the Tmax in grid (i,j) on a specific day after the time series is standardized, as described in Sect. 2.2. Domains with strong correlation between each parameter (Tmax, RH, V850, or U500) and MDA8 O3 concentrations in North China are shown in Fig. 5 by red rectangles. Since RH exhibits a negative correlation with MDA8 O3 concentrations, index_RH has a negative sign in Eq. (5).
Figure 6 shows the time series of MDA8 O3 concentrations in North China and the five indexes (index_Tmax, index_RH, index_V850, index_U500 and I_OPE). The OPEs in Fig. 6a (pink rectangles) are captured by the five indexes. Among all the indexes, index_Tmax has the strongest correlation with MDA8 O3 concentrations, with a correlation coefficient (r) of 0.56. The correlation coefficients between index_RH, index_V850 and index_U500 and MDA8 O3 concentrations are 0.30, 0.37 and 0.44, respectively. It is interesting that the correlation coefficient between I_OPE and MDA8 O3 is 0.67, which is higher than that between each individual index and MDA8 O3, indicating that MDA8 O3 concentrations in North China are influenced by multiple meteorological factors rather than a single factor.
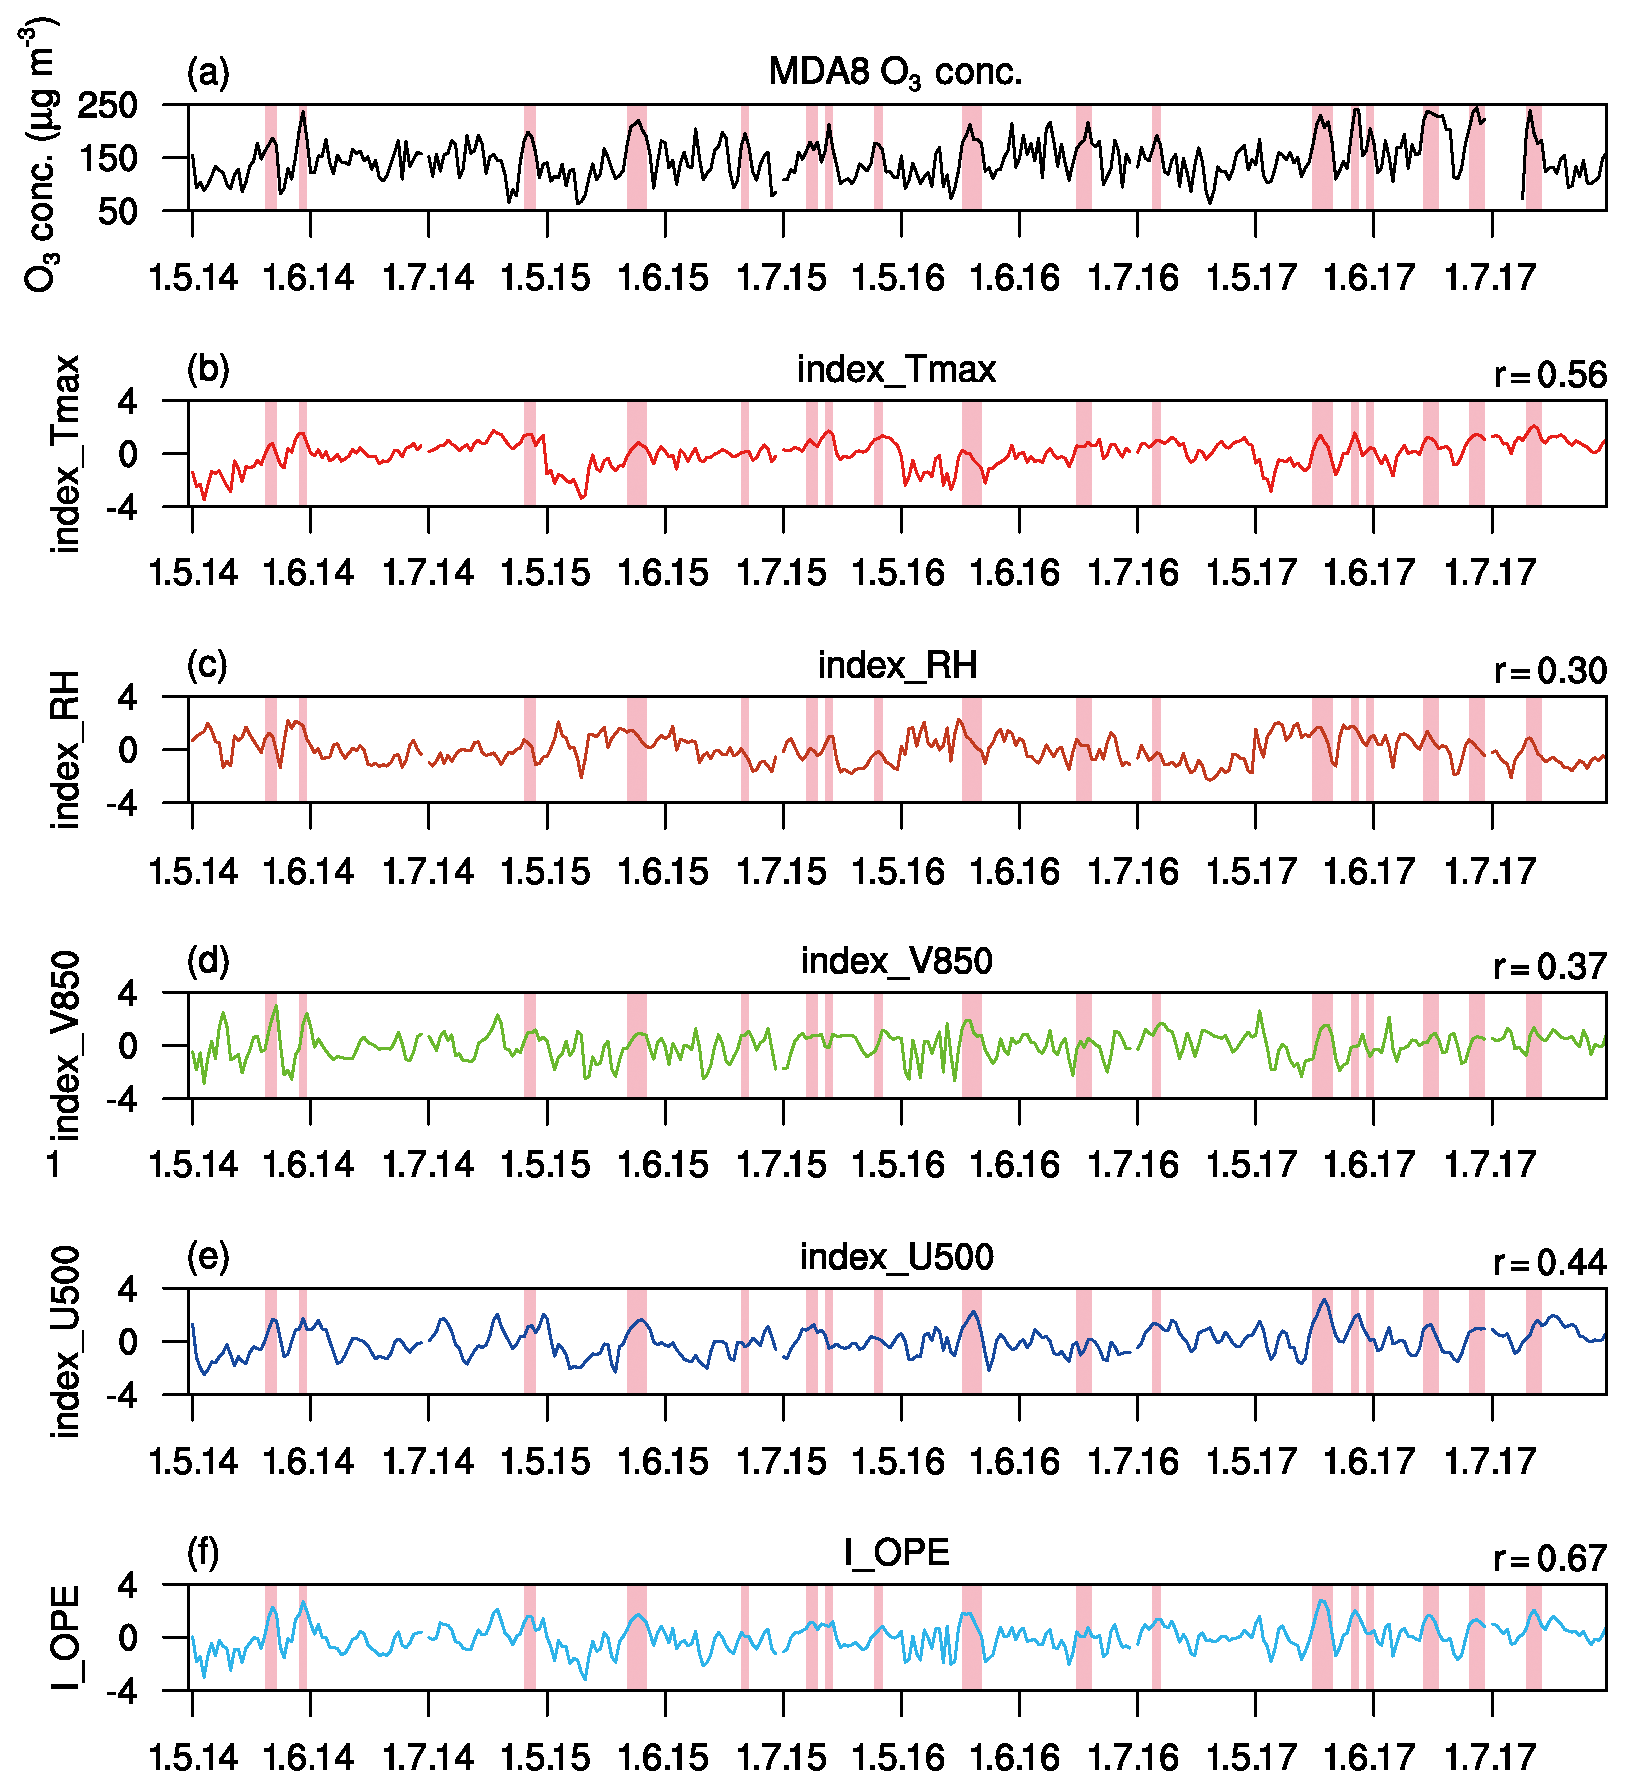
Figure 6Daily variations in (a) MDA8 O3 concentrations (µg m−3) in North China, (b) index_Tmax, (c) index_RH, (d) index_V850, (e) index_U500 and (f) I_OPE for the months of May to July of 2014–2017. Observed OPEs in North China are highlighted by pink rectangles. Correlation coefficients between MDA8 O3 concentrations and different indexes are shown above the top right corner of each plot.
Figure S2 shows the composite patterns of anomalies of meteorological fields (Tmax at the surface, RH at the surface, winds at 850 hPa and winds at 500 hPa) for OPEs (Fig. S2a–d) and for days with I_OPE > 0 (Fig. S2e–h). The similarity in patterns between these two types of composite analyses indicates that I_OPE can capture the weather pattern associated with OPEs, including the high Tmax, low RH, anomalous southerlies at 850 hPa and the anomalous anticyclonic winds at 500 hPa. From the months of May to July over 2014–2017, there were 123 d with regionally averaged observed O3 concentrations of greater than 160 µg m−3, in which 83.7 % days (103 of 123) occurred under the condition of I_OPE > 0. Conversely, 55.0 % days (103 of 186) with I_OPE > 0 and 75.0 % days (42 of 56) with I_OPE > 1 were observed for O3 pollution days in North China. Among the observed 21 OPEs (90 d), 17 OPEs (71 d) occurred under a weather pattern with I_OPE > 0. Therefore, I_OPE can be used as a meteorological predictor for OPEs in North China.
5.1 Simulated OPEs
We have identified a typical weather pattern associated with OPEs in North China, as presented in Sect. 4. Here, we use the GEOS-Chem simulation of O3 in the months of May to July of 2014–2017 to quantify the contributions of different chemical and physical processes to OPEs under such a weather pattern. Figure 7 shows the time series of observed and simulated daily MDA8 O3 averaged over North China. The correlation coefficients between the observed and simulated MDA8 O3 are 0.53, 0.64, 0.61 and 0.71 in 2014, 2015, 2016 and 2017, respectively, indicating that the GEOS-Chem model can simulate the daily variation in MDA8 O3. Compared to observed MDA8 O3 concentrations, the simulated concentrations have a mean bias (MB) (normalized mean bias, NMB) of 2.4 µg m−3 (1.7 %) in 2014, 6.7 µg m−3 (4.9 %) in 2015, 1.8 µg m−3 (1.2 %) in 2016 and −12.5 µg m−3 (−8.4 %) in 2017, indicating the capability of the model to simulate the MDA8 O3 concentrations. For all the data samples from the months of May to July of 2014–2017, the observed MDA8 O3 concentration averaged over North China is 146.8 µg m−3 and the simulated mean value is also 146.8 µg m−3. The linear regression between observed and simulated MDA8 O3 by the least-squares method through the origin has a regression coefficient of 0.96 (Fig. S3).
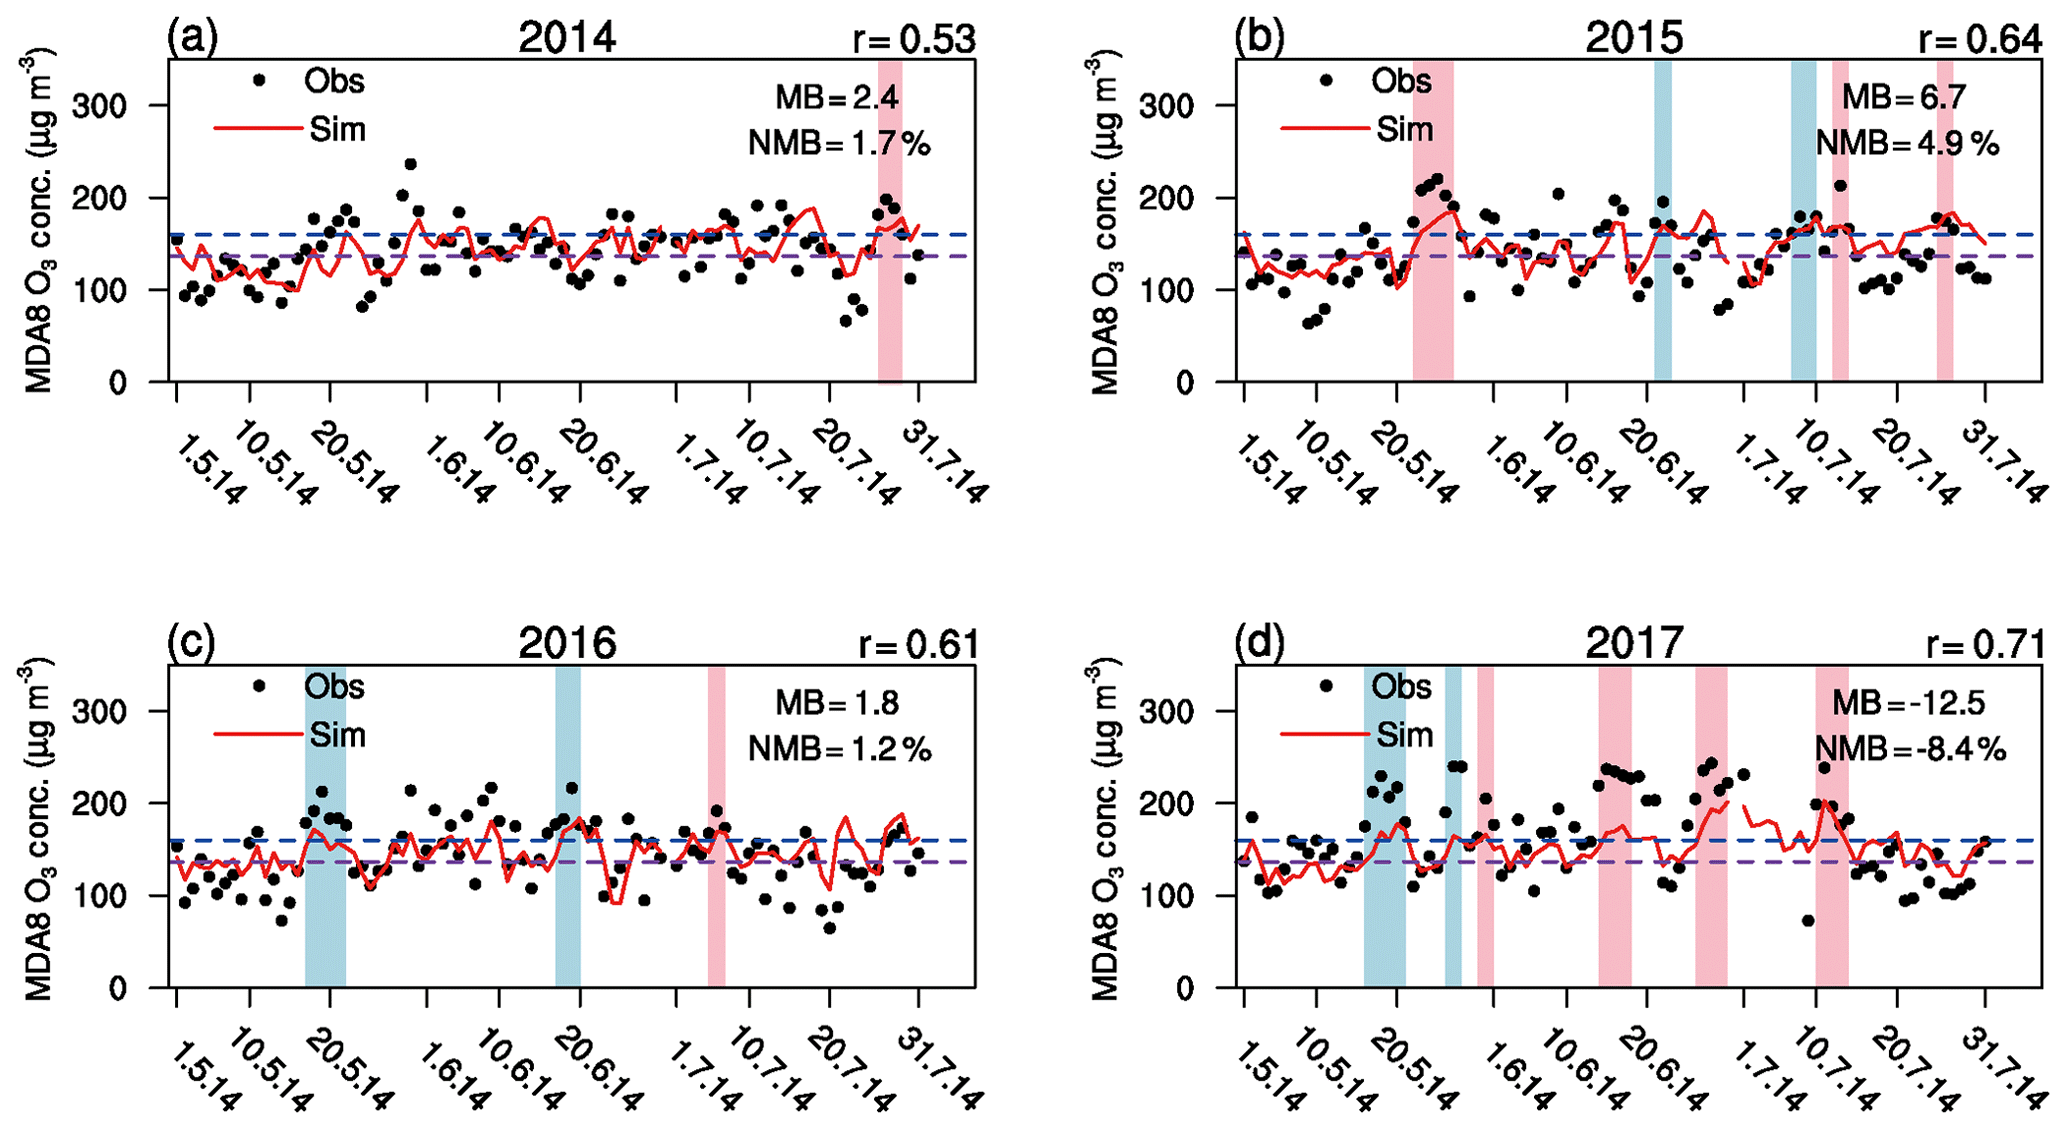
Figure 7Daily variations in observed (black dots) and simulated (solid red lines) regional mean MDA8 O3 (µg m−3) in North China during the months of May to July of 2014–2017. The dashed blue and dashed purple lines indicate the thresholds of 160 and 136.6 µg m−3 for observation and simulation, respectively. OPEs captured by the GEOS-Chem model with I_OPE > 0 are highlighted by pink rectangles (OPEs with simulated MDA8 O3 concentrations larger than 160 µg m−3) and by blue rectangles (OPEs with simulated MDA8 O3 concentrations larger than 136.6 µg m−3 but including days with simulated MDA8 O3 smaller or equal to 160 µg m−3). Correlation coefficient between observed and simulated MDA8 O3 concentrations for each year is shown above the top right corner of each plot. The mean bias (MB) and normalized mean bias (NMB) are calculated by and , where Oi and Si indicate the observed and simulated MDA8 O3 concentrations on the i day, respectively, and n indicates the number of days.
The GEOS-Chem model, however, has some difficulties in capturing the peak values of MDA8 O3, as reported in previous studies by Zhang and Wang (2016) and Ni et al. (2018). During the months of May to July of 2014–2017, for the O3-polluted days with observed MDA8 O3 > 160 µg m−3, comparisons of simulated values with observations show an NMB of −14.6 %. As a result, if the same threshold (160 µg m−3) is applied in the model to define O3-polluted days, only 9 OPEs (highlighted by pink rectangles in Fig. 7) among the 17 OPEs with I_OPE > 0 can be captured by the model. Considering that the model has an NMB of −14.6 % for the days with observed MDA8 O3 > 160 µg m−3, a revised lower threshold of 136.6 µg m−3 (160⋅85.4 %) is adopted to define the O3-polluted days in the model, and, consequently, six more OPEs are identified (highlighted by light blue rectangles in Fig. 7). Therefore, among the 17 OPEs (71 d) under the typical weather pattern, 15 episodes (63 d) can be identified by the model. We then carry out IPR analysis for these 15 episodes (63 d) to understand how the typical weather pattern leads to OPEs in North China.
5.2 IPR analysis
The vertical profile of simulated daily O3 concentrations averaged over the months of May to July in 2014–2017 as well as those composited over the 15 OPEs are shown in Fig. 8a. For both profiles, the O3 concentrations are highest between 950 and 850 hPa and are relatively low at the surface due to the titration by high NOx concentrations. When OPEs occur, O3 concentrations are higher from the surface to 700 hPa (about 3 km altitude) but change little above 700 hPa, indicating that the enhancement of O3 concentrations during OPEs occurs not only at the surface but also in and above the boundary layer.
Five processes that influence O3 concentrations are analyzed, including net chemical production, horizontal advection, vertical advection, dry deposition and diffusion. Note that wet deposition is not considered because of its small contribution to the O3 budget (Mickley et al., 1999; Liao et al., 2006). All of the processes are diagnosed at every time step and then summed over each day in the simulation. To avoid the discrepancy in the O3 budget because of different lasting days of OPEs, the daily mean net change in O3 mass (Gg O3 d−1) is presented for each process. We also calculate PC(%), as described in Sect. 2.4, to examine the relative percentage contribution of each process. The horizontal domain for the IPR analysis is North China (36.5–40.5∘ N, 114.5–119.5∘ E). We first diagnose the vertical profiles of net changes in O3 mass for the model layers from the surface to 500 hPa, averaged over all days in the months of May to July of 2014–2017, and then quantify the anomalous net changes in O3 mass during OPEs, relative to the seasonal mean flux, to identify the major changes in processes that lead to high O3 episodes. Finally, mechanisms that lead to OPEs in North China are discussed on the basis of process analysis.
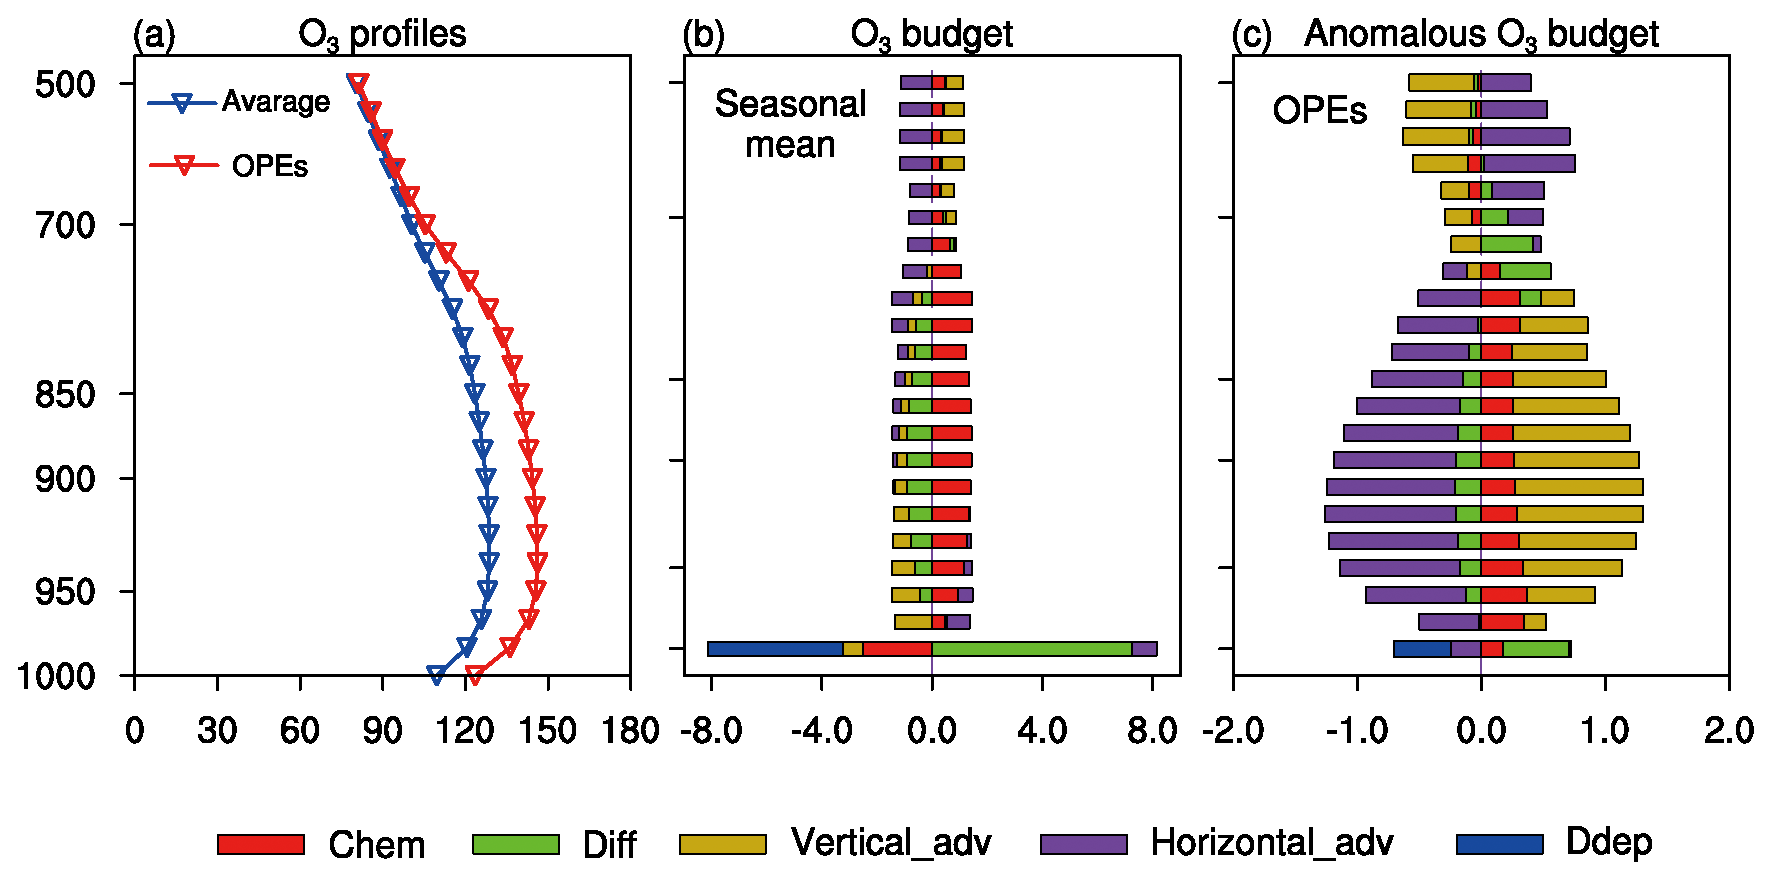
Figure 8(a) Vertical profile of simulated daily O3 concentrations (µg m−3) averaged over the months of May to July in 2014–2017 (blue line and triangle) as well as those composited over the 15 simulated OPEs with I_OPE > 0 (red line and triangle) in North China. (b) Vertical profile of net change in O3 mass (Gg O3 d−1) over North China for each process that is averaged over all days in the months of May to July of 2014–2017. (c) Anomalous vertical profile of each process during the 15 OPEs relative to the mean value of the months of May to July of 2014–2017. The vertical axis is the same for all the panels with a unit of hPa.
5.2.1 Vertical profiles of net changes in O3 mass averaged over the months of May to July of 2014–2017
Figure 8b shows the vertical profiles of net changes in O3 mass for each process over North China, averaged over all days in the months of May to July of 2014–2017. Net chemical production at the surface is a large negative value (−2.5 Gg O3 d−1) (Fig. 8b) as a result of the O3 titration effect by high NOx concentrations at the surface. In the upper layers, because of the decreases in NOx concentrations and stronger radiation, net chemical production has positive contributions to O3 concentration over North China, with high values exceeding 1.4 Gg O3 d−1 at approximately 900 and 800 hPa. Note that net chemical production is practically the only process that increases O3 between 930 and 800 hPa. Above 750 hPa, net chemical production decreases due to the decreases in O3 precursors.
Diffusion process in the GEOS-Chem model describes the mixing in the boundary layer, which transports O3 along the concentration gradient. Since O3 concentrations are higher at 950 to 850 hPa than at the surface (Fig. 8a), the diffusion transports O3 from the upper boundary layer downward to the surface. As a result, the IPR analysis shows that the net mass change in O3 by diffusion is negative between 950 and 850 hPa but positive at the surface (Fig. 8b). Note that the net changes in O3 mass over North China by the diffusion process should approximately equal to zero (Table 1) if we integrate the change in O3 mass by diffusion from the surface to 850 hPa because diffusion just redistributes the O3 mass vertically in the boundary layer. The downward transport of O3 by diffusion was also reported in previous IPR analyses (e.g., Khiem et al., 2010; Li et al., 2012; Tang et al., 2017).
Table 1Net changes (NC) in O3 mass (Gg O3 d−1) and percentage contributions (PC(%)) of different processes to O3 in North China (36.5–40.5∘ N, 114.5–119.5∘ E) from the surface to 850 hPa.

a Average indicates the mean NC in O3 mass and PC averaged over the months of May to July of 2014–2017. b OPEs indicate the averaged NC in O3 mass and PC for the 15 OPEs that are captured by the GEOS-Chem model with I_OPE > 0. c OPEs−average indicate the differences in NC in O3 mass between OPEs and the average.
Vertical advection exhibits negative net changes in O3 mass from the surface to approximately 750 hPa and then becomes positive in the upper layers (Fig. 8b), indicating that O3 is transported from the lower to upper atmosphere by vertical advection under the seasonal mean condition. Horizontal advection increases O3 from the surface to approximately 900 hPa but decreases O3 at the upper levels (Fig. 8b). Dry deposition occurs at the surface and has a net change in O3 mass of −4.9 Gg O3 d−1 under the seasonal mean condition.
5.2.2 Comparison of processes during OPEs with the seasonal mean values
Figure 8c shows the profiles of the anomaly of each process during OPEs relative to the seasonal mean value over the months of May to July of 2014–2017. During OPEs, net chemical production at layers from the surface to approximately 800 hPa is enhanced significantly, generating O3 in North China. The largest enhancement occurs between 950 and 800 hPa, exceeding +0.3 Gg O3 d−1. With respect to diffusion during OPEs, both the positive contribution at the surface and the negative contributions in the upper layers increase (Fig. 8c), indicating that more O3 is mixed from the upper levels to the surface to increase the surface O3 concentration during OPEs.
The vertical and horizontal advections during OPEs are the processes that have the largest changes relative to the mean condition. Anomalous vertical advection increases O3 from the surface to approximately 800 hPa but decreases O3 above 700 hPa. A large amount of O3 is transported from aloft to the lower atmosphere by vertical advection, which will be examined in detail in Sect. 5.2.3 below. Horizontal advection reduces O3 from the surface to approximately 800 hPa, which will also be explained in Sect. 5.2.3.
Since O3 concentrations at the surface are determined by the processes in the boundary layer, we show in Table 1 the seasonal mean net changes in O3 mass, the absolute net changes in O3 mass during OPEs and their difference for each process in the boundary layer (from the surface to 850 hPa) over North China. Relative to the mean condition, net chemical production, diffusion, dry deposition, horizontal advection and vertical advection during OPEs change by 3.3, −1.1, −0.4, −9.1 and 8.1 Gg O3 d−1, indicating that net chemical production and vertical advection are the most dominant processes that lead to OPEs. During OPEs, net chemical production and vertical advection increase O3 in North China, while horizontal advection reduces O3 in this region.
5.3 Mechanisms for the typical weather pattern leading to OPEs
The typical weather pattern for OPEs in North China has been identified in Sect. 4, which is characterized by hot and dry air at the surface, anomalous southerlies and divergence in the lower troposphere, anomalous high pressure at 500 hPa and anomalous downward airflows from 500 hPa to the surface. The hot and dry air under the high-pressure system accelerates chemical production of O3 in and above the boundary layer (e.g., Zhang and Wang, 2016; Pu et al., 2017). Moreover, hot and sunny weather during OPEs increases the vertical concentration gradient (stronger chemical production at and above the upper boundary layer), leading to more O3 transported downward to the surface, as described in Sect. 5.2.2.
The diagnosed vertical advection anomaly during OPEs can be explained by Fig. 9a, which shows the pressure–latitude cross section of simulated daily mean O3 concentrations as well as the anomalous vertical pressure velocity profile averaged over North China during OPEs. Note that the regional mean vertical velocity near the surface is interfered with by the Yan Mountains, as described in Sect. 4.1, so we will not discuss the vertical air flow below 950 hPa. The anomalous downward air flow is high at 850 hPa, and the net chemical production of O3 is still strong above 850 hPa (Fig. 8c), leading to the large transport of O3 to the boundary layer to form OPEs (Table 1).
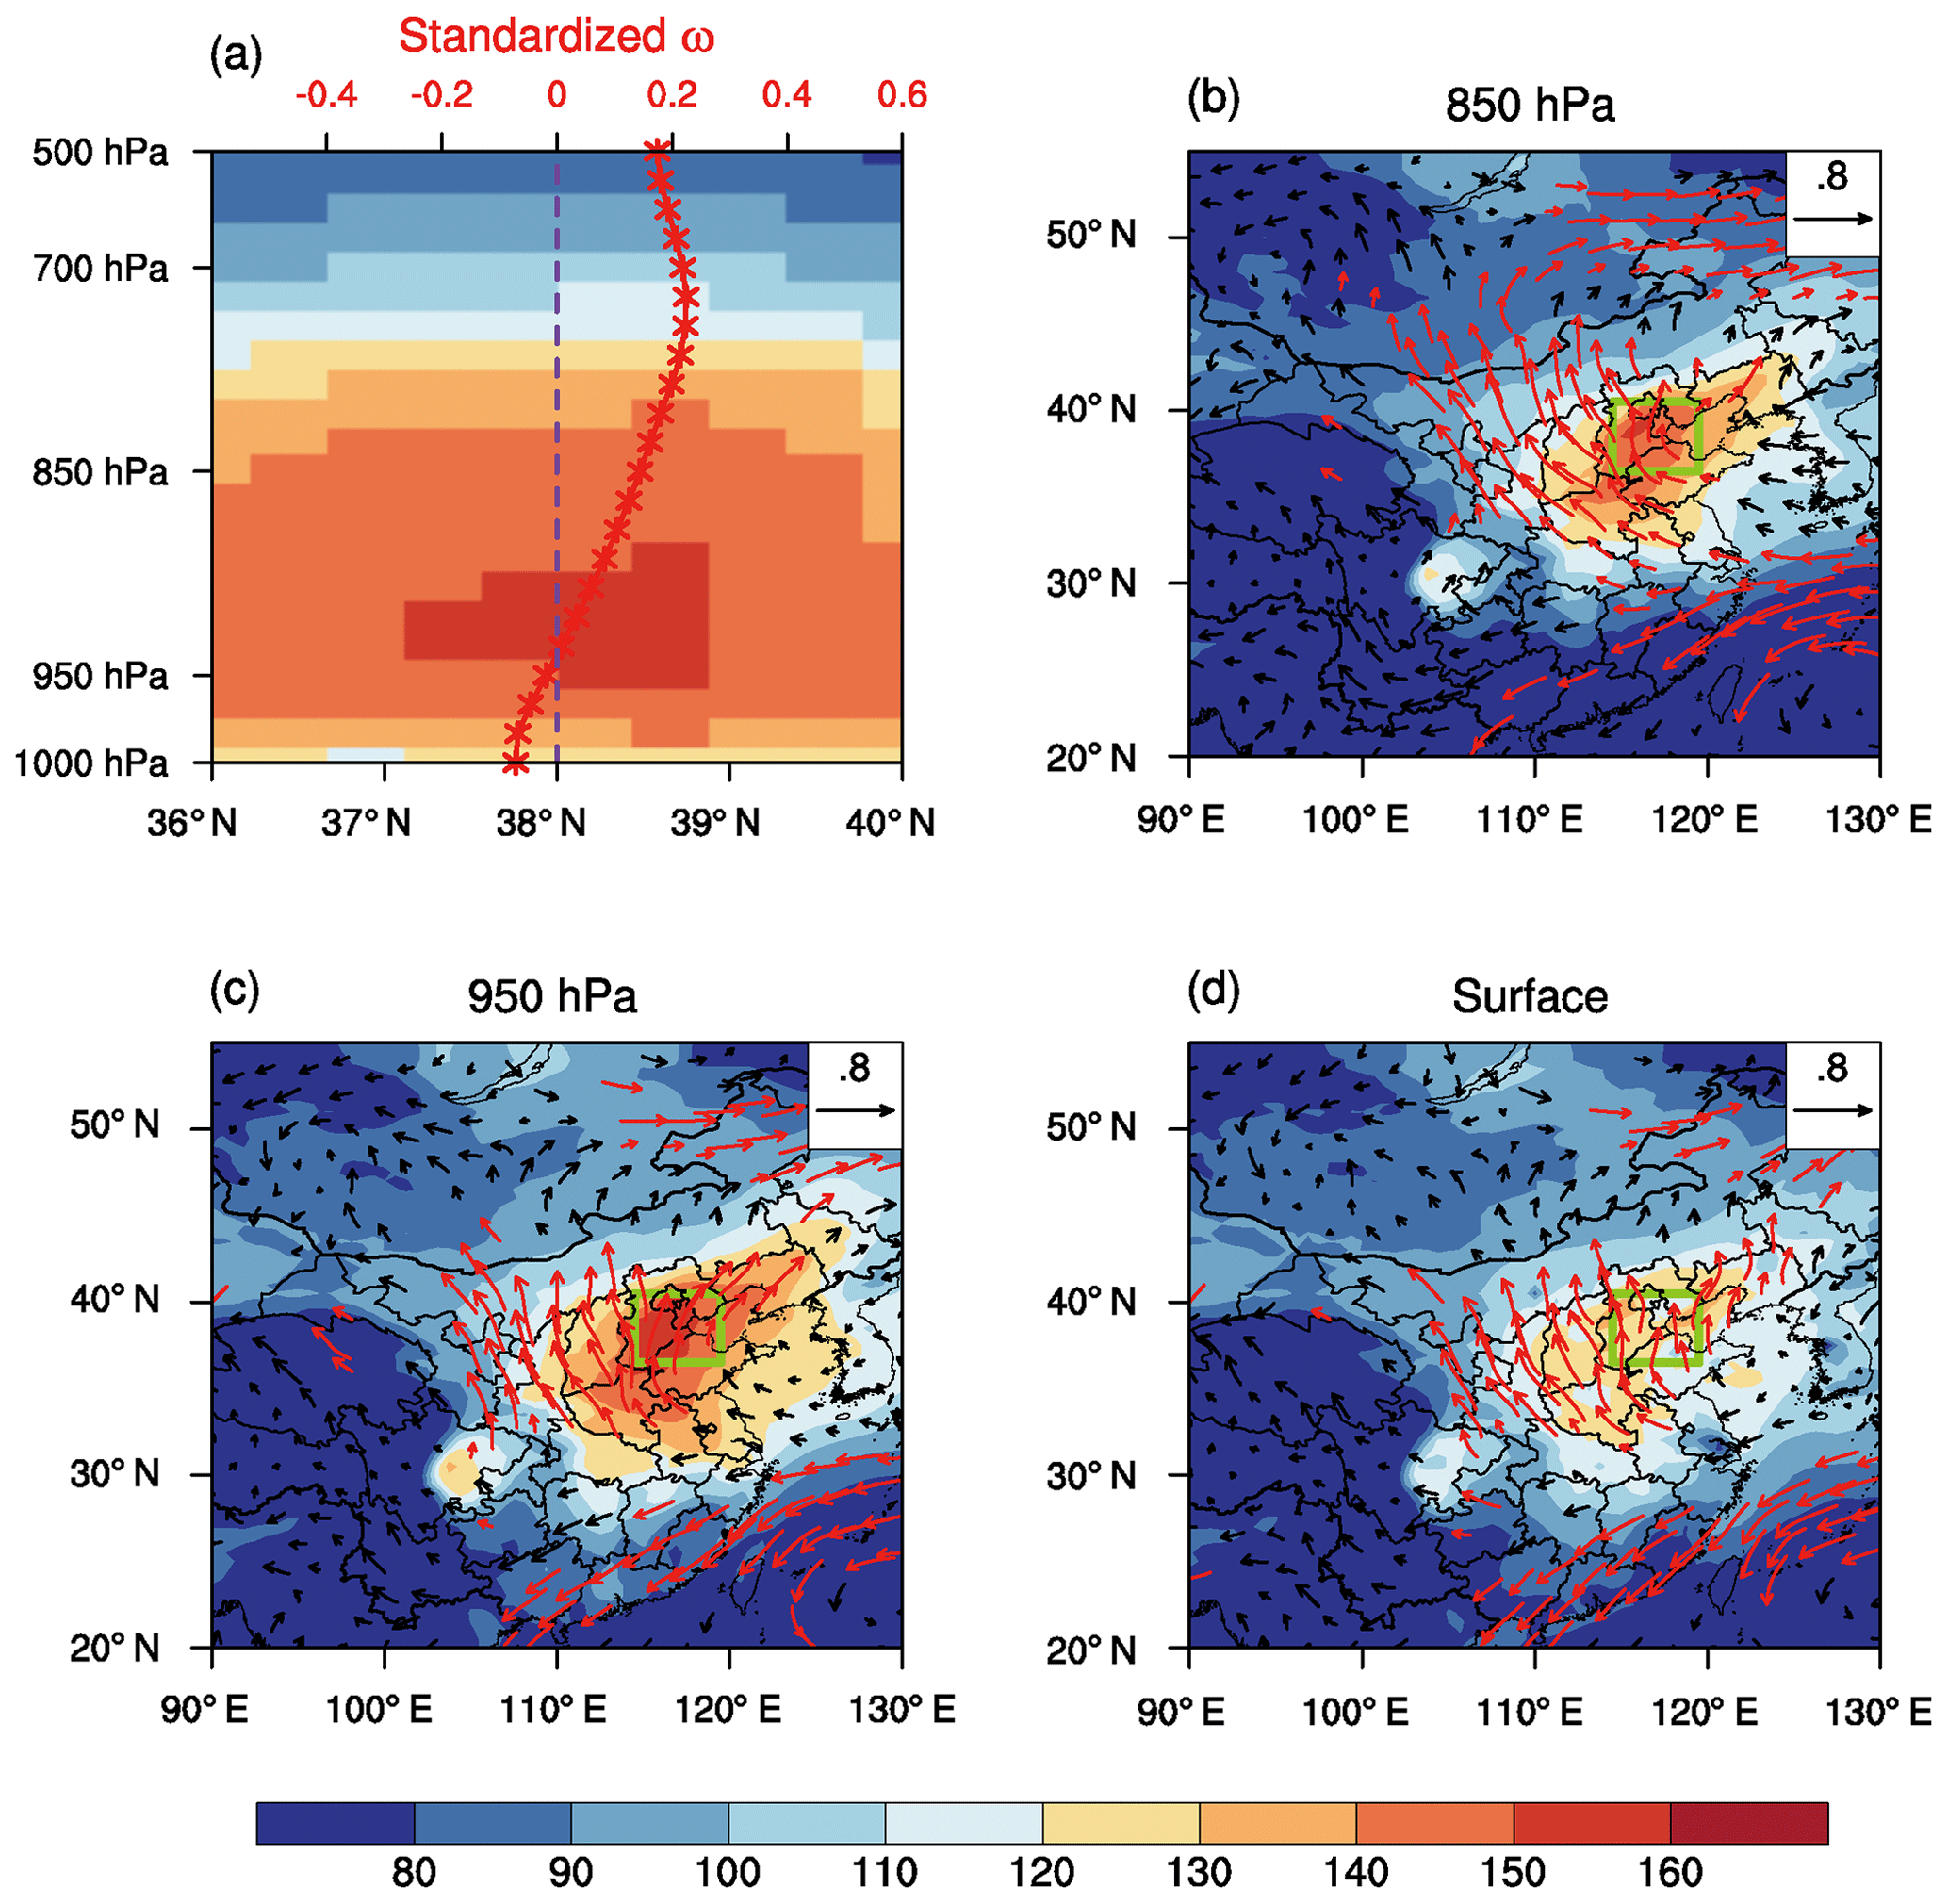
Figure 9(a) The pressure–latitude cross section averaged over the longitudes of 114.5–119.5∘ E of simulated daily mean O3 concentrations (µg m−3) during the 15 OPEs that are captured by the GEOS-Chem model with I_OPE > 0. The red line with asterisks shows the anomalous profile of the regionally averaged vertical pressure velocity (ω, Pa s−1, positive value indicates downward airflow) in North China. The dashed purple line indicates the position where the standardized ω is zero. Panels (b)–(d) show anomalous winds and the simulated daily mean O3 concentrations during OPEs at (b) 850 hPa, (c) 950 hPa and (d) the surface. The solid green lines indicate North China. ω in (a) and winds in (b)–(d) are composited over the standardized time series during the months of May to July of 2014–2017 (see Sect. 2.2). The red vectors in (b)–(d) are significant winds at 95 % confidence.
Figure 9b–d show the anomalous winds and the simulated daily mean O3 concentrations at 850, 950 hPa and the surface, respectively. The patterns of wind anomalies are similar at these three levels, all of which show a divergence of winds over North China, and anomalous southerlies prevail in this region. The divergence is caused by a high-pressure system at 500 hPa and is represented by index_U500 in the definition of I_OPE. Because O3 concentrations in North China are the highest during OPEs, horizontal advection associated with the divergence has an effect of decreasing O3 concentration in North China, as shown by the IPR analysis.
Currently, among the four indexes that are utilized to define I_OPE, the mechanisms for three of them (index_Tmax, index_RH and index_U500) have been demonstrated. It is of interest to understand the role of index_V850. On the one hand, the anomalous southerlies are associated with the high-pressure system. As Figs. 4b and 5h show, the strongest southerly anomalies at 850 hPa during OPEs are presented in the west of North China, which is consistent with the southerlies at the west boundary of the anticyclone circulation at 500 hPa. On the other hand, the southerlies are likely to have the effect of increasing the O3 concentrations by transporting O3 during OPEs. Figure 10 presents the composite daily mean O3 concentrations and winds at the surface, 950 and 850 hPa for the first day and the last day of the OPEs, respectively. In the composited first day of the OPEs, O3 concentrations in the south of North China are high (Fig. 10a–c). However, when the episodes are ending, O3 concentrations decrease in the southern domain but increase in North China (Fig. 10d–f), indicating that the O3 transport strengthens OPEs with the southerly winds.
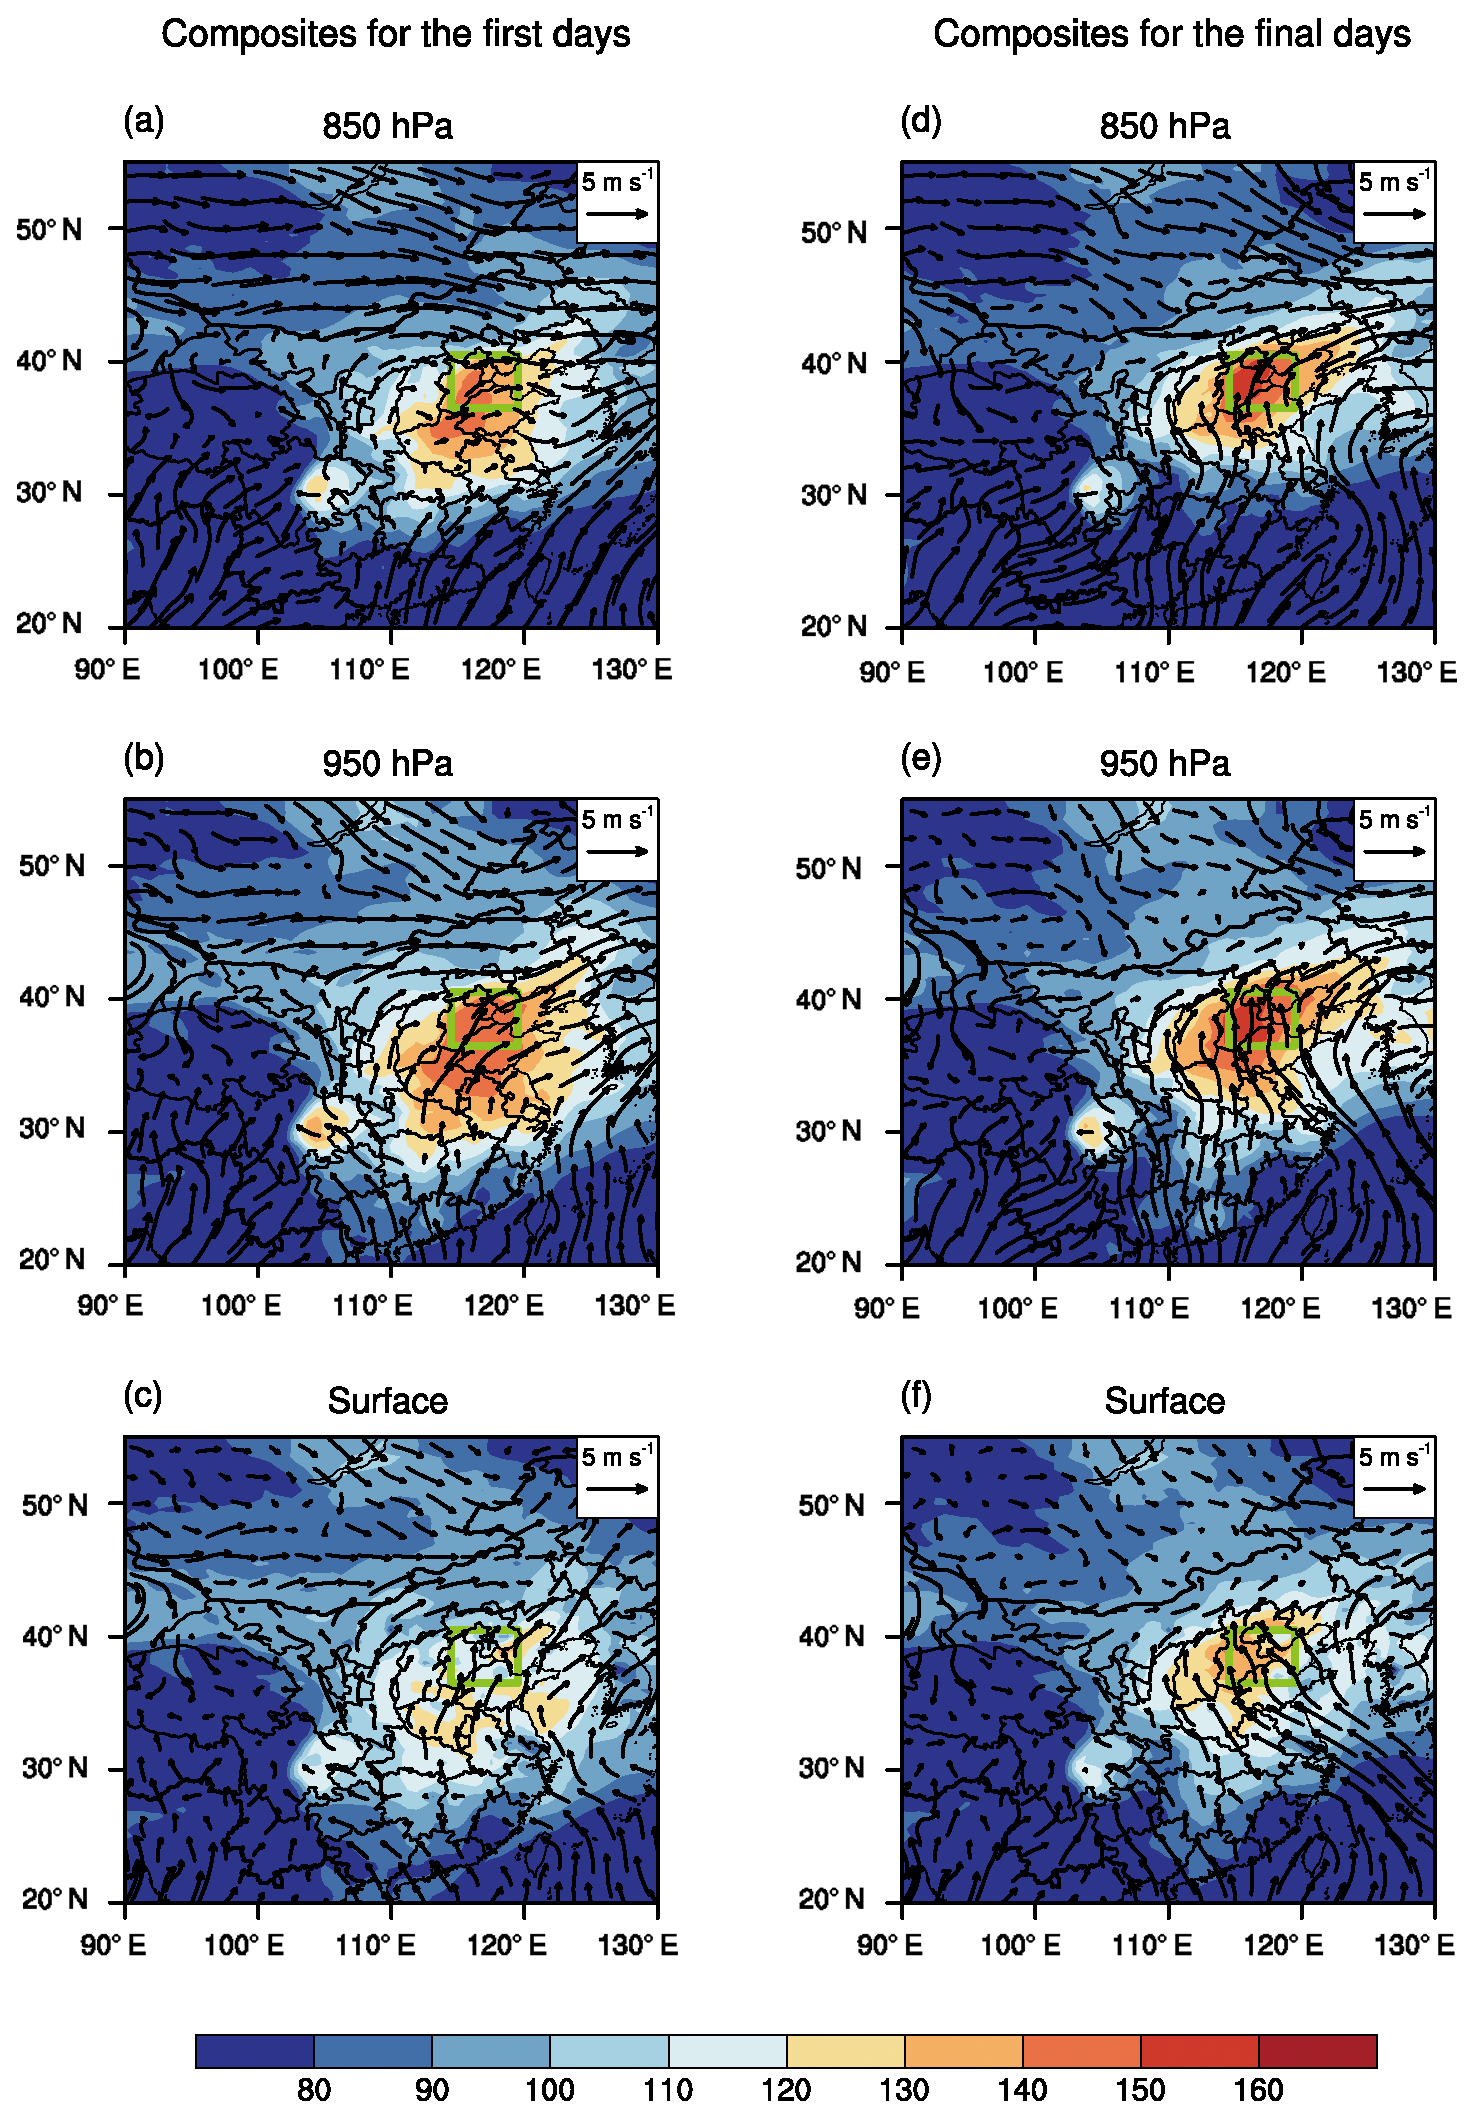
Figure 10Winds (m s−1) and the simulated O3 concentrations (µg m−3) averaged over the first day of the 15 OPEs that are captured by the GEOS-Chem model with I_OPE > 0 at (a) 850 hPa, (b) 950 hPa and (c) the surface. Panels (d)–(f) are the same as (a)–(c) but are averaged over the final day of the OPEs. The solid green lines indicate North China.
In this study, we utilized ground-level observations, reanalyzed meteorological data, and a 3-D global transport and chemical model (GEOS-Chem) to understand the ozone pollution events (OPEs) over the months of May to July of 2014–2017 in North China and their relationships with the weather pattern. O3-polluted days in North China are defined as days with an average MDA8 O3 concentration exceeding 160 µg m−3, and OPEs are defined as episodes where O3 pollution lasts for 3 days or longer.
Ground-based observations showed that North China had the worst O3 pollution in China. There were 167 O3-polluted days and 27 OPEs in North China in the years 2014–2017, in which 123 O3-polluted days and 21 OPEs occurred in the months May to July. The mean MDA8 O3 concentrations for OPEs in the months of May to July were 193.0 µg m−3.
A typical weather pattern was identified for OPEs in North China in the months May to July (Fig. 11), which is characterized by high Tmax and low RH at the surface, anomalous southerlies and divergence in the lower troposphere, an anomalous high-pressure system at 500 hPa, and downward air flow from 500 hPa to the surface. The hot and dry air accelerates chemical production of O3 in and above the boundary layer. The anomalous downward air flow under the high-pressure system transports O3 formed in the upper layers to the boundary layer. The anomalous southerlies associated with the high-pressure system transport O3 from the south to North China, enhancing the intensity of OPEs. Four parameters, including Tmax, RH, V850 and U500, were selected to define a standardized index I_OPE to represent such a weather pattern. In the months of May to July of 2014–2017, 83.7 % (103 of 123) of O3-polluted days and 80.9 % (17 of 21) of OPEs occurred with I_OPE > 0, indicating that I_OPE has the potential to be used for forecasting OPEs in North China.
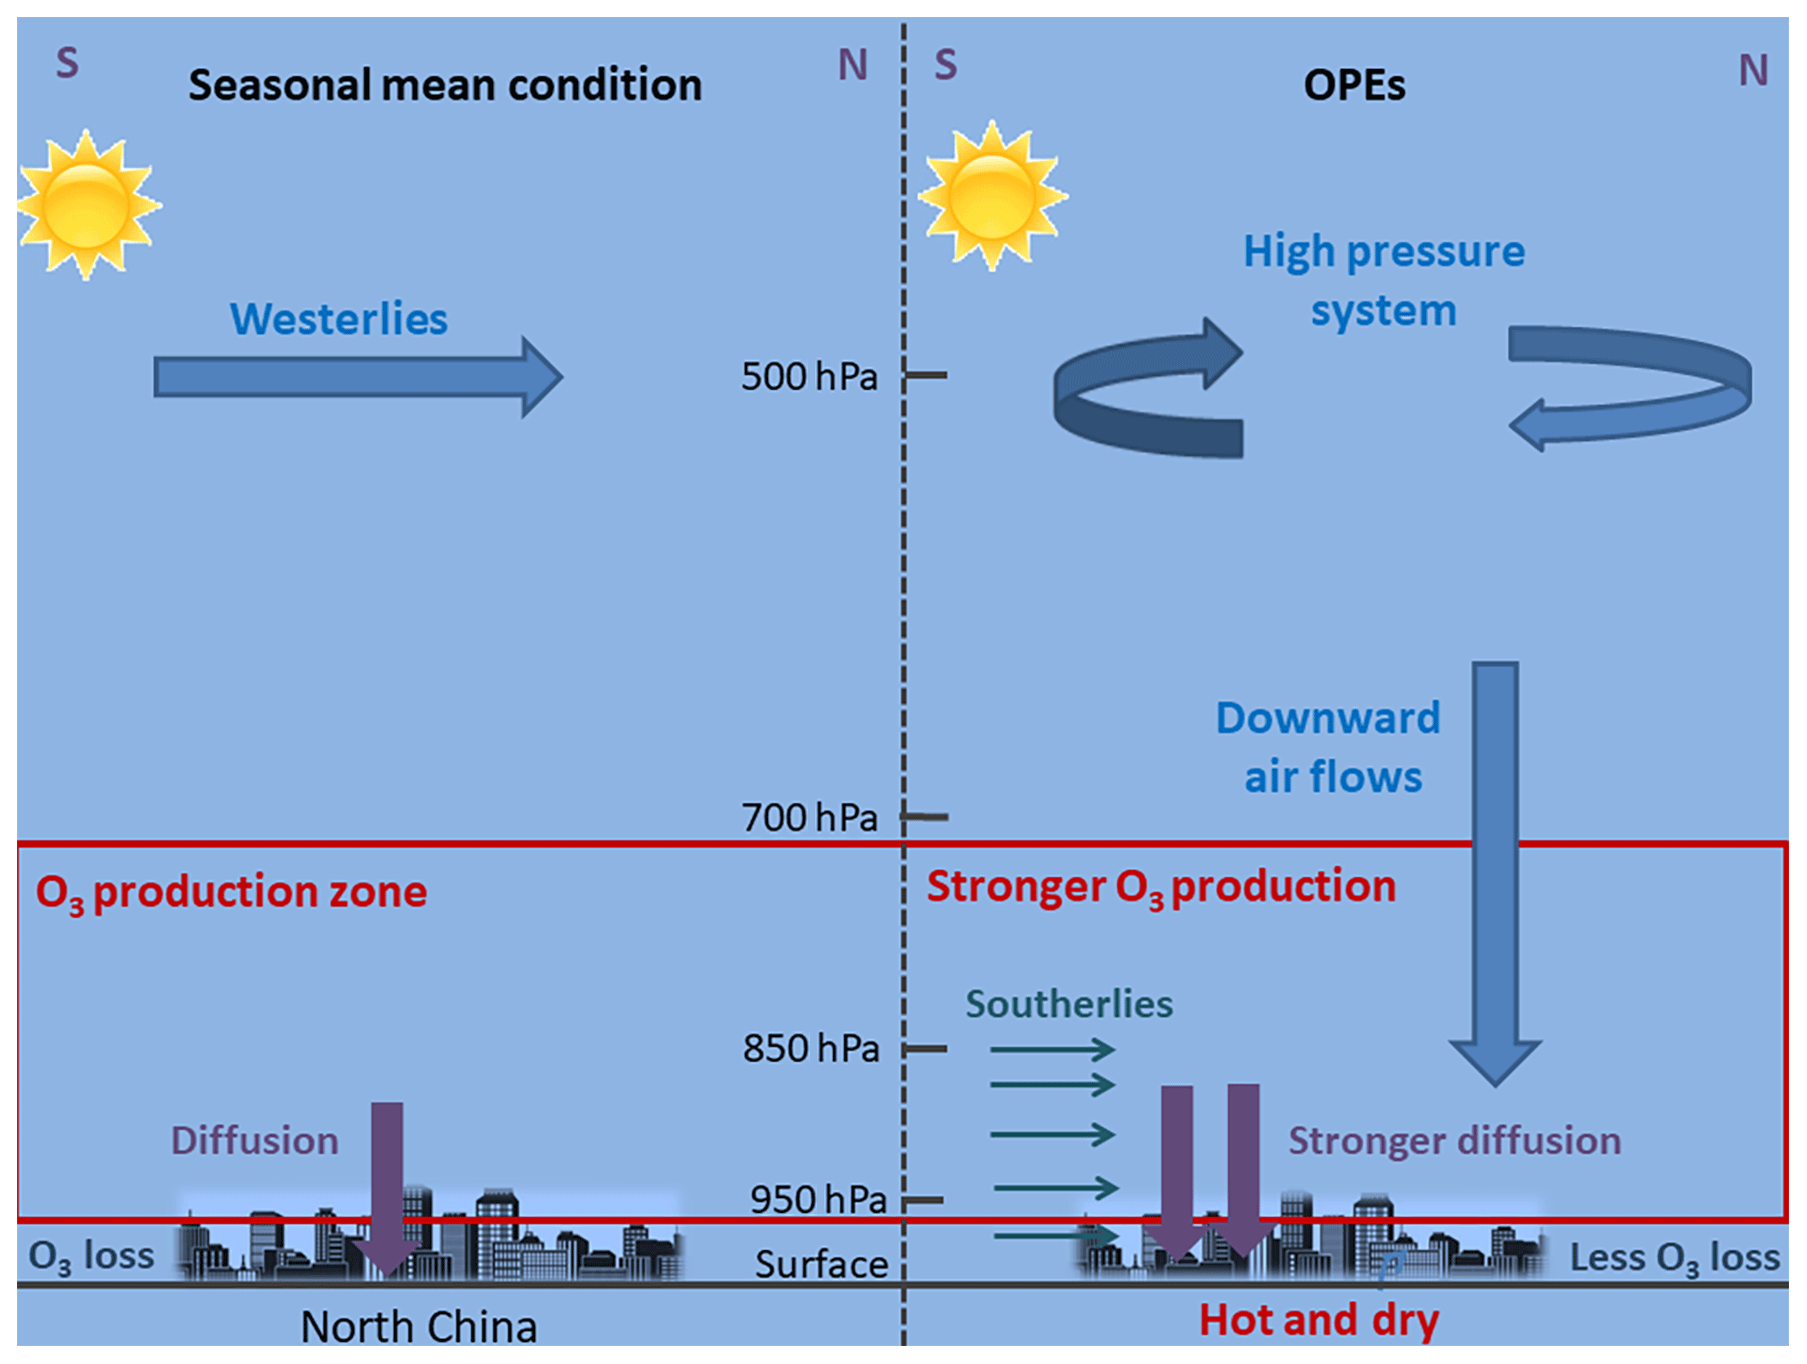
Figure 11A schematic diagram of the typical weather pattern showing the mechanisms for the formation of OPEs in North China.
Integrated process rate (IPR) analysis was applied in the GEOS-Chem model to quantify the contributions of each process (including net chemical production, diffusion, dry deposition, horizontal advection and vertical advection) to OPEs in North China. Relative to the mean condition, net chemical production, diffusion, dry deposition, horizontal advection and vertical advection during OPEs change by 3.3, −1.1, −0.4, −9.1 and 8.1 Gg O3 d−1, indicating that net chemical production and vertical advection are the most dominant processes that lead to OPEs. In North China, during OPEs, net chemical production has a high value at altitudes of 900 to 800 hPa and O3 generated is transported downward to increase O3 at the surface, whereas horizontal advection reduces surface O3.
The observed hourly ozone concentrations are derived from the Data Center of China's Ministry of Ecology and Environment (http://datacenter.mee.gov.cn/websjzx/queryIndex.vm, last access: 8 November 2019) over 2014–2017. The NCEP reanalyzed dataset is obtained from https://www.esrl.noaa.gov/psd/cgi-bin/data/getpage.pl (last access: 8 November 2019). The GEOS-Chem model is an open-access model managed by the Atmospheric Chemistry Modeling group at Harvard University with support from institutes in North America, Europe and Asia. The source codes, as well as the MERRA2 reanalyzed data, can be downloaded from http://acmg.seas.harvard.edu/geos/ (last access: 8 November 2019).
The supplement related to this article is available online at: https://doi.org/10.5194/acp-19-13725-2019-supplement.
HL and CG conceived the study and designed the experiments. CG carried out the simulations and performed the analysis. CG and HL prepared the manuscript with contributions from all coauthors.
The authors declare that they have no conflict of interest.
This article is part of the special issue “Regional transport and transformation of air pollution in eastern China”. It is not associated with a conference.
We acknowledge the Data Center of China's Ministry of Ecology and Environment and NCAR teams for making their data publicly available. We acknowledge the efforts of the GEOS-Chem working groups for developing and managing the model.
This research has been supported by the National Natural Science Foundation of China (grant nos. 91544219, 91744311 and 41475137) and by the Major Research Plan of the National Social Science Foundation (grant no. 18ZDA052).
This paper was edited by Tong Zhu and reviewed by two anonymous referees.
Ainsworth, E. A., Yendrek, C. R., Sitch, S., Collins, W. J., and Emberson, L. D.: The Effects of Tropospheric Ozone on Net Primary Productivity and Implications for Climate Change, Annu. Rev. Plant Biol., 63, 637–661, 2012.
Anenberg, S. C., Horowitz, L. W., Tong, D. Q., and West, J. J.: An Estimate of the Global Burden of Anthropogenic Ozone and Fine Particulate Matter on Premature Human Mortality Using Atmospheric Modeling, Environ. Health Persp., 118, 1189–1195, https://doi.org/10.1289/ehp.0901220, 2010.
Bell, M. L., Peng, R. D., and Dominici, F.: The exposure-response curve for ozone and risk of mortality and the adequacy of current ozone regulations, Environ. Health Persp., 114, 532–536, https://doi.org/10.1289/ehp.8816, 2006.
Bey, I., Jacob, D. J., Yantosca, R. M., Logan, J. A., Field, B. D., Fiore, A. M., Li, Q. B., Liu, H. G. Y., Mickley, L. J., and Schultz, M. G.: Global modeling of tropospheric chemistry with assimilated meteorology: Model description and evaluation, J. Geophys. Res.-Atmos., 106, 23073–23095, https://doi.org/10.1029/2001jd000807, 2001.
Bloomer, B. J., Stehr, J. W., Piety, C. A., Salawitch, R. J., and Dickerson, R. R.: Observed relationships of ozone air pollution with temperature and emissions, Geophys. Res. Lett., 36, L09803, https://doi.org/10.1029/2009gl037308, 2009.
Carro-Calvo, L., Ordonez, C., Garcia-Herrera, R., and Schnell, J. L.: Spatial clustering and meteorological drivers of summer ozone in Europe, Atmos. Environ., 167, 496–510, https://doi.org/10.1016/j.atmosenv.2017.08.050, 2017.
Finlayson-Pitts, B. J. and Pitts, J. N.: Tropospheric air pollution: Ozone, airborne toxics, polycyclic aromatic hydrocarbons, and particles, Science, 276, 1045–1052, https://doi.org/10.1126/science.276.5315.1045, 1997.
Fix, M. J., Cooley, D., Hodzic, A., Gilleland, E., Russell, B. T., Porter, W. C., and Pfister, G. G.: Observed and predicted sensitivities of extreme surface ozone to meteorological drivers in three US cities, Atmos. Environ., 176, 292–300, https://doi.org/10.1016/j.atmosenv.2017.12.036, 2018.
Fuhrer, J., Skarby, L., and Ashmore, M. R.: Critical levels for ozone effects on vegetation in Europe, Environ. Pollut., 97, 91–106, https://doi.org/10.1016/s0269-7491(97)00067-5, 1997.
Gonçalves, M., Jiménez-Guerrero, P., and Baldasano, J. M.: Contribution of atmospheric processes affecting the dynamics of air pollution in South-Western Europe during a typical summertime photochemical episode, Atmos. Chem. Phys., 9, 849–864, https://doi.org/10.5194/acp-9-849-2009, 2009.
Guenther, A. B., Jiang, X., Heald, C. L., Sakulyanontvittaya, T., Duhl, T., Emmons, L. K., and Wang, X.: The Model of Emissions of Gases and Aerosols from Nature version 2.1 (MEGAN2.1): an extended and updated framework for modeling biogenic emissions, Geosci. Model Dev., 5, 1471–1492, https://doi.org/10.5194/gmd-5-1471-2012, 2012.
Guo, J., Miao, Y., Zhang, Y., Liu, H., Li, Z., Zhang, W., He, J., Lou, M., Yan, Y., Bian, L., and Zhai, P.: The climatology of planetary boundary layer height in China derived from radiosonde and reanalysis data, Atmos. Chem. Phys., 16, 13309–13319, https://doi.org/10.5194/acp-16-13309-2016, 2016.
Jacob, D. J. and Winner, D. A.: Effect of climate change on air quality, Atmos. Environ., 43, 51–63, https://doi.org/10.1016/j.atmosenv.2008.09.051, 2009.
Jenkinson, A. F. and Collison, F. P.: An initial climatology of gales over the North Sea, Synoptic Branch Memorandum No. 62, Met Office, Exeter, 1977.
Jeong, J. I. and Park, R. J.: Effects of the meteorological variability on regional air quality in East Asia, Atmos. Environ., 69, 46–55, https://doi.org/10.1016/j.atmosenv.2012.11.061, 2013.
Jiang, F., Zhou, P., Liu, Q., Wang, T., Zhuang, B., and Wang, X.: Modeling tropospheric ozone formation over East China in springtime, J. Atmos. Chem., 69, 303–319, https://doi.org/10.1007/s10874-012-9244-3, 2012.
Kavassalis, S. C. and Murphy, J. G.: Understanding ozone-meteorology correlations: A role for dry deposition, Geophys. Res. Lett., 44, 2922–2931, https://doi.org/10.1002/2016gl071791, 2017.
Khiem, M., Ooka, R., Hayami, H., Yoshikado, H., Huang, H., and Kawamoto, Y.: Process analysis of ozone formation under different weather conditions over the Kanto region of Japan using the MM5/CMAQ modelling system, Atmos. Environ., 44, 4463–4473, https://doi.org/10.1016/j.atmosenv.2010.07.038, 2010.
Krupa, S. V., Nosal, M., and Legge, A. H.: A numerical analysis of the combined open-top chamber data from the USA and Europe on ambient ozone and negative crop responses, Environ. Pollut., 101, 157–160, https://doi.org/10.1016/s0269-7491(98)00019-0, 1998.
Lelieveld, J., Evans, J. S., Fnais, M., Giannadaki, D., and Pozzer, A.: The contribution of outdoor air pollution sources to premature mortality on a global scale, Nature, 525, 367–371, https://doi.org/10.1038/nature15371, 2015.
Li, K., Chen, L., Ying, F., White, S. J., Jang, C., Wu, X., Gao, X., Hong, S., Shen, J., Azzi, M., and Cen, K.: Meteorological and chemical impacts on ozone formation: A case study in Hangzhou, China, Atmos. Res., 196, 40–52, https://doi.org/10.1016/j.atmosres.2017.06.003, 2017.
Li, L., Chen, C. H., Huang, C., Huang, H. Y., Zhang, G. F., Wang, Y. J., Wang, H. L., Lou, S. R., Qiao, L. P., Zhou, M., Chen, M. H., Chen, Y. R., Streets, D. G., Fu, J. S., and Jang, C. J.: Process analysis of regional ozone formation over the Yangtze River Delta, China using the Community Multi-scale Air Quality modeling system, Atmos. Chem. Phys., 12, 10971–10987, https://doi.org/10.5194/acp-12-10971-2012, 2012.
Li, M., Zhang, Q., Kurokawa, J.-I., Woo, J.-H., He, K., Lu, Z., Ohara, T., Song, Y., Streets, D. G., Carmichael, G. R., Cheng, Y., Hong, C., Huo, H., Jiang, X., Kang, S., Liu, F., Su, H., and Zheng, B.: MIX: a mosaic Asian anthropogenic emission inventory under the international collaboration framework of the MICS-Asia and HTAP, Atmos. Chem. Phys., 17, 935–963, https://doi.org/10.5194/acp-17-935-2017, 2017.
Liao, H., Chen, W.-T., and Seinfeld, J. H.: Role of climate change in global predictions of future tropospheric ozone and aerosols, J. Geophys. Res.-Atmos., 111, D12304, https://doi.org/10.1029/2005jd006852, 2006.
Liao, Z., Gao, M., Sun, J., and Fan, S.: The impact of synoptic circulation on air quality and pollution-related human health in the Yangtze River Delta region, Sci. Total Environ., 607–608, 838–846, https://doi.org/10.1016/j.scitotenv.2017.07.031, 2017.
Lin, J.-T. and McElroy, M. B.: Impacts of boundary layer mixing on pollutant vertical profiles in the lower troposphere: Implications to satellite remote sensing, Atmos. Environ., 44, 1726–1739, https://doi.org/10.1016/j.atmosenv.2010.02.009, 2010.
Lou, S., Liao, H., Yang, Y., and Mu, Q.: Simulation of the interannual variations of tropospheric ozone over China: Roles of variations in meteorological parameters and anthropogenic emissions, Atmos. Environ., 122, 839–851, https://doi.org/10.1016/j.atmosenv.2015.08.081, 2015.
McLinden, C. A., Olsen, S. C., Hannegan, B., Wild, O., Prather, M. J., and Sundet, J.: Stratospheric ozone in 3-D models: A simple chemistry and the cross-tropopause flux, J. Geophys. Res.-Atmos., 105, 14653–14665, https://doi.org/10.1029/2000jd900124, 2000.
Mickley, L. J., Murti, P. P., Jacob, D. J., Logan, J. A., Koch, D. M., and Rind, D.: Radiative forcing from tropospheric ozone calculated with a unified chemistry-climate model, J. Geophys. Res.-Atmos., 104, 30153–30172, https://doi.org/10.1029/1999jd900439, 1999.
Mills, G., Sharps, K., Simpson, D., Pleijel, H., Broberg, M., Uddling, J., Jaramillo, F., Davies, W. J., Dentener, F., Van den Berg, M., Agrawal, M., Agrawal, S. B., Ainsworth, E. A., Buker, P., Emberson, L., Feng, Z., Harmens, H., Hayes, F., Kobayashi, K., Paoletti, E., and Van Dingenen, R.: Ozone pollution will compromise efforts to increase global wheat production, Glob. Change Biol., 24, 3560–3574, https://doi.org/10.1111/gcb.14157, 2018.
Molod, A., Takacs, L., Suarez, M., and Bacmeister, J.: Development of the GEOS-5 atmospheric general circulation model: evolution from MERRA to MERRA2, Geosci. Model Dev., 8, 1339–1356, https://doi.org/10.5194/gmd-8-1339-2015, 2015.
Mu, Q. and Liao, H.: Simulation of the interannual variations of aerosols in China: role of variations in meteorological parameters, Atmos. Chem. Phys., 14, 9597–9612, https://doi.org/10.5194/acp-14-9597-2014, 2014.
Ni, R., Lin, J., Yan, Y., and Lin, W.: Foreign and domestic contributions to springtime ozone over China, Atmos. Chem. Phys., 18, 11447–11469, https://doi.org/10.5194/acp-18-11447-2018, 2018.
Nuvolone, D., Petri, D., and Voller, F.: The effects of ozone on human health, Environ. Sci. Pollut. R., 25, 8074–8088, https://doi.org/10.1007/s11356-017-9239-3, 2018.
Park, R. J., Jacob, D. J., Chin, M., and Martin, R. V.: Sources of carbonaceous aerosols over the United States and implications for natural visibility, J. Geophys. Res.-Atmos., 108, 4355, https://doi.org/10.1029/2002jd003190, 2003.
Pu, X., Wang, T. J., Huang, X., Melas, D., Zanis, P., Papanastasiou, D. K., and Poupkou, A.: Enhanced surface ozone during the heat wave of 2013 in Yangtze River Delta region, China, Sci. Total Environ., 603–604, 807–816, https://doi.org/10.1016/j.scitotenv.2017.03.056, 2017.
Pye, H. O. T., Liao, H., Wu, S., Mickley, L. J., Jacob, D. J., Henze, D. K., and Seinfeld, J. H.: Effect of changes in climate and emissions on future sulfate-nitrate-ammonium aerosol levels in the United States, J. Geophys. Res.-Atmos., 114, D01205, https://doi.org/10.1029/2008jd010701, 2009.
Rasmussen, D. J., Fiore, A. M., Naik, V., Horowitz, L. W., McGinnis, S. J., and Schultz, M. G.: Surface ozone-temperature relationships in the eastern US: A monthly climatology for evaluating chemistry-climate models, Atmos. Environ., 47, 142–153, https://doi.org/10.1016/j.atmosenv.2011.11.021, 2012.
Roy, S., Beig, G., and Jacob, D.: Seasonal distribution of ozone and its precursors over the tropical Indian region using regional chemistry-transport model, J. Geophys. Res.-Atmos., 113, D21307, https://doi.org/10.1029/2007jd009712, 2008.
Seidel, D. J., Ao, C. O., and Li, K.: Estimating climatological planetary boundary layer heights from radiosonde observations: Comparison of methods and uncertainty analysis, J. Geophys. Res.-Atmos., 115, D16113, https://doi.org/10.1029/2009jd013680, 2010.
Shen, J., Zhang, Y., Wang, X., Li, J., Chen, H., Liu, R., Zhong, L., Jiang, M., Yue, D., Chen, D., and Lv, W.: An ozone episode over the Pearl River Delta in October 2008, Atmos. Environ., 122, 852–863, https://doi.org/10.1016/j.atmosenv.2015.03.036, 2015.
Shu, L., Xie, M., Wang, T., Gao, D., Chen, P., Han, Y., Li, S., Zhuang, B., and Li, M.: Integrated studies of a regional ozone pollution synthetically affected by subtropical high and typhoon system in the Yangtze River Delta region, China, Atmos. Chem. Phys., 16, 15801–15819, https://doi.org/10.5194/acp-16-15801-2016, 2016.
Sillman, S.: The relation between ozone, NOx and hydrocarbons in urban and polluted rural environments, Atmos. Environ., 33, 1821–1845, https://doi.org/10.1016/s1352-2310(98)00345-8, 1999.
Solomon, P., Cowling, E., Hidy, G., and Furiness, C.: Comparison of scientific findings from major ozone field studies in North America and Europe, Atmos. Environ., 34, 1885–1920, https://doi.org/10.1016/s1352-2310(99)00453-7, 2000.
Tang, G., Zhu, X., Xin, J., Hu, B., Song, T., Sun, Y., Zhang, J., Wang, L., Cheng, M., Chao, N., Kong, L., Li, X., and Wang, Y.: Modelling study of boundary-layer ozone over northern China – Part I: Ozone budget in summer, Atmos. Res., 187, 128–137, https://doi.org/10.1016/j.atmosres.2016.10.017, 2017.
Wang, T., Ding, A., Gao, J., and Wu, W. S.: Strong ozone production in urban plumes from Beijing, China, Geophys. Res. Lett., 33, L21806, https://doi.org/10.1029/2006gl027689, 2006.
Wang, T., Xue, L., Brimblecombe, P., Lam, Y. F., Li, L., and Zhang, L.: Ozone pollution in China: A review of concentrations, meteorological influences, chemical precursors, and effects, Sci. Total Environ., 575, 1582–1596, https://doi.org/10.1016/j.scitotenv.2016.10.081, 2017.
Wang, T. J., Lam, K. S., Xie, M., Wang, X. M., Carmichael, G., and Li, Y. S.: Integrated studies of a photochemical smog episode in Hong Kong and regional transport in the Pearl River Delta of China, Tellus B, 58, 31–40, https://doi.org/10.1111/j.1600-0889.2005.00172.x, 2006.
Wang, Z., Li, J., Wang, X., Pochanart, P., and Akimoto, H.: Modeling of regional high ozone episode observed at two mountain sites (Mt. Tai and Huang) in East China, J. Atmos. Chem., 55, 253–272, https://doi.org/10.1007/s10874-006-9038-6, 2006.
Whaley, C. H., Strong, K., Jones, D. B. A., Walker, T. W., Jiang, Z., Henze, D. K., Cooke, M. A., McLinden, C. A., Mittermeier, R. L., Pommier, M., and Fogal, P. F.: Toronto area ozone: Long-term measurements and modeled sources of poor air quality events, J. Geophys. Res.-Atmos., 120, 11368–11390, https://doi.org/10.1002/2014jd022984, 2015.
Yang, Y., Liao, H., and Li, J.: Impacts of the East Asian summer monsoon on interannual variations of summertime surface-layer ozone concentrations over China, Atmos. Chem. Phys., 14, 6867–6879, https://doi.org/10.5194/acp-14-6867-2014, 2014.
Zhang, H., Wang, Y., Hu, J., Ying, Q., and Hu, X.-M.: Relationships between meteorological parameters and criteria air pollutants in three megacities in China, Environ. Res., 140, 242–254, https://doi.org/10.1016/j.envres.2015.04.004, 2015.
Zhang, H., Wang, Y., Park, T.-W., and Deng, Y.: Quantifying the relationship between extreme air pollution events and extreme weather events, Atmos. Res., 188, 64–79, https://doi.org/10.1016/j.atmosres.2016.11.010, 2017.
Zhang, Y. and Wang, Y.: Climate-driven ground-level ozone extreme in the fall over the Southeast United States, P. Natl. Acad. Sci. USA, 113, 10025–10030, https://doi.org/10.1073/pnas.1602563113, 2016.
Zhang, Y., Seidel, D. J., and Zhang, S.: Trends in Planetary Boundary Layer Height over Europe, J. Climate, 26, 10071–10076, https://doi.org/10.1175/jcli-d-13-00108.1, 2013.
Zhao, Z. J. and Wang, Y. X.: Influence of the West Pacific subtropical high on surface ozone daily variability in summertime over eastern China, Atmos. Environ., 170, 197–204, https://doi.org/10.1016/j.atmosenv.2017.09.024, 2017.
Zheng, B., Tong, D., Li, M., Liu, F., Hong, C., Geng, G., Li, H., Li, X., Peng, L., Qi, J., Yan, L., Zhang, Y., Zhao, H., Zheng, Y., He, K., and Zhang, Q.: Trends in China's anthropogenic emissions since 2010 as the consequence of clean air actions, Atmos. Chem. Phys., 18, 14095–14111, https://doi.org/10.5194/acp-18-14095-2018, 2018.
Zhou, D., Ding, A., Mao, H., Fu, C., Wang, T., Chan, L. Y., Ding, K., Zhang, Y., Liu, J., Lu, A., and Hao, N.: Impacts of the East Asian monsoon on lower tropospheric ozone over coastal South China, Environ. Res. Lett., 8, 044011, https://doi.org/10.1088/1748-9326/8/4/044011, 2013.
- Abstract
- Introduction
- Methods
- Frequencies and intensities of OPEs in North China
- A typical weather pattern for OPEs
- Simulated OPEs and IPR analysis
- Conclusions
- Data availability
- Author contributions
- Competing interests
- Special issue statement
- Acknowledgements
- Financial support
- Review statement
- References
- Supplement