the Creative Commons Attribution 4.0 License.
the Creative Commons Attribution 4.0 License.
 | 06 Nov 2019
The control of anthropogenic emissions contributed to 80 % of the decrease in PM2.5 concentrations in Beijing from 2013 to 2017
Ziyue Chen
Danlu Chen
Mei-Po Kwan
Bin Chen
Bingbo Gao
Yan Zhuang
Ruiyuan Li
Bing Xu
With the completion of the Beijing Five-year Clean Air Action Plan by the end of 2017, the annual mean PM2.5 concentration in Beijing dropped dramatically to 58.0 µg m−3 in 2017 from 89.5 µg m−3 in 2013. However, controversies exist to argue that favourable meteorological conditions in 2017 were the major driver for such a rapid decrease in PM2.5 concentrations. To comprehensively evaluate this 5-year plan, we employed a Kolmogorov–Zurbenko (KZ) filter and WRF-CMAQ (Weather Research and Forecasting and the Community Multi-scale Air Quality) to quantify the relative contribution of meteorological conditions and the control of anthropogenic emissions to PM2.5 reduction in Beijing from 2013 to 2017. For these 5 years, the relative contribution of emission reduction to the decrease in PM2.5 concentrations calculated by KZ filtering and WRF-CMAQ was 80.6 % and 78.6 % respectively. KZ filtering suggested that short-term variations in meteorological and emission conditions contributed majorly to rapid changes in PM2.5 concentrations in Beijing. WRF-CMAQ revealed that the relative contribution of local and regional emission reduction to the PM2.5 decrease in Beijing was 53.7 % and 24.9 % respectively. For local emission-reduction measures, the regulation of coal boilers, increasing use of clean fuels for residential use and industrial restructuring contributed 20.1 %, 17.4 % and 10.8 % to PM2.5 reduction respectively. Both models suggested that the control of anthropogenic emissions accounted for around 80 % of the PM2.5 reduction in Beijing, indicating that emission reduction was crucial for air quality enhancement in Beijing from 2013 to 2017. Consequently, such a long-term air quality clean plan should be continued in the following years to further reduce PM2.5 concentrations in Beijing.
- Article
(4624 KB) - Full-text XML
- BibTeX
- EndNote


In January 2013, persistent haze episodes occurred in Beijing, during which the highest hourly PM2.5 concentration once reached 886 µg m−3, a historically high record. High-concentration PM2.5 led to long-lasting black and thick fogs, which not only significantly influenced people's daily life (low-visibility induced traffic jams), but also posed a severe threat to public health (Brunekreef et al., 2002; Dominici et al., 2014; Nel et al., 2005; Zhang et al., 2012; Qiao et al., 2014). Since then, severe haze episodes have frequently been observed in Beijing and other regions across China (Chan et al., 2008; Huang et al., 2014; Guo et al.,2014; Zheng et al.,2015), and PM2.5 pollution has become one of the most concerning environmental issues in China. Consequently, a national network for monitoring hourly PM2.5 concentrations has been established gradually, including 35 ground observation stations in Beijing, which provide important support for better understanding and managing PM2.5 concentrations. To effectively mitigate PM2.5 pollution, the Beijing Municipal Government released the Beijing Five-year Clean Air Action Plan (2013–2017) with a series of long-term emission-reduction measures, including shutting down heavily polluting factories, restricting traffic emissions and replacing coal fuels with clean energies; it also released a Heavy Air Pollution Contingency Plan with a series of contingent emission-reduction measures during heavy pollution episodes. By the end of 2017, these long-term and contingent emission-reduction measures worked jointly to reduce the annual mean PM2.5 concentration in Beijing from 89.5 µg m−3 in 2013 to 58.0 µg m−3 in 2017, indicating a great success of PM2.5 management during the past 5 years. The notable decrease in PM2.5 concentrations attracted nationwide attention, and a growing number of studies has been conducted to understand spatio-temporal characteristics (Shao et al., 2018; Sun et al., 2019; Wang et al., 2019), sources (Chen et al., 2019; Xu et al., 2019; J. Cheng et al., 2019) and health effects (Liang et al., 2019) of PM2.5 variations in Beijing from 2013 to 2017. These studies revealed that air quality in Beijing was improved significantly in 2017 in terms of annual mean PM2.5 concentrations, polluted days and pollution durations. Furthermore, despite different outputs, both source apportionment during pollution episodes based on collected samples (Shao et al., 2019; Xu et al., 2019; Chen et al., 2019) and long-term model simulation based on regional and local emission inventories (J. Cheng et al., 2019) suggested that local and regional anthropogenic emissions (e.g. coal combustion and vehicle emissions) were the major influencing factors for long-term and short-term PM2.5 variations in Beijing.
In addition to anthropogenic emissions, the strong meteorological influence on PM2.5 concentrations in Beijing have been widely acknowledged (Zhao et al., 2013; Wang et al., 2014; UNEP, 2016; Chen et al., 2017; Sun et al., 2019). For instance, for 2014, more than 180 d in Beijing experienced a dramatic daily AQI (Air Quality Index) change (AQI > 50) (Z. Y. Chen et al., 2016). Considering that anthropogenic emissions for a megacity unlikely changed significantly on a daily basis, rapid variations in meteorological conditions were one major driver for the dramatic change in daily air quality in Beijing. In winter 2017, strong northwest winds led to favourable meteorological conditions for PM2.5 diffusion and low PM2.5 concentrations in Beijing. This raised the controversy that meteorological conditions, instead of emission reduction, accounted for the remarkable PM2.5 reduction in Beijing. In this case, with the completion of the 5-year plan, it is highly necessary to quantify the relative contribution of meteorological conditions and emission reduction to the notable decrease in PM2.5 concentrations in Beijing from 2013 to 2017.
In recent years, a growing number of studies has been conducted to investigate meteorological and anthropogenic influence on long-term PM2.5 variations. Based on the Goddard Earth Observing System (GEOS) chemical transport model (GEOS-Chem), Yang et al. (2016) revealed that the relative contribution of meteorological conditions to PM2.5 variations in eastern China from 1985 to 2005 was 12 %. Based on a multiple general linear model (GLM), Gui et al. (2019) quantified that meteorological conditions accounted for 48 % of PM2.5 variations in eastern China from 1998 to 2016. Based on a stepwise multiple linear regression (MLR) model, Zhai et al. (2019) quantified the relative contribution of meteorology to PM2.5 variations from 2013 to 2018 in the Beijing–Tianjin–Hebei region, the Yangtze River Delta, the Pearl River Delta, and the Sichuan Basin and Fenwei plain at 14 %, 3 %, 19 %, 27 % and 23 % respectively. Through a two-stage hierarchical clustering method, Zhang et al. (2018) calculated that the relative contribution of meteorological conditions to heavy pollution episodes within the Beijing–Tianjin–Hebei region was larger than 50 % from 2013 to 2017. These studies quantified the overall meteorological influence on long-term PM2.5 variations using different statistical models and chemical transport models (CTMs). However, due to strong interactions between individual meteorological factors, traditional statistical methods such as correlation analysis and linear regression may be biased significantly when quantifying meteorological influence on PM2.5 concentrations (Chen et al., 2017). On the other hand, the accuracy of CTMs can be influenced largely by the uncertainty in emission inventories (Xu et al., 2016) and the deficiency of heterogeneous or aqueous processes (Li et al., 2011). Therefore, multiple advanced models should be comprehensively considered to better quantify meteorological influence on PM2.5 concentrations (Pearce et al., 2011).
To evaluate this 5-year clean-air plan, we employ an advanced statistical model, Kolmogorov–Zurbenko (KZ) filtering, which is advantageous for filtering meteorological influence on long-term time series of airborne pollutants, and a CTM model, WRF-CMAQ ( Weather Research and Forecasting and the Community Multi-scale Air Quality), which is advantageous for quantifying the relative contribution of different emission sources, to comprehensively investigate the relative contribution of meteorological conditions and emission reduction to PM2.5 reduction in Beijing from 2013 to 2017 respectively. In this light, this research provides important insights for better designing and implementing successive clean-air plans in the future to further mitigate PM2.5 pollution in Beijing.
This paper is structured as follows. Firstly, the major data sources, including PM2.5 and meteorological data and emission inventories, employed for this research are briefly introduced. Secondly, the principle and parameter setting of two models – KZ filtering and WRF-CMAQ – and model verification are explained. In the Results section, the relative contribution of meteorological conditions and anthropogenic emissions to PM2.5 variations in Beijing from 2013 to 2017 calculated using both models is presented. In the “Discussion” and “Conclusion” parts, implementations of this research and suggestions for further improving air quality in Beijing are given.
2.1 PM2.5 and meteorological data
In this study, hourly PM2.5 concentration data were acquired from the website PM25.in (http://www.PM25.in, last access: 18 August 2018), which collects official data provided by the China National Environmental Monitoring Center (CNEMC). Beijing has established an advanced air quality monitoring network with 35 ground stations across the city. Considering the major contribution of industry and traffic-induced emissions in urban areas, we selected all 12 urban stations to analyse spatio-temporal variations in PM2.5 concentrations and quantify their influencing factors. In addition to these urban stations, we selected two background stations, the Dingling Station located in the suburb and the Miyun Reservoir Station located in the outer suburb, one transportation station (the Qianmen station) located close to a main road, and one rural station (the Yufa Station) that is far away from central Beijing for the following analysis. The Dingling and Miyun Reservoir Station were chosen as background stations by the Ministry of Environmental Protection of China. These two stations receive limited influence from anthropogenic emissions due to their location in suburban and outer suburban areas. The Qianmen transportation station received more influence from vehicle emissions. Long-term variations in PM2.5 concentrations in different types of stations provide a useful reference for comprehensively understanding the effects of emission-reduction measures on the PM2.5 decrease in Beijing from 2013 to 2017. Meteorological data for this research were collected from the Guanxiangtai Station (GXT; 54511; 39.80∘ N, 116.46∘ E), Beijing and downloaded from the Department of Atmospheric Science, College of Engineering, University of Wyoming (http://weather.uwyo.edu/upperair/sounding.html, last access: 18 August 2018). Both PM2.5 and meteorological data were collected from 1 January 2013 to 31 December 2017. The locations of these selected stations are shown in Fig. 1.
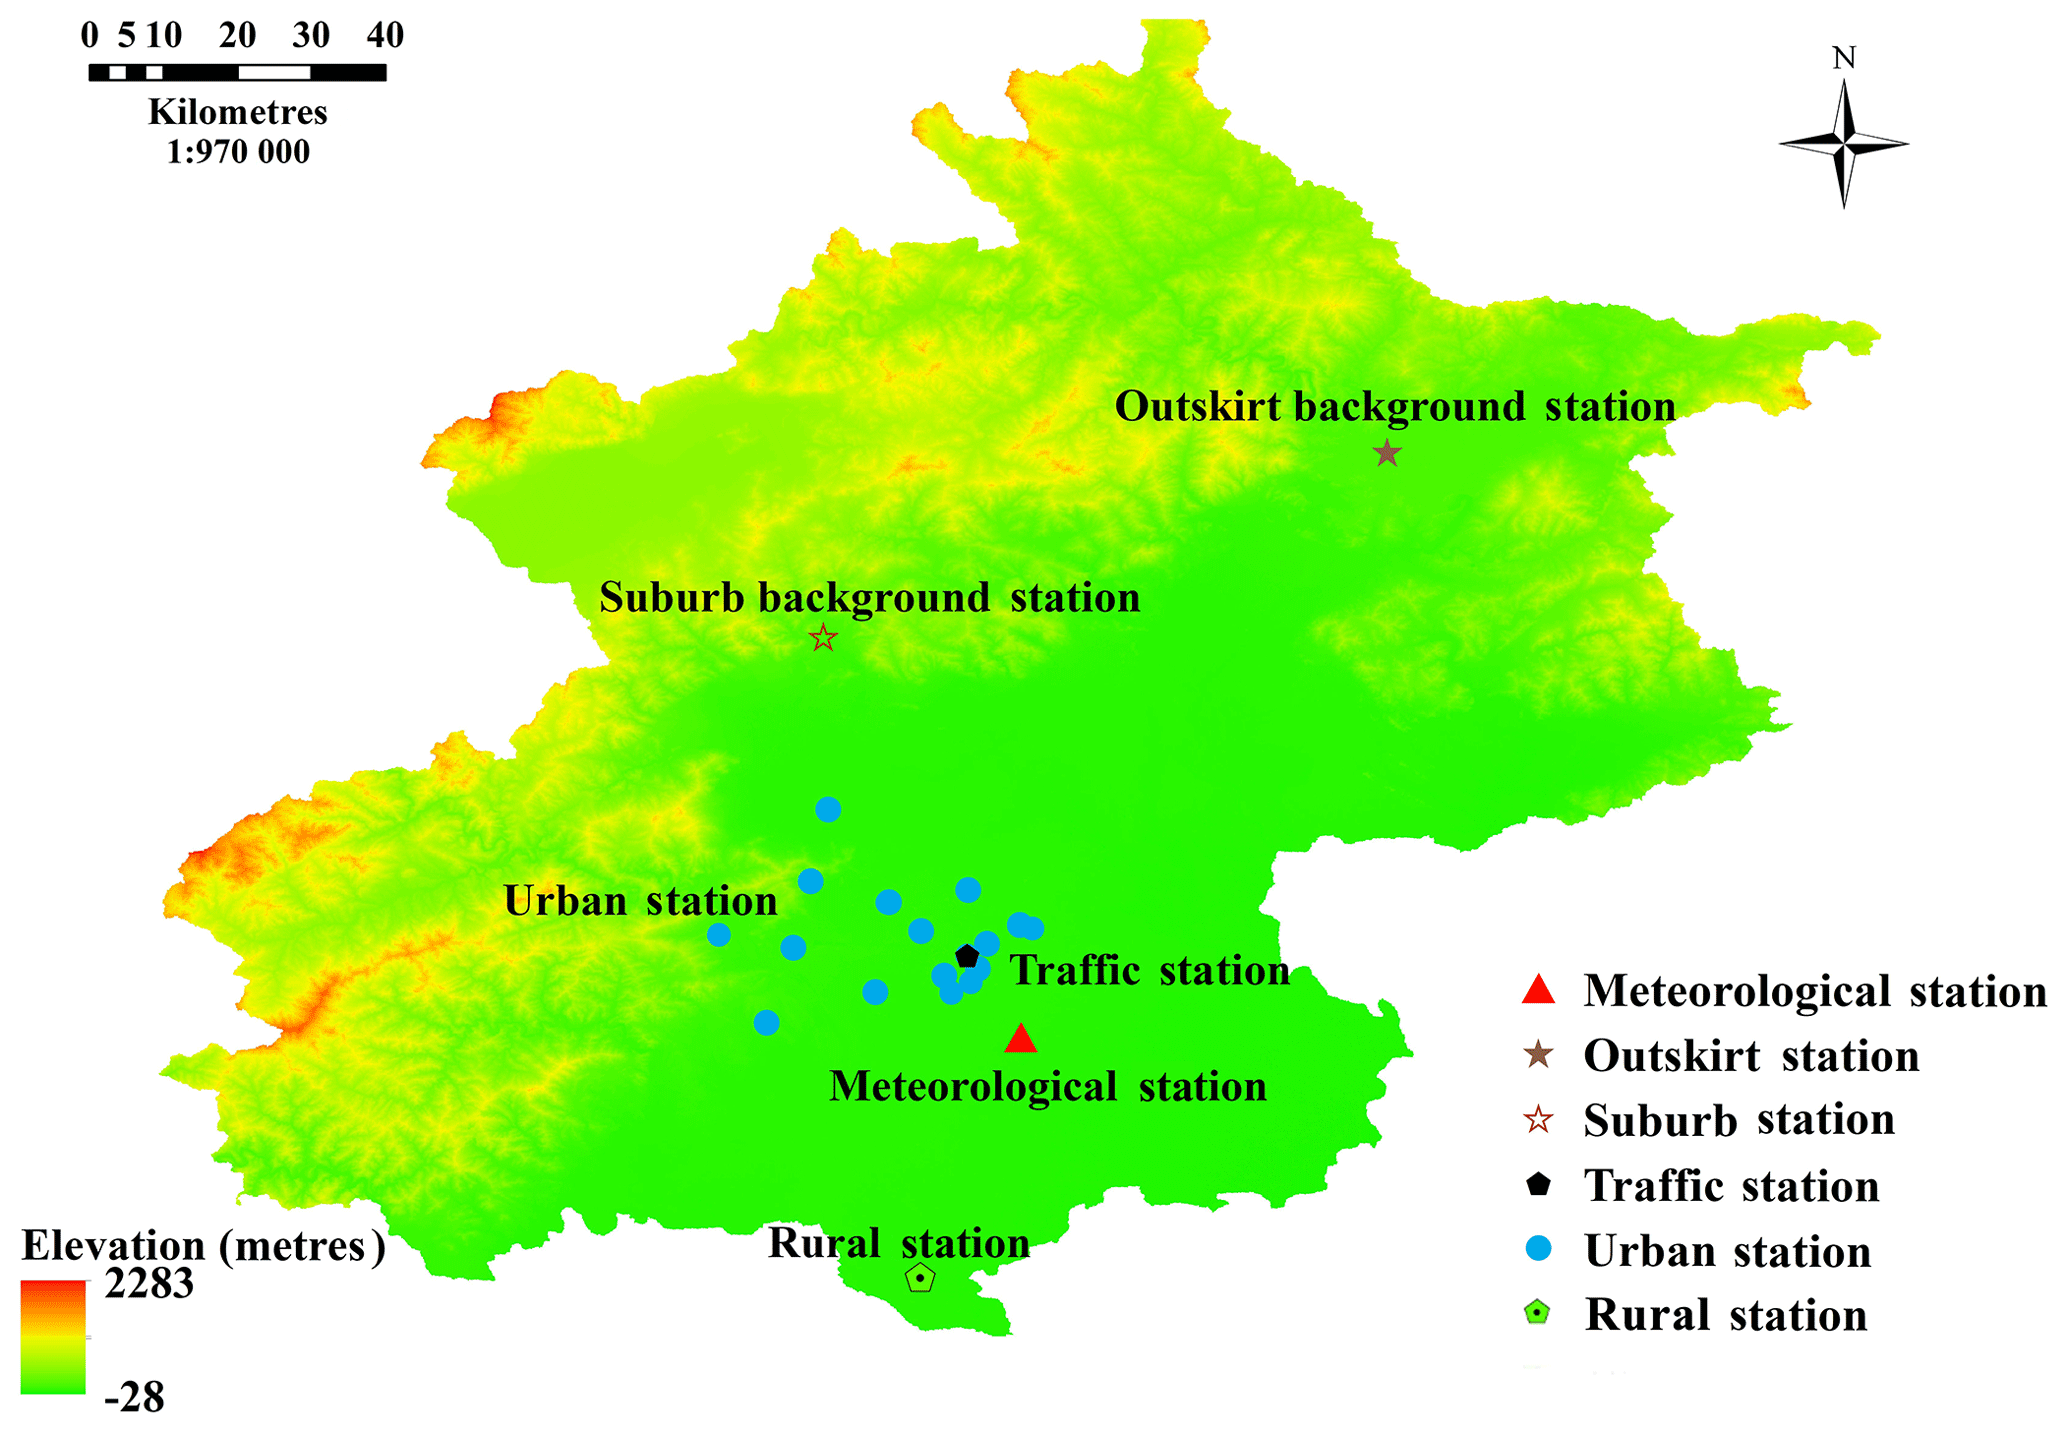
Figure 1Locations of different ground monitoring stations.
2.2 Emission inventories
For this research, we employed both regional and local emission inventories for running model simulations. The Multi-resolution Emission Inventory for China, MEIC, (http://meicmodel.org/, last access: 16 February 2019) provided by Tsinghua University, was employed as the regional emission inventory. MEIC has been widely employed and verified as a reliable emission inventory by a diversity of studies (Hong et al., 2017; Saikawa et al., 2017; Zhou et al., 2017; etc.). For simulating 5-year PM2.5 concentrations, MEIC from 2013 to 2017 is required. Since the official MEIC 2017 has yet to become available, we employed a strategy from previous studies (Chen et al., 2019; etc.) and updated MEIC 2016 for simulating emission-reduction scenarios and PM2.5 concentrations in 2017 by considering official 2017 emission-reduction plans (e.g. the target of coal combustion reduction) required by the local government.
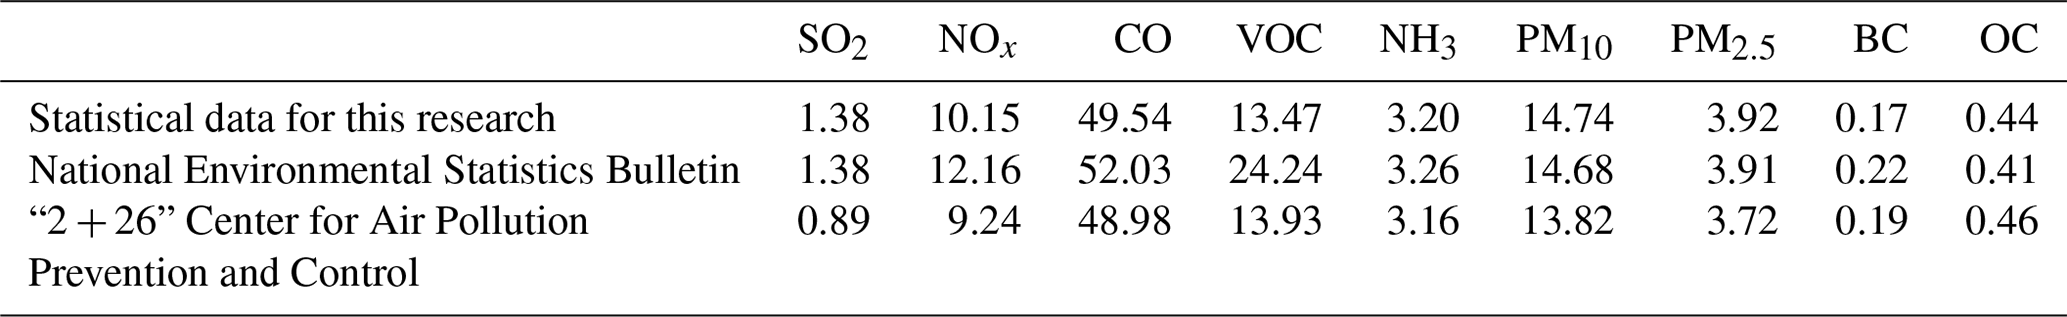
Different from regional emission inventories, local emission inventories are usually produced independently by local institutions. The Beijing local emission inventory employed for this research was produced and updated by the Beijing Municipal Research Institute of Environmental protection, fully according to the requirement of MEP (Ministry of Ecology and Environment of the People's Republic of China) for the production of local emission inventories within the Beijing–Tianjin–Hebei region. This Beijing local emission inventory from 2013 to 2017 was produced by synthesising local environmental statistical data and reported emission data, carrying out field investigations, and conducting a series of estimations according to the Beijing Five-year Clean Air Action Plan. As shown in Table 1, it is highly consistent with other official statistical data, such as the annual report from National Environmental Statistics Bulletin (http://www.mee.gov.cn/gzfw_13107/hjtj/qghjtjgb/, last access: 16 February 2019) and “2+26” Center for Air Pollution Prevention and Control, and has been formally employed for the implementation of recent 2017 Air Pollution Prevention and Management Plan for the Beijing-Tianjin-Hebei Region and its Surrounding Areas (MEP, 2017).
Table 1The comparison of local environmental statistical data used for this research and other official statistical data in 2017 (unit: 10 kt). BC: black carbon; OC: organic carbon.
A key step for quantifying the relative contribution of anthropogenic emissions to PM2.5 variations is to properly filter meteorological influence on PM2.5 concentrations, which is highly challenging and have rarely been investigated by previous studies. Therefore, we employed both a statistical method and a CTM to comprehensively evaluate the role of anthropogenic emissions and meteorological conditions in the decrease in PM2.5 concentrations in Beijing from 2013 to 2017.
3.1 Kolmogorov–Zurbenko filtering
Since meteorological conditions exert a strong influence on PM2.5 concentrations in Beijing, the removal of seasonal signals from time series of meteorological factors produces data sets suitable for understanding the trend of PM2.5 concentrations mainly influenced by anthropogenic factors (Eskridge et al., 1997). To better analyse the trend of time series data without the disturbances from other major influencing variables, a statistical method, KZ filtering, was proposed by Rao et al. (1994). The KZ filter is advantageous for removing high-frequency variations in data sets through an iterative moving average. Eskridge et al. (1997) compared four major approaches for trend detection, including PEST (political, economic, technological and social) analysis, anomalies, wavelet transform and the KZ filter, and suggested that KZ achieved higher confidence in detecting long-term trends than other models. Due to its reliable performance in trend detection in complicated ecosystems, the KZ filter has been increasingly employed to remove seasonal signals of meteorological conditions and extract a long-term trend of airborne pollutants (Zurbenko, et al., 1996; Eskridge, et al., 1997; Kang, et al., 2013; Ma et al., 2016; N. Cheng et al., 2019). One potential limitation of the KZ filter is that an iterative moving average (m) may have an influence on detecting abrupt variations. Therefore, Zurbenko et al (1996) proposed an enhanced KZ filter that employed a dynamic variable m that decreased with the increase in changing rate. For this research, we employed this dynamic m to produce an adjusted time series of PM2.5 concentrations in Beijing by removing large inter-annual and seasonal variations in meteorological conditions. The principle of the KZ filter is briefly introduced as follows.
The raw time series of airborne pollutants can be decomposed as
where Xb(t) is the original time series of airborne pollutants, E(t) is the long-term trend component, S(t) is the seasonal component and W(t) is the short-term (synoptic-scale) component or residue. KZi,j(X) indicates KZ filtering on the original data set X with a moving window size of i and j iterations.
Xb(t) stands for the base component, the sum of the long-term and seasonal component, presenting steady trend variation. E(t) is mainly affected by long-term anthropogenic emission and climate change. S(t) is mainly influenced by the seasonal variation in emission and meteorological conditions. W(t) is caused by short-term and small-scale shifts in emissions and meteorological conditions.
The long-term trend component E(t) processed by KZ filtering still contains the influence of meteorological conditions, which can be removed by multiple regression models. Multiple linear relationships are established for the residue and baseline component respectively using meteorological factors strongly correlated with airborne pollutants.
We examined correlations between seasonal PM2.5 concentrations in Beijing and a set of meteorological factors, including temperature, wind speed, wind direction, precipitation, relative humidity, solar radiation, evaporation and air pressure. Due to limited space, detailed correlations between PM2.5 concentrations and individual meteorological factors in Beijing are not presented here and readers can refer to previous studies for more information (Chen et al., 2017, 2018). The correlation analysis revealed that wind speed, relative humidity, temperature and solar radiation were strongly and significantly correlated with PM2.5 concentrations in Beijing (as shown in Table 2), which was consistent with findings from other studies (Sun et al., 2013; Wang et al., 2018).
Table 2Major meteorological factors strongly correlated with seasonal PM2.5 concentrations in Beijing (Chen et al., 2017).
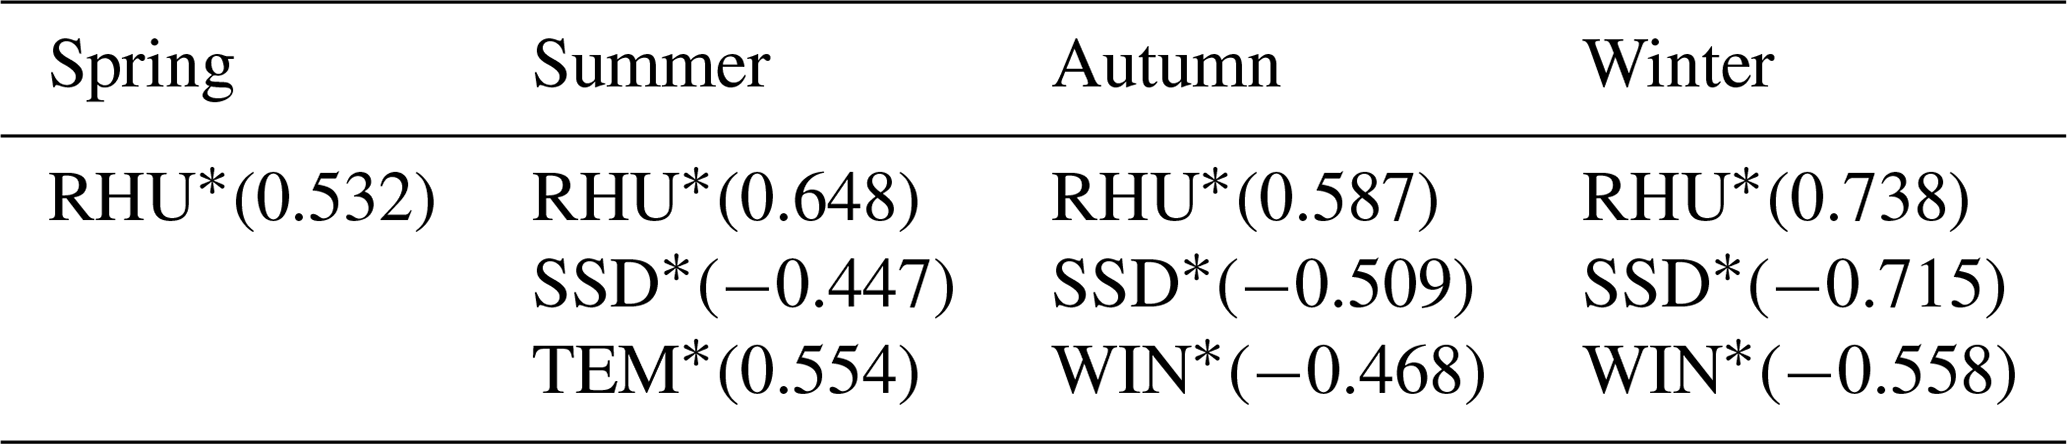
* Correlation is significant at the 0.01 level (two-tailed). RHU: relative humidity; SSD: sunshine duration; TEM: temperature; WIN: wind speed.
Therefore, we further established multiple linear regression equations between PM2.5 concentrations and wind speed, relative humidity, temperature and solar radiation as follows.
where wi(t) and xi(t) stand for the different short-term and baseline components of the ith meteorological factor. εw and εb are the regression residue of the short-term and baseline component. ε(t) indicates the total residue, including the short-term influence of local emission and meteorological factors neglected during the regression process and other noises.
Next, KZ filtering was conducted on the ε(t) for its long-term component εE(t). After the influence of meteorological variations was filtered, the reconstructed time series of airborne pollutants XLT(t) was calculated as the sum of εE(t) and the average value of E(t) , .
After KZ filtering, the relative contribution of meteorological conditions to PM2.5 variations can be calculated as follows:
where Pcontrib is the relative contribution of meteorological conditions to PM2.5 variations in Beijing, Korg is the variation slope of the original PM2.5 time series and K is the variation slope of adjusted PM2.5 time series with filtered influence from meteorological variations.
3.2 WRF-CMAQ model
We employed WRF-CMAQ for simulating the effects of emission reduction on the decrease in PM2.5 concentrations. WRF-CMAQ includes three models: the middle-scale meteorology model (WRF), the source emission model (SMOKE) (http://www.cmascenter.org/smoke/, last access: 16 February 2019) and the community multiscale air quality modelling system (CMAQ) (CMAQ, http://www.cmascenter.org/, last access: 16 February 2019). The centre of the CMAQ was set at coordinate 35∘ N, 110∘ E and a bidirectional nested technology was employed, producing two layers of grids with a horizontal resolution of 36 and 12 km. The first layer of grids with a 36 km resolution and 200×160 cells covered most areas in East Asia (including China, Japan, North Korea, South Korea and other countries). The second layer of grids with a 12 km resolution and 120×102 cells covered the North China Plain (including the Beijing–Tianjin–Hebei region, Shandong and Henan provinces). The vertical layer was divided into 20 unequal layers, eight of which were at less than 1 km distance to the ground to better feature the structure of the atmospheric boundary. The height of the ground layer was 35 m.
We employed ARW-WRF3.2 (Advanced Research Weather Research and Forecasting) to simulate the meteorological field. The setting of the centre and the bidirectional nest for WRF and CMAQ was similar. There were 35 vertical layers for WRF, and the outer layer provided boundary conditions of the inner layer. The meteorological background field and boundary information with an FNL (final) resolution of and temporal resolution of 6 h were acquired from NCAR (National Center for Atmospheric Research, https://ncar.ucar.edu/, last access: 16 February 2019) and NCEP (National Centers for Environmental Prediction) respectively. The terrain and underlying surface information was obtained from the USGS 30 s global DEM (digital elevation model) (https://earthquake.usgs.gov/, last access: 16 February 2019). The outputs from WRF were interpolated to the region and grid of CMAQ using the Meteorology-Chemistry Interface Processor (MCIP, https://www.cmascenter.org/mcip, last access: 16 February 2019). The meteorological factors used for this model included temperature, air pressure, humidity, geopotential height, zonal wind, meridional wind, precipitation, boundary layer heights and so forth. An estimation model for terrestrial ecosystem, MEGAN (http://ab.inf.uni-tuebingen.de/software/megan/, last access: 16 February 2019), was employed to process the natural emissions. MEIC (http://www.meicmodel.org/, last access: 16 February 2019) and the Beijing emission inventory (http://www.cee.cn/, last access: 16 February 2019) provided anthropogenic emission data. We input the processed natural and anthropogenic emission data into the SMOKE model and acquired comprehensive emission source files.
Scenario simulation is employed to estimate the contribution of emission reduction to the variation in PM2.5 concentrations.
where Pcontrib, C and Cbase are the contribution rate of emission reduction to PM2.5 concentrations, simulated PM2.5 concentrations under the emission-reduction scenario, and simulated PM2.5 concentrations under the baseline scenario respectively.
To evaluate the relative contribution of meteorological conditions and different emission-reduction measures to the decrease in PM2.5 concentrations, we designed two baseline experiments and four sensitivity experiments. For the first baseline experiment, we employed the actual meteorological data in 2013. For the second baseline experiment, we employed the actual meteorological data in 2017 and the emission inventory in 2017. Since no emission-reduction measures were conducted in 2013, the first baseline experiment was used to estimate the relative contribution of meteorological conditions to the variation in PM2.5 concentrations. By comparing the first and second baseline experiment, the relative contribution of all emission-reduction measures to the variation in PM2.5 concentrations can be quantified. For the first sensitivity experiment, we employed the actual meteorological conditions in 2013 and the emission inventory in 2017 and compared the simulation result with the baseline experiment, which demonstrated the relative contribution of meteorological concentrations to PM2.5 reduction in Beijing from 2013 to 2017. Since the WRF-CMAQ simulation simply considers PM2.5 concentrations and meteorological conditions in 2013 and 2017 without considering their variation process from 2013 to 2017, KZ filtering may perform better in quantifying the relative contribution of meteorological variations to PM2.5 reduction in Beijing. However, the output from this sensitivity experiment served as a useful reference for cross-verifying the output from the KZ filtering. For the remaining three sensitivity-simulation experiments, we added the reduced emission amount induced by one specific emission-reduction measure to the actual emission amount in 2017 and kept other parameters unchanged, and thus we quantified the relative contribution of one specific emission-reduction measure to PM2.5 reduction in Beijing from 2013 to 2017. Consequently, we quantified the relative contribution of three major emission-reduction measures to PM2.5 reduction in Beijing (Table 3).
Table 3The design and materials for two baseline and four sensitivity experiments using WRF-CMAQ.
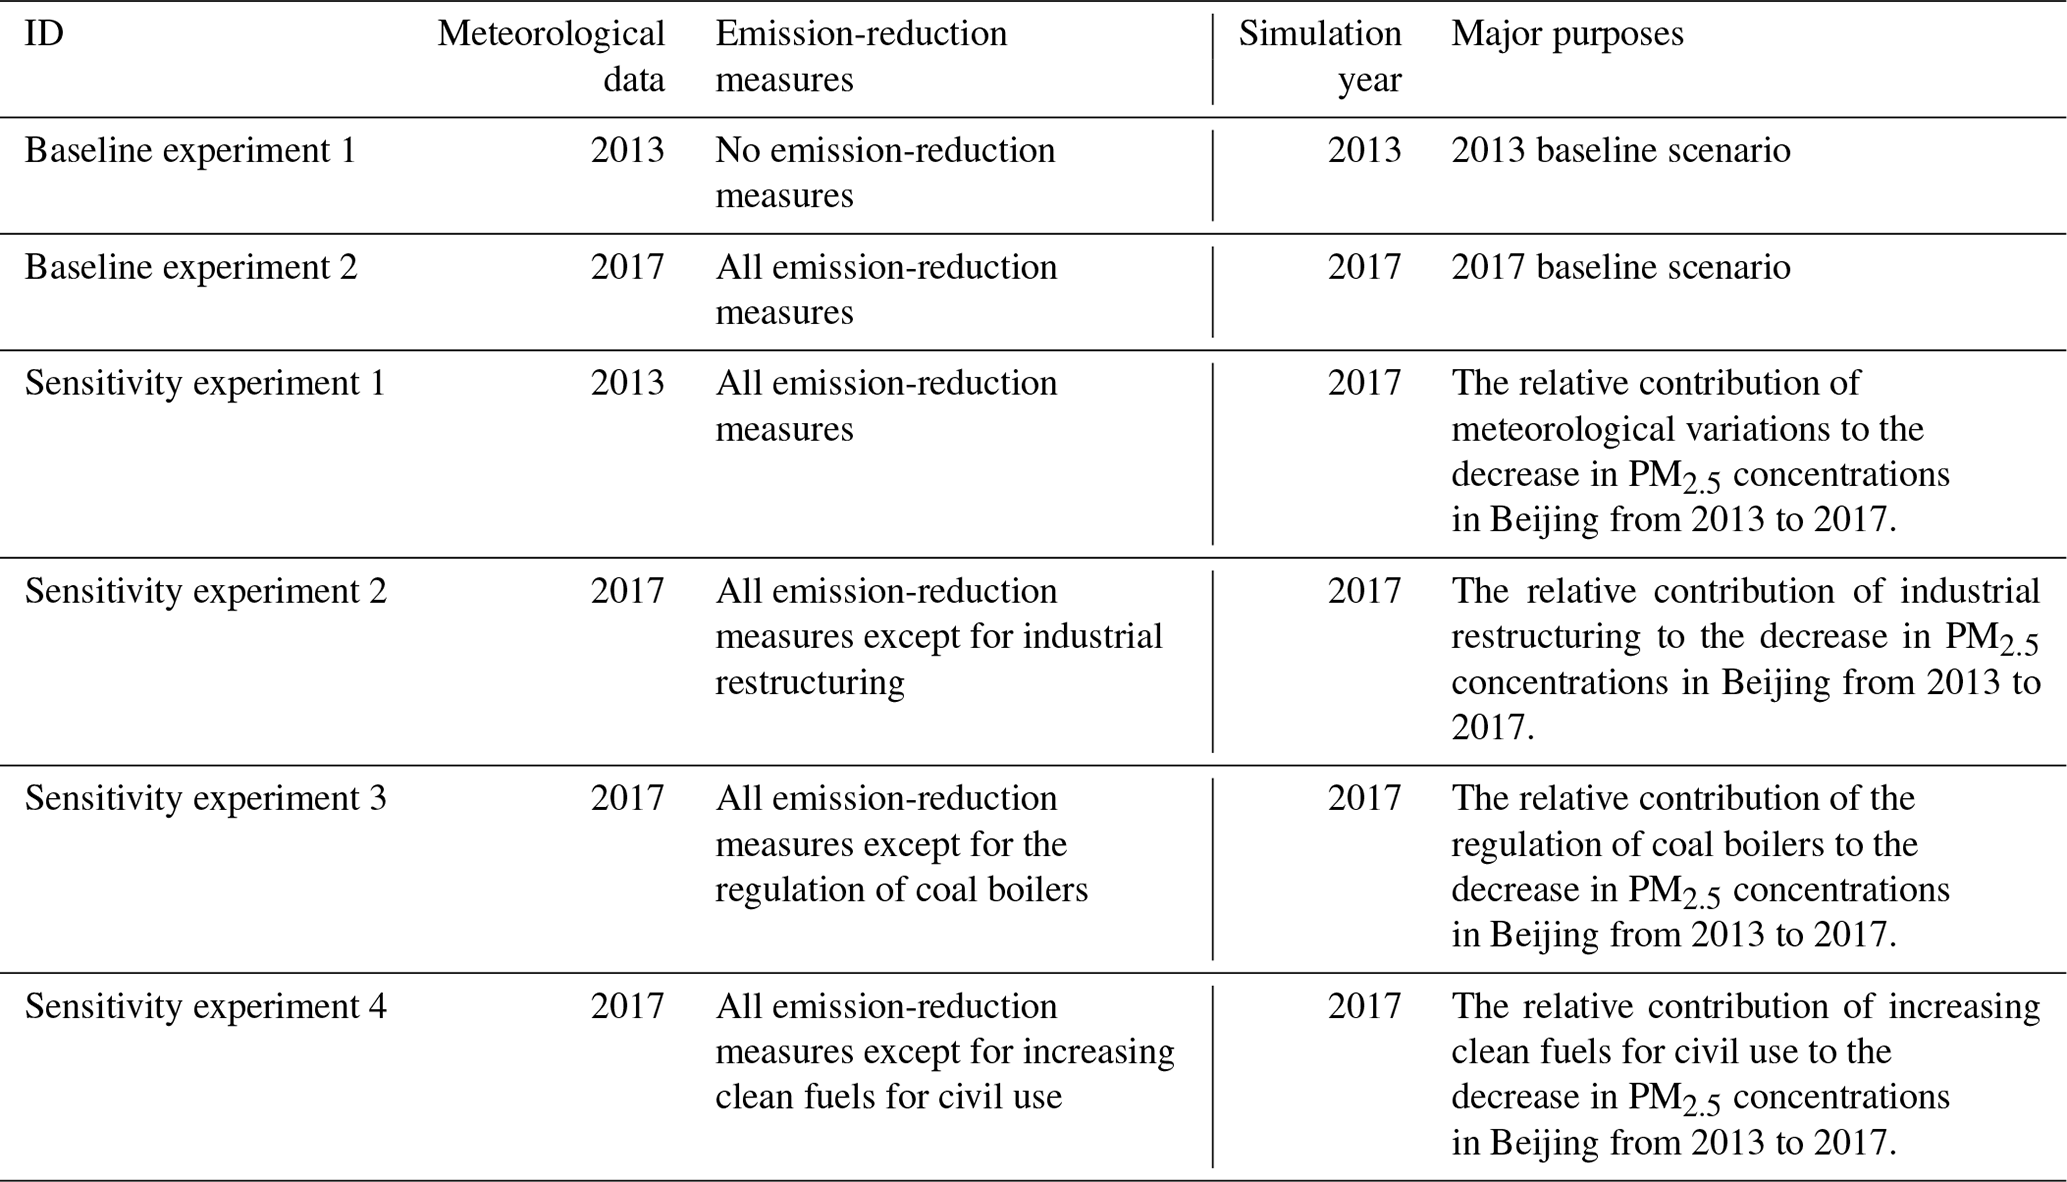
For emission data, all experiments employed the Beijing local emissions inventory in 2017 for Beijing and the regional emission inventory in 2017 for other regions. MEIC 2017 was acquired based on our update of MEIC 2016 according to official 2017 emission-reduction targets required by the local government.
3.3 Model verification
3.3.1 Verification of KZ filtering
For each station, the original time series of PM2.5 data was processed by the KZ filter and the relative contribution of the long-term, seasonal and short-term component to the total variance is shown as Table 4. The sum of the long-term, seasonal and short-term component contributed 93.6 %∼95.3 % to the total variance at different stations respectively. The larger the total variance, the more independent the three components are of each other. The total variance close to 100 % suggests that a majority of meteorological influence has been considered and effectively removed. As shown in Table 4, the large value of the total variation in all stations indicated a satisfactory output from the KZ filtering.
Specifically, the relative contribution of the seasonal component (ranging from 9 % to 23.8 %) and short-term component (ranging from 66.8 % to 83.8 %) was much larger than that of the long-term component (ranging from 1.2 % to 3.5 %), suggesting that seasonal and short-term variations in meteorological and emission factors exerted a major influence on the rapid change in PM2.5 concentrations in Beijing. The decomposed long-term, seasonal and short-term component from the original time series of mean urban PM2.5 concentrations in Beijing from 2013 to 2017 are demonstrated as Fig. 2. According to Fig. 2, the notable peaks of decomposed seasonal and short-term components were highly consistent with the peaks of PM2.5 concentrations in the original time series, which further proved the dominant influence of seasonal and short-term variations in meteorological and anthropogenic factors on the temporal changes in PM2.5 concentrations in Beijing.
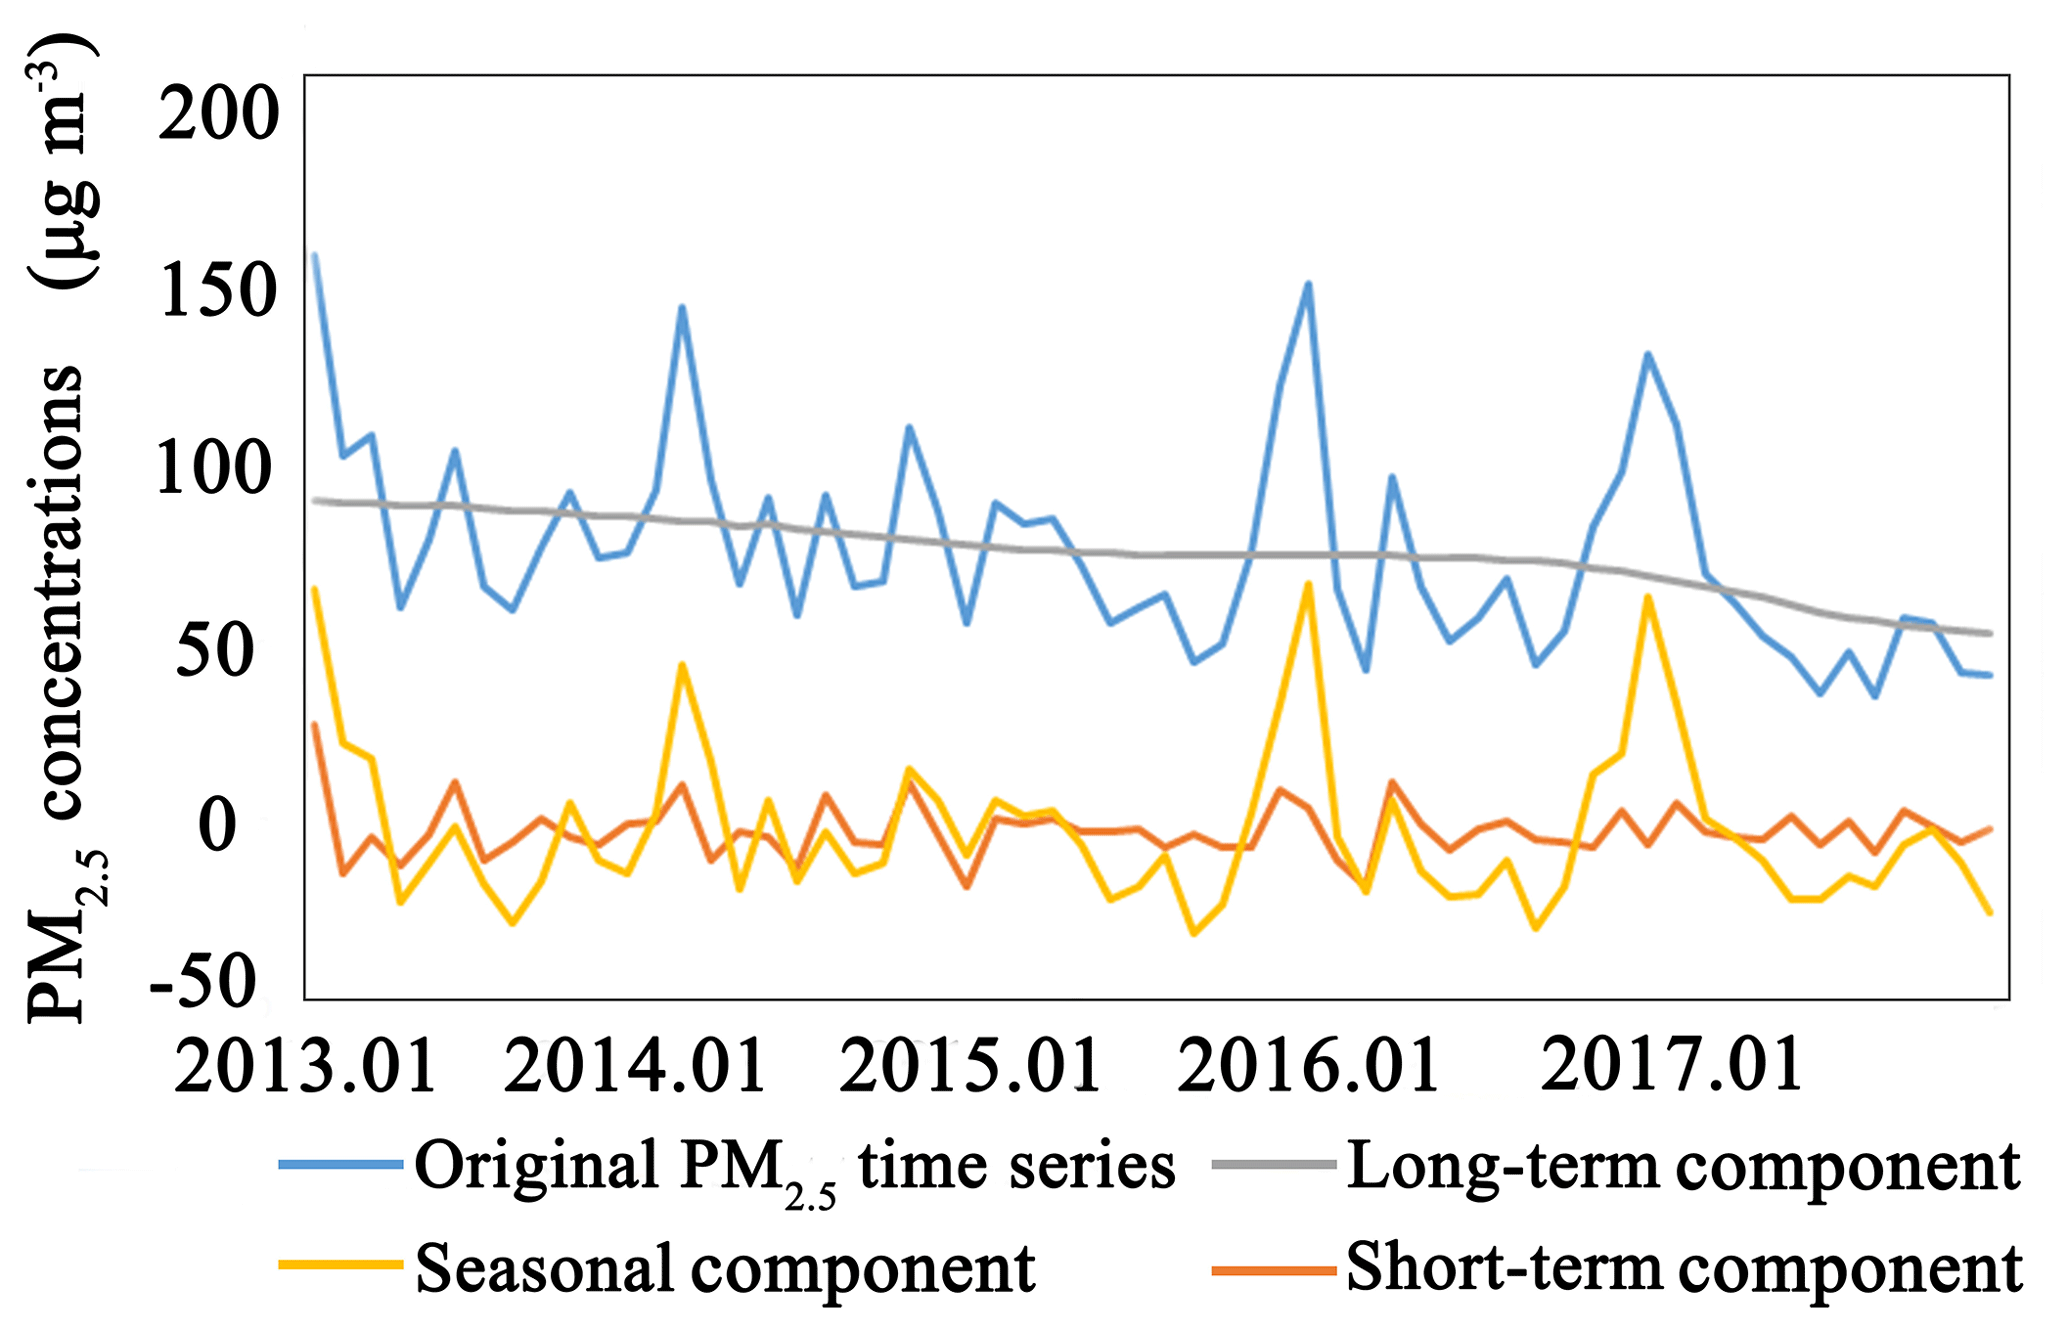
Figure 2The long-term, seasonal and short-term components extracted from the original time series of mean urban PM2.5 concentrations in Beijing from 2013 to 2017.
3.3.2 Verification of WRF-CMAQ
We employed the emission inventory and meteorological data for 2017 to verify the accuracy of WRF-CMAQ simulation. For six stations of different types (Dingling background station, Yufa rural station, Olympic centre urban station, Guanyuan urban station, Dongsi urban station and Agricultural museum urban station), we compared the observed and estimated PM2.5 concentrations and presented the comparison result as Fig. 3. According to Fig. 3, the general trend of the simulated PM2.5 concentrations was consistent with that of the observed PM2.5 concentrations. For six stations, the correlation coefficient R, normalised mean bias (NMB), normalised mean error (NME), mean fractional bias (MFB) and mean fractional error (MFE) between observed and simulated data were 0.63 %∼0.91 %, , 26 %∼40 %, and 27 %∼46 % respectively, indicating a satisfactory simulation output (EPA, 2005; Boylan et al., 2006). However, as shown in Fig. 3, WRF-CMAQ may notably underestimate PM2.5 concentrations during heavy pollution episodes due to unified parameter setting for long-term simulation, the uncertainty in emission inventories and especially insufficient chemical reaction mechanisms, which is a common challenge for CTM-based PM2.5 simulation (Li et al., 2011). For instance, without considering heterogeneous or aqueous reactions between multiple precursors, CTMs failed to approach the maximum PM2.5 concentrations during severe haze episodes and the simulation accuracy was dramatically improved by including proper descriptions of heterogeneous or aqueous reactions in CTMs (D. Chen et al., 2016). With more finer-scale emission inventories and better descriptions of reaction mechanisms between precursors, the accuracy of PM2.5 simulation can be improved significantly.
Table 4The relative contribution of different components to the total variance of the original time series of PM2.5 concentrations from 2013 to 2017 at different stations.

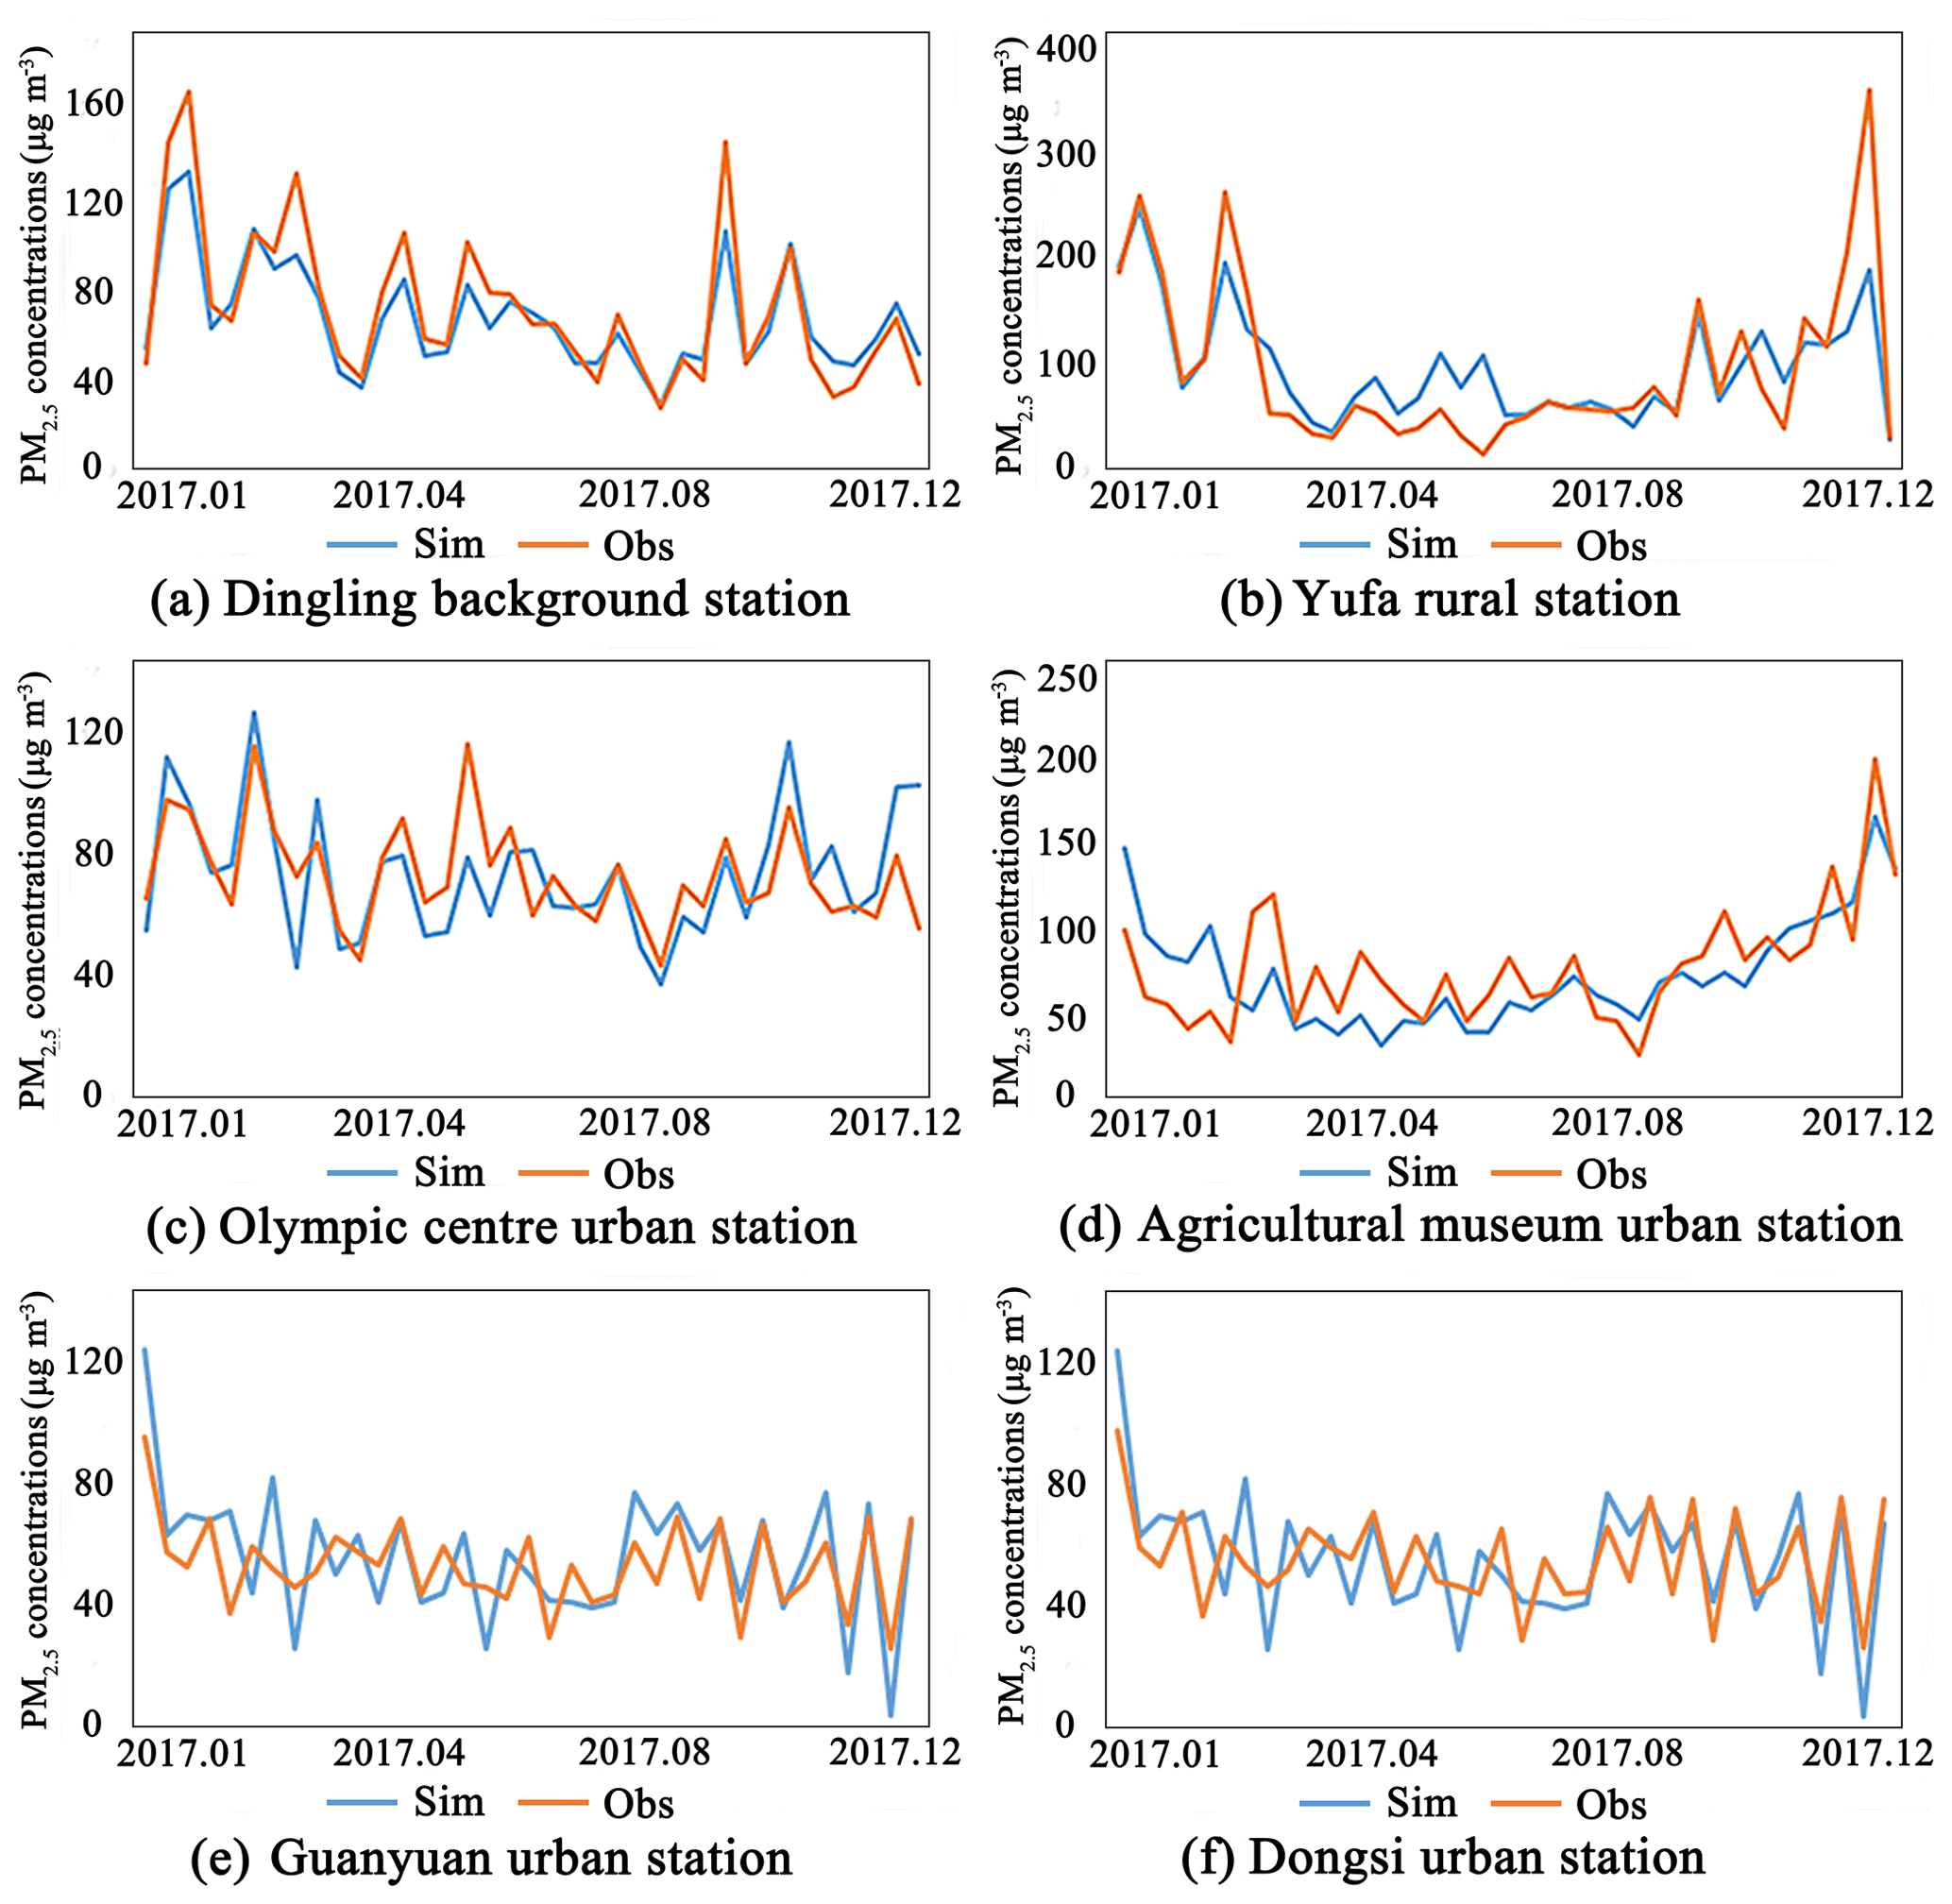
Figure 3The comparison between observed and WRF-CMAQ simulated PM2.5 concentrations in 2017 at six stations across Beijing.
4.1 The relative contribution of emission reduction and meteorological variations to the decrease in PM2.5 concentrations in Beijing from 2013 to 2017
4.1.1 Estimation based on KZ filtering
Through KZ filtering, the adjusted time series of PM2.5 concentrations with filtered meteorological variations was acquired. Next, for each station, the actual PM2.5 variations and adjusted PM2.5 variations without the disturbance of meteorological variations from 2013 to 2017 were calculated respectively (as shown in Table 5). Based on this, the relative contribution of emission reduction and meteorological conditions to PM2.5 reduction in Beijing from 2013 to 2017 can be quantified.
The original and KZ-processed time series of PM2.5 concentrations were illustrated using one background station, one rural station and four urban stations (Fig. 4). As shown in Fig 4, most abrupt variations in the original time series of PM2.5 concentrations have been smoothed through KZ filtering, and the generally decreasing trend of PM2.5 variations from 2013 to 2017 caused by anthropogenic emissions can be clearly presented.
Table 5Estimated relative contribution of emission reduction and meteorological variations to PM2.5 reduction in Beijing from 2013 to 2017 using KZ filter.
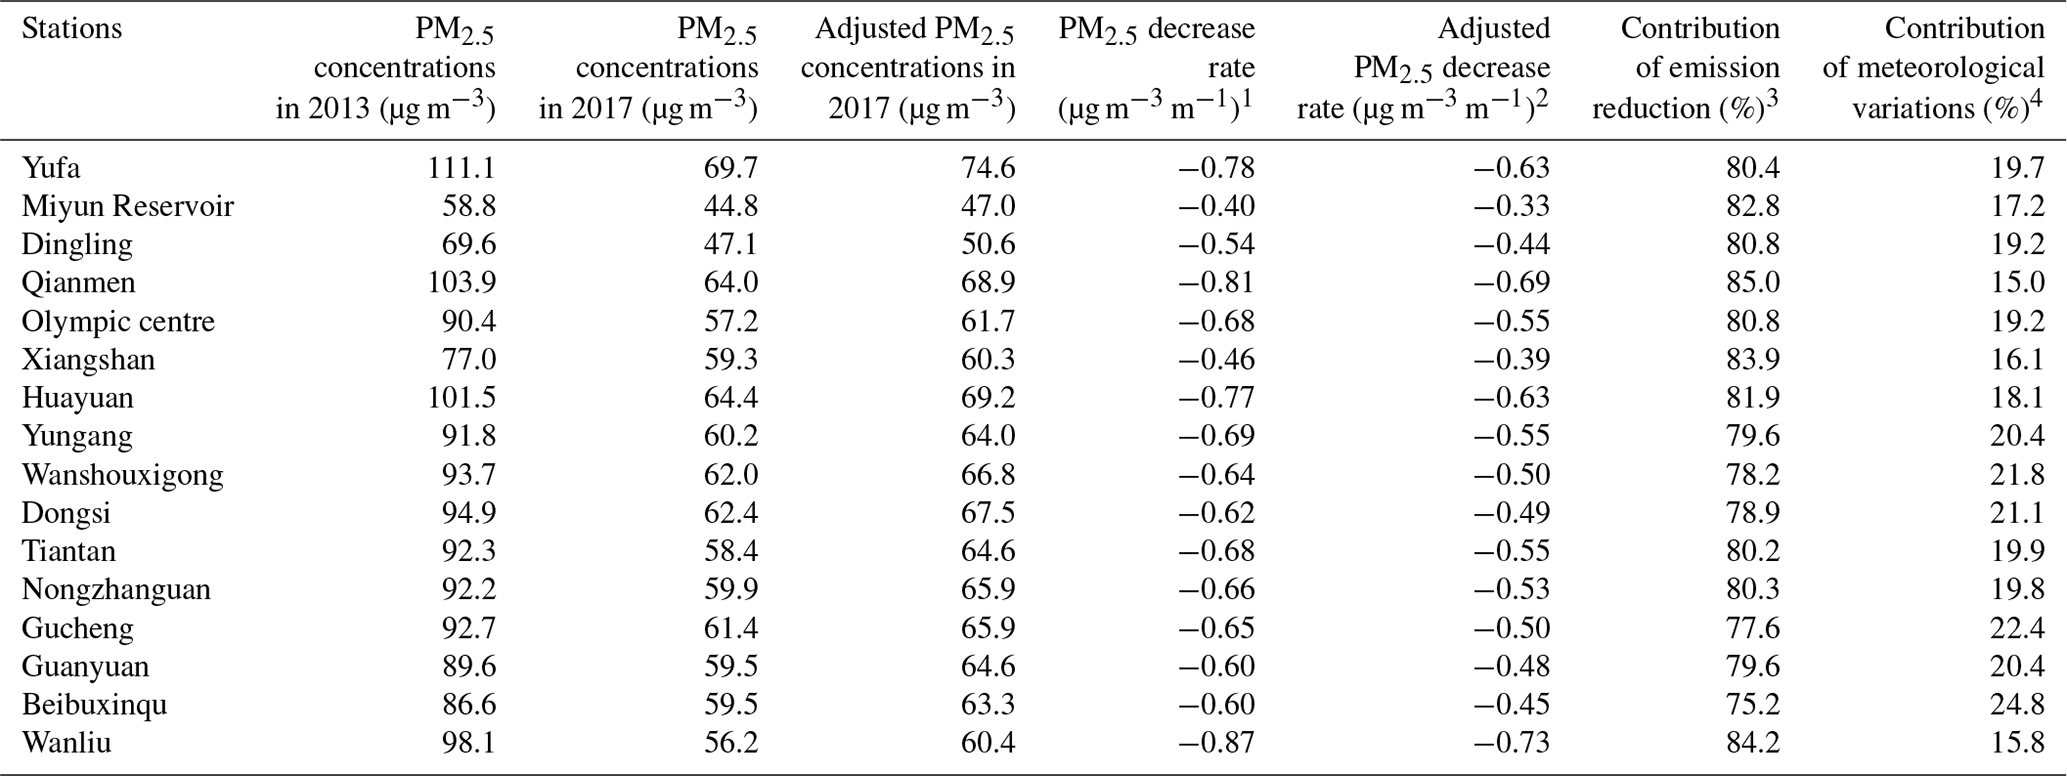
1 PM2.5 decrease rate: the fitted variation slope of original monthly average PM2.5 time series. 2 Adjusted PM2.5 decrease rate: the fitted variation slope of adjusted monthly average PM2.5 time series. 3 Contribution of emission reduction = 1 – Contribution of meteorological variations. 4 Contribution of meteorological variations = (PM2.5 decrease rate – Adjusted PM2.5 decrease rate) ∕ PM2.5 decrease rate.
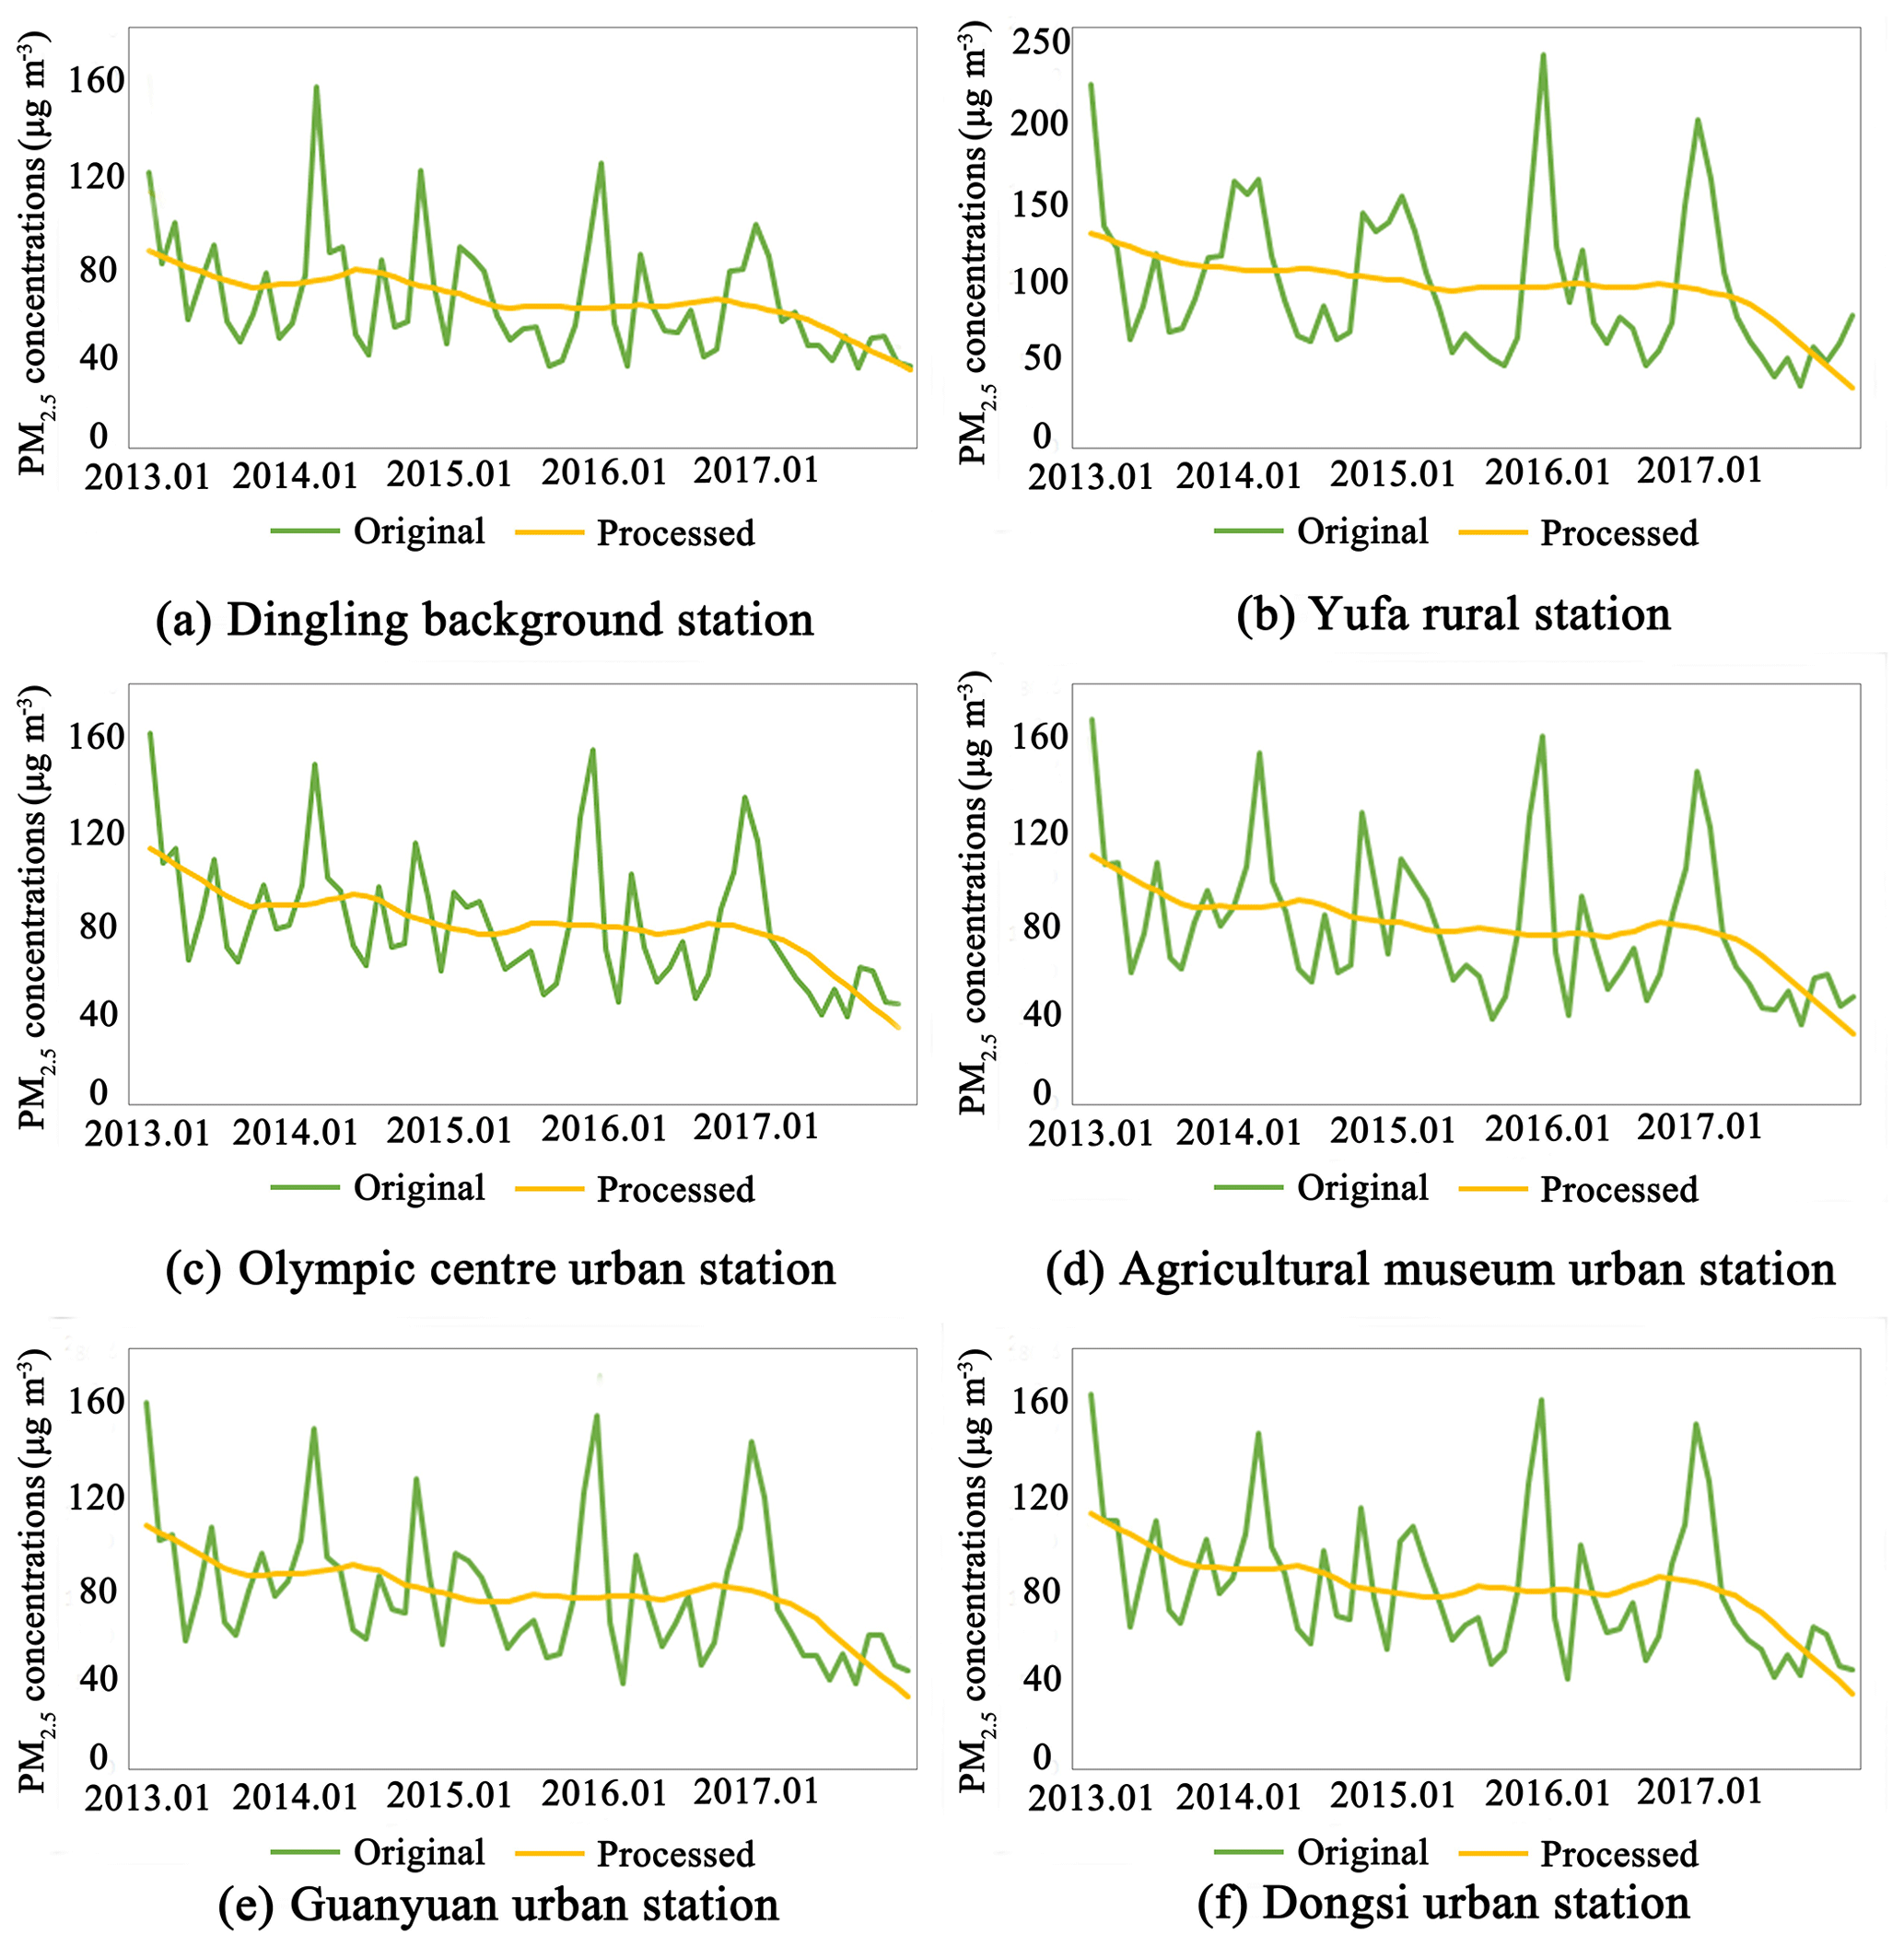
Figure 4The comparison of original and KZ processed time series of PM2.5 concentrations at six stations from 2013 to 2017.
According to Table 5, the annual mean PM2.5 concentration in Beijing in 2017 was 35.6 % lower than that in 2013. By filtering the influence of meteorological variations, the adjusted annual mean PM2.5 concentration in Beijing in 2017 decreased by 31.7 % when compared to that in 2013, indicating that the variation in meteorological conditions exerted a moderate influence on PM2.5 reduction from 2013 to 2017. Meteorological conditions in Beijing were generally favourable for PM2.5 dispersion during the 5-year period, especially in the latter half of 2017, when there was a high frequency of strong northerly winds and much lower wintertime PM2.5 concentrations than in previous years.
For the winter of 2017, frequent windy weather and successive clean sky had a strong influence on the reduction of PM2.5 concentrations in Beijing. This led to a hot debate concerning whether the notable decrease in PM2.5 concentrations was mainly attributed to the favourable meteorological conditions or emission reduction. Table 5 suggests that the control of anthropogenic emissions contributed 75.2 %∼85.0 % to the PM2.5 decrease in the 5-year period, indicating that emission reduction worked effectively in all rural, urban and background stations. On average, the relative contribution of emission reduction and meteorological variations to PM2.5 reduction in Beijing from 2013 to 2017 was 80.6 % and 19.4 % respectively. Therefore, in spite of more favourable meteorological conditions, properly designed and implemented emission-reduction measures were the dominant driver for the remarkable decrease in PM2.5 concentrations in Beijing from 2013 to 2017.
4.1.2 Estimation based on WRF-CMAQ
In addition to the KZ filter, we also employed WRF-CMAQ to estimate the relative contribution of emission reduction and meteorological conditions to the decrease in PM2.5 concentrations in Beijing. The result is shown in Table 6.
Table 6Estimated relative contribution of emission reduction and meteorological variations to PM2.5 reduction in Beijing from 2013 to 2017 using WRF-CMAQ.
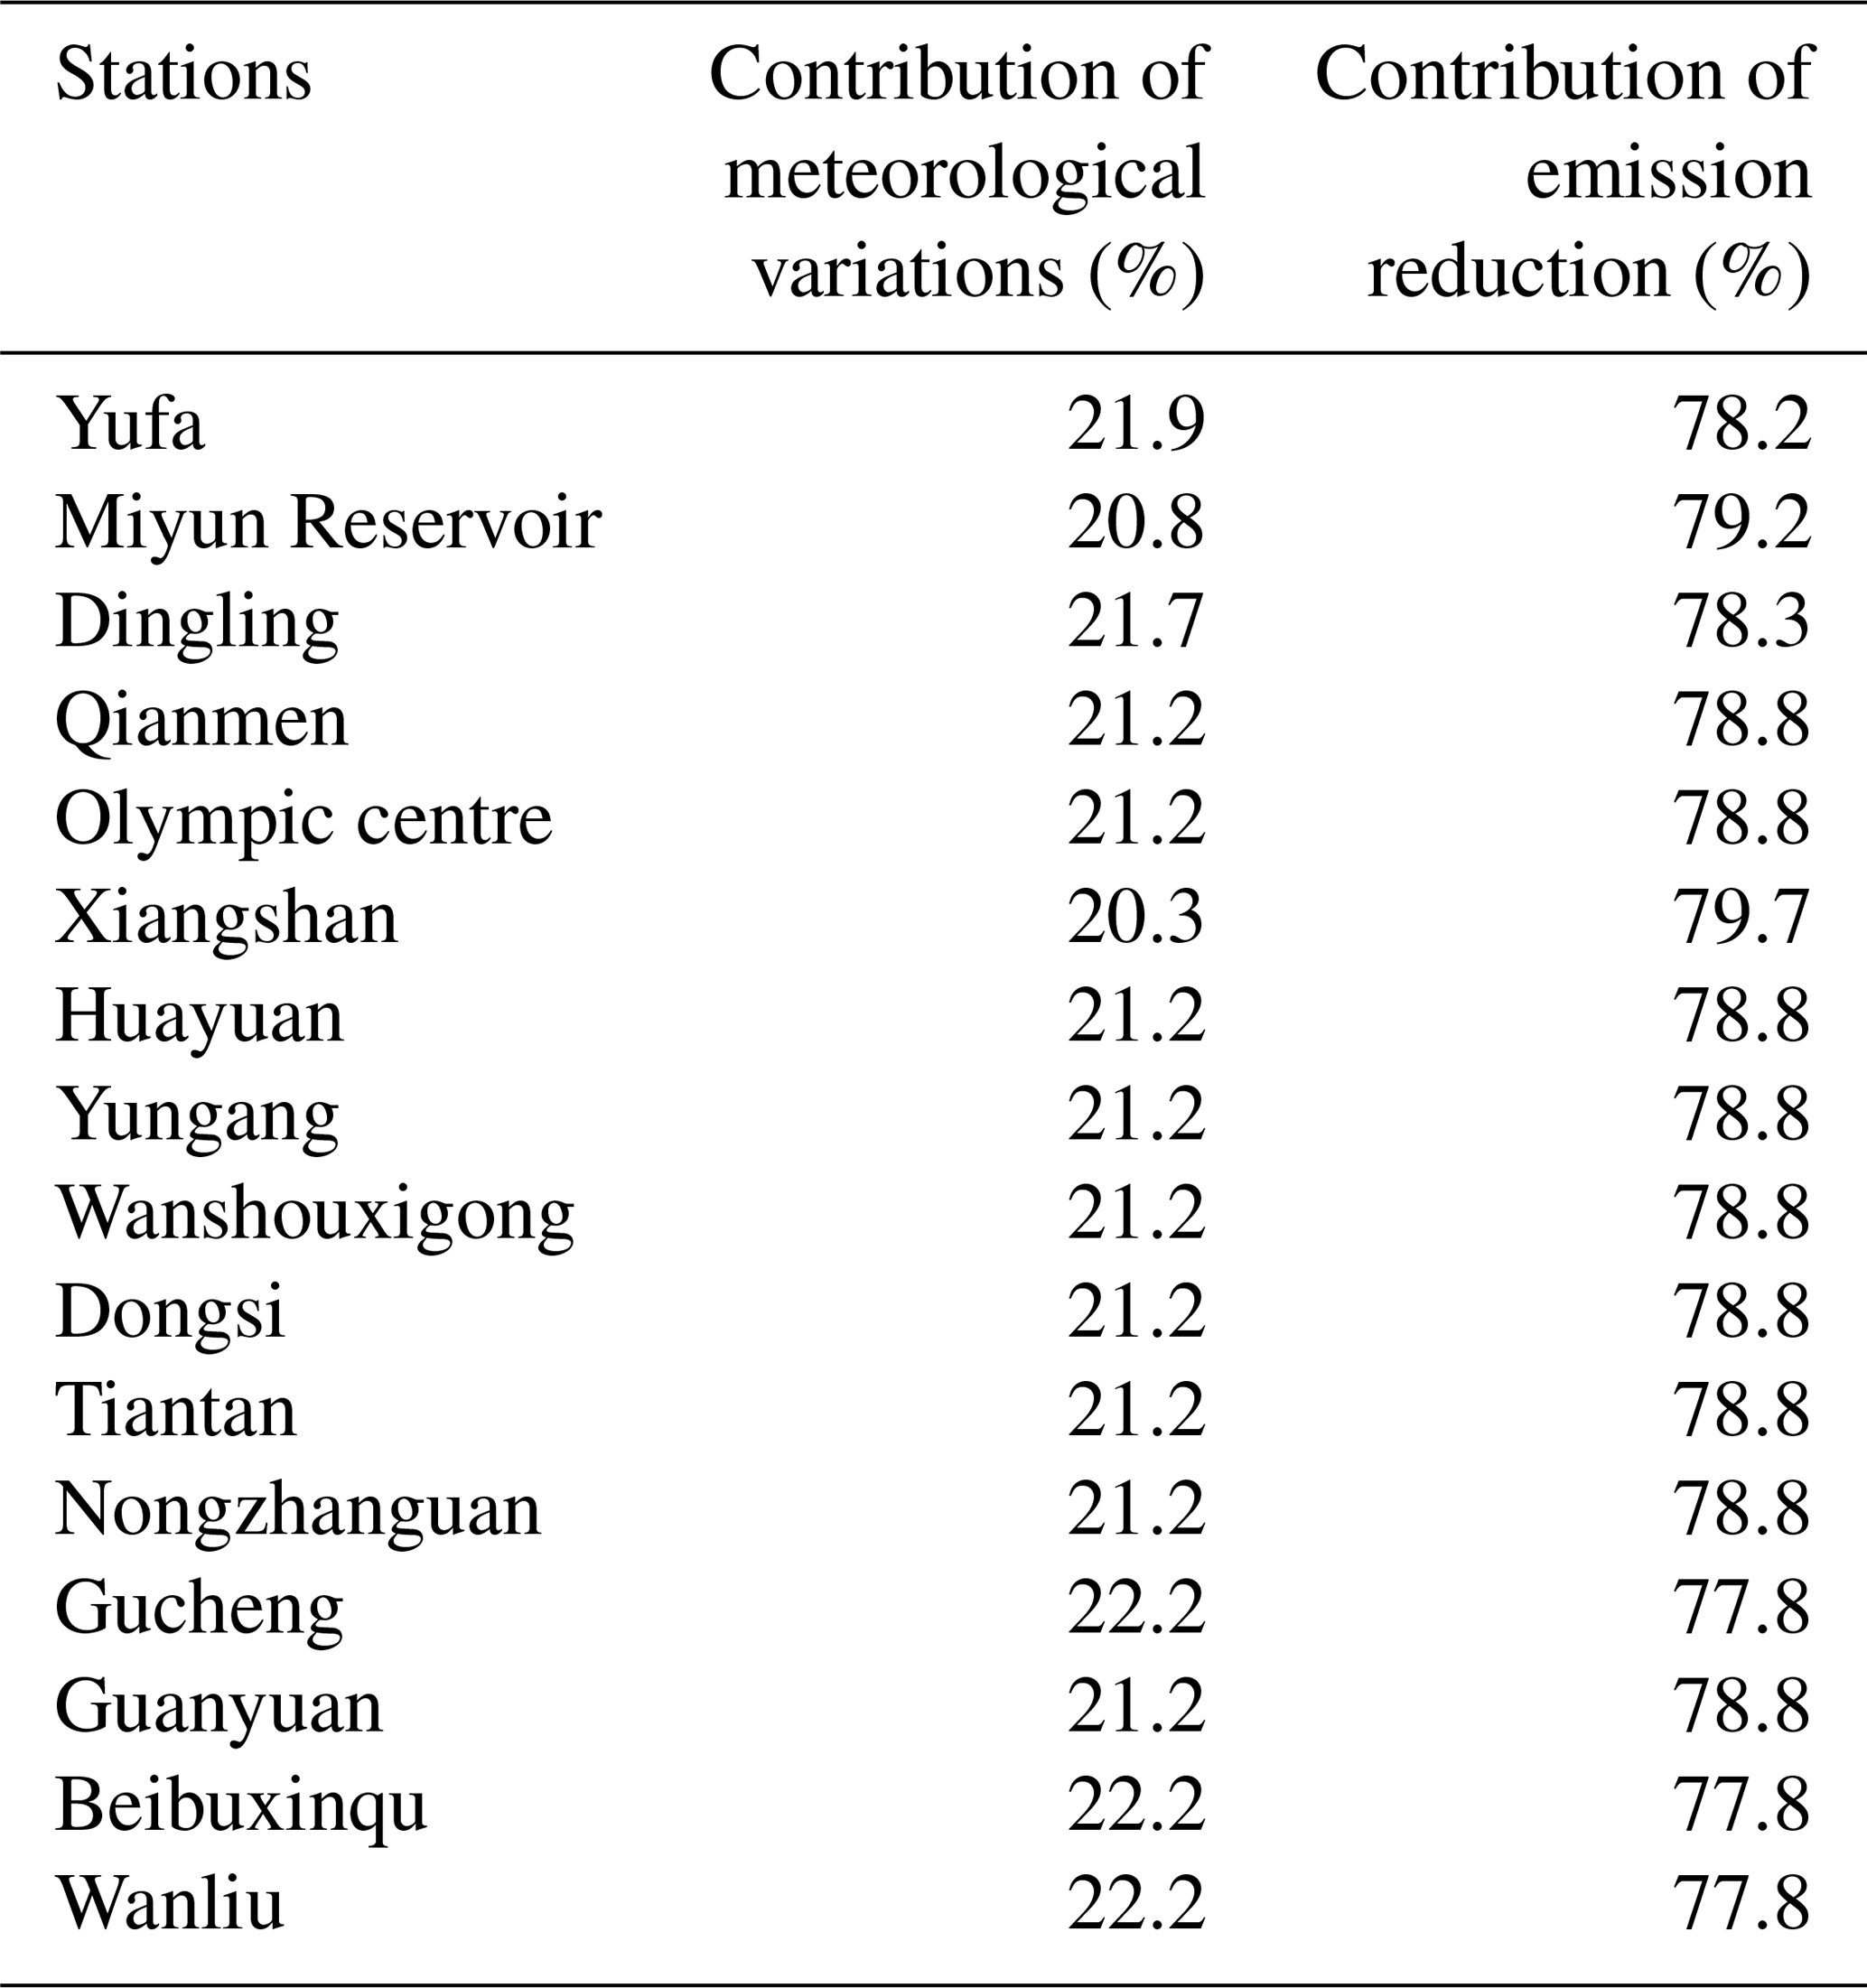
Based on WRF-CMAQ, the relative contribution of meteorological variations to the decrease in PM2.5 concentrations in Beijing ranged from 20.3 % to 22.2 % in different stations, whilst emission reduction accounted for about four-fifths of PM2.5 reduction from 2013 to 2017. It is worth mentioning that WRF-CMAQ is a grid-based model and thus the calculated contribution of meteorological variations for some stations located in the same grid was the same. Instead, station-based KZ filtering led to a more reliable analysis for each station and can better distinguish the differences between multiple stations. Furthermore, WRF-CMAQ simply considered the differences between meteorological conditions in 2013 and 2017 without considering their variations during the 5-year period while the KZ filtering analysed the entire time series of PM2.5 and meteorological data from 2013 to 2017. The averaged relative contribution of meteorological variations to PM2.5 reduction in Beijing calculated using WRF-CMAQ was 21.4 %, very similar to the 19.4 % calculated using KZ filtering. The slightly larger meteorological contribution calculated using WRF-CMAQ might be attributed to the fact that WRF-CMAQ simply considered the favourable meteorological conditions in 2017 whilst KZ fully considered the long-term meteorological variations from 2013 to 2017.
Since KZ filtering is fully based on observed data and simply considers the influence of time series meteorology data on PM2.5 variations, less uncertainty is involved. The accuracy of KZ filtering is influenced mainly by the variations in PM2.5–meteorology interactions in different areas and seasons. On the other hand, CTMs (e.g. WRF-CMAQ or WRF-CAMx, Weather Research and Forecasting-Comprehensive air quality Model with Extensions) consider both meteorological conditions (mainly large-scale meteorological data for model simulation, not as accurate as local observed meteorological data) and anthropogenic emissions for estimating PM2.5 concentrations under different emission scenarios. The accuracy of these models is not only decided by a proper understanding of PM2.5–meteorology interactions, but also the reliability of emission inventories and proper descriptions of reaction mechanisms for PM2.5 production, especially during heavy pollution episodes, which is a major challenge for the current model simulation. Consequently, KZ filtering provides a more reliable method for researchers and decision makers to understand the relative importance of emission reduction and meteorological conditions in recent PM2.5 reduction in Beijing. Meanwhile, similar outputs from the WRF-CMAQ simulation provide complementary evidence for the fact that anthropogenic emissions exerted a much stronger influence on PM2.5 concentrations than meteorological conditions. In addition to the combined effects of all emission-reduction measures, we further employed WRF-CMAQ to quantify the relative contribution of different emission-reduction measures to the decrease in PM2.5 concentrations in Beijing from 2013 to 2017.
4.2 The relative contribution of different emission-reduction measures to the decrease in PM2.5 concentrations in Beijing
The observed annual average PM2.5 concentration in Beijing in 2017 was 58 mg m−3, compared with 89.5 µg m−3 in 2013. Based on WRF-CMAQ simulation, meteorological conditions contributed 6.7 µg m−3, whilst the control of anthropogenic emissions contributed 24.7 µg m−3 to the total PM2.5 reduction of 31.5 µg m−3 in Beijing from 2013 to 2017. Specifically, local and regional emission reduction accounted for 16.9 and 7.8 µg m−3 of PM2.5 reduction. Local emissions and regional transport took up 68.4 % and 31.6 % of total anthropogenic emissions in Beijing. This result is consistent with our recent study (Chen et al., 2019). Chen et al. (2019) investigated four pollution episodes in Beijing in 2013, 2016, 2017 and 2018 respectively and found that local emissions accounted for 69.3 %, 76.8 %, 49.5 % and 88.4 % of total emissions in Beijing respectively. Except for the moderate pollution episode in 2017, local emissions caused more than two-thirds of anthropogenic emissions in Beijing. Therefore, local emissions played a dominant role for PM2.5 variations in Beijing in both the long-term run and heavy pollution episodes. According to three emission-reduction scenarios designed, the regulation of coal boilers had the most significant effect on PM2.5 reduction in Beijing and resulted in a decrease of 6.3 µg m−3. Meanwhile, increasing clean fuels for residential use and industrial restructuring also exerted a strong influence on PM2.5 reduction and contributed to a decrease of 5.5 and 3.4 µg m−3 respectively. The three major strategies accounted for around half of the total effects of emission reduction on PM2.5 variations in Beijing.
By the end of 2017, the Beijing Five-year Clean Air Action Plan (2013–2017) was completed and achieved its primary goal of reducing the annual average PM2.5 concentration to less than 60 µg m−3. Meanwhile, in November 2017, strong northerly winds in Beijing resulted in the cleanest winter in the past 5 years, raising arguments of whether the favourable meteorological conditions were primarily responsible for PM2.5 reduction or whether the significant improvement in air quality in Beijing was mainly attributed to the control of anthropogenic emissions. In this case, a quantitative comparison between the influence of meteorological conditions and emission reduction on PM2.5 reduction is necessary for comprehensively evaluating the Five-year Clean Air Action Plan. Based on two different approaches, this research revealed that the control of anthropogenic emissions contributed around 80 % to PM2.5 reductions in Beijing from 2013 to 2017, indicating that the Five-Year Clean Air Action Plan exerted a dominant influence on air quality enhancement in Beijing. The large contribution of some specific emission-reduction measures may be obscured in the presence of favourable meteorological conditions. For instance, many residents may attribute the clean winter of 2017 to the notable strong winds without noticing some of major emission-reduction strategies implemented during this period. A large-scale replacement of coal boilers with gas boilers has been conducted in Beijing and its neighbouring areas since 2013. As quantified by WRF-CMAQ, the regulation of coal boilers and increasing use of clean fuels for residential use jointly contributed to an 11.8 µg m−3 decrease in PM2.5 concentrations, much (almost twice) larger than the 6.7 µg m−3 decrease caused by favourable meteorological conditions. In general, although favourable meteorological conditions (e.g. strong winds) may lead to an instant improvement of air quality, regular emission-reduction measures exert a reliable and consistent influence on the long-term reduction of PM2.5 concentrations in Beijing. Given the satisfactory performance of the Five-year Clean Air Action Plan in PM2.5 reduction, such a long-term clean-air plan should be further designed and implemented in Beijing and other megacities with heavy PM2.5 pollution.
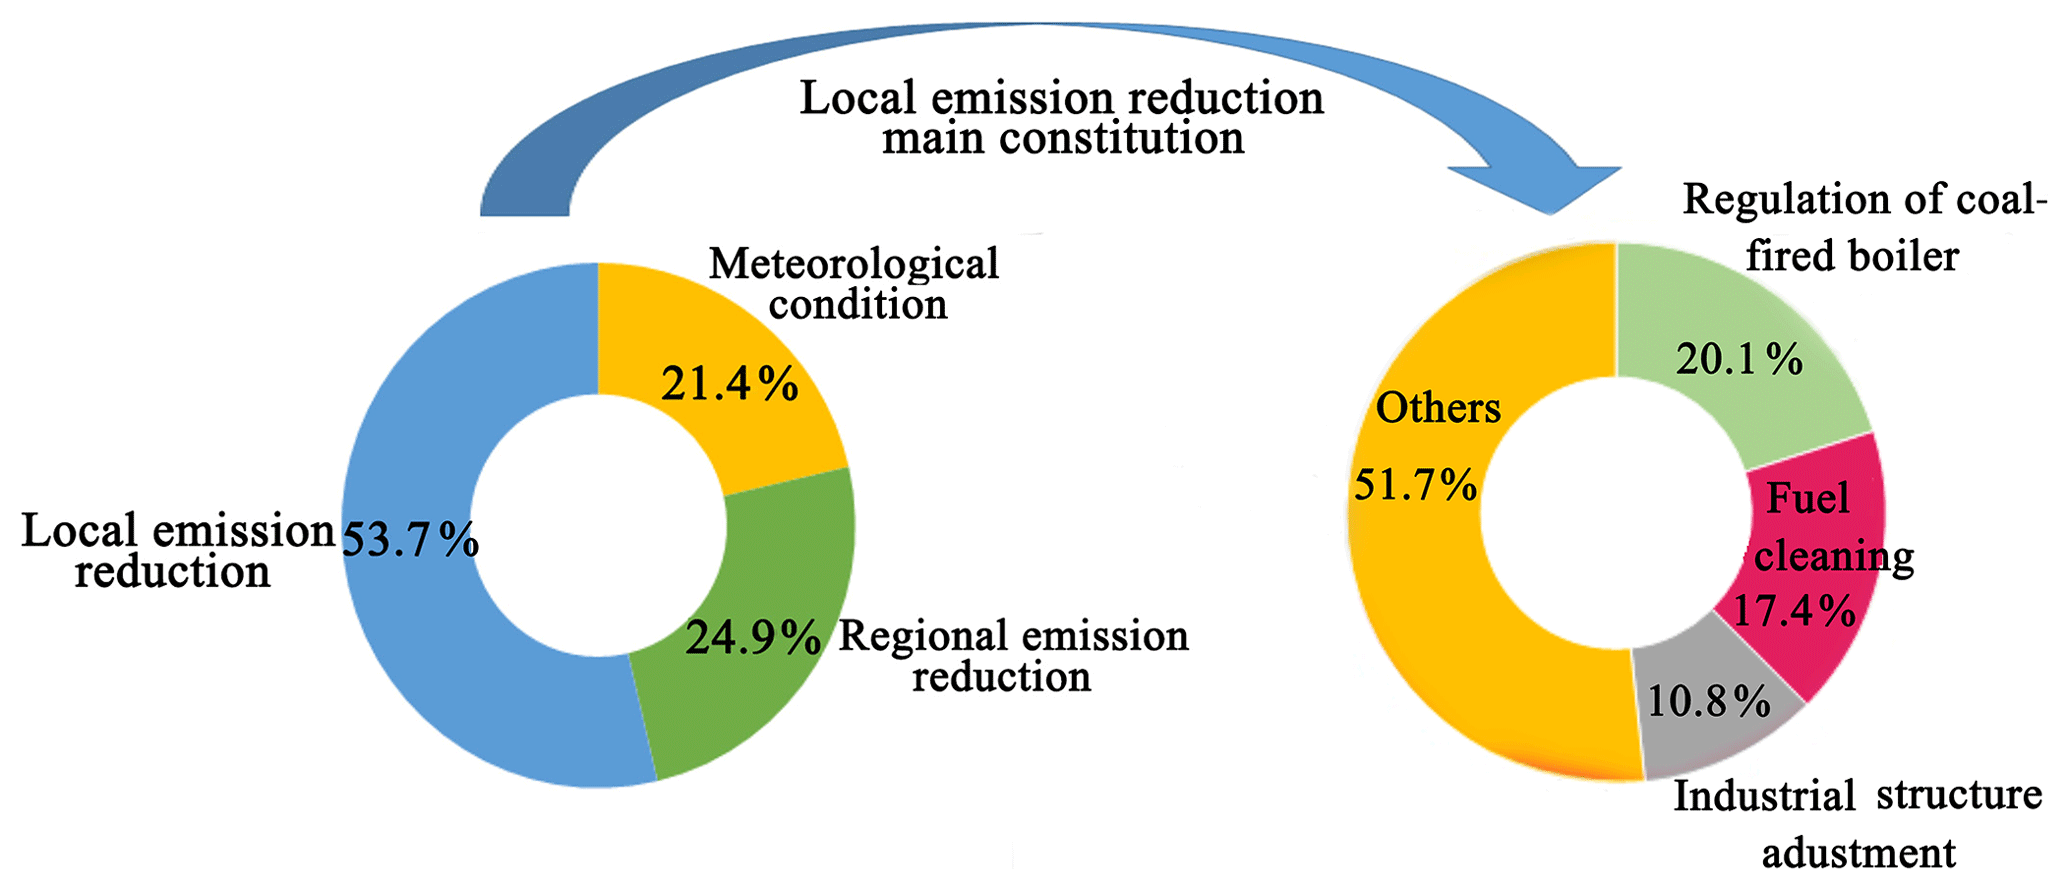
Figure 5The relative contribution of different influencing factors to the decrease in PM2.5 concentrations in Beijing from 2013 to 2017.
Recently, with growing attention to the completion of the Five-year Clean Air Action Plan, some other studies have also been conducted to evaluate this 5-year plan. J. Cheng et al. (2019) employed a finer-scale and more detailed local emission inventory and quantified the relative contribution of multiple emission-reduction strategies, including the control of coal-fired boilers, increasing use of clean fuels, optimisation of industrial structure, fugitive dust control, vehicle emission control, improved end-of-pipe control and integrated treatment of VOCs (volatile organic compounds). The relative contribution of these emission-reduction measures to PM2.5 reduction in Beijing from 2013 to 2017 was 18.7 %, 16.8 %, 10.2 %, 7.3 %, 6.0 %, 5.7 % and 0.6 % respectively. By contrast, our research revealed that three major emission-reduction measures (the regulation of coal-fired boiler, increasing use of clean fuels and industrial restructuring) contributed 20.1 %, 17.4 % and 10.8 % of total PM2.5 reduction in Beijing from 2013 to 2017, which was very close to J. Cheng et al.'s (2019) findings. Based on finer-scale local emission-inventories with more field-collected emission data, J. Cheng et al. (2019) provided a comprehensive and reliable understanding of the effects of multiple emission-reduction measures on PM2.5 reduction in Beijing. The similar outputs from the two studies further proved the reliability of WRF-CMAQ simulation. Meanwhile, J. Cheng et al. (2019) and UNEP (2019) jointly quantified that the total amount of reduction in SO2, NOx, VOCs and direct PM2.5 induced by the control of anthropogenic emissions was 79 420, 93 522, 115 752 and 44 307 t respectively, which was the major driver for the notable PM2.5 reduction in Beijing from 2013 to 2017.
Although the “2+26” regional strategy for air quality improvement in Beijing has become a hotly debated issue and growing emphasis has been placed on the proper design and implementation of regional emission-reduction strategies in Beijing and its surrounding cities, previous studies (Chen et al., 2019; J. Cheng et al., 2019) and this research proved that local emissions played a dominant role in affecting PM2.5 concentrations in Beijing. Specifically, Chen et al. (2019) pointed out that with the intensive reduction of coal-fired boilers in the Beijing–Tianjin–Hebei region, the relative contribution of vehicle emissions to PM2.5 concentrations in Beijing, especially during heavy pollution episodes, could be up to 50 %. To further improve air quality in Beijing, stricter regulations on local vehicle emissions, including contingent strategies during pollution episodes (e.g. odd-even license plate policy) and long-term policies (e.g. increasing availability of public transit systems and electric cars) should be a major priority for the next stage clean-air actions.
Based on KZ filtering, N. Cheng et al. (2019) and Ma et al. (2016) suggested the seasonal component contributed dominantly to O3 variations in Beijing. By comparison, this research revealed that the short-term component contributed dominantly to PM2.5 variations in Beijing. These findings explained the phenomenon well that ground ozone pollution in Beijing, controlled by seasonal variations in emission and meteorological conditions (especially high temperature and low humidity), simply occurred in summer, whilst PM2.5 pollution in Beijing, controlled by short-term variations in meteorological and emission factors might occur in all seasons. Consequently, contingent emission-reduction measures during heavy pollution episodes are an effective approach to offset the short-term deterioration of meteorological conditions and improve local air quality.
Despite the major contribution of emission-reduction measures to PM2.5 reduction in Beijing, meteorological influence, which contributed 20 % to PM2.5 reduction, should also be considered in a balanced way. In addition to the control of anthropogenic emissions, PM2.5 reduction may be realised through meteorological means. For the winter of 2017, strong northwesterly winds led to instant improvement in air quality, suggesting wind was a dominant meteorological factor for the accumulation or dispersion of PM2.5 in Beijing. Meanwhile, previous studies (Chen et al., 2017) suggested that increasing wind speeds led to increased evaporation, increased sunshine duration (SSD) and reduced humidity, which further reduced local PM2.5 concentrations. In other words, strong winds help reduce PM2.5 concentrations through direct and indirect measures. In this light, the forthcoming Beijing Wind-corridor Project, which includes five 500 m width corridors and more than ten 80 m width corridors to bring in stronger wintertime northwesterly winds, can be a promising approach for promoting a long-term favourable meteorological influence on PM2.5 reduction in Beijing.
To comprehensively evaluate the effect of the Beijing Five-year Clean Air Action Plan (2013–2017), we quantified the relative contribution of meteorological conditions and the control of anthropogenic emissions to the notable decrease in PM2.5 concentrations in Beijing from 2013 to 2017. Based on KZ filtering, we found that meteorological conditions and emission reduction accounted for 19.4 % and 80.6 % of the PM2.5 reduction in Beijing respectively. The large short-term component suggested that short-term variations in meteorological and emission factors exerted a dominant influence on the rapid variation in PM2.5 concentrations in Beijing. Meanwhile, WRF-CMAQ revealed that meteorological conditions and emission reduction contributed 21.4 % and 78.6 % to PM2.5 variations. Specifically, local and regional emission-reduction measures contributed 53.7 % and 24.9 % to PM2.5 reduction. For three major emission-reduction measures, the regulation of coal boilers, increasing use of clean fuels for residential use and industrial restructuring contributed 20.1 %, 17.4 % and 10.8 % to PM2.5 reduction respectively. Similar outputs from two models suggested that the control of anthropogenic emissions contributed around 80 % to the total decrease in PM2.5 concentrations in Beijing from 2013 to 2017, indicating that the Five-year Clean Air Action Plan worked effectively and that such a long-term clean-air plan should be continued in the following years to further reduce PM2.5 concentrations in Beijing.
The PM2.5 data used for this research are available at http://pm25.in/ (China National Environmental Monitoring Center, 2017, last access: 18 August 2018), whilst meteorological data are available at http://www.cma.gov.cn/2011qxfw/2011qsjgx/ (China Meteorological Data Sharing Service System, 2017, last access: 18 August 2018).
ZC, BG and BX designed this research. ZC wrote this paper. DC, YZ, BG and RL conducted data analysis. DC and YZ produced the figures. MK and BC helped revise this paper.
The authors declare that they have no conflict of interest.
Sincere gratitude goes to Tsinghua University, which produced the Multi-resolution Emission Inventory for China (http://meicmodel.org/, last access: 16 February 2019) and the Research Center for Air Quality Simulation and Forecast, Chinese Research Academy of Environmental Sciences (http://106.38.83.6/, last access: 16 February 2019), which supported the model simulation in this research. This research is supported by the National Key Research and Development Program of China (no. 2016YFA0600104) and National Natural Science Foundation of China (grant no. 41601447).
This research has been supported by the National Key Research and Development Program of China (no. 2016YFA0600104), and the State Key Laboratory of Earth Surface Processes and Resource Ecology (grant no. 2017-KF-22).
This paper was edited by Yves Balkanski and reviewed by two anonymous referees.
Boylan, J. W. and Russell, A. G.: PM and light extinction model performance metrics, goals and criteria for three-dimensional air quality models, Atmos. Environ., 40, 4946–4959, 2006.
Brunekreef, B. and Holgate, S.: Air pollution and health Lancet, 360, 1233–1242, 2002.
Chan, C. K. and Yao, X.: Air pollution in mega cities in China, Atmos. Environ., 42, 1–42, 2008.
Chen, D., Liu, Z., Fast, J., and Ban, J.: Simulations of sulfate–nitrate–ammonium (SNA) aerosols during the extreme haze events over northern China in October 2014, Atmos. Chem. Phys., 16, 10707–10724, https://doi.org/10.5194/acp-16-10707-2016, 2016.
Chen, Z., Xie, X., Cai, J., Chen, D., Gao, B., He, B., Cheng, N., and Xu, B.: Understanding meteorological influences on PM2.5 concentrations across China: a temporal and spatial perspective, Atmos. Chem. Phys., 18, 5343–5358, https://doi.org/10.5194/acp-18-5343-2018, 2018.
Chen, Z. Chen, D., Wen, W., Zhuang, Y., Kwan, M., Chen, B., Zhao, B., Yang, L., Gao, B., Li, R., and Xu, B.: Evaluating the “2+26” Regional Strategy for Air Quality Improvement During Two Air Pollution Alerts in Beijing: variations of PM2.5 concentrations, source apportionment, and the relative contribution of local emission and regional transport, 19, 6879–6891, 2019.
Chen, Z. Y., Xu, B., Cai, J., and Gao, B. B.: Understanding temporal patterns and characteristics of air quality in Beijing: A local and regional perspective, Atmos. Environ., 127, 303–315, 2016.
Chen, Z. Y., Cai, J., Gao, B. B., Xu, B., Dai, S., He, B., and Xie, X. M.: Detecting the causality influence of individual meteorological factors on local PM2.5 concentrations in the Jing-Jin-Ji region, Sci. Rep., 7, 40735, https://doi.org/10.1038/srep40735, 2017.
Cheng, J., Su, J., Cui, T., Li, X., Dong, X., Sun, F., Yang, Y., Tong, D., Zheng, Y., Li, Y., Li, J., Zhang, Q., and He, K.: Dominant role of emission reduction in PM2.5 air quality improvement in Beijing during 2013–2017: a model-based decomposition analysis, Atmos. Chem. Phys., 19, 6125–6146, https://doi.org/10.5194/acp-19-6125-2019, 2019.
Cheng, N., Li, R., Xu, C., Chen, Z., Chen, D., Meng, F., Cheng, B., Ma, Z., Zhuang, Y., He, B., and Gao, B.: Ground ozone variations at an urban and a rural station in Beijing from 2006 to 2017: Trend, meteorological influences and formation regimes, J. Clean. Prod., 235, 11–20, 2019.
Cheng, N., Zhang, D., Li, Y., Xie, X., Chen, Z., Meng, F., Gao, B., and He, B.: Spatio-temporal variations of PM2.5 concentrations and the evaluation of emission reduction measures during two red air pollution alerts in Beijing, Sci. Rep., 7, 8220, https://doi.org/10.1038/s41598-017-08895-x, 2017
Dominici, F., Greenstone, M., and Sunstein, C.: Particulate matter matters, Science, 344, 257–259, 2014.
Eskridge, R. E., Ku, J. Y., and Rao, S. T.: Separating Different Scales of Motion in Time Series of Meteorological Variables, B. Am. Meteorol. Soc., 78, 1473–1483, 1997.
Gui, K., Che, H., Wang, Y., Wang, H., Zhang, L., Zhao, H., Zheng, Y., Sun, T., and Zhang, X.: Satellite-derived PM2.5 concentration trends over Eastern China from 1998 to 2016: Relationships to emissions and meteorological parameters, Environ. Pollut., 247, 1125–1133, 2019.
Guo, S., Hu, M., and Zamora, M. L.: Elucidating severe urban haze formation in China, P. Natl. Acad. Sci. USA, 1, 17373–17378, 2014.
Hong, C., Zhang, Q., He, K., Guan, D., Li, M., Liu, F., and Zheng, B.: Variations of China's emission estimates: response to uncertainties in energy statistics, Atmos. Chem. Phys., 17, 1227–1239, https://doi.org/10.5194/acp-17-1227-2017, 2017.
Huang, R., Zhang, Y., Bozzetti, C., Ho, K. F., Cao, J. J., and Han, Y.: High secondary aerosol contribution to particulate pollution during haze events in China, Nature, 514, 218–222, 2014.
Kang, D., Hogrefe, C., Foley, K. L., Napelenok, S. L., Mathur, R., and Rao, S. T.: Application of the kolmogorov–zurbenko filter and the decoupled direct 3d method for the dynamic evaluation of a regional air quality model, Atmos. Environ., 80, 58–69, 2013.
Li, G., Zavala, M., Lei, W., Tsimpidi, A. P., Karydis, V. A., Pandis, S. N., Canagaratna, M. R., and Molina, L. T.: Simulations of organic aerosol concentrations in Mexico City using the WRF-CHEM model during the MCMA-2006/MILAGRO campaign, Atmos. Chem. Phys., 11, 3789–3809, https://doi.org/10.5194/acp-11-3789-2011, 2011.
Liang, L., Cai, Y., Barratt, B., Lyu, B., Chan, Q., Hansell, A. L., Xie, W., Zhang, D., Kelly, F. J., and Tong, Z.: Associations between daily air quality and hospitalisations for acute exacerbation of chronic obstructive pulmonary disease in Beijing, 2013–17: an ecological analysis, Lancet Planet. Health, 3, 270–279, 2019.
Ma, Z., Xu, J., Quan, W., Zhang, Z., Lin, W., and Xu, X.: Significant increase of surface ozone at a rural site, north of eastern China, Atmos. Chem. Phys., 16, 3969–3977, https://doi.org/10.5194/acp-16-3969-2016, 2016.
MEP: 2017 air pollution prevention and management plan for the Beijing-Tianjin-Hebei region and its surrounding areas, available at: http://dqhj.mee.gov.cn/dtxx/201703/t20170323_408663.shtml (last access: 18 August 2018), 2017.
Nel, A.: Air pollution-related illness effects of particles Science, 308, 804–806, 2015.
Pearce, J. L., Beringer, J., Nicholls, N., Hyndman, R. J., and Tapper, N. J.: Quantifying the influence of local meteorology on air quality using generalized additive models, Atmos. Environ., 45, 1328–1336, 2011.
Qiao, L. P., Cai, J., Wang, H. L., Wang, W. L., Zhou, M., Lou, S. R., Chen, R. J., Dai, H. X., Chen, C. H., and Kan, H. D.: PM2.5 Constituents and Hospital Emergency-Room Visits in Shanghai, China, Environ. Sci. Technol., 48, 10406–10414, 2014.
Rao, S. T. and Zurbenko, I. G.: Detecting and Tracking Changes in Ozone Air Quality, Air Waste, 44, 1089–1092, https://doi.org/10.1080/10473289.1994.10467303, 1994.
Saikawa, E., Kim, H., Zhong, M., Avramov, A., Zhao, Y., Janssens-Maenhout, G., Kurokawa, J.-I., Klimont, Z., Wagner, F., Naik, V., Horowitz, L. W., and Zhang, Q.: Comparison of emissions inventories of anthropogenic air pollutants and greenhouse gases in China, Atmos. Chem. Phys., 17, 6393–6421, https://doi.org/10.5194/acp-17-6393-2017, 2017.
Shao, P., Tian, H., Sun, Y., Liu, H., Wu, B., Liu, S., Liu, X., Wu, Y., Liang, W., Wang, Y., Gao, J., Xue, Y., Bai, X., Liu, W., Lin, S., and Hu, G.: Characterizing remarkable changes of severe haze events and chemical compositions in multi-size airborne particles (PM1, PM2.5 and PM10) from January 2013 to 2016–2017 winter in Beijing, China, Atmos. Environ., 189, 133–144, 2018.
Sun, J., Gong, J., Zhou, J., Liu, J., and Liang, J.: Analysis of PM2.5 pollution episodes in Beijing from 2014 to 2017: Classification, interannual variations and associations with meteorological features, Atmos. Environ., 213, 384–394, 2019.
Sun, Y., Song, T., and Tang, G.: The vertical distribution of PM2.5, and boundary-layer structure during summer haze in Beijing, Atmos. Environ., 74, 413–421, 2013.
UNEP: A Review of Air Pollution Control in Beijing: 1998–2013, United Nations Environment Programme (UNEP), Nairobi, Kenya, 9–23, available at: http://www.unep.org/publications (last access: 16 February 2019), 2016.
UNEP: A Review of Air Pollution Control in Beijing: 1998–2017, United Nations Environment Programme (UNEP), Nairobi, Kenya, 9–23, available at: http://www.unep.org/publications (last access: 16 February 2019), 2019.
Wang, S., Xing, J., Zhao, B., Jang, C., and Hao, J.: Effectiveness of national air pollution control policies on the air quality in metropolitan areas of China, J. Environ. Sci., 26, 13–22, 2014.
Wang, T., Du, Z., Tan, T., Xu, N., Hu, M., Hu, J., and Guo, S.: Measurement of aerosol optical properties and their potential source origin in urban Beijing from 2013–2017, Atmos. Environ., 206, 293–302, 2019.
Wang, X., Wei, W., and Cheng, S.: Characteristics and classification of PM2.5 pollution episodes in Beijing from 2013 to 2015, Sci. Total Environ., 612, 170–179, 2018.
Xu, H., Xiao, Z., Chen, K., Tang, M., Zheng, N., Li, P., Yang, N., Yang, W., and Deng, X.: Spatial and temporal distribution, chemical characteristics, and sources of ambient particulate matter in the Beijing-Tianjin-Hebei region, Sci. Total Environ., 658, 280–293, 2019.
Xu, J., Chang, L., Qu, Y., Yan, F., Wang, F., and Fu, Q.: The meteorological modulation on PM2.5 interannual oscillation during 2013 to 2015 in Shanghai, China, Sci. Total Environ., 572, 1138–1149, 2016.
Yang, Y., Liao, H., and Lou, S.: Increase in winter haze over eastern china in recent decades: roles of variations in meteorological parameters and anthropogenic emissions, J. Geophys. Res.-Atmos., 121, 13050–13065, 2016.
Zhai, S., Jacob, D. J., Wang, X., Shen, L., Li, K., Zhang, Y., Gui, K., Zhao, T., and Liao, H.: Fine particulate matter (PM2.5) trends in China, 2013–2018: separating contributions from anthropogenic emissions and meteorology, Atmos. Chem. Phys., 19, 11031–11041, https://doi.org/10.5194/acp-19-11031-2019, 2019.
Zhang, H., Yuan, H., Liu, X., Yu, J., and Jiao, Y.: Impact of synoptic weather patterns on 24 h-average PM2.5 concentrations in the North China Plain during 2013–2017, Sci. Total Environ., 627, 200–210, 2018.
Zhang, Q., He, K., and Huo, H.: Cleaning China's air, Nature, 484, 161–162, 2012.
Zhao, B., Wang, S. X., Wang, J. D., Fu, J., Liu, T. H., Xu, J. Y., Fu, X., and Hao, J. M.: Impact of national NOX and SO2 control policies on particulate matter pollution in China, Atmos. Environ., 77, 453–463, 2013.
Zheng, G. J., Duan, F. K., Su, H., Ma, Y. L., Cheng, Y., and Zheng, B.: Exploring the severe winter haze in Beijing: the impact of synoptic weather, regional transport and heterogeneous reactions, Atmos. Chem. Phys., 15, 2969–2983, https://doi.org/10.5194/acp-15-2969-2015, 2015.
Zhou, Y., Zhao, Y., Mao, P., Zhang, Q., Zhang, J., Qiu, L., and Yang, Y.: Development of a high-resolution emission inventory and its evaluation and application through air quality modeling for Jiangsu Province, China, Atmos. Chem. Phys., 17, 211–233, https://doi.org/10.5194/acp-17-211-2017, 2017.
Zurbenko, I., Chen, J., and Rao, S. T.: Detecting discontinuities in time series of upper air data: Demonstration of an adaptive filter technique, J. Clim., 9, 3548–3560, 1996.