the Creative Commons Attribution 4.0 License.
the Creative Commons Attribution 4.0 License.
 | 25 Oct 2019
Composition and origin of PM2.5 aerosol particles in the upper Rhine valley in summer
Xiaoli Shen
Heike Vogel
Bernhard Vogel
Wei Huang
Claudia Mohr
Ramakrishna Ramisetty
Thomas Leisner
André S. H. Prévôt
We conducted a 6-week measurement campaign in summer 2016 at a rural site about 11 km north of the city of Karlsruhe in southwest Germany in order to study the chemical composition and origin of aerosols in the upper Rhine valley. In particular, we deployed a single-particle mass spectrometer (LAAPTOF) and an aerosol mass spectrometer (AMS) to provide complementary chemical information on aerosol particles smaller than 2.5 µm. For the entire measurement period, the total aerosol particle mass was dominated by sodium salts, contributing on average (36±27) % to the total single particles measured by the LAAPTOF. The total particulate organic compounds, sulfate, nitrate, and ammonium contributed on average (58±12) %, (22±7) %, (10±1) %, and (9±3) % to the total non-refractory particle mass measured by the AMS. Positive matrix factorization (PMF) analysis for the AMS data suggests that the total organic aerosol (OA) consisted of five components, including (9±7) % hydrocarbon-like OA (HOA), (16±11) % semi-volatile oxygenated OA (SV-OOA), and (75±15) % low-volatility oxygenated OA (LV-OOA). The regional transport model COSMO-ART was applied for source apportionment and to achieve a better understanding of the impact of complex transport patterns on the field observations. Combining field observations and model simulations, we attributed high particle numbers and SO2 concentrations observed at this rural site to industrial emissions from power plants and a refinery in Karlsruhe. In addition, two characteristic episodes with aerosol particle mass dominated by sodium salts particles comprising (70±24) % of the total single particles and organic compounds accounting for (77±6) % of total non-refractory species, respectively, were investigated in detail. For the first episode, we identified relatively fresh and aged sea salt particles originating from the Atlantic Ocean more than 800 km away. These particles showed markers like m∕z 129 , indicating the influence of anthropogenic emissions modifying their composition, e.g. from chloride to nitrate salts during the long-range transport. For a 3 d episode including high organic mass concentrations, model simulations show that on average (74±7) % of the particulate organics at this site were of biogenic origin. Detailed model analysis allowed us to find out that three subsequent peaks of high organic mass concentrations originated from different sources, including local emissions from the city and industrial area of Karlsruhe, regional transport from the city of Stuttgart (∼64 km away), and potential local night-time formation and growth. Biogenic (forest) and anthropogenic (urban) emissions were mixed during transport and contributed to the formation of organic particles. In addition, topography, temperature inversion, and stagnant meteorological conditions also played a role in the build-up of higher organic particle mass concentrations. Furthermore, the model was evaluated using field observations and corresponding sensitivity tests. The model results show good agreement with trends and concentrations observed for several trace gases (e.g. O3, NO2, and SO2) and aerosol particle compounds (e.g. ammonium and nitrate). However, the model underestimates the number of particles by an order of magnitude and underestimates the mass of organic particles by a factor of 2.3. The discrepancy was expected for particle number since the model does not include all nucleation processes. The missing organic mass indicates either an underestimated regional background or missing sources and/or mechanisms in the model, like night-time chemistry. This study demonstrates the potential of combining comprehensive field observations with dedicated transport modelling to understand the chemical composition and complex origin of aerosols.
- Article
(7706 KB) - Full-text XML
-
Supplement
(5117 KB) - BibTeX
- EndNote


Aerosols are ubiquitous in the atmosphere and play a crucial role in air quality, human health, the ecosystem, and climate change. In particular, aerosol particles modify atmospheric radiative fluxes and can serve as cloud condensation nuclei (CCN) and/or be activated as ice nuclei (IN), which influences cloud formation, properties (albedo), and precipitation, thus having a further impact on weather and climate change (Fuzzi et al., 2015; Pöschl, 2005; Seinfeld and Pandis, 2006). Such indirect impacts of aerosols on climate are still related to large uncertainties and low confidence levels (IPCC, 2013). There are various types of atmospheric aerosol particles, such as mineral dust, sea salt, soot, and organic aerosol particles, originating from biogenic and/or anthropogenic emission sources, as well as secondary formation from precursors within the atmosphere (Tsigaridis et al., 2006). Aerosol particles are not typically purely inorganic or organic; instead, they are often composed of different inorganic and organic species. Diverse origins and atmospheric ageing cause the complexity of the aerosol particle mixtures.
Real-time mass spectrometry is widely used to measure size and chemical composition of aerosol particles with high temporal resolution. Two major instrument types are the single-particle mass spectrometer (singe-particle MS) and aerosol mass spectrometer (AMS). The single-particle MS is sensitive to both non-refractory and refractory species and to the mixing state of individual particles; it thus identifies particle types (Murphy, 2007), while the AMS can quantify mass concentrations of non-refractory particulate compounds in bulk samples (Canagaratna et al., 2007). Complementary data from single-particle MS and AMS allow for the quantitative interpretation of the internal and external mixing state of the aerosol (Gemayel et al., 2017; Gunsch et al., 2018; Healy et al., 2013; Jeong et al., 2011; Shen et al., 2019a; Zhou et al., 2016). The mixing state of aerosol particles can reflect their evolution, e.g. caused by chemical reactions, leading to changing compositions or coatings (Reitz et al., 2016). A good example is the ageing of sea salt particles: chloride replacement by nitrate on sea salt particles can be well identified by single-particle MS (Gard et al., 1998).
The large diversity of aerosols, containing hundreds of gaseous and particulate components, makes it difficult to trace their sources. Therefore, several source apportionment methods have been developed with the common aim of reducing the complexity of aerosol particle mixtures and thus helping to identify the major particle types in the atmosphere. Clustering algorithms have been commonly used for single-particle MS data analysis (Reitz et al., 2016), while positive matrix factorization (PMF; Paatero, 1997; Paatero and Tapper, 1994) is commonly applied for AMS data analysis (Canonaco et al., 2013, 2015; Crippa et al., 2014; DeCarlo et al., 2010; Mohr et al., 2012; Ulbrich et al., 2009; Zhang et al., 2011). According to PMF analysis, organic aerosol (OA) can be separated into e.g. hydrocarbon-like OA (HOA), cooking-related OA (COA), nitrogen-enriched OA (NOA), biomass burning OA (BBOA), semi-volatile oxygenated OA (SV-OOA), and low-volatility oxygenated OA (LV-OOA). This information can give valuable hints regarding OA ageing and potential sources. However, these methods can only provide indirect source information. The application of a transport model gives additional information. It can predict the state of the atmosphere based on detailed meteorology, emission data, and conversions of reactive species and thus allows for the study of aerosol evolution from emission to a site of interest.
There are a variety of so-called online coupled chemical transport models. A recent review is given by Baklanov et al. (2014). Such models are important tools to better understand aerosol particle sources and ageing processes, as well as their impact on particles' climate-relevant properties, such as cloud condensation nuclei (CCN) activity, optical properties, and hygroscopicity (Fierce et al., 2017). Models can be improved with a good process understanding, e.g. emissions, transport, and deposition, as well as corresponding parameterizations obtained from dedicated laboratory studies (Burkholder et al., 2017). They are often used to predict the evolution of atmospheric composition on different spatial scales, which can be evaluated by comparison with field measurements. Comparisons between model simulations and field observations also help to validate the model or to identify weaknesses like poorly represented chemistry and missing sources or mechanisms.
For comparison with measurements at a single location, regional-scale models with small grid sizes (down to a few kilometres) are required. In addition, phenomena such as mountain and valley winds, land–sea breezes, or lee waves become important, which requires a non-hydrostatic formulation of the model equations. In this study we use the regional-scale model system COSMO-ART (Consortium for small-scale modelling – aerosols and reactive trace gases; Vogel et al., 2009). The part of the model describing aerosols and reactive trace gases was developed at the Karlsruhe Institute of Technology (http://www.imk-tro.kit.edu/english/3509.php, last access: 17 October 2019). It extends the operational weather forecast model COSMO of the German Weather Service (DWD), and it allows for the study of the feedback processes between aerosol particles and the state of the atmosphere covering the continental to the regional scale.
Mobile particle measurements on a tramline intersecting the city of Karlsruhe in southwest Germany and in the upper Rhine valley showed particle number concentrations in the rural area north of the city almost as high as in downtown (particle size >4 nm; mean value cm−3, maximum values 3×104 cm−3) (Hagemann et al., 2014). The Rhine valley provides a well-known wind channel of large-scale flow. This results in faster transport of pollutants along the valley axis, e.g. NOx, SO2, volatile organic compounds (VOCs), and particles (Gross and Wippermann, 1987; Hagemann et al., 2014; Kalthoff and Vogel, 1992; Vogel et al., 1986). According to data from the local air quality monitoring administration (LUBW; https://www.lubw.baden-wuerttemberg.de/luft, last access: 17 October 2019) from 2016 to 2018, the annual averaged mass concentrations of NO2, SO2, PM10, and soot are 20, 2, 16, and 1.8 µg m−3, respectively. They were measured at the Eggenstein monitoring station (3.3 km south of the measurement site used in this study and about 9 km north of the city of Karlsruhe). Specifically, NO2 concentrations are about half of the values measured in downtown Karlsruhe, but they exhibit comparably peak values (around 50–80 µg m−3). SO2 levels at Eggenstein are the second highest in the state of Baden-Württemberg (from the available data from 2016 to 2018), and maximum hourly values can reach up to ∼50 µg m−3.
In order to understand the sources of high local particle concentrations as well as the chemical nature and mass concentrations of aerosol types prevailing in the upper Rhine valley in summertime, we combine comprehensive aerosol information from point measurements with a regional transport model. Besides a better understanding of the origin of the aerosol in that region, we want to validate the capabilities of our transport model to predict characteristic air quality parameters.
2.1 Measurement site and instrumentation
The measurement site (49∘6′10.54′′ N, 8∘24′26.07′′ E) is in the upper Rhine valley 175 m north of the village of Leopoldshafen and 10 m east of the tramline no. S1/11 described by Hagemann et al. (2014) (marked with a star in Fig. 1). The Rhine valley often acts as a wind channel, leading to wind directions mainly from southwest or northeast. As shown in Fig. 1, the measurement site is located ∼11 km north of downtown Karlsruhe and ∼5 to 15 km northeast of an industrial area, including a refinery with 15.5 Mt yr−1 capacity, a 1450 MW hard-coal-fired power plant, and a 365 MW gas-fired power plant (Hagemann et al., 2014). Therefore, the measurement site is potentially subject to urban and industrial emissions, especially for southerly wind directions. Apart from that, there are several nearby biogenic emission sources, e.g., forests, sunflower fields, and other agricultural areas (Hagemann et al., 2014; Huang et al., 2019). Local traffic emissions from the minor road near the measurement site were identified by measurements with high time resolution. Its contributions to the aerosol load are small due to the generally low traffic.
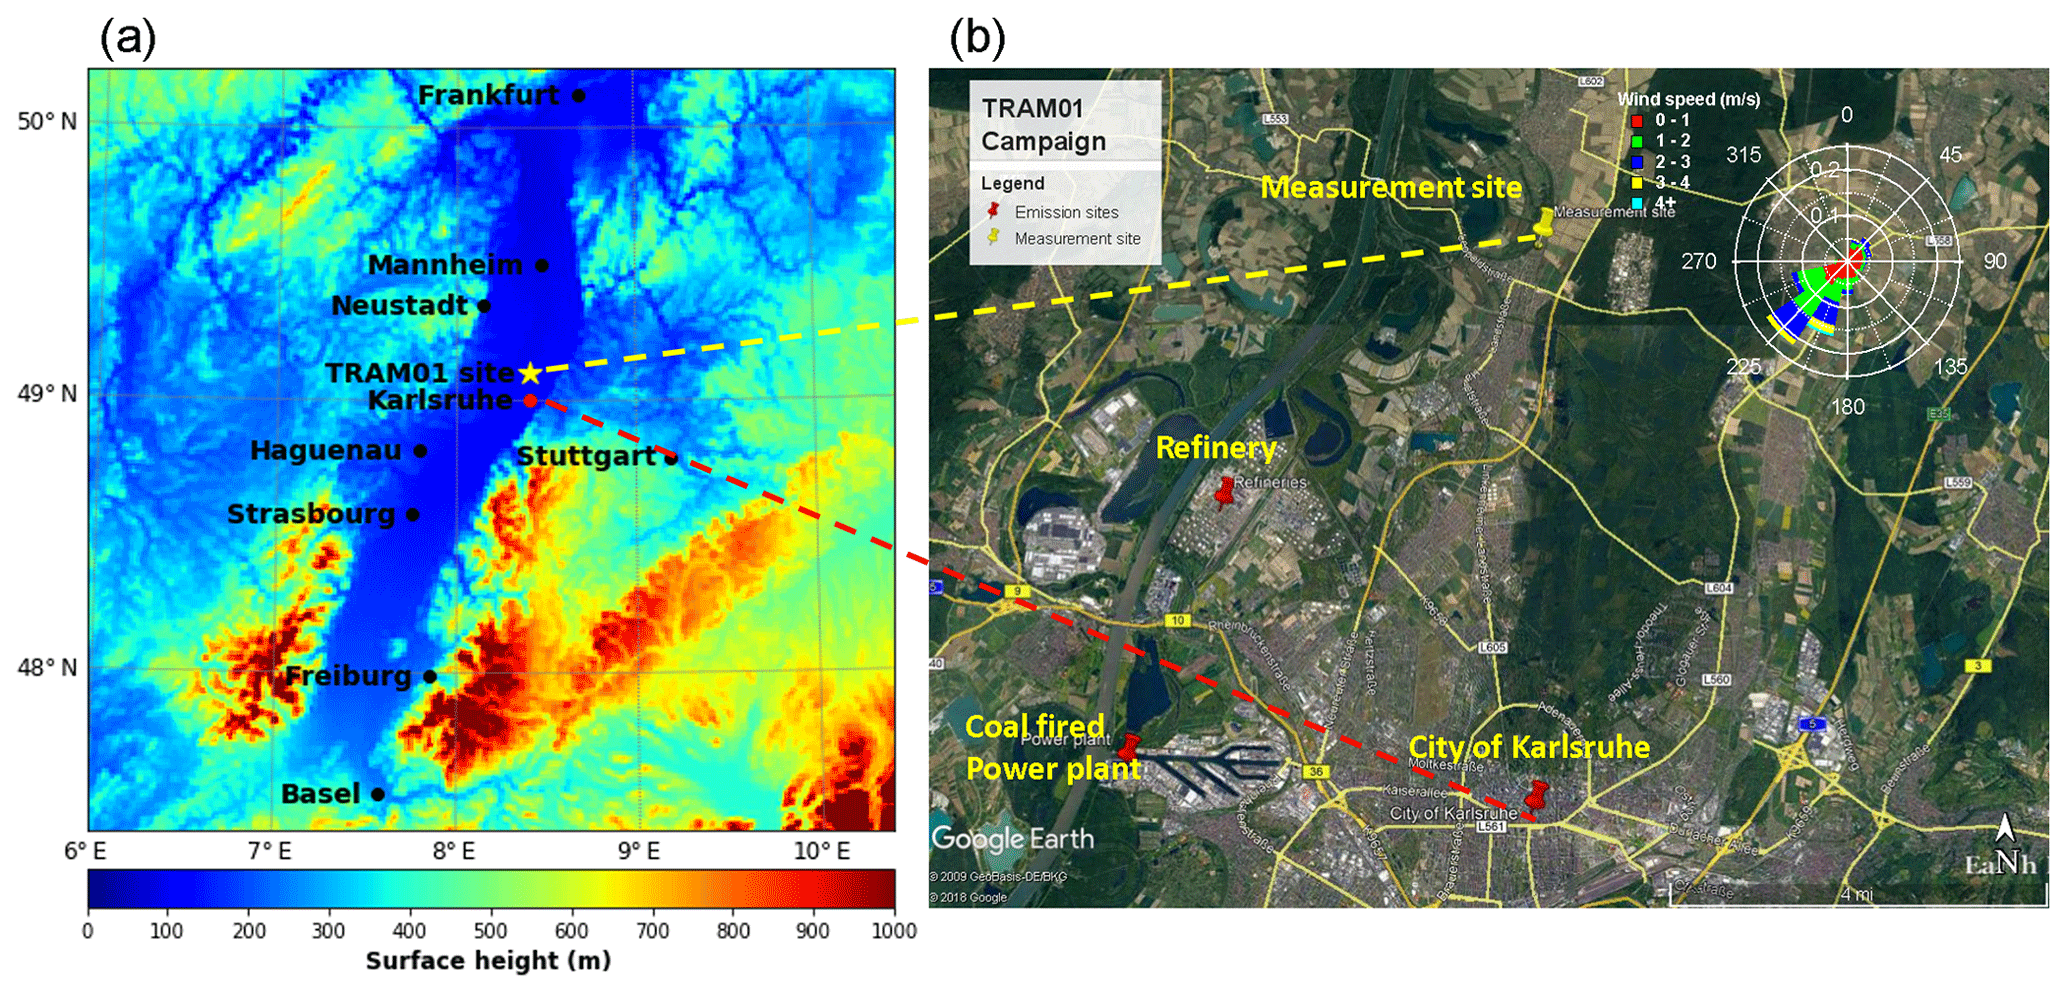
Figure 1Measurement location and topography (a); nearby peak emission sites and wind rose for the complete measurement campaign in summer 2016 (b).
The instrumentation for this campaign has been described in detail in previous publications (Huang et al., 2019; Shen et al., 2019a). Briefly, the data we use here are from the 6-week (26 July to 31 August 2016) deployment of a laser ablation aerosol particle time-of-flight mass spectrometer (LAAPTOF; AeroMegt GmbH) and a high-resolution time-of-flight aerosol mass spectrometer (HR-ToF-AMS; Aerodyne Inc.; hereafter AMS). These instruments were used to provide real-time information on size and chemical composition for individual particles and bulk samples, respectively. The LAAPTOF is a commercially available single-particle mass spectrometer and has been well described in recent publications (Gemayel et al., 2016; Marsden et al., 2016; Ramisetty et al., 2018; Shen et al., 2018). In brief, aerosol particles with a size range of 70 nm to 2.5 µm in vacuum aerodynamic diameter (dva) are sampled with a flow rate of ∼ 80 cm3 min−1, then focused and accelerated via an aerodynamic lens (ADL). Afterwards, the particles of ∼ 200 nm to 2.5 µm dva can be detected with two laser diodes (λ=405 nm) mounted in the particle time-of-flight (PTOF) chamber. Once a single particle is detected successively by both of the detection lasers, its dva is calculated from the time of flight and an excimer laser (λ=193 nm) is triggered to desorb and ionize the refractory and non-refractory species of the particle. The resulting cations and anions are analysed with a bipolar ToF mass spectrometer. The AMS measures the particle size-resolved bulk chemical composition, e.g. organic compounds, ammonium, nitrate, sulfate, and chloride, in mass concentrations with high time resolution and sensitivity (DeCarlo et al., 2006). Similarly as the LAAPTOF, aerosols are sampled with a flow rate of ∼84 cm3 min−1 via a similar ADL (Peck et al., 2016) in the size range 70 nm to 2.5 µm dva and then pass through a PTOF chamber. At the end of the PTOF chamber, particles encounter a 600 ∘C heater that vaporizes the non-refractory species. The corresponding vapours are ionized by electron impact with high energy of 70 eV, generating positive ions that are analysed with a ToF mass spectrometer.
All sampling inlets (PM2.5, PM10, and total suspended particulates) were positioned at the top of a measurement container (3.7 m above ground level, a.g.l.). Particle number (size >2.5 and >7 nm; CPC3776 and CPC 3022A, TSI Inc.), particle mass (PM2.5, PM10, and total suspended particulates; FIDAS, PALAS GmbH), black carbon (AE33-7 Aethalometer, Magee Scientific Co.), and the trace gases O3 (O341M, Environment SA), SO2 (AF22M, Environment SA), NO2 (AS32M, Environment SA), and CO2 (NGA2000, Rosemont Inc.) were measured. The meteorological parameters temperature, relative humidity, solar radiation, wind direction, and wind speed (WS700, Luft GmbH) were measured 10 m a.g.l. and complemented by meteorological data from a 200 m tower located at the KIT campus north, ∼2 km east of the measurement site (49∘5′43.0′′ N, 8∘25′46.0′′ E).
2.2 Mass spectrometer data analysis
Single-particle data were analysed by using the Igor LAAPTOF data analysis software (version 1.0.2, AeroMegt GmbH). The corresponding basic procedures (e.g. mass calibration and fuzzy c-means clustering) and particle mass quantification method have been described in detail in our previous studies (Shen et al., 2018, 2019a). The AMS data analysis was done with the standard software written for Igor, including SQUIRREL (version 1.60C) and PIKA (version 1.20C). To account for a particle bouncing effect, we applied a composition-dependent collection efficiency (CE, the product of net particle transmission and detection efficiency) to the entire AMS dataset (Canagaratna et al., 2007; Middlebrook et al., 2012). In order to investigate the potential sources of organic aerosols, we have done a positive matrix factorization (PMF) analysis for AMS high-resolution (HR) spectra of organic compounds by using the PMF Evaluation Tool (PET version 3.00D) (Ulbrich et al., 2009). Detailed protocols were reported by Ulbrich et al. (2009) and DeCarlo et al. (2010). In brief, the HR input matrices without isotopes were created using PIKA. A five-factor PMF solution with FPEAK = 0 was chosen according to the following criteria, including least residuals (unexplained data), (the quality-of-fit parameter Q is the sum of the squares of the scaled residuals; Qexp is the expected Q), and distinguishable features (e.g. spectra and diurnal patterns) of the components. It should be noted again that although fuzzy clustering and PMF analyses are commonly used methods in source apportionment, they cannot provide information on aerosol origin and the interaction between aerosol transport and transformation processes, which can be studied with aerosol transport models.
2.3 Regional transport model COSMO-ART
The regional transport model COSMO-ART is used in this study to simulate an episode with a high mass concentration of organics (up to ∼25 µg m−3 measured by AMS). Detailed model descriptions can be found in previous studies (Bangert et al., 2011; Knote et al., 2011; Stanelle et al., 2010; Vogel et al., 2009). Therefore, we will only give a brief review here. COSMO-ART is a fully online coupled model system, which uses the same spatial and temporal resolution for all scalars, such as temperature, gas, and aerosol particle concentrations. The meteorological module is based on the operational weather forecast model COSMO of the German Weather Service (Deutscher Wetterdienst, DWD). When atmospheric chemistry and aerosol dynamics are coupled to COSMO, it allows for the online calculation of the transport of reactive trace gases and aerosol particles as well as their interaction with the state of the atmosphere. Physical processes, e.g. nucleation, coagulation, condensation, and sedimentation, are included in the model. The aerosol particles are represented by five interactive lognormal modes representing particles consisting of internally mixed sulfate, ammonium, nitrate and organic compounds, pure soot, and internal mixtures of them all. The hourly biogenic emissions are calculated online according to land use data, the simulated temperatures, and radiative fluxes (Vogel et al., 1995). Anthropogenic emissions, including traffic emissions, large point sources, and area sources such as industrial and household areas, were precalculated by Johannes Bieser at the Helmholtz Zentrum Geesthacht (Backes et al., 2016; Bieser et al., 2011). In our study, the simulation domain is covered by a 350×330 grid with a horizontal resolution of 1×1 km2 and 50 vertical atmospheric layers (nonlinear increase up to 22 km a.g.l.). Most of the simulation results shown in this paper correspond to the lowest atmospheric level (10 m a.g.l.) and we indicate if results are from higher levels. The hourly emissions of SO2, NOx, CO, NH3, anthropogenic volatile organic compounds (VOCs), and primary organic aerosols (POA) were precalculated. As shown in Fig. S1 in the Supplement, VOCs, NOx, and POA are mainly emitted at a lower atmospheric level in urban areas, such as the cities of Karlsruhe, Stuttgart, Mannheim, and Strasburg, as well as the corresponding highways. SO2 hot spots typically correspond to the stack heights of the power plants emitting, such as the one in the western part of Karlsruhe.
In the first section (Sect. 3.1), we give an overview of the meteorological conditions, the trace gases, and particles measured during the whole measurement campaign and will then give an example for source identification using the transport model in Sect. 3.2. In the following two sections (Sect. 3.3 and 3.4), we discuss two selected episodes in more detail, which are dominated by aged sea salt particles and relatively high organic particle mass concentrations, respectively.
3.1 Overview of the field observations
Table 1 and Fig. S2 give an overview of meteorological conditions, trace gases, and particle concentrations for the entire measurement campaign. In summer 2016, the major wind direction was southwest (174±75)∘ and the average wind speed was (1.3±0.9) m s−1 at the measurement site in the upper Rhine valley. This wind speed allows trace gases and particles to be transported over a distance of 10 km within 2 h, e.g. from the city of Karlsruhe to the measurement site. During the measurement time sunrise and sunset were at around 06:30 and 20:30 CEST (Central European Summer Time), respectively. Temperature and relative humidity (RH) showed relatively stable anti-correlated diurnal patterns. Given the frequent clear nights, night-time temperature inversions occurred for 32 out of 37 nights during the entire measurement period (Fig. S3). Among the trace gases, CO2 and O3 showed clear diurnal patterns, with ozone peaking in the afternoon. NO2 concentrations were higher in the morning hours and in the late evenings and were generally anti-correlated with O3. NO2 and particle number showed spikes at similar times (more frequently during the daytime), mainly due to local emissions from nearby road traffic. The averaged particle number concentration of cm−3 for particles larger than 2.5 nm measured by CPC3776 in this study is comparable with that observed at the same site in previous tram-based measurements (Hagemann et al., 2014). SO2 concentrations showed peaks with low frequency (up to >10 ppb) but only when the wind was coming from the direction of the industrial area in the southwest. As shown in Fig. S2, these SO2 peaks correspond to higher particle number concentrations at around noontime when the wind speed is higher (∼1.7 m s−1) and vertical mixing intensified. This is in agreement with the downward mixing of stack emissions from industrial sources, which can be validated by model calculations using COSMO-ART (refer to Sect. 3.2).
Table 1Mean values (± SD) of characteristic parameters for the entire measurement period.
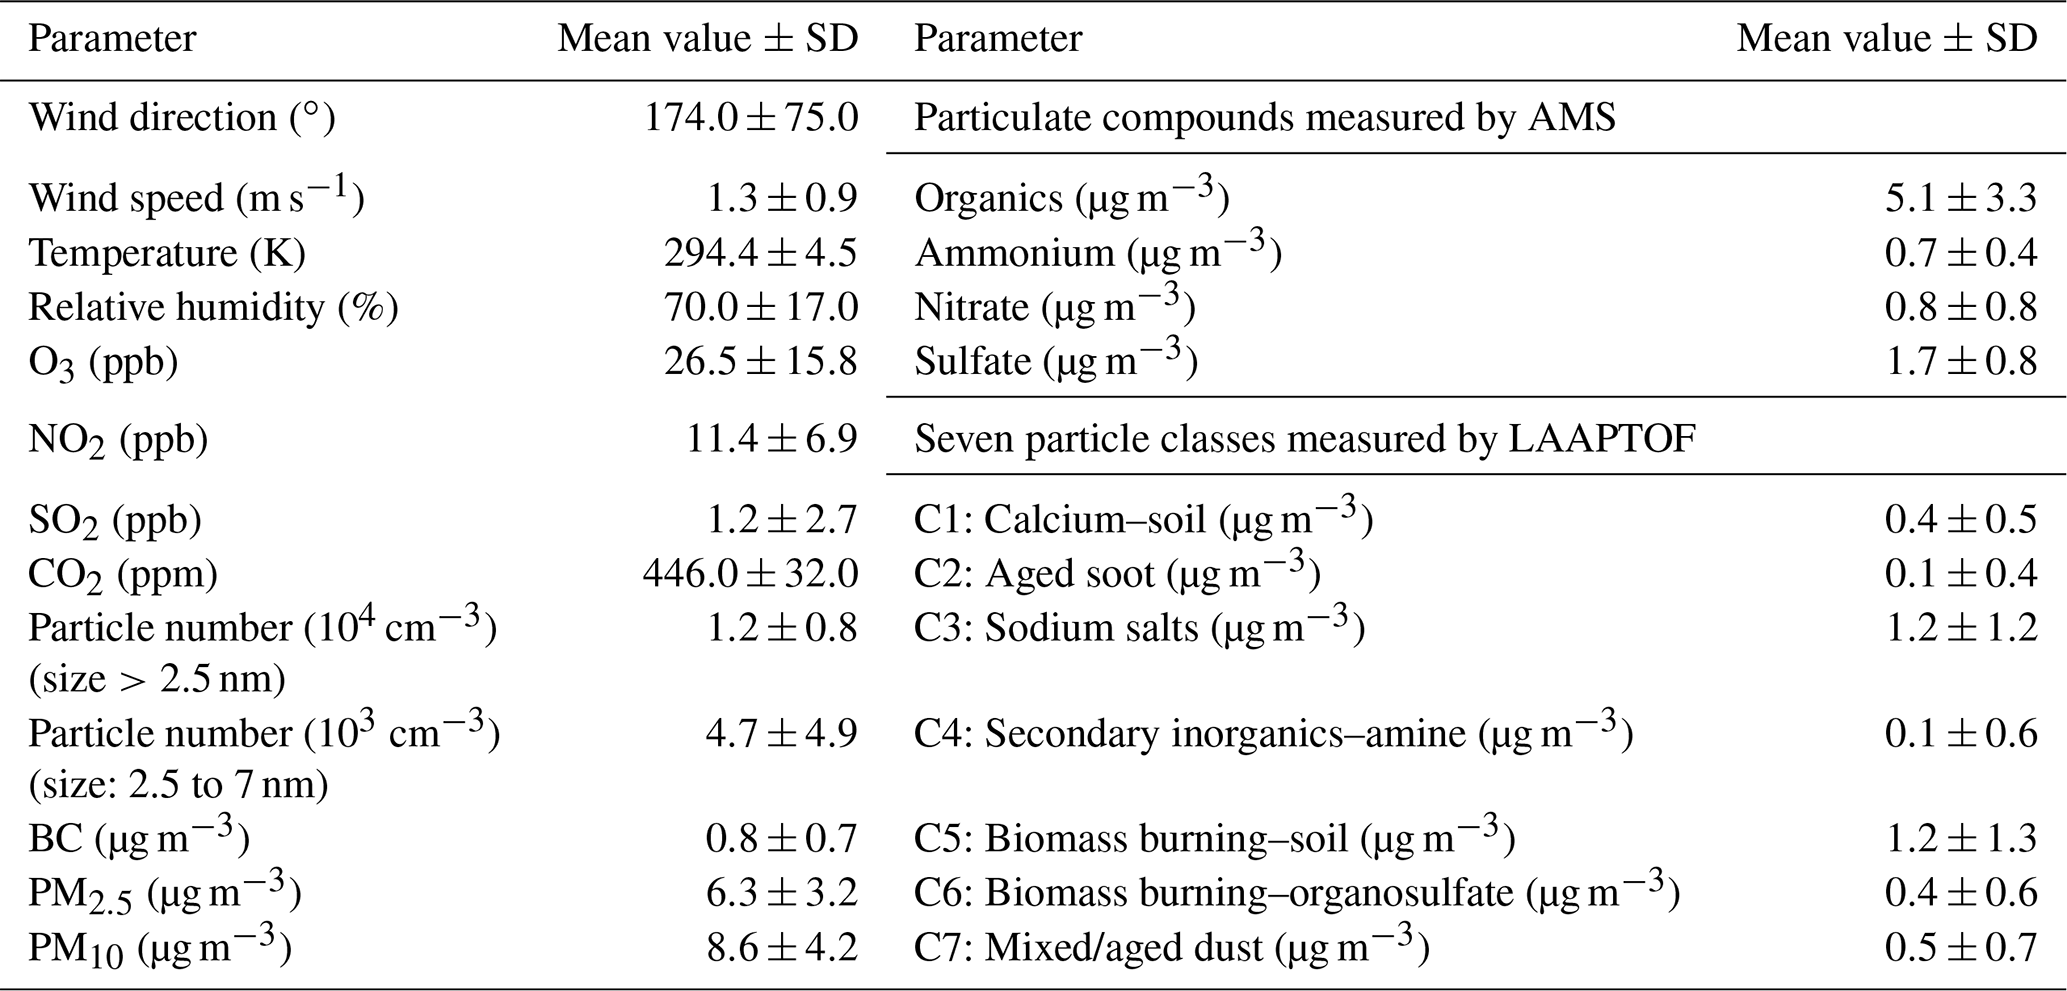
Note that the full names of the seven particle classes are as follows. C1: calcium-rich and soil-dust-like particles; C2: aged-soot-like particles; C3: sodium-salt-like particles; C4: secondary-inorganic-rich and amine-containing particles; C5: aged-biomass-burning and soil-dust-like particles; C6: aged-biomass-burning and organosulfate-containing particles; C7: mixed/aged and dust-like particles.
In the entire measurement period, the total organic compounds, sulfate, nitrate, and ammonium were analysed to contribute on average (58±12) %, (22±7) %, (10±1) %, and (9±3) % to the total non-refractory PM2.5 mass measured by AMS, respectively. Given the AMS-PMF results shown in Fig. S4, five OA factors (components) were determined with characteristic mass spectra, corresponding elemental ratios (O : C and H : C), and distinct temporal variations. These were (9±7) % HOA, (16±11) % SV-OOA, and (75±15) % LV-OOA, i.e. (16±15) % LV-OOA1, (37±17) % LV-OOA2, and (21±13) % LV-OOA3, contributing to the OA mass. The HOA and OOA are linked to primary and secondary organic aerosol (POA and SOA), respectively (Ulbrich et al., 2009). Thus, SOA dominated the OA mass at this measurement site. Further descriptions of PMF results can be found in the Supplement (Fig. S4) and more discussions are given in Sect. 3.4.2, especially regarding the organic compounds.
In a previous publication (Shen et al., 2019a), we could identify seven major particle classes at the measurement site among single particles with sizes between 200 nm and 2.5 µm dva. In brief, class 1 is identified as calcium-rich and soil-dust-like particles (calcium–soil) with marker peaks at m∕z 40 Ca+, 56 CaO+, 57 CaOH+, 75 CaCl+, 96 Ca2O+, and 112 . This particle class shows a good correlation (Pearson's correlation coefficient γ≥0.6) with the laboratory-derived reference spectra of soil dust particles. Class 2 is identified as aged-soot-like particles (aged soot) with characteristic C patterns and is mixed with sulfate and nitrate. Class 3 is identified as sodium-salt-like particles (sodium salts) with marker peaks at m∕z 23 Na+, 81 ∕ 83 Na2Cl+, 139 ∕ 141 , 165 , 35 ∕ 37 Cl−, 93 ∕ 95 , 115 , 131 , and 147 . Class 4 includes secondary-inorganic-rich and amine-containing particles (secondary inorganic–amine) with prominent ammonium, nitrate and sulfate markers, and amine marker peaks at m∕z 58 , 59 (CH3)3N+, 86 , 88 , and 118 . Class 5, aged-biomass-burning and soil-dust-like particles (biomass burning–soil), has aged-biomass-burning marker peaks at m∕z 39 K+, 213 , 46 , 62 , and 97 , as well as peaks related to aromatic compounds (50 , 63 , 77 , 85 C7H+, 91 , 95 , 104 , 115 ). Furthermore, class 5 shows a strong correlation with reference spectra of soil dust particles. The representative spectra of class 6, aged-biomass-burning and organosulfate-containing particles (biomass burning–organosulfate), also features aged-biomass-burning particles and has organosulfate marker peaks at m∕z 141 , 155 , and 215 . Class 7 particles contain all the marker peaks from the other six classes and show a good correlation with the reference spectra of mineral and soil dust particles; they are consequently labelled as “mixed/aged dust” (short for mixed/aged and dust-like particles). These particle types were not always present in similar fractions but showed distinct periods with one or two types dominating the particle mass (Shen et al., 2019a). Here, we will mainly discuss two particle classes that dominated the total particle mass, i.e. sodium salts and biomass burning–soil particles, contributing on average (36±27) % and (30±18) % to the PM2.5 mass measured by the LAAPTOF, respectively. We will also discuss one characteristic particle class, i.e. secondary inorganic–amine particles, which showed relatively intensive and distinct peaks three times during this campaign (Fig. S2) as well as several weaker peaks.
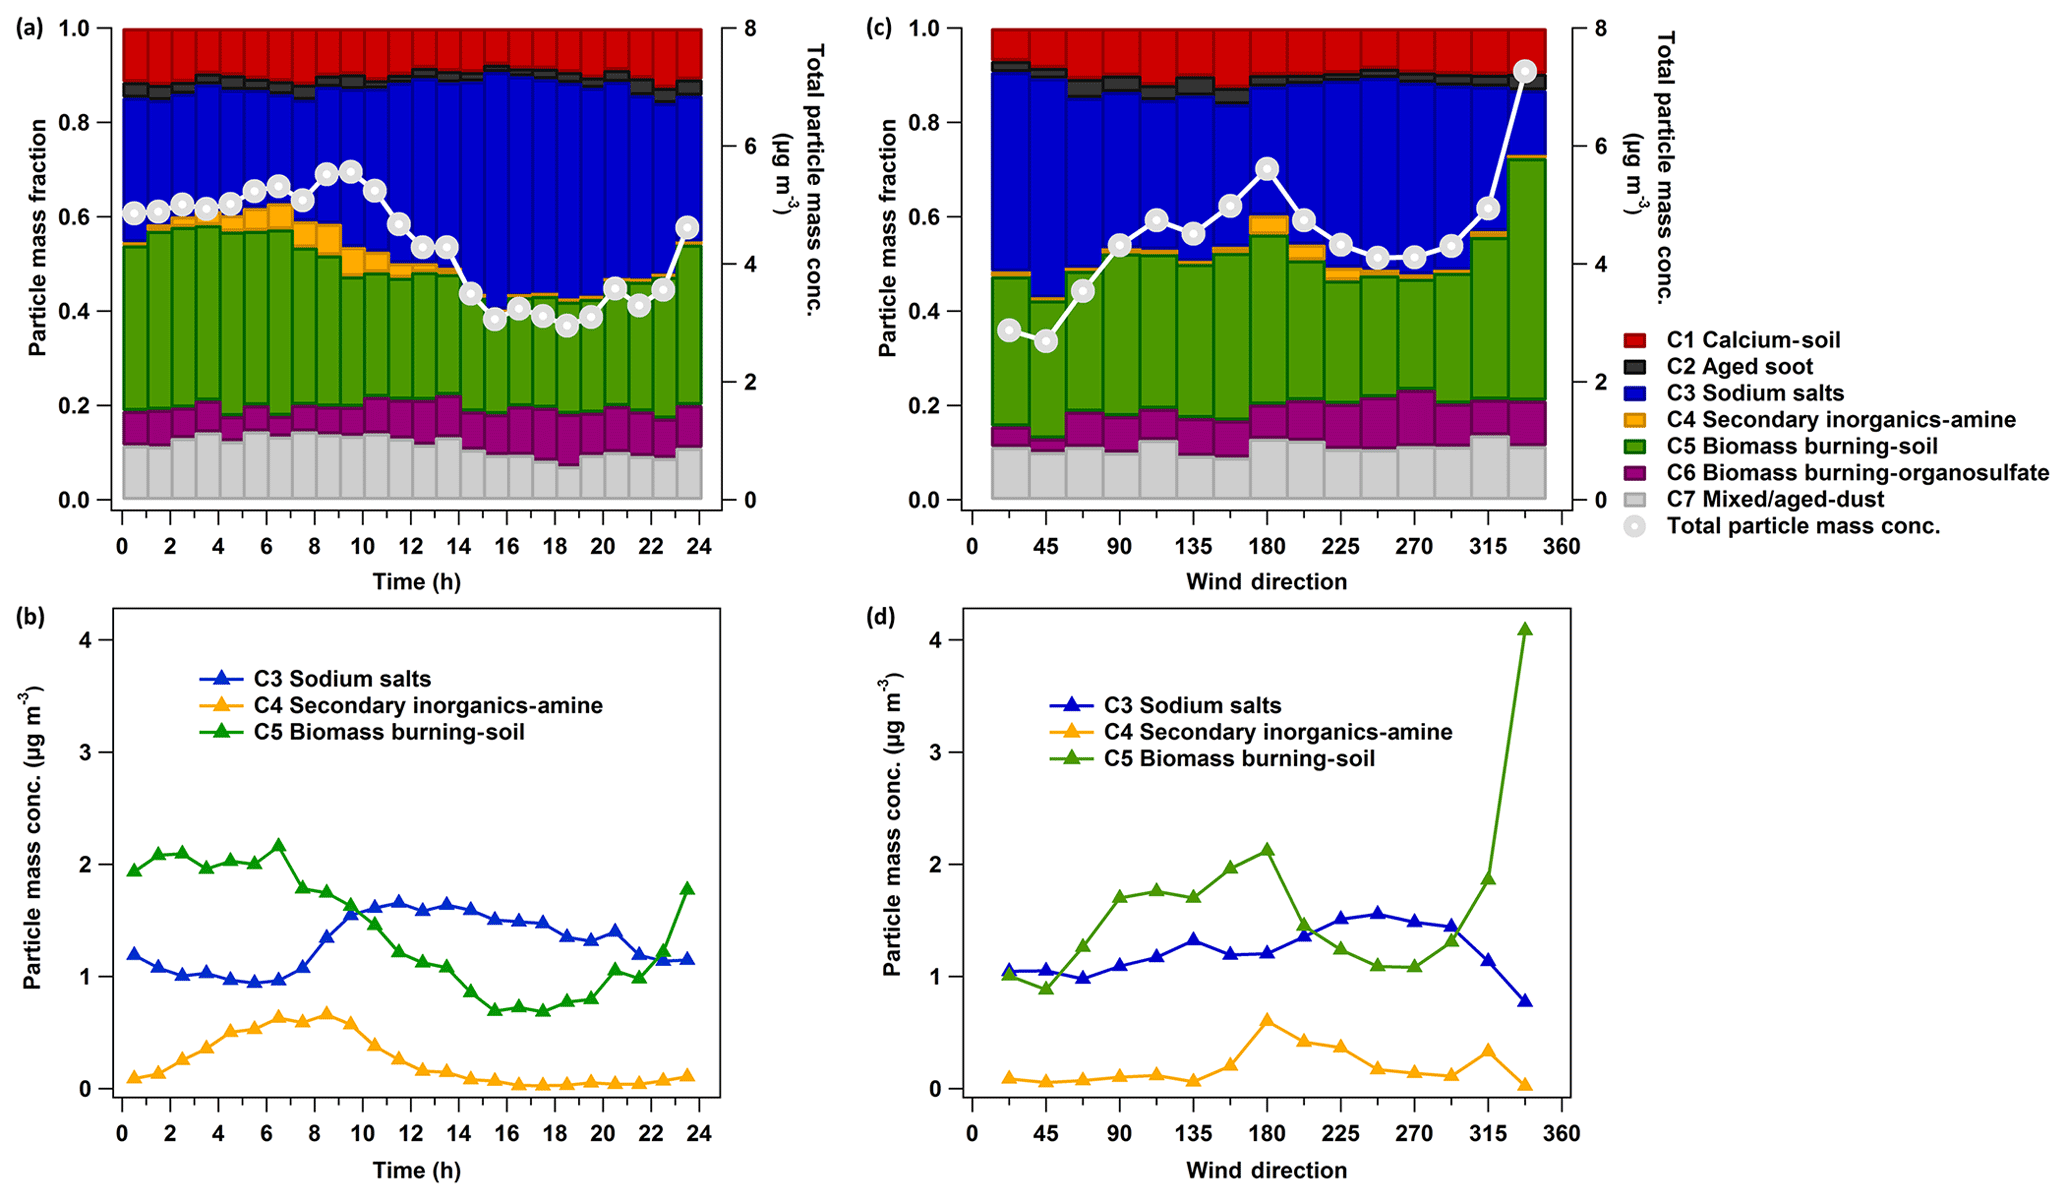
Figure 2Diurnal pattern (a, b) and wind-direction-resolved particle class masses (c, d) measured by LAAPTOF. The data are averaged over the entire campaign. In total 4842 time points of 10 min averaged data were analysed for these plots. The total particle mass concentration for each hour of the day is on average 4.3 (±2.6, 1σ) µg m−3 and for each wind direction is on average 4.5 (±2.9) µg m−3. For the dominating classes the average mass concentrations are 1.3 (±1.1) and 1.2 (±1.0) µg m−3 for class 3, 0.2 (±0.5) and 0.2 (±0.4) µg m−3 for class 4, and 1.4 (±1.0) and 1.6 (±1.5) µg m−3 for class 5 in panels (b) and (d). It is worthy to note that particle mass quantification is one of the most challenging issues in single-particle mass spectrometry (Shen et al., 2019a, and the references therein). There are several assumptions mainly regarding particle shape and density in our particle mass quantification method, leading to potential uncertainties of up to ∼300 %. Despite such large uncertainty, the estimated total particle mass has good correlation with the total mass measured by the AMS, covering ∼85 % of the measurement time (Shen et al., 2019a).
As shown in Fig. 2a, total particle mass concentrations have clear diurnal patterns (the data are averaged over the entire campaign), showing higher night-time values and a peak during the morning rush hour (∼ 09:00 local time). Higher particle mass values mainly correspond to southern wind directions, with one exception of extremely high masses associated with northwesterly winds (Fig. 2c). Specifically, sodium-salt-containing particles have higher fractions during daytime and correspond to southwesterly wind directions (Fig. 2b). Such wind was observed mainly during daytime and with higher wind speeds than at night. Biomass burning–soil particles enrich during night-time and mainly correspond to southeast wind (Fig. 2d). Secondary inorganic–amine particles typically rise in the morning and correspond to south and southwest wind directions (Fig. 2). When we compare weekdays (Monday to Friday) and weekends (Saturday and Sunday) in Fig. S5, the sodium salt particles were always correlated with southwest wind directions. Obvious differences can be found for secondary inorganic–amine and biomass burning–soil. Secondary inorganic–amine-type particles were mainly advected by south and southwest wind during weekdays. However, they were much less abundant during weekends and did not show a clear relationship with wind directions (only a small peak for northwest). For biomass burning–soil particles the observations are a bit more complex.
The biomass burning–soil particles measured during weekdays were correlated with south and southwest wind as well, indicating potential sources from the city of Karlsruhe and its industrial area. Please note that the representative spectra of these particles show aromatic ion peaks, which may arise from aromatic compounds such as toluene and xylene due to motor vehicle emissions. This type of particle also contains some metals such as barium and lead that are related to coal combustion from industry (Hudson et al., 2004; Xu et al., 2018). These features correspond to urban and industrial sources. During the weekends, biomass burning–soil particles had higher mass concentrations than during weekdays and were correlated with wind directions from the east, southeast, and northwest, where there are mainly forests and agricultural areas. Therefore, we can infer that there were various sources for biomass burning–soil particles and these sources differed between weekdays and weekends. This could be e.g. barbecue fires during weekends, while the weekday source is likely to be associated with that for secondary inorganic–amine particles.
In order to refine this type of particle, we compared them with black carbon particles measured by an Aethalometer (AE33-7). The equivalent black carbon concentration was calculated by the mass absorption cross-sectional value of 11.7 m2 g−1 (Herich et al., 2011). They seem to show a similar trend in the time series with a triplet of peaks from 25 to 28 August (refer to Figs. S2 and S6). We found that biomass burning–soil and black carbon concentrations are well correlated only for the weekends, with Pearson's correlation coefficients γ≥0.6 (Fig. S6b), and poorly correlated for weekdays (γ<0.3). This points to different major sources for weekdays and weekends. In addition, the black carbon instrument measuring the light absorption at different wavelengths (λ) can be used to determine the absorption Ångström exponent (α) (Drinovec et al., 2015). For the entire campaign, the average α was 0.96±0.24, calculated by using a pair of wavelengths and their corresponding mass absorption cross sections (MAC = 11.7 and 23.6 m2 g−1 for λ=950 and 470 nm, respectively; Herich et al., 2011). Herich et al. (2011) and Zotter et al. (2017) have assigned to BC from road traffic emissions, while the α values for wood-burning BC were typically higher at ∼1.68 (Zotter et al., 2017). Our measurements indicate that traffic was the dominating source of BC. Considering the good correlation between BC and biomass burning–soil particles during the weekend, we could infer the corresponding traffic emissions that contributed to biomass burning–soil particles. All observations support the conclusion that this particle class has significant anthropogenic sources, which may vary between weekends and weekdays. It should be noted that there were no significant biomass burning organic aerosols (BBOAs) identified by AMS-PMF for the entire measurement period. The marker f60 (the mass fraction of m∕z 60 to the total organics) of BBOA is very close to the background fraction of 0.003 (Crippa et al., 2014; Cubison et al., 2011). In addition to biomass burning, other potential sources for potassium- and sulfate-rich particles detected by LAAPTOF must also be taken into consideration, such as coal combustion (Xu et al., 2018). Therefore, further analysis is required to identify the different sources contributing to this particle class.

Figure 3Time series of particulate organic mass measured by the AMS (AMS org in panel a), the particle acidity indicator (the lower the value the more acidic, b), and the particle class number classified by LAAPTOF (colour code, a). The seven classes are as follows. Class 1: calcium–soil; class 2: aged soot; class 3: sodium salts; class 4: secondary inorganics–amine; class 5: biomass burning–soil; class 6: biomass burning organosulfate; and class 7: mixed/aged dust. The first (blue) and second (green) shaded areas mark the sodium-chloride-rich and organic-rich episodes.
As mentioned before, the dominating particle classes varied for different time periods (Shen et al., 2019a). In the following we focus on an episode with particles rich in sodium salts to find out if sea salt particles can significantly influence the aerosol particle composition at this central European location about 800 km inland. Furthermore, we discuss another episode with relatively high organic mass concentrations to find out how these mass loads could form and exist for a relatively long time period. Both episodes are easily recognized from the time series of particles measured by LAAPTOF and the organic compounds measured by AMS (Figs. S2 and 3; see also Fig. 4 in Shen et al., 2019a), as well as the time series of OOA, in particular for SV-OOA, LV-OOA1, and LV-OOA2 (Fig. S4). Apart from the difference of dominating particle classes and particulate organics, the particle acidity indicator value, organonitrate fraction, and organic carbon oxidation state, as well as meteorological conditions were quite different between these two episodes. For particle acidity, the molar ratio of measured to predicted from AMS measurement is commonly used as an indicator (Zhang et al., 2007). The predicted value is the mass concentration required to fully neutralize sulfate, nitrate, and chloride measured by AMS. A lower ratio value represents higher acidity under certain conditions, i.e. inorganic species are dominating the particle mass and crustal elements have relatively low concentrations (Zhang et al., 2007). It should be noted that organic acids and crustal elements such as sodium can bias the results (Hennigan et al., 2015, and the references therein). Despite the large uncertainty for indicating acidity, we can still use such ratios to indicate special events, e.g. sodium-nitrate-rich particles will provide nitrate, leading to lower values. As shown in Fig. 3, this ratio reaches the lowest value during the sodium-salt-rich episode, while the value in the organic-rich episode is at the average level. If we assume the organic acids only have a minor influence on the particle acidity, the anti-correlation between the acidity indicator value and organic concentrations may be related to acid-catalysed organic particle formation. For the fraction of organonitrates, the AMS-derived ratio of is commonly used as an indicator (Farmer et al., 2010; Kiendler-Scharr et al., 2016). In the episode rich in sodium salts, particles contain the highest organonitrate fraction, while the particles in the organic-rich episode contain the lowest fraction (refer to Fig. S7). It should be noted that NaNO3 can also result in higher ratios (5 to 7; Allan et al., 2004) than NH4NO3 (2.3 in our calibration). However, the values here are much higher (see Fig. S7) and thus we can expect a major contribution by organonitrates. Higher fractions of organonitrates suggest a stronger influence of anthropogenic emissions on the sodium-rich aerosol. The averaged carbon oxidation state () of the organic compounds is a robust metric of its degree of oxidation or processing (Canagaratna et al., 2015; Kroll et al., 2011). It turns out that the organics were more oxidized in the organic-rich episode, with relatively higher value and less variability (), than that for the entire campaign () (refer to Fig. S7 and Table 2). In addition, the major wind with higher speeds was from the southwest in the episode rich in sodium salt particles, and we will show in Sect. 3.3 that this is related to the long-range transport of sea salt particles. For the organic-rich episode, the wind speeds were lower most of the time. The different features of these two episodes are summarized in Table 2. We will discuss the episodes in more detail in Sect. 3.3 and 3.4, but we first demonstrate the usefulness of the transport model to identify an industrial point source.
Table 2Features and mean values (± SD) of characteristic parameters for the two selected episodes.

3.2 Identification of an industrial point source
As shown in Fig. 4, we have modelled O3, NO2, SO2, and particle number for the organic-rich episode with COSMO-ART. Model simulations show comparable results and/or trends with field observations. For SO2, there is a modelled peak at 10:00 CEST on 26 August. As mentioned above, in the upwind direction of our measurement site is a coal-fired power plant, from which SO2 is emitted from a stack at 230 m a.g.l. Therefore, we compared SO2 concentrations in an area including the power plant and our measurement site (refer to Fig. 5a1 and a2), as well as time series of their vertical profile at the measurement site (Fig. 5b). The model results show that SO2 emissions started at 02:00 CEST from the stack of the power plant, continuously transported by southwest wind (from 06:00 CEST; not shown here). Around noon, the SO2 was transported downward due to enhanced vertical mixing. Similar to SO2, we found corresponding vertical transport of NOx and primary particles (refer to Fig. 5c and d), as well as secondary inorganic particles, which will be discussed in Sect. 3.3.3. In addition to the power plant emissions, particle emissions from the Karlsruhe refinery (e.g. around 08:00 CEST at 122 m a.g.l.) and downtown Karlsruhe (at 10 m a.g.l.) were observed in the model results, which are visualized via videos of the evolution of particle number at these two altitudes (refer to the Video Supplement). Given these findings, we have verified industrial contributions to the particles measured at this rural site. However, the particle numbers calculated by the model are 10 times lower than the measured values. In this context, it should be noted that the observations relate to particles larger than 2.5 and 7 nm. The modelled particles include Aitken- and accumulation-mode particles with median diameters at around 30–80 and 300–400 nm, respectively. The model does not represent the ultrafine particles to their full extent, especially e.g. the contribution of organic compounds or ammonia to nucleation.
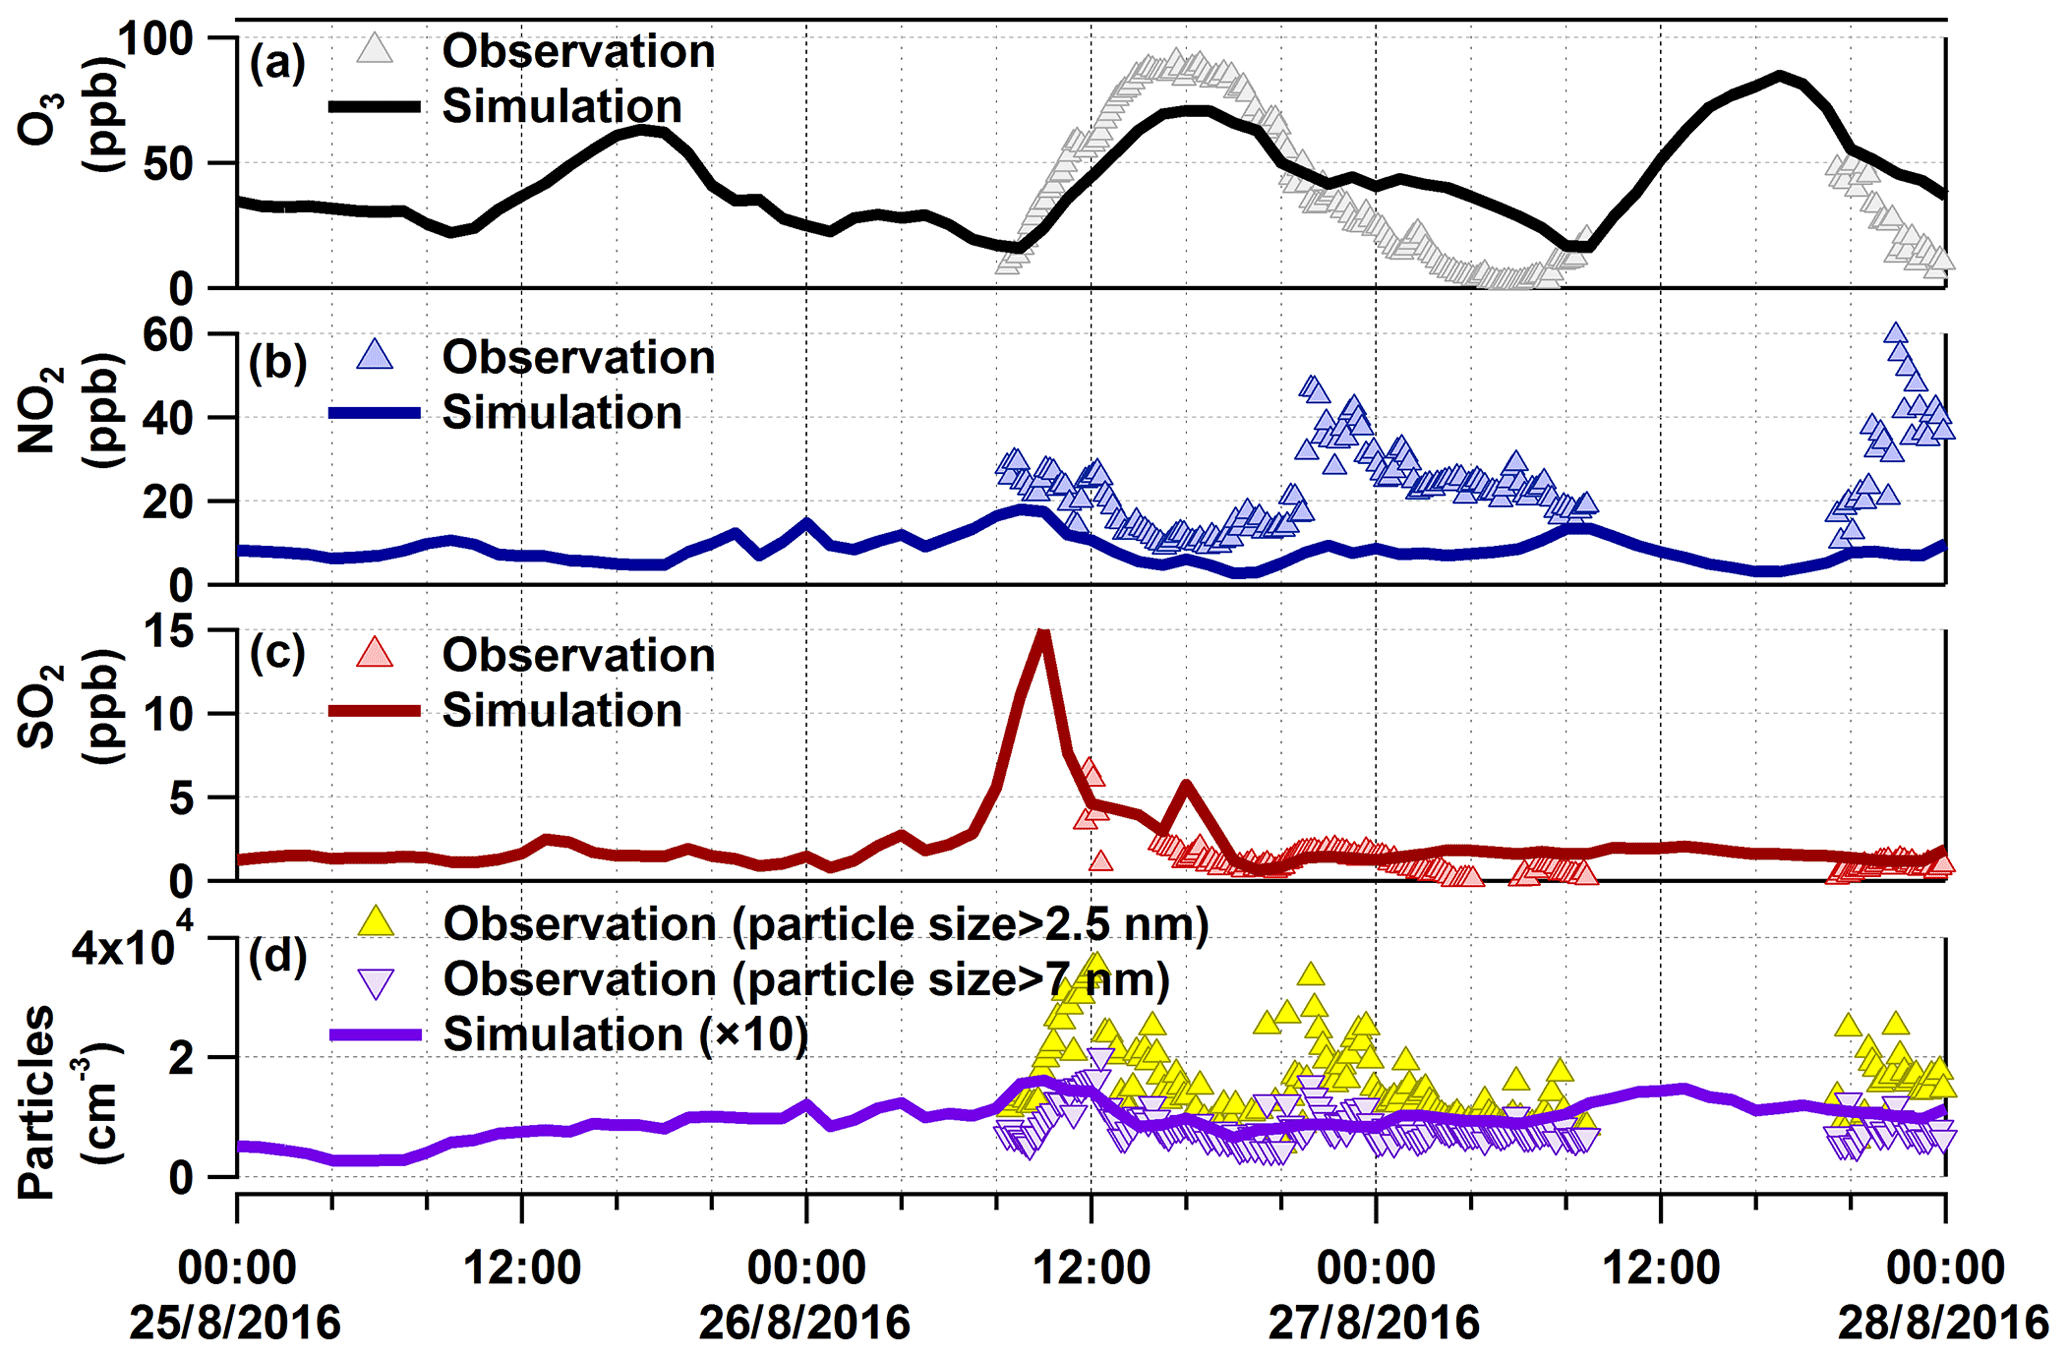
Figure 4Comparison between observations and model results for O3, NO2, SO2, and particle number in the organic-rich episode. The modelled particles do not represent the ultrafine particles to their full extent, especially for the particles in the nucleation mode.
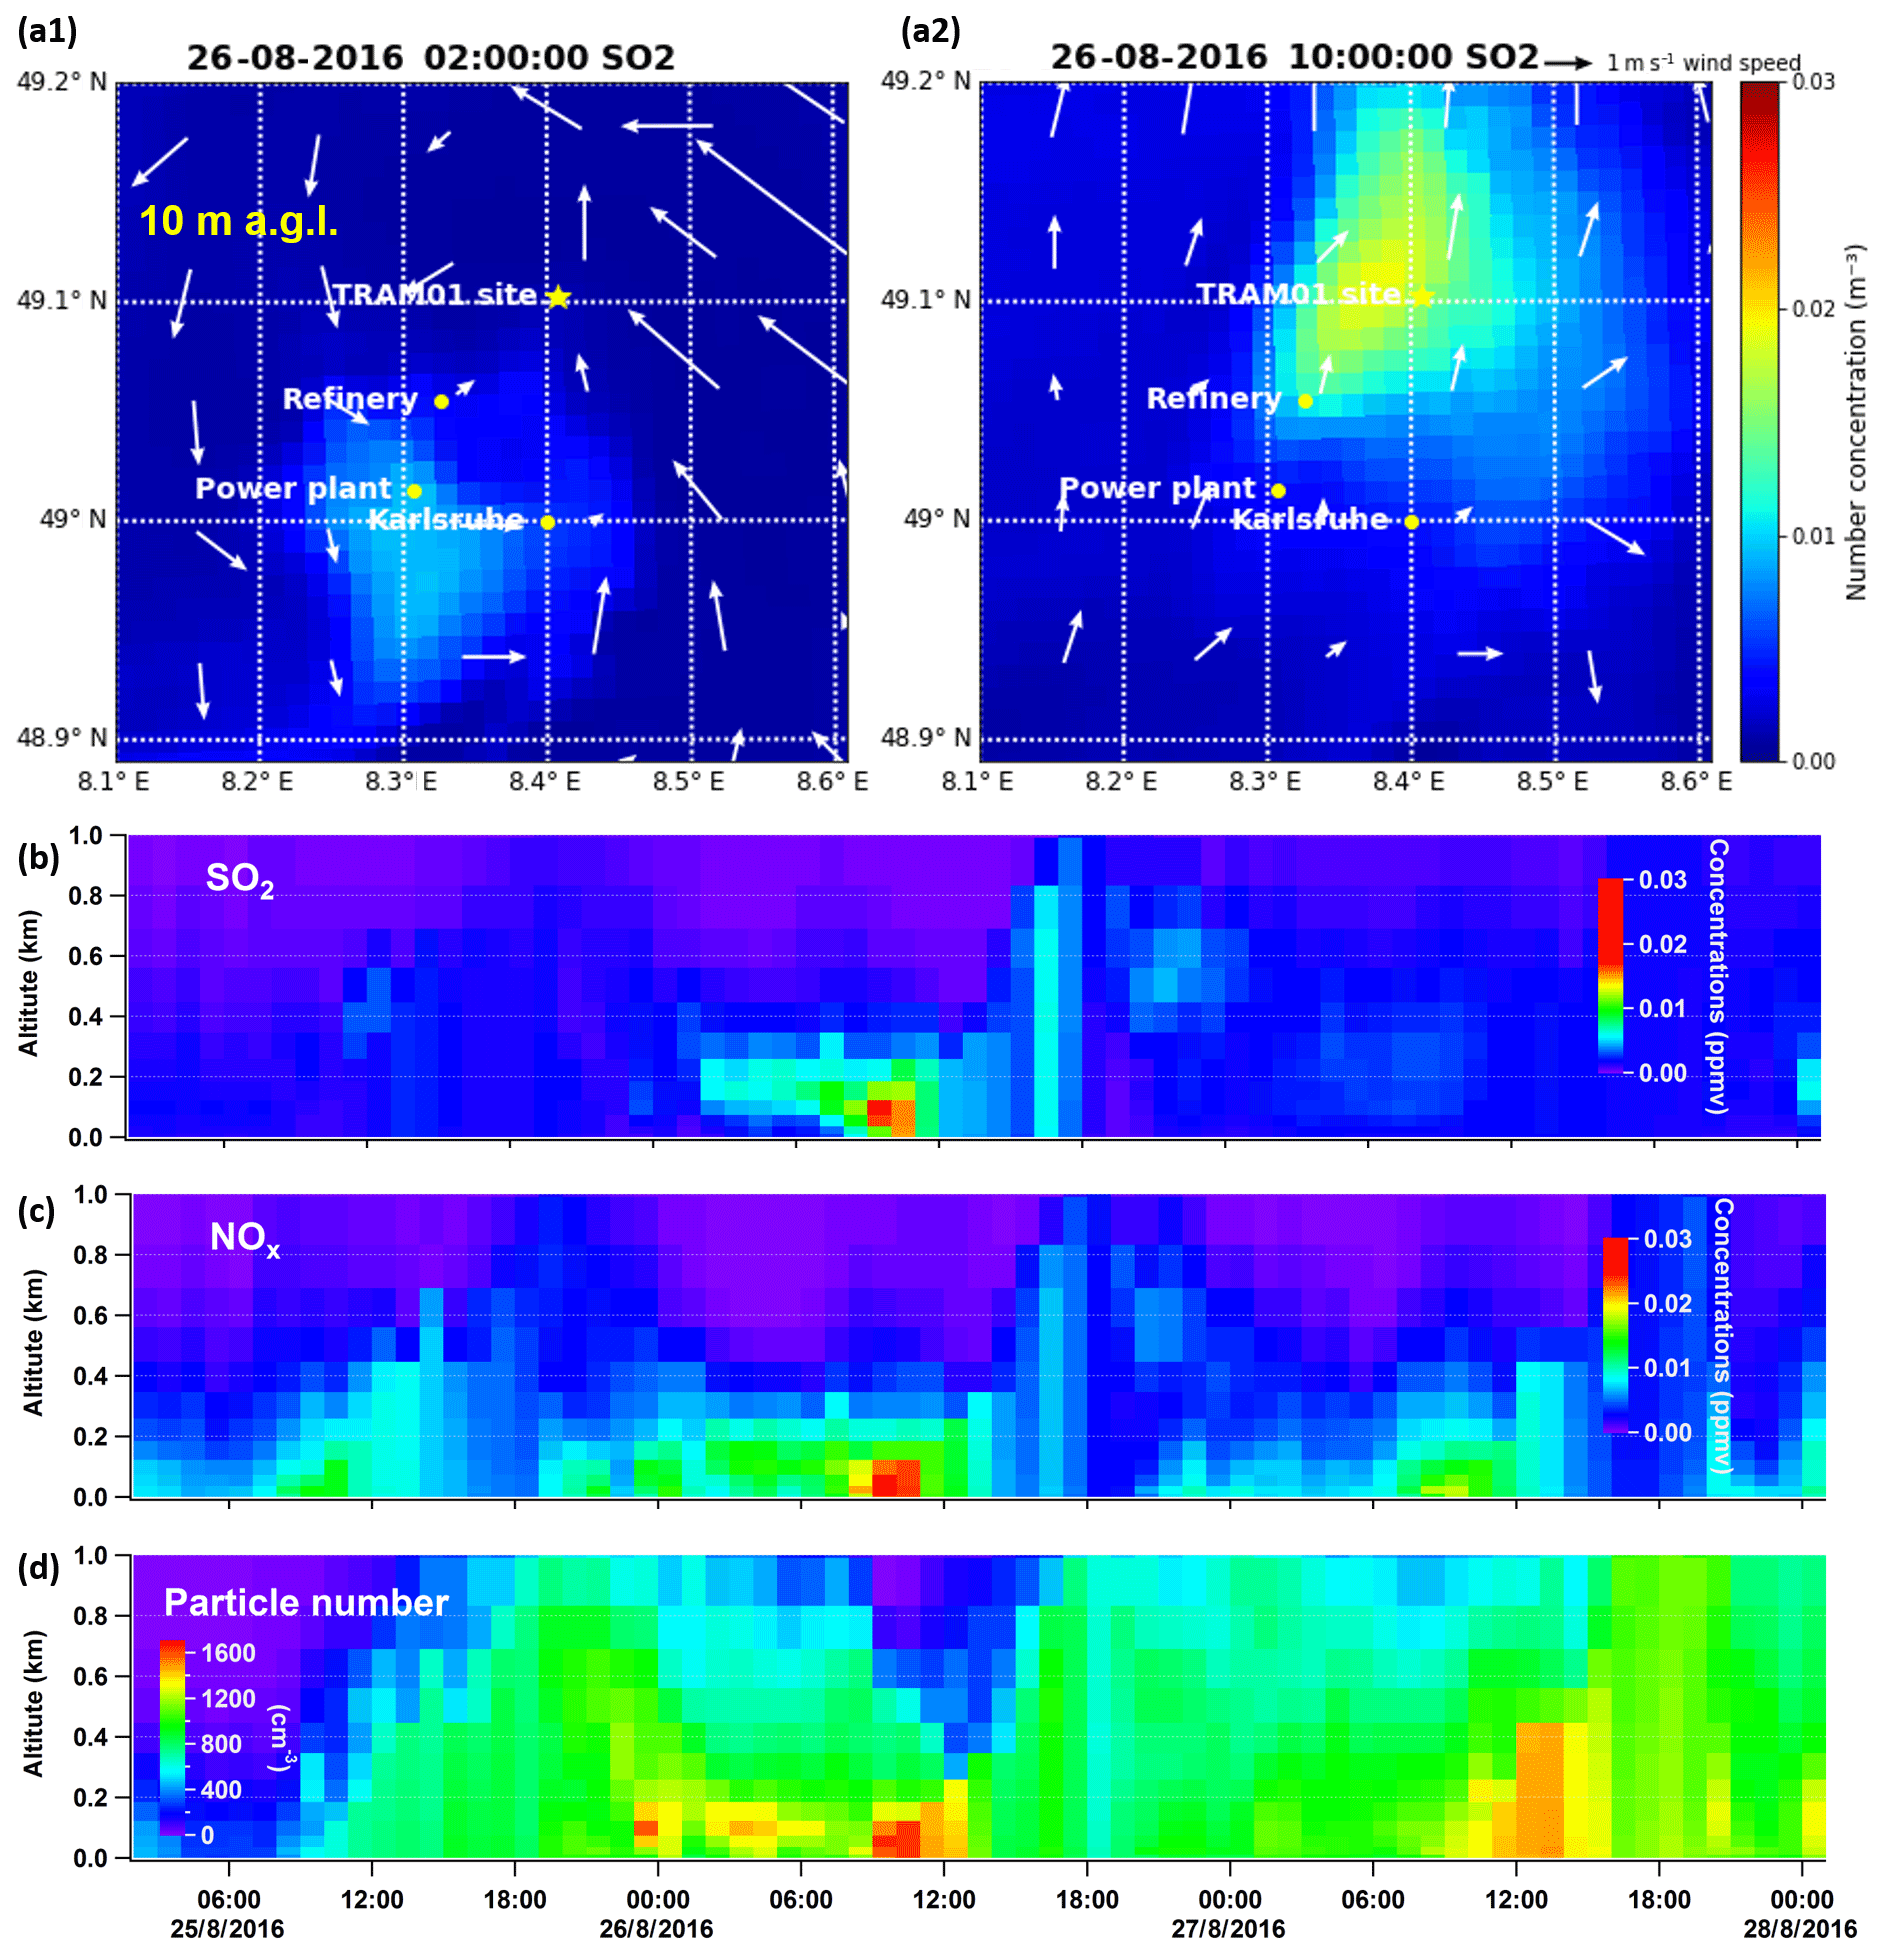
Figure 5Modelled SO2 concentrations at 02:00 CEST (a1) and 10:00 CEST (a2) on 26 August at 10 m a.g.l. Panels (b) to (d) are time series of vertical profiles above the measurement site for simulated SO2, NOx, and total particle number.
3.3 Aged sea salt in central Europe
Sodium salt particles accounted on average for (35.6±26.7) % of the particle mass measured by LAAPTOF during the whole campaign, and they dominated several time periods (refer to Fig. S2). However, not all the peak events were the same. We chose a unique episode when sodium chloride signatures, e.g. m∕z 81 Na2Cl+, showed the strongest signal, as plotted in Fig. 6a. In this episode, the sodium salts accounted for (70±24) % of the total mass of the single particles. To study the origin of these particles, we used the Hybrid Single-Particle Lagrangian Integrated Trajectory (HYSPLIT; Stein et al., 2015) on the READY website (http://www.ready.noaa.gov, last access: 17 October 2019; Rolph et al., 2017) for back-trajectory analysis. The corresponding results suggest that these particles came from the Atlantic Ocean, which is more than 800 km west of our measurement site (refer to Fig. S8a). Therefore, we can constrain the type of sodium salt particles as sea salts with an age of about 1.5 to 3 d.

Figure 6(a) Time series of sodium chloride and nitrate signatures in seven particle classes. The y axis is the normalized ion intensity (each ion peak intensity is normalized to the sum of all ion signals; positive and negative ions were analysed separately). The seven classes are as follows. Class 1: calcium–soil; class 2: aged soot; class 3: sodium salts; class 4: secondary inorganics–amine; class 5: biomass burning–soil; class 6: biomass burning organosulfate; and class 7: mixed/aged dust. Obvious sodium chloride and nitrate signatures are mainly found in class 3 labelled in blue. (b) Size distributions of NaCl-rich (young sea salt) and NaNO3-rich (aged sea salt) particles. Gaussian fit NaCl nm; NaNO3 1697(±946) nm. (c) Spectra difference between aged and young sea salt particles (aged – young). The blue band marks the sodium-chloride-rich episode.
In this episode, sea salt particles retained strong chloride signatures in spite of the long-range transport due to relatively high wind speeds (e.g. the average wind speed was ∼6 m s−1 from the ocean to our measurement site at noontime on 21 and 22 August based on a 72 h back-trajectory analysis). Therefore, we interpret them as relatively fresh sea salt, which is the first subclass of sodium salt particles identified with the fuzzy clustering analysis of the single-particle mass spectra. As shown in Fig. 6a, there is an obvious decrease in m∕z 81 Na2Cl+ at the end of this episode, while the sodium nitrate signature at m∕z 108 increases. Such trends can also be found in similar but much less prominent sodium-chloride-rich episodes (see the red guiding arrows in Fig. 6a). This indicates the ageing process of sea salt particles, namely heterogeneous replacement of chloride by nitrate on sea salt particles (Gard et al., 1998). We assigned the second subclass of sodium salts to more aged sea salt particles, which are bigger than the relatively young sea salt (Fig. 6b). A 72 h back-trajectory analysis suggests that these particles came from the Atlantic Ocean and were carried with southwesterly wind of relatively lower speed (∼3.5 m s−1) to reach our measurement site on 23 August, thus they spent more time (∼3 d) over the continent and are more aged. The representative spectra of sodium salt particles and the averaged spectra of their subclasses can be found in Fig. S9. The signal difference between aged and young sea salt spectra (aged – young) is shown in Fig. 6c, highlighting their signatures. Similar relationships as for m∕z 81 Na2Cl+ and 108 can also be found for the other signature peaks (refer to Fig. S10). It is worth noting that there are also nitrate-related peaks in young sea salt, such as m∕z 104 , verifying that these young sea salts were not fresh. In addition, m∕z 92 and 131 increase earlier than 108 and 147 . We can therefore infer the ageing degree from a series of signature peaks in LAAPTOF spectra: and and 147 (from relatively fresh to more aged, corresponding to chloride to nitrite to nitrate salts). However, this requires further systematic studies to be validated.
For sodium salt particles, a weak but characteristic peak at m∕z 129 is likely to be an organonitrate signature (Shen et al., 2019a). As shown in Fig. S10, m∕z 129 has a similar trend as m∕z 131 and it is more pronounced in the LAAPTOF spectra of aged sea salt. In the sodium-chloride-rich episode, in general m∕z 129 has a similar trend as organonitrate mass concentrations estimated by AMS results and the results of a molecular analysis using FIGAERO-HR-ToF-CIMS (a filter inlet for gases and aerosols coupled to a high-resolution time-of-flight chemical ionization mass spectrometer) in a companion study by Huang et al. (2019). The method for organonitrate estimation can be found in Farmer et al. (2010) and the parameters used here are the same as those used by Huang et al. (2019). We have briefly described this method in the Supplement after the caption for Fig. S10. In addition, our simulation chamber study has shown that this m∕z 129 arises from the recombination of inorganic nitrate and organics due to the laser desorption and ionization (LDI) matrix effect in single-particle MS (Murphy, 2007; Reilly et al., 2000; Reinard and Johnston, 2008; Zenobi and Knochenmuss, 1998). It is even stronger when it arises from organonitrates formed under NOx-rich conditions (refer to Fig. S11). Taken together, we can conclude that the m∕z 129 signal mainly results from organonitrates, but we still cannot rule out the LDI effect. Furthermore, our simulation chamber studies also revealed that m∕z 129 in LAAPTOF spectra could be a signature for anthropogenic sources (refer to Fig. S11 and the corresponding detailed description in the Supplement). Therefore, m∕z 129 on sea salt particles indicates interactions between natural sea salt and anthropogenic emissions. It is worth noting that another weak but characteristic peak was observed at m∕z 165 . This signature peak for sea salt sulfate can be found with a stronger signal in young sea salt than in aged sea salt (Gard et al., 1998).
Apart from that, in high-resolution AMS spectra we have observed the peak at 78.99 , which is the marker for methanesulfonic acid (MSA) from marine or coastal areas (Huang et al., 2015), although other sources cannot be excluded (Daellenbach et al., 2017). Based on the method developed by Huang et al. (2015), we have also estimated the MSA fraction (fMSA, signal fraction of MSA to total organics and sulfate) and mass concentrations for the entire campaign (refer to Fig. S12). It turns out that during the sodium-chloride-rich episode, the fMSA is enhanced compared to the other low-sodium-salt time period, such as the organic-rich episode. This also supports the fact that sodium salt particles measured by the LAAPTOF had a sea salt origin.
3.4 Origin of the aerosol particles during the organic-rich episode
At the end of the measurement period, we observed three subsequent organic peaks (see Figs. 3, S2, and S7): one peak on Friday 26 August during daytime and two peaks during the following two nights. Organics measured in this episode exhibited the highest mass concentrations of (12.9±3.9) µg m−3, which accounted for (77±6) % of the total non-refractory particle mass and is almost 3 times more than organic masses measured in other periods of the entire AMS measurement period. Please note that some secondary inorganic components were also measured in this episode, showing some peaks at similar times as the high organic peaks. As for the sodium-chloride-rich episode, we have also done a HYSPLIT back-trajectory analysis for the organic-rich episode. Figure S8b shows these results: the air mass was coming from the continent during this episode.
In order to better interpret the measurements and to understand the impact of transport processes for the particles measured in the organic-rich episode, we have done COSMO-ART simulations covering the time period from 25 to 28 August 2016. Figure 7 shows the particulate organic compounds, the secondary inorganics (ammonium, nitrate, and sulfate) measured by AMS, and the result calculated using COSMO-ART (panels d to g). The corresponding meteorological conditions measured are shown in Fig. 7a to c. In general, the trends and also the amplitudes of the model results compare quite well with the observations. In the following, we will combine field observation and transport model simulation results to address these questions: (1) were the organic-rich aerosols due to local formation, regional transport, or vertical mixing? (2) Were all three organic peaks due to the same factors? (3) Did the secondary inorganics originate from the same sources as the organics? We will start the discussion with the inorganics; we will then go to the organics and end with a typical particle type in this episode.
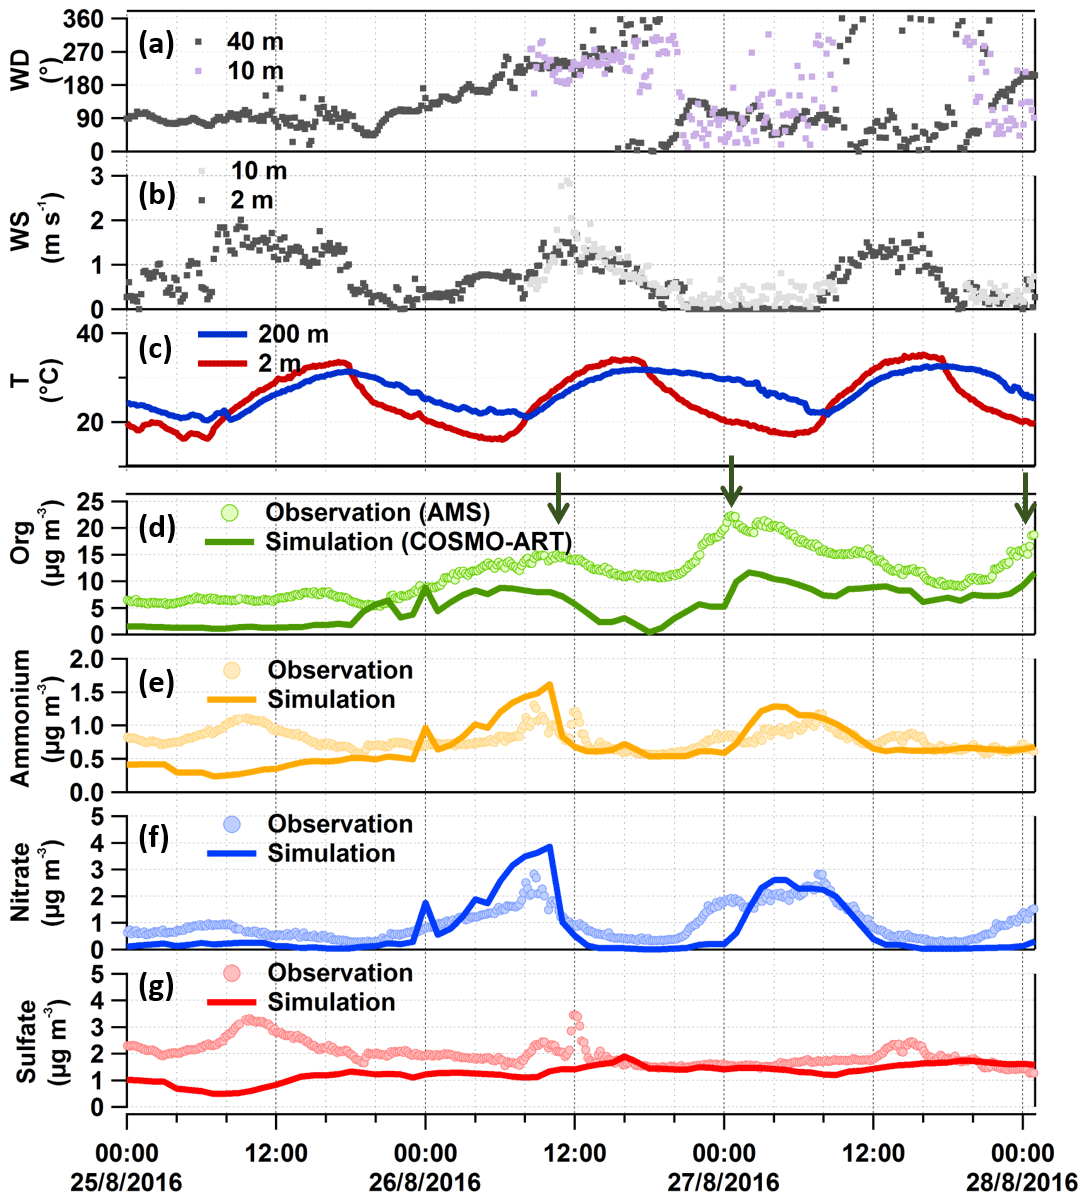
Figure 7Comparison between observations and model simulations for the organic-rich episode. Panels (a) and (b) are wind conditions measured 10 m a.g.l. at our measurement site (purple and light grey dots for wind direction and speed, respectively) and complementary KIT tower data (dark grey dots). Panel (c) shows the temperature data from the KIT tower. Panels (d) to (g) are the particulate organic compounds (with green arrows pointing out the high organic peaks), ammonium, nitrate, and sulfate measured by AMS and simulated by COSMO-ART. The simulation results are at the lowest atmospheric level in the model, namely 10 m a.g.l.
3.4.1 Secondary inorganic compounds
As shown in Fig. 7e to g, observations and model results for secondary inorganic compounds show comparable diurnal cycles and even the concentration levels match quite well. While ammonium and nitrate have a similar trend most of the time, the trend for sulfate seems to be somewhat different. The major peaks of ammonium and nitrate appear at similar times as the high organic peaks. As will be shown in the following section, these compounds originated from anthropogenic sources in the urban and industrial area of Karlsruhe and from the city of Stuttgart. There is only one instance when all the measured secondary inorganics show peaks together: the inorganics peak at ∼ 10:00 CEST on 26 August when high SO2 concentrations were also observed (see Fig. 4), which were due to emissions from a power plant located in the upwind direction. To verify this, we can refer to the time series of vertical profiles for the simulated secondary inorganics (Fig. S13b to d). Despite similar spatial distributions of nitrate, ammonium, NO2, and SO2 from 02:00 to 12:00 CEST (see Fig. 5) the measured sulfate peak for that time is missing in the model output. The reason for this is still unclear. It should be noted that, compared to the sulfate peak observed, the companion ammonium and nitrate peaks are much broader and attributed to additional anthropogenic sources from the city and refinery rather than only the power plant.
Some of the differences between the model result and observation, such as that on 25 August or e.g. for sharper peaks, may be explained by missing (point) sources in the emission data and/or the limited spatial resolution. The general agreement is, however, quite good, also for some point sources like the largest power plant in Karlsruhe. Some of the differences in the trends of nitrate and sulfate may be caused by the different nature of the sources of their precursor gases SO2 and NOx. While SO2 is emitted in this area mainly from a few point sources, NOx is emitted from various sources over a larger area.
3.4.2 Organic compounds
The dominating OA components in this episode were LV-OOA1 (42±15) % and LV-OOA2 (32±21) %, which are surrogates for more aged SOA (Zhang et al., 2011). It should be noted that LV-OOA1 has a strong correlation with SV-OOA (γ=0.8), which is a surrogate for local (less aged) SOA (Zhang et al., 2011). As shown in Fig. S4 (the insert in panel d), they both peak at a similar time during the night with broader peaks for LV-OOA1. This indicates that the LV-OOA1 might have a similar origin as the SV-OOA (more related to local biogenic sources). However, it can also be influenced by regional transport. For example, the first LV-OOA1 peak has two sub-peaks: the first one appears during the night, e.g. related to NO3 oxidation (strong correlation with γ=0.9 between LV-OOA1 and the CHO1N family has been found here; refer to their time series in Fig. S4b), and the second sub-peak appears in the morning rush hour and corresponds to south and southwest wind directions, indicating potential transport from the urban and industrial area of Karlsruhe. The more oxidized LV-OOA2 peaks during daytime and shows a negative correlation with SV-OOA (), possibly due to photochemical ageing of SV-OOA. Therefore, we conclude that the SOA measured in this study was likely due to both local formation and regional transport.
For the field and model comparison, the general temporal development of organics is represented well by the model, showing similar trends as measured by AMS, but it underestimates the mass concentrations by a factor of ∼2.3; the averaged model result is (5.5±3.3) µg m−3, while the observed was (12.9±3.9) µg m−3. Potential reasons for this discrepancy will be discussed in light of sensitivity tests at the end of this section.
As mentioned above, the organics shows a peak on Friday 26 August during daytime (peak 1) and two more during the following nights of the weekend (peak 2 and 3) in the organic-rich episode. Model results cover peak 1 and 2, as well as the first part of peak 3. Analysis of the model results shows that the three peaks were caused by different factors including meteorological conditions, regional transport, and local or in situ new particle formation and growth (such as night-time new particle formation; Huang et al., 2019). As shown in Fig. 7a and d, peak 1 corresponds to south and southwest wind, indicating that the air masses came from the urban and industrial area of Karlsruhe. This is illustrated very well in a video showing the transmission of particulate organics leading to peak 1 (refer to the Video Supplement). The most intensive peak in organic particle mass (peak 2) starts from 26 August 20:30 CEST (Figs. 3 and S2) when the wind direction shifts from northwest to east (northeast, straight east, and southeast), the wind speed decreases to <0.5 m s−1, and the night-time temperature inversion starts. Such stagnant conditions limit aerosol mixing and support the build-up aerosols and their growth. During the entire campaign, the strongest temperature inversion was observed during this night from 26 to 27 August (peak inversion at 02:40 CEST on 27 August; Fig. S3). In spite of the stagnant conditions and rather low wind speeds, regional transport still plays an important role. The model results for this time show the transport of organic aerosol particles from the city of Stuttgart (southeast of the measurement site) over forested areas into the Rhine valley. This is clearly visible in a corresponding video of the model results for particulate organics and wind directions (refer to the Video Supplement). Furthermore, we investigate the relative contribution of biogenic and anthropogenic emissions and their interactions for this episode by comparing the model results with and without biogenic emissions. It turns out that the corresponding air masses originating from anthropogenic emissions in the Stuttgart area were transported to the measurement site by southeasterly winds via forested hills. During this transport, the organic particle mass concentrations increased while being mixed with biogenic emissions from the forest. The resulting air mass finally reaching the measurement site therefore consisted of anthropogenic and biogenic organics. For peak 3, we can also find the impact of transport as illustrated in another video of particulate organic mass evolution (refer to the Video Supplement). However, the origin of this peak is more complex and is most likely more influenced by local particle formation and growth. After the night-time peak 2, from 12:00 CEST on 27 August the air mass exhibited back-and-forth movements in west–east directions, showing a strong concentration gradient (west–east). Such conditions lead to high uncertainty of the model results for one point. Hence, although we observed quite similar particle compositions in these three subsequent peaks with high organic mass concentrations for similar meteorological conditions with low wind speeds, all three peaks were caused by air masses of different origin.
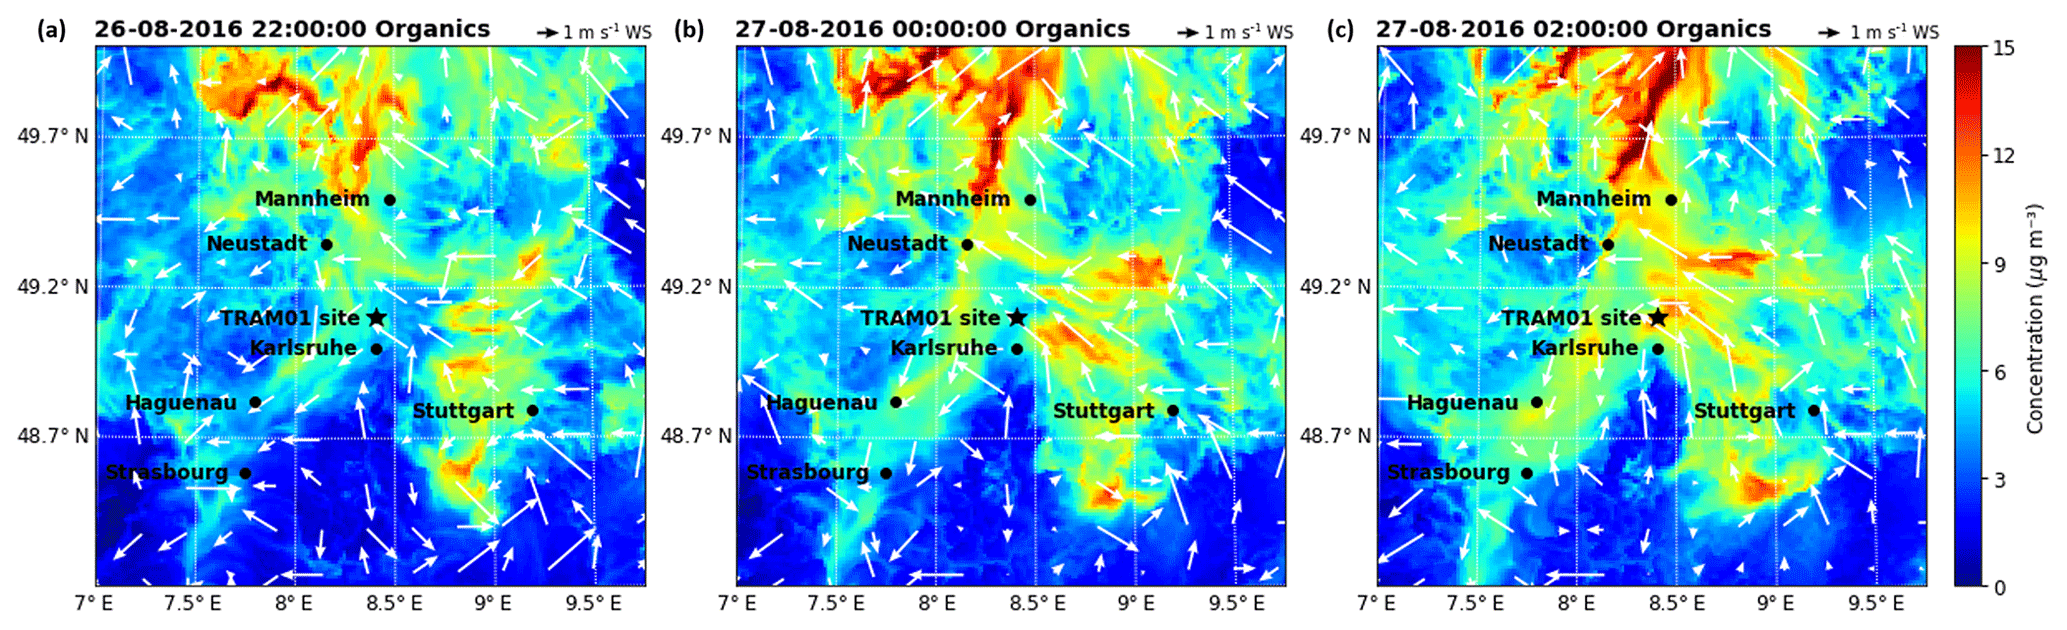
Figure 8Particulate organic concentrations calculated by COSMO-ART for three different time points (a–c) during the night from 26 to 27 August for 10 m a.g.l.
As mentioned above, the model underestimates the organic aerosol mass on average by a factor of 2.3. In order to better understand this discrepancy, we have done three sensitivity tests: one without biogenic emissions (test 01), one with doubled biogenic emissions (test 02), and one with boundary values or regional background values (outside the model domain) of particulate organic compounds increased by a factor of 10 (test 03). The results of test 01 suggest that (80±4) % of the organic mass calculated resulted from biogenic sources for the peak 1 time period, corresponding to the air masses coming from Karlsruhe. Regarding the time period of peak 2, there was a sharp drop in the biogenic contribution from 88 % to 68 %, corresponding to 26 August 23:00 to 27 August 02:00 CEST when the air mass was coming from the direction of Stuttgart (see Fig. 8). Hence, we can infer that the anthropogenic contribution to the air mass that originated from Stuttgart was somewhat larger than that originating from Karlsruhe. Over the entire organic-rich episode, on average (74±7) % of the organic mass was contributed by biogenic sources. To test if missing emissions of biogenic precursors can explain the underestimated organic particulate masses we doubled this major (biogenic) source for organics (test 02). As shown in Fig. 9, doubling biogenic emissions makes some of the peaks in organic mass fit the observations better, but the concentrations before and between the peak values are still underestimated. Another potential reason for the discrepancy could be boundary values that are too low (regional background); therefore, we increased them by a factor of 10 (test 03). This elevates the overall simulated concentration levels, leading to an overestimation, especially of the first peak. These tests demonstrate the potential role of precursor emissions and the regional transport of organic aerosol particles in the model results. There seems to be evidence that the model underestimates the regional background of organic aerosol particles. However, we cannot rule out the possibility that underestimated sources of VOCs or weaknesses in the SOA formation mechanism may also contribute to the underestimation of the organic aerosol particle mass. For example, night-time new particle formation mechanisms are not included in the current model version.
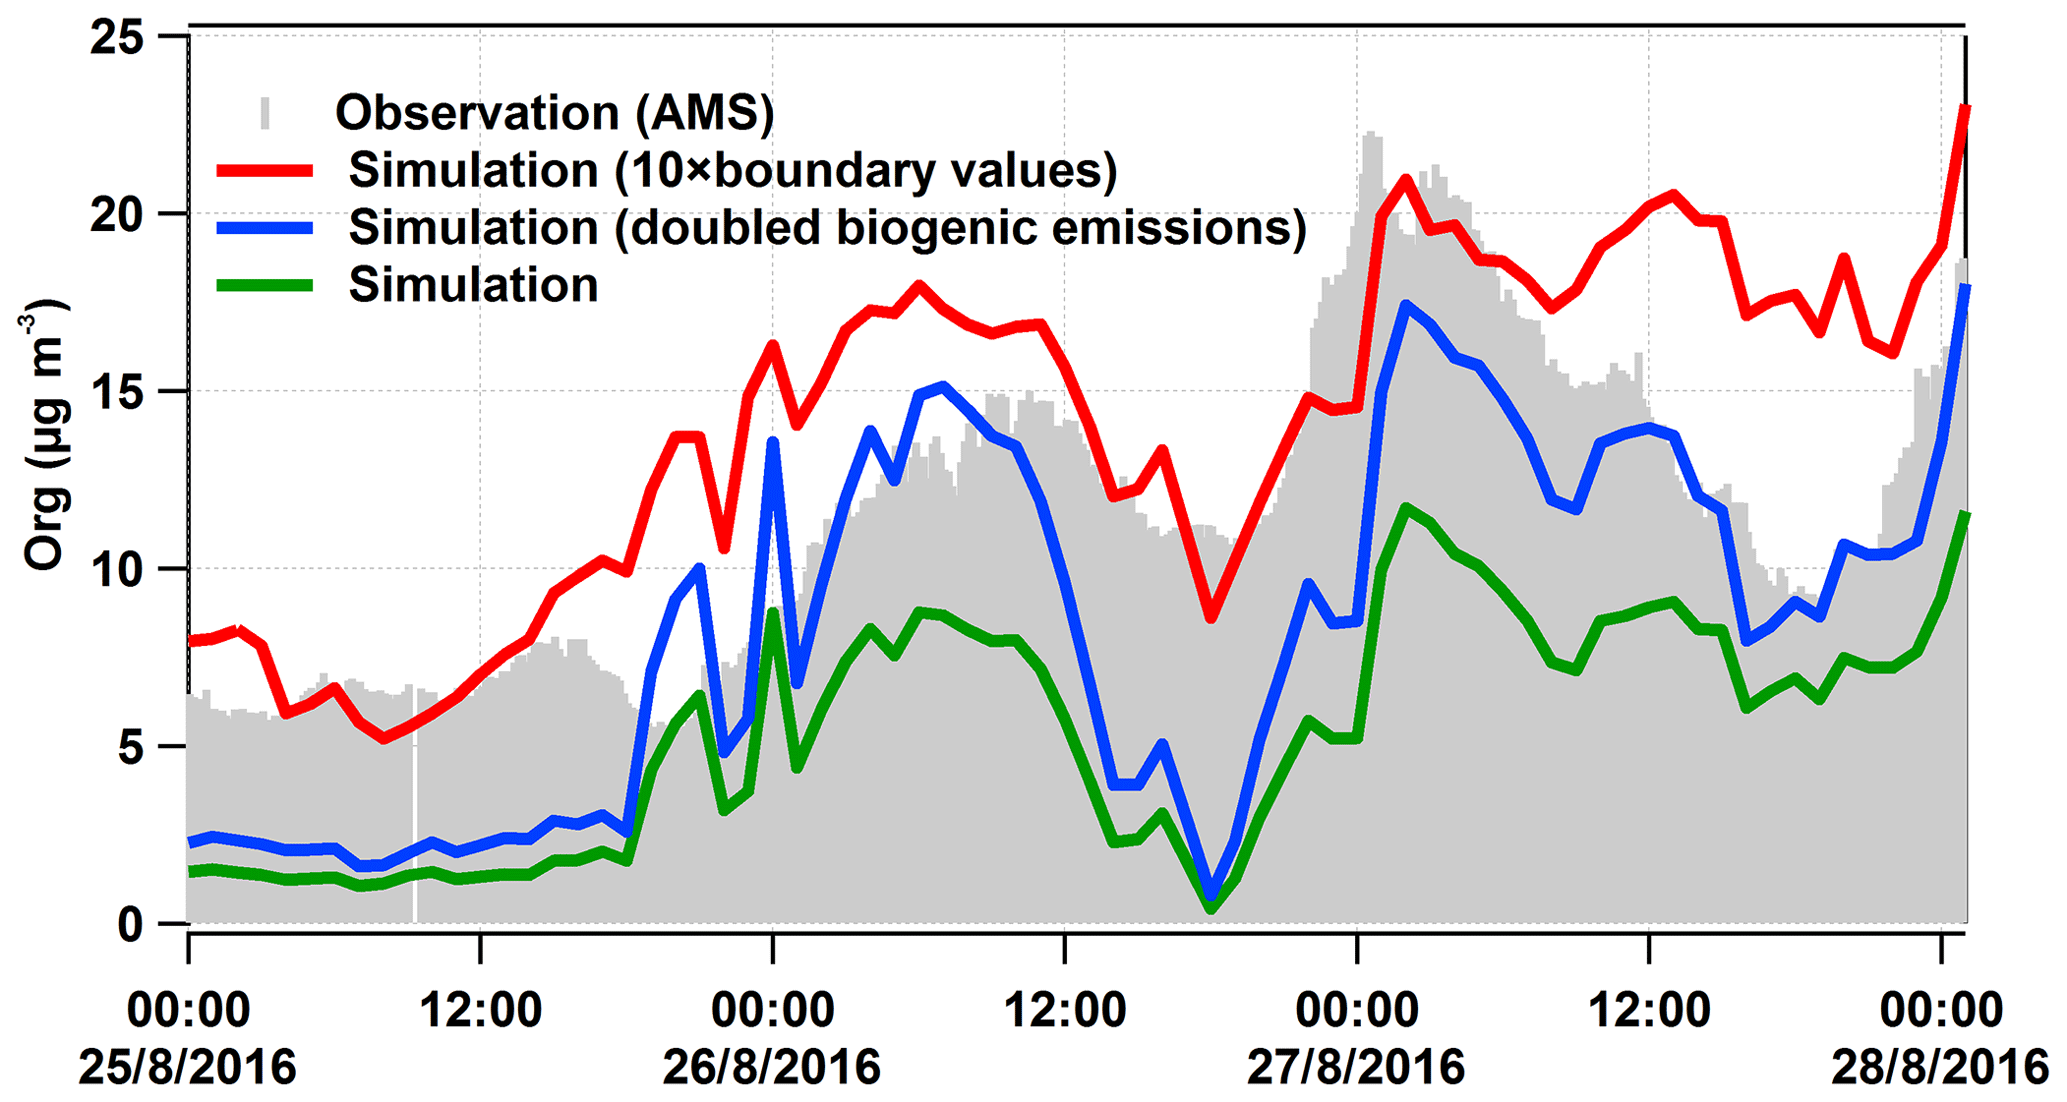
Figure 9Modelled organic mass concentrations (lines) compared to measured values (grey area). The green line is the same as in Fig. 7, the red line was calculated for a 10-fold-enhanced regional background in organics, and the blue was calculated for doubled biogenic emissions in COSMO-ART.
High particle number concentrations have been observed at a rural site in the upper Rhine valley by measurements on a tramline (Hagemann et al., 2014). In order to study the nature of the aerosols in the same region, we conducted a 6-week stationary field measurement campaign at a rural site next to the tramline in summer 2016 and applied a regional transport model, COSMO-ART, to analyse the origin of the aerosols. Comparing the field observations and model calculations, we have verified that industrial emissions contribute to the high particle number concentrations at this rural site.
For the whole measurement period, the particles that dominate the mass are sodium salts, which contributed (36±27) % to the PM2.5 mass measured by the LAAPTOF. According to the AMS measurements, organics, sulfate, nitrate, and ammonium contributed (58±12) %, (22±7) %, (10±1) %, and (9±3) % to the total non-refractory PM2.5 mass, respectively. AMS-PMF results suggest the organic aerosols (OA) consisted of (9±7) % HOA, (16±11) % SV-OOA, and (75±15) % LV-OOA with three subtypes (LV-OOA1, LV-OOA2, and LV-OOA3). Furthermore, we have investigated two episodes dominated by aged sea salt and organics, which show characteristic features such as higher particle acidities and carbon oxidation states, respectively. Both episodes selected were dominated by particles formed from the interaction of natural and anthropogenic or of biogenic and anthropogenic and emissions.
For the sodium-chloride-rich episode, sodium salt particles accounted for (70±24) % of total mass of the single particles. We could show that the dominating particles were originally sea salt from the Atlantic Ocean (∼800 km away from the measurement site). These particles consisted of two classes with different ageing stages. After 1.5–3 d of transport, the original sea salt particles retained strong chloride signatures, while after 3.5–4 d of transport over the continent aged sea salt with stronger nitrate signatures and larger size arrived at the measurement location. In addition, the organonitrate signature peaks at m∕z 129 were stronger for the aged sea salt particles. According to chamber experiments on OH oxidation of α-pinene and/or toluene in the presence of NOx on sodium nitrate seed particles, we have evidence that m∕z 129 is a signature peak for anthropogenic organics in single-particle mass spectra. Hence, the m∕z 129 observed on sea salt particles in this study is another indicator for the interaction of anthropogenic emissions with sea salt particles. Some other signature peaks, such as 81 Na2Cl+, 92 , 108 , 104 , 131 , and 147 , have the potential to indicate the degree of ageing of sea salt particles.
For the organic-rich episode, the particulate organic compounds accounted for (77±6) % of total non-refractory particle mass measured by the AMS. AMS-PMF analysis suggests the dominating OA components were LV-OOA1 and LV-OOA2, contributing (42±15) % and (32±21) % to the total OA mass in this episode. LV-OOA1 and LV-OOA2 had positive (γ=0.9) and negative () correlations with SV-OOA, respectively, indicating their local formation. In order to investigate origin of the aerosols and their transport and transformation processes, we applied a regional transport model, COSMO-ART. Transport model results suggest that (74±7) % of the particulate organic mass calculated was related to biogenic emissions. With the combination of mass spectrometry and COSMO-ART modelling, we can confirm that during Friday 26 August, air masses came from an industrial area and the city of Karlsruhe, leading to high particle numbers (including all the particles with size >2.5 nm), high particulate organics and secondary inorganics, and high fractions of aged-biomass-burning and soil-dust-like particles. During night-time on 26 August, southeasterly winds transported air masses from Stuttgart via forested areas to the measurement site, resulting in particles formed by the interaction of anthropogenic and biogenic precursors. Such air masses flowed into the Rhine valley and also contributed to the high organic aerosol mass concentrations during the night from 27 to 28 August. In addition, low wind speeds and temperature inversion limited mixing and supported new particle formation and growth, partially contributing to higher organic particle masses.
Comparing comprehensive field observations with the COSMO-ART model results showed quite good agreement for trends and most concentration levels for several aerosol particle compounds and trace gases, even if not all details could be reproduced by the model. However, the simulated particle numbers are 10 times less than the observed values. This is mainly due to the fact that not all new particle formation processes (nucleation mode) are included in the model (e.g. night-time chemistry and the role of organics or ammonia). Furthermore, the model underestimates particulate organics by a factor of 2.3. This discrepancy may be partly explained by an underestimated regional background, missing sources, or incomplete SOA formation and growth mechanisms in the current model version. Such field–model comparisons and corresponding sensitivity tests are useful for targeting missing sources and mechanisms in the current model and thus help its development such that the model can be improved to become better predictive, which is useful for e.g. legislation and the implementation of policies against air pollution. Consequently, model systems suitable for a reasonable environmental policy should be validated by comprehensive field studies with state-of-the-art aerosol analytics and meteorological parameters.
As discussed above, we can conclude that factors related to topography, metrological conditions, local emissions, in situ formation and growth, regional transport, and the interaction of biogenic and anthropogenic compounds need to be considered for a comprehensive understanding of aerosol composition and processing in this region. Our results show how closely the physical and chemical nature of aerosols is related to emission sources, transformation processes, and complex transport patterns. The method of combining field measurement and model calculation in this study can be widely used in other places in the world in order to investigate the origin of aerosols and their interaction between transport and transformation: for example, in some pollution hot spots like the Po Valley, and some other places which are subject to both biogenic and anthropogenic emissions. It is also not limited to the summertime during which we studied. Overall, this study provides good insight into the chemical nature and complex origin of aerosols in the upper Rhine valley, achieved by combining complementary mass spectrometry and transport modelling.
Five supporting videos (.gif files) are available at KIT as open data (https://doi.org/10.5445/IR/1000094401; Shen et al., 2019b).
The supplement related to this article is available online at: https://doi.org/10.5194/acp-19-13189-2019-supplement.
XS operated LAAPTOF and AMS during the whole field campaign, did the LAAPTOF data analysis, did COSMO-ART model runs and model output data analysis, did HYSPLIT back-trajectory analysis, did further analysis for AMS data, produced all figures, and wrote the paper. HS organized the campaign, provided trace gas, meteorology, and particle measurements, and provided suggestions for the data analysis, interpretation, and discussion. HV and BV provided the input data for the COSMO-ART model and provided suggestions for the model simulation, the model data analysis, interpretation, and discussion. WH operated AMS during the whole campaign and did basic AMS data analysis as well as PMF analysis. CM helped to operate the instruments, did black carbon data analysis, and provided suggestions for the data analysis, interpretation, and discussion. RR helped to operate LAAPTOF. ASHP gave comments for the interpretation of black carbon data. TL gave general advice and comments for this paper. All authors contributed to the final text.
The authors declare that they have no conflict of interest.
The authors gratefully thank the IMK-AAF AIDA staff and IMK-TRO modellers at KIT for helpful discussions and technical support, as well as the China Scholarship Council (CSC) for financial support of Xiaoli Shen and Wei Huang. Special thanks go to the Albtal-Verkehrs-Gesellschaft (AVG) for providing power and the measurement location near the tramline and to Norbert Kalthoff's group for providing tower data. In addition, the authors gratefully acknowledge the NOAA Air Resources Laboratory (ARL) for provision of the HYSPLIT transport and dispersion model and the READY website (http://www.ready.noaa.gov).
The article processing charges for this open-access publication were covered by a Research Centre of the Helmholtz Association.
This paper was edited by Eleanor Browne and reviewed by two anonymous referees.
Allan, J. D., Bower, K. N., Coe, H., Boudries, H., Jayne, J. T., Canagaratna, M. R., Millet, D. B., Goldstein, A. H., Quinn, P. K., Weber, R. J., and Worsnop, D. R.: Submicron aerosol composition at Trinidad Head, California, during ITCT 2K2: Its relationship with gas phase volatile organic carbon and assessment of instrument performance, J. Geophys. Res.-Atmos., 109, D23S24, https://doi.org/10.1029/2003jd004208, 2004.
Backes, A., Aulinger, A., Bieser, J., Matthias, V., and Quante, M.: Ammonia emissions in Europe, part I: Development of a dynamical ammonia emission inventory, Atmos. Environ., 131, 55–66, 2016.
Baklanov, A., Schlünzen, K., Suppan, P., Baldasano, J., Brunner, D., Aksoyoglu, S., Carmichael, G., Douros, J., Flemming, J., Forkel, R., Galmarini, S., Gauss, M., Grell, G., Hirtl, M., Joffre, S., Jorba, O., Kaas, E., Kaasik, M., Kallos, G., Kong, X., Korsholm, U., Kurganskiy, A., Kushta, J., Lohmann, U., Mahura, A., Manders-Groot, A., Maurizi, A., Moussiopoulos, N., Rao, S. T., Savage, N., Seigneur, C., Sokhi, R. S., Solazzo, E., Solomos, S., Sørensen, B., Tsegas, G., Vignati, E., Vogel, B., and Zhang, Y.: Online coupled regional meteorology chemistry models in Europe: current status and prospects, Atmos. Chem. Phys., 14, 317–398, https://doi.org/10.5194/acp-14-317-2014, 2014.
Bangert, M., Kottmeier, C., Vogel, B., and Vogel, H.: Regional scale effects of the aerosol cloud interaction simulated with an online coupled comprehensive chemistry model, Atmos. Chem. Phys., 11, 4411–4423, https://doi.org/10.5194/acp-11-4411-2011, 2011.
Bieser, J., Aulinger, A., Matthias, V., Quante, M., and Builtjes, P.: SMOKE for Europe – adaptation, modification and evaluation of a comprehensive emission model for Europe, Geosci. Model Dev., 4, 47–68, https://doi.org/10.5194/gmd-4-47-2011, 2011.
Burkholder, J. B., Abbate, J. P. D., Barnes, I., Roberts, J. M., Melamed, M. L., Ammann, M., Bertram, A. K., Cappa, C. D., Carlton, A. G., Carpenter, L. J., Crowley, J. N., Dubowski, Y., Georges, C., Heard, D. E., Herrmann, H., Keutsch, F. N., Kroll, J. H., McNeill, V. F., Ng, N. L., Nizkorodov, S. A., Orlando, J. J., Percival, C. J., Picquet-Varrault, B., Rudich, Y., Seakins, P. W., Surratt, J. D., Tanimoto, H., Thornton, J. A., Tong, Z., Tyndall, G. S., Wahner, A., Weschler, C. J., Wilson, K. R., and Ziemann, P. J.: The Essential Role for Laboratory Studies in Atmospheric Chemistry, Environ. Sci. Technol., 51, 2519–2528, 2017.
Canagaratna, M. R., Jayne, J. T., Jimenez, J. L., Allan, J. D., Alfarra, M. R., Zhang, Q., Onasch, T. B., Drewnick, F., Coe, H., Middlebrook, A., Delia, A., Williams, L. R., Trimborn, A. M., Northway, M. J., DeCarlo, P. F., Kolb, C. E., Davidovits, P., and Worsnop, D. R.: Chemical and microphysical characterization of ambient aerosols with the aerodyne aerosol mass spectrometer, Mass Spectrom. Rev., 26, 185–222, 2007.
Canagaratna, M. R., Jimenez, J. L., Kroll, J. H., Chen, Q., Kessler, S. H., Massoli, P., Hildebrandt Ruiz, L., Fortner, E., Williams, L. R., Wilson, K. R., Surratt, J. D., Donahue, N. M., Jayne, J. T., and Worsnop, D. R.: Elemental ratio measurements of organic compounds using aerosol mass spectrometry: characterization, improved calibration, and implications, Atmos. Chem. Phys., 15, 253–272, https://doi.org/10.5194/acp-15-253-2015, 2015.
Canonaco, F., Crippa, M., Slowik, J. G., Baltensperger, U., and Prévôt, A. S. H.: SoFi, an IGOR-based interface for the efficient use of the generalized multilinear engine (ME-2) for the source apportionment: ME-2 application to aerosol mass spectrometer data, Atmos. Meas. Tech., 6, 3649–3661, https://doi.org/10.5194/amt-6-3649-2013, 2013.
Canonaco, F., Slowik, J. G., Baltensperger, U., and Prévôt, A. S. H.: Seasonal differences in oxygenated organic aerosol composition: implications for emissions sources and factor analysis, Atmos. Chem. Phys., 15, 6993–7002, https://doi.org/10.5194/acp-15-6993-2015, 2015.
Crippa, M., Canonaco, F., Lanz, V. A., Äijälä, M., Allan, J. D., Carbone, S., Capes, G., Ceburnis, D., Dall'Osto, M., Day, D. A., DeCarlo, P. F., Ehn, M., Eriksson, A., Freney, E., Hildebrandt Ruiz, L., Hillamo, R., Jimenez, J. L., Junninen, H., Kiendler-Scharr, A., Kortelainen, A.-M., Kulmala, M., Laaksonen, A., Mensah, A. A., Mohr, C., Nemitz, E., O'Dowd, C., Ovadnevaite, J., Pandis, S. N., Petäjä, T., Poulain, L., Saarikoski, S., Sellegri, K., Swietlicki, E., Tiitta, P., Worsnop, D. R., Baltensperger, U., and Prévôt, A. S. H.: Organic aerosol components derived from 25 AMS data sets across Europe using a consistent ME-2 based source apportionment approach, Atmos. Chem. Phys., 14, 6159–6176, https://doi.org/10.5194/acp-14-6159-2014, 2014.
Cubison, M. J., Ortega, A. M., Hayes, P. L., Farmer, D. K., Day, D., Lechner, M. J., Brune, W. H., Apel, E., Diskin, G. S., Fisher, J. A., Fuelberg, H. E., Hecobian, A., Knapp, D. J., Mikoviny, T., Riemer, D., Sachse, G. W., Sessions, W., Weber, R. J., Weinheimer, A. J., Wisthaler, A., and Jimenez, J. L.: Effects of aging on organic aerosol from open biomass burning smoke in aircraft and laboratory studies, Atmos. Chem. Phys., 11, 12049–12064, https://doi.org/10.5194/acp-11-12049-2011, 2011.
Daellenbach, K. R., Stefenelli, G., Bozzetti, C., Vlachou, A., Fermo, P., Gonzalez, R., Piazzalunga, A., Colombi, C., Canonaco, F., Hueglin, C., Kasper-Giebl, A., Jaffrezo, J.-L., Bianchi, F., Slowik, J. G., Baltensperger, U., El-Haddad, I., and Prévôt, A. S. H.: Long-term chemical analysis and organic aerosol source apportionment at nine sites in central Europe: source identification and uncertainty assessment, Atmos. Chem. Phys., 17, 13265–13282, https://doi.org/10.5194/acp-17-13265-2017, 2017.
DeCarlo, P. F., Kimmel, J. R., Trimborn, A., Northway, M. J., Jayne, J. T., Aiken, A. C., Gonin, M., Fuhrer, K., Horvath, T., Docherty, K. S., Worsnop, D. R., and Jimenez, J. L.: Field-deployable, high-resolution, time-of-flight aerosol mass spectrometer, Anal. Chem., 78, 8281–8289, 2006.
DeCarlo, P. F., Ulbrich, I. M., Crounse, J., de Foy, B., Dunlea, E. J., Aiken, A. C., Knapp, D., Weinheimer, A. J., Campos, T., Wennberg, P. O., and Jimenez, J. L.: Investigation of the sources and processing of organic aerosol over the Central Mexican Plateau from aircraft measurements during MILAGRO, Atmos. Chem. Phys., 10, 5257–5280, https://doi.org/10.5194/acp-10-5257-2010, 2010.
Drinovec, L., Močnik, G., Zotter, P., Prévôt, A. S. H., Ruckstuhl, C., Coz, E., Rupakheti, M., Sciare, J., Müller, T., Wiedensohler, A., and Hansen, A. D. A.: The “dual-spot” Aethalometer: an improved measurement of aerosol black carbon with real-time loading compensation, Atmos. Meas. Tech., 8, 1965–1979, https://doi.org/10.5194/amt-8-1965-2015, 2015.
Farmer, D. K., Matsunaga, A., Docherty, K. S., Surratt, J. D., Seinfeld, J. H., Ziemann, P. J., and Jimenez, J. L.: Response of an aerosol mass spectrometer to organonitrates and organosulfates and implications for atmospheric chemistry, P. Natl. Acad. Sci. USA, 107, 6670–6675, 2010.
Fierce, L., Riemer, N., and Bond, T. C.: Toward reduced representation of mixing state for simulating aerosol effects on climate, B. Am. Meteorol. Soc., 98, 971–980, 2017.
Fuzzi, S., Baltensperger, U., Carslaw, K., Decesari, S., Denier van der Gon, H., Facchini, M. C., Fowler, D., Koren, I., Langford, B., Lohmann, U., Nemitz, E., Pandis, S., Riipinen, I., Rudich, Y., Schaap, M., Slowik, J. G., Spracklen, D. V., Vignati, E., Wild, M., Williams, M., and Gilardoni, S.: Particulate matter, air quality and climate: lessons learned and future needs, Atmos. Chem. Phys., 15, 8217–8299, https://doi.org/10.5194/acp-15-8217-2015, 2015.
Gard, E. E., Kleeman, M. J., Gross, D. S., Hughes, L. S., Allen, J. O., Morrical, B. D., Fergenson, D. P., Dienes, T., Galli, M. E., Johnson, R. J., Cass, G. R., and Prather, K. A.: Direct observation of heterogeneous chemistry in the atmosphere, Science, 279, 1184–1187, 1998.
Gemayel, R., Hellebust, S., Temime-Roussel, B., Hayeck, N., Van Elteren, J. T., Wortham, H., and Gligorovski, S.: The performance and the characterization of laser ablation aerosol particle time-of-flight mass spectrometry (LAAP-ToF-MS), Atmos. Meas. Tech., 9, 1947–1959, https://doi.org/10.5194/amt-9-1947-2016, 2016.
Gemayel, R., Temime-Roussel, B., Hayeck, N., Gandolfo, A., Hellebust, S., Gligorovski, S., and Wortham, H.: Development of an analytical methodology for obtaining quantitative mass concentrations from LAAP-ToF-MS measurements, Talanta, 174, 715–724, 2017.
Gross, G. and Wippermann, F.: Channeling and Countercurrent in the Upper Rhine Valley – Numerical Simulations, J. Clim. Appl. Meteorol., 26, 1293–1304, 1987.
Gunsch, M. J., May, N. W., Wen, M., Bottenus, C. L. H., Gardner, D. J., VanReken, T. M., Bertman, S. B., Hopke, P. K., Ault, A. P., and Pratt, K. A.: Ubiquitous influence of wildfire emissions and secondary organic aerosol on summertime atmospheric aerosol in the forested Great Lakes region, Atmos. Chem. Phys., 18, 3701–3715, https://doi.org/10.5194/acp-18-3701-2018, 2018.
Hagemann, R., Corsmeier, U., Kottmeier, C., Rinke, R., Wieser, A., and Vogel, B.: Spatial variability of particle number concentrations and NOx in the Karlsruhe (Germany) area obtained with the mobile laboratory “AERO-TRAM”, Atmos. Environ., 94, 341–352, 2014.
Healy, R. M., Sciare, J., Poulain, L., Crippa, M., Wiedensohler, A., Prévôt, A. S. H., Baltensperger, U., Sarda-Estève, R., McGuire, M. L., Jeong, C.-H., McGillicuddy, E., O'Connor, I. P., Sodeau, J. R., Evans, G. J., and Wenger, J. C.: Quantitative determination of carbonaceous particle mixing state in Paris using single-particle mass spectrometer and aerosol mass spectrometer measurements, Atmos. Chem. Phys., 13, 9479–9496, https://doi.org/10.5194/acp-13-9479-2013, 2013.
Hennigan, C. J., Izumi, J., Sullivan, A. P., Weber, R. J., and Nenes, A.: A critical evaluation of proxy methods used to estimate the acidity of atmospheric particles, Atmos. Chem. Phys., 15, 2775–2790, https://doi.org/10.5194/acp-15-2775-2015, 2015.
Herich, H., Hueglin, C., and Buchmann, B.: A 2.5 year's source apportionment study of black carbon from wood burning and fossil fuel combustion at urban and rural sites in Switzerland, Atmos. Meas. Tech., 4, 1409–1420, https://doi.org/10.5194/amt-4-1409-2011, 2011.
Huang, D. D., Li, Y. J., Lee, B. P., and Chan, C. K.: Analysis of Organic Sulfur Compounds in Atmospheric Aerosols at the HKUST Supersite in Hong Kong Using HR-ToF-AMS, Environ. Sci. Technol., 49, 3672–3679, 2015.
Huang, W., Saathoff, H., Shen, X. L., Ramakrishna, R., Leisner, T., and Mohr, C.: Chemical characterization of highly functionalized organonitrates contributing to high night-time organic aerosol mass loadings and particle growth, Environ. Sci. Technol., 53, 1165–1174, 2019.
Hudson, P. K., Murphy, D. M., Cziczo, D. J., Thomson, D. S., de Gouw, J. A., Warneke, C., Holloway, J., Jost, J. R., and Hubler, G.: Biomass-burning particle measurements: Characteristic composition and chemical processing, J. Geophys. Res.-Atmos., 109, D23S27, https://doi.org/10.1029/2003jd004398, 2004.
IPCC: Summary for Policymakers, in: Climate Change 2013: The Physical Science Basis. Contribution of Working Group I to the Fifth Assessment Report of the Intergovernmental Panel on Climate Change, edited by: Stocker, T. F., Qin, D., Plattner, G.-K., Tignor, M., Allen, S. K., Boschung, J., Nauels, A., Xia, Y., Bex, V., and Midgley, P. M., Cambridge University Press, Cambridge, UK and New York, NY, USA, 2013.
Jeong, C.-H., McGuire, M. L., Godri, K. J., Slowik, J. G., Rehbein, P. J. G., and Evans, G. J.: Quantification of aerosol chemical composition using continuous single particle measurements, Atmos. Chem. Phys., 11, 7027–7044, https://doi.org/10.5194/acp-11-7027-2011, 2011.
Kalthoff, N. and Vogel, B.: Countercurrent and Channeling Effect under Stable Stratification in the Area of Karlsruhe, Theor. Appl. Climatol., 45, 113–126, 1992.
Kiendler-Scharr, A., Mensah, A. A., Friese, E., Topping, D., Nemitz, E., Prevot, A. S. H., Aijala, M., Allan, J., Canonaco, F., Canagaratna, M., Carbone, S., Crippa, M., Dall Osto, M., Day, D. A., De Carlo, P., Di Marco, C. F., Elbern, H., Eriksson, A., Freney, E., Hao, L., Herrmann, H., Hildebrandt, L., Hillamo, R., Jimenez, J. L., Laaksonen, A., McFiggans, G., Mohr, C., O'Dowd, C., Otjes, R., Ovadnevaite, J., Pandis, S. N., Poulain, L., Schlag, P., Sellegri, K., Swietlicki, E., Tiitta, P., Vermeulen, A., Wahner, A., Worsnop, D., and Wu, H. C.: Ubiquity of organic nitrates from nighttime chemistry in the European submicron aerosol, Geophys. Res. Lett., 43, 7735–7744, 2016.
Knote, C., Brunner, D., Vogel, H., Allan, J., Asmi, A., Äijälä, M., Carbone, S., van der Gon, H. D., Jimenez, J. L., Kiendler-Scharr, A., Mohr, C., Poulain, L., Prévôt, A. S. H., Swietlicki, E., and Vogel, B.: Towards an online-coupled chemistry-climate model: evaluation of trace gases and aerosols in COSMO-ART, Geosci. Model Dev., 4, 1077–1102, https://doi.org/10.5194/gmd-4-1077-2011, 2011.
Kroll, J. H., Donahue, N. M., Jimenez, J. L., Kessler, S. H., Canagaratna, M. R., Wilson, K. R., Altieri, K. E., Mazzoleni, L. R., Wozniak, A. S., Bluhm, H., Mysak, E. R., Smith, J. D., Kolb, C. E., and Worsnop, D. R.: Carbon oxidation state as a metric for describing the chemistry of atmospheric organic aerosol, Nat. Chem., 3, 133–139, 2011.
Marsden, N., Flynn, M. J., Taylor, J. W., Allan, J. D., and Coe, H.: Evaluating the influence of laser wavelength and detection stage geometry on optical detection efficiency in a single-particle mass spectrometer, Atmos. Meas. Tech., 9, 6051–6068, https://doi.org/10.5194/amt-9-6051-2016, 2016.
Middlebrook, A. M., Bahreini, R., Jimenez, J. L., and Canagaratna, M. R.: Evaluation of composition-dependent collection efficiencies for the aerodyne aerosol mass spectrometer using field data, Aerosol Sci. Tech., 46, 258–271, 2012.
Mohr, C., DeCarlo, P. F., Heringa, M. F., Chirico, R., Slowik, J. G., Richter, R., Reche, C., Alastuey, A., Querol, X., Seco, R., Peñuelas, J., Jiménez, J. L., Crippa, M., Zimmermann, R., Baltensperger, U., and Prévôt, A. S. H.: Identification and quantification of organic aerosol from cooking and other sources in Barcelona using aerosol mass spectrometer data, Atmos. Chem. Phys., 12, 1649–1665, https://doi.org/10.5194/acp-12-1649-2012, 2012.
Murphy, D. M.: The design of single particle laser mass spectrometers, Mass Spectrom. Rev., 26, 150–165, 2007.
Paatero, P.: Least squares formulation of robust non-negative factor analysis, Chemometr. Intell. Lab., 37, 23–35, 1997.
Paatero, P. and Tapper, U.: Positive Matrix Factorization – a Nonnegative Factor Model with Optimal Utilization of Error-Estimates of Data Values, Environmetrics, 5, 111–126, 1994.
Peck, J., Gonzalez, L. A., Williams, L. R., Xu, W., Croteau, P. L., Timko, M. T., Jayne, J. T., Worsnop, D. R., Miake-Lye, R. C., and Smith, K. A.: Development of an aerosol mass spectrometer lens system for PM2.5, Aerosol Sci. Tech., 50, 781–789, 2016.
Pöschl, U.: Atmospheric aerosols: Composition, transformation, climate and health effects, Angew. Chem. Int. Edit., 44, 7520–7540, 2005.
Ramisetty, R., Abdelmonem, A., Shen, X., Saathoff, H., Leisner, T., and Mohr, C.: Exploring femtosecond laser ablation in single-particle aerosol mass spectrometry, Atmos. Meas. Tech., 11, 4345–4360, https://doi.org/10.5194/amt-11-4345-2018, 2018.
Reilly, P. T. A., Lazar, A. C., Gieray, R. A., Whitten, W. B., and Ramsey, J. M.: The elucidation of charge-transfer-induced matrix effects in environmental aerosols via real-time aerosol mass spectral analysis of individual airborne particles, Aerosol. Sci. Tech., 33, 135–152, 2000.
Reinard, M. S. and Johnston, M. V.: Ion formation mechanism in laser desorption ionization of individual nanoparticles, J. Am. Soc. Mass. Spectr., 19, 389–399, 2008.
Reitz, P., Zorn, S. R., Trimborn, S. H., and Trimborn, A. M.: A new, powerful technique to analyze single particle aerosol mass spectra using a combination of OPTICS and the fuzzy c-means algorithm, J. Aerosol Sci., 98, 1–14, 2016.
Rolph, G., Stein, A., and Stunder, B.: Real-time Environmental Applications and Display sYstem: READY, Environ. Modell. Softw., 95, 210–228, 2017.
Seinfeld, J. H. and Pandis, S. N.: Atmospheric chemistry and physics: From air pollution to climate change, Wiley, J & Sons, Inc., Hoboken, New Jersey, USA, 2006.
Shen, X., Ramisetty, R., Mohr, C., Huang, W., Leisner, T., and Saathoff, H.: Laser ablation aerosol particle time-of-flight mass spectrometer (LAAPTOF): performance, reference spectra and classification of atmospheric samples, Atmos. Meas. Tech., 11, 2325–2343, https://doi.org/10.5194/amt-11-2325-2018, 2018.
Shen, X., Saathoff, H., Huang, W., Mohr, C., Ramisetty, R., and Leisner, T.: Understanding atmospheric aerosol particles with improved particle identification and quantification by single-particle mass spectrometry, Atmos. Meas. Tech., 12, 2219–2240, https://doi.org/10.5194/amt-12-2219-2019, 2019a.
Shen, X., Vogel, H., Vogel, B., and Saathoff, H.: Modelling Aerosols in the upper Rhine valley for August 2016, KITopen, https://doi.org/10.5445/IR/1000094401, 2019b.
Stanelle, T., Vogel, B., Vogel, H., Bäumer, D., and Kottmeier, C.: Feedback between dust particles and atmospheric processes over West Africa during dust episodes in March 2006 and June 2007, Atmos. Chem. Phys., 10, 10771–10788, https://doi.org/10.5194/acp-10-10771-2010, 2010.
Stein, A. F., Draxler, R. R., Rolph, G. D., Stunder, B. J. B., Cohen, M. D., and Ngan, F.: Noaa's Hysplit Atmospheric Transport and Dispersion Modeling System, B. Am. Meteorol. Soc., 96, 2059–2077, 2015.
Tsigaridis, K., Krol, M., Dentener, F. J., Balkanski, Y., Lathière, J., Metzger, S., Hauglustaine, D. A., and Kanakidou, M.: Change in global aerosol composition since preindustrial times, Atmos. Chem. Phys., 6, 5143–5162, https://doi.org/10.5194/acp-6-5143-2006, 2006.
Ulbrich, I. M., Canagaratna, M. R., Zhang, Q., Worsnop, D. R., and Jimenez, J. L.: Interpretation of organic components from Positive Matrix Factorization of aerosol mass spectrometric data, Atmos. Chem. Phys., 9, 2891–2918, https://doi.org/10.5194/acp-9-2891-2009, 2009.
Vogel, B., Gross, B., and Wippermann, F.: Mesoklip (1st Special Observation Period) – Observations and Numerical-Simulation – a Comparison, Bound.-Lay. Meteorol., 35, 83–102, 1986.
Vogel, B., Fiedler, F., and Vogel, H.: Influence of Topography and Biogenic Volatile Organic-Compounds Emission in the State of Baden-Wurttemberg on Ozone Concentrations during Episodes of High Air Temperatures, J. Geophys. Res.-Atmos., 100, 22907–22928, 1995.
Vogel, B., Vogel, H., Bäumer, D., Bangert, M., Lundgren, K., Rinke, R., and Stanelle, T.: The comprehensive model system COSMO-ART – Radiative impact of aerosol on the state of the atmosphere on the regional scale, Atmos. Chem. Phys., 9, 8661–8680, https://doi.org/10.5194/acp-9-8661-2009, 2009.
Xu, J., Wang, H. T., Li, X. J., Li, Y., Wen, J., Zhang, J. S., Shi, X. R., Li, M., Wang, W., Shi, G. L., and Feng, Y. C.: Refined source apportionment of coal combustion sources by using single particle mass spectrometry, Sci. Total Environ., 627, 633–646, 2018.
Zenobi, R. and Knochenmuss, R.: Ion formation in MALDI mass spectrometry, Mass. Spectrom. Rev., 17, 337–366, 1998.
Zhang, Q., Jimenez, J. L., Worsnop, D. R., and Canagaratna, M.: A case study of urban particle acidity and its influence on secondary organic aerosol, Environ. Sci. Technol., 41, 3213–3219, 2007.
Zhang, Q., Jimenez, J. L., Canagaratna, M. R., Ulbrich, I. M., Ng, N. L., Worsnop, D. R., and Sun, Y. L.: Understanding atmospheric organic aerosols via factor analysis of aerosol mass spectrometry: a review, Anal. Bioanal. Chem., 401, 3045–3067, 2011.
Zhou, Y., Huang, X. H. H., Griffith, S. M., Li, M., Li, L., Zhou, Z., Wu, C., Meng, J. W., Chan, C. K., Louie, P. K. K., and Yu, J. Z.: A field measurement based scaling approach for quantification of major ions, organic carbon, and elemental carbon using a single particle aerosol mass spectrometer, Atmos. Environ., 143, 300–312, 2016.
Zotter, P., Herich, H., Gysel, M., El-Haddad, I., Zhang, Y., Močnik, G., Hüglin, C., Baltensperger, U., Szidat, S., and Prévôt, A. S. H.: Evaluation of the absorption Ångström exponents for traffic and wood burning in the Aethalometer-based source apportionment using radiocarbon measurements of ambient aerosol, Atmos. Chem. Phys., 17, 4229–4249, https://doi.org/10.5194/acp-17-4229-2017, 2017.