the Creative Commons Attribution 4.0 License.
the Creative Commons Attribution 4.0 License.
 | 18 Oct 2019
Nepal emission inventory – Part I: Technologies and combustion sources (NEEMI-Tech) for 2001–2016
Maheswar Rupakheti
Prakash Bhave
Kiran Shakya
Mark Lawrence
The lack of a comprehensive, up-to-date emission inventory for the Himalayan region is a major challenge in understanding the extensive regional air pollution, including its causes, impacts and mitigation pathways. This study describes a high-resolution (1 km × 1 km) present-day emission inventory for Nepal, developed with a higher-tier approach. The complete study is divided into two parts; this paper covers technologies and combustion sources in residential, industrial, commercial, agricultural diesel-use and transport sectors as Part I (NEEMI-Tech), while emissions from the open burning of municipal waste and agricultural residue in fields and fugitive emissions from waste management, paddy fields, enteric fermentation and manure management for the period 2001–2016 will be covered in Part II (NEEMI-Open). The national total energy consumption (except hydropower, solar and wind energy) estimated in the base year 2011 was 374 PJ, with the residential sector being the largest energy consumer (79 %), followed by industry (11 %) and the transport sector (7 %). Biomass is the dominant energy source, contributing to 88 % of the national total energy consumption, while the rest is from fossil fuel. A total of 8.9 Tg of CO2, 110 Gg of CH4, 2.1 Gg of N2O, 64 Gg of NOx, 1714 Gg of CO, 407 Gg of NMVOCs, 195 Gg of PM2.5, 23 Gg of BC, 83 Gg of OC and 24 Gg of SO2 emissions were estimated in 2011 from the five energy-use sectors considered in NEEMI-Tech. The Nepal emission inventory provides, for the first time, temporal trends of fuel and energy consumption and associated emissions in Nepal for a long period, 2001–2016. The energy consumption showed an increase by a factor of 1.6 in 2016 compared to 2001, while the emissions of various species increased by a factor of 1.2–2.4. An assessment of the top polluting technologies shows particularly high emissions from traditional cookstoves and space-heating practices using biomass. In addition, high emissions were also computed from fixed-chimney Bull's trench kilns (FCBTKs) in brick production, cement kilns, two-wheeler gasoline vehicles, heavy-duty diesel freight vehicles and kerosene lamps. The monthly analysis shows December, January and February as periods of high PM2.5 emissions from the technology-based sources considered in this study. Once the full inventory including open burning and fugitive sources (Part II) is available, a more complete picture of the strength and temporal variability in the emissions and sources will be possible. Furthermore, the large spatial variation in the emissions highlights the pockets of growing urbanization, which emphasize the importance of the detailed knowledge about the emission sources that this study provides. These emissions will be of value for further studies, especially air-quality-modeling studies focused on understanding the likely effectiveness of air pollution mitigation measures in Nepal.
- Article
(4596 KB) - Full-text XML
-
Supplement
(1388 KB) - BibTeX
- EndNote


Nepal, a developing country in southern Asia, is subject to the same increasing burden of air pollution seen over most of the subcontinent for the last decades (MoEST, 2005). With its complex topography, ranging from ca. 100 m a.s.l. (meters above sea level) in the south to above 8000 m a.s.l. in the north, the region is home to a population of 26.5 million (in 2011) that depends mainly on biomass and fossil fuel (imported from other countries) for its total energy needs (CBS, 2012; WECS, 2014). It is well established that the incomplete combustion of such biomass emits a significant amount of the fine particulate matter PM2.5 (diameter ≤2.5 µm) and ozone precursor emissions, which have been linked to degrading air quality, adverse health impacts, climate change and effects on the cryosphere (Fiore et al., 2015; Shakya et al., 2016). In addition, studies have also shown that air pollution causes reductions in crop productivity and have identified hotspots and the air pollution linkage behind urban heat islands, altering monsoon patterns and increases in natural calamities like floods (Burney and Ramanathan, 2014; Shastri et al., 2017; Collier and Zhang, 2009; Fan et al., 2015).
Global studies of health effects have identified air pollution, including both household pollution and ambient particulate pollution, as the second and third leading risk factors responsible for burden of disease attributable to premature deaths in Nepal (Forouzanfar, 2016). The prolonged exposure to these pollutants has led to significant respiratory symptoms. The exposure of adults to biomass smoke in rural households of Nepal has led to prevailing respiratory symptoms, while those with prolonged exposure to ambient particulate pollution in urban households have shown evidence of high chronic phlegm (Kurmi, 2014). A study has also demonstrated exposure as high as a 165 µg m−3 respirable fraction of particulates in children from the use of biomass for residential activities in Nepal (Devakumar et al., 2014). The roadside measurements in the Kathmandu Valley have also observed an average of ca. 90 µg m−3 of PM2.5 concentration, with higher upper bounds during the winter season (Bhari, 2015; Shakya et al., 2017). The ambient measurements of PM2.5 in the Kathmandu Valley, the capital and main metropolitan region in Nepal, have shown seasonal concentrations varying from 30 µg m−3 (monsoon) to 90 µg m−3 (winter), attributed to various emission sources and meteorology (Aryal et al., 2009). Such large variations in ambient concentrations are also likely partly due to seasonality in energy consumption and emissions.
The gross domestic product (GDP) of Nepal has been increasing substantially in the past 2 decades (MoF, 2017). Similarly there has been a tremendous increase in the energy-use footprint and import of fossil fuels (NOC, 2019). Since a large fraction of available national energy is consumed in the residential sector, relying on biomass fuels, there is an urgent need to understand the demand and supply of bio-resources and explore other cleaner options. Moreover, the rapid urbanization has led to an approximately 15-fold increase in vehicle numbers over the last 2 decades, unfortunately increasing the demand for petroleum fuels (DoTM, 2016). The increasing population and commercialization also call for uninterrupted electricity. Until recently, Nepal has faced very high amounts of load shedding and diesel consumption in diesel generators for backup power generation. This has led to a significant increase in the national black carbon (BC) emissions (World Bank, 2014). In order to tackle the problem of future energy demand (though the situation has improved since 2016) and degrading air quality, synergetic work is needed that is based on an understanding of the current fuel consumption and efficient combustion technologies.
Recent studies in Nepal have attempted to characterize and quantify the energy needs and emissions from sources such as the residential and commercial sectors using the “IPCC Tier I” or “EMEP/EEA Tier I” approach (less detailed) that fails to provide complete information about the combustion technologies and control abatements (Malla, 2013; Bhattarai and Jha, 2015). Research studies have mainly focused on residential cooking, with the aim of promoting energy-efficient and fuel-efficient cookstoves, renewable technologies, and better indoor air quality, with a brief discussion about the co-benefits of cleaner combustion technologies (Pokhrel, 2015; Gurung et al., 2012; Singh et al., 2012). Similarly, past studies on the transport sector have only been focused on the Kathmandu Valley due to large number of vehicles registered in the Bagmati Zone, where the Kathmandu Valley is located, and subsequently higher sales of gasoline and diesel in the valley (Shrestha et al., 2013). Past studies like that of Shrestha and Rajbhandari (2010) have modeled the influence of the residential, agricultural, transport, industrial and commercial sectors on reducing future carbon emissions only for the Kathmandu Valley, which takes into consideration the economics and demands of the population without a detailed classification of combustion technologies that drive the emissions.
Moreover, current Asian emission inventories tend to provide explicit details on energy-use patterns only for regions of interest while aggregating the same details on a coarser resolution for the rest of the countries (Zhang et al., 2009; Kurokawa et al., 2013). One such effort in segregating the energy use at a higher resolution of sectoral activities has been executed by the Water and Energy Commission Secretariat (WECS), Nepal; however, there is no clear methodology and underlying assumptions stated which can be relied on for further investigation into emission estimates (WECS, 2014). In addition to the upcoming air pollution strategies, NAMaSTE (Nepal Ambient Monitoring and Source Testing Experiment) has led to the measurements of emission factors from the different informal sources in Nepal, thereby providing Nepal-specific emission factors (EFs) that can be used in reducing the uncertainties in emissions (Stockwell et al., 2016; Jayarathne et al., 2018).
Analyzing the following issues, it is important to conduct a systematic and comprehensive study of all energy sectors, agriculture sources and solid-waste burning in Nepal from an emission point of view, which has not yet been done, integrating the primary information on energy production and use, combustion technologies and corresponding EFs. The Nepal emission inventory study is divided into two parts: technology-based emissions (NEEMI-Tech) as part I and open burning and fugitive emissions (NEEMI-Open) as part II. This paper discusses the development of a high-resolution (1 km × 1 km; monthly) combustion- and technology-based emission inventory from the residential, industrial, transport (on-road and off-road) and commercial sectors as well as the agricultural sector (only technology-based emissions from the use of tractors, tillers, pumps and threshers), while Part II encompasses emissions from the open burning of municipal waste and agricultural open field burning along with fugitive emissions from waste, paddy fields, enteric fermentation and manure management. At the time of writing, Part II was under preparation for publication. In both parts, total emissions of 10 species, where applicable, are estimated in this study, including greenhouse gases and short-lived climate-forcing pollutants (SLCPs). The methodology of developing emission estimates is described in Sect. 2, followed by information on activity rates, the detailed combustion technology and industrial process in practice, the region-specific EFs, spatial surrogates, and finally sectoral emissions. The analysis of our results compares our national energy and emissions with reported estimates by national authorities and regional and global inventories. Finally, the emissions from the Kathmandu Valley are compared with the rest of the Nepal to understand the relative contributions of different sources and emissions at the national level as well as in the Kathmandu Valley.
The methodology follows a bottom-up estimation of emissions using activity rates in the form of fuel consumption and the measured EFs in Nepal wherever possible. The fuel consumption is uniquely estimated across each sub-sector using available primary data of activity rates such as fuel imports, production, registered number of vehicles, machinery units and specific energy consumption (SEC). The approach also incorporates current industrial process technologies and the spread of control measures for particulates and other species (Fig. 1).
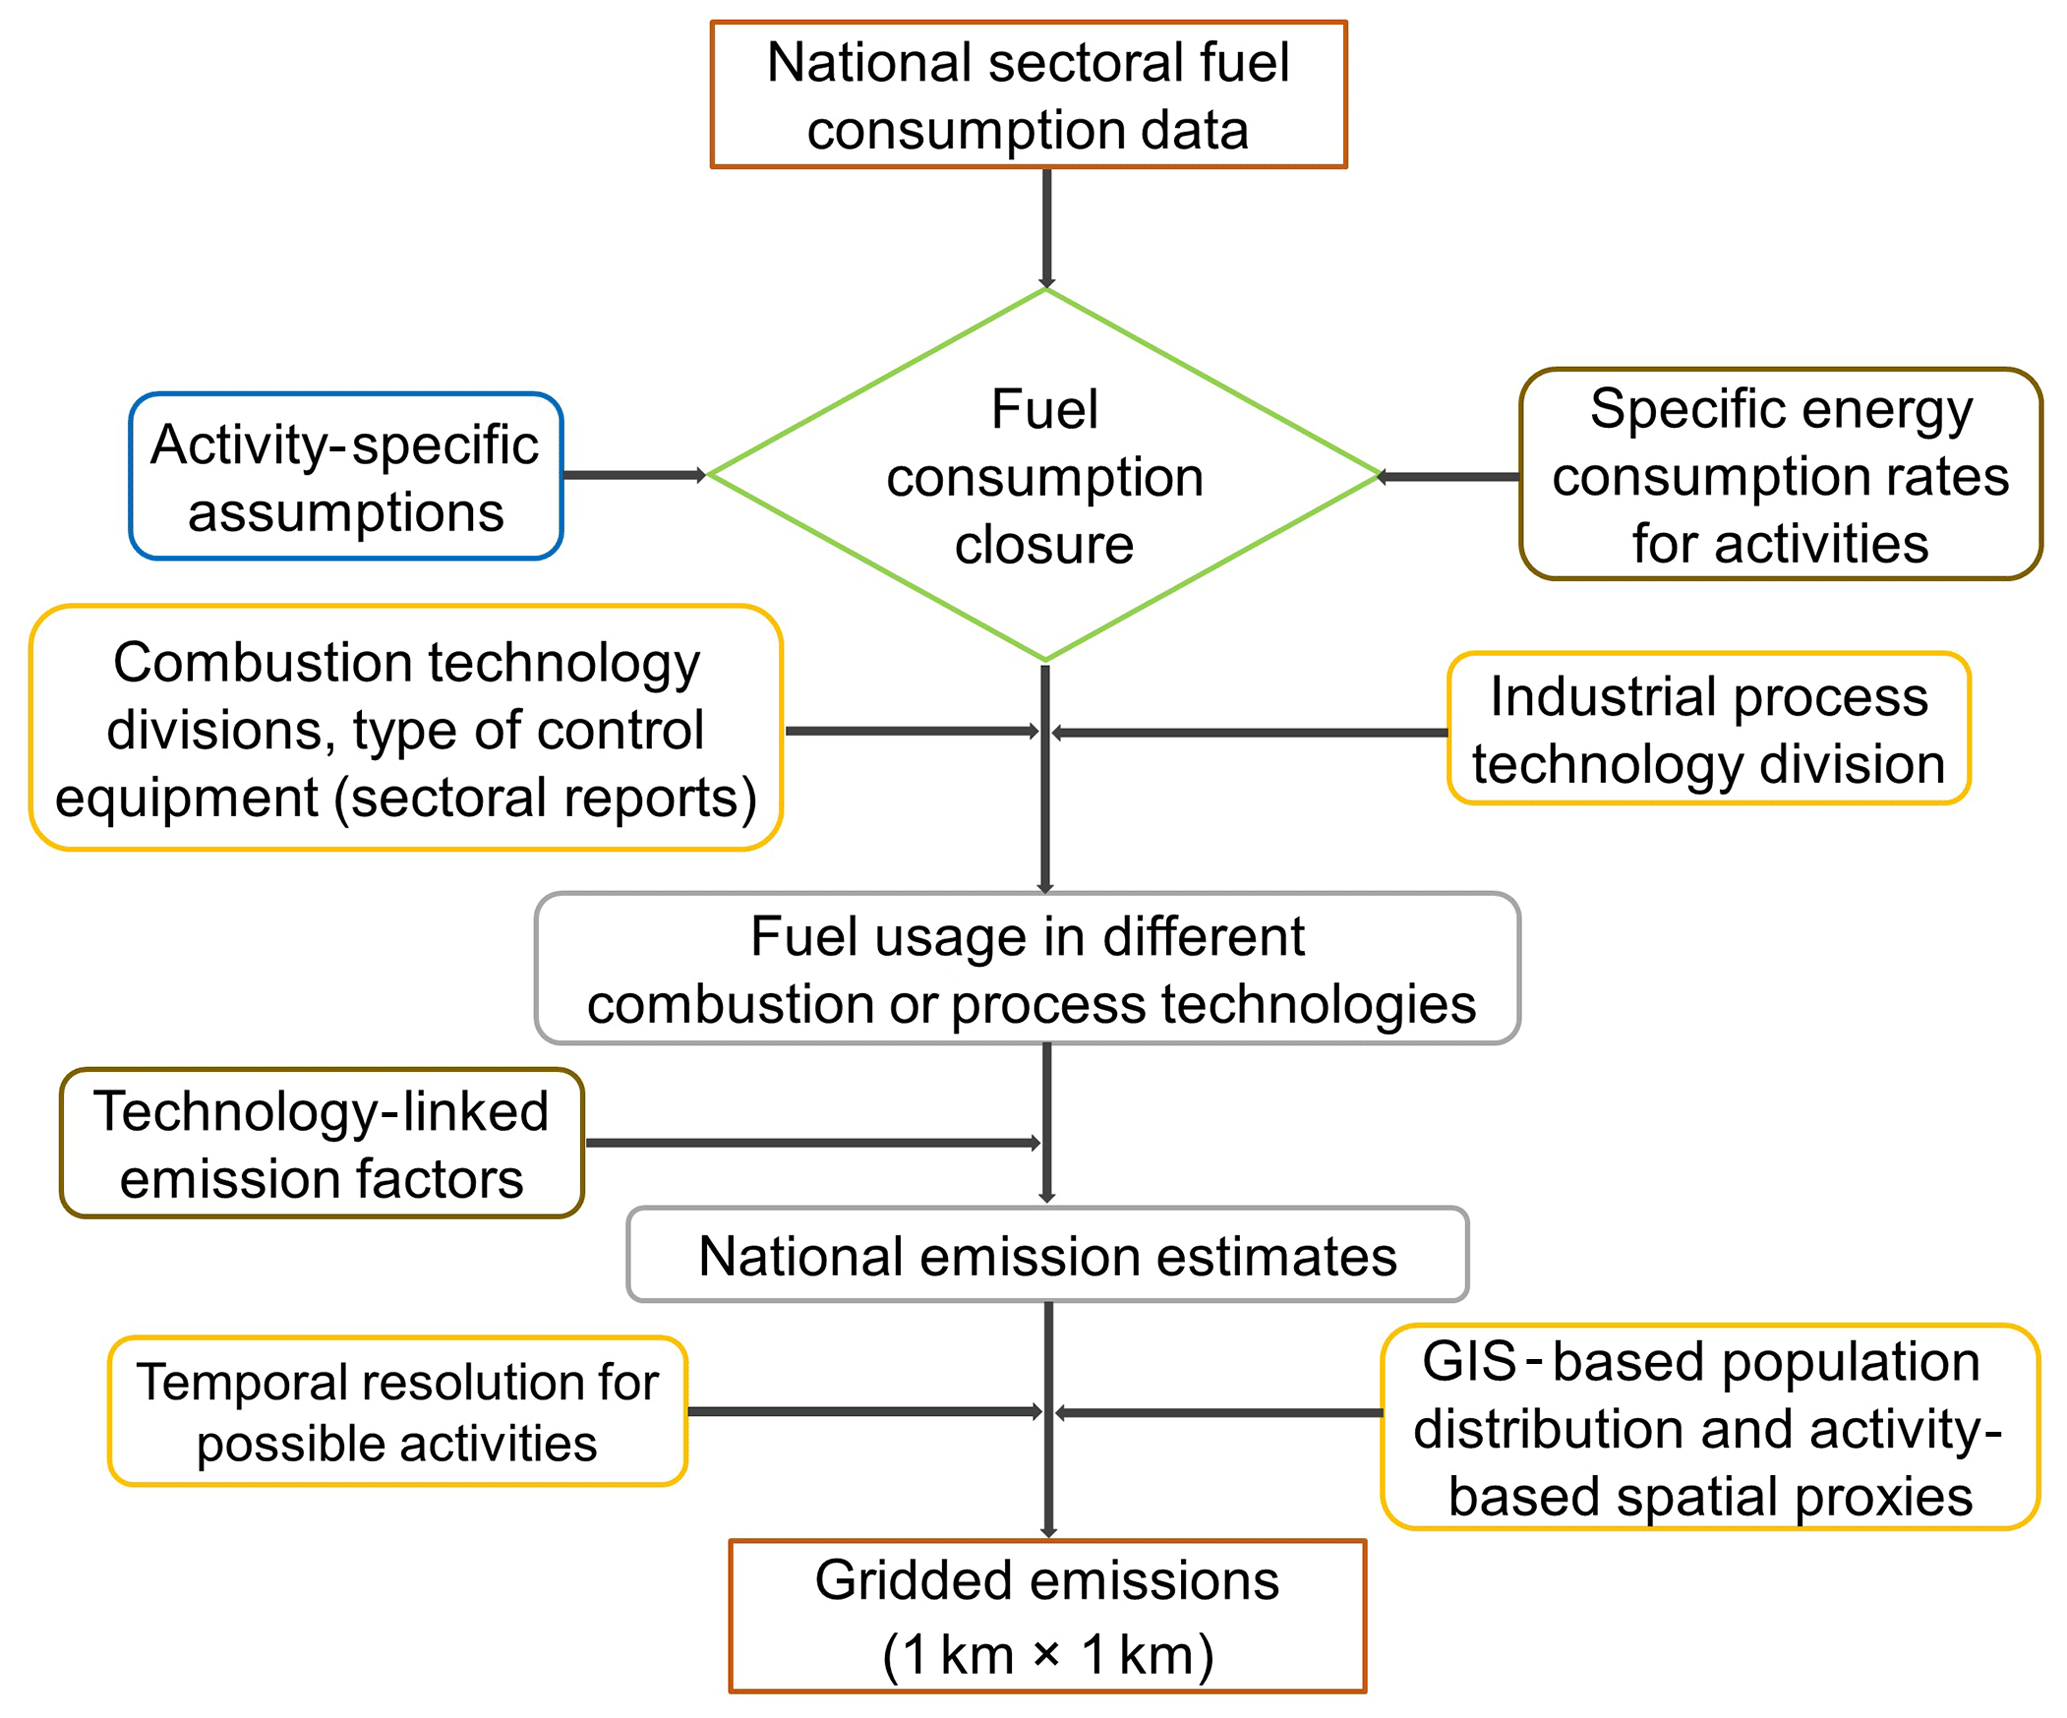
An emission E is estimated using Eq. (1), where pollutant i from sub-sector a is calculated using the fuel consumed (FC) by its type f in combustion technology t and emission factor (EF). The emission factor considered is a function of fuel type and the combustion technology, different across each sub-sector and fuel–technology combination. Black carbon (BC) and organic carbon (OC), two key components of particulate matter, are calculated using their respective fractions of PM2.5 (in Sect. 2.3; Eqs. 2 and 3). Table 1 lists the complete details about the emission sectors, pollutant species and spatial resolution considered in this study, referred to as the Nepal emission inventory (NEEMI):
Table 1Details about important features of the Nepal emission inventory (NEEMI).
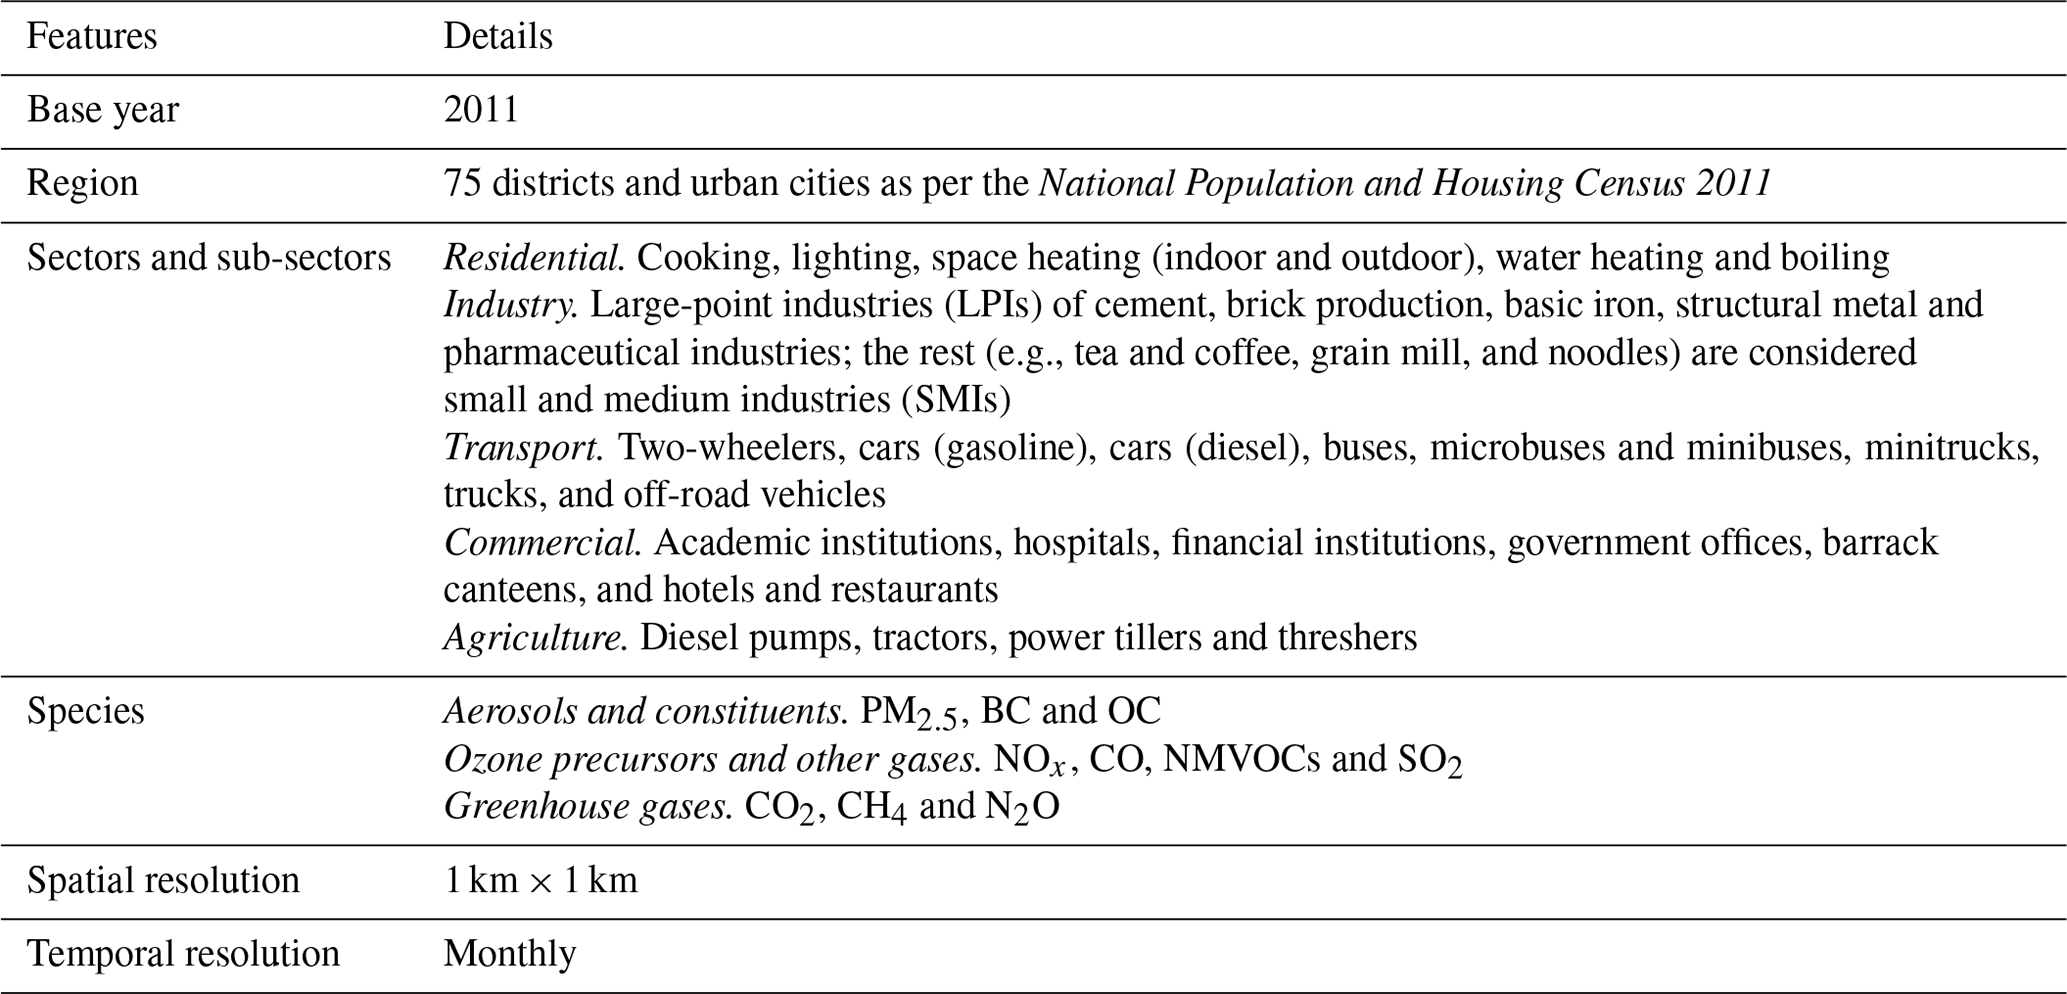
Note: open burning (municipal waste and agricultural open-field burning) and fugitive sources (waste, paddy fields, enteric fermentation and manure management) are not considered in this study.
2.1 Activity rates and technology division
Each sector considered in the study (residential, industrial, commercial, agricultural and transport) is classified into coherent sources broadly termed as sub-sectors, listed in Table 1. Activities and their combustion technologies pertaining to each sub-sector are identified for quantifying final energy consumption and resultant emissions. The following section describes in brief the methodological approach for estimating the fuel consumption in each sub-sector.
Residential. In residential sector, the National Population and Housing Census 2011 provides primary data on the number of households using different types of cooking fuel and sources of lighting for 3915 village development committees (VDCs) and 58 municipalities, i.e., administrative units in rural and urban regions, respectively, at the time of this study (CBS, 2012). The amounts and types of fuel consumed for cooking are based on previous studies reporting the “useful energy” required for preparing daily food in various utensil–stove–fuel combinations in different seasons (Pokharel, 2004; Kandel et al., 2016). For lighting, the amount of kerosene used is calculated using the average burn rate, hours of daily usage and number of lamps per household (Lam et al., 2012; DECP, 2014). For water heating and boiling, the specific energy required to raise the temperature from being ambient (t<20 ∘C) to 43 ∘C was calculated assuming an amount of bathing water of 15 L per capita per day (average capacity of commonly used buckets in Nepal). A similar temperature threshold (t<20 ∘C) was adopted to estimate the amount of fuel used for indoor and outdoor space heating. Space heating outdoors refers to where people gather around an open fire to keep themselves and the immediate vicinity warm by burning firewood, agricultural residue and dung cakes. Further details about each residential activity are described in the Supplement. Similarly, the National Population and Housing Census 2001 is used for activity rates in the year 2001. For years between 2001 and 2011, the data were interpolated using the compound annual growth rate (CAGR), which was further extrapolated to 2016 in order to provide trends from 2012 to 2016.
Industry. The industrial census, the National Census of Manufacturing Establishments 2011 (CME 2011), was used for fuel estimation; it collates the annual details on proprietorship, organizational structure, production, sales figures, fuel consumption, electricity consumption and details on pollution-control equipment. The CME 2011 surveyed a total of 4076 industrial units nationwide, covering small and medium industries (SMIs) and large-point industries (LPIs) (CBS, 2014). In this study, a total of 1512 industrial units, including cement manufacturing, basic iron, structural metal, brick production, grain mill, noodles, tea, coffee and pharmaceuticals are considered to be large-point sources or heavy industries, whereas the remaining 2564 industrial units are considered to be small and medium industries. The fuels in the above LPIs and SMIs of paper, sugar, beverage, dairy and soap were corrected using SEC from a survey conducted for selected industries and the production data (PACE Nepal, 2012; CBS, 2014). The methodology described above is followed to estimate fuel consumption for these respective years and interpolated for intermediate years.
Commercial. The commercial sector includes all service-providing institutions that are largely dispersed over the whole country (Table 1). These institutional units mainly require energy in the form of electricity (Nepal Electricity Authority – NEA – supply and diesel generators), while a few sub-sectors like hotels, restaurants and barrack canteens also consume energy for cooking and other utilities such as water boiling and space heating. The fuel consumption in each commercial sector activity is derived independently and explained in the Supplement.
Agriculture. The agricultural sector in this paper includes combustion activities of diesel use in pumps, tractors, power tillers and engines for threshing. The energy required for pumping water was estimated using the amount of water used for irrigation in Nepal, reported by the Food and Agriculture Organization (FAO), and the fraction of people relying on surface water (SW), shallow tube wells (STWs) and deep tube wells (DTWs) for irrigation (Frenken and Gillet, 2012). For mechanized farming the statistical information on Nepalese agriculture (2011–2012) from the Department of Agriculture reported the number of landholdings using tractors, tillers and threshers in 2011 (MoAD, 2011), which served as the primary information for estimating the fuel. The flowsheets explaining the fuel consumption are shown in the Supplement.
Transport. The activity rates for the transport sector include age-distributed vehicle population, fuel efficiency (FE) and vehicle kilometers traveled (VKT) for a total of eight categories of on-road and off-road vehicles (Shrestha et al., 2013; DoTM, 2013). The actual number of on-road vehicles is modeled using the long-term vehicle registration data (from ca. 1989 to 2016) and the survival fraction of vehicles in each category in every year (DoTM, 2016; Baidya and Borken-Kleefeld, 2009; Yan et al., 2011). The survival fraction was modeled using a logistic function to estimate the survival function parameters, alpha (α) and L50, which describes the onset of retirement and the age when 50 % of vehicles have retired (Yan et al., 2011; Pandey and Venkataraman, 2014). The fuel efficiency for each vehicle category was compiled from the survey-based studies conducted in Nepal (Dhital and Shakya, 2014; Dhakal 2003; Bajracharya and Bhattarai, 2016; Pradhan et al., 2006). The VKT was modeled using the survey study in the Kathmandu Valley for two-wheelers, buses, vans and taxis by Shrestha et al. (2013). For the remaining categories these data were taken from other literature (Dhital and Shakya, 2014; Dhakal, 2003; Bajracharya and Bhattarai 2016).
2.2 Combustion technologies
Understanding the combustion technologies in each sub-sector and characterizing emissions at activity level are two of the principal objectives of this study. Table 2 highlights the technologies considered in each sector and sub-sector.

In residential cooking, the type of cookstove used is mostly governed by the fuel burned. A large fraction of rural households in Nepal still rely on traditional mud cookstoves (TCSs), while there has been a drive to spread improved cookstoves (ICSs) and increase the use of biogas plants under various renewable-energy technology (RET) programs (AEPC, 2012). For water heating and boiling, the population in urban areas uses liquefied petroleum gas (LPG) stoves and kerosene stoves, whereas in rural areas they rely on firewood in traditional cookstoves (WECS, 2014; CBS, 2012). In the industrial sector, energy is required for thermal purposes (steam generation) and utilities through boilers, furnaces and diesel generators. The iron and steel industry in Nepal converts the imported billets into elongated rods using rolling mills that heavily consume furnace oil (FO) in a reheating furnace. The cement industries in Nepal are mostly grinding units, with 14 mine-based units equipped with rotary kilns (Pandey and Banskota, 2008). The brick kilns are mostly fixed-chimney Bull's trench kilns (FCBTKs), either with straight-firing or zigzag-firing technology, and a small fraction of clamp kilns (CKs) and the vertical-shaft brick kilns (VSBKs). A total of 609 brick kilns, whose geolocations were identified, are considered in this study, out of which 557 are FCBTKs and 52 are clamp kilns during 2011. The zigzag-firing technique is a relatively new development in Nepal. It has only been used in the brick kilns in the Kathmandu Valley, which were rebuilt after 2015 earthquake in Nepal. Kilns outside the Kathmandu Valley are slowly adopting the zigzag technique. An in-house survey of 82 brick factories in 2014 in the Kathmandu Valley showed that only 22 FCBTKs (∼25 %) had zigzag-firing technology compared to straight-firing technology. This fraction may be extrapolated to a national level to understand the number of zigzag-firing brick kilns in Nepal, although a thorough study is indeed required to furnish the actual numbers.
In commercial sector, since the activities involve energy use for electricity purposes, diesel generators are considered to be the prominent combustion technology in this sector. In the case of restaurants, a technology division similar to the residential sector is followed, with additional boilers required in tourism hotels for hot-water generation. The combustion technologies in the agricultural sector include diesel use in irrigation pumps, tractors, power tillers and threshers. Since insufficient information is available in terms of size for diesel pumps, tractors, power tillers and threshers, the fuel consumption estimates do not account for any additional factors that would have led to more accurate (new) fuel estimates in this study.
In transport sector, a total of eight vehicle categories are considered, including an off-road category for tractors and power tillers (Table 2). The tractors and tillers are attached to trailers for transportation during non-farming days. Since more than 80 % of the vehicles are imported from India, we assumed that all the vehicles comply with Bharat Stage (BS) emission standards for emission estimation. Diesel vehicles like jeeps and taxis, minibuses, microbuses, and buses are treated as public passenger vehicles, while minitrucks, pickups and trucks are treated as public freight vehicles. Around 40 % of the diesel vehicles in Nepal are categorized as superemitters or high emitters due to poor maintenance of vehicles, old vintage vehicles and a large fraction of shoddy roads (Bond et al., 2004; Yan et al., 2011; Prakash Bhave, personal communication, 2016). Further details about combustion technologies can be found in the Supplement.
2.3 Emission factors
New country-specific emission factors measured recently during NAMaSTE were especially considered in this study for sources like motorcycles, scooters, diesel generators, diesel pumps, cookstoves and brick kilns (Stockwell et al., 2016; Jayarathne et al., 2018). The measured emission factors include CO2, CH4, NOx, CO, NMVOCs, PM2.5, BC and OC, reflecting the combustion technologies and regional practice. For residential and commercial sectors, especially cooking, space-heating and water boiling activities, the emission factors were also considered and averaged from Habib et al. (2004, 2008), Smith et al. (2000), Pandey et al. (2017), and Zhang et al. (2000). For kerosene lamps, the measured EFs from Lam et al. (2012) were available for all pollutants except CH4, NMVOCs and N2O, which were considered to be similar to the kerosene stoves (Smith et al., 2000). Due to lack of studies on the definite number of types of lamps, it is assumed that 50 % of the population relies on kerosene wick lamps and that the rest rely on kerosene lanterns. For biogas lamps, all EFs were considered to be similar to biogas stoves (Table S3 in the Supplement).
For the industrial sector, technology-linked EFs were used from the EPA AP-42 repository that identified the combustion and process activities for different sources and industries (Table S4). The measured EFs for brick production were compiled from Weyant et al. (2014), Stockwell, et al. (2016), Jayarathne et al. (2018) and Nepal et al. (2019) for zigzag and straight firing in FCBTKs and clamp kilns (Table S5). For diesel generators, the recently measured EFs from the NAMaSTE campaign were considered for all pollutants except CO and SO2 (Table S6). The EF for CO was averaged from data provided in Shah et al. (2006), since among the two diesel generators measured during the NAMaSTE campaign, one apparently reflected steady-state conditions and was regularly maintained, while the other one appeared to be improperly regulated, as it provided extremely high values. The SO2 was estimated using the sulfur content of the fuel with no retention. The recently measured EFs from the irrigation pump (Adhikari et al., 2019) were also considered and averaged with NAMaSTE campaign EFs (Table S6). For mechanized tractors, power tillers and threshers, the EFs were compiled from a study that reported the EFs for off-road vehicles measured across different power capacities (Notter and Schmied, 2015).
In the transport sector, for categories other than two-wheelers, the emission factors of N2O, NOx, CO and NMVOCs were taken from Shrestha et al. (2013), who studied emissions from the on-road traffic fleet in the Kathmandu Valley using vehicle survey data and the International Vehicle Emissions (IVE) model (Table S7). The NOx emission factors for heavy-duty diesel vehicles were considered from Sadavarte and Venkataraman (2014); the EFs for Indian vehicles were modeled using the MOBILEv6.2 model. These were found to be consistent with EFs from Zhang et al. (2009) for Chinese vehicles. The PM2.5 EFs for the rest of the categories were averaged from Shrestha et al. (2013), Kim Oanh et al. (2010) and Jaiprakash et al. (2016). The NMVOC emissions from Shrestha et al. (2013) also include running evaporative emissions and reflect the real-world emissions under increasing ambient temperatures. The CO2 emission factors for all categories of vehicles other than two-wheelers were considered from a chassis dynamometer study that measured values for different vintage vehicles using an Indian driving cycle (ARAI, 2007). The fractions of BC and OC were obtained by averaging respective fractions from chassis dynamometer test results by Kim Oanh et al. (2010), Wu et al. (2015), Zhang et al. (2015), Yang et al. (2019) and Jaiprakash et al. (2016). These studies reflect the regional characteristics of driving cycles and the road infrastructure, which plays an important role in tailpipe exhaust. Kim Oanh et al. (2010) made a vintage-vehicle-based measurements showing the degradation of emissions and resultant high fractions of elemental carbon (EC) and OC in the oldest category of vehicles. However, Wu et al. (2015) and Jaiprakash et al. (2016) emphasized the importance of driving speed (on non-highways, highways and in cities) on the EC and OC fraction from diesel vehicles. SO2 emissions were calculated using the sulfur content of BS II, BS III and BS IV fuel imported from India, with no retention assumed. Non-exhaust emissions such as brake wear and tire wear are not included in this study.
3.1 National energy estimates and sectoral fuel consumption
Using the methodology described above in each sector or sub-sector and the efficiency associated with fuel–technology combination, the total national energy consumption is estimated explicitly for the base year 2011 and also for each year over the period 2001–2016.
3.1.1 National energy trend
Figure 2a and b show the proportional contributions of each sector and fuel type, respectively, to the total energy consumption in Nepal in 2011. It should be noted here that as our study focuses on technology-based emissions, we did not include the electricity (supplied by the hydropower stations) consumption in the total energy estimate. Previous studies report that the contribution of electricity to total energy in Nepal is less than 5 % (WECS, 2010, 2014). We estimate that Nepal consumed 374 PJ of energy (except hydropower, solar and wind energy, which when combined equal <3 %) in 2011, and it can be observed that the residential sector is the highest and most dominant consumer of total national energy consumption (79 %), followed by the industrial (11 %), transport (7 %), commercial (2 %) and agricultural sectors (1 %). Figure 2c shows the trend in energy consumption at the sectoral level for each year from 2001 to 2016, with a national total energy consumption of 457 PJ in 2016, an increase by a factor of 1.61 compared to 284 PJ in 2001. The majority of the energy is derived from solid biomass (including firewood, agricultural residue and dung cakes), which accounted for 91 % of the total energy consumption in 2001; this decreased to 84 % in 2016 (Fig. S5). The imported fossil fuel contributed 9 % to the national total energy consumption in 2001, which increased to 16 % in 2016.
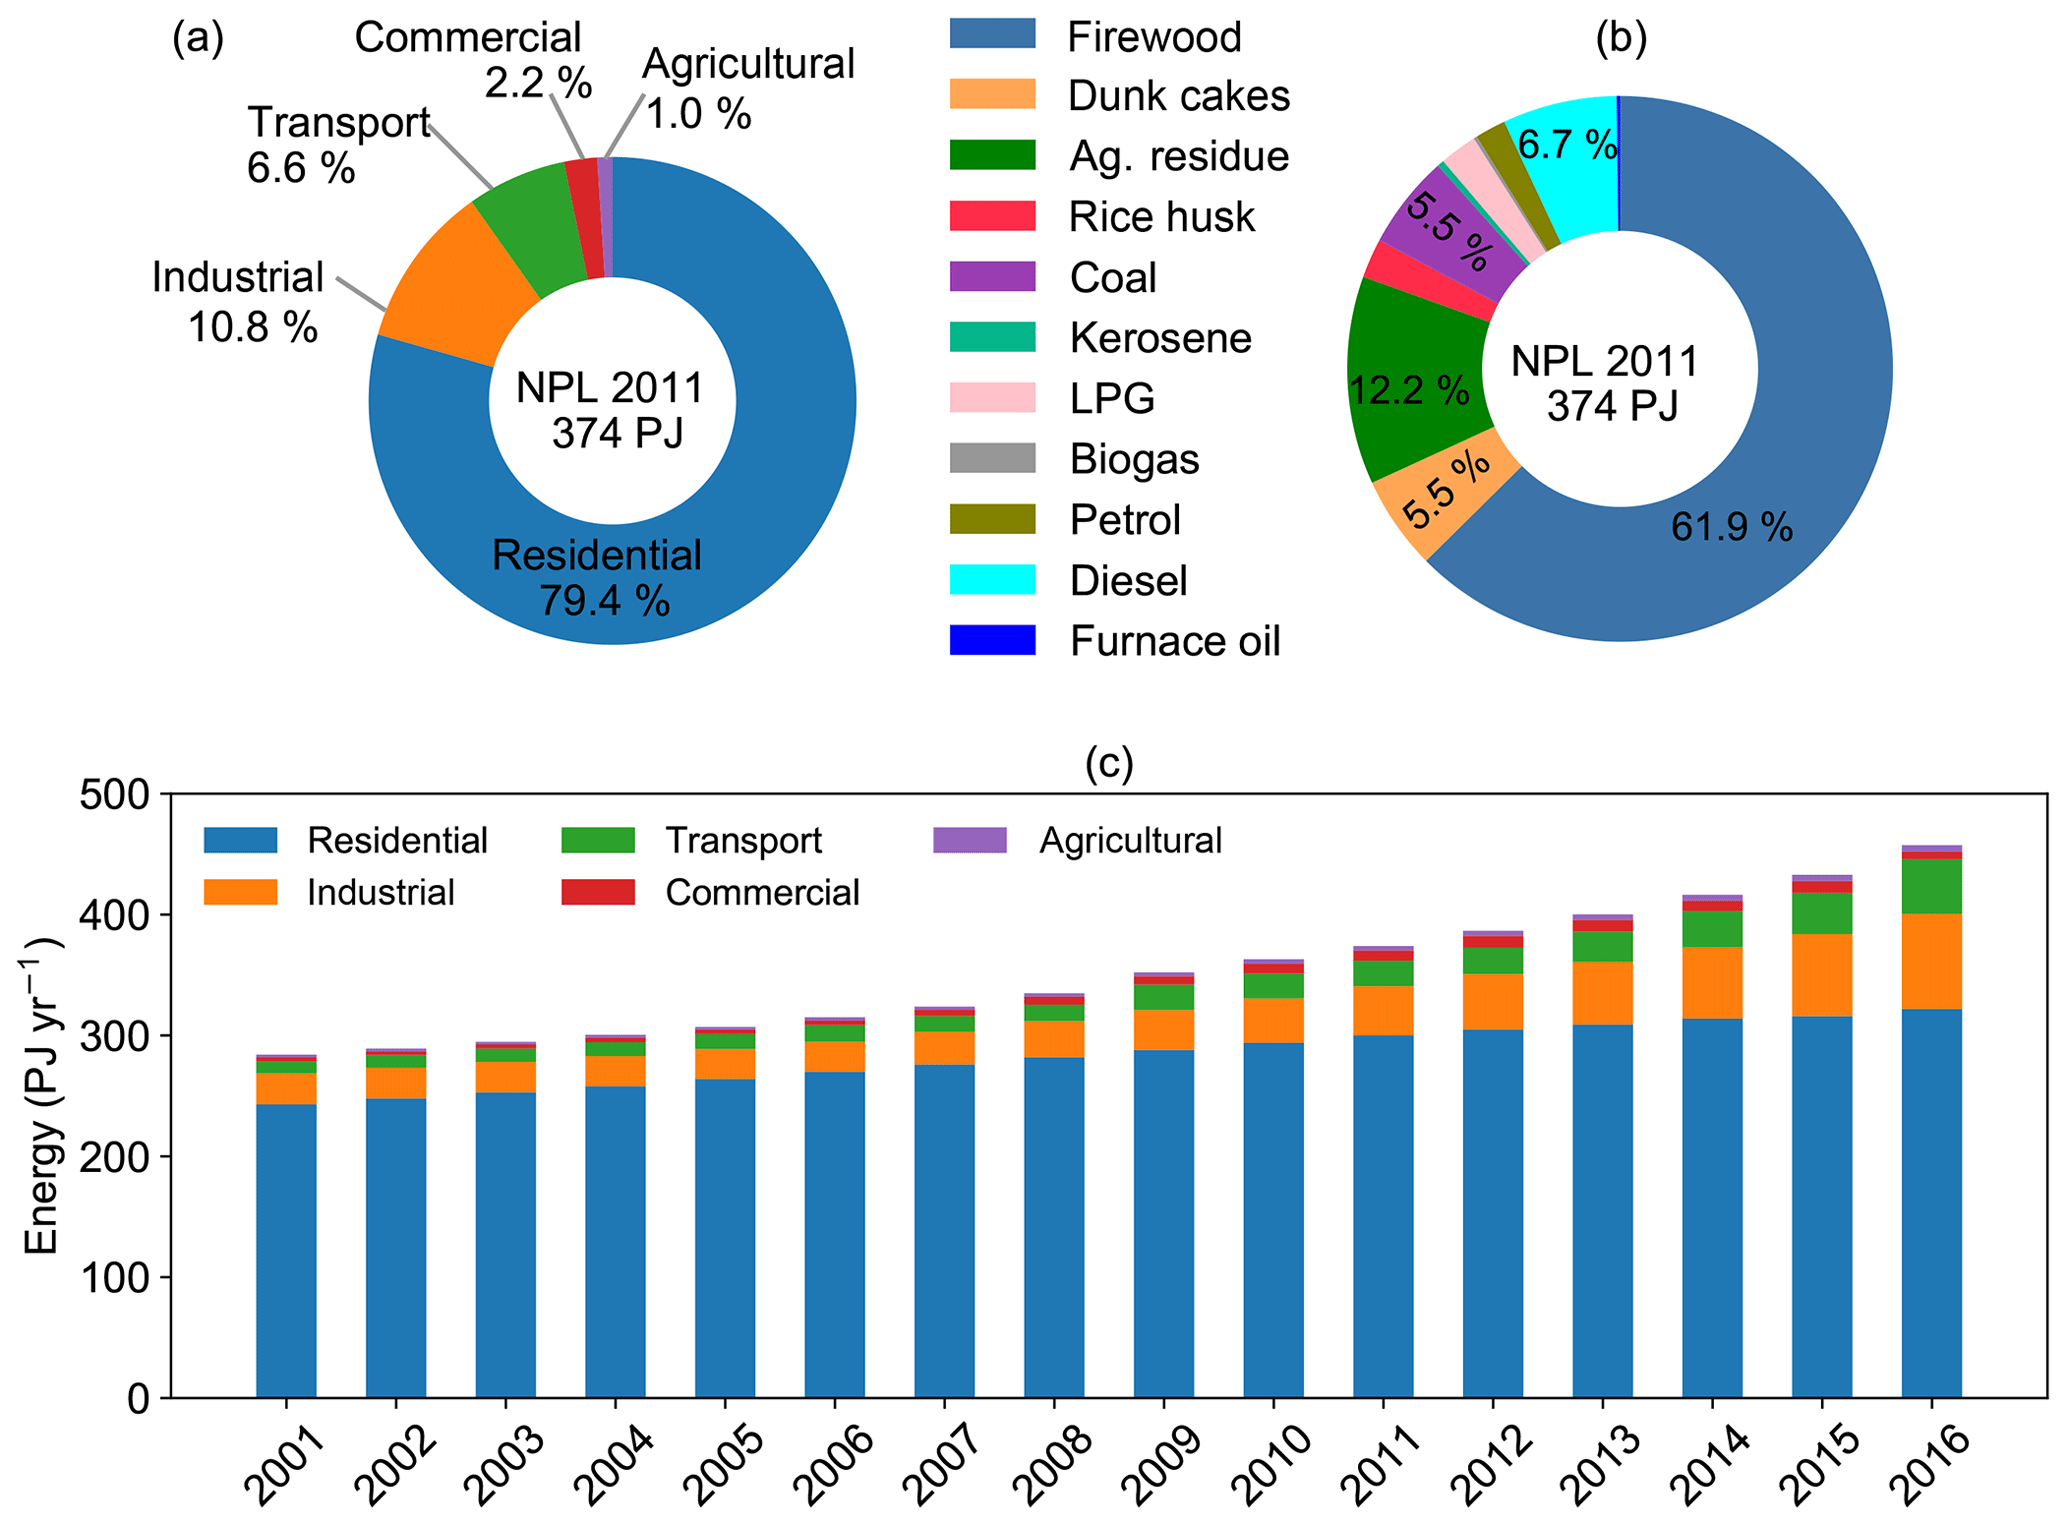
Figure 2(a) National sectoral energy consumption, (b) contribution of fuel type to national energy consumption estimated for 2011 and (c) energy consumption trend for the period 2001–2016.
The energy consumed in residential sector was estimated to be 322 PJ in 2016, higher than in 2001 by a factor of 1.32. In this sector, activities of cooking, space heating and water heating contribute to 68 %, 20 % and 12 %, respectively, of the total residential energy use throughout the analysis period 2001–2016, and a small amount is contributed by kerosene lighting. The national population almost doubled (a factor of 1.8) in the same period. There was a continuous increase in the number of households (1.27 million households) using energy-efficient ICSs until 2016 (AEPC, 2012). Also, the amount of kerosene used in 2016 for lighting reduced by 50 % compared with 2001 due to an increase in the number of households with access to electricity (5.68 million in 2016) and greater distribution of renewables like solar household lighting systems (0.6 million units until 2016; AEPC, 2012). These highly energy-efficient interventions have helped to offset the emissions; this otherwise would not have been possible.
The industrial sector consumed 79 PJ of energy in 2016, a 3-fold increase since 2001. The point-source industries consumed 77 % of the industrial energy used in 2001, which further increased to 84 % in 2016. Basically, the number of manufacturing establishments in area-source industries increased from 2163 to 2564, while that in point-source industries increased from 1050 to 1512, during the period 2001–2016 (CBS, 2014). The commercial sector consumed 6.4 PJ of energy in 2016, which is almost double (a factor of 1.8) the energy used in this sector in 2001. Along with an increase in population and number of tourists, the use of diesel in captive power generators to cope with the shortage of power supply has started becoming serious since 2006. It is the foremost source that consumed one-third of the commercial energy in 2016. During 2001–2005, the load shedding in Nepal was insignificant and ranged from 1 to 8 GWh. However, this problem increased gradually after 2006, reaching a shortfall of 1000 GWh in 2010. The load shedding worsened further from 2011, reaching a shortage of 1300 GWh in 2015. During 2016, as a result of careful power-management measures implemented by the NEA, the load shedding was reduced to 474 GWh (modeled using electricity demand, actual sales and electricity that can be supplied).
The agricultural sector, which includes mechanized farming using diesel pumps, tractors, tillers and threshers, consumed 5 PJ of energy in 2016, higher than in 2001 by a factor of 2.7. There has been a tremendous increase in the use of tractors, tillers and threshers, now consuming 4 times more diesel when compared to 2001, which is not found in the case of diesel pumps. For pumps, the diesel consumption was estimated using the agricultural productivity data and also the distribution of highly efficient kerosene-based pumps along with the use of solar pumps that have reduced the diesel usage. The transport sector, comprised of both on-road vehicles and off-road tractors and tillers, consumed 45 PJ of energy in 2016, higher than in 2001 by a factor of 4.5. This increase in fuel can be attributed to continuous increase in the total number of fleets from 0.27 million to 2.23 million during the study period (DoTM, 2016), which is estimated using the vehicle registration data and the survival function for each category of vehicle.
If the trend in national fuel consumption is analyzed with respect to 2001, it can be inferred that the import of fossil fuels has increased many times more than the increase in solid biofuels in the country (Supplement Figs. S6, S7; Table S8). The LPG consumption in Nepal has increased by a factor of 6.5 compared to consumption in 2001 mainly because a large population shifted to a cleaner fuel for cooking in this period. Even the consumption of gasoline has steadily increased by a factor of 6 due to an increase in the import of gasoline vehicles; similarly diesel increased by a factor of 4, as it was also heavily used in power generators as well as in diesel vehicles. It is interesting to observe here that there was a jump in diesel consumption in the year 2009, when there was a policy shift equating the kerosene price with diesel. This resulted in a sharp fall in kerosene consumption in 2009, which continued to fall gradually afterwards (Fig. S7). Before this policy intervention, kerosene was used as an alternative for diesel (in fuel adulteration). A low growth (a factor of 1.1–2.1) is observed in the solid biofuel used mainly due to higher distribution of improved cookstoves and cleaner fuel such as LPG for cooking and increases in renewables (e.g., biogas).
3.1.2 Comparison with WECS 2011 estimation
The national fuel and energy consumption in individual sectors estimated in this study for the year 2011 are compared with the national totals reported by the Water and Energy Commission Secretariat (WECS, 2014), as shown in Fig. 3. According to WECS, a total of 376 PJ of energy was consumed in 2011 in all forms such as hydroelectricity, thermoelectricity and other renewables; fossil fuels; and solid biofuels. However, a 1 : 1 correspondence for each activity and type of fuel is made while comparing the energy, which shows 374 PJ of fuel energy estimated in this study against 329 PJ (energy consumed in combustion activities) by WECS. In the present study, a slightly higher amount of energy consumption in the residential sector (300 PJ) can be observed compared to the WECS estimate of 265 PJ, which can be attributed to the inclusion of agricultural residue as a fuel for cooking that was not considered in the WECS estimate.
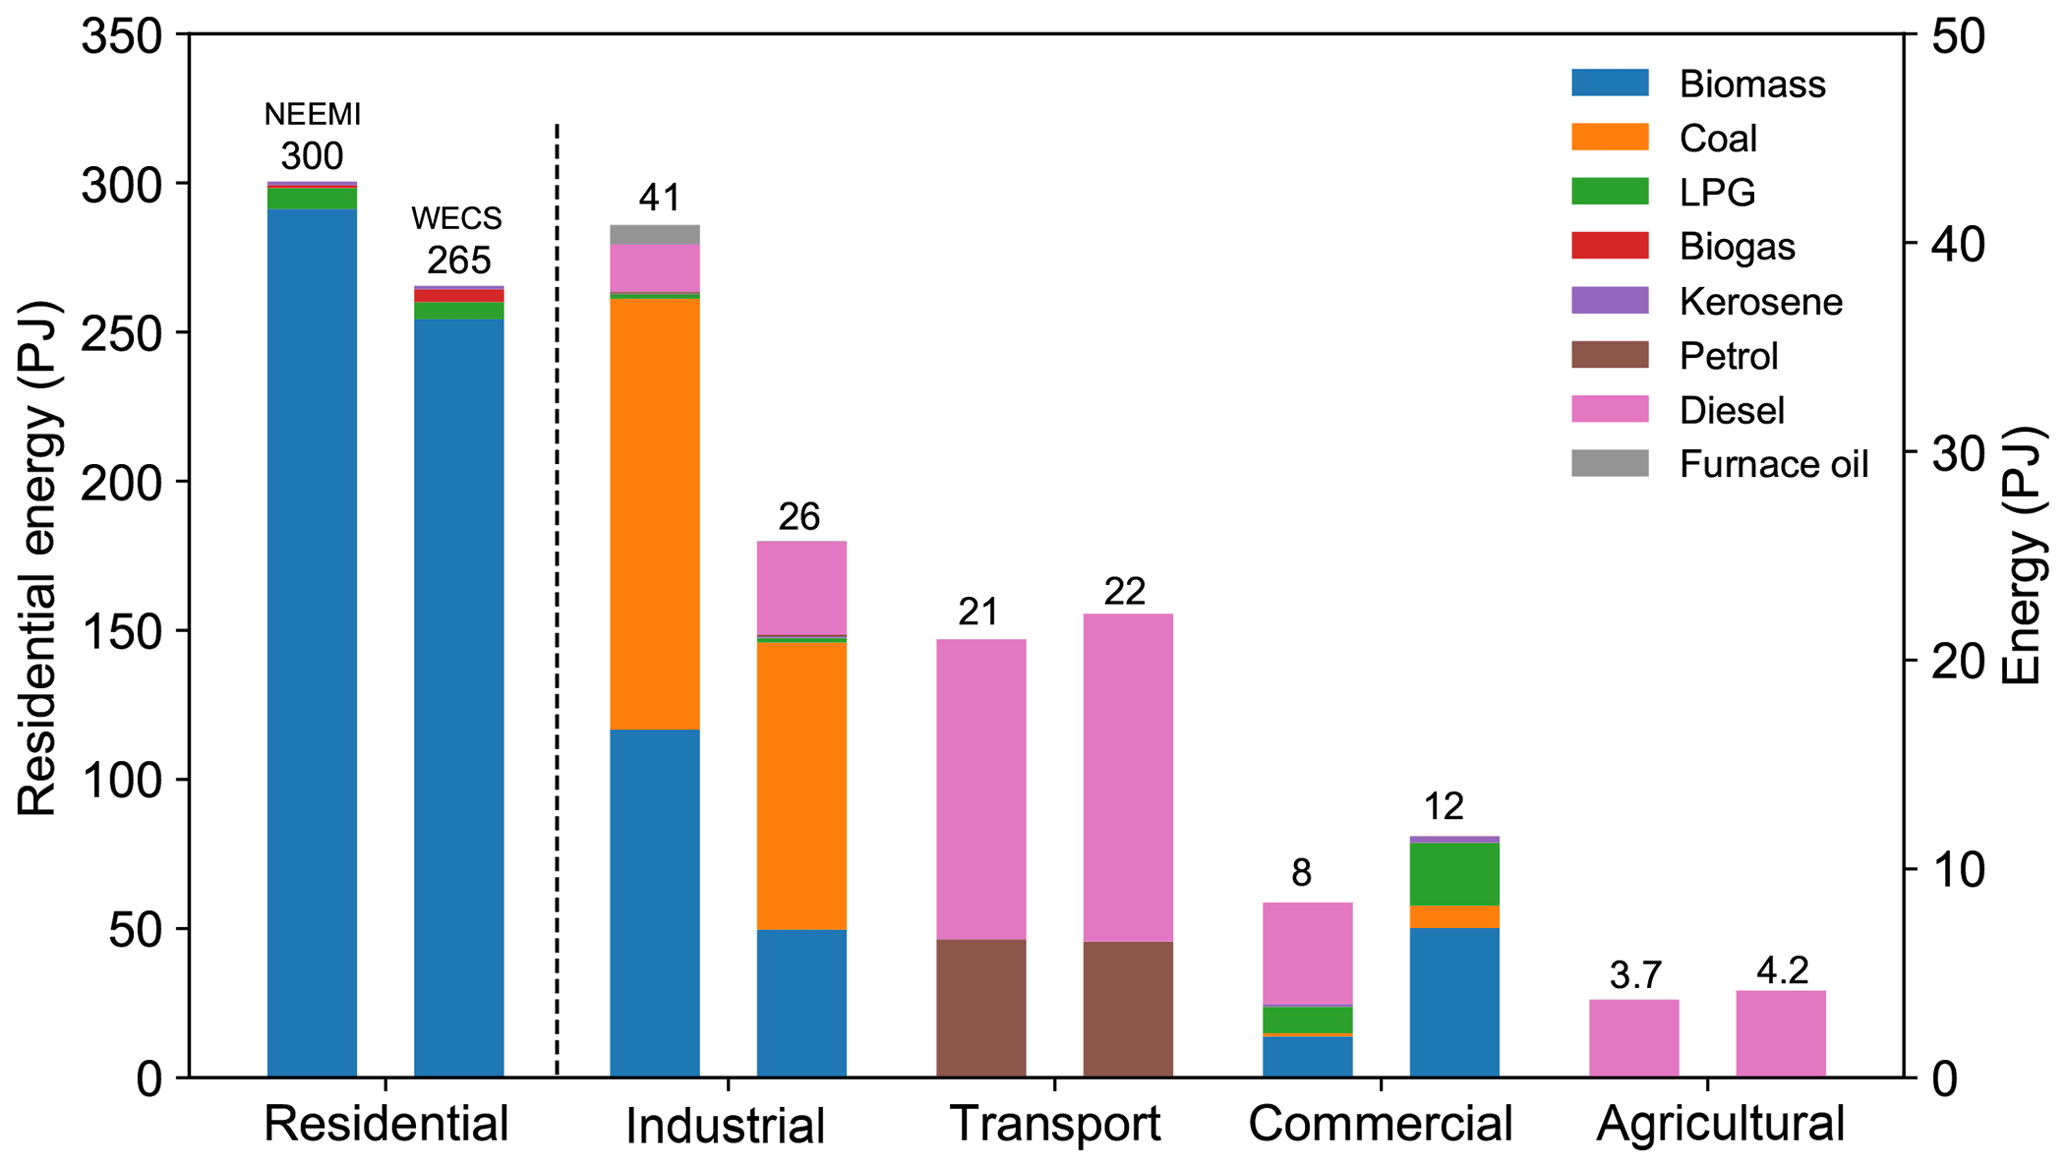
Figure 3National energy consumption estimated for 2011; this study compared with WECS estimates. Residential sector (on left y axis) and industrial, transport, commercial and agricultural sectors (on right y axis).
In industrial sector, the present study estimates 41 PJ of energy consumption, which is 59 % higher than that reported in the WECS report (26 PJ). This difference is attributed to biomass in the form of rice husk being taken into account in this study as boiler fuel in the paper, sugar, alcohol, soap and noodle industries (PACE Nepal, 2012) using SEC. Similarly, consumption of coal in brick production and cement manufacturing was also corrected using SEC. Apart from these fuels, the FO use in the metal industry and captive power generation was completely missing in the WECS detailed fuel and energy consumption data, which are considered in this study. Basically, the Nepal Oil Corporation (NOC) is an authorized agency to import fossil fuels (consisting of kerosene, gasoline, diesel and LPG, and FO), which are made available through public distribution system. However, in recent years, FO was also imported as an industrial fuel by private importers, without being recorded by the NOC, and was hence not reported under import statistics by the NOC. Therefore, the FO reported in this study accounts for the total import available from the foreign trade statistics report which was not accounted for by the NOC (MoF, 2012) and WECS report.
The energy consumption in commercial hotels and restaurants was estimated using energy consumed per room and energy per capita, as described in Sect. 2.1. Our energy estimate was lower compared to the WECS by a factor of 0.73. This difference can be explained by higher use of firewood (factor 3.6), LPG (factor 2.4) and kerosene (factor 2.6) in the WECS estimate. The commercial sector also relies on diesel generator sets during load-shedding hours, which seems to be completely missing in the WECS estimate. An energy value of 4.6 PJ of diesel was estimated in generator sets, which accounts for 58 % of the energy consumed in the commercial sector in 2011.
In the agricultural sector, the amount of diesel consumed for irrigation pumps, tractors, power tillers and threshers is in agreement with WECS estimates. In transport sector, the energy estimated in this study was 5 % lower than the WECS estimate, especially in diesel vehicles. For gasoline vehicles, the alpha (α) and L50 were modeled using the registered population for two-wheeler motorcycles and age distribution from Shrestha et al. (2013), while the remaining gasoline was distributed among four-wheeler cars (due to non-availability of the age distribution) closing the annual consumption, thereby being similar to amount of gasoline reported in the WECS report. The on-road and off-road diesel vehicle fleet was modeled using a logistic function chosen that was similar to that of Indian vehicles (Pandey and Venkataraman, 2014) except for buses, for which the age distribution was available from Shrestha et al. (2013).
3.1.3 Kathmandu Valley and Nepal
The Kathmandu Valley is a highly urbanized area and more advanced than the rest of the country and varies significantly in energy-use patterns and their respective emissions. The following section compares energy consumption in the Kathmandu Valley (KTM) and Nepal (NPL) during 2011 across different sectors and fuel types. Figure 4a and c show the estimated total energy consumption in KTM as 30 PJ, which is 8 % of the national energy (374 PJ). In the Kathmandu Valley, the residential sector contributes to 41 % of the total energy, followed by transport (26 %), industry (22 %) and commercial use (10 %), with a small energy fraction in the agricultural sector; in comparison, these do not resemble the national energy consumption pattern across these sectors.
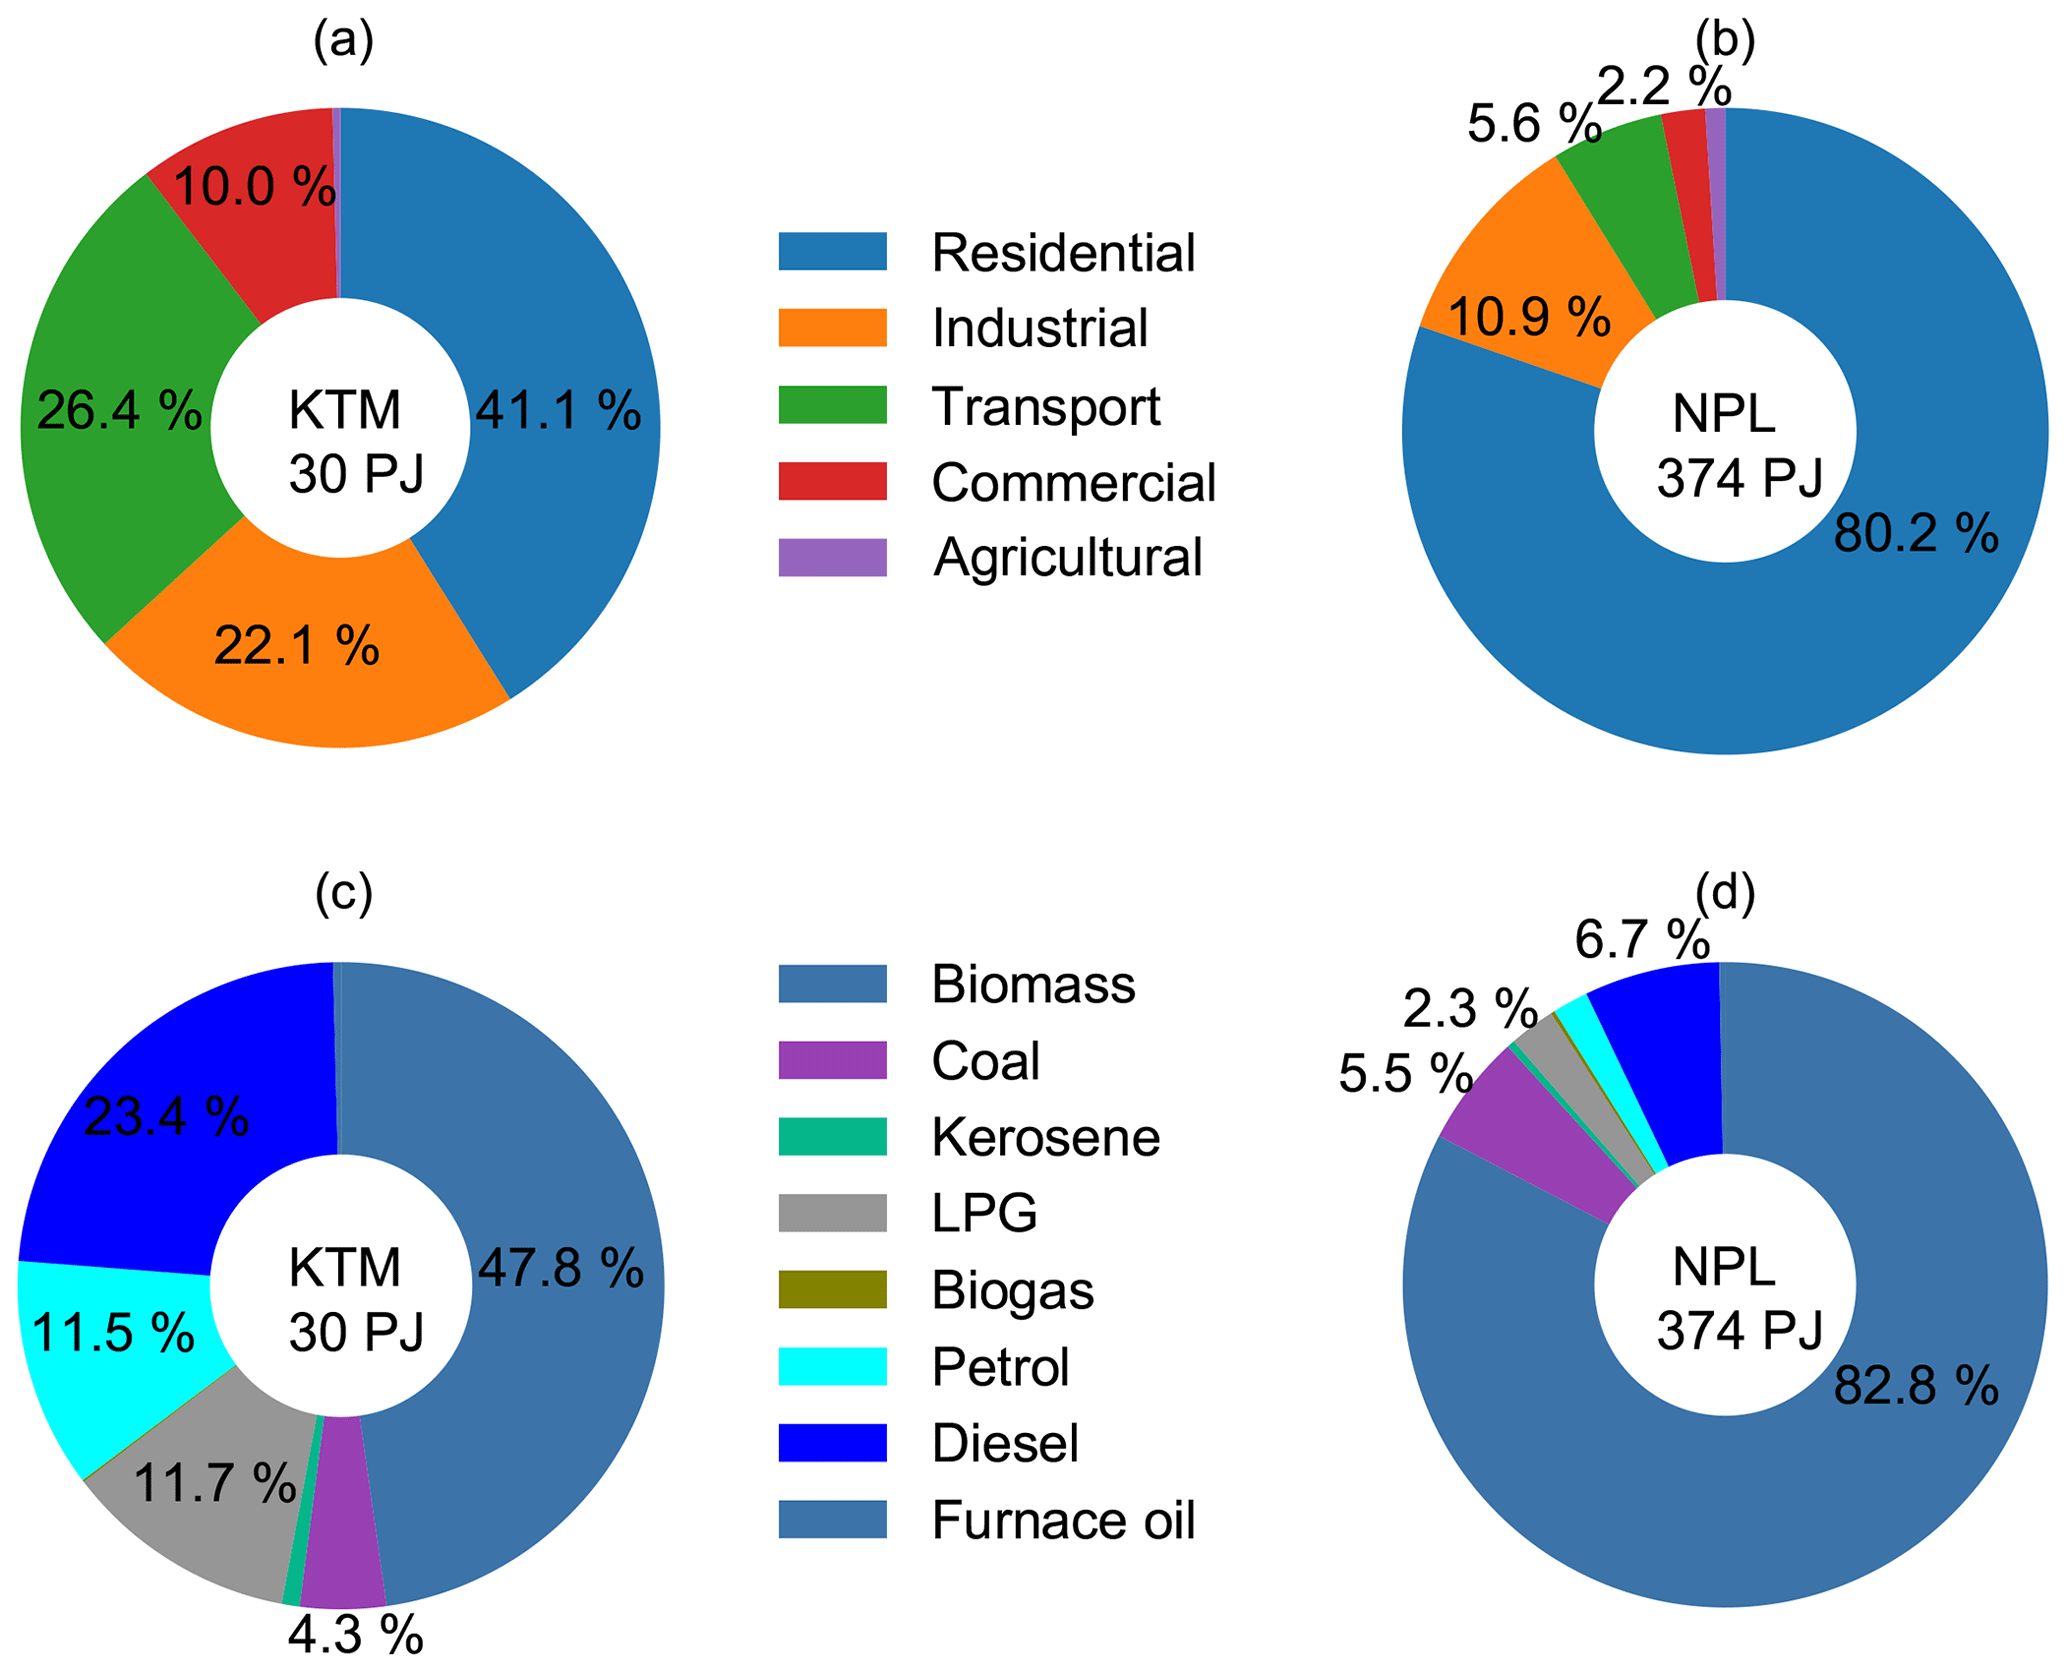
Figure 4Energy consumption comparison at sectoral level for the Kathmandu Valley and Nepal in (a) and (b) and for different fuels (c) and (d) for year 2011.
The intensity of activity rates within the Kathmandu Valley is different from the whole country. If the sectors are disaggregated further, it is found that the residential sector in the Kathmandu Valley consumes 73 % solid biomass, 27 % LPG and a small fraction of kerosene, while all of Nepal consumes 98 % solid biomass and 2 % LPG. The Kathmandu Valley is home to only 10 % of the national population, where 84 % of the households use LPG for cooking versus 21 % of households nationwide. Such a high LPG consumption rate in the residential sector leads to 41 % of the national consumption in the Kathmandu Valley alone. Also in the case of lighting sources in the Kathmandu Valley, 98 % of households use electricity as the primary source, with only 1 % kerosene users; this is different from only 67 % households using electricity and 18 % using kerosene in Nepal.
Nearly one-fourth of manufacturing establishments (947 out of 4067 industries) in Nepal are located in the valley, which includes 109 point-source industries (including 76 brick manufacturing units reported in the CME 2011 report) and 838 area sources. From the commercial sector, 503 tourist hotels, 363 academic campuses, 394 financial institutions and 78 hospitals are in the Kathmandu Valley out of 817 tourist hotels, 1101 academic campuses, 1245 financial institutions and 143 hospitals in Nepal. The use of diesel and LPG, especially in tourist hotels, and diesel generator sets in the Kathmandu Valley makes a huge difference in the fuel fraction. Approximately one-third of the energy in transport sector is consumed by vehicles registered in the Bagmati Zone alone. Around 30 % of the national vehicles are registered in the Bagmati Zone, which encompasses three districts in the Kathmandu Valley. This represents 50 % of the national gasoline consumption and 27 % of the national diesel consumption in the valley.
In 2016 the Kathmandu Valley consumed 51 PJ of energy, which is higher than 2011 by is a factor 1.7, with an increase in energy use mainly from the industrial and transport sector (Fig. S8). In spite of an increase in population, the residential sector saw growth in the use of energy-efficient renewable technologies and cleaner fuels (e.g., LPG); these did not cause a large increase in 2016 energy use compared to 2011. Similarly, the increase in production by point-source industries and vehicle registration led to an increase in the sectoral energy in these two sectors by a factor of 3 and 2, respectively. The energy (fuel-based) in the commercial sector reduced by 50 % due to a reduction in load shedding, ultimately decreasing the diesel consumption by small but numerous captive diesel-power generators.
3.2 Emission trends and sectoral contribution to national estimates
The emissions were estimated for 10 pollutants, namely CO2, CH4 and N2O (GHGs); NOx, CO, NMVOCs and SO2 (trace gases); and PM2.5, BC and OC (aerosols), using technology-linked EFs in each sub-sector. The following section explains the emission estimates for 2011 in each sector and sub-sectors (Fig. 5a) and the emission trends (Fig. 5b) in order of aerosols and their precursor, trace gases and greenhouse gases. The emissions discussed henceforth refer to the estimates from the sectors and source categories described above and do not account for the complete national totals, which will also include emissions from Part II of this work.
In 2011, 195 Gg of PM2.5, 23 Gg of BC and 83 Gg of OC emissions were estimated from five energy-use sectors. Similar to the total energy consumption pattern, the residential sector contributes to the highest share of particulate emissions (95 % PM2.5, 88 % BC and 96 % OC). Within the residential sector, the activities of cooking and space heating are responsible for ∼75 %–90 % emissions of PM2.5, BC and OC. Additionally, BC emissions are also emitted from residential kerosene lighting (4 %) that makes use of cotton-wick kerosene lamps and kerosene lanterns. Industrial sources contribute to ∼3 % of PM2.5, ∼5 % of BC and 1 % of OC emissions, with significant emissions from brick kilns (FCBTKs) and the use of firewood and rice husk in industrial furnace of sugar, beverages, noodles and other small industries. From the total of five sectors, the transport sector contributes to only 1.4 % of PM2.5, ∼6 % of BC and 1 % of OC emissions, largely from diesel freight and public passenger vehicles; 40 % of fleets are assumed to be superemitters or high emitters, and they contribute to 53 % PM2.5, 58 % BC and 44 % OC emissions from the transport sector. Their emission factors were derived by scaling the normal emission factors, as discussed in Sect. 2.3. The scaling factor was derived from Klimont et al. (2017), who provided the global values for diesel and gasoline vehicles across different emission standard vehicles, and also based on PM emission factors measured in developing countries (Subramanian et al., 2009). On average, light duty diesel vehicles are scaled by a factor of 5 to get a value of 8.1 g kg−1, and on average heavy-duty diesel vehicles are scaled by a factor of 2 to get a value of 13.3 g kg−1 for superemitter vehicles. However, there is no clear distinction for measured emission factors for a superemitter vehicle, and many contemporary studies have derived it using statistical percentile (Subramanian et al., 2009; Ban-Weiss et al., 2009). If a policy to identify and remove the superemitters is enforced, this would reduce ∼30 % of PM2.5, BC and OC transport-sector emissions, which can be considered to be a good and immediate policy target. The emissions from agricultural sector contributed to small fractions of 0.2 % for PM2.5, 0.4 % for BC and 0.3 % of OC, since the energy consumption in mechanized activities is small compared to national energy estimates.
Emissions of 24 Gg of SO2, 64 Gg of NOx, 1714 Gg of CO and 407 Gg of NMVOCs were estimated in 2011 from the sectors discussed in this part of the work. However the total national values will also include emissions from the second part of the study (NEEMI-Open). The SO2 emissions were estimated using the sulfur content of the fuel with no retention in liquid and gaseous fuels. The industrial sector contributed 75 % of SO2 emissions, especially from the coal users such as brick kilns and cement manufacturers. The residential sector is the second largest gross emitter of SO2, adding 24 % to the total of the five sectors and ∼0.5 % each from the commercial and transport sectors. In the case of NOx emissions, the residential sector overshadowed all other sectors and contributed significantly, being responsible for 53 % of NOx, 91 % of CO and 94 % of NMVOC emissions. Residential cooking, space heating and water heating are the major sources of incomplete combustion of biomass fuels and hence high CO and NMVOC emissions. After residential emissions, the transport sector contributes 23 % of NOx emissions. High NOx emissions were emitted by diesel passenger (9 %) and freight vehicles (11 %). The industrial sector was responsible for 17 % of NOx, 2 % of CO and 0.6 % of NMVOC emissions. The clinker production in cement industries has a large share of NOx emissions, which was about 60 % of the total point-source industries. The fugitives of NMVOCs from storage tanks, service stations are expected to be a small fraction compared with combustion-related NMVOC emissions; though they might gain importance in the future, they will be considered in detail in the second part of this study. A total of 8.9 Tg of CO2, 110 Gg of CH4 and 2.1 Gg of N2O was estimated in this work. Broadly, fossil fuels and biofuels (firewood, agriculture residue, dung cakes and biogas) contribute 73 % and 27 %, respectively, of CO2 emissions in 2011, in contrast to only 12 % (43 PJ) of the energy coming from fossil fuels and 88 % (331 PJ) from biofuels, since fossil-fuel combustion moves CO2 from the long-term fossil reservoir into the atmosphere, while biofuels are mostly recycled from recent biomass (though they include some long-term removal of net biomass, which is a small relative source to the atmosphere). As a sector, industry contributed to 46 % of the combustion-based CO2 emissions, followed by the residential (32 %) and transport (15 %) sectors, with small fractions from the commercial (4 %) and agricultural (mechanized farming; 3 %) sectors. Even though the residential activities are the main drivers of the national energy, consuming 292 PJ of biofuels and 8 PJ of fossil energy, almost 92 % of the CO2 emissions from biofuels are from recycled carbon, with the non-recycled fraction being about 10 % firewood, 10 % agricultural residue and 0 % dung cakes (see Supplement Sect. S4). The CO2 emissions from the industries are mostly driven by fossil-fuel combustion (98 % fossil fuel and 2 % biofuel), especially coal use in the production of bricks (27 %) and process emissions (53 %) from cement manufacturing.
Figure 5b shows the normalized trend in emissions with respect to 2001. Overall there is an increase in emissions by a factor ranging from 1.2 for species like CH4, PM2.5 and OC to a factor of 2.3 for CO2 and 2.2 for NOx between 2001 and 2016. The change in slope and increase in CO2 and NOx emissions can be explained well by a sharp increase in the import of petroleum fuels like LPG, petrol and diesel after 2008. The emissions of PM2.5, BC, OC, NMVOCs and CO have increased by a factor of 1.2–1.7 with a steep slope. A dip in the SO2 emissions in 2006 can be explained by low coal consumption in brick factories as reported by CBS (2008) and the decreasing sulfur content in imported petrol and diesel, namely a decrease from 500 mg sulfur per kilogram of fuel (BS II norm until 2005) to 50 mg sulfur per kilogram of fuel (BS IV norm from 2011 onwards). The increasing trend in PM2.5, OC, NMVOCs and CO follows the increase in energy use in the residential sector with a steep slope due to less fuel consumption in improved cookstoves.
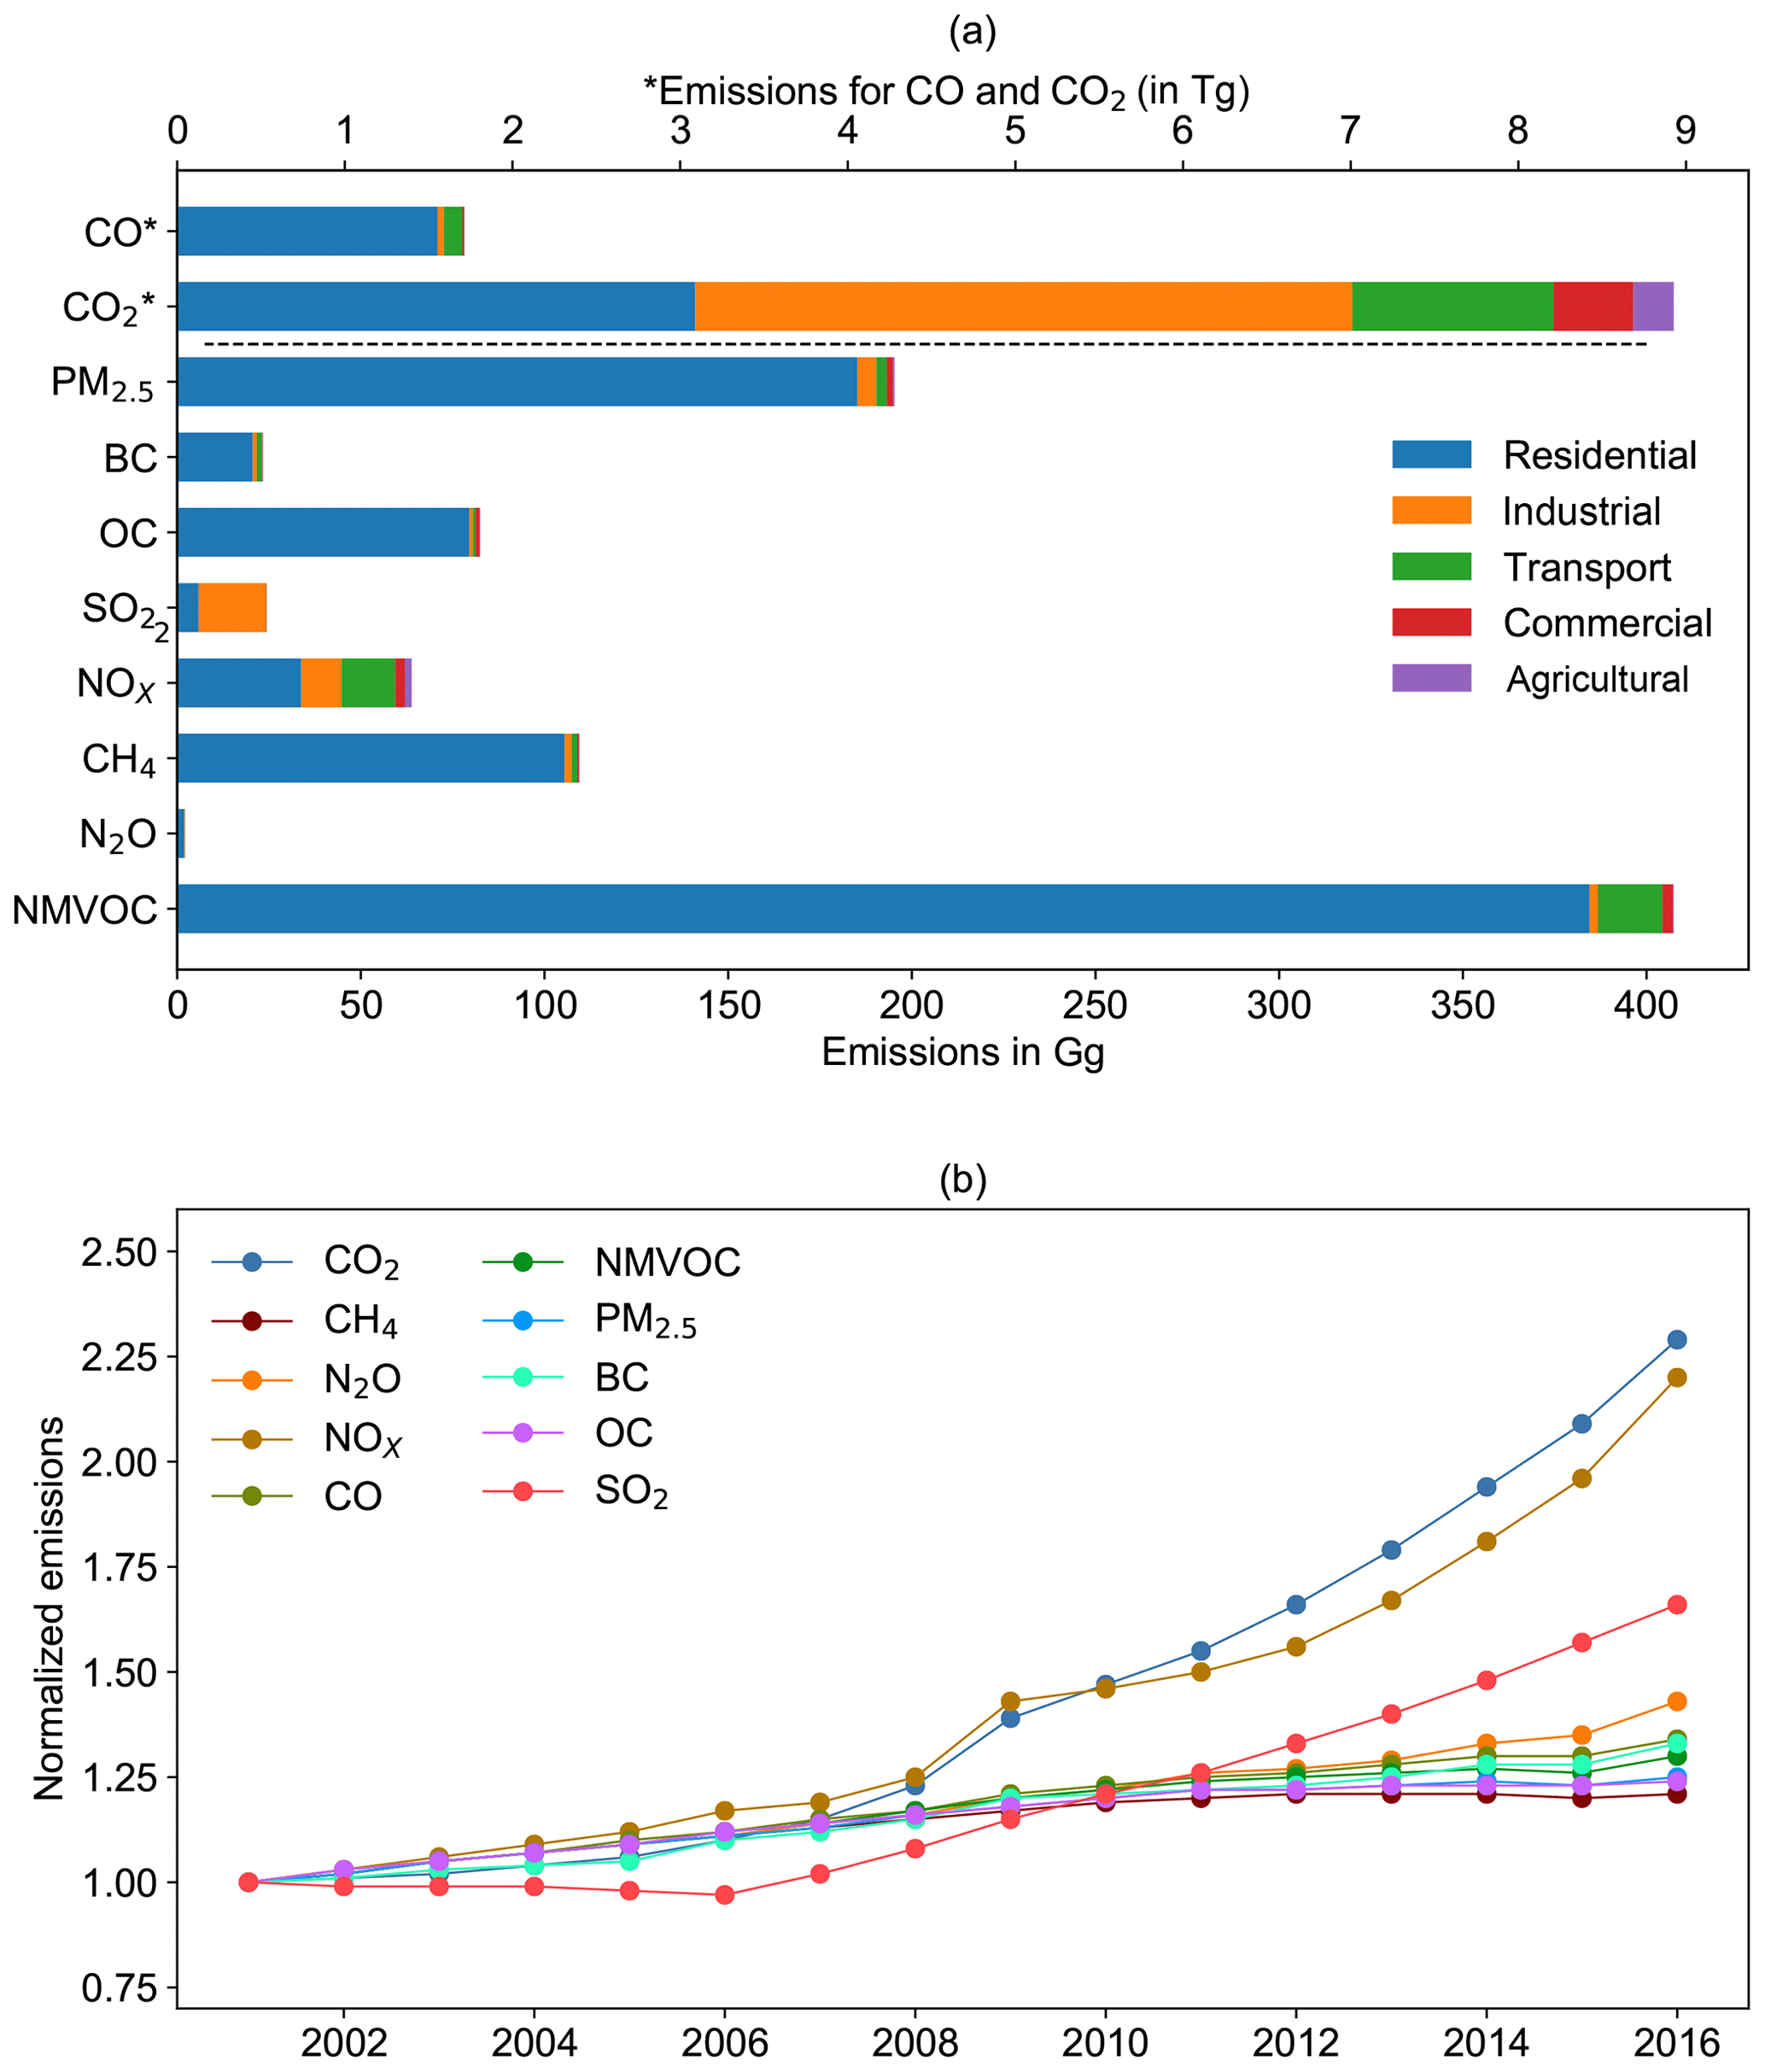
Figure 5National emission estimates for aerosols and trace gases for (a) each sector in 2011 and (b) normalized trends for the period 2001–2016.
3.3 Technology-based emission estimates
The emissions are characterized for 36 different combustion technologies using their respective emission factors. The following section describes the top six combustion technologies and their overall contribution to the 2011 emission estimates of aerosols, ozone precursors and greenhouse gases from the five energy-use sectors.
For primary particulate matter, the top six combustion technologies correspond to 95 % PM2.5, 91 % BC and 97 % OC. The high PM2.5 emissions are estimated from use of firewood, dung cake and agricultural residue in traditional cookstoves; burning of wood and dung cakes for space-heating activities; and fuel in brick kilns (Fig. 6). Similar combustion technologies are found with high OC emissions (Fig. S9). Various national and international organizations have promoted the use of ICSs, which are energy-efficient stoves that promote improved air quality and health co-benefits. So far, 1.26 million ICSs distributed during 2000–2011 are considered in this study, which have contributed to reductions of 13 % for PM2.5, 12 % for BC and 13 % for OC emissions compared to the emission scenario without ICS distribution. In the case of BC, apart from above combustion technologies, high amounts of BC are also emitted from kerosene lamps (3.5 %). The information on emission control measures used in industries is not readily available. Given poor implementation of policies in Nepal on emission control measures, we expect that most of the industries are operated without proper emission control measures. However, the installation of stack emission control technology in the power plants and industrial boilers will become a reality sooner or later. This is likely to change the emission profile, such as shares of BC and OC in PM2.5, and the size of particles emitted, which needs to be considered in future emission estimates.
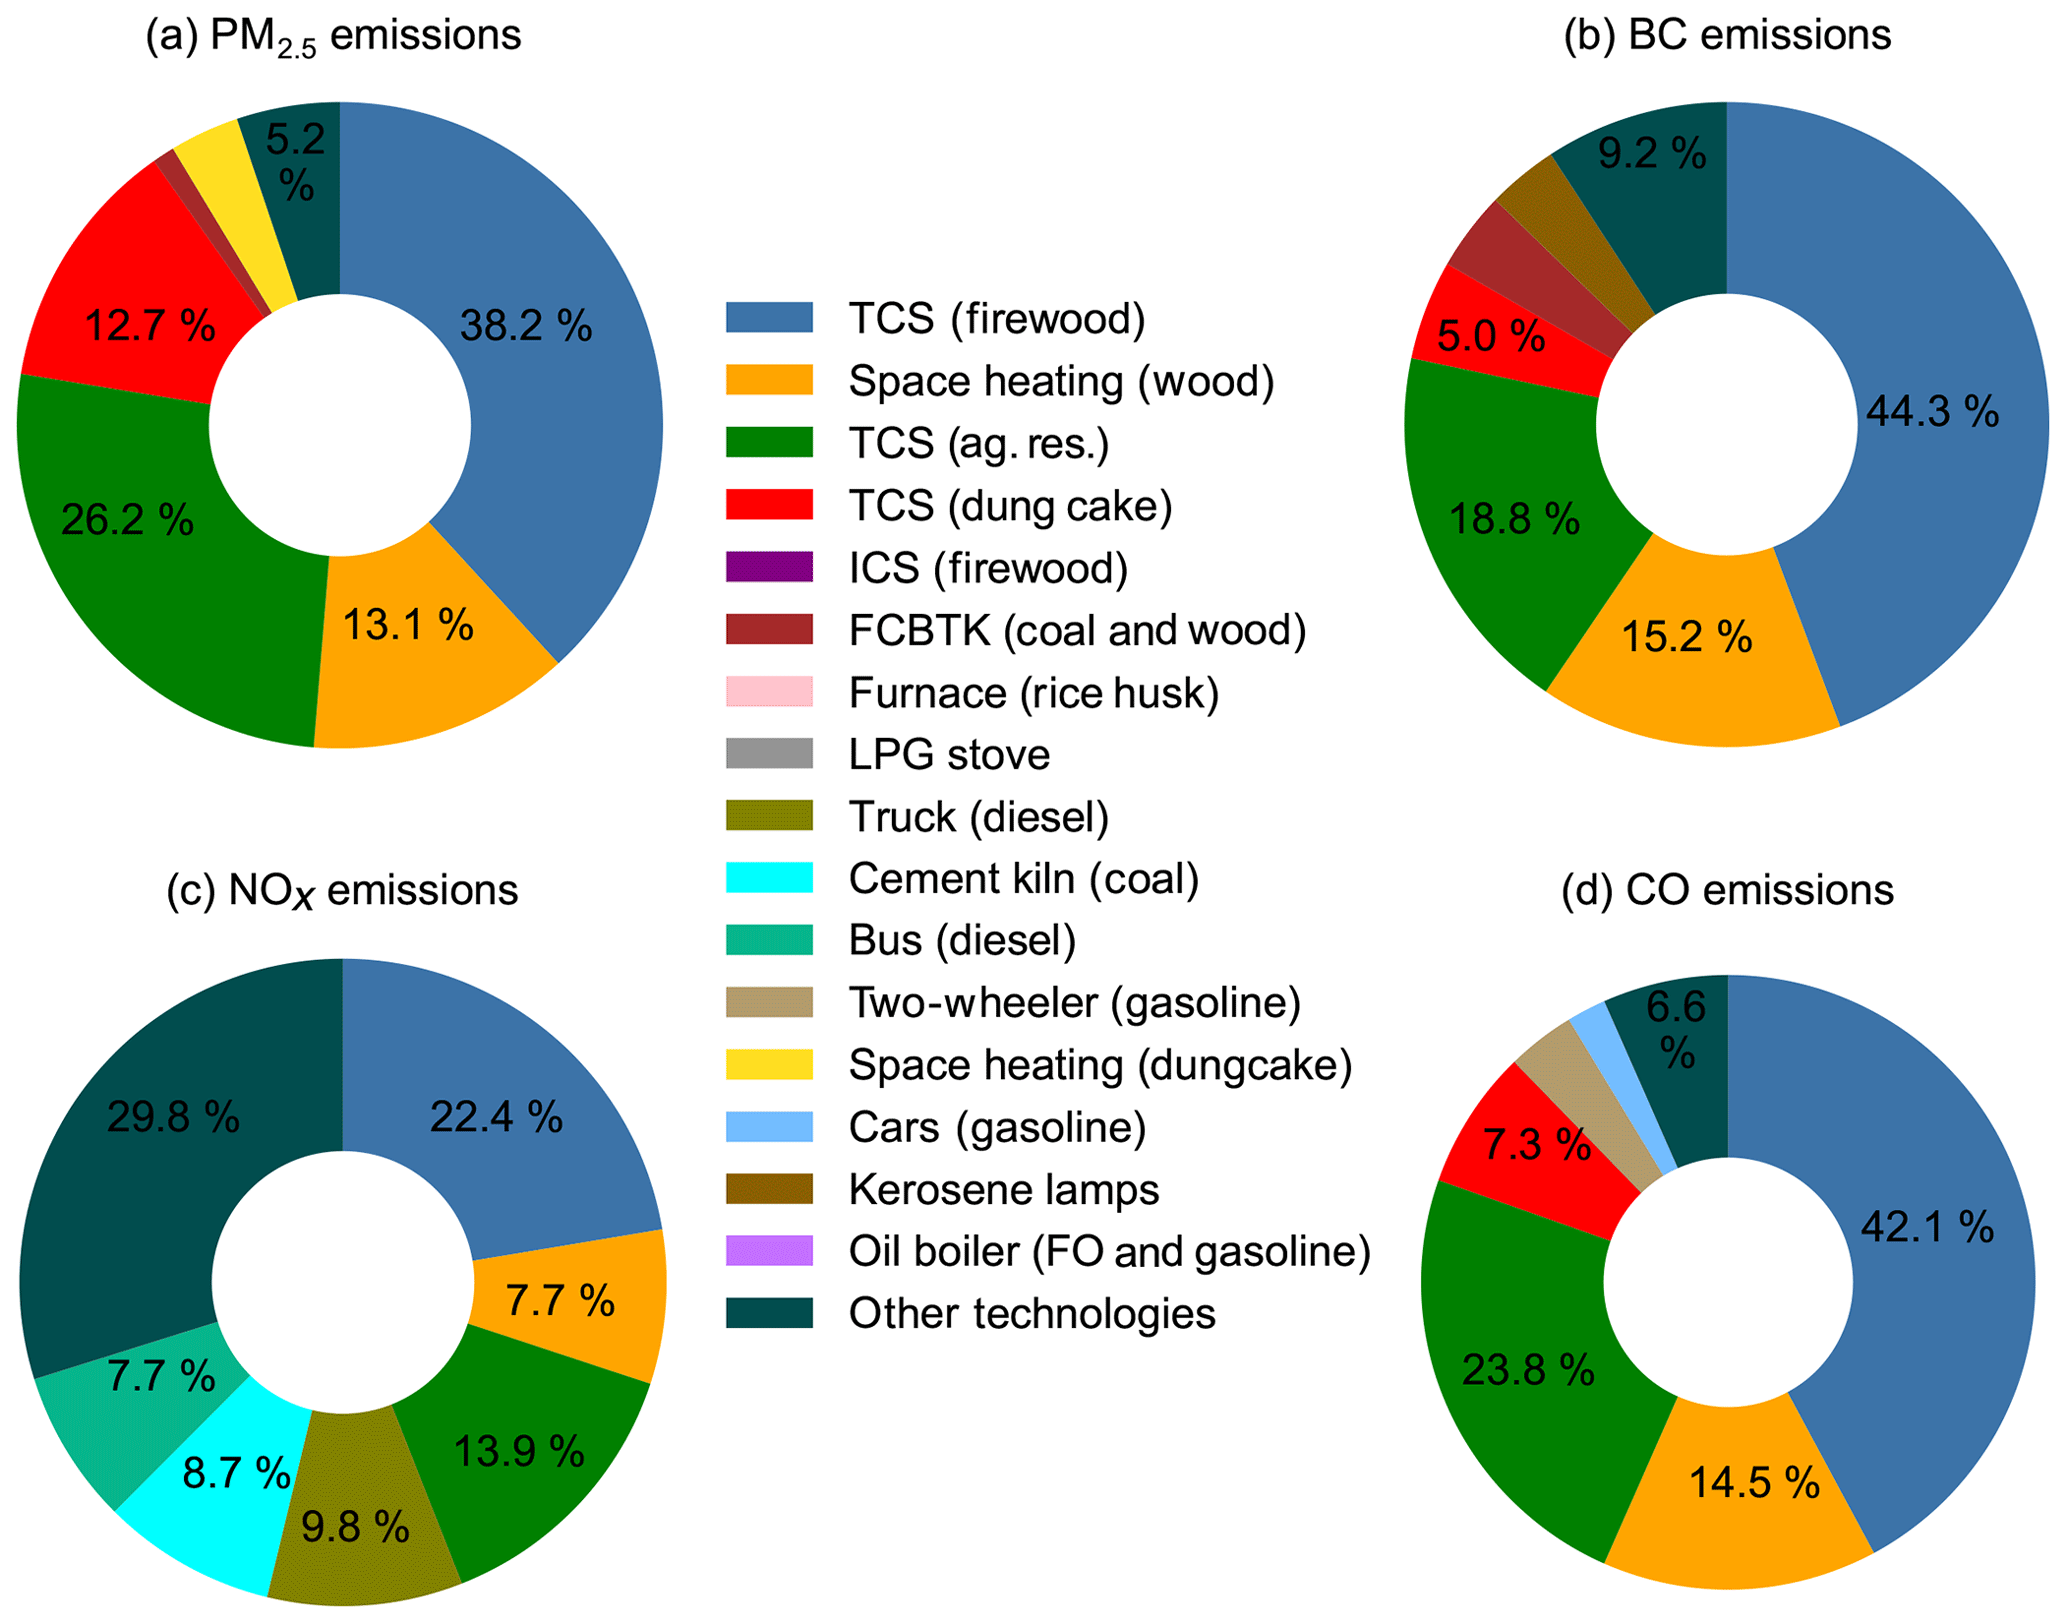
Figure 6Top six polluting technologies contributing to (a) PM2.5, (b) BC, (c) NOx and (d) CO emissions.
In the case of ozone precursors, apart from residential and industrial sectors, we start to observe the increase in polluting technologies from transport sector, too. Combustion technologies using biomass emit 44 % of NOx, while heavy-duty diesel passenger (buses) and freight (trucks) vehicles emit 17 % and cement kilns 9 %, which accounts for 70 % of the estimate from sources in this part of the study (Fig. 6). CO, a tracer of incomplete combustion, is largely emitted from TCSs using biomass, contributing to 73 % of emissions, while 14 % is emitted from the burning of wood for space heating. Gasoline two-wheeler vehicles also contribute to 3.6 % of CO; this aggregates to 93 % of the total of the five sectors. Recent years have seen a sharp increase in use of two-wheeler vehicles, with about 1.03 million two-wheelers registered by 2011 (2.18 million by 2016) nationwide; these vehicles are estimated to consume 113 million liters of gasoline. NMVOC emissions are completely driven by the combustion of biomass in every form of fuel in TCSs, and also in ICSs, which contribute 94 % of the total NMVOCs. Replacing 1.26 million TCSs with ICSs has reduced NMVOC emissions by 15 % in the residential sector. The coal-combusting technologies like FCBTKs and cement kilns emit about 69 % of SO2, followed by 19 % from traditional stoves using firewood, dung cakes and agricultural residue and 2 % from oil boilers, amounting to 90 % from the top six polluting technologies.
High CO2 emissions (considered after non-renewability factor, explained in detail in Supplement Sect. S4) are largely driven by high energy consumption in cement kilns (27 %), TCSs using wood (15 %), brick kilns (11 %), LPG stove users (6 %), diesel trucks (5 %) and wood burning in space heating and diesel trucks (5 %), making up 70 % of the total estimate. Only pyrogenic emissions are considered for analysis, and, hence, the CH4 and N2O emissions follow the top polluting technological trends, similar to PM2.5, CO, NMVOCs and OC, i.e., in cooking and space-heating activities. For OC, SO2, NMVOCs, CH4, CO2 and N2O, see Fig. S9 in the Supplement.
3.4 Emission comparison
3.4.1 Regional and global emission inventories
In the present study, NEEMI-Tech emissions are compared with the Asian anthropogenic MIX (emission source: Nepal emissions reported in Li et al., 2017) emission inventory which was prepared for the Model Inter-Comparison Study for Asia (MICS-Asia) and the Task Force on Hemispheric Transport of Air Pollution (TF HTAP) projects (Li et al., 2017); 1 : 1 correspondence for sectors and activities is considered when making the comparison. Table 3 shows the total emission ratios of NEEMI to MIX in 2010. It is observed that the NEEMI estimates lower emissions of NOx (0.75), CO (0.80), BC (0.90), OC (0.77) and SO2 (0.78), while CH4 (1.21), N2O (1.35), NMVOC (1.06) and PM2.5 (1.38) emissions are higher than the MIX estimates. This difference in emissions can be explained by the underlying assumption of fuel allocation and the EFs in each sector. Since the MIX inventory for Nepal was reproduced using the REAS 2.1 (emission source: https://www.nies.go.jp/REAS/, last access: 25 August 2019), the following analyses have compared the REAS 2.1 2008 sectoral emissions with NEEMI 2008 emissions to explain the difference in emissions (Table S9). In both the inventories, the residential sector dominated all the emissions, emitting more than 90 % of the total estimate, which identifies it as the single most influential sector for causing low ratios for NOx, CO, BC, OC and SO2. Further the EFs for biomass burning in the residential sector in MIX and NEEMI were investigated, and it was found that the ratio of NEEMI to MIX weighted average EF was 0.89 for NOx, 0.88 for CO and 0.22 for SO2. However, for BC the weighted average EF in NEEMI was 1.1, a factor higher than MIX, and for OC the EFs were similar. Moreover, the REAS 2.1 inventory was also compared for 2001–2007, delineating similar ratios to those found in 2008 (Fig. 7). This shows the use of invariant emission factors and other underlying assumptions for different timescales in REAS 2.1, with an increase in fuel consumption from 2001 onwards, while the resultant SO2 emission factor in NEEMI reflects the timely improved sulfur content of diesel and petrol. Apart from the difference in emission factors in biomass fuel, the contribution from the industrial sector is weakly estimated for NOx, BC and SO2 in REAS, which is 4.5 %, 1.3 % and 20.6 % compared to 14.6 %, 7.9 % and 71.7 % in NEEMI. This concludes that the difference in emissions is not predominated by EFs only but that there is also an influence of fuel consumption and its appropriate allocation to combustion technologies. Since these factors are carefully considered in this study, the NEEMI estimates have (or are likely to have) less uncertainty in emissions.
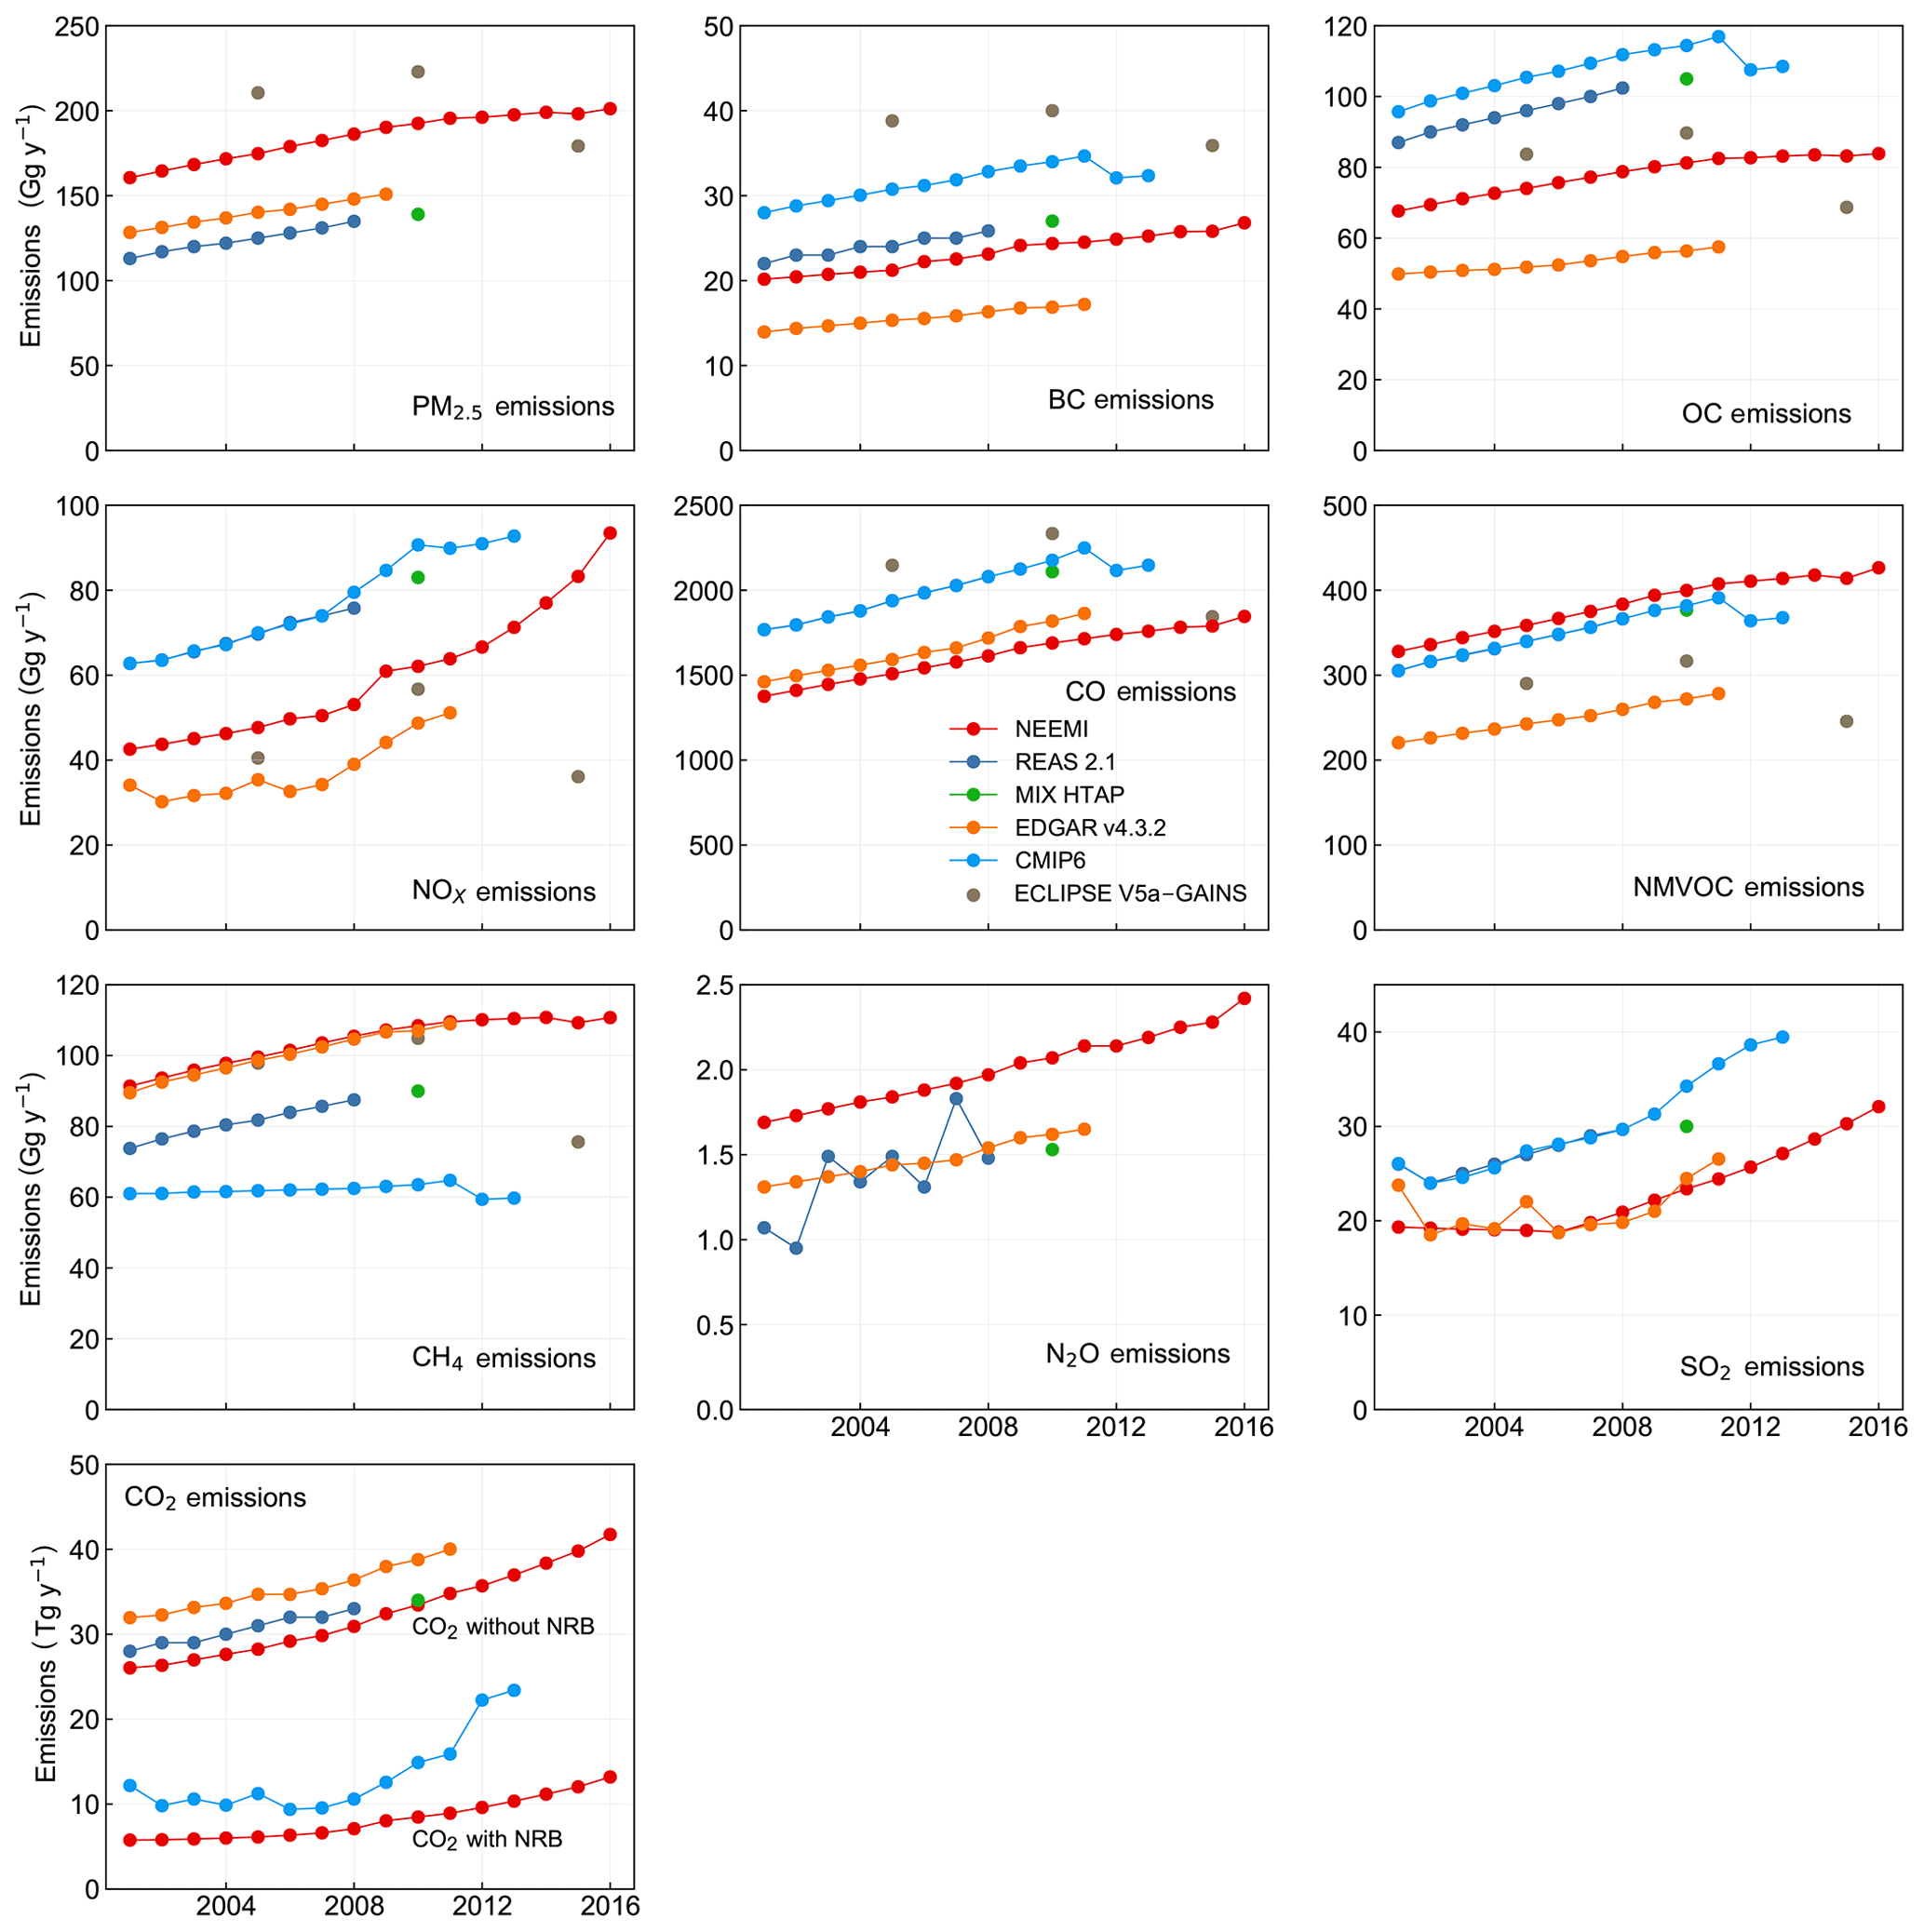
Figure 7Emission comparison with EDGAR, CMIP6, ECLIPSE–GAINS, REAS and MIX HTAP emission inventories. CO2 emissions with and without non-renewability fraction for biomass (NRB) are also shown for comparison.
Table 3Comparison of NEEMI-Tech emissions with the MIX HTAP emissions for 2010.
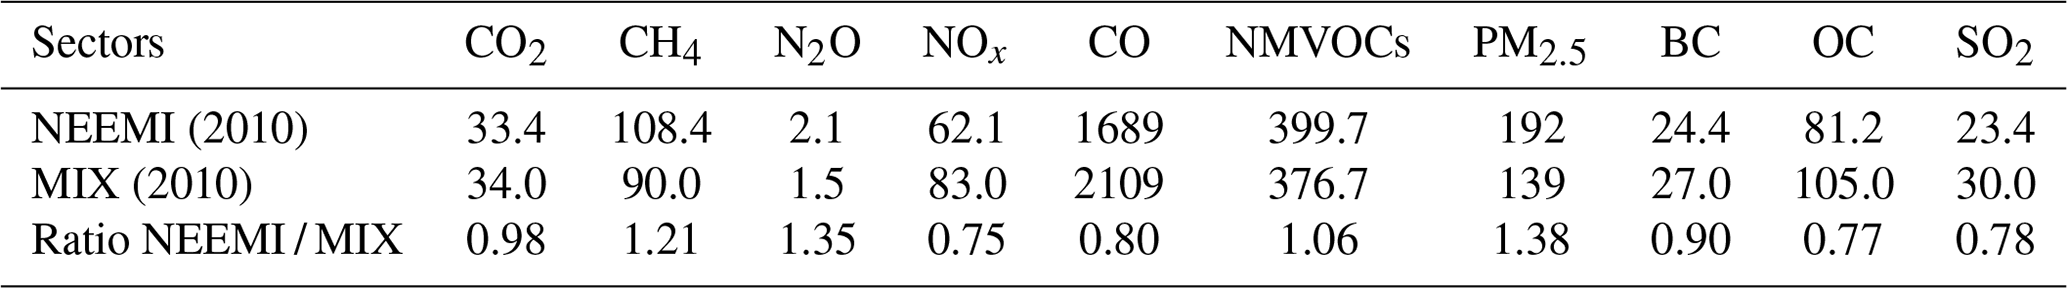
All units in gigagrams per year except CO2, which is in teragrams per year.
The emissions were also compared with the global datasets of EDGAR v4.3.2 (emission source: https://edgar.jrc.ec.europa.eu/, last access: 25 August 2019; https://edgar.jrc.ec.europa.eu/, last access: 25 August 2019), CMIP6 (emission source: https://www.geosci-model-dev.net/11/369/2018/, last access: 25 August 2019) and ECLIPSE V5a–GAINS (emission source: author and co-author direct communication) for the emission trends and the year 2010. The objective behind developing the CMIP6 emissions was “to combine the global estimation framework with country-level inventories, to produce reproducible, consistent over space, time and species” (Hoesly et al., 2018). Following this, the CMIP6 inventory starts with fuel consumption at the sector level from the International Energy Agency (IEA) and the emission factors, with an intention to scale their estimates by comparing them with regional emissions. For Nepal, the scaling was done with REAS 2.1, and we observe from Fig. 7 that the total estimates of NOx, CO, NMVOCs and SO2 were found to be similar in both studies, while CH4, BC, OC and CO2 were not. One of the reasons for the disagreement in BC and OC was the default estimates from the Speciated Pollutant Emission Wizard (SPEW), while for CO2 it can be inferred that estimates are much closer to the NEEMI CO2 emissions, considering the non-renewability factor. The CH4 emissions from CMIP6 are consistent and do not vary over the time, which is completely different than REAS 2.1 and NEEMI, where the increase can be attributed to an increase in fuel consumption over the 1.5 decades. At the sectoral level, the residential activities contribute 92 %–99 % to the total emissions of the five sectors for BC, OC, NMVOCs, CH4, CO and ∼55 %–60 % to the total NOx in the CMIP6 and NEEMI inventories. Also, the CMIP6 SO2 emissions from each sector vary a lot when compared to NEEMI, showcasing the shortcomings due to the coarser-resolution methodologies, which lack the degree of detail present in the NEEMI inventory. Like in NEEMI, SO2 emission factors used are for a large number of fuel–technology combinations; the sulfur content of the liquid fuels changes over a period of 1.5 decades and the sulfur retention fraction in the ash content of coal depends on the combustion technology. In contrast, CMIP6 considers only eight types of fuel, with no clear distinction in biomass sources such as firewood, agricultural residue and dung cakes.
Even EDGAR v4.3.2 emissions are estimated using activity and production numbers from the IEA and emission factors from the EMEP/EEA guidebook (Crippa et al., 2018). One of the core differences between global inventories of EDGAR v4.3.2 and CMIP6 lies in the consideration of the level of detail and their integrity in each sector. For example, EDGAR covers 26 aggregated sources and 64 fuel types compared to 55 sources and 8 fuel types in CMIP6 (Hoesley et al., 2018; Crippa et al., 2018; Janssens-Maenhout et al., 2019). For the five sectors considered, emissions of PM2.5, BC, OC, NOx, NMVOCs and N2O from NEEMI are higher than EDGAR by a factor of 1.3–1.5, which is mainly due to differences in biomass consumption (especially the consideration of space- and water-heating activities in the residential sector) and differences in the new field-measured emission factors for traditional cookstoves and biomass burning (Stockwell et al., 2015). Also, differences arise due to the assumption of a 40 % superemitter fraction in on-road vehicles and use of technology-specific emission factors throughout the inventory. The CO2, CO and SO2 emissions from NEEMI are lower than EDGAR by a factor of 0.7–0.9 due to the use of Tier II and III approaches in the methodologies and technology-specific emission factors, while there is good agreement for CH4 emissions. Across sectors, the residential and commercial together contribute 90 %–97 % of the total estimate in EDGAR, which is consistent with NEEMI for all pollutants except CO2, NOx, CO and SO2. These differences in emissions can be explained with the underlying assumptions in each activity, type of fuel consumption and emission factor.
The emissions from the ECLIPSE V5a–GAINS model were also compared for 2005, 2010 and 2015 for PM2.5, BC, OC, NOx, CO, NMVOCs, CH4 and SO2. One of the first inferences that can be derived is the decrease in GAINS emissions by a factor of about 0.10–0.35 for the year 2015 with respect to 2010. Since there has been an increase in fuel use over the years, the GAINS model assumes a decrease in emission factors for PM2.5 by 15 % globally during 2005–2010 due to improvements in combustion technologies for cookstoves in the Asia (Klimont et al., 2017). Under the current legislation emission (CLE) scenarios, it continues to improve further, and the impact is visible due to higher distribution of ICSs. A large variability is observed when the GAINS emissions are compared with NEEMI for the 2005, 2010 and 2015 period. Still they are within an uncertainty ratio of 0.8–1.2 (GAINS/NEEMI) during 2005 and 2010 for PM2.5, OC, NOx, NMVOCs, and CH4. The BC, CO and SO2 emissions from GAINS are a factor of 1.5–3.0 higher than NEEMI, anticipating the difference in high emission factors. Overall, the residential sector is the dominant source, contributing to ∼90 % of the total emissions, while the difference arises in NOx and SO2 emissions. The GAINS inventory estimates 50 % NOx emissions from the transport sector compared with 19 % from NEEMI. Inclusion of a 20 % superemitter fleet fraction with a varying and high amplification factor of up to 10 across vehicles with emission standards may be one of the reasons. In the case of SO2, 43 % is emitted from industry and 53 % is residential, which is different from 61 % and 37 % in NEEMI due to the use of regional and technology-specific emission factors and assumptions about sulfur retention in ash.
3.4.2 Kathmandu Valley and Nepal
The emissions from the KTM are compared with all of NPL to understand the relative contributions from different sources for year 2011. There are three administrative districts in the Kathmandu Valley, namely Kathmandu, where the capital city (Kathmandu metropolitan city, or KMC) is located, Lalitpur and Bhaktapur. Being the commercial and financial hub of the country, the population residing in the valley is about 2.5 million, ∼10 % of the total population of Nepal in 2011 (CBS, 2012). Table 4 shows the emission ratio of KTM to NPL for all pollutants and sectors, which ranges from 0.03 to 0.13, with a minimum for CH4, PM2.5 and OC emissions and a maximum for NOx emissions i.e., 0.13. This reflects strong sources of NOx in the Kathmandu Valley and definitively high diesel use. These ratios were also estimated for each sector to understand its relative contribution.
Table 4Comparison of total and sectoral emission ratios for the Kathmandu Valley and Nepal for 2011.
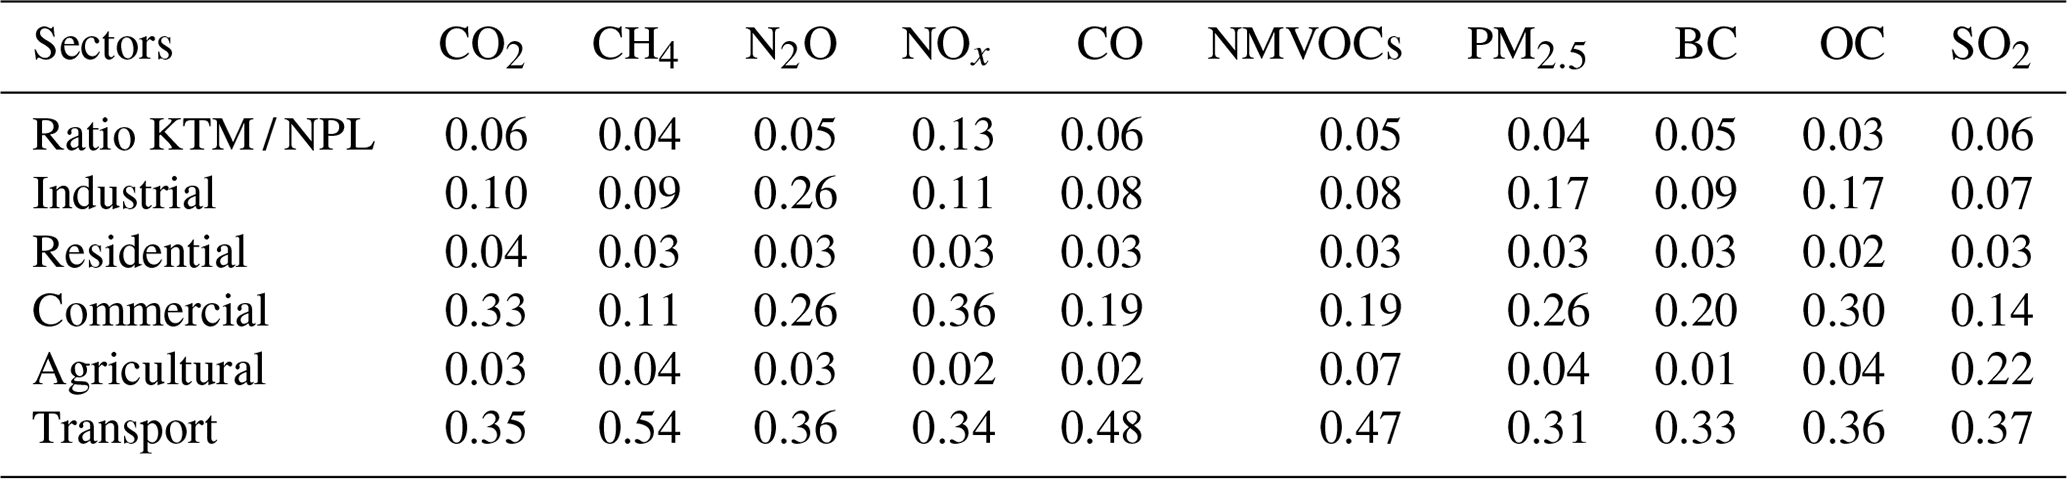
On a sectoral level, the emissions (all species) from the transport sector in the Kathmandu Valley are 30 % to 55 % of the total estimates. One of the important reasons for high emissions from transport is the number of vehicles registered in the Bagmati Zone (a zone of eight districts, including three districts in the Kathmandu Valley); 30 % of national fleets are registered in the Bagmati Zone, which subsequently results in a high level of fuel consumption. Next, the commercial sector is of importance, for which the emission ratio ranges from 0.10 to 0.35 for individual pollutants. This sector is comprised of the sub-sectors of hotels and restaurants and heavy use of diesel in generators during load-shedding hours (power cuts). According to the Nepal tourism statistics, there are 423 hotels registered in the Kathmandu Valley compared to 291 outside the valley (MoCTCA, 2013). Also the urban population that dines in restaurant is assumed to be 3 times higher than the rural population, which increases the fuel consumption and its emissions. The industrial-sector emission ratio for all species ranges from 0.07 to 0.17, except for that of N2O, which is 0.26. There are 110 large-point-source industries within the valley (out of 1512 nationally), which especially include 76 brick production units (identified using geolocations) that tend to use biomass and coal, increasing the PM2.5 and OC emissions. Industries that manufacture structural metal also contribute significantly. The residential sector emissions from the Kathmandu Valley are only 2 %–4 % of the total emissions for all pollutants in spite of the fact that ∼10 % of the population resides in the valley. Due to extensive urbanization, the population relies on cleaner sources of fuel; 84 % of the households use LPG and 10 % use electricity as their primary source of fuel for cooking (CBS, 2012). In addition, < 5 % of the households use sources other than electricity for lighting. In contrast to the valley, 82 % of the households in the rest of the Nepal rely heavily on biomass (firewood, agricultural residue and dung cakes) for cooking, and nearly 35 % use sources other than electricity for lighting.
For 2016, the emissions from the Kathmandu Valley were compared with those of 2011 in order to understand the impact of the shift in technology on emissions. The total emissions from KTM during 2016 increased by a factor varying from 1.05 for OC to ∼2.0 for NOx and SO2. Table S10 details the emissions in 2011 and 2016 over the Kathmandu Valley. There was a major change in two main polluting sources during 2016: (i) straight-firing brick kilns in the Kathmandu Valley were changed to the zigzag-firing technology when they were rebuilt after the 2015 earthquake, and (ii) diesel generator sets were phased out due to improvements in load-shedding hours since 2016. The shift to zigzag firing has resulted in reductions of 65 % CO, 30 % PM2.5, 81 % BC and 19 % SO2 emissions from brick production, while the near-complete phasing out of diesel generator sets has reduced all pollutants from diesel generator sets to effectively zero.
3.5 Spatial and temporal distribution
High-resolution emission estimates require suitable surrogates to distribute emissions spatially according to their activity locations. Each sector and sub-sector activity was tracked down and distributed as point, area and line sources. Figure S10 shows the proxies considered in each sector. The emissions from residential activities were distributed using population surrogates from the Central Bureau of Statistics (CBS) for 2011. These vector data of the population that are available at each VDC, an administrative unit in rural areas, and municipalities in urban areas are processed using dasymetric-mapping techniques (in addition to census data using ancillary information like topographic maps and land-use and land-cover (LULC) data to generate population density maps) and converted into a uniform raster grid of 1 km × 1 km resolution (Mennis, 2009). Similarly, these spatial proxies were also used in space-heating and water-heating sub-sectors. Industrial emissions from point sources (Table 1) were distributed to approximate locations identified based on CME survey information (CBS, 2014). Similarly, for emissions from brick production, the exact geospatial locations of the individual ∼470 kilns were identified using web URLs (Google Earth) and CME reports (Fig. S10).
Industries categorized as area sources were aggregated, and their emissions were distributed in respective VDCs and municipalities using population surrogates. Emissions from commercial sources of hospitals, hotels, banks and academic institutions were distributed based on their locations at VDCs and municipalities. Emissions from sub-sectors of restaurants, barrack canteens and other service sectors were distributed using a population similar to the residential sector. The census of agriculture reports the irrigation and cultivation activities using tractors, pumps, power tillers and threshers at the district level. These identified districts, along with LULC maps of the agricultural area, were utilized for distributing emissions from diesel use in the agricultural sector. The emissions from mobile sources were distributed using proxies of population and road density maps. With a basic understanding of the population and its urbanization, the emissions from private cars (gasoline) were distributed using urban population densities, while for two-wheeler vehicles, these were spread across rural and urban population maps. For diesel, especially the public passenger and freight vehicles, due to insufficient information, 50 % of emissions were distributed to the population and road density network. Figure 8 shows the final spatial distribution of PM2.5, BC, NOx and CO emissions for 2011. As the residential sector dominates the whole inventory, the gradient across different parts of the country mostly reflects the population density, with a few hotspots for point sources.
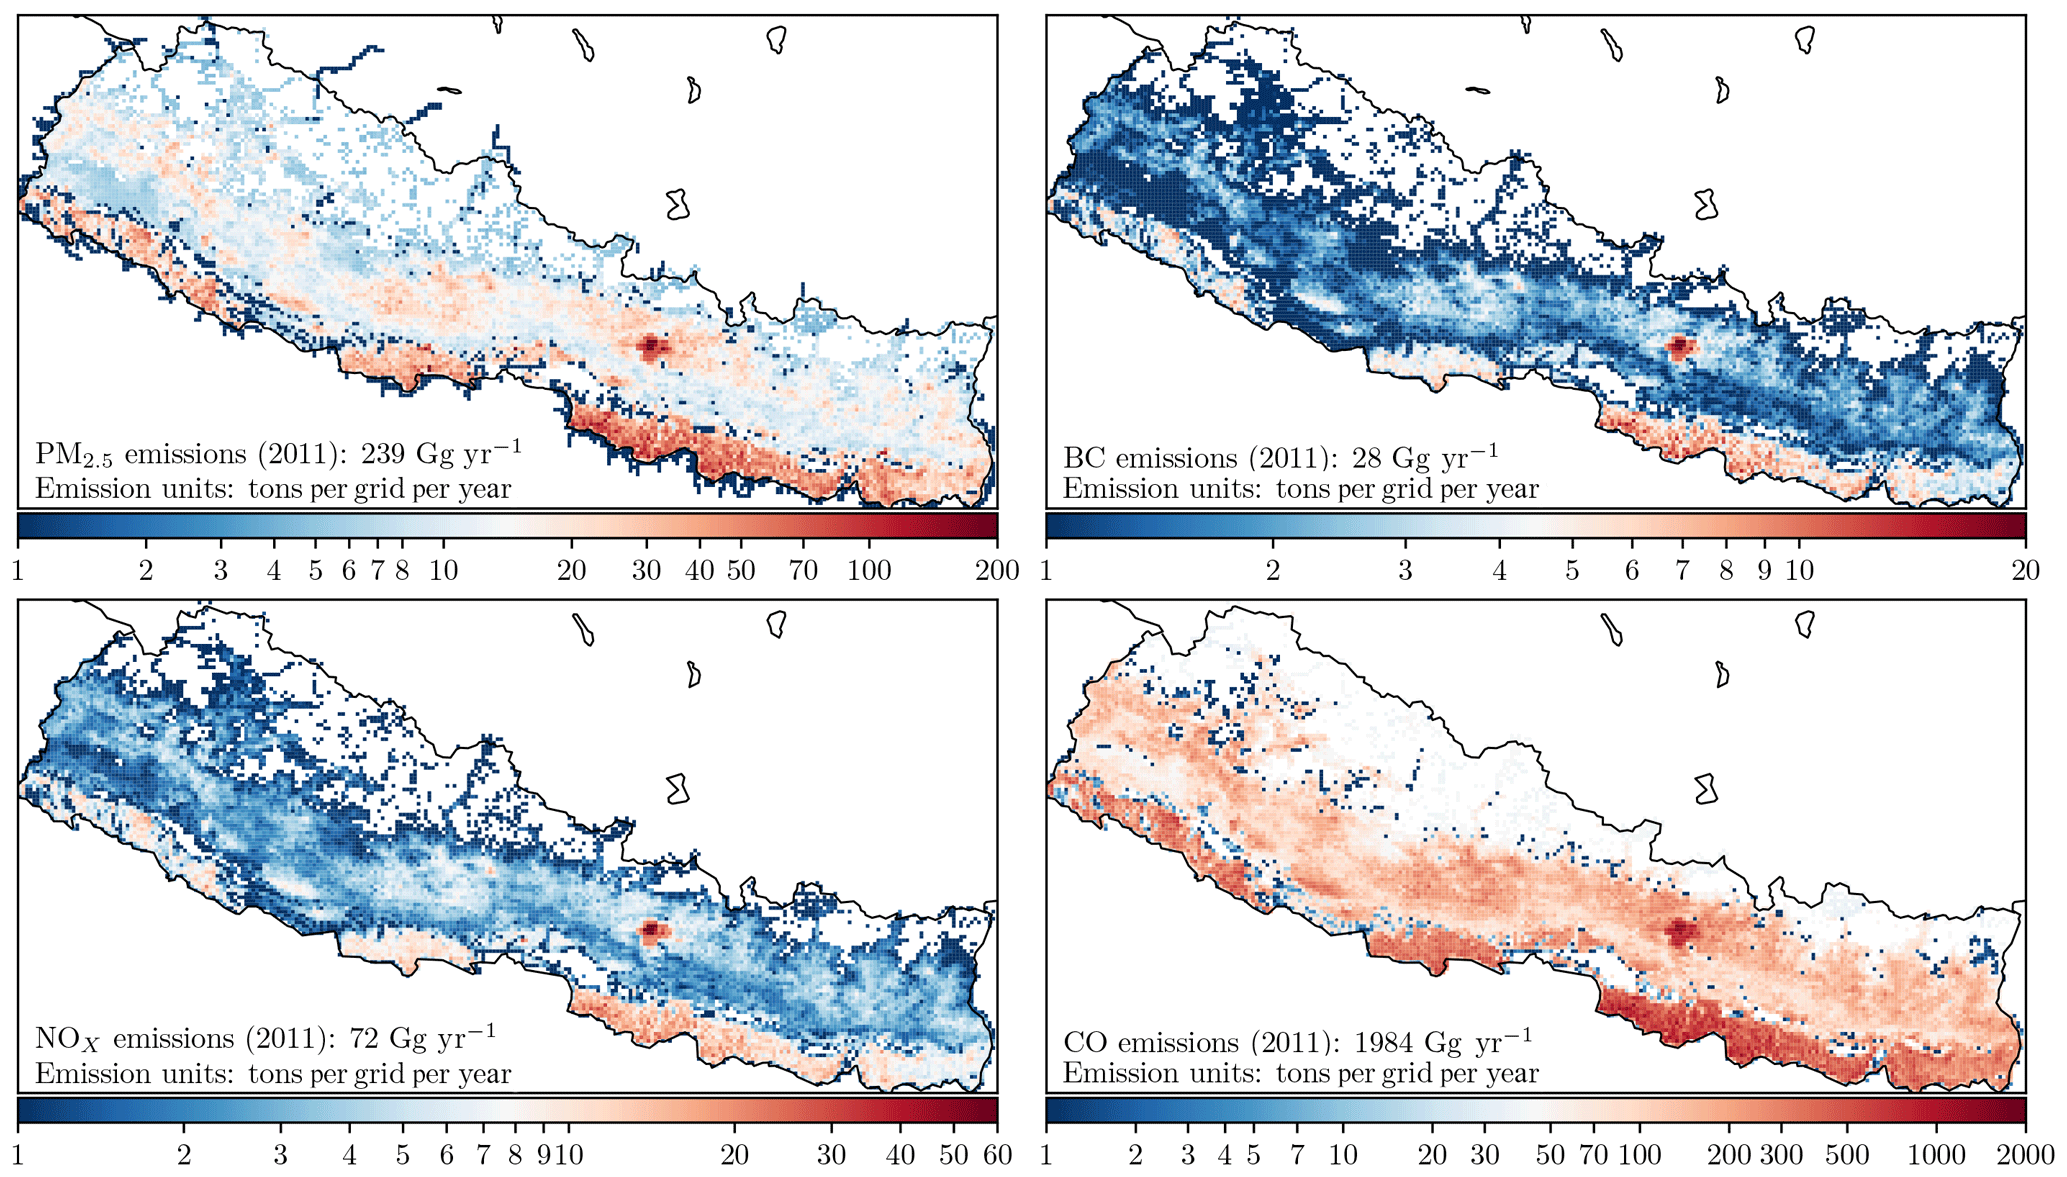
Figure 8Spatial distributions of PM2.5, BC, NOx and CO emissions for year 2011.
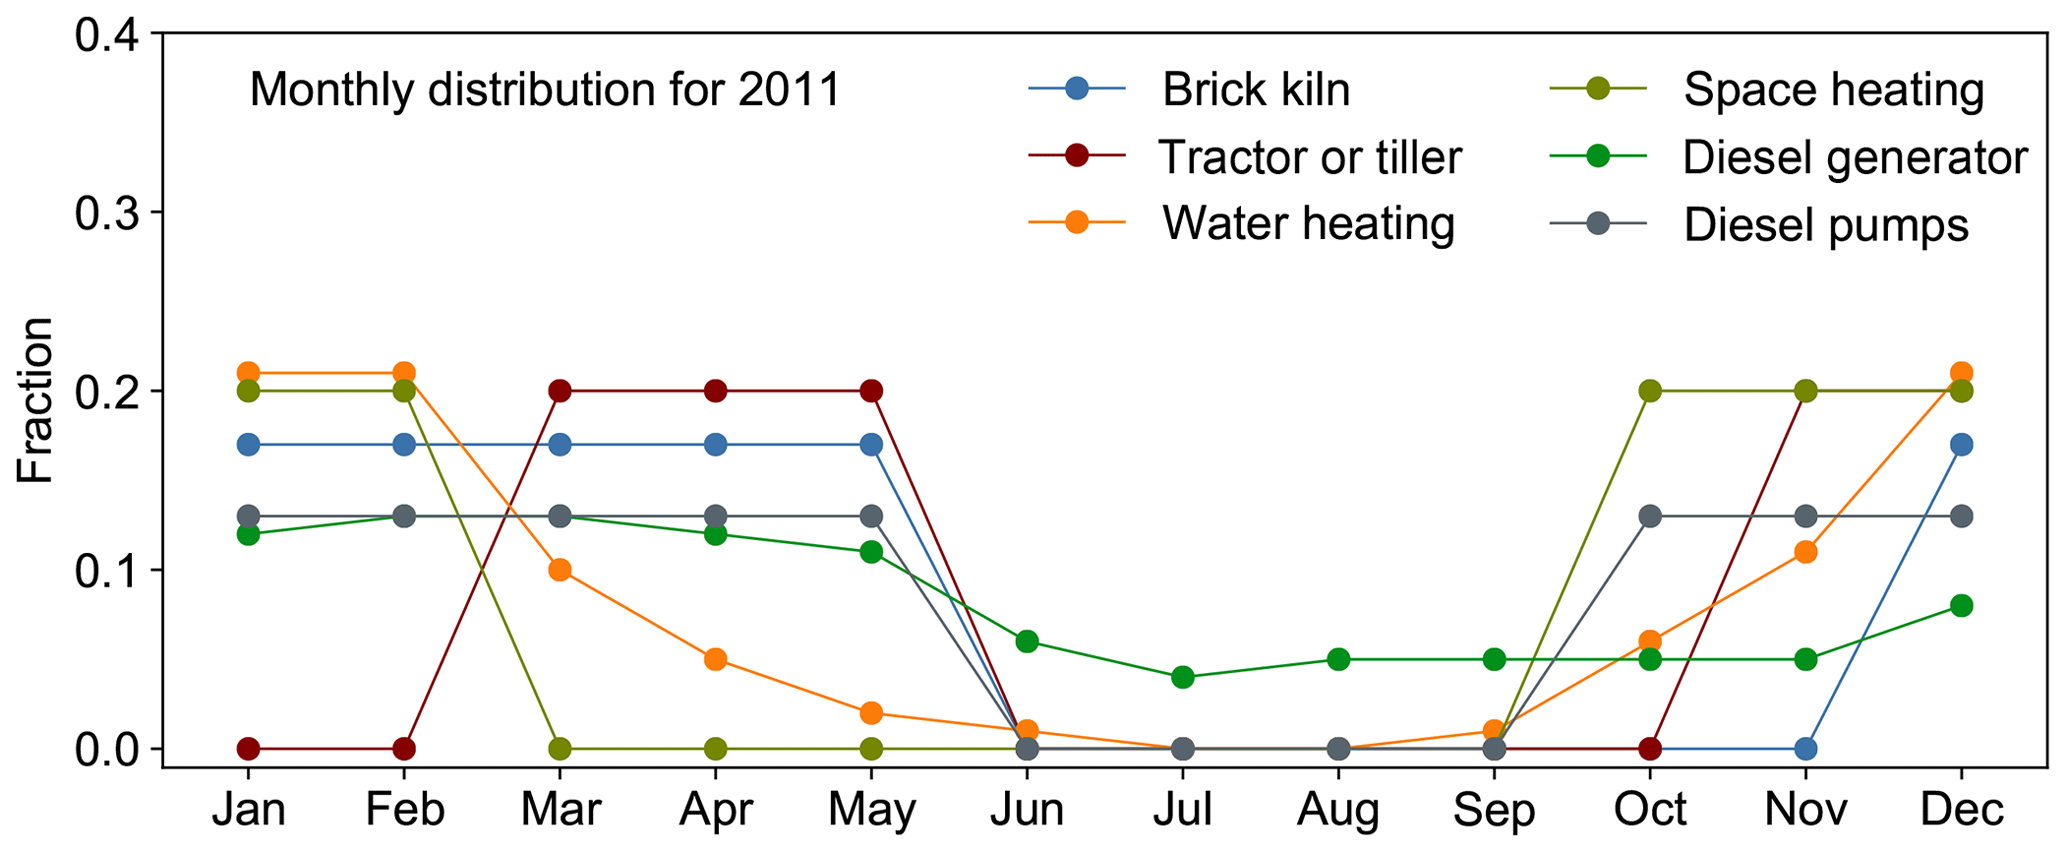
Figure 9 shows the seasonality of various activities on a monthly resolution basis. Temporal variability in emissions was introduced in the activities of brick kiln production, where the official firing of kilns starts from December and continues for the next 5 months until May, before the onset of the monsoon. Around 87 % of the households throughout the country hire tractors and power tillers for tillage operations, which usually last for 40–45 d, including 2–3 d of usage on their own farmland. Therefore, 2 months in the pre-monsoon season and post-monsoon season are considered for distributing emissions from tractors and power tillers used on fields. Emissions from space heating and water heating are considered following the temperature profiles across each district. Diesel generators are heavily used in the non-monsoon season during hours of load shedding (before the shift in power management). Therefore, the seasonal variability in the use of diesel generators is followed as per the trend in monthly hours of load shedding reported by the NEA. The analysis of the monthly distribution of emissions showed that December–January–February emitted the maximum amount PM2.5, i.e., 11 % of the annual total, followed by October–November (10 %; Fig. S11). The sectoral contribution showed peak emissions in December–January–February due to the variability in emissions mostly caused by space- and water-heating. Once a more complete inventory, including open-waste and agricultural-waste burning, is available (to be described in Part II of this work), it would be pragmatic to identify the peak emissions on a monthly scale.
A high-resolution 1 km × 1 km technology-linked multipollutant emission inventory was developed for Nepal for the base year 2011. The trends in energy and emissions during the period 2001–2016 were also studied. This work included all the relevant sources of energy-use sectors, such as residential, industrial, transport, commercial and agricultural sectors, and emissions were characterized by their combustion technologies. These broad sectors were further disaggregated into sub-sectors of coherent sources, and emissions were estimated for a total of 36 combustion technologies. The national energy consumption estimated for 2011 was 374 PJ, with the residential sector being the largest consumer of energy, around 79 %, followed by industry (11 %) and transport (7 %). The energy source was dominated by biomass, contributing 88 % to the total energy consumption, while 12 % was from fossil fuel. A total of 8.9 Tg of CO2, 110 Gg of CH4, 2.1 Gg of N2O, 64 Gg of NOx, 1714 Gg of CO, 408 Gg of NMVOCs, 195 Gg of PM2.5, 23 Gg of BC, 83 Gg of OC and 24 Gg of SO2 were estimated in 2011 using regionally measured emissions factors. The sectoral contributions to emissions were mostly energy-driven, especially cookstoves using biomass and burning for space-heating activities in the residential sectors. The assessment of top polluting technologies showed high emissions from traditional cookstoves using firewood, dung cakes, agricultural residues, and burning of firewood and dung cakes for space and water heating. In addition, high emissions were also computed from fixed-chimney Bull's trench kilns in brick production, cement kilns, two-wheeler gasoline vehicles, heavy-duty diesel freight vehicles and kerosene lamps. The estimated energy was compared with the officially reported energy by WECS for 2011. Overall the technology-linked energy consumption estimated in NEEMI was higher by a factor of 1.15 than that estimated by WECS. Comparison with the regional inventory MIX showed lower estimates of NOx, CO, BC, OC and SO2, while CH4, N2O, NMVOCs and PM2.5 were estimated to be higher in the NEEMI inventory due to differences in methodologies, emission factors, and the disaggregation of energy across sources and sectors. Even the global inventory shows high uncertainties in their estimates due to the coarser resolution of the defined sectors (important in the local context), fuel sources from global database and use of Tier I emission factors. The energy and emissions for Nepal were also compared specifically with the Kathmandu Valley, and it was found that the valley consumed 8.2 % of the national energy in 2011, and the emissions were 3 %–6 % of the total estimates, except for the 13 % estimate of NOx, which was attributed to a high use of diesel in vehicles and diesel generators.
Activity-specific spatial proxies were used for developing the gridded spatial distribution of emissions. A wide variation in emissions distributions was achieved, highlighting the pockets of growing urbanization and the detailed knowledge about the emission sources. Emissions from brick production, the agricultural sector, space and water heating, and the use of diesel generators were apportioned across different months using information on the respective temporal variation in the activities. It was observed that December–January–February constituted the maximum PM2.5 emissions, followed by October–November. However, with a more complete inventory after the inclusion of open-waste and agricultural-waste burning from Part II, this would provide more realistic emissions for identifying the peak months for high emissions. Though such extensive work requires a lot of crucial demographic data and statistical information for each activity, this work has made some pragmatic assumptions wherever required which identify the need to improve the information available for some of the important sectors at the national and municipal level. NEEMI has attempted to provide an insightful and detailed understanding of the energy requirements in various sectors. It has also provided implications of new energy-efficient technologies in emissions, which can be further used in modeling the atmospheric dynamics at the urban to regional scale and redesigning appropriate mitigation policies.
The emission data generated in this study will be made public through the SusKat website of IASS. They are also available for scientific research upon direct request to Maheswar Rupakheti (maheswar.rupakheti@iasspotsdam.de) and Pankaj Sadavarte (p.sadavarte@sron.nl).
The supplement related to this article is available online at: https://doi.org/10.5194/acp-19-12953-2019-supplement.
MR and ML conceptualized the research idea. PS designed the methodology and investigated and analyzed the results. PB and KS provided inputs on spatial distribution of source sectors and crucial discussion and analysis on emission factors. PS prepared the paper, with contributions from all co-authors.
The authors declare that they have no conflict of interest.
The authors would like to thank Bhishma Pandit for his critical and expert knowledge on fuel consumption in the industrial sector; Rejina Maskey Byanju (Tribhuvan University, Nepal), Bhupendra Das (doctoral student, Tribhuvan University, Nepal) and Pratik Singdan (research assistant, IASS Potsdam) for assisting in data collection; and Ashish Singh (post-doctoral fellow, IASS Potsdam) and Khadak Mahata (research assistant, IASS Potsdam) for fruitful discussions and interpreting the traditional and regional practices in energy consumption across different sectors in Nepal.
The work is a part of the IASS project “A Sustainable Atmosphere for the Katmandu Valley” (SusKat) funded by the German Federal Ministry for Education and Research (BMBF) and the Brandenburg State Ministry for Science, Research and Culture (MWFK).
This paper was edited by Jason West and reviewed by Harry Vallack and one anonymous referee.
Adhikari, S., Mahapatra, P. S., Sapkota, V., and Puppala, S. P.: Characterizing Emissions from Agricultural Diesel Pumps in the Terai Region of Nepal, Atmosphere, 10, 1–12, https://doi.org/10.3390/atmos10020056, 2019.
AEPC: A Year in Review NYF 2069/70, Alternative Energy Promotion Centre, Ministry of Science, Technology and Environment, Government of Nepal, 1–74, 2012.
ARAI: Emission factor development for Indian vehicles, in: Air Quality Monitoring Project-Indian Clean Air Programme, The Automotive Research Association Of India, Pune, 1–94, 2007.
Aryal, R. K., Lee B. K., Karki R., Gurung A., Baral B., and Byeon S. H.: Dynamics of PM2.5 concentrations in Kathmandu Valley, Nepal, J. Hazard. Mater., 168, 732–738, https://doi.org/10.1016/j.jhazmat.2009.02.086, 2009.
Baidya, S. and Borken-Kleefeld, J.: Atmospheric emissions from road transportation in India, Energ. Policy, 37, 3812–3822, https://doi.org/10.1016/j.enpol.2009.07.010, 2009.
Bajracharya, I. and Bhattarai, N.: Road Transportation Energy Demand and Environmental Emission: A Case of Kathmandu Valley, Hydro Nepal, J. Water Energ. Environ., 18, 30–40, https://doi.org/10.3126/hn.v18i0.14641, 2016.
Ban-Weiss, G. A., Lunden, M. M., Kirchstetter, T. W., and Harley, R. A.: Measurement of Black Carbon and Particle Number Emission Factors from Individual Heavy-Duty Trucks, Environ. Sci. Technol., 43, 1419–1424, 2009.
Bhari B.: Characterization of Roadside Air Pollution Levels in Kathmandu Valley, Master's Thesis, School of Environment, Resources and Development, Asian Institute of Technology, Thailand, 1–88, 2015.
Bhattarai, N. and Jha, A. K.: Commercial Sector Energy Demand Projections of Nepal for Sustainable Sectoral Energy Planning, J. Environ. Protect. Sustain. Dev., 1, 165–177, 2015.
Bond, T. C., Streets, D. G., Yarber, K. F., Nelson, S. M., Woo, J. H., and Klimont, Z.: A technology-based global inventory of black and organic carbon emissions from combustion, J. Geophys. Res., 109, D14203, https://doi.org/10.1029/2003JD003697, 2004.
Burney J. and Ramanathan V.: Recent climate and air pollution impacts on Indian agriculture, P. Natl. Acad. Sci. USA, 111, 16319–16324, https://doi.org/10.1073/pnas.1317275111, 2014.
CBS: National Census of Manufacturing Establishment (CME) 2006/07, National Planning Commission Secretariat, Central Bureau of Statistics, Kathmandu, 1–154, 2008.
CBS: National Population and Housing Census, 2011, National Report, National Planning Commission Secretariat, Central Bureau of Statistics, Kathmandu, 1–262, 2012.
CBS: National Census of Manufacturing Establishment (CME) 2011/12, National Planning Commission Secretariat, Central Bureau of Statistics, Kathmandu, 7–126, June 2014.
Collier J. C. and Zhang G. J.: Aerosol direct forcing of the summer Indian monsoon as simulated by the NCAR CAM3, Clim. Dynam., 32, 313–332, https://doi.org/10.1007/s00382-008-0464-9, 2009.
Crippa, M., Guizzardi, D., Muntean, M., Schaaf, E., Dentener, F., van Aardenne, J. A., Monni, S., Doering, U., Olivier, J. G. J., Pagliari, V., and Janssens-Maenhout, G.: Gridded emissions of air pollutants for the period 1970–2012 within EDGAR v4.3.2, Earth Syst. Sci. Data, 10, 1987–2013, https://doi.org/10.5194/essd-10-1987-2018, 2018.
DECP: District Climate and Energy Plan Reports, Multiscope Consultancy Pvt. Ltd., Kathmandu, 1–155, 2014.
Devakumar D., Semple, S., Osrin, D., Yadav, S. K., Kurmi, O. P., Saville, N. M., Shrestha, B., Manandhar, D. S., Costello, A., and Ayres, J. G.: Biomass fuel use and the exposure of children to particulate air pollution in southern Nepal, Environ. Int., 66, 79–87, https://doi.org/10.1016/j.envint.2014.01.011, 2014.
Dhakal, S.: Implications of transportation policies on energy and environment in Kathmandu Valley, Nepal, Energ. Policy, 31, 1493–1507, https://doi.org/10.1016/S0301-4215(02)00205-7, 2003.
Dhital, H. C. and Shakya, S. R.: Implication of Sustainable Low Carbon Transportation Development Strategy in Emerging City: A case of Kathmandu Valley, Proceedings of IOE Graduate Conference, 215–224, 2014.
DoTM: Details of Registration of Transport up to Fiscal Year 2046/47-070/71, Department of Transport Management, Kathmandu, p. 1, 2013.
DoTM: Details of Registration of Transport up to Fiscal Year 2046/47-073/74, Department of Transport Management, Kathmandu, p. 1, 2016.
Fan, J., Rosenfeld, D., Yang, Y., Zhao, C., Leung, L. R., and Li, Z.: Substantial contribution of anthropogenic air pollution to catastrophic floods in Southwest China, Geophys. Res. Lett., 42, 6066–6075, https://doi.org/10.1002/2015GL064479, 2015.
Fiore, A. M., Naik, V., and Leibensperger, E. M.: Air Quality and Climate Connections, J. Air Waste Manage., 65, 645–685, https://doi.org/10.1080/10962247.2015.1040526, 2015.
Forouzanfar, M. H., et al.: Global, regional, and national comparative risk assessment of 79 behavioural, environmental and occupational, and metabolic risks or clusters of risks, 1990–2015: a systematic analysis for the Global Burden of Disease Study 2015, The Lancet, 388, 1659–1724, https://doi.org/10.1016/S0140-6736(16)31679-8, 2016.
Frenken K. and Gillet V.: Irrigation water requirement and water withdrawal by country, FAO AQUASTAT Reports, 1–263, 2012.
Gurung, A., Ghimeray, A. K., and Hassan, S. H. A.: The prospects of renewable energy technologies for rural electrification: a review from Nepal, Energ. Policy, 40, 374–380, https://doi.org/10.1016/j.enpol.2011.10.022, 2012.
Habib, G., Venkataraman, C., Shrivastava, M., Banerjee, R., Stehr, J. W., and Dickerson, R. R.: New methodology for estimating biofuel consumption for cooking: atmospheric emissions of black carbon and sulfur dioxide from India, Global Biogeochem. Cy., 18, GB3007, https://doi.org/10.1029/2003GB002157, 2004.
Habib, G., Venkataraman, C., Bond, T. C., and Schauer, J. J.: Chemical, microphysical and optical properties of primary particles from the combustion of biomass fuels, Environ. Sci. Technol., 42, 8829–8834, https://doi.org/10.1021/es800943f, 2008.
Hoesly, R. M., Smith, S. J., Feng, L., Klimont, Z., Janssens-Maenhout, G., Pitkanen, T., Seibert, J. J., Vu, L., Andres, R. J., Bolt, R. M., Bond, T. C., Dawidowski, L., Kholod, N., Kurokawa, J.-I., Li, M., Liu, L., Lu, Z., Moura, M. C. P., O'Rourke, P. R., and Zhang, Q.: Historical (1750–2014) anthropogenic emissions of reactive gases and aerosols from the Community Emissions Data System (CEDS), Geosci. Model Dev., 11, 369–408, https://doi.org/10.5194/gmd-11-369-2018, 2018.
Jaiprakash, Gazala H., and Kumar S.: Evaluation of portable dilution system for aerosol measurement from stationary and mobile combustion sources, Aerosol Sci. Technol., 50, 717–731, https://doi.org/10.1080/02786826.2016.1178502, 2016.
Janssens-Maenhout, G., Crippa, M., Guizzardi, D., Muntean, M., Schaaf, E., Dentener, F., Bergamaschi, P., Pagliari, V., Olivier, J. G. J., Peters, J. A. H. W., van Aardenne, J. A., Monni, S., Doering, U., and Petrescu, A. M. R.: EDGAR v4.3.2 Global Atlas of the three major Greenhouse Gas Emissions for the period 1970–2012, Earth Syst. Sci. Data Discuss., 11, 959–1002, https://doi.org/10.5194/essd-11-959-2019, 2019.
Jayarathne, T., Stockwell, C. E., Bhave, P. V., Praveen, P. S., Rathnayake, C. M., Islam, Md. R., Panday, A. K., Adhikari, S., Maharjan, R., Goetz, J. D., DeCarlo, P. F., Saikawa, E., Yokelson, R. J., and Stone, E. A.: Nepal Ambient Monitoring and Source Testing Experiment (NAMaSTE): emissions of particulate matter from wood- and dung-fueled cooking fires, garbage and crop residue burning, brick kilns, and other sources, Atmos. Chem. Phys., 18, 2259–2286, https://doi.org/10.5194/acp-18-2259-2018, 2018.
Kandel, P., Chapagain, P. S., Sharma, L., N., and Vetaas, O., R.: Consumption Patterns of Fuelwood in Rural Households of Dolakha District, Nepal: Reflections from Community Forest User Groups, Small-scale Forest., 15, 481–495, 2016.
Kim Oanh, N. T., Thiansathit, W., Bond, T. C., Subramanian, R., Winijkul, E., and Paw-Armart, Compositional characterization of PM2.5 emitted from in-use diesel vehicles, Atmos. Environ., 44, 15–22, https://doi.org/10.1016/j.atmosenv.2009.10.005, 2010.
Klimont, Z., Kupiainen, K., Heyes, C., Purohit, P., Cofala, J., Rafaj, P., Borken-Kleefeld, J., and Schöpp, W.: Global anthropogenic emissions of particulate matter including black carbon, Atmos. Chem. Phys., 17, 8681–8723, https://doi.org/10.5194/acp-17-8681-2017, 2017.
Kurmi, O. P., Semple, S., Devereux, G. S., Gaihre, S., Lam, K. B., Sadhra, S., Steiner, M. F., Simkhada, P., Smith W. C., and Ayres, J. G.: The effect of exposure to biomass smoke on respiratory symptoms in adult rural and urban Nepalese populations, Environ. Health, 13, 1–8, https://doi.org/10.1186/1476-069X-13-92, 2014.
Kurokawa, J., Ohara, T., Morikawa, T., Hanayama, S., Janssens-Maenhout, G., Fukui, T., Kawashima, K., and Akimoto, H.: Emissions of air pollutants and greenhouse gases over Asian regions during 2000–2008: Regional Emission inventory in ASia (REAS) version 2, Atmos. Chem. Phys., 13, 11019–11058, https://doi.org/10.5194/acp-13-11019-2013, 2013.
Lam, N. L., Chen, Y., Weyant, C., Venkataraman, C., Sadavarte, P., Johnson, M. A., Smith, K. R., Brem, B. T., Arineitwe, J., Ellis, J. E., and Bond, T. C.: Household light makes global heat: high black carbon emissions from kerosene wick lamps, Environ. Sci. Technol., 46, 13531–13538, https://doi.org/10.1021/es302697h, 2012.
Li, M., Zhang, Q., Kurokawa, J.-I., Woo, J.-H., He, K., Lu, Z., Ohara, T., Song, Y., Streets, D. G., Carmichael, G. R., Cheng, Y., Hong, C., Huo, H., Jiang, X., Kang, S., Liu, F., Su, H., and Zheng, B.: MIX: a mosaic Asian anthropogenic emission inventory under the international collaboration framework of the MICS-Asia and HTAP, Atmos. Chem. Phys., 17, 935–963, https://doi.org/10.5194/acp-17-935-2017, 2017.
Malla, S.: Household energy consumption patterns and its environmental implications: Assessment of energy access and poverty in Nepal, Energ. Policy, 61, 990–1002, https://doi.org/10.1016/j.enpol.2013.06.023, 2013.
Mennis J.: Dasymetric Mapping for Estimating Population in Small Areas, Geography Compass, 3/2, 727–745, https://doi.org/10.1111/j.1749-8198.2009.00220.x, 2009.
MoAD: Statistical Information on Nepalese Agriculture 2011/12, Agri-Business Promotion and Statistics Division, Statistics Section, Ministry of Agricultural Development, Singha Durbar, Kathmandu, Nepal, 1–170, 2011.
MoCTCA: Nepal Tourism Statistics 2012, Ministry of Culture, Tourism and Civil Aviation, Planning and Evaluation Division, Statistical Section, Singha Darbar, Kathmandu, 1–117, 2013.
MoEST: Ambient Air Quality of Kathmandu Valley, Ministry of Environment, Science and Technology Singh Durbar, Kathmandu, 1–33, 2005.
MoF: Nepal Foreign Trade Statistics, Annual Report 2011/12, Ministry of Finance, Department of Customs, Kathmandu, available at: https://www.customs.gov.np/en/annual.html (last access: 27 April 2017), 2012.
MoF: Nepal Foreign Trade Statistics, Annual Report 2016/17, Ministry of Finance, Department of Customs, Kathmandu, 1–550, 2017.
Nepal, S., Mahapatra, P. S., Adhikari, S., Shrestha, S., Sharma, P., Shrestha, K. L., Pradhan, B. B., and Puppala, S. P.: A Comparative Study of Stack Emissions from Straight-Line and Zigzag Brick Kilns in Nepal, Atmosphere, 10, 1–19, https://doi.org/10.3390/atmos10030107, 2019.
NOC: Nepal Oil Corporation, available at: http://nepaloil.com.np/import?type=sales&offset=0&max=10, last access: 11 January 2019.
Notter, B. and Schmied, M.: Non-road energy consumption and pollutant emissions, Study for the period from 1980 to 2050, Federal Office for the Environment, Bern, Environmental studies no. 1519, 237 pp., 2015.
PACE Nepal: Baseline Study of Selected Sector Industries to Assess the Potentials for more Efficient use of Energy, PACE Nepal Pvt. Ltd., Kathmandu, 1–220, 2012.
Pandey, A. and Venkataraman, C.: Estimating emissions from the Indian transport sector with on-road fleet composition and traffic volume, Atmos. Environ., 98, 123–133, https://doi.org/10.1016/j.atmosenv.2014.08.039, 2014.
Pandey, A., Patel, S., Pervez, S., Tiwari, S., Yadama, G., Chow, J. C., Watson, J. G., Biswas, P., and Chakrabarty, R. K.: Aerosol emissions factors from traditional biomass cookstoves in India: insights from field measurements, Atmos. Chem. Phys., 17, 13721–13729, doi.org/10.5194/acp-17-13721-2017, 2017.
Pandey, P. R. and Banskota N., Process of cement production in Nepal, Bulletin of the Department of Geology, Tribhuvan University, Kathmandu, Nepal, 11, 71–78, https://doi.org/10.3126/bdg.v11i0.1545, 2008.
Pokharel, S.: Energy economics of cooking in households in Nepal, Energy, 29, 547–559, https://doi.org/10.1016/j.energy.2003.10.015, 2004.
Pokhrel, A. K., Bates, M. N., Acharya, J., Valentiner-Branth, P., Chandyo, R. K., Shrestha, P. S., Raut, A. K., and Smith, K. R.: PM2.5 in household kitchens of Bhaktapur, Nepal, using four different cooking fuels, Atmos. Environ., 113, 159–168, https://doi.org/10.1016/j.atmosenv.2015.04.060, 2015.
Pradhan, S., Alea, B. B., and Amatya, V. B.: Mitigation potential of greenhouse gas emission and implications on fuel consumption due to clean energy vehicles as public passenger transport in Kathmandu Valley of Nepal: A case study of trolley buses in Ring Road, Energy, 31, 1748–1760, https://doi.org/10.1016/j.energy.2005.10.013, 2006.
Sadavarte, P. and Venkataraman, C.: Trends in multi-pollutant emissions from a technology-linked inventory for India: I. Industry and transport sectors, Atmos. Environ., 99, 353–364, https://doi.org/10.1016/j.atmosenv.2014.09.081, 2014.
Shah, S. D., Cocker, D. R., Johnson, K. C., Lee, J. M., Soriano, B. L., Wayne and Miller, J.: Emissions of regulated pollutants from in-use diesel back-up generators, Atmos. Environ., 40, 4199–4209, https://doi.org/10.1016/j.atmosenv.2005.12.063, 2006.
Shakya, K. M., Rupakheti, M., Aryal, K., and Peltier, R.: Respiratory effects of high levels of particulate exposure in a cohort of traffic police in Nepal, J. Occup. Environ. Med., 58, 218–225, https://doi.org/10.1097/JOM.0000000000000753, 2016.
Shakya, K. M., Rupakheti, M., Shahi, A., Maskey, R., Pradhan, B., Panday, A., Puppala, S. P., Lawrence, M., and Peltier, R. E.: Near-road sampling of PM2.5, BC, and fine-particle chemical components in Kathmandu Valley, Nepal, Atmos. Chem. Phys., 17, 6503–6516, https://doi.org/10.5194/acp-17-6503-2017, 2017.
Shastri H., Barik, B., Ghosh, S., Venkataraman, C., and Sadavarte, P.: Flip flop of day-night and summer-winter surface urban heat island intensity in India, Sci. Rep., 7, 40178, https://doi.org/10.1038/srep40178, 2017.
Shrestha, R. M. and Rajbhandari, S.: Energy and environmental implications of carbon emission reduction targets: case of Kathmandu valley, Nepal, Energ. Policy, 38, 4818–4827, https://doi.org/10.1016/j.enpol.2009.11.088, 2010.
Shrestha, S. R., Kim Oanh, N. T., Xu, Q., Rupakheti, M., and Lawrence, M. G.: Analysis of the vehicle fleet in the Kathmandu Valley for estimation of environment and climate co-benefits of technology intrusions, Atmos. Environ., 81, 579–590, https://doi.org/10.1016/j.atmosenv.2013.09.050, 2013.
Singh, A., Tuladhar, B., Bajracharya, K., and Pillarisetti, A.: Assessment of effectiveness of improved cookstoves in reducing indoor air pollution and improving health in Nepal, Energy Sustain. Dev., 16, 406–414, https://doi.org/10.1016/j.esd.2012.09.004, 2012.
Smith, K. R: National burden of disease in India from indoor air pollution., P. Natl. Acad. Sci. USA, 97, 13286–13293, https://doi.org/10.1073/pnas.97.24.13286, 2000.
Stockwell, C. E., Christian, T. J., Goetz, J. D., Jayarathne, T., Bhave, P. V., Praveen, P. S., Adhikari, S., Maharjan, R., DeCarlo, P. F., Stone, E. A., Saikawa, E., Blake, D. R., Simpson, I. J., Yokelson, R. J., and Panday, A. K.: Nepal Ambient Monitoring and Source Testing Experiment (NAMaSTE): emissions of trace gases and light-absorbing carbon from wood and dung cooking fires, garbage and crop residue burning, brick kilns, and other sources, Atmos. Chem. Phys., 16, 11043–11081, https://doi.org/10.5194/acp-16-11043-2016, 2016.
Subramanian, R., Winijkul, E., Bond, T. C., Thiansathit, W., Kim Oanh, N. T., Paw-Armart, I., and Duleep, K. G.: Climate-relevant properties of diesel particulate emissions: results from a piggyback study in Bangkok, Thailand, Environ. Sci. Technol., 43, 4213–4218, https://doi.org/10.1021/es8032296, 2009.
WECS: Energy Sector Synopsis Report, Nepal, Water Energy Commission Secretariat, 1–115, 2010.
WECS: Energy Data Sheet, Water Energy Commission Secretariat, 1–16, 2014.
Weyant, C. L., Athalye, V., Ragavan, S., Rajarathnam, U., Lalchandani, D., Maithel, S., and Bond, T. C.: Emissions from South Asian brick production, Environ. Sci. Technol., 46, 13531–13538, https://doi.org/10.1021/es302697h, 2014.
World Bank: Diesel Power Generation: Inventories and Black Carbon Emissions in Kathmandu Valley, Nepal, The World Bank, 1–60, 2014.
Wu, B., Shen, X., Cao, X., Zhang, W., Wu, H., and Yao, Z.: Carbonaceous composition of PM2.5 emitted from on-road China III diesel trucks in Beijing, China, Atmos. Environ., 116, 216–224, https://doi.org/10.1016/j.atmosenv.2015.06.039, 2015.
Yan, F., Winijkul, E., Jung, S., Bond, T. C., and Streets, D. G.: Global emission projections of particulate matter (PM): I. Exhaust emissions from on-road vehicles, Atmos. Environ., 45, 4830–4844, https://doi.org/10.1016/j.atmosenv.2011.06.018, 2011.
Yang, H. H., Dhital, N. B., Wang, L. C., Hsieh, Y. S., Lee, K. T., Hsu, Y. T., and Huang, S. C.: Chemical Characterization of Fine Particulate Matter in Gasoline and Diesel Vehicle Exhaust, Aerosol Air Qual. Res., 19, 1439–1449, https://doi.org/10.4209/aaqr.2019.04.0191, 2019.
Zhang, J., Smith, K. R., Ma, Y., Ye, S., Jiang, F., Qi, W., and Thorneloe, S. A.: Greenhouse gases and other airborne pollutants from household stoves in China: a database for emission factors, Atmos. Environ., 34, 4537–4549, https://doi.org/10.1016/S1352-2310(99)00450-1, 2000.
Zhang, Q., Streets, D. G., Carmichael, G. R., He, K. B., Huo, H., Kannari, A., Klimont, Z., Park, I. S., Reddy, S., Fu, J. S., Chen, D., Duan, L., Lei, Y., Wang, L. T., and Yao, Z. L.: Asian emissions in 2006 for the NASA INTEX-B mission, Atmos. Chem. Phys., 9, 5131–5153, https://doi.org/10.5194/acp-9-5131-2009, 2009.
Zhang, Y., Yao, Z., Shen, X., Liu, H., and He, K.: Chemical characterization of PM2.5 emitted from on-road heavy-duty diesel trucks in China, Atmos. Environ., 122, 885–891, https://doi.org/10.1016/j.atmosenv.2015.07.014, 2015.