the Creative Commons Attribution 4.0 License.
the Creative Commons Attribution 4.0 License.
 | 02 Oct 2019
A large contribution of anthropogenic organo-nitrates to secondary organic aerosol in the Alberta oil sands
Alex K. Y. Lee
Max G. Adam
John Liggio
Shao-Meng Li
Megan D. Willis
Jonathan P. D. Abbatt
Travis W. Tokarek
Charles A. Odame-Ankrah
Hans D. Osthoff
Kevin Strawbridge
Jeffery R. Brook
The oil sands industry in Alberta, Canada, represents a large anthropogenic source of secondary organic aerosol (SOA). Atmospheric emissions from oil sands operations are a complex mixture of gaseous and particulate pollutants. Their interaction can affect the formation and characteristics of SOA during plume dispersion, but their chemical evolution remains poorly understood. Oxidative processing of organic vapours in the presence of NOx can lead to particulate organo-nitrate (pON) formation, with important impacts on the SOA budgets, the nitrogen cycle and human health. We provide the first direct field evidence, from ground- and aircraft-based real-time aerosol mass spectrometry, that anthropogenic pON contributed up to half of SOA mass that was freshly produced within the emission plumes of oil sands facilities. Using a top-down emission-rate retrieval algorithm constrained by aircraft measurements, we estimate the production rate of pON in the oil sands region to be ∼15.5 t d−1. We demonstrate that pON formation occurs via photo-oxidation of intermediate-volatility organic compounds (IVOCs) in high-NOx environments, providing observational constraints to improve current SOA modelling frameworks. Our ambient observations are supported by laboratory photo-oxidation experiments of IVOCs from bitumen vapours under high-NOx conditions, which demonstrate that pON can account for 30 %–55 % of the observed SOA mass depending on the degree of photochemical ageing. The large contribution of pON to freshly formed anthropogenic SOA illustrates the central role of pON in SOA production from the oil and gas industry, with relevance for other urban and industrial regions with significant anthropogenic IVOC and NOx emissions.
- Article
(3843 KB) - Full-text XML
-
Supplement
(1527 KB) - BibTeX
- EndNote


Organo-nitrate (ON), a class of compounds containing the RONO2 and RO2NO2 moieties, comprises 5 %–77 % (by mass) of ambient organic aerosol in North America and Europe (Kiendler-Scharr et al., 2016; Ng et al., 2017). Particle-phase ON (pON) is formed through chemical reactions between volatile organic compounds (VOCs), NOx and atmospheric oxidants, with a strong influence on regional NOx budgets, tropospheric O3 production and atmospheric oxidizing capacity (Lelieveld et al., 2016; Liang et al., 1998; Perring et al., 2013). pON can be transported over long distances and act as a source of NOx in remote locations through gas–particle repartitioning and heterogeneous chemistry (Fry et al., 2013; Liu et al., 2012). Deposition of particulate reactive nitrogen can lead to adverse ecological consequences in nitrogen-limited ecosystems (Matson et al., 2002). Although little is known about the health impacts of pON, inhalation of nitrating reagents in aerosol is thought to be associated with various health risks such as the triggering of immune responses and promoting the genesis of allergies (Pöschl, 2005). Furthermore, pON can be highly functionalized, which has been observed in the events of new particle formation and secondary organic aerosol (SOA) growth (Ehn et al., 2014; Lee et al., 2016), with strong impacts on air quality and climate (Hallquist et al., 2009; Kanakidou et al., 2005).
Many laboratory studies have shown that pON can be produced by photochemical (OH radical initiated) and nocturnal (NO3 radical initiated) oxidation of biogenic and anthropogenic SOA precursors (Lim and Ziemann, 2005; Ng et al., 2017). Extensive field investigations have demonstrated the significant formation of pON via nocturnal NO3 radical chemistry of biogenic VOCs on a global scale (Kiendler-Scharr et al., 2016; Ng et al., 2017). Daytime production of pON has also been observed in urban and forested regions (Farmer et al., 2010; Kiendler-Scharr et al., 2016; L. Lee et al., 2015; Lee et al., 2016), but the potential role of anthropogenic VOCs in pON formation remains largely unexplored. Recently, a field study demonstrated that oil and natural gas drilling operations were associated with alkane-derived pON production (L. Lee et al., 2015). Heavier saturated alkanes were more important contributors to pON formation from OH radical oxidation during the daytime, whereas pON from lighter biogenic VOCs dominated nighttime production due to NO3 and N2O5 chemistry (L. Lee et al., 2015). Despite advances in our understanding of pON, limited direct field observations have been conducted to (1) evaluate the significance of daytime formation of anthropogenic pON, (2) constrain the contribution of pON to anthropogenic SOA in chemical transport models, and (3) identify the major anthropogenic pON precursors in urban environments and regions that are heavily influenced by large-scale industrial and urban emissions.
Unconventional forms of oil production have become an increasingly important source of oil over the past several decades, with the largest oil sands reserve being found in Alberta, Canada (Alberta Energy Regulator, 2014). The Alberta oil sands region has been recognized as a large source of SOA, NOx and gas-phase hydrocarbons with a wide range of volatilities (Li et al., 2017; Liggio et al., 2016; Simpson et al., 2010), and hence the potential exists for oil sands operations to be a significant regional source of pON. Here we present the first direct observational evidence from ground and aircraft measurements that precursor emissions from the Alberta oil sands operations result in the formation of substantial amounts of pON, contributing a significant fraction of freshly formed SOA due to the photo-oxidation of intermediate-volatility organic compounds (IVOCs; saturation concentration (C*) = 103–106 µg m−3) under high-NOx conditions. Our ambient and laboratory measurements illustrate that the observed pON production and the relative importance of pON to the freshly formed SOA depend upon the degree of photochemical ageing in the polluted atmosphere. Our field observations are consistent with our photo-oxidation flow tube experiments exploring pON formation from IVOCs released from bitumen vapours as SOA precursors. Recent modelling work has shown that IVOCs have large impacts on anthropogenic SOA production (Eluri et al., 2017) and global SOA budgets (Hodzic et al., 2016). Our findings highlight the important role of daytime pON formation in SOA production in urban and industrial regions with strong emissions of anthropogenic hydrocarbons in the range of IVOCs and NOx and not only limited to those associated with oil and gas production.
2.1 Ground-based measurements
An Aerodyne soot-particle aerosol mass spectrometer (SP-AMS) was deployed between 11 August and 10 September 2013 at the Air Monitoring Station 13 (AMS13) ground site managed by the Wood Buffalo Environmental Association near Fort MacKay (57.1492∘ N, 111.6422∘ W; ∼270 m a.s.l.), which is located in the scarcely populated Alberta oil sands region. The laser-off and laser-on modes of SP-AMS measurements were used for quantifying the non-refractory particulate matter (NR-PM; including , , and organics) and refractory black carbon (rBC), respectively (A. K. Y. Lee et al., 2015; Onasch et al., 2012), and for performing source-apportionment analysis of ambient organic aerosol via positive matrix factorization (PMF; Ulbrich et al., 2009; Zhang et al., 2011). Single-particle characterization was achieved from 22 to 29 August 2013 by deploying another co-located SP-AMS equipped with a light-scattering module (A. K. Y. Lee et al., 2015) in order to assess the mixing state of the NR-PM during the ground-based campaign. The SP-AMS was calibrated by size-selected ammonium nitrate and Regal Black particles. Further details regarding the calibration and operation of SP-AMS, the quantification of NR-PM and rBC, and the PMF analysis of organic fragments are provided in the Supplement.
The SP-AMS can detect total nitrate, which is the sum of inorganic nitrate and organo-nitrate (ON). Electron impact ionization of nitrate functional groups (-ONO2 and -O2NO2) in ON generates NO+ and fragments. A significantly higher ratio in the ambient measurements compared to that obtained from pure ammonium nitrate (i.e. a calibration standard) can be used an indicator as substantial contribution of ON in the observed organic aerosol. The mass concentrations of pON and inorganic nitrate () can be estimated based on the observed ratio, assuming that the molecular weight and ratio of ON are 200–300 g mol−1 and 5–10, respectively, based on the method previously described in Farmer et al. (2010) and Xu et al. (2015). The details (i.e. equations and assumptions) of such calculations are provided in the Supplement.
The AMS13 site provides a comprehensive suite of meteorological and gas-phase measurements; of these, wind direction, wind speed, temperature, ozone (O3), sulfur dioxide (SO2) and nitrogen dioxides (NOx) were used in the data analysis. Mixing ratios of NOx were also quantified by cavity ring-down spectroscopy (CRDS), and total odd nitrogen (NOy) was measured using a Thermo Scientific 42i gas analyzer. The data were used to determine the −log(NOx∕NOy) ratio for estimating the relative age of air masses. The mixing height data were obtained from a dual-wavelength backscatter lidar which is in continuous and autonomous operation except during periods of precipitation. For details on the data being used in this study, please refer to the Supplement and Tokarek et al. (2018). The bivariate polar plots to illustrate the variation in the concentration of species with wind speed and wind direction were generated using the openair R package and are described in more detail in the Supplement.
2.2 Aircraft measurements
Flights investigating the transformation of oil sands pollutants downwind of facilities were conducted during the same period as the ground-based measurements. The nature of the flights, and the use of TERRA to derive emissions for various pollutants, has been described in great detail in numerous publications (Gordon et al., 2015; Li et al., 2017; Liggio et al., 2016; Tokarek et al., 2018). Briefly, transformation flights were designed as Lagrangian experiments and flown as virtual screens such that plumes were repeatedly sampled at different times downwind with no industrial emissions between the screens. In the current work, a high-resolution time-of-flight aerosol mass spectrometer (HR-ToF-AMS) was used to measure the chemical composition of ambient aerosol particles, and the formation of SOA and pON over time is investigated using primarily Flight 19 (F19), as it was the most successful Lagrangian experiment, having the best agreement between air parcel transport times and aircraft flight times. pON mass was determined in the same manner as for the ground site measurements, using a ratio of 3.5±1.5, as determined during HR-ToF-AMS calibrations.
The TERRA algorithm determines the transfer rate of pollutants through the walls of a virtual screen or box. The transfer rate is derived using the divergence theorem (Gordon et al., 2015). After accounting for horizontal and vertical advection and turbulence, and air density changes, the transfer rate is equivalent to the emission rate of the pollutant. In the current case, the SOA formation rate is the difference in organic aerosol transfer rate between any two screens, assuming that there are no other primary emissions between screens and ignoring dry deposition. The total pON (or SOA) production rate is taken to be the transfer rate through the final screen, and since dry deposition is not accounted for, it is considered to be a lower limit to the actual ON formation rate. The spatial extent of the oil sands plume (including the pON and SOA formation within such plumes) across any given screen is defined using the spatial extent of BC as a surrogate, as it is known to originate from mining activities in the oil sands, as described in Liggio et al. (2016). The total pON production rate over the course of the flight (4 h) is extrapolated to a photochemical day (i.e. tonnes per day) via scaling to the OH radical, as described previously (Liggio et al., 2016).
2.3 Laboratory flow tube experiments
A laboratory study of SOA formation from bitumen vapour was conducted using a 1 L flow tube reactor, which has been described in detail elsewhere (Liu et al., 2014). Briefly, precursors derived from bitumen ore were oxidized by OH radical in the presence of NOx, simulating up to several hours of oxidation. The OH radicals inside the reactor were generated by photolysis of 6 ppm O3 at 254 nm in the presence of water vapour (∼35 % RH). The total flow rate was 0.8 L min−1, resulting in a reaction time inside the reactor of 75 s. A bitumen ore sample obtained directly from an active mine was placed in a glass U tube to which a small flow of zero air was added and introduced into the flow tube. The total gas-phase organic carbon (TOC) concentration was estimated by converting all carbon to CO2 using a Pd catalyst and measuring the resultant CO2 concentration (Veres et al., 2010). The TOC in the flow tube was 375±30 ppbC, corresponding to 25±2 ppb of organic species when assuming an average carbon number of 15 (Liggio et al., 2016). The OH concentration was adjusted by changing the intensity of the 254 nm UV lamp. The OH exposure ranged from 1.11×10¹¹ to 3.06×10¹¹ molecule cm−3 s, which corresponds to 4.3–12.2 h when assuming a daytime OH concentration of 7×10⁶ molecule cm−3, as estimated for polluted areas (Hofzumahaus et al., 2009; Stone et al., 2012) and consistent with estimations for oil sands plumes (Liggio et al., 2016).
As NO was consumed very quickly under the parts per million level of O3 within the flow tube, traditional methods of NO addition to the system are not ideal for high-NOx experiments. Hence, percent-level N2O (2 %) was used to generate NO. N2O reacts with O(1D) (which is formed by photolysis of O3) to generate NO: N2O + O(1D) → 2NO. This approach can provide a relatively high NO concentration uniformly throughout the entire reactor and has proven to be a reliable approach for performing high-NOx experiments using flow tube reactors (Lambe et al., 2017). Using this method, we can achieve a NO concentration of 2–12 ppb and a NO2 concentration of 20–120 ppb. The aerosol composition in the flow tube was measured by a long TOF-AMS (L-TOF-AMS; Aerodyne Research Inc.). In the high-NOx experiments, inorganic nitrate and ON were formed, with both of them generating NO+ and fragments. Hence the inorganic and organic nitrate must be distinguished from each other, and the total N signal was determined by following the approach proposed by Farmer et al. (2010; see Supplement).
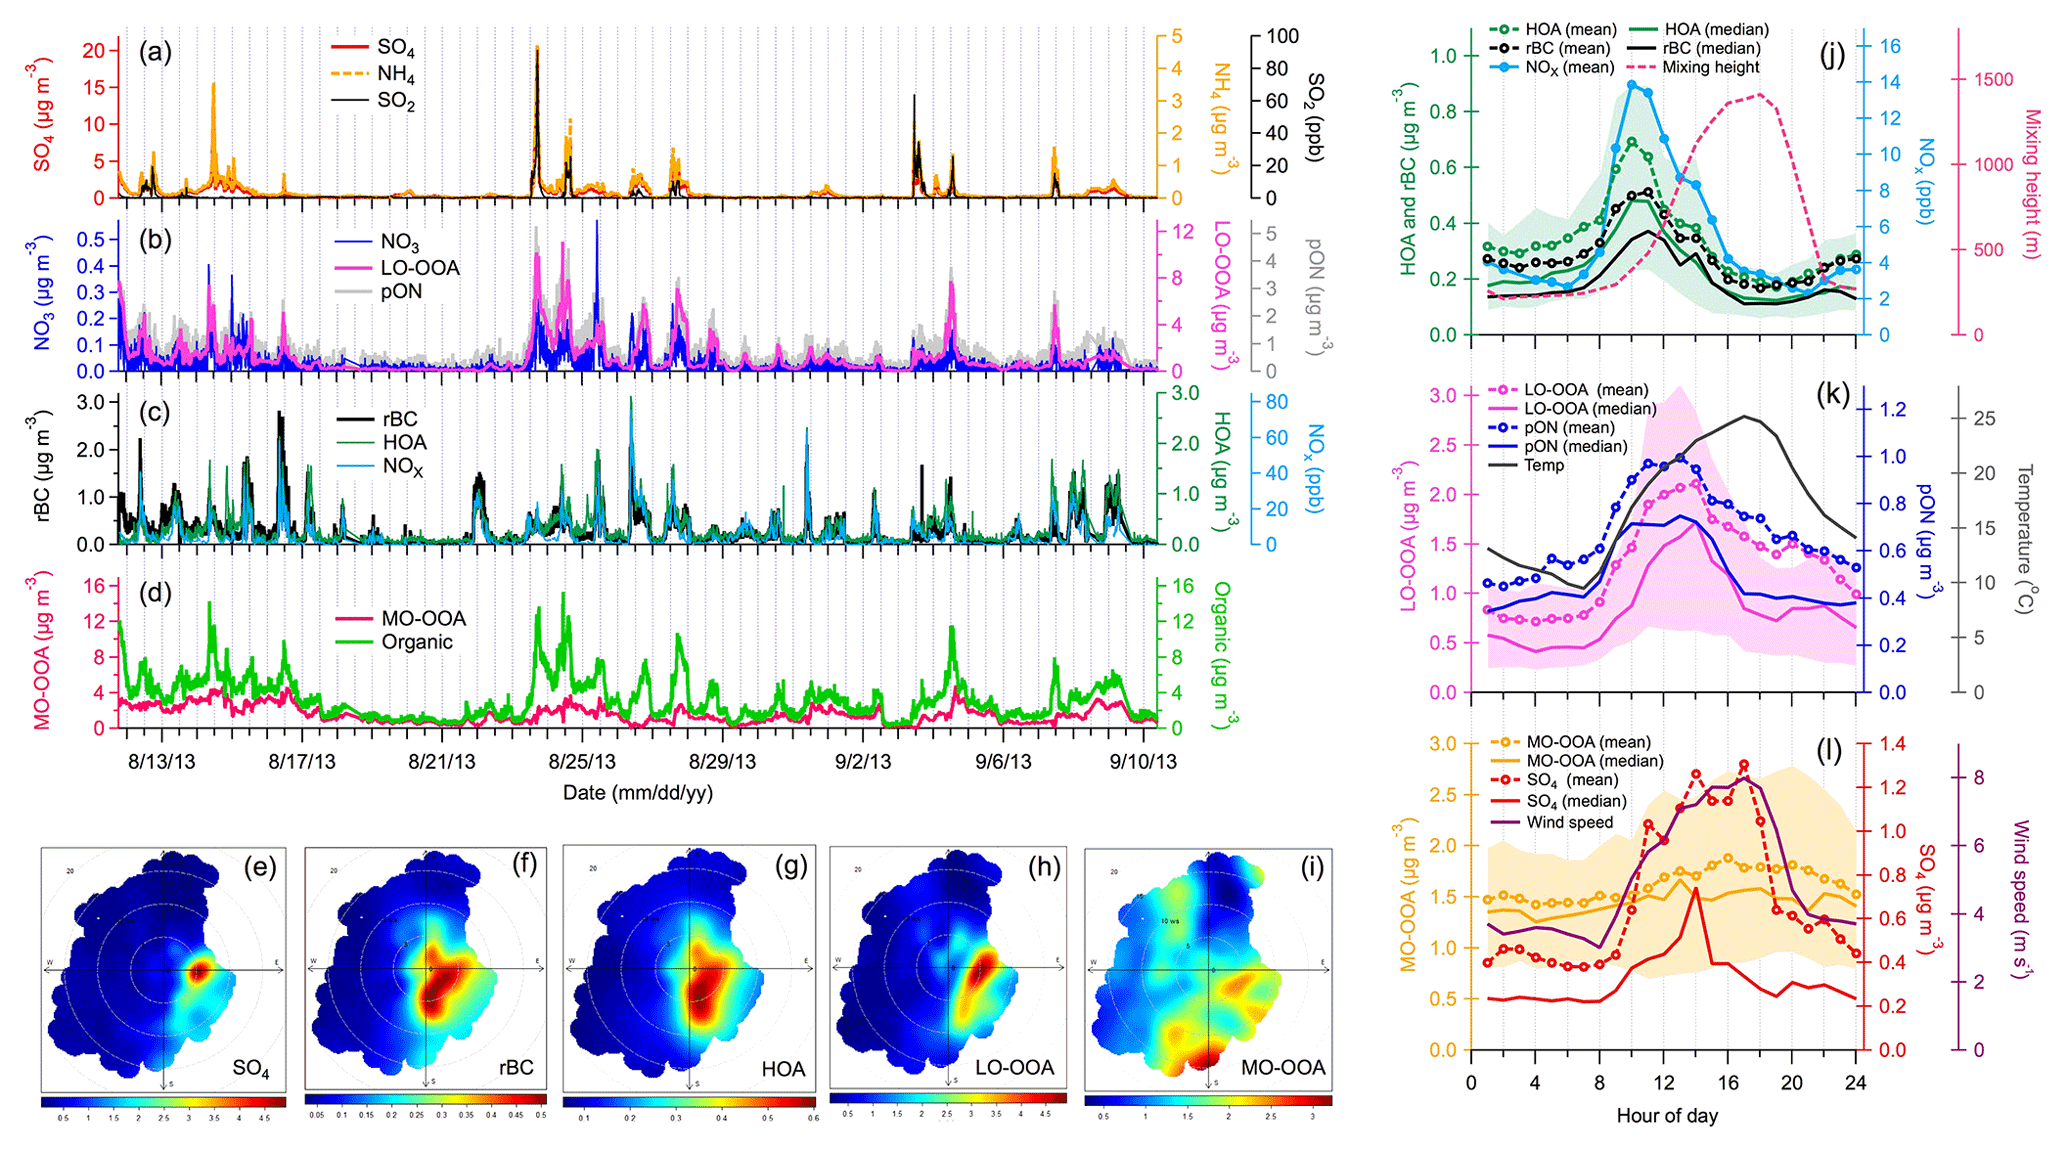
Figure 1Ground-based observations: time series (a–d) and wind rose plots (e–i) of gas-phase species (SO2 and NOx), particle-phase species (organics, SO4, NO3, NH4 and rBC) and PMF factors (HOA, LO-OOA and MO-OOA). Correlations (r2 values) between all these measurements are presented in Table S1 (Supplement) for the entire sampling period. Other wind rose plots are shown in Fig. S11. (j–l) Diurnal patterns of SP-AMS measurements (rBC and SO4), PMF factors (HOA, LO-OOA and MO-OOA), organo-nitrate (pON), NOx, ambient temperature, local wind speeds and mixing height. Diurnal pattern of pON ∕ total OA ratio is shown in Fig. S14. While mean values could reflect the influences of pollutant plumes on mass loadings, median values could better represent the central tendency of measurements that are less affected by individual plumes. Both mean and median values of SP-AMS measurements and PMF factors are presented. The upper and lower values of shaded regions represented 25th and 75th percentiles of diurnal variations in PMF factors, respectively.
The chemical compositions of NR-PM and rBC were measured using a SP-AMS at a ground site (Fig. S1 in the Supplement). Three types of organic aerosol (OA), referred to as hydrocarbon-like OA (HOA), less-oxidized oxygenated OA (LO-OOA) and more-oxidized OOA (MO-OOA) were identified based on PMF of organic fragments (Figs. 1, S2 and S3). HOA accounted for ∼10 % of total OA and was strongly correlated to two combustion tracers, rBC and NOx (r2=0.70 and 0.73; Fig. 1c), primarily emitted from combustion sources such as the mining fleets during the daytime (Tokarek et al., 2018). The LO-OOA and MO-OOA factors were secondary in nature and accounted for 39 % and 51 % of total OA, respectively.
In this work, we focus on the origins and chemical characteristics of LO-OOA, which represents fresh SOA that was largely associated with the observed pON concentrations at the ground site, as discussed in the later sections. Both temporal and diurnal variations in MO-OOA were modest, with a minor enhancement in the afternoon (Fig. 1d and l), probably due to the combined effects of local photochemistry and atmospheric dilution. No noticeable association between MO-OOA and local wind directions was observed (Fig. 1j). Therefore, MO-OOA represents SOA formed via oxidation of VOCs that were relatively well mixed in the atmosphere rather than those freshly emitted from the oil sands facilities. Liggio et al. (2016) also identified this type of background OOA, dominating outside the plumes emitted from oil sands operations in the aircraft measurements. Note that the Alberta oil sands region is largely covered by forest with significant influence of anthropogenic emissions. Both biogenic and anthropogenic precursors could contribute to the observed MO-OOA, but their relative contributions require additional information to be further separated.
3.1 Significant contribution of pON to SOA in oil sands plumes
Strong plumes of gaseous SO2, particulate and LO-OOA were occasionally observed at the ground site, which were primarily transported from the east and southeast directions (Figs. 1 and S11), indicating the presence of large anthropogenic sources in the oil sands region. The largest possible source of SO2 and is upgrading facilities in which sulfur and nitrogen constituents are removed from the bitumen. LO-OOA was moderately correlated with (r2=0.46; Table S1), suggesting that this SOA component (or its precursors) also originated from the oil sands facilities and was subsequently mixed with plumes during dispersion. Furthermore, a fraction of LO-OOA was internally mixed with in sulfate-rich plumes, which is supported by single-particle measurements and PMF analysis during a short period (22–29 August 2013), with relatively large influences from oil sands emission plumes (Figs. S2–S7 and S10–S12). These ground-based observations are in good agreement with the aircraft-based high-resolution aerosol mass spectrometry measurements over the same oil sands region. Two major types of plumes were frequently observed, dominated by either or fresh SOA (i.e. >90 % of total NR-PM mass; Liggio et al., 2016). The mass spectrum of fresh SOA-rich plumes observed on the aircraft (Liggio et al., 2016) was similar to that of LO-OOA observed at the ground site (Fig. S3), confirming the anthropogenic origin of LO-OOA.
The LO-OOA component observed in oil sands plumes was strongly correlated with the total signals for nitrate fragments (i.e. NO+ and ; r2=0.88; Table S1). AMS-measured NO+ and signals can originate from both pON and inorganic nitrate. A significantly higher ratio observed at the ground site compared to that of pure ammonium nitrate (Fig. S8) indicates that pON contributed substantially to the observed NO+ and signals. The mass concentrations of pON and inorganic nitrate () were estimated based on the observed ratio at the ground site, assuming that the molecular weight and ratio of ON are 200–300 g mol−1 and 5–10, respectively (Farmer et al., 2010; Xu et al., 2015). A strong correlation between the mass loadings of pON and LO-OOA (r2=0.77) suggests that ON was a component of LO-OOA, contributing approximately 24 %–53 % of the LO-OOA mass (i.e. represents the lower and upper limits based on different combination of ratios, i.e. 5 and 10, and molecular weight of pON, i.e. 200–300 g mol−1, in the calculation; Fig. S9 and Table S3). Mass loadings of pON and calculated from this approach are shown in Fig. 1b.
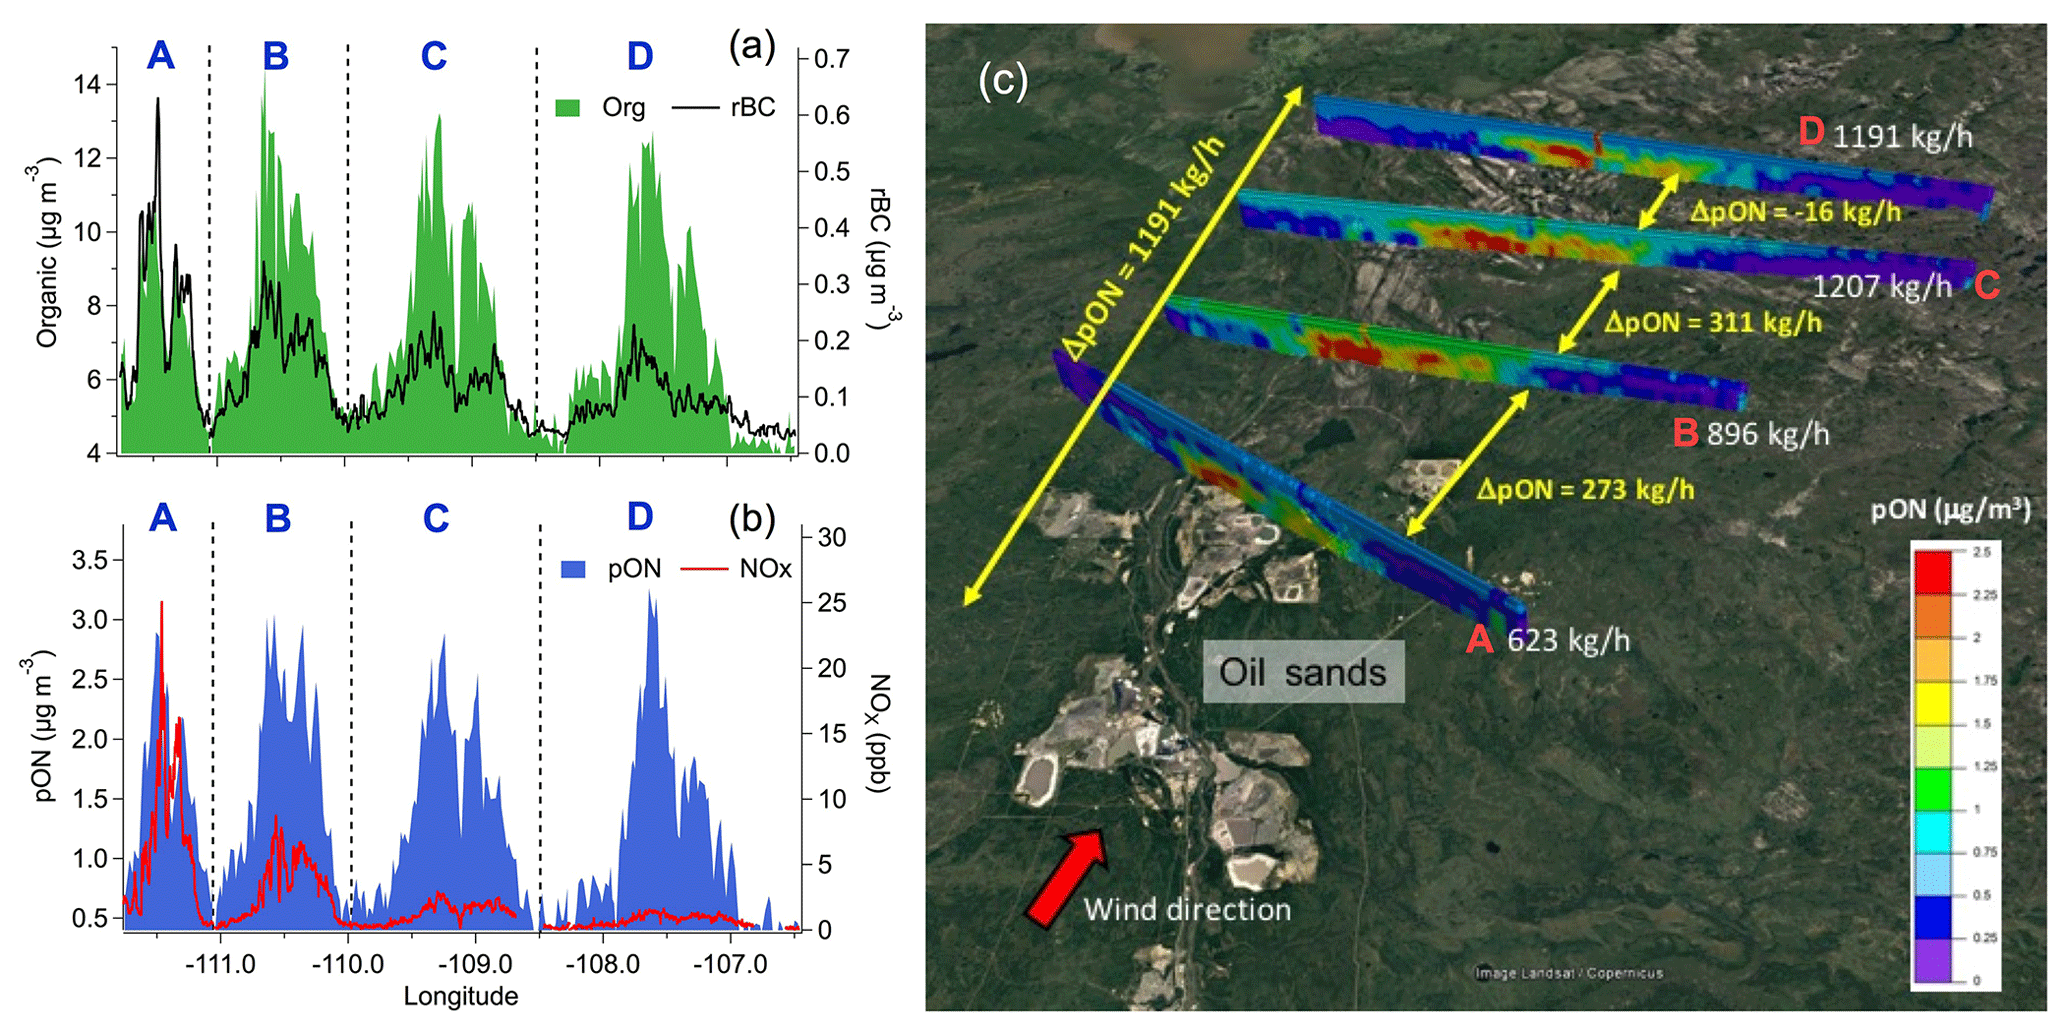
Figure 2Aircraft observations: (a) organic aerosol and rBC and (b) pON and NOx concentrations measured at the four screens (A to D) shown in (c). Organic aerosol and pON concentrations remained roughly constant during dispersion, whereas rBC and NOx decreased continuously. (c) Results from the TERRA algorithm, which estimate a total pON production of 1.2 t h−1 (or 15.5 t d−1) downstream of oil sands operations (i.e. the sum of ΔpON between the four screens – A to D), constrained by the aircraft measurements.
Aircraft measurements were designed to trace the chemical evolution of SOA within plumes downwind of oil sands facilities (Liggio et al., 2016). A higher average value of the ratio of SOA-rich plumes compared to that of pure ammonium nitrate was also observed in our aircraft measurements, further demonstrating the presence of pON in SOA. The pON mass derived from these aircraft measurements correlated well with anthropogenic SOA that was freshly formed during plume dispersion (i.e. both pON and fresh SOA are background subtracted as reported in Liggio et al., 2016; r2=0.71; Figs. 2a, 2b and S13) and accounted for up to ∼34 % (±18 %) of such fresh SOA by mass. Utilizing the top-down emission-rate retrieval algorithm (TERRA; Gordon et al., 2015) and the aircraft-based aerosol mass spectrometry measurements, we derived a significant pON production rate of ∼15.5 t d−1 (or 1.2 t h−1; Fig. 2c). Together, our ground- and aircraft-based measurements provide direct field evidence for a strong association of pON with SOA formation chemistry in the emission plumes of oil sands facilities.
3.2 Daytime pON formation and IVOCs as potential precursors
The diurnal patterns of LO-OOA and pON suggest that their production was driven by daytime photochemistry in the presence of NOx. LO-OOA and pON peaked between 10:00–13:00 LT, in conjunction with the higher levels of NOx (8–13 ppb on average), and had relatively low concentrations during the nighttime (nighttime [pON]avg=0.4–0.6 µg m−3 vs. daytime peak [pON]avg=0.9–1 µg m−3; Fig. 1j and k). Mass concentrations of pON in some of the major emission plumes ranged from 2.2 to 5.3 µg m−3 (Fig. 1b). Tokarek et al. (2018) performed principle component analysis of 28 co-located measurements at the ground site and reported that LO-OOA was strongly associated with unresolved IVOCs measured by gas chromatography–ion trap mass spectrometry (GC-ITMS), while biogenic VOCs including α-pinene, β-pinene and limonene were not associated with LO-OOA. Their results of principle component analysis further illustrated that tailing ponds, mine fleet and vehicle emissions, and mining and processing of raw bitumen are the major sources of IVOCs in the oil sands region. Furthermore, Liggio et al. (2016) illustrated that substantial amounts of fresh SOA could be generated from semi-volatile organic compounds (SVOCs) and IVOCs emitted from oil sands operations (i.e. 86 % of the SOA observed at Screen A of Fig. 2c), dominating over SOA from total traditional biogenic and anthropogenic VOC precursors ( µg m−3). These observations suggest that IVOCs were the major precursors of pON observed in the oil sands region.

Figure 3Comparison between ground-based, aircraft and flow tube data as a function of −log(NOx∕NOy) or photochemical age (PCA): (a) rBC normalized mass loadings of total organic, (b) rBC-normalized mass loadings (mean) of HOA, LO-OOA, MO-OOA and pON, (c) pON ∕ OOA ratios (i.e. OOA is LO-OOA observed from the ground site, OOA is total SOA in the plume observed from the aircraft measurement, and OOA is total SOA produced in the flow tube experiments) and (d) NOx mixing ratio. The pON data presented here are upper limit based on the assumption of RON=5 and MWON=300 g mol−1. The colour scale of solid circles in (a) represents the average carbon oxidation state of OA materials, assuming that ambient daytime OH radical concentration was molecules cm−3 (Liggio et al., 2016) and the major NOx loss product was HNO3. The PCA of air masses (i.e. PCA = [OH]) was estimated using a rate constant between OH radical and NOx for HNO3 formation (krxn) of cm3 molecules−1 s−1 (Brown et al., 1999; Cappa et al., 2012). Only the first two points of ground data were included in (c) as a reference for the pON ∕ OOA ratio of the fresh SOA. Letters A to D in all the panels refer to the measurements at the four screens indicated in Fig. 2c.
Laboratory flow tube experiments were conducted to investigate pON formation through photo-oxidation of bitumen hydrocarbon vapours under high-NOx conditions. The volatility profile of organic vapours evaporated from bitumen ore has been previously reported (Liggio et al., 2016). Bitumen vapours are dominated by species with intermediate volatility (IVOCs; i.e. range from C11–C17 of n-alkane and peak at C13–C14) and are consistent with the IVOC volatility profiles observed at the ground site during polluted periods (Liggio et al., 2016; Tokarek et al., 2018). Based on the results from aerosol mass spectrometry measurements of the flow tube experiments, pON contributed approximately 30 %–55 % of the total SOA mass over an estimated photochemical age (PCA) of 4–12 h, assuming a daytime OH concentration of 7×10⁶ molecule cm−3, which is typical for polluted areas (Hofzumahaus et al., 2009; Stone et al., 2012) and consistent with estimates for oil sands pollution plumes (Liggio et al., 2016). The fractional contribution of pON to SOA determined from the flow tube experiments was in agreement with our ambient field and aircraft observations (Fig. 3c). Note that the pON formation potential of hydrocarbons depends on their molecular structures. Matsunaga and Ziemann (2010) demonstrated that yields of pON due to OH radical oxidation in the presence of NOx increased with the carbon number of 2-methyl-1-alkenes (from C9 to C15), primarily due to enhanced gas-to-particle partitioning, and reached a plateau for C14–C15 precursors that fall into the IVOC range of hydrocarbons observed in the bitumen vapour, as discussed above. Although our results demonstrate that bitumen hydrocarbon vapour has a large potential to produce pON, it is important to note that our flow tube observations might not fully represent our ambient observations. More research is required to investigate the relative importance of different reaction pathways under various atmospheric conditions that are relevant to the oil sands region.
3.3 Decreasing contribution of pON to SOA with photochemical ageing
Using −log(NOx∕NOy) as a proxy of the average PCA of air masses and the organic-to-rBC ratio as an indication of SOA formation, observations at the ground site indicate that SOA concentrations increased continuously and that the overall OA became more oxygenated with increasing PCA up to approximately 4 h (Fig. 3a). Of particular interest is that the rBC-normalized mass concentrations of pON (and LO-OOA) increased with PCA only when PCA was ≤1 h, becoming roughly constant thereafter (Fig. 3b). This observation provides evidence for freshly formed SOA containing pON. The average pON-to-LO-OOA ratios in fresh SOA plumes at the ground site were up to ∼0.6 (red circles in Fig. 3c). Relatively low NOx levels might limit pON production when the estimated PCA >1 h (Fig. 3d; i.e. at times without strong influence from NOx emissions), but the effects of atmospheric mixing of aged background air masses cannot be ruled out. Although the lifetime of anthropogenic pON remains poorly understood, recent laboratory and modelling studies have shown that a short atmospheric lifetime of biogenic VOC-derived pON, on the order of hours, could be due to different chemical loss mechanisms (Boyd et al., 2015; Pye et al., 2015; Zare et al., 2018). Substantial evaporative loss (i.e. LO-OOA generally represents a more volatile fraction of OOA), hydrolysis and photo-degradation of pON when both temperature and photochemical activity were high might limit the net pON production to a longer PCA. Note that pON concentrations at the oil and gas producing region located at Uinta Basin, Utah, during winter could be well described with no additional loss of pON besides turbulent mixing (L. Lee et al., 2015).
Our aircraft-based measurements show that both ΔSOA / ΔrBC and ΔpON / ΔrBC (Δ represents the change in the plume observations after background subtraction) increased continuously as a function of PCA within emission plumes (from flight screen A to D; Fig. 3a and b). This observation confirms that both SOA and pON were freshly formed during their transport up to a PCA of 5–6 h (i.e. extending our observations from the ground site to larger PCA). One of the possible reasons for more sustained pON production in the aircraft observations is that the NOx mixing ratios, and potentially IVOC concentrations, remain relatively high within the plumes compared to at the ground site (Fig. 3d), which was not continuously impacted by plumes. Nevertheless, the contribution of pON to fresh SOA mass decreased with PCA from 0.49 to 0.31 (i.e. further downwind of the oil sands facilities; Fig. 3c). Such a decreasing trend could be due to decreasing mixing ratios of NOx (Fig. 3d) in the plume caused by dilution downwind of the emission source, which may make the formations of non-pON fresh SOA and multi-generation products more important in the later stage of oxidative process, and there may be a larger degree of degradation and evaporative loss of pON as a function of PCA compared to other types of SOA products.
A decreasing trend in the pON-to-SOA ratio (from 0.55 to 0.30) was also observed with PCA in the flow tube experiments (Fig. 3c). However, NOx was not the limiting factor for pON production. The NOx mixing ratios in the flow tube were much higher than those observed from the aircraft and led to higher pON-to-SOA ratios for the flow tube SOA within the similar range of PCA (Fig. 3c and d). The flow tube experiments were conducted at a relatively constant RH (∼35 %) with a fixed residence time of 75 s so that particle-phase hydrolysis is unlikely to be the governing factor of the decreasing trend. Overall, in addition to the effects of the NOx mixing ratio and hydrolysis of pON, both aircraft observations and laboratory flow tube experiments highlight the importance of investigating relative contributions of anthropogenic pON and other SOA products as a function of PCA, especially under atmospherically relevant conditions that allow multi-step oxidation of precursors and intermediate products.
Ambient observations involving a comprehensive suite of ground- and aircraft-based measurements in the Alberta oil sands region, combined with laboratory flow tube experiments, have shown that daytime production of anthropogenic pON can contribute up to ∼50 % of fresh SOA. Utilizing aircraft data and the TERRA algorithm, we estimate a pON production rate of 15 t d−1 from the Alberta oil sands region. Given the recent observation that oil sands operations in Alberta can be one of the largest anthropogenic sources of SOA in North America (45–84 t d−1) in comparison with the estimated SOA production rates in different cities (Liggio et al., 2016), the production of pON in the oil sands pollutant plumes can be significant on regional or continental scales. Schwantes et al. (2019) reported that collection efficiency and/or relative ionization efficiency of pON produced via photo-oxidation of isoprene was lower than that of other isoprene-SOA products in AMS measurements. Although such measurement uncertainty has not been generalized for pON generated from other SOA precursors, underestimation of pON mass contribution to total SOA is possible in this work.
Despite the Alberta oil sands region being largely vegetated, both ground- and aircraft-based observations suggest that nocturnal chemistry of NO3 radicals and biogenic VOCs was not the key formation mechanism of pON in the Alberta oil sands during our field campaign. Rather, this work provides direct evidence for a significant contribution of pON to fresh anthropogenic SOA, driven by photochemistry and emission of IVOCs and NOx from large-scale industrial facilities. Our aircraft measurements have shown that hydrocarbons including alkanes and aromatics are dominant gas-phase precursors within the plumes (Li et al., 2017). There is increasing evidence that IVOCs emitted from vehicle and other petroleum-based sources can lead to substantial anthropogenic SOA production in urban environments (Liu et al., 2017; Zhao et al., 2014, 2015). Such urban IVOCs comprise different molecular structures of alkanes and aromatics, which can form SOA with much higher yields (5 times) compared to single-ring aromatic VOCs (Zhao et al., 2014). Including IVOCs in SOA prediction models can have a great impact on estimating the production of anthropogenic SOA in urban environments and global SOA budgets (Eluri et al., 2017; Hodzic et al., 2016). However, anthropogenic pON formation chemistry has not been fully integrated into current SOA prediction models. Although IVOC chemical compositions remain largely unspeciated (∼80 %–90 % of total IVOCs) in urban air and vehicle emissions (Zhao et al., 2014, 2015), our findings highlight the significance of investigating the role of pON formation in SOA production in other urban and industrial regions with strong emissions of hydrocarbon in the range of IVOCs.
Both aircraft observations and flow tube experiments demonstrate that the mass fraction of pON in fresh SOA decreases as a function of PCA of the air masses. However, detailed anthropogenic pON formation and degradation mechanisms, and their lifetime, remain poorly understood. More research is required to improve our understanding on the sources and sinks of anthropogenic pON for constraining chemical transport models as well as their subsequent environmental implications. pON accounted for up to 21 % of total OA mass (i.e. HOA + LO-OOA + MO-OOA) in the Alberta oil sands region, which is comparable to other locations worldwide (Kiendler-Scharr et al., 2016; Ng et al., 2017). In contrast, the average mass fraction of organic -ONO2 functionality to total particulate nitrate (i.e. organic -ONO2 + NO3) was 0.83, which is much higher than the average (0.33) reported in North America and Europe (Kiendler-Scharr et al., 2016; Ng et al., 2017). Given that pON can be converted back to NOx during atmospheric transport, the large contribution of organic -ONO2 to total particulate nitrate may have significant implications for the predictions of nitrogen deposition (including nitrogen from NO2 and total particulate nitrate) from the industrial center to the surrounding boreal forest ecosystem and regions (Fenn et al., 2015; Hsu et al., 2016).
The data set for this publication is available upon contacting the corresponding authors.
The supplement related to this article is available online at: https://doi.org/10.5194/acp-19-12209-2019-supplement.
AKYL prepared the paper, with contributions from all co-authors. AKYL, MDW, TWT, CAO-A and HDO operated the instruments in the field and analyzed resulting data. MGA analyzed the field data. AKYL, MDW, JPDA and JRB designed the field experiment. JL and S-ML designed, conducted and analyzed the aircraft measurements. JL and KL designed and conducted the laboratory experiments. KS analyzed mixing height data.
The authors declare that they have no conflict of interest.
This article is part of the special issue “Atmospheric emissions from oil sands development and their transport, transformation and deposition (ACP/AMT inter-journal SI)”. It is not associated with a conference.
Funding for this work was provided by the Natural Sciences and Engineering Research Council of Canada (NSERC), Environment and Climate Change Canada, and the Oil Sands Monitoring Program (JOSM). AKYL and MGA were supported by the National University of Singapore start-up grant (R-302-000-173-133).
This paper was edited by Sally E. Pusede and reviewed by two anonymous referees.
Alberta Energy Regulator: Alberta's Energy Reserves 2014 and Supply/Demand Outlook 2015–2024, 2014.
Boyd, C. M., Sanchez, J., Xu, L., Eugene, A. J., Nah, T., Tuet, W. Y., Guzman, M. I., and Ng, N. L.: Secondary organic aerosol formation from the β-pinene + NO3 system: effect of humidity and peroxy radical fate, Atmos. Chem. Phys., 15, 7497–7522, https://doi.org/10.5194/acp-15-7497-2015, 2015.
Brown, S. S., Talukdar, R. K., and Ravishankara, A. R.: Rate constants for the reaction OH + NO2 +MHNO3 + M under atmospheric conditions, Chem. Phys. Lett., 299, 277–284, https://doi.org/10.1016/s0009-2614(98)01283-4, 1999.
Cappa, C. D., Onasch, T. B., Massoli, P., Worsnop, D. R., Bates, T. S., Cross, E. S., Davidovits, P., Hakala, J., Hayden, K. L., Jobson, B. T., Kolesar, K. R., Lack, D. A., Lerner, B. M., Li, S. M., Mellon, D., Nuaaman, I., Olfert, J. S., Petaja, T., Quinn, P. K., Song, C., Subramanian, R., Williams, E. J., and Zaveri, R. A.: Radiative Absorption Enhancements Due to the Mixing State of Atmospheric Black Carbon, Science, 337, 1078–1081, https://doi.org/10.1126/science.1223447, 2012.
Ehn, M., Thornton, J. A., Kleist, E., Sipila, M., Junninen, H., Pullinen, I., Springer, M., Rubach, F., Tillmann, R., Lee, B., Lopez-Hilfiker, F., Andres, S., Acir, I. H., Rissanen, M., Jokinen, T., Schobesberger, S., Kangasluoma, J., Kontkanen, J., Nieminen, T., Kurten, T., Nielsen, L. B., Jorgensen, S., Kjaergaard, H. G., Canagaratna, M., Dal Maso, M., Berndt, T., Petaja, T., Wahner, A., Kerminen, V. M., Kulmala, M., Worsnop, D. R., Wildt, J., and Mentel, T. F.: A large source of low-volatility secondary organic aerosol, Nature, 506, 476–479, https://doi.org/10.1038/nature13032, 2014.
Eluri, S., Cappa, C. D., Friedman, B., Farmer, D. K., and Jathar, S. H.: Modeling the formation and composition of secondary organic aerosol from diesel exhaust using parameterized and semi-explicit chemistry and thermodynamic models, Atmos. Chem. Phys., 18, 13813–13838, https://doi.org/10.5194/acp-18-13813-2018, 2018.
Farmer, D. K., Matsunaga, A., Docherty, K. S., Surratt, J. D., Seinfeld, J. H., Ziemann, P. J., and Jimenez, J. L.: Response of an aerosol mass spectrometer to organonitrates and organosulfates and implications for atmospheric chemistry, P. Natl. Acad. Sci. USA, 107, 6670–6675, https://doi.org/10.1073/pnas.0912340107, 2010.
Fenn, M. E., Bytnerowicz, A., Schilling, S. L., and Ross, C. S.: Atmospheric deposition of nitrogen, sulfur and base cations in jack pine stands in the Athabasca Oil Sands Region, Alberta, Canada, Environ. Poll., 196, 497–510, https://doi.org/10.1016/j.envpol.2014.08.023, 2015.
Fry, J. L., Draper, D. C., Zarzana, K. J., Campuzano-Jost, P., Day, D. A., Jimenez, J. L., Brown, S. S., Cohen, R. C., Kaser, L., Hansel, A., Cappellin, L., Karl, T., Hodzic Roux, A., Turnipseed, A., Cantrell, C., Lefer, B. L., and Grossberg, N.: Observations of gas- and aerosol-phase organic nitrates at BEACHON-RoMBAS 2011, Atmos. Chem. Phys., 13, 8585–8605, https://doi.org/10.5194/acp-13-8585-2013, 2013.
Gordon, M., Li, S.-M., Staebler, R., Darlington, A., Hayden, K., O'Brien, J., and Wolde, M.: Determining air pollutant emission rates based on mass balance using airborne measurement data over the Alberta oil sands operations, Atmos. Meas. Tech., 8, 3745–3765, https://doi.org/10.5194/amt-8-3745-2015, 2015.
Hallquist, M., Wenger, J. C., Baltensperger, U., Rudich, Y., Simpson, D., Claeys, M., Dommen, J., Donahue, N. M., George, C., Goldstein, A. H., Hamilton, J. F., Herrmann, H., Hoffmann, T., Iinuma, Y., Jang, M., Jenkin, M. E., Jimenez, J. L., Kiendler-Scharr, A., Maenhaut, W., McFiggans, G., Mentel, Th. F., Monod, A., Prévôt, A. S. H., Seinfeld, J. H., Surratt, J. D., Szmigielski, R., and Wildt, J.: The formation, properties and impact of secondary organic aerosol: current and emerging issues, Atmos. Chem. Phys., 9, 5155–5236, https://doi.org/10.5194/acp-9-5155-2009, 2009.
Hodzic, A., Kasibhatla, P. S., Jo, D. S., Cappa, C. D., Jimenez, J. L., Madronich, S., and Park, R. J.: Rethinking the global secondary organic aerosol (SOA) budget: stronger production, faster removal, shorter lifetime, Atmos. Chem. Phys., 16, 7917–7941, https://doi.org/10.5194/acp-16-7917-2016, 2016.
Hofzumahaus, A., Rohrer, F., Lu, K. D., Bohn, B., Brauers, T., Chang, C. C., Fuchs, H., Holland, F., Kita, K., Kondo, Y., Li, X., Lou, S. R., Shao, M., Zeng, L. M., Wahner, A., and Zhang, Y. H.: Amplified Trace Gas Removal in the Troposphere, Science, 324, 1702–1704, 10.1126/science.1164566, 2009.
Hsu, Y. M., Bytnerowicz, A., Fenn, M. E., and Percy, K. E.: Atmospheric dry deposition of sulfur and nitrogen in the Athabasca Oil Sands Region, Alberta, Canada, Sci. Total Environ., 568, 285–295, https://doi.org/10.1016/j.scitotenv.2016.05.205, 2016.
Kanakidou, M., Seinfeld, J. H., Pandis, S. N., Barnes, I., Dentener, F. J., Facchini, M. C., Van Dingenen, R., Ervens, B., Nenes, A., Nielsen, C. J., Swietlicki, E., Putaud, J. P., Balkanski, Y., Fuzzi, S., Horth, J., Moortgat, G. K., Winterhalter, R., Myhre, C. E. L., Tsigaridis, K., Vignati, E., Stephanou, E. G., and Wilson, J.: Organic aerosol and global climate modelling: a review, Atmos. Chem. Phys., 5, 1053–1123, https://doi.org/10.5194/acp-5-1053-2005, 2005.
Kiendler-Scharr, A., Mensah, A. A., Friese, E., Topping, D., Nemitz, E., Prevot, A. S. H., Aijala, M., Allan, J., Canonaco, F., Canagaratna, M., Carbone, S., Crippa, M., Dall Osto, M., Day, D. A., De Carlo, P., Di Marco, C. F., Elbern, H., Eriksson, A., Freney, E., Hao, L., Herrmann, H., Hildebrandt, L., Hillamo, R., Jimenez, J. L., Laaksonen, A., McFiggans, G., Mohr, C., O'Dowd, C., Otjes, R., Ovadnevaite, J., Pandis, S. N., Poulain, L., Schlag, P., Sellegri, K., Swietlicki, E., Tiitta, P., Vermeulen, A., Wahner, A., Worsnop, D., and Wu, H. C.: Ubiquity of organic nitrates from nighttime chemistry in the European submicron aerosol, Geophys. Res. Lett., 43, 7735–7744, https://doi.org/10.1002/2016gl069239, 2016.
Lambe, A., Massoli, P., Zhang, X., Canagaratna, M., Nowak, J., Daube, C., Yan, C., Nie, W., Onasch, T., Jayne, J., Kolb, C., Davidovits, P., Worsnop, D., and Brune, W.: Controlled nitric oxide production via O(1D) + N2O reactions for use in oxidation flow reactor studies, Atmos. Meas. Tech., 10, 2283–2298, https://doi.org/10.5194/amt-10-2283-2017, 2017.
Lee, A. K. Y., Willis, M. D., Healy, R. M., Onasch, T. B., and Abbatt, J. P. D.: Mixing state of carbonaceous aerosol in an urban environment: single particle characterization using the soot particle aerosol mass spectrometer (SP-AMS), Atmos. Chem. Phys., 15, 1823–1841, https://doi.org/10.5194/acp-15-1823-2015, 2015.
Lee, L., Wooldridge, P. J., deGouw, J., Brown, S. S., Bates, T. S., Quinn, P. K., and Cohen, R. C.: Particulate organic nitrates observed in an oil and natural gas production region during wintertime, Atmos. Chem. Phys., 15, 9313–9325, https://doi.org/10.5194/acp-15-9313-2015, 2015.
Lee, B. H., Mohr, C., Lopez-Hilfiker, F. D., Lutz, A., Hallquist, M., Lee, L., Romer, P., Cohen, R. C., Iyer, S., Kurten, T., Hu, W. W., Day, D. A., Campuzano-Jost, P., Jimenez, J. L., Xu, L., Ng, N. L., Guo, H. Y., Weber, R. J., Wild, R. J., Brown, S. S., Koss, A., de Gouw, J., Olson, K., Goldstein, A. H., Seco, R., Kim, S., McAvey, K., Shepson, P. B., Starn, T., Baumann, K., Edgerton, E. S., Liu, J. M., Shilling, J. E., Miller, D. O., Brune, W., Schobesberger, S., D'Ambro, E. L., and Thornton, J. A.: Highly functionalized organic nitrates in the southeast United States: Contribution to secondary organic aerosol and reactive nitrogen budgets, P. Natl. Acad. Sci. USA, 113, 1516–1521, https://doi.org/10.1073/pnas.1508108113, 2016.
Lelieveld, J., Gromov, S., Pozzer, A., and Taraborrelli, D.: Global tropospheric hydroxyl distribution, budget and reactivity, Atmos. Chem. Phys., 16, 12477–12493, https://doi.org/10.5194/acp-16-12477-2016, 2016.
Li, S. M., Leithead, A., Moussa, S. G., Liggio, J., Moran, M. D., Wang, D., Hayden, K., Darlington, A., Gordon, M., Staebler, R., Makar, P. A., Stroud, C. A., McLaren, R., Liu, P. S. K., O'Brien, J., Mittermeier, R. L., Zhang, J. H., Marson, G., Cober, S. G., Wolde, M., and Wentzell, J. J. B.: Differences between measured and reported volatile organic compound emissions from oil sands facilities in Alberta, Canada, P. Natl. Acad. Sci. USA, 114, 3756–3765, https://doi.org/10.1073/pnas.1617862114, 2017.
Liang, J. Y., Horowitz, L. W., Jacob, D. J., Wang, Y. H., Fiore, A. M., Logan, J. A., Gardner, G. M., and Munger, J. W.: Seasonal budgets of reactive nitrogen species and ozone over the United States, and export fluxes to the global atmosphere, J. Geophys. Res.-Atmos., 103, 13435–13450, https://doi.org/10.1029/97jd03126, 1998.
Liggio, J., Li, S. M., Hayden, K., Taha, Y. M., Stroud, C., Darlington, A., Drollette, B. D., Gordon, M., Lee, P., Liu, P., Leithead, A., Moussa, S. G., Wang, D., O'Brien, J., Mittermeier, R. L., Brook, J. R., Lu, G., Staebler, R. M., Han, Y. M., Tokarek, T. W., Osthoff, H. D., Makar, P. A., Zhang, J. H., Plata, D. L., and Gentner, D. R.: Oil sands operations as a large source of secondary organic aerosols, Nature, 534, 91–94, https://doi.org/10.1038/nature17646, 2016.
Lim, Y. B., and Ziemann, P. J.: Products and mechanism of secondary organic aerosol formation from reactions of n-alkanes with OH radicals in the presence of NOx, Environ. Sci. Technol., 39, 9229–9236, https://doi.org/10.1021/es051447g, 2005.
Liu, H., Man, H., Cui, H., Wang, Y., Deng, F., Wang, Y., Yang, X., Xiao, Q., Zhang, Q., Ding, Y., and He, K.: An updated emission inventory of vehicular VOCs and IVOCs in China, Atmos. Chem. Phys., 17, 12709–12724, https://doi.org/10.5194/acp-17-12709-2017, 2017.
Liu, S., Shilling, J. E., Song, C., Hiranuma, N., Zaveri, R. A., and Russell, L. M.: Hydrolysis of Organonitrate Functional Groups in Aerosol Particles, Aerosol Sci. Tech., 46, 1359–1369, https://doi.org/10.1080/02786826.2012.716175, 2012.
Liu, Y. C., Liggio, J., Harner, T., Jantunen, L., Shoeib, M., and Li, S. M.: Heterogeneous OH Initiated Oxidation: A Possible Explanation for the Persistence of Organophosphate Flame Retardants in Air, Environ. Sci. Technol., 48, 1041–1048, https://doi.org/10.1021/es404515k, 2014.
Matson, P., Lohse, K. A., and Hall, S. J.: The globalization of nitrogen deposition: Consequences for terrestrial ecosystems, Ambio, 31, 113–119, https://doi.org/10.1639/0044-7447(2002)031[0113:tgondc]2.0.co;2, 2002.
Matsunaga, A. and Ziemann, P. J.: Yields of beta-hydroxynitrates, dihydroxynitrates, and trihydroxynitrates formed from OH radical-initiated reactions of 2-methyl-1-alkenes, P. Natl. Acad. Sci. USA, 107, 6664–6669, https://doi.org/10.1073/pnas.0910585107, 2010.
Ng, N. L., Brown, S. S., Archibald, A. T., Atlas, E., Cohen, R. C., Crowley, J. N., Day, D. A., Donahue, N. M., Fry, J. L., Fuchs, H., Griffin, R. J., Guzman, M. I., Herrmann, H., Hodzic, A., Iinuma, Y., Jimenez, J. L., Kiendler-Scharr, A., Lee, B. H., Luecken, D. J., Mao, J., McLaren, R., Mutzel, A., Osthoff, H. D., Ouyang, B., Picquet-Varrault, B., Platt, U., Pye, H. O. T., Rudich, Y., Schwantes, R. H., Shiraiwa, M., Stutz, J., Thornton, J. A., Tilgner, A., Williams, B. J., and Zaveri, R. A.: Nitrate radicals and biogenic volatile organic compounds: oxidation, mechanisms, and organic aerosol, Atmos. Chem. Phys., 17, 2103–2162, https://doi.org/10.5194/acp-17-2103-2017, 2017.
Onasch, T., Trimborn, A., Fortner, E., Jayne, J., Kok, G., Williams, L., Davidovits, P., and Worsnop, D.: Soot particle aerosol mass spectrometer: development, validation, and initial application, Aerosol Sci. Tech., 46, 804–817, 2012.
Perring, A. E., Pusede, S. E., and Cohen, R. C.: An Observational Perspective on the Atmospheric Impacts of Alkyl and Multifunctional Nitrates on Ozone and Secondary Organic Aerosol, Chem. Rev., 113, 5848–5870, https://doi.org/10.1021/cr300520x, 2013.
Pöschl, U.: Atmospheric aerosols: Composition, transformation, climate and health effects, Angewandte Chemie-International Edition, 44, 7520–7540, https://doi.org/10.1002/anie.200501122, 2005.
Pye, H. O. T., Luecken, D. J., Xu, L., Boyd, C. M., Ng, N. L., Baker, K. R., Ayres, B. R., Bash, J. O., Baumann, K., Carter, W. P. L., Edgerton, E., Fry, J. L., Hutzell, W. T., Schwede, D. B., and Shepson, P. B.: Modeling the Current and Future Roles of Particulate Organic Nitrates in the Southeastern United States, Environ. Sci. Technol., 49, 14195–14203, https://doi.org/10.1021/acs.est.5b03738, 2015.
Schwantes, R. H., Charan, S. M., Bates, K. H., Huang, Y., Nguyen, T. B., Mai, H., Kong, W., Flagan, R. C., and Seinfeld, J. H.: Low-volatility compounds contribute significantly to isoprene secondary organic aerosol (SOA) under high-NOx conditions, Atmos. Chem. Phys., 19, 7255–7278, https://doi.org/10.5194/acp-19-7255-2019, 2019.
Simpson, I. J., Blake, N. J., Barletta, B., Diskin, G. S., Fuelberg, H. E., Gorham, K., Huey, L. G., Meinardi, S., Rowland, F. S., Vay, S. A., Weinheimer, A. J., Yang, M., and Blake, D. R.: Characterization of trace gases measured over Alberta oil sands mining operations: 76 speciated C2–C10 volatile organic compounds (VOCs), CO2, CH4, CO, NO, NO2, NOy, O3 and SO2, Atmos. Chem. Phys., 10, 11931–11954, https://doi.org/10.5194/acp-10-11931-2010, 2010.
Stone, D., Whalley, L. K., and Heard, D. E.: Tropospheric OH and HO2 radicals: field measurements and model comparisons, Chem. Soc. Rev., 41, 6348–6404, https://doi.org/10.1039/c2cs35140d, 2012.
Tokarek, T. W., Odame-Ankrah, C. A., Huo, J. A., McLaren, R., Lee, A. K. Y., Adam, M. G., Willis, M. D., Abbatt, J. P. D., Mihele, C., Darlington, A., Mittermeier, R. L., Strawbridge, K., Hayden, K. L., Olfert, J. S., Schnitzler, E. G., Brownsey, D. K., Assad, F. V., Wentworth, G. R., Tevlin, A. G., Worthy, D. E. J., Li, S.-M., Liggio, J., Brook, J. R., and Osthoff, H. D.: Principal component analysis of summertime ground site measurements in the Athabasca oil sands with a focus on analytically unresolved intermediate-volatility organic compounds, Atmos. Chem. Phys., 18, 17819–17841, https://doi.org/10.5194/acp-18-17819-2018, 2018.
Ulbrich, I. M., Canagaratna, M. R., Zhang, Q., Worsnop, D. R., and Jimenez, J. L.: Interpretation of organic components from Positive Matrix Factorization of aerosol mass spectrometric data, Atmos. Chem. Phys., 9, 2891–2918, https://doi.org/10.5194/acp-9-2891-2009, 2009.
Veres, P., Gilman, J. B., Roberts, J. M., Kuster, W. C., Warneke, C., Burling, I. R., and de Gouw, J.: Development and validation of a portable gas phase standard generation and calibration system for volatile organic compounds, Atmos. Meas. Tech., 3, 683–691, https://doi.org/10.5194/amt-3-683-2010, 2010.
Xu, L., Guo, H. Y., Boyd, C. M., Klein, M., Bougiatioti, A., Cerully, K. M., Hite, J. R., Isaacman-VanWertz, G., Kreisberg, N. M., Knote, C., Olson, K., Koss, A., Goldstein, A. H., Hering, S. V., de Gouw, J., Baumann, K., Lee, S. H., Nenes, A., Weber, R. J., and Ng, N. L.: Effects of anthropogenic emissions on aerosol formation from isoprene and monoterpenes in the southeastern United States, P. Natl. Acad. Sci. USA, 112, 37–42, https://doi.org/10.1073/pnas.1417609112, 2015.
Zare, A., Romer, P. S., Nguyen, T., Keutsch, F. N., Skog, K., and Cohen, R. C.: A comprehensive organic nitrate chemistry: insights into the lifetime of atmospheric organic nitrates, Atmos. Chem. Phys., 18, 15419–15436, https://doi.org/10.5194/acp-18-15419-2018, 2018.
Zhang, Q., Jimenez, J. L., Canagaratna, M. R., Ulbrich, I. M., Ng, N. L., Worsnop, D. R., and Sun, Y. L.: Understanding atmospheric organic aerosols via factor analysis of aerosol mass spectrometry: a review, Anal. Bioanal. Chem., 401, 3045–3067, https://doi.org/10.1007/s00216-011-5355-y, 2011.
Zhao, Y. L., Hennigan, C. J., May, A. A., Tkacik, D. S., de Gouw, J. A., Gilman, J. B., Kuster, W. C., Borbon, A., and Robinson, A. L.: Intermediate-Volatility Organic Compounds: A Large Source of Secondary Organic Aerosol, Environ. Sci. Technol., 48, 13743–13750, https://doi.org/10.1021/es5035188, 2014.
Zhao, Y. L., Nguyen, N. T., Presto, A. A., Hennigan, C. J., May, A. A., and Robinson, A. L.: Intermediate Volatility Organic Compound Emissions from On-Road Diesel Vehicles: Chemical Composition, Emission Factors, and Estimated Secondary Organic Aerosol Production, Environ. Sci. Technol., 49, 11516–11526, https://doi.org/10.1021/acs.est.3b02841, 2015.