the Creative Commons Attribution 4.0 License.
the Creative Commons Attribution 4.0 License.
 | 06 Sep 2019
Ozone enhancement due to the photodissociation of nitrous acid in eastern China
Xuexi Tie
Xin Long
Guohui Li
Shuyu Zhao
Junji Cao
Jianming Xu
PM2.5, particulate matter with a diameter of 2.5 µm or less, is one of the major components of air pollution in eastern China. In the past few years, China's government has made strong efforts to reduce PM2.5 pollution. However, another important pollutant (ozone) is becoming a problem in eastern China. Ozone (O3) is produced by photochemistry, which requires solar radiation for the formation of O3. Under heavy PM2.5 pollution, solar radiation is often depressed, and the photochemical production of O3 is prohibited. This study shows that during late spring and early fall in eastern China, under heavy PM2.5 pollution, there was often strong O3 photochemical production, causing a co-occurrence of high PM2.5 and O3 concentrations. This co-occurrence of high PM2.5 and O3 is unusual and is the main focus of this study. Recent measurements show that there were often high HONO surface concentrations in major Chinese megacities, especially during daytime, with maximum concentrations ranging from 0.5 to 2 ppbv. It is also interesting to note that high HONO concentrations occurred during high aerosol concentration periods, suggesting that there were additional HONO surface sources in eastern China. Under high daytime HONO concentrations, HONO can be photodissociated to OH radicals, which enhance the photochemical production of O3. In order to study the above scientific issues, a radiative transfer model (TUV; tropospheric ultraviolet–visible) is used in this study, and a chemical steady-state model is established to calculate OH radical concentrations. The calculations show that by including the OH production of photodissociated HONO, the calculated OH concentrations are significantly higher than the values without including this production. For example, by including HONO production, the maximum OH concentration under high aerosol conditions (AOD = 2.5) is similar to the value under low aerosol conditions (AOD = 0.25) in the no-HONO case. This result suggests that even under high aerosol conditions, the chemical oxidizing process for O3 production can occur, which explains the co-occurrence of high PM2.5 and high O3 in late spring and early fall in eastern China. However, the O3 concentrations were not significantly affected by the appearance of HONO in winter. This study shows that the seasonal variation of solar radiation plays important roles for controlling the OH production in winter. Because solar radiation is at a very low level in winter, adding the photolysis of HONO has a smaller effect in winter than in other seasons, and OH remains at low values by including the HONO production term. This study provides some important scientific insight to better understand O3 pollution in eastern China.
- Article
(10387 KB) - Full-text XML
- BibTeX
- EndNote


Currently, China is undergoing rapid economic development, resulting in a higher demand for energy and greater use of fossil fuels. As a result, high emissions of pollutants produce heavy pollution in the megacities of eastern China, such as Beijing and Shanghai. For example, in the city of Shanghai (a large megacity in China), urban and economic developments of the city are very rapid. During 1990 to 2015, the population increased from 13.3 to 24.1 million. The number of automobiles increased from 0.2 million (1993) to 2.0 million (2011). The rapidly growing population and energy usage caused a rapid increase in the emissions of pollutants, leading to severe air pollution problems in these megacities (Zhang et al., 2006; Geng et al., 2007; Deng et al., 2008).
Measurements such as satellite observations have revealed much higher aerosol pollution in eastern China than in the eastern US (Tie et al., 2006). High aerosol pollution causes a wide range of environmental consequences. Jia et al. (2019) studied anthropogenic aerosol pollution over the eastern slope of the Tibetan Plateau, and Zhu et al. (2018) studied the impact of smoke aerosols from Russian forest fires on the air pollution over Asia. According to a study by Tie et al. (2009a), exposure to extremely high particle concentrations leads to a great increase in lung cancer cases. High PM (particular matter) concentrations also significantly reduce the range of visibility in China's megacities (Deng et al., 2008). According to a recent study, high aerosol pollution causes important effects on crop (rice and wheat) production in eastern China (Tie et al., 2016).
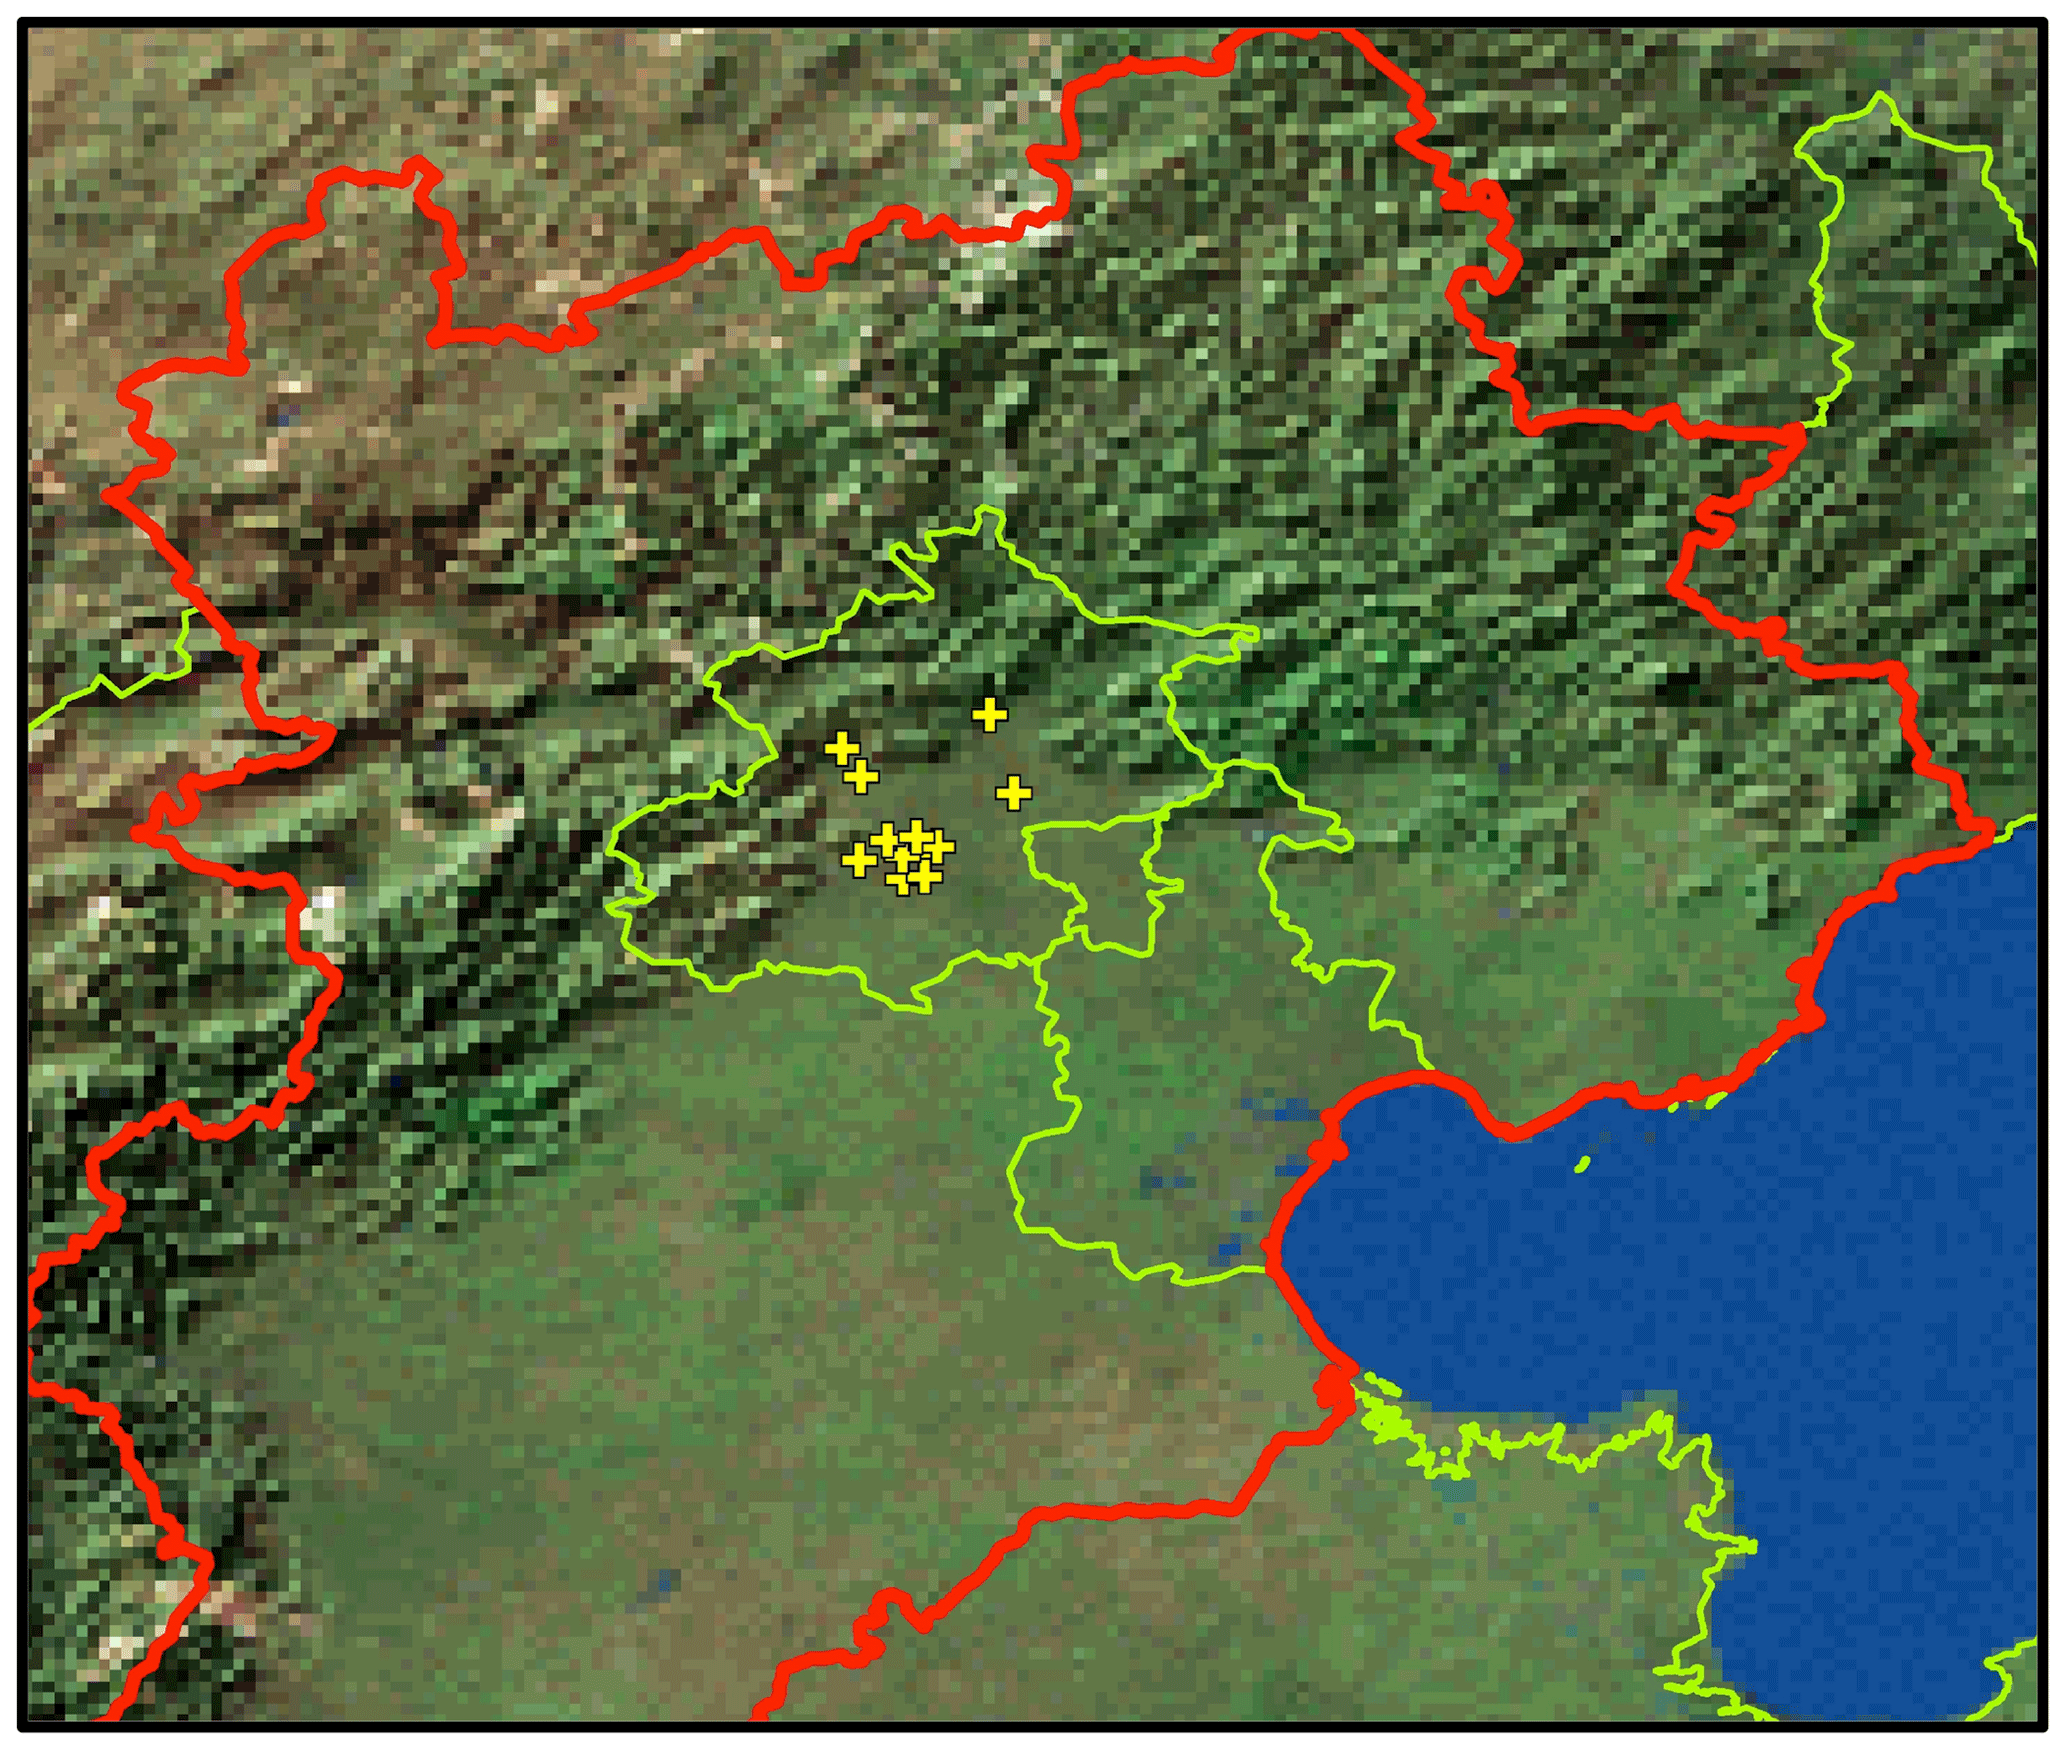
Figure 1The geographic locations of the measurement sites in Beijing, from which the measured concentrations of PM2.5 and O3 are used in the analysis.
In the troposphere, ozone formation results from a complicated chemical process and requires ozone precursors, such as VOCs (volatile organic carbons) and (nitrogen oxides) (Sillman, 1995). With the increase in industrial activity and the number of automobiles, the precursors of ozone (O3) and the global budget of oxidization are also significantly increased (J. P. Huang et al., 2017, 2018). As a result, O3 pollution is becoming a serious pollution problem in Shanghai and other Chinese megacities (Geng et al., 2010; Tie et al., 2009b, 2015). The effects of the O3 production rate can be characterized as either NOx-sensitive or VOC-sensitive conditions. For city areas, O3 production is generally VOC-sensitive, while in remote areas, O3 production is generally NOx-sensitive in eastern China (Sillman, 1995; Zhang et al., 2003; Lei et al., 2004; Tie et al., 2013). Thus, better understanding the trends of O3 precursors (VOCs, NOx) is important to determine the O3 trends in Shanghai (as well as many large cities in China).
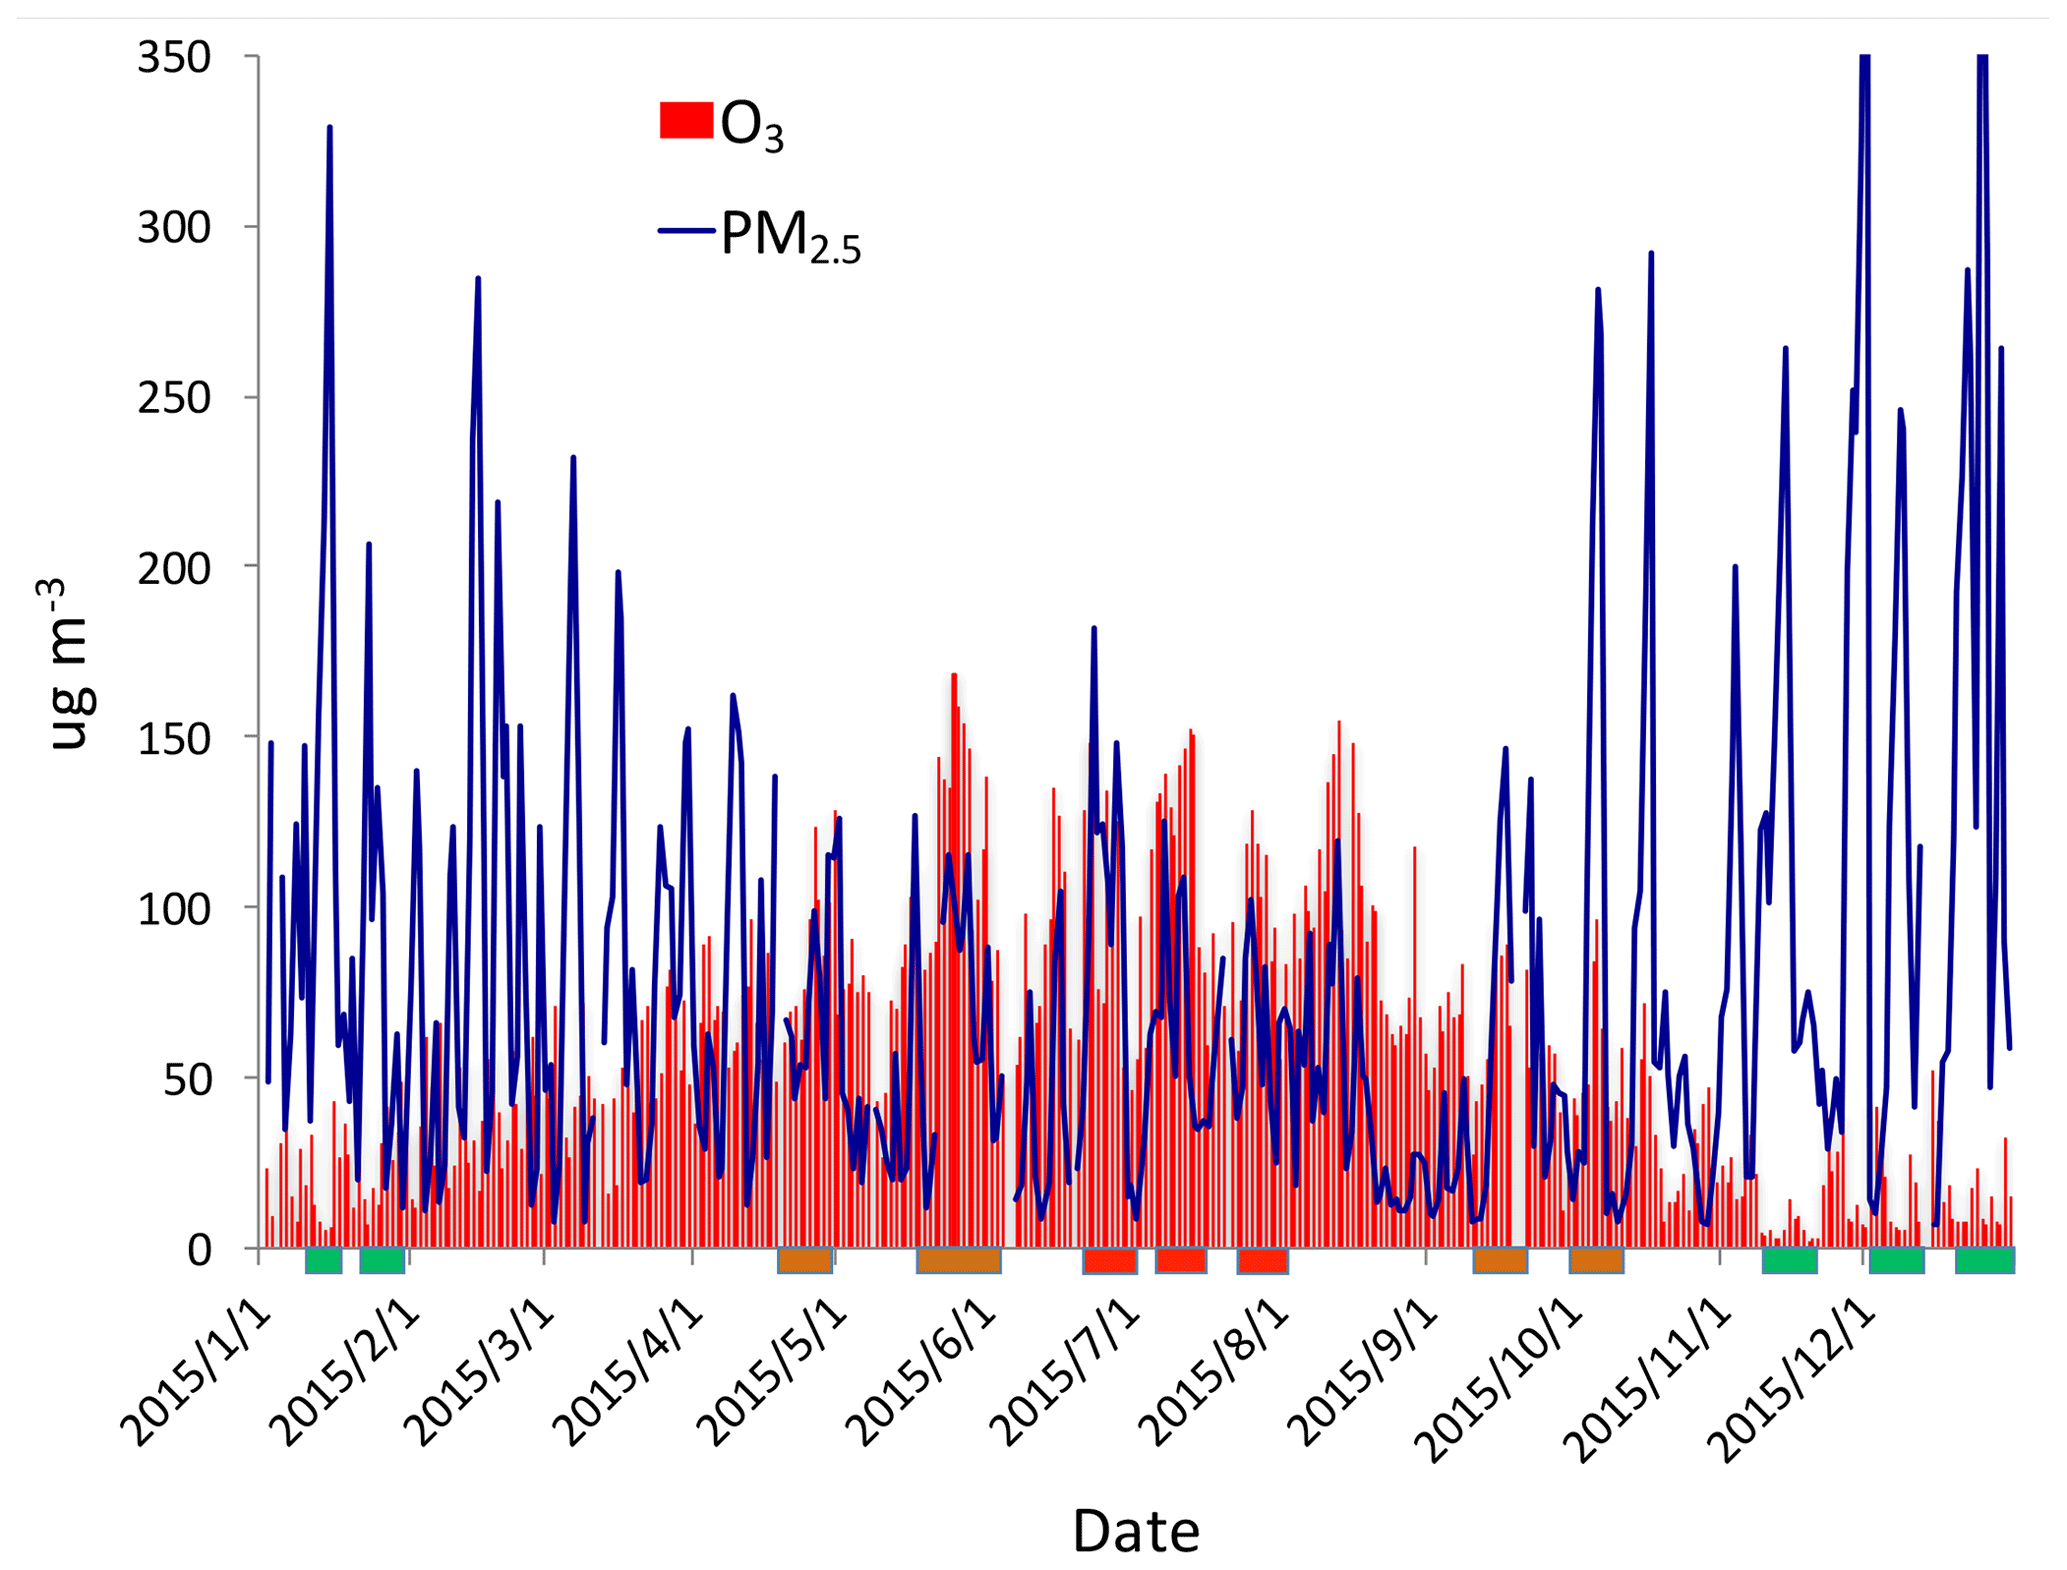
Figure 2The daily averaged concentrations of PM2.5 and O3 in the Beijing region in 2015. The concentrations are averaged over all sites shown in Fig. 1. The blue lines represent the PM2.5 concentrations (µg m−3), and the red bars represent the O3 concentrations (µg m−3). The rectangles show some typical events during winter (green), spring and fall (orange), and summer (red).
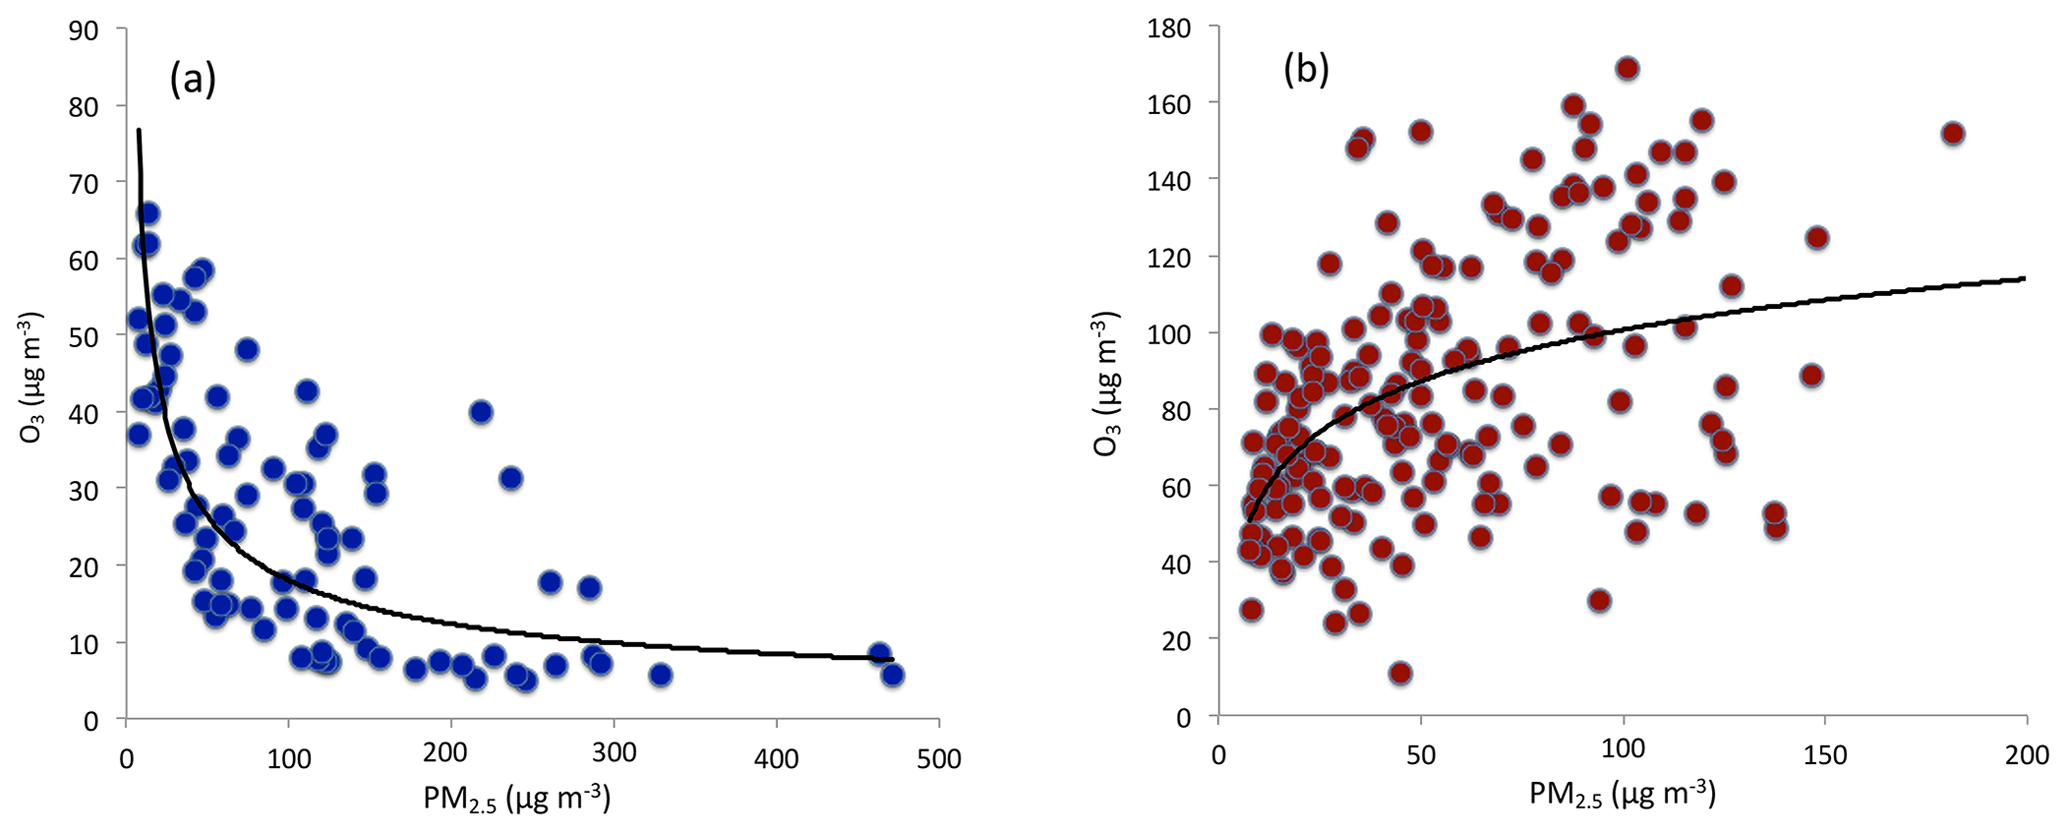
Figure 3The correlation between O3 and PM2.5 concentrations during winter (a) and from late spring to early fall (b). During winter, O3 concentrations were strong anticorrelated with PM2.5 concentrations. From late spring to early fall, O3 concentrations were correlated with PM2.5 concentrations.
In the past few years, China's government has made strong efforts to reduce PM2.5 pollution. However, another important pollutant (O3) is becoming a problem in eastern China. Several studies regarding O3 formation have been previously conducted in Shanghai. For example, Geng et al. (2007, 2008) studied the relationship between O3 precursors (NOx and VOCs) for ozone formation in Shanghai. Tie et al. (2009) studied the short-term variability of O3 in Shanghai. Their study suggested that in addition to ozone precursors, meteorological conditions, such as regional transport, also have strong impacts on ozone concentrations. During September 2009, a major field experiment (MIRAGE-Shanghai) was conducted in Shanghai, and multiple chemical species were measured during the experiment. The summary of the measurements by Tie et al. (2013) suggests that ozone formation in Shanghai is under VOC-sensitive conditions. However, if the emission ratio of NOx∕VOCs is reduced to a lower value (0.1–0.2), the ozone formation in Shanghai will switch from VOC-sensitive conditions to NOx-sensitive conditions.
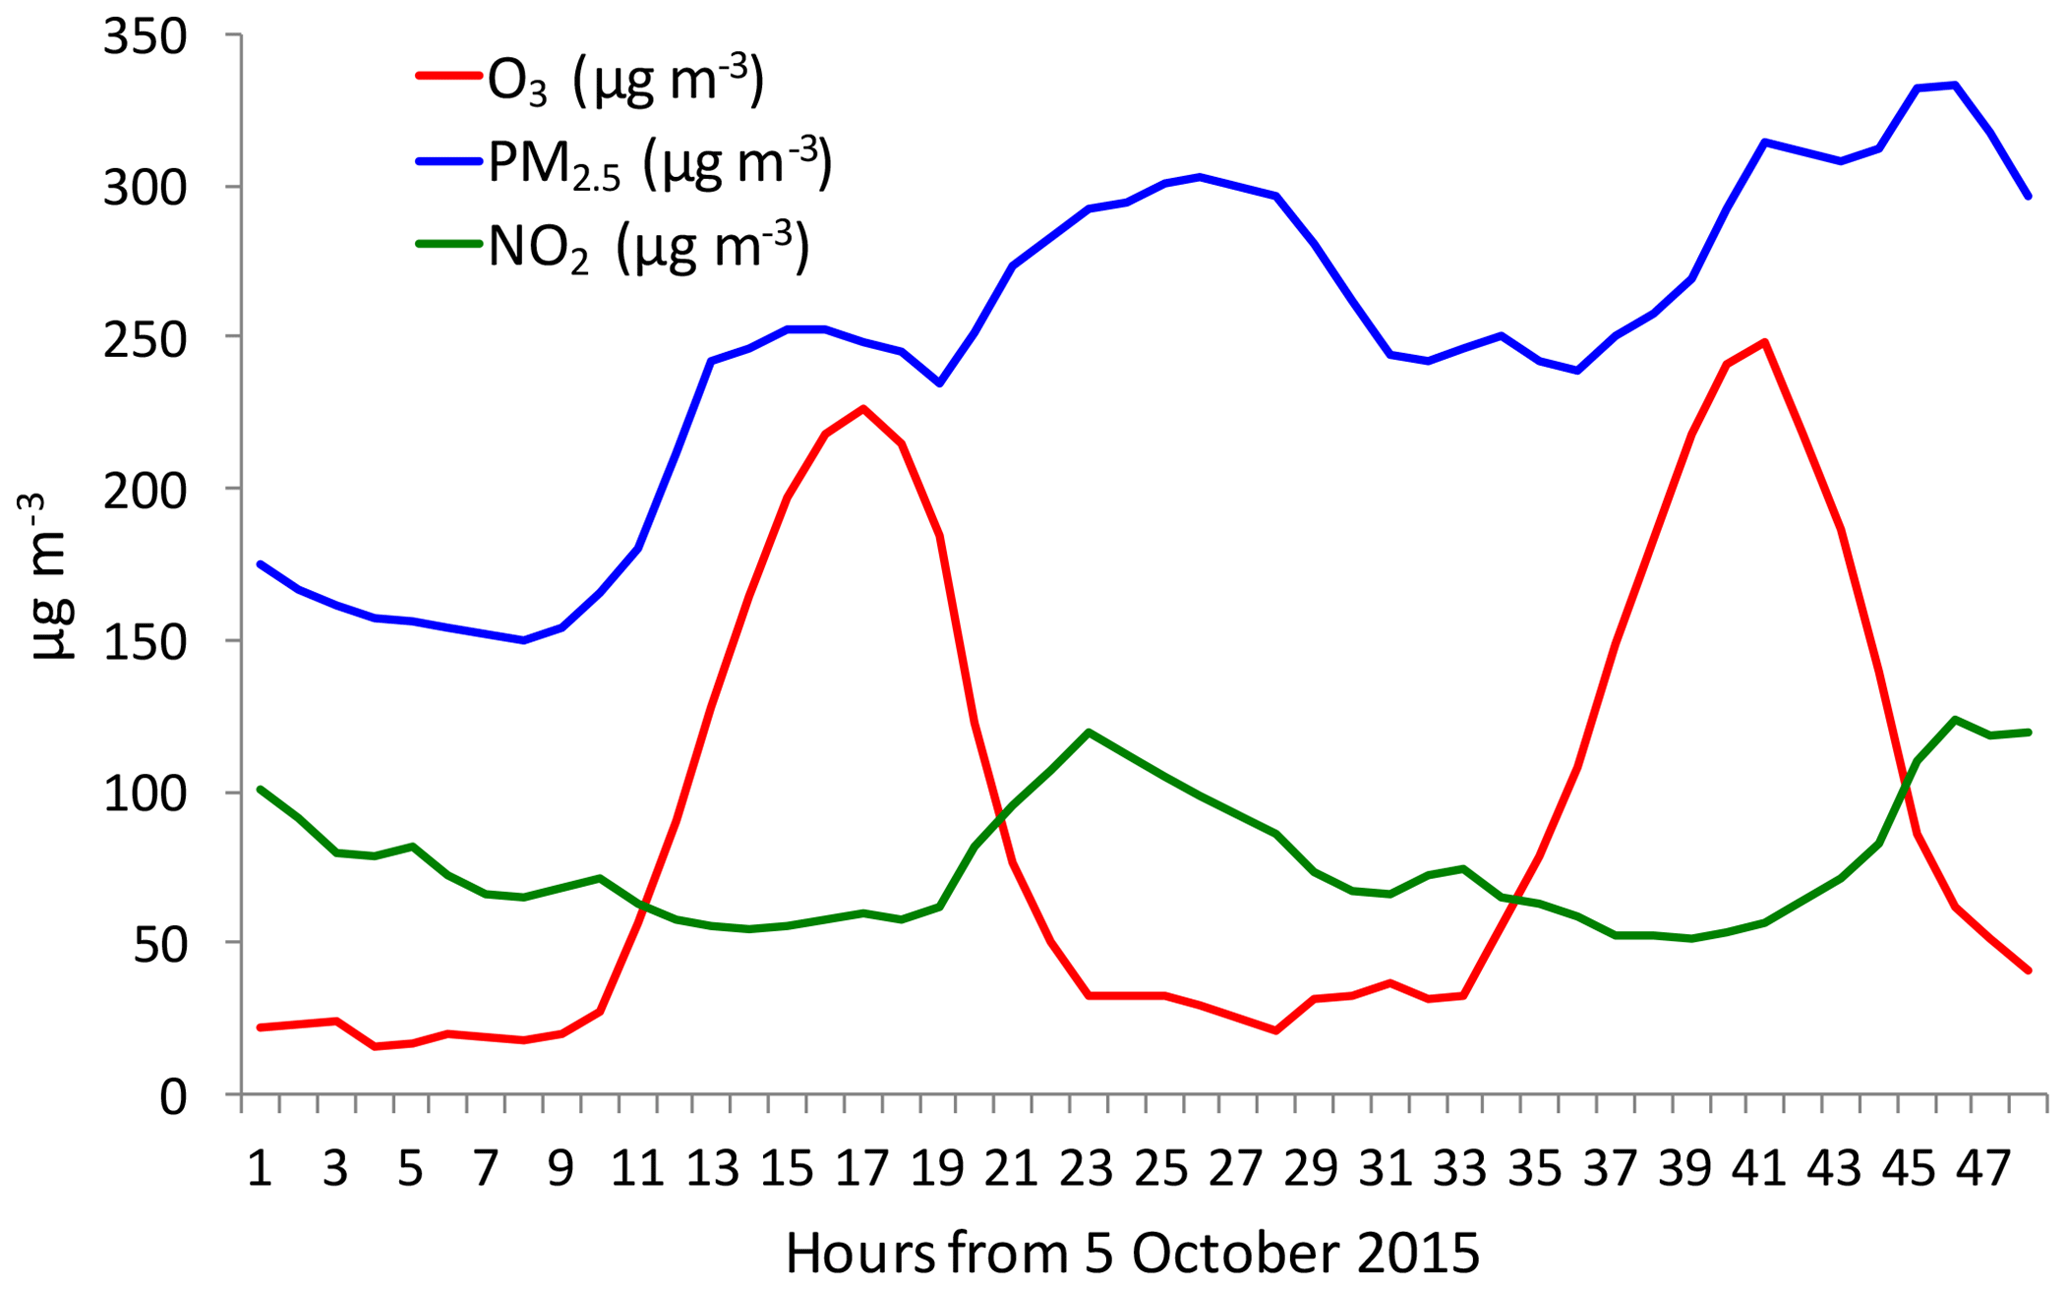
Figure 4The diurnal variations of PM2.5 (blue line), O3 (red line), and NO2 (green line) during a fall period (from 5 to 6 October 2015). It shows that under high PM2.5 conditions, there was a strong O3 diurnal variation.
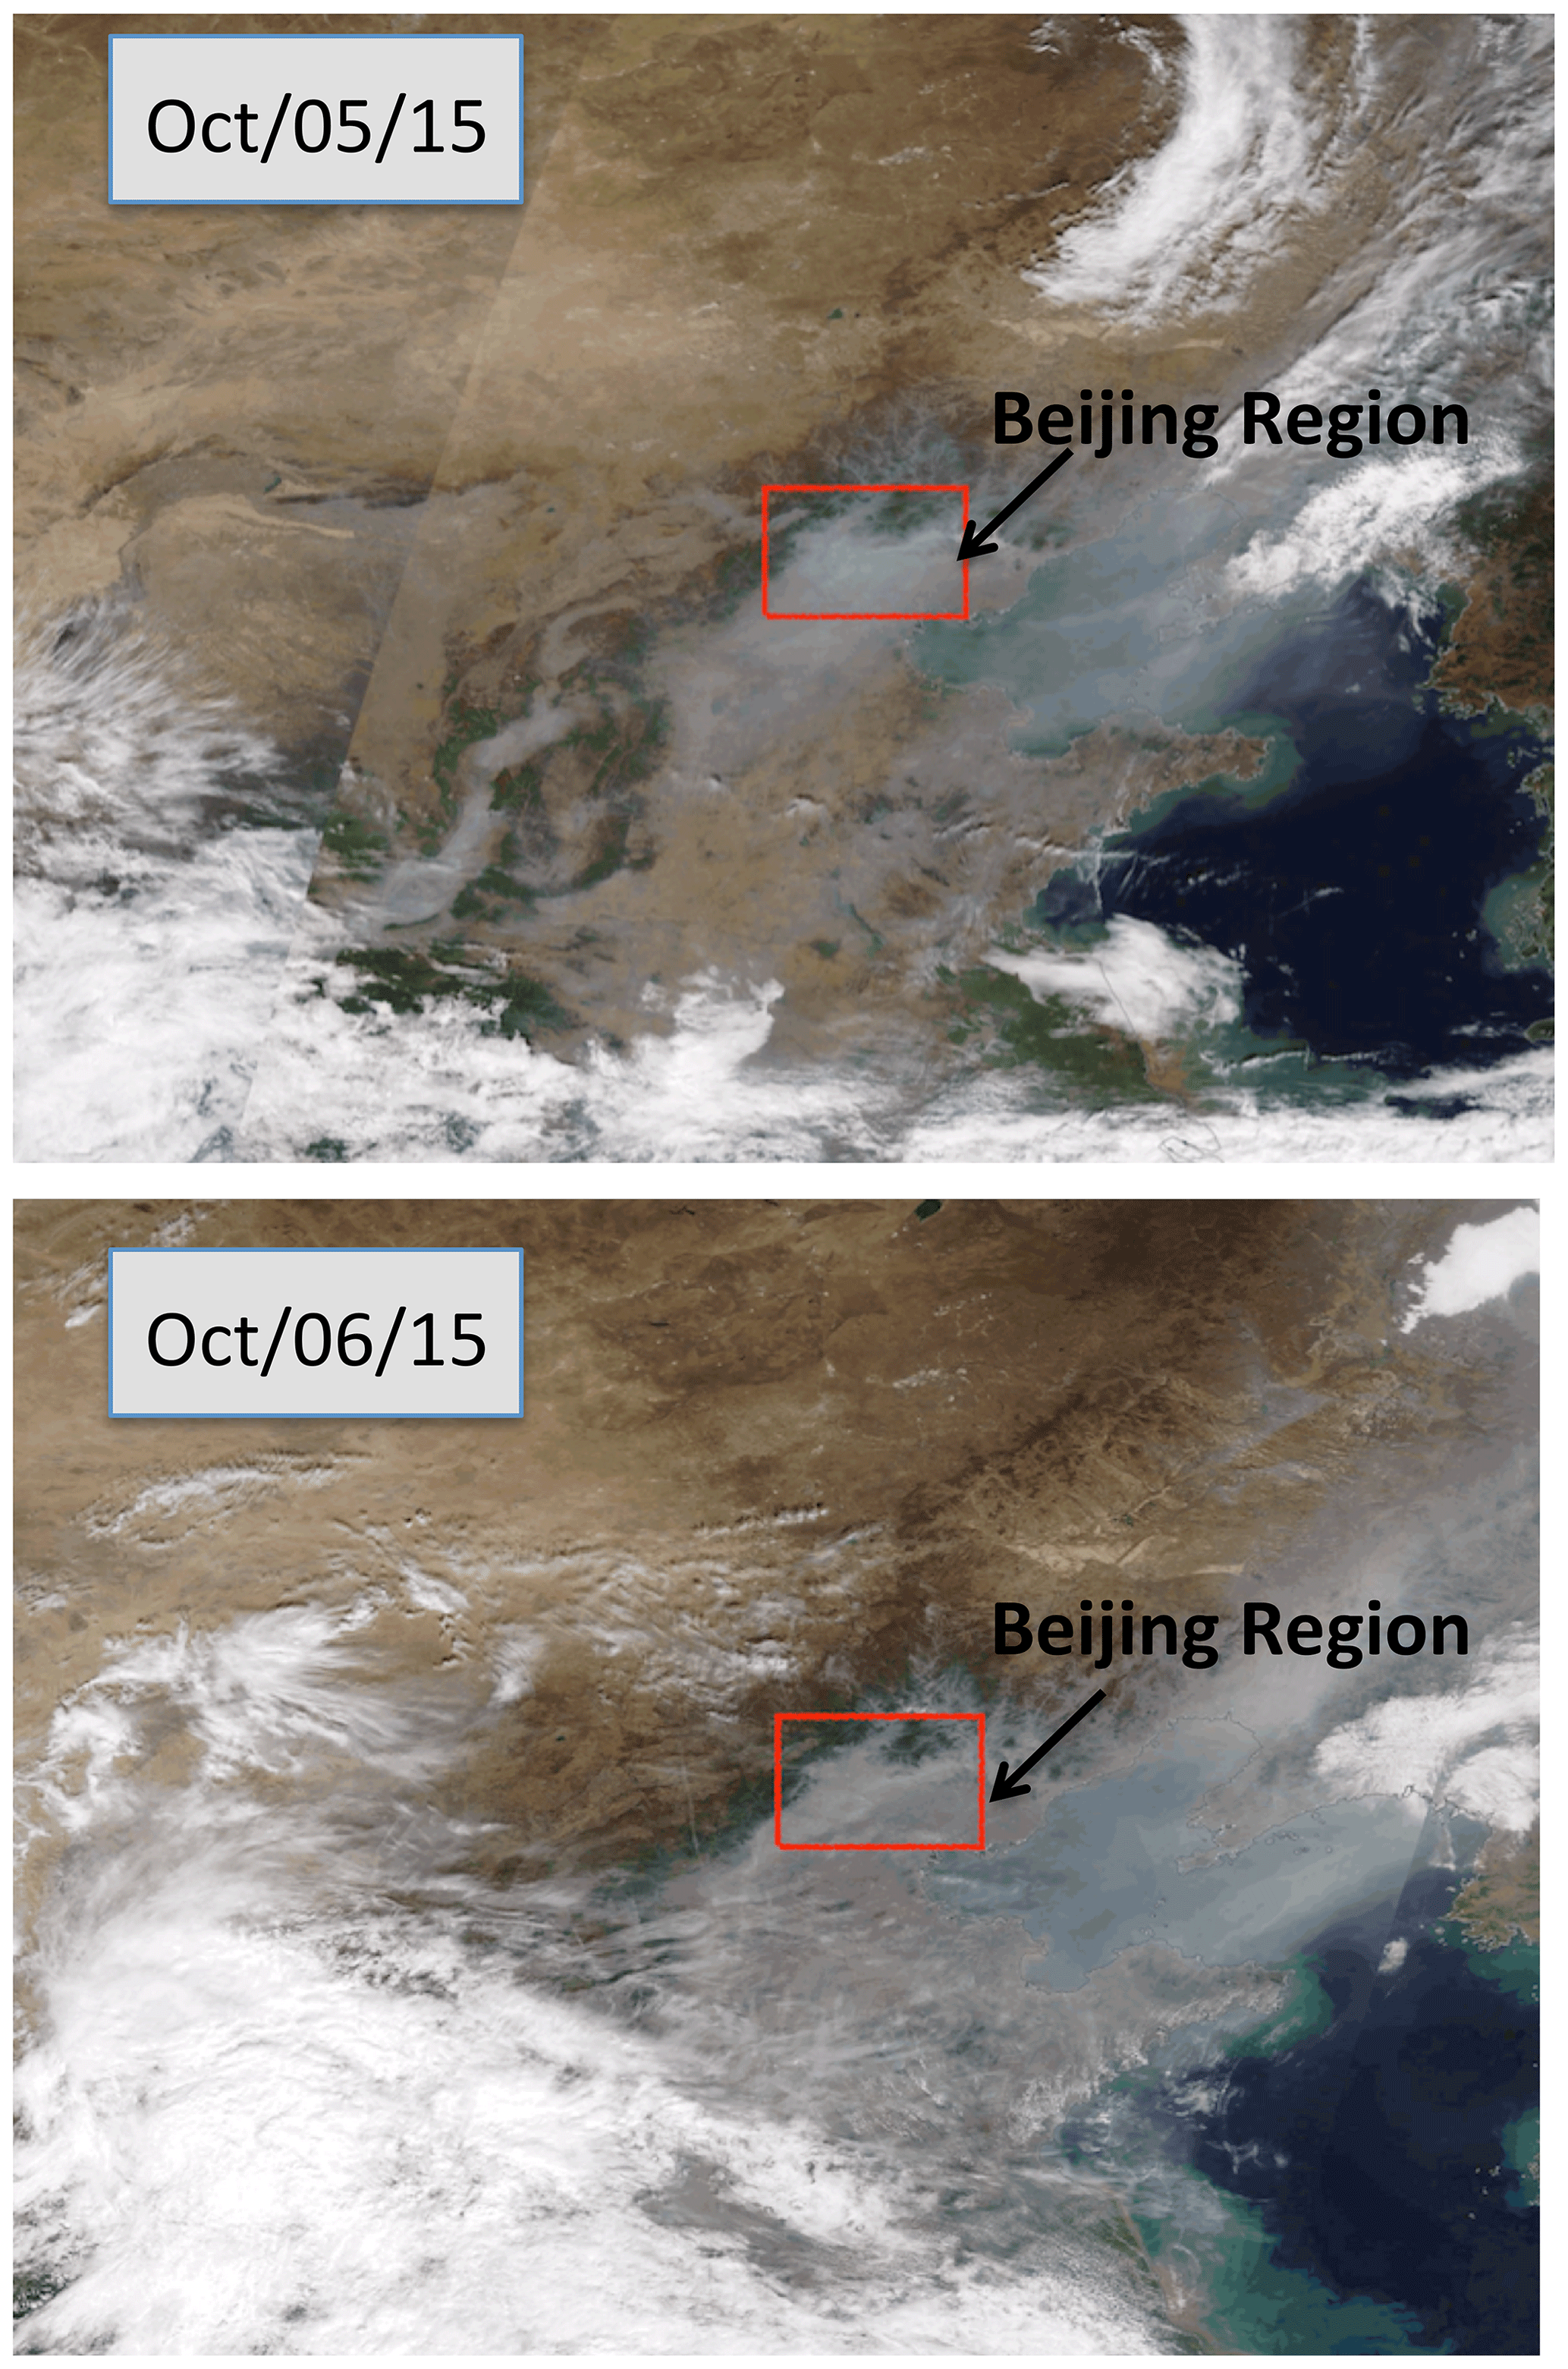
Figure 5The cloud conditions during the period of the case study (between 5 and 6 October 2015) in the Beijing region. Bright white shows the cloud cover, and grey–white shows the haze cover. The Beijing region was under heavy haze conditions during the period. The figure is download from https://worldview.earthdata.nasa.gov (last access: 15 July 2019), with additions.
Despite the fact that some progress has been made for ozone formation in megacities in China, there is still a lack of studies on ozone development in large cities of China. For example, this study shows that during late spring and early fall in eastern China, under heavy PM2.5 pollution, there was often strong O3 chemical production, causing the co-occurrence of high PM2.5 and O3 concentrations. Under heavy aerosol conditions, solar radiation is depressed, significantly reducing the photochemical production of O3. This co-occurrence of high PM2.5 and O3 is unusual and is the focus of this study. He and Carmichael (1999) suggest that aerosol particles can enhance the scattering of solar radiation, enhancing the flux density inside the boundary layer. Recent measurements also show that there were often high HONO concentrations in major Chinese megacities, especially during daytime, with maximum concentrations ranging from 0.5 to 2 ppbv (Huang et al., 2017). Zhang et al. (2016) suggest that there are several potential HONO sources, including surface emissions and conversion of NO2 at the ocean surface, and adding these sources can improve the calculated HONO concentrations. It is also interesting to note that high HONO surface concentrations occurred during high aerosol concentration periods, suggesting that there are additional HONO surface sources in eastern China. Under high daytime HONO concentrations, HONO can be photodissociated to OH radicals, which enhance the photochemical production of O3.
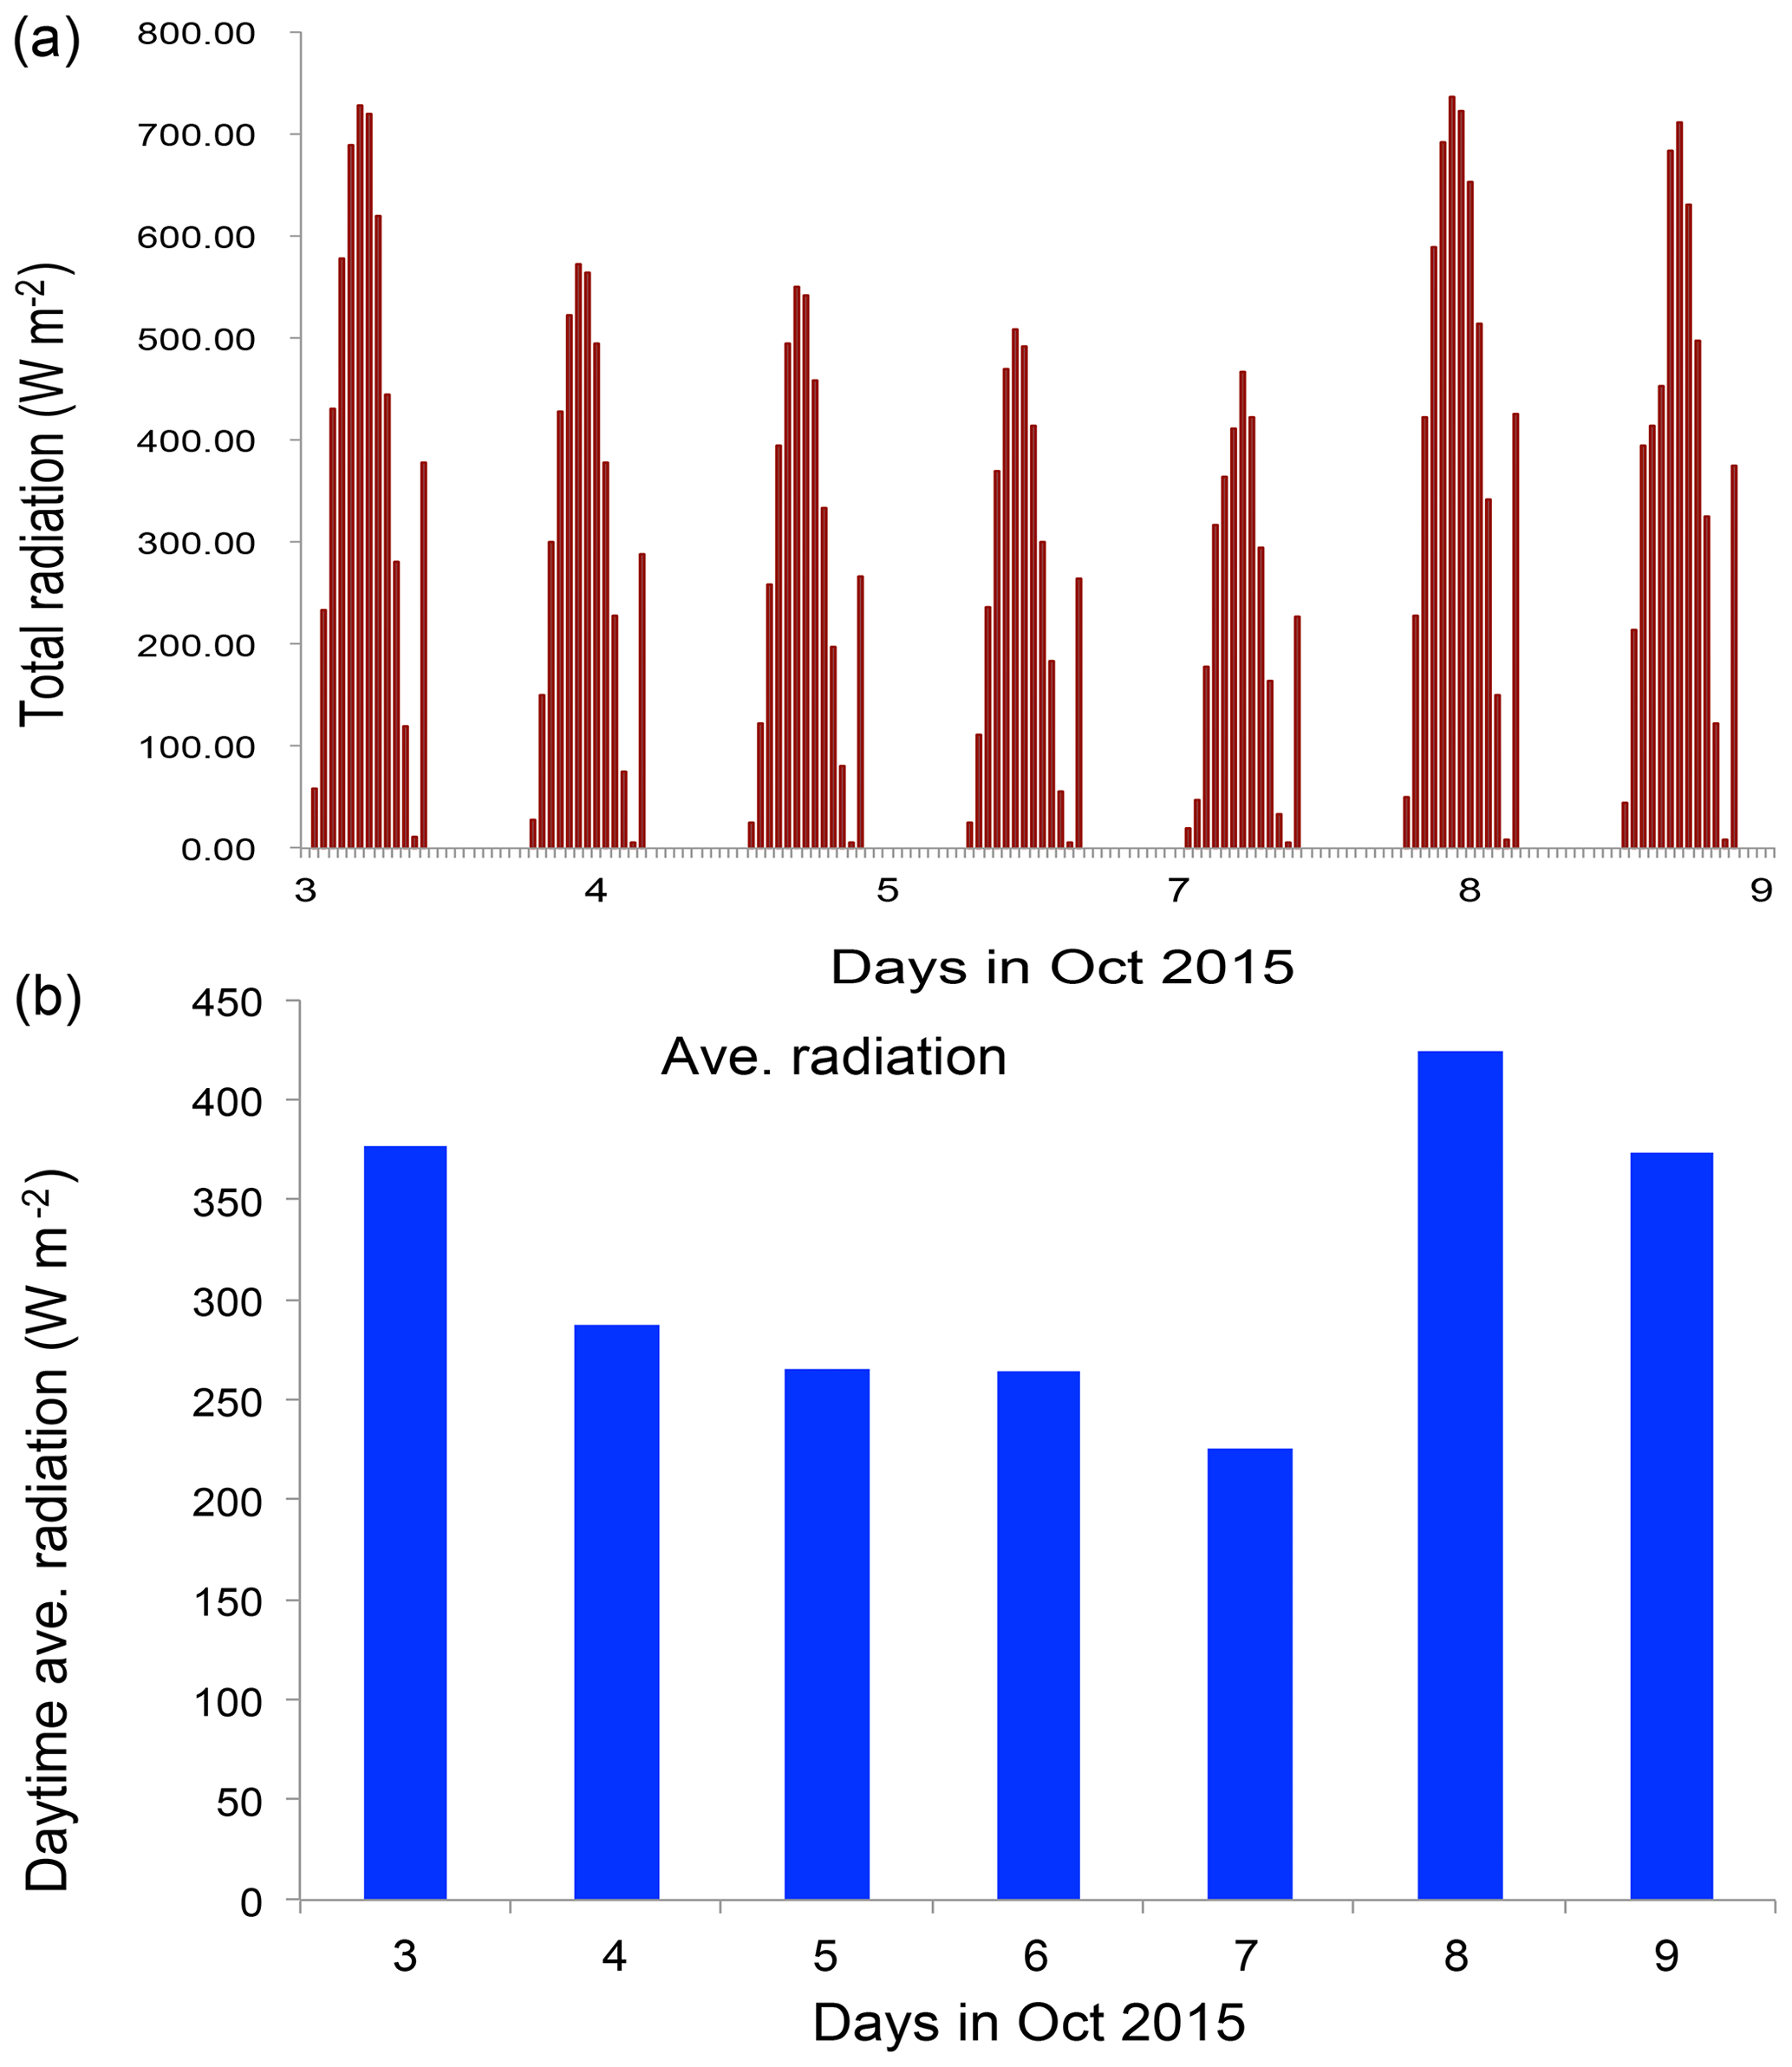
Figure 6The measured solar radiation (W m−2) from 3 to 9 October 2015 in Beijing. (a) Hourly values and (b) daytime averaged values.
The paper is organized as follows: in Sect. 2, we describe the measurement of O3 and PM2.5. In Sect. 3, we describe the calculation of the photodissociation rate of HONO, a steady-state model for the calculation of OH, and the causes of high O3 production under heavy aerosol conditions. Section 4 shows a brief conclusion of the results.
There are long-term measurements in eastern China by the Chinese Environment Protection Agency (CEPA) for monitoring the air quality in China. In eastern China, especially in the capital city of China (Beijing), there is often heavy air pollution, particularly fine particular matter (PM2.5 – the radius of particles being less than 2.5 µm). Figure 1 shows the measurement sites in Beijing, from which the measured concentrations of PM2.5 and O3 are used in the analysis. In the region, the air pollution was very heavy, especially in winter (Long et al., 2016; Tie et al., 2017). Previous studies suggest that both aerosol and O3 have become major pollutants in the region (Li et al., 2017).
Figure 2 shows the daily averaged concentrations of PM2.5 and O3 in the Beijing region in 2015. The daily averaged concentrations show that there were strong daily and seasonal variations for the concentrations of both PM2.5 and O3. Despite the daily variation, the concentrations of PM2.5 exhibited a strong seasonal variation. For example, there were very high concentrations during winter, with a maximum of ∼300 µg m−3, while in summer, the maximum concentrations were reduced to ∼150 µg m−3. The seasonal variability of O3 concentrations were opposite to the PM2.5 concentrations, with lower concentrations in winter (< 50 µg m−3) and higher concentrations in summer (> 150 µg m−3). These seasonal variations of PM2.5 and O3 have been studied by previous authors (Tie and Cao, 2017; Li et al., 2017). Their results suggest that high winter PM2.5 concentrations resulted from the combination of high emissions (heating season in the Beijing region) and poor meteorological ventilation conditions, such as a lower PBL (planetary boundary layer) height (Quan et al., 2013; Tie et al., 2015). According to the photochemical theory of O3 formation, high summer and low winter O3 concentrations are mainly due to the seasonal variation of solar radiation (Seinfeld and Pandis, 2006).
Heavy aerosol concentrations play important roles in reducing solar radiation, causing the reduction of O3 formation (Bian et al., 2007). As we show in Fig. 3a, during wintertime, the O3 concentrations were strongly anticorrelated with the PM2.5 concentrations, suggesting that the reduction of solar radiation by aerosol particles has an important impact on the reduction of O3 concentrations. Figure 3a also shows that the relationship between O3 and PM2.5 was not linearly related. For example, when the concentrations of PM2.5 were less than 100 µg m−3, O3 concentrations rapidly decreased with the increase in PM2.5 concentrations. In contrast, when the concentrations of PM2.5 were greater than 100 µg m−3, O3 concentrations slowly decreased with the increase in PM2.5 concentrations. This is consistent with the result of Bian et al. (2007).

Figure 7The effect of aerosol levels with AOD = 0.25 (black line), AOD = 2.5 (red line), AOD = 3.5 (blue line), and AOD = 4.0 (green line) on the O3 photolysis calculated by the TUV model in October at middle latitudes.
It is interesting to note that from late spring to early fall, the correlation between PM2.5 and O3 concentrations was positive compared to the negative relationship in winter (see Fig. 3b). This result suggests that O3 production was high during the heavy haze period, despite the fact that the solar radiation was greatly depressed. In order to clearly display this unusual event, we illustrate diurnal variations of PM2.5, O3, and NO2 during a fall period (from 5 to 6 October 2015). Figure 4 shows that during this period (as a case study), the PM2.5 concentrations were very high, ranging from 150 to 320 µg m−3. Under such high aerosol conditions, the solar radiation should be significantly reduced, and O3 photochemical production would also be reduced. However, the diurnal variation of O3 was unexpectedly strong, with a high noontime concentration of > 220 µg m−3 and very low nighttime concentration of ∼25 µg m−3. This strong diurnal variation was due to photochemical activity, which suggested that during relatively low solar conditions, the photochemical activities of O3 production were high. According to the theory of O3 chemical production, high O3 production is related to a high oxidant of OH (Seinfeld and Pandis, 2006), which should not occur during lower solar radiation. This result brings up an important issue for air pollution control strategies because both PM2.5 and O3 are severe air pollutants in eastern China.
To clearly understand the effect of high aerosol concentrations on solar radiation, we investigate the meteorological conditions, such as cloud cover, relation humidity (RH), and solar radiation, during the period of the case study (see Figs. 5 and 6). Figure 5 shows that the cloud condition was close to cloud-free, but there was a very heavy aerosol layer in the Beijing region, suggesting that cloud cover played a minor role in the reduction of solar radiation. The measured RH values (not shown) were generally higher than 60 %, with a maximum of 95 % during the period. As a result, high aerosol concentrations accompanied by high RH produced important effects on solar radiation. As shown in Fig. 6, the daytime averaged solar radiation was significantly reduced (about a 40 % reduction in the 5–6 October period compared with the value of 8 October).

Figure 8(a) Measured HONO concentrations (ppbv) and PM2.5 and O3 daily concentrations in Beijing. The upper graph shows the measured daily concentrations of PM2.5 and O3 as shown in Fig. 2. The dark red line represents measured HONO in Beijing from 1 to 27 January 2014. (b) Measured HONO concentrations (ppbv) and PM2.5 and O3 daily concentrations in Shanghai. The upper graph shows the measured daily concentrations of PM2.5 and O3 in 2015. The dark red line was measured in Shanghai from 9 to 18 September 2009. The green line was calculated by the WRF-Chem model. (c) Measured HONO concentrations (ppbv) and PM2.5 and O3 daily concentrations in Xi'an. The upper graph shows the measured daily concentrations of PM2.5 and O3 in 2015. The red line represents measured HONO in Xi'An from 24 July to 6 August 2015.
In order to better understand the O3 chemical production that occurred in heavy aerosol conditions in eastern China, the possible O3 production in such conditions is discussed. Ozone photochemical production (P[O3]) is strongly related to the amount of OH radicals (Chameides et al., 1999). According to the traditional theory, the amount of surface OH radicals is proportional to the surface solar radiation, which is represented by
where [OH] represents the concentration of hydroxyl radicals (no. cm−3), where “no.” represents the number of molecules; HOx represents the concentration of HO2+OH (no. cm−3); P[HOx] represents the photochemical production of HOx (no. cm−3 s−1); and L[HOx]* (1 s−1) represents the photochemical destruction of HOx, which is normalized by the concentrations of OH.
The major process for the photochemical production of P[HOx] is through O3 photolysis and follows the reaction with atmospheric water vapor. It can be expressed as
where J1 represents the photolysis of O3 + hv→ O1D; k1 represents the reaction rate of O1D + am → O3P; and k2 represents the reaction rate of O1D + H2O → 2OH. As we can see, this HOx production is proportional to the magnitude of solar radiation (J1), and J1 is O3 photolysis with solar radiation. Figure 7 shows the relationship between the values of J1 and aerosol concentrations in October at middle latitudes calculated by the TUV model (Madronich and Flocke, 1999). This result suggests that under high aerosol concentrations (AOD = 2.5), the J1 value is strongly depressed, resulting in a significant reduction of OH concentrations and O3 production. For example, the maximum J1 value is about (1 s−1) with lower aerosol values (AOD = 0.25). According to a previous study, the surface PM2.5 concentrations were generally smaller than 50 µg m−3 with this AOD value (Tie et al., 2017). However, when the AOD value increased to 2.5 (the PM2.5 concentrations are generally > 100 µg m−3), the maximum J1 value rapidly decreased to about (1 s−1), which is about a 450 % reduction compared to the value with AOD = 0.25. This study suggests that under high PM2.5 concentrations (>100 µg m−3), the photochemical production of OH (P[HOx]) is rapidly decreased, leading to low OH concentrations, which cannot initiate the high oxidation of O3 production. As a result, the high O3 production shown in Fig. 4 cannot be explained. Other sources for O3 oxidation are needed to explain this result.
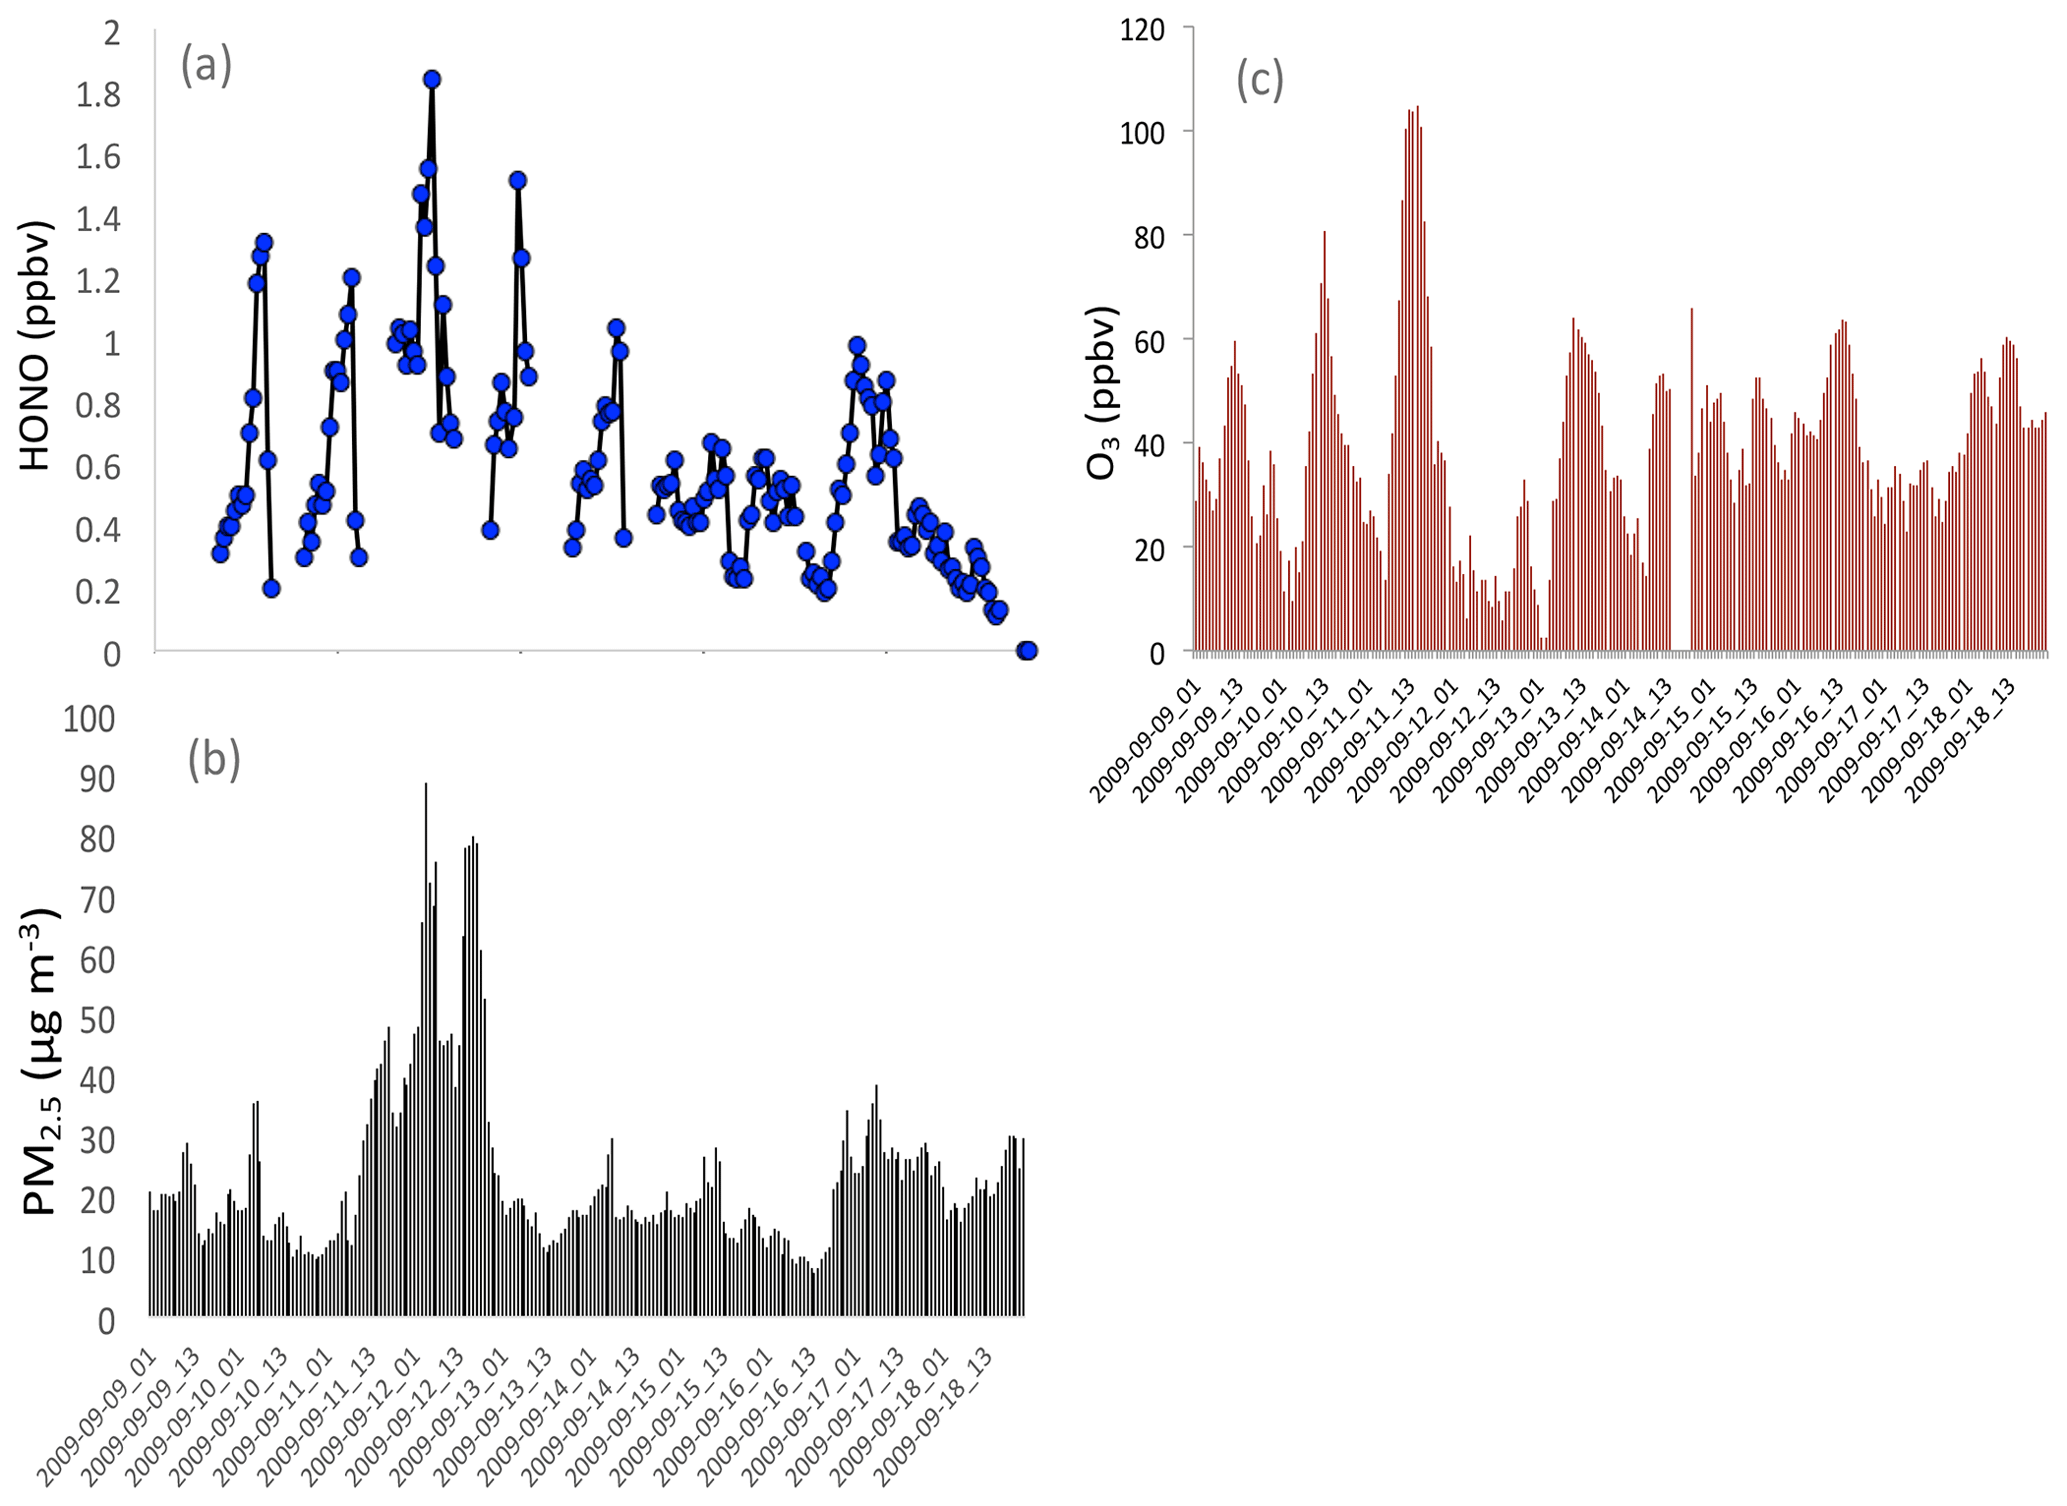
Figure 9Measured HONO (b), PM2.5 concentrations (c), and O3 concentrations (a) in fall in Shanghai, illustrating that high HONO concentrations corresponded to high PM2.5 concentrations.
Recent studies show that HONO concentrations are high in eastern China (R. J. Huang et al., 2017). Under high solar radiation, the photolysis rate of HONO is very high, resulting in very low HONO concentrations in daytime (Seinfeld and Pandis, 2006). These measured high HONO concentrations are explained by other studies. One of the explanations is that there are high surface HONO sources during daytime, which produces high HONO concentrations (R. J. Huang et al., 2017). Zhang et al. (2016) suggest that there are several potential HONO sources, including surface emissions and conversion of NO2 at the ocean surface. Zhang et al. (2016) parameterized these potential HONO sources in the WRF-Chem model, and the calculated HONO concentrations are increased in the WRF-Chem model.
The WRF-Chem model is based on the version developed by Grell et al. (2015) and is improved mainly by Tie et al. (2017) and Li et al. (2011). The chemical mechanism chosen in this version of WRF-Chem is the RADM2 (Regional Acid Deposition Model, version 2) gas-phase chemical mechanism. For the calculation of HONO, only the gas-phase chemistry of OH+NO is included to calculate HONO concentrations. As shown in Fig. 8, the calculated HONO concentrations are significantly smaller than the measured HONO values in eastern China, suggesting that in addition to the gas reaction, there are missing HONO sources (surface sources or others). Because these missing sources are not fully understood and large uncertainty remains, in the following calculation, we compare the OH concentrations due to both calculated HONO (without the missing sources) and measured HONO concentrations to illustrate the importance of these missing sources for the production of OH radicals and to suggest that further study is needed to better understand the missing sources; this is an urgent scientific issue.

Figure 10The calculated OH production P(HOx) (no. cm−3 s−1) by using the model-calculated HONO (low concentrations) (a) and by using the measured HONO (high concentrations) (b). The blue bars represent the calculation of the P1 term, and the red bars represent the calculation of the P2 term (OH production from HONO).
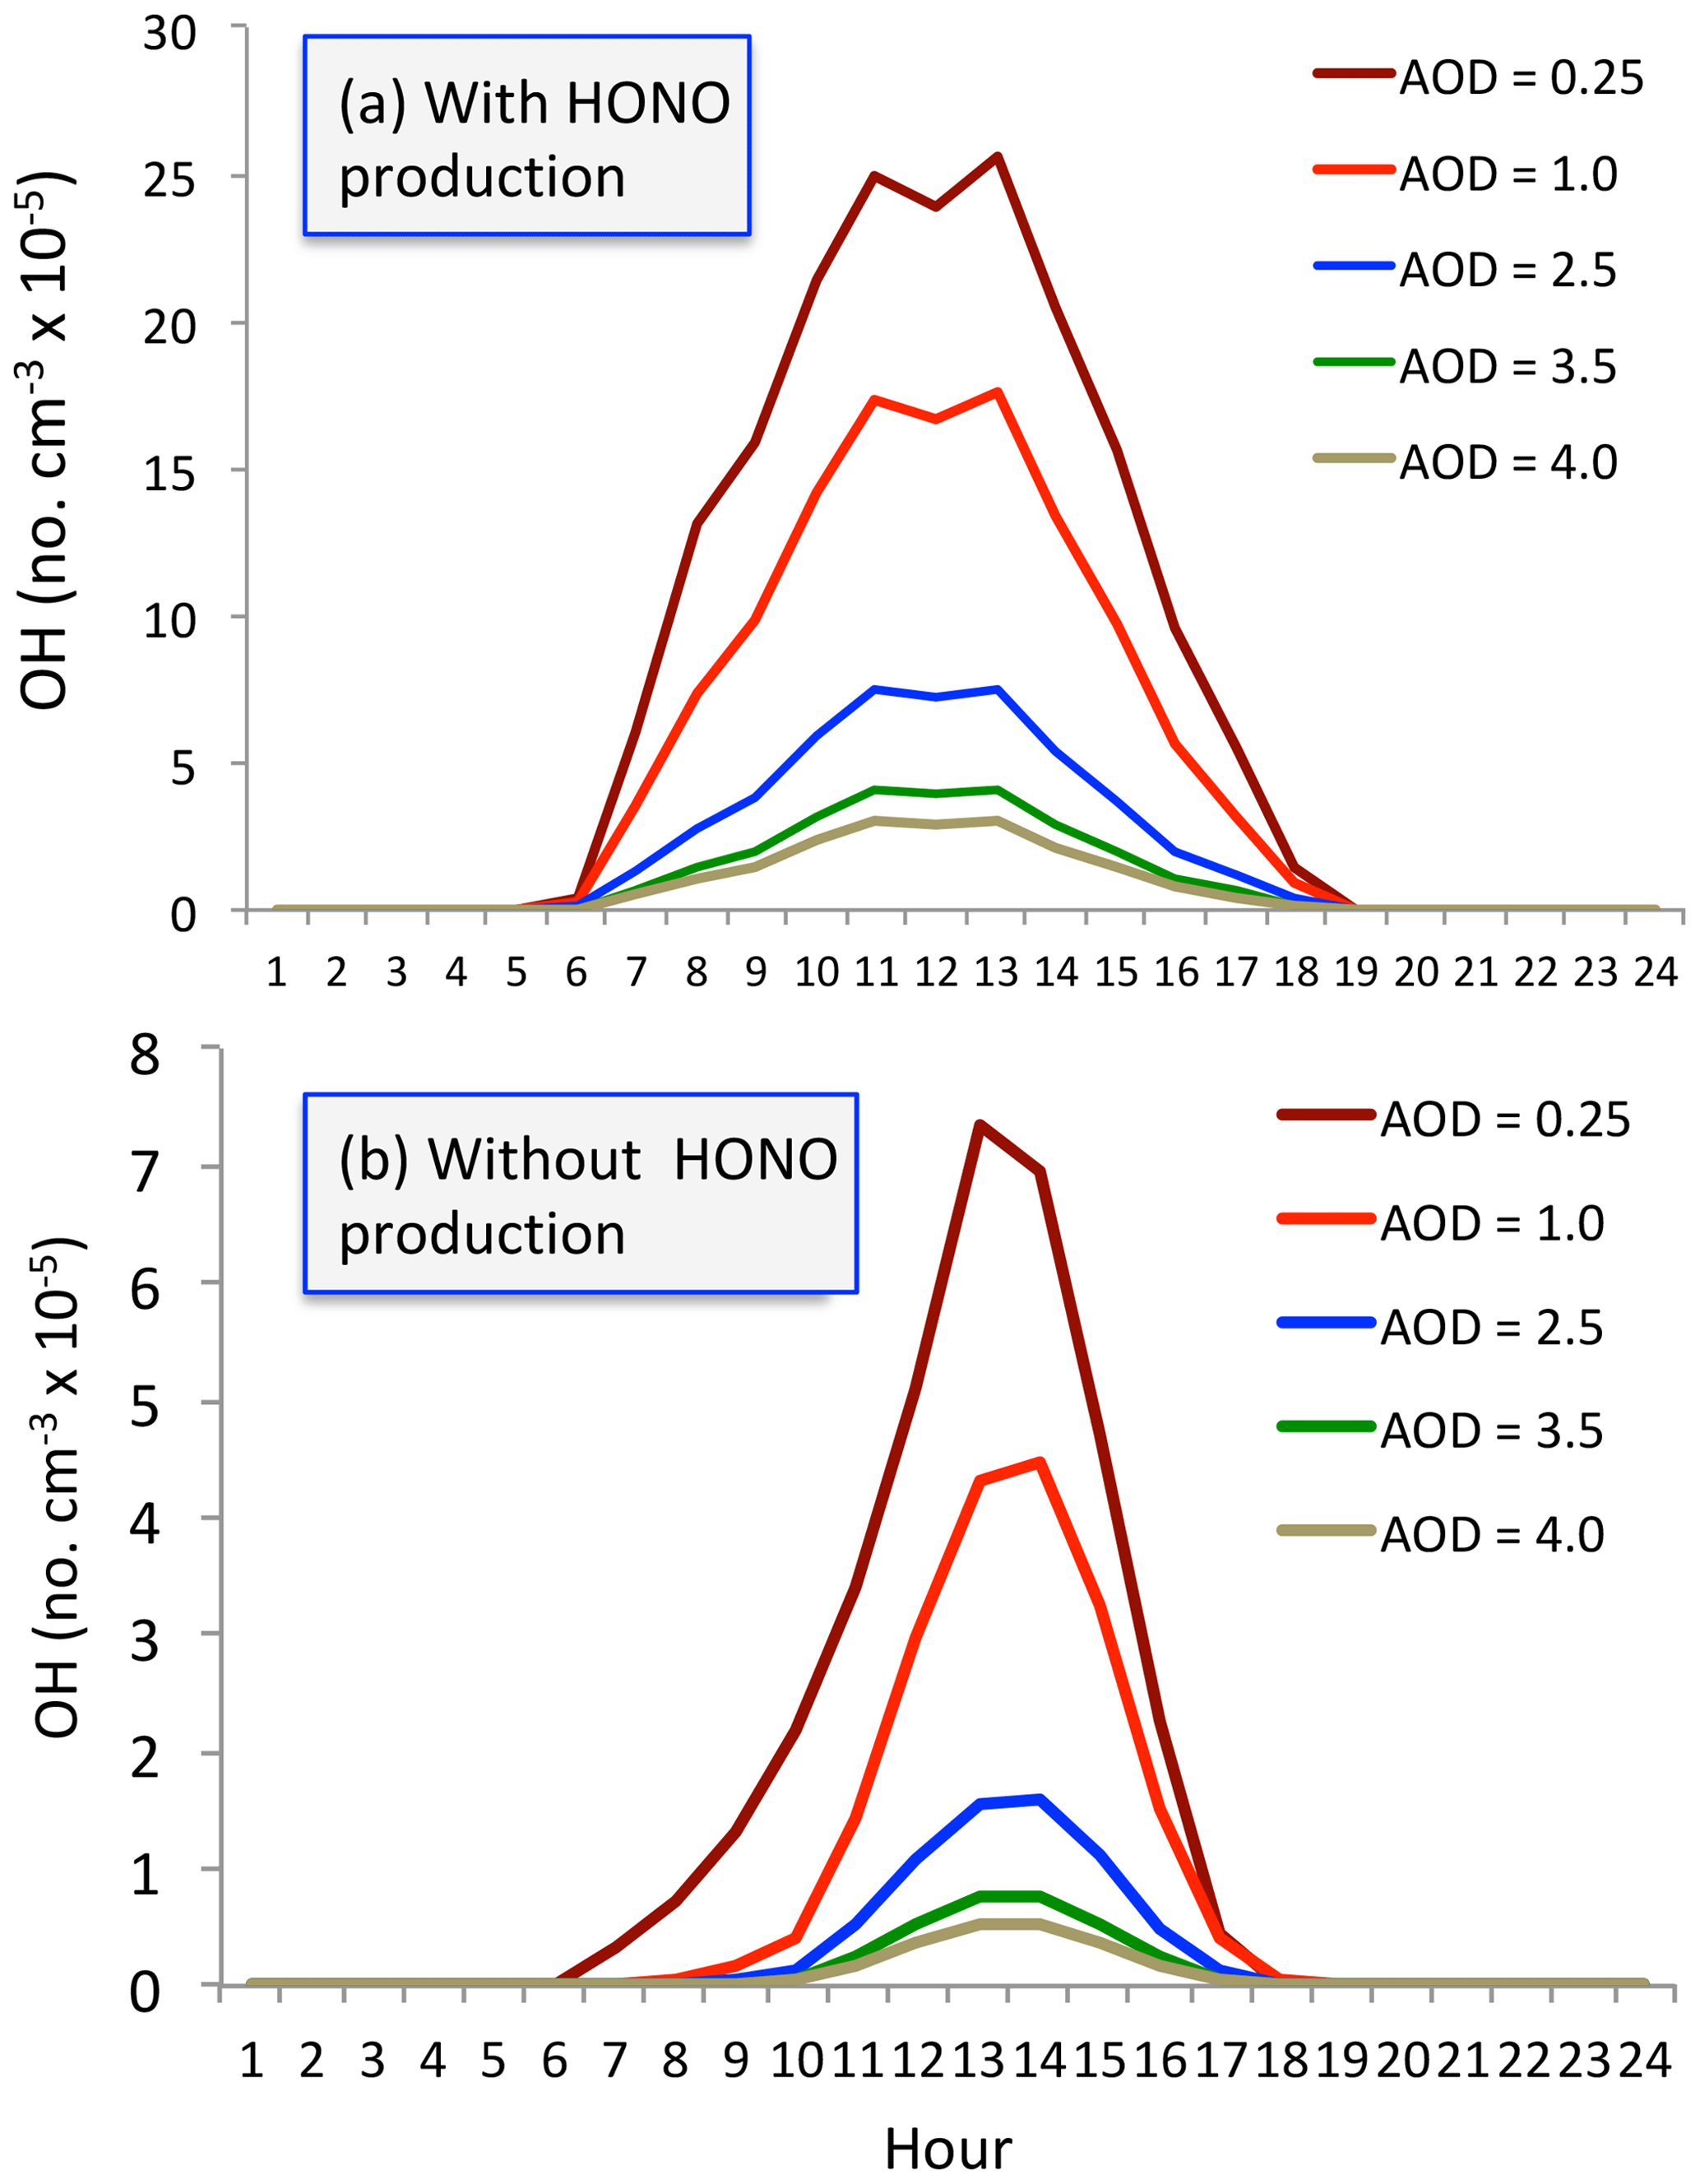
Figure 11The calculated OH concentrations (no. cm−3) with (a) and without (b) HONO production of OH under different aerosol levels. Dark red (AOD = 0.25), red (AOD = 1.0), blue (AOD = 2.5), green (AOD = 3.5), and beige (AOD = 4.0).
Figure 8 shows the measured HONO concentrations in three large cities in China (Shanghai, Xi'an, and Beijing) during fall and winter. It also shows the corresponding PM2.5 and O3 in the three cities (i.e., Fig. 8a for Beijing, Fig. 8b for Shanghai, and Fig. 8c for Xi'an). It shows that the measured HONO concentrations were high, ranging from smaller than parts per billion measurements to a few parts per billion by volume, with higher values during morning and lower values in daytime. Co-occurrences of high PM2.5 and O3 happened in the three cities. As a result, we think that the high HONO is a common event in large cities in eastern China, especially in daytime. This high HONO is also measured by previous studies (Zhang et al., 2016; Huang et al., 2017). In this study, we make an assumption that the co-occurrence between O3 and PM2.5 occurred under high HONO concentrations. We note that using this assumption may result in some uncertainties in estimating the effect of HONO on OH. For example, using the measured HONO in Xi'an and Beijing could produce 1–2 times higher OH production by the photolysis of HONO than the result by using the data from Shanghai. In this case, we use the measured HONO from Shanghai to avoid overestimating the HONO effect, which can be considered a low-limit estimation.
It is also interesting to note that high HONO concentrations occurred during high aerosol concentration periods. Figure 9 illustrates that when the PM2.5 concentrations increased to 70–80 µg m−3, the HONO concentrations were enhanced to 1.4–18 ppbv during September in Shanghai. These measured HONO concentrations were significantly higher than the calculated concentrations (shown in Fig. 8), suggesting that some additional sources of HONO are needed. This result is consistent with HONO measurements in other Chinese cities (Huang et al., 2017).
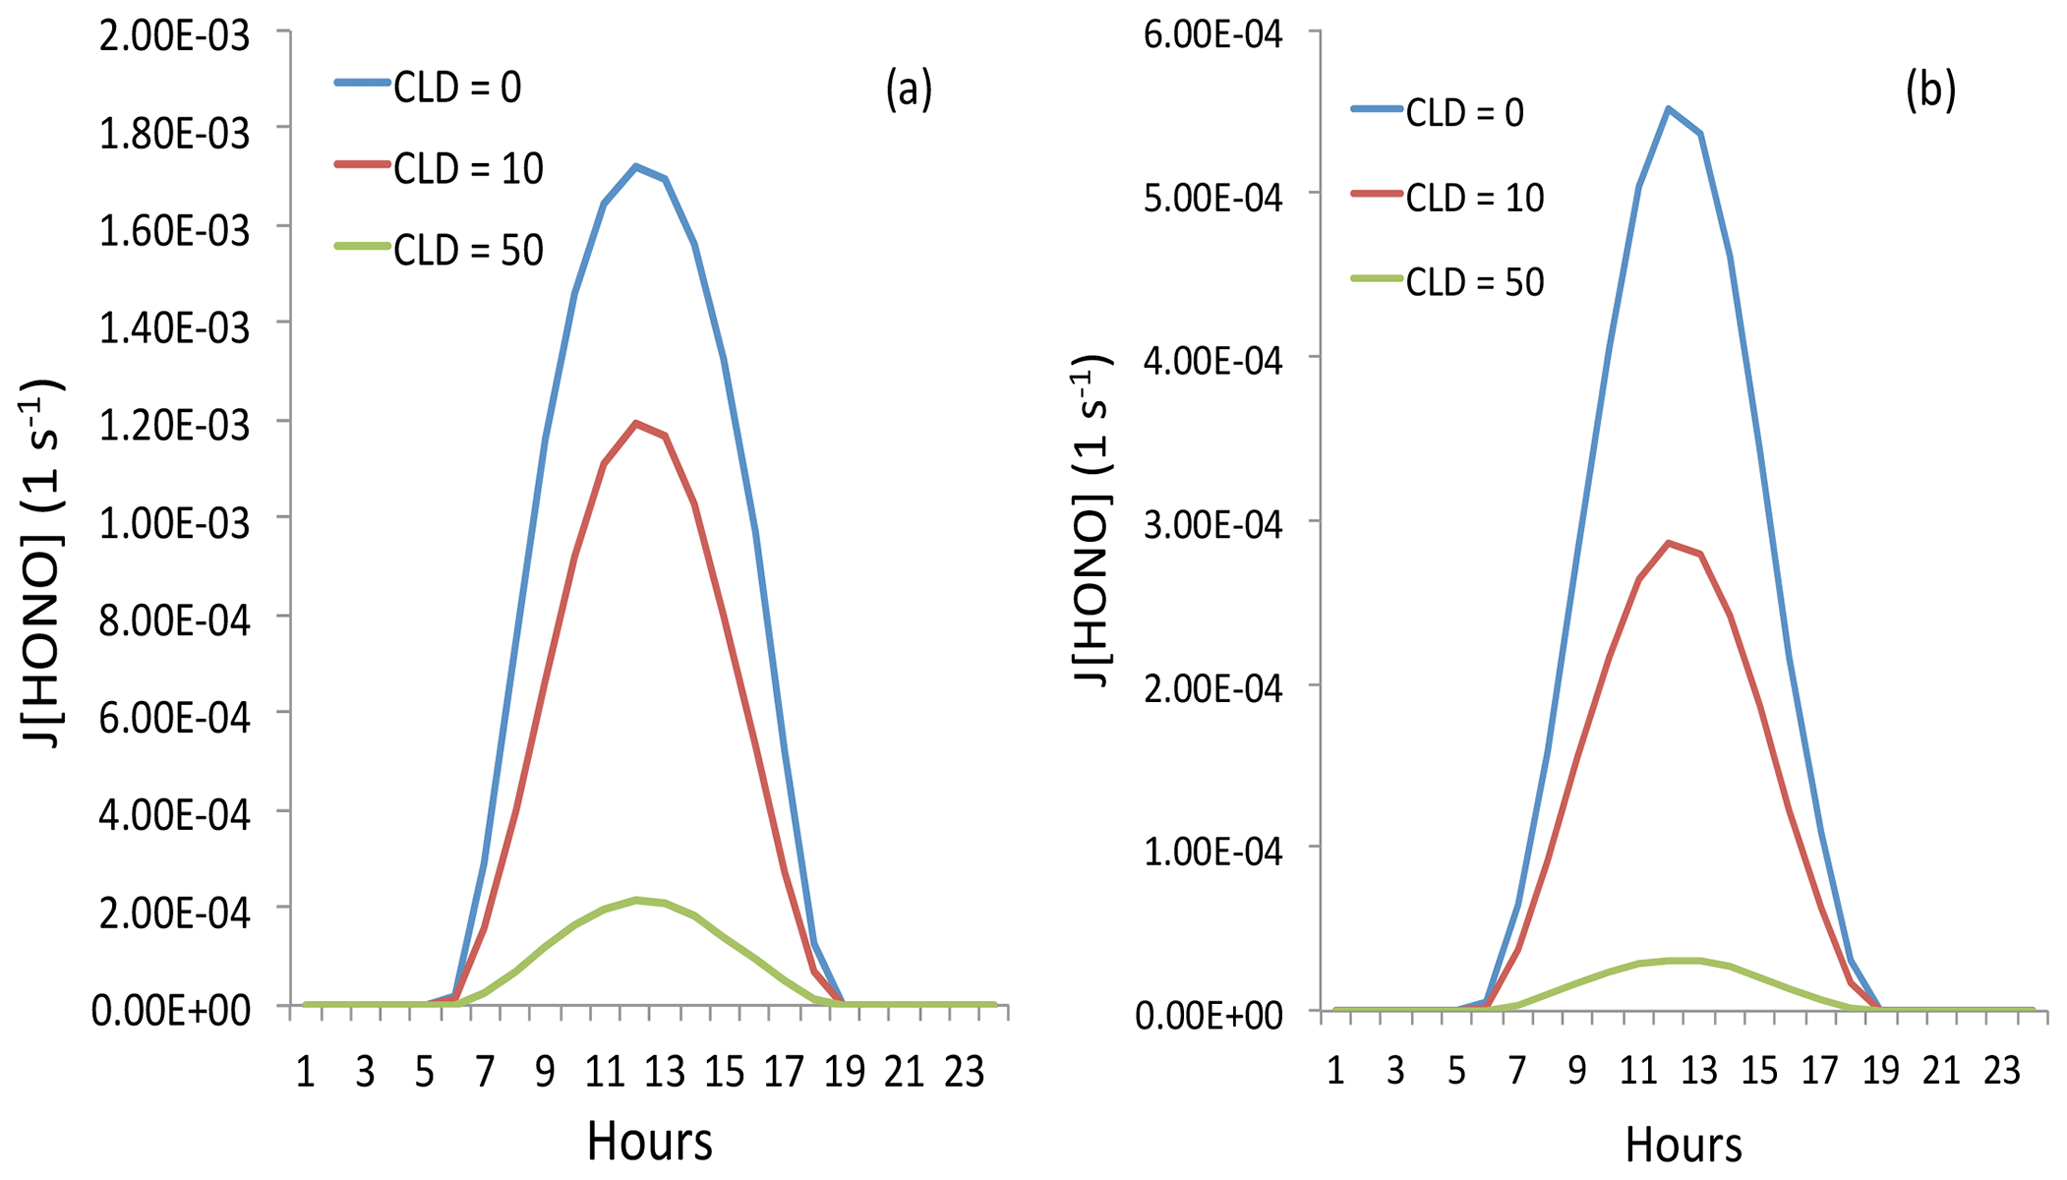
Figure 12The effect of cloud cover on the photolysis rate of HONO (J[HONO]). The blue, red, and green lines represent cloud water vapor of 0 g m−3 (cloud-free), 10 g m−3 (thin cloud), and 50 g m−3 (thick cloud), respectively. Panel (a) represents light aerosol conditions with an AOD of 0.25, and panel (b) represents heavy aerosol conditions with an AOD of 2.5.
High HONO concentrations in daytime are becoming a significant source of OH radicals. As a result, the OH production rate (P[HOx]) can be written according to the following reactions.
Because the chemical lifetime of OH is less than a second, OH concentrations can be calculated according to the equilibrium of chemical production and chemical loss. With both OH chemical production processes, the OH concentrations can be calculated by the following equation (Seinfeld and Pandis, 2006):
where P1 and P2 represent the major chemical production expressed in Reaction (R4), and L1 and L2 are the major chemical loss of OH represented by
Under high NOx conditions, such as in the large cities in eastern China, NOx concentrations were often higher than 50 ppbv (as shown in Fig. 4). As a result, the L1 term is larger than L2. The OH concentrations can be approximately expressed as
where k3 is the reaction coefficient of .
4.1 OH production in different HONO conditions
In order to quantify the individual effects of these two OH production terms (P1 and P2) on the OH concentrations, P1 and P2 are calculated under different daytime HONO conditions (calculated low HONO and measured high HONO concentrations). Figure 10 shows that under low HONO conditions, P1 is significantly higher than P2, and P2 has only a minor contribution to the OH values. For example, the maximum of P1 occurred at 13:00 CST, with a value of 65×106 no. cm−3 s−1. In contrast, the maximum of P2 occurred at 10:00 CST, with a value of 15×106 no. cm−3 s−1. However, under high HONO conditions, P2 plays very important roles for OH production. The maximum of P2 occurred at 11:00 CST, with a value of 350×106 no. cm−3 s−1, which is about 500 % higher than the P1 value. It is important to note that this calculation is based on high aerosol conditions (AOD = 2.5) in September. This result can explain the high O3 chemical production in Fig. 4.
4.2 OH in different aerosol conditions
We seek to understand the effect of aerosol conditions, especially high aerosol conditions, on OH concentrations. Figure 11 shows OH concentrations with and without the HONO production of OH. With including the HONO production (i.e., including P1 and P2), the calculated OH concentrations are significantly higher than without including this production (i.e., only including P1). Both calculated OH concentrations are rapidly changed with different levels of aerosol conditions. For example, without HONO production, the maximum OH concentration is about 7.5×10⁵ no. cm−3 under low aerosol conditions (AOD = 0.25). In contrast, the maximum OH concentration was rapidly reduced to 1.5×10⁵ no. cm−3 under high aerosol conditions (AOD = 2.5) and further decreased to 1.0×10⁵ no. cm−3 with the AOD value of 3.5. In contrast, with including HONO production, the OH concentrations significantly increased. Under higher aerosol conditions (AOD = 2.5), the maximum OH concentration is about 7.5×10⁵ no. cm−3, which is the same value under low aerosol conditions in the no-HONO case. This result suggests that measured high O3 production occurring in high aerosol conditions is likely due to the high HONO concentrations in Shanghai.
4.3 Effects of clouds
Cloud cover can have very important impacts on the photolysis of HONO, which can affect the effect of HONO on OH radicals. The above calculations are based on cloud-free conditions, with a heavy aerosol concentration in the Beijing region. As shown in Fig. 5, during the case study period (5 to 6 October 2015) (see Fig. 4), the weather map shows cloud-free conditions with heavy aerosol conditions.
In order to understand the effects of cloud on the photolysis of HONO, we include different cloud cover in the TUV model. The calculated results are shown in Fig. 12. The results show that thin cloud (with cloud cover at 2 km and cloud water of 10 g m−3) could reduce the photolysis rate of HONO by about 40 %, but the HONO could still have important effects. However, with dense cloud conditions (with cloud cover at 2 and 3 km and cloud water of 50 and 10 g m−3), the photolysis rate of HONO could be reduced by 9–10 times by the cloud. In this case, adding the photolysis rate of HONO cannot produce an important effect on OH radicals and the production of O3.
4.4 OH in winter
The measurement of O3 also shows that the concentrations in winter were always low (see Fig. 2), suggesting that the O3 concentrations were not significantly affected by the appearance of HONO. Figure 13 shows the OH concentrations in September and December. It shows that under different aerosol conditions, OH concentrations in December were very low compared with the values in September. Both the calculated OH concentrations include the HONO production term. For example, under the condition of AOD = 2.5, the maximum OH is about 7.5×10⁵ no. cm−3 in September, while it is rapidly reduced to 1.5×10⁵ no. cm−3 in December. Under the condition of AOD = 3.5, the maximum OH is still maintained at a relatively high level (4.5×10⁵ no. cm−3) in September. However, the maximum OH values are extremely low in December, with maximum value of 0.5×10⁵ no. cm−3. Because both types of OH chemical production (P1 and P2) are strongly dependent upon solar radiation (see Reaction R4), the seasonal variation of solar radiation plays important roles for controlling the OH production in winter (see Fig. 13). Because the solar radiation is at a very low level in winter, adding the photolysis of HONO has a smaller effect in winter than in other seasons, and OH remains at low values by including the HONO production term.

Figure 13The calculated OH concentrations in September (blue bars) and December (dark red bars) under different aerosol levels.
Currently, China is undergoing rapid economic development, resulting in a high demand for energy and greater use of fossil fuels. As a result, high emissions of pollutants produce heavy aerosol pollution (PM2.5) in eastern China, such as in the megacity of Beijing. Long-term measurements show that in addition to heavy aerosol pollution, O3 is becoming another major pollutant in the Beijing region. The measured results show that there was very strong seasonal variation in the concentrations of both PM2.5 and O3 in the region. During winter, the seasonal variability of O3 concentrations was anticorrelated with PM2.5 concentrations. However, from late spring to early fall, the correlation between PM2.5 and O3 concentrations was positive compared to negative in winter. This result suggests that during heavy aerosol conditions (solar radiation was depressed), the O3 chemical production was still high, appearing as a co-occurrence of high PM2.5 and O3 in some cases from late spring to early fall. This co-occurrence of high PM2.5 and O3 is the focus of this study. The results are highlighted as follows.
-
There are high daytime HONO concentrations in major Chinese megacities, such as Beijing and Shanghai. It is also interesting to note that high HONO concentrations occurred during high aerosol concentration periods. Under high daytime HONO concentrations, HONO can be photodissociated to OH radicals and become an important part of the process to produce OH.
-
With including the OH production of measured HONO concentrations, the calculated OH concentrations are significantly higher than without including this production. For example, without HONO production, the maximum OH concentration is about 7.5×10⁵ no. cm−3 under low aerosol conditions (AOD = 0.25) and is rapidly reduced to 1.5×10⁵ no. cm−3 under high aerosol conditions (AOD = 2.5) in September. In contrast, by including HONO production, the OH concentrations significantly increased. For example, under higher aerosol conditions (AOD = 2.5), the maximum OH concentration is about 7.5×10⁵ no. cm−3, which is similar to the value under low aerosol conditions in the no-HONO case. This result suggests that even under high aerosol conditions, the chemical oxidizing process for O3 production can be active. This result is likely to explain the co-occurrence of high PM2.5 and high O3 from late spring to early in eastern China.
-
The measurement of O3 also shows that the concentrations in winter were always low, suggesting that the O3 concentrations were not significantly affected by the appearance of HONO. The calculated result shows that the seasonal variation of solar radiation plays important roles for controlling the OH production in winter. Because solar radiation is at a very low level in winter, adding the photolysis of HONO has a smaller effect in winter than in other seasons, and OH remains at low values by including the HONO production term.
In recent years, PM2.5 pollution has been reduced due to the large control efforts by the Chinese government, but O3 pollution has become another severe pollution problem in eastern China. This study is important because it provides some significant scientific insight to better understand O3 pollution in eastern China.
The data used in this paper can be provided upon request from Xuexi Tie (tiexx@ieecas.cn).
XT came up with the original idea of investigating the scientific issue. XT and JX designed the analysis method. XL, GL, JC, and SZ provided the observational data and helped in discussion. XT prepared the paper with contributions from all coauthors.
The authors declare that they have no conflict of interest.
This work was supported by the National Natural Science Foundation of China (NSFC) under grant nos. 41430424 and 41730108. The authors are grateful for support from the Center for Excellence in Urban Atmospheric Environment, Institute of Urban Environment, Chinese Academy of Sciences.
This research has been supported by the National Natural Science Foundation of China (grant nos. 41430424 and 41730108).
This paper was edited by Jianping Huang and reviewed by two anonymous referees.
Bian, H., Han, S. Q., Tie, X., Shun, M. L., and Liu, A. X.: Evidence of Impact of Aerosols on Surface Ozone Concentration: A Case Study in Tianjin, China, Atmos. Environ., 41, 4672–4681, 2007.
Chameides, W. L., Fehsenfeld, F., Rodgers, M. O., Cardelino, C., Martines, J., Parrish, D., Lonneman, W., Lawson, D. R., Rasmussen, R. A., Zimmerman, P., Greenberg, J., Middleton, P., and Wang, T.: Ozone precursor relationships in the ambient atmosphere, J. Geophys. Res., 97, 6037–6055, 1992.
Deng, X. J, Tie, X., Wu, D., Zhou, X. J., Tan, H. B., Li, F., and Jiang, C.: Long-term trend of visibility and its characterizations in the Pearl River Delta Region (PRD), China, Atmos. Environ., 42, 1424–1435, 2008.
Geng, F. H., Zhao, C. S., Tang, X., Lu, G. L., and Tie, X.: Analysis of ozone and VOCs measured in Shanghai: A case study, Atmos. Environ., 41, 989–1001, 2007.
Geng, F. H., Cai, C. G., Tie, X., Yu, Q., An, J. L., Peng, L., Zhou, G. Q., and Xu, J. M.: Analysis of VOC emissions using PCA/APCS receptor model at city of Shanghai, China, J. Atmos. Chem., 62, 229–247, https://doi.org/10.1007/s10874-010-9150-5, 2010.
Grell, G. A., Peckham, S. E., Schmitz, R., McKeen, S. A., Frost, G., Skamarock, W. C., and Eder, B.: Fully coupled “online” chemistry within the WRF model, Atmos. Environ., 39, 6957–6975, 2005.
He, S. and Carmichael, G. R.: Sensitivity of photolysis rates and ozone production in the troposphere to aerosol properties, J. Geophys. Res.-Atmos., 104, 26307–26324, 1999.
Huang, J. P., Li, Y., Fu, C., Chen, F., Fu Q., Dai, A., Shinoda, M., Ma, Z., Guo, W., Li, Z., Zhang, L., Liu, Y., Yu, H., He, Y., Xie, Y., Guan, X., Ji, M., Lin, L., Wang, S., Yan, H., and Wang, G., Dryland climate change recent progress and challenges, Rev. Geophys., 55, 719–778, https://doi.org/10.1002/2016RG000550, 2017.
Huang, J. P, Liu, X. Y., Li, C. Y., Ding, L., and Yu, H. P.: The global oxygen budget and its future projection, Science Bull., 63, 1180–1186, 2018.
Huang, R. J., Yang, L., Cao, J. J., Wang, Q. Y., Tie, X., Ho, K. F., Shen, Z., Zhang, R., Li, G., Zhu, C., Zhang, N., Dai, W., Zhou, J., Liu, S., Chen, Y., Chen, J., and O'Dowd, C. D.: Concentration and sources of atmospheric nitrous acid (HONO) at an urban site in Western China, Sci. Total Environ., 593/594, 165–172, https://doi.org/10.1016/j.scitotenv.2017.02.166, 2017.
Jia, R., Luo, M., Liu, Y., Zhu, Q. Z., Hua, S., Wu, C. Q., and Shao, T.: Anthropogenic Aerosol Pollution over the Eastern Slope of the Tibetan Plateau, Adv. Atmos. Sci., 36, 847–862, 2019.
Lei, W., Zhang, R., Tie, X., and Hess, P.: Chemical characterization of ozone
formation in the Houston-Galveston area, J. Geophys. Res., 109, 1–15, https://doi.org/10.102/2003JD004219, 2004.
Li, G., Bei, N., Tie, X., and Molina, L. T.: Aerosol effects on the photochemistry in Mexico City during MCMA-2006/MILAGRO campaign, Atmos. Chem. Phys., 11, 5169–5182, https://doi.org/10.5194/acp-11-5169-2011, 2011.
Li, G., Bei, N., Cao, J., Wu, J., Long, X., Feng, T., Dai, W., Liu, S., Zhang, Q., and Tie, X.: Widespread and persistent ozone pollution in eastern China during the non-winter season of 2015: observations and source attributions, Atmos. Chem. Phys., 17, 2759–2774, https://doi.org/10.5194/acp-17-2759-2017, 2017.
Long, X., Tie, X., Cao, J., Huang, R., Feng, T., Li, N., Zhao, S., Tian, J., Li, G., and Zhang, Q.: Impact of crop field burning and mountains on heavy haze in the North China Plain: a case study, Atmos. Chem. Phys., 16, 9675–9691, https://doi.org/10.5194/acp-16-9675-2016, 2016.
Madronich, S. and Flocke, S.: The Role of Solar Radiation in Atmospheric Chemistry, in: Environmental Photochemistry 2/2L, 1–26, Springer Berlin Heidelberg, 1–26, 1999.
Quan, J. N., Gao, Y., Zhang, Q., Tie, X., Cao, J. J., Han, S. Q., Meng, J. M., Chen, P. F., and Zhao, D. L.: Evolution of Planetary Boundary Layer under different weather conditions, and its impact on aerosol concentrations, Particuology, 11, 34–40, https://doi.org/10.1016/j.partic.2012.04.005, 2013.
Seinfeld, J. H. and Pandis, S. N.: Atmospheric Chemistry and Physics, From Air Pollution to Climate Change, 2nd Edn., John Wiley and Sons, New York, chap. 6, Chemistry of the Troposphere, 204–274, 2006.
Sillman, S.: The use of NOy, H2O2, and HNO3 as indicators for ozone-NOx-hydrocarbon sensitivity in urban locations, J. Geophys. Res., 100, 14175–14188, 1995.
Tie, X. and Cao, J. J.: Understanding Variability of Haze in Eastern China, J. Fundam. Renew. Energ. Appl., 7, 1–4, https://doi.org/10.4172/2090-4541.1000241, 2017.
Tie, X., Brasseur, G., Zhao, C., Granier, C., Massie, S., Qin, Y., Wang, P. C., Wang, G. L., and Yang, P. C.: Chemical Characterization of Air Pollution in Eastern China and the Eastern United States, Atmos. Environ., 40, 2607–2625, 2006.
Tie, X., Wu, D., and Brasseur, G.: Lung Cancer Mortality and Exposure to Atmospheric Aerosol Particles in Guangzhou, China, Atmos. Environ., 43, 2375–2377, 2009a.
Tie, X., Geng, F. H., Peng, L., Gao, W., and Zhao, C. S.: Measurement and modeling of O3 variability in Shanghai, China; Application of the WRF-Chem model, Atmos. Environ., 43, 4289–4302, 2009b.
Tie, X., Geng, F., Guenther, A., Cao, J., Greenberg, J., Zhang, R., Apel, E., Li, G., Weinheimer, A., Chen, J., and Cai, C.: Megacity impacts on regional ozone formation: observations and WRF-Chem modeling for the MIRAGE-Shanghai field campaign, Atmos. Chem. Phys., 13, 5655–5669, https://doi.org/10.5194/acp-13-5655-2013, 2013.
Tie, X., Zhang, Q., He, H., Cao, J. J., Han, S.Q., Gao, Y., Li, X., and Jia, X. C.: A budget analysis on the formation of haze in Beijing, Atmos. Environ., 100, 25–36, https://doi.org/10.1016/j.atmosenv.2014.10.038, 2015.
Tie, X., Huang, R. J., Dai, W. T., Cao, J. J., Long, X., Su, X. L., Zhao, S. Y., Wang, Q. Y., and Li, G. H.: Effect of heavy haze and aerosol pollution on rice and wheat productions in China, Sci. Rep., 6, 29612, https://doi.org/10.1038/srep29612, 2016.
Tie, X., Huang, R. J., Cao, J. J., Zhang, Q., Cheng, Y. F., Su, H., Chang, D., Pöschl, U., Hoffmann, T., Dusek, U., Li, G. H., Worsnop, D. R., and O'Dowd, C. D.: Severe Pollution in China Amplified by Atmospheric Moisture, Sci. Rep., 7, 15760, https://doi.org/10.1038/s41598-017-15909-1, 2017.
Zhang, L., Wang, T., Zhang, Q., Zheng, J., Xu, Z., and Lv, M.: Potential sources of nitrous acid (HONO) and their impacts on ozone: A WRF/Chem study in a polluted subtropical region, J. Geophys. Res.-Atmos., 121, 3645–3662, 2016.
Zhang, Q., Zhao, C. S., Tie, X., Wei, Q., Li, G. H., and Li, C.: Characterizations of Aerosols over the Beijing Region: A Case Study of Aircraft Measurements, Atmos. Environ., 40, 4513–4527, 2006.
Zhang, R., Tie, X., and Bond, D.: Impacts of Anthropogenic and Natural NOx Sources over the US on Tropospheric Chemistry, P. Natl. Acad. Sci. USA, 100, 1505–1509, 2003.
Zhu, Q., Liu, Y., Jia, R., Hua, S., Shao, T., and Wang, B.: A numerical simulation study on the impact of smoke aerosols from Russian forest fires on the air pollution over Asia, Atmos. Environ., 182, 263–274, 2018.