the Creative Commons Attribution 4.0 License.
the Creative Commons Attribution 4.0 License.
 | 04 Sep 2019
Impact of the Green Light Program on haze in the North China Plain, China
Xin Long
Xuexi Tie
Jiamao Zhou
Wenting Dai
Tian Feng
Guohui Li
Junji Cao
Zhisheng An
As the world's largest developing country, China has undergone ever-increasing demand for electricity during the past few decades. In 1996, China launched the Green Light Program (GLP), which became a national energy conservation activity for saving lighting electricity as well as an effective reduction of the coal consumption for power generation. Despite the great success of the GLP, its effects on haze have not been investigated and well understood. This study focused on assessing the potential coal saving induced by the improvement of luminous efficacy, the core of the GLP, and on estimating the consequent effects on the haze in the North China Plain (NCP), where a large number of power plants are located and are often engulfed by severe haze. The estimated potential coal saving induced by the GLP can reach a massive value of 120–323 million tons, accounting for 6.7 %–18.0 % of the total coal consumption for thermal power generation in China. There was a massive potential emission reduction of air pollutants from thermal power generation in the NCP, which was estimated to be 20.0–53.8 Gg for NOx and 6.9–18.7 Gg for SO2 in December 2015. The potential emission reduction induced by the GLP plays important roles in the haze formation, because the NOx and SO2 are important precursors for the formation of particles. To assess the impact of the GLP on haze, sensitivity studies were conducted by applying a regional chemical–dynamical model (WRF-CHEM). The model results suggest that in the case of lower-limit emission reduction, the PM2.5 concentration decreased by 2–5 µg m−3 in large areas of the NCP. In the case of upper-limit emission reduction, there was much more remarkable decrease in PM2.5 concentration (4–10 µg m−3). This study is a good example to illustrate that scientific innovation can induce important benefits for environment issues such as haze.
- Article
(6885 KB) - Full-text XML
-
Supplement
(7029 KB) - BibTeX
- EndNote


As the world's largest developing country, China has undergone ever-increasing demand for electricity during the past few decades. Artificial lighting is an important part of China's energy consumption, accounting for a quite stable share of about 10 %–14 % of the total electricity consumption (Lv and Lv, 2012; Zheng et al., 2016). Also, the lighting demand in China is predicted to increase continuously, with a projected average annual growth rate of 4.3 % from 2002 to 2020 (Liu, 2009). With the principal objective of alleviating shortage of electricity, China launched the Green Light Program (GLP) in 1996, with the core aim of replacing low-efficiency lighting lamps with high-efficiency ones. Since then, the GLP has become a national energy conservation activity for saving lighting electricity (Lin, 1999) and has been highlighted continuously in the nation's 9th–12th Five-Year Plan (1996–2015) (Guo and Pachauri, 2017).
With the object of providing high-quality efficient lighting products, the GLP is undoubtedly a useful electricity saving measure. Nonetheless, driven by the accelerated economic increase, the thermal power electricity has experienced an ever-increasing trend in the past decades as well as the associated coal consumption for thermal power generation. Thermal power generation is the primary electricity source in China, contributing about 72 %–78 % of the total electricity (NBS, 2000–2016). In 2015, the coal consumption for thermal power generation in China increased to a massive value of about 1.8 billion tons, which was 3.2 times that in 2000. And the coal consumption for thermal power generation in China was 2.7 times that in the USA, which was reported to be 670 million tons (https://www.eia.gov/totalenergy/data/browser/, last access: 20 December 2018).
Due to the significant use of coal, thermal power generation is one of the dominant emission contributors to anthropogenic air pollutants in China (Tie and Cao, 2010; Wang and Hao, 2012; Wang et al., 2015b). The power sector contributes significantly to air pollutants of the nitrogen oxides (NOx), the sulfur dioxide (SO2), and the particulate mater (PM) (Zhao et al., 2013; Huang et al., 2016). The pollutants of SO2 and NOx are the precursors of secondary pollutants of ozone (O3) and secondary aerosols (Seinfeld et al., 1998; Laurent et al., 2014). It is also reported that emission from the power sector is a major contributor to particulate sulfate and nitrate (Zhang et al., 2012). The emissions from thermal power generation in China can also be transported a long distance, causing regional/global air pollutions (Tie et al., 2001; Huang et al., 2016). Considering the important contributions to air pollutants, controlling emissions from thermal power generation is a vital strategy for the improvement of air quality in China.
Distinguished from the ever-increasing trend of thermal power electricity and the associated coal consumption, the increase trends of SO2 and NOx emissions from thermal power generation are curbed and even change to decrease (Liu et al., 2015). This is caused by the nation-wide project of utilizing emission control facilities during 2005 to 2015, such as installing flue-gas desulfurization/denitrification systems and optimizing the generation fleet mix (Liu et al., 2015; Huang et al., 2016). Influenced by the technological changes that have occurred in the power sector, the air pollutant emissions from power generation have been significantly reduced. Emission reductions of air pollutants can substantially reduce the aerosol loading and thus influence the boundary layer, which is inherently connected to air pollution (Li et al., 2017). The interactions between aerosol and boundary layer can influence the surface ozone significantly, and more attention should be paid when controlling ozone pollution (Gao et al., 2018). However, the thermal power generation is still identified with massive air pollutant emissions, involving 5.1 million tons of NOx, 4.0 million tons of SO2, and 0.8 million tons of PM in 2015 (Tong et al., 2018). Under high standards of ultra-low emission power units, the staggering total amount of coal consumption becomes a vital challenge for emission control from thermal power generation.
With ambitious and comprehensive efforts, the success of the GLP resulted in about 59 billion kWh of accumulated electricity savings from 1996 to 2005 (SCIO, 2006) and about 14.4 billion kWh of annual electricity savings from 2006 to 2010 (Lv and Lv, 2012). It is reported that the GLP has produced climate benefits for the environment, reducing 17 million tons of CO2 and 530 thousand tons of SO2 emissions from 1996 to 2005 (Guo and Pachauri, 2017). Aside from emission reductions, the GLP is a benefit to coal saving from the thermal power generation, which is inherently connected to air quality in China (Liu et al., 2015; Huang et al., 2016; Hu et al., 2016).
However, few studies have so far been dedicated to estimating the effectiveness of the GLP in controlling air pollution on a regional scale. In the North China Plain (NCP), the thermal power plants are distributed very densely, resulting in massive emissions of air pollutants (Liu et al., 2015). As a result, the GLP could produce significant energy saving and reduce the associated air pollutant emissions from thermal power generation. Although the GLP is under strong and sustained government commitment, there is no built-in mechanism for monitoring the GLP and without regularly issued official program assessment reports (Guo and Pachauri, 2017). During the past decades, the Chinese government has published only one report regarding the performance of the GLP (NDRC, 2005). There are several articles and books summarizing the GLP from time to time by the Energy Research Institute under Chinas' National Development and Reform Commission, providing information for an assessment of the GLP (Yu and Zhou, 2001; Liu, 2006, 2012; Liu and Zhao, 2011; Lv and Lv, 2012; Gao and Zheng, 2016). Previous studies do not investigate the effects of the GLP on air pollution well, such as the resultant emission reductions of air pollutants or the consequent effects on haze.
We quantified the effect of the GLP on the haze in the NCP, a severely air-polluted region in China. The study included satellite measurements and numerical model studies (WRF-CHEM). We first investigated the lighting coal consumption and resultant coal saving induced by the GLP utilizing the satellite nighttime lights (NTL) data (Elvidge et al., 2009), which have been widely used to estimate the consumption of energy and electricity (He et al., 2013; Huang et al., 2014). Then we evaluated the potential emission reductions and resultant effects on air pollution in the NCP using the WRF-CHEM model. This study provided an overall perspective on gaps of the unevaluated potential benefits to haze induced by the GLP, which can inspire more macroscopic and interdisciplinary analysis in long-term national activities based on NTL datasets. We summarized the data, the methodology, and the WRF-CHEM model description in Sect. 2. Results and discussions were presented in Sect. 3, followed by the summaries and conclusions in Sect. 4.
2.1 The NTL and emissions from the power sector
In order to understand the spatial distributions of lighting electricity consumption, we investigated version 4 of the Defense Meteorological Satellite Program Operational Line Scanner (DMSP/OLS) NTL time series data from 1992 to 2013 (Elvidge et al., 2014). The dataset is available at https://ngdc.noaa.gov/eog/dmsp/downloadV4composites.html (last access: 27 August 2019). We selected the stable light datasets, which are the cloud-free composites using all the archived DMSP/OLS smooth resolution data for calendar years. The images represent the average intensity of NTL, with DN values ranging from 0 to 63 in 30 arcsec grid cells (about 1 km spatial resolution). The 1992 and 2013 datasets were used to investigate the different status of NTL before and after the GLP. Considering the differences between the sensors, differences in the crossing times of the satellites, and degradation of the sensors (Elvidge et al., 2009, 2014), we inter-calibrated the NTL datasets followed a second-order regression model (Elvidge et al., 2014). Figure 1 shows the spatial distributions of the DMSP/OLS NTL data. We found that the nighttime lights were increased significantly from 1992 to 2013, both in lighting intensity and spatial coverage, especially in the regions of eastern China, including the NCP, the Pearl River Delta, and the Yangtze River Delta. The rapid increase in the nighttime lights implies that the lighting electricity was greatly increased.
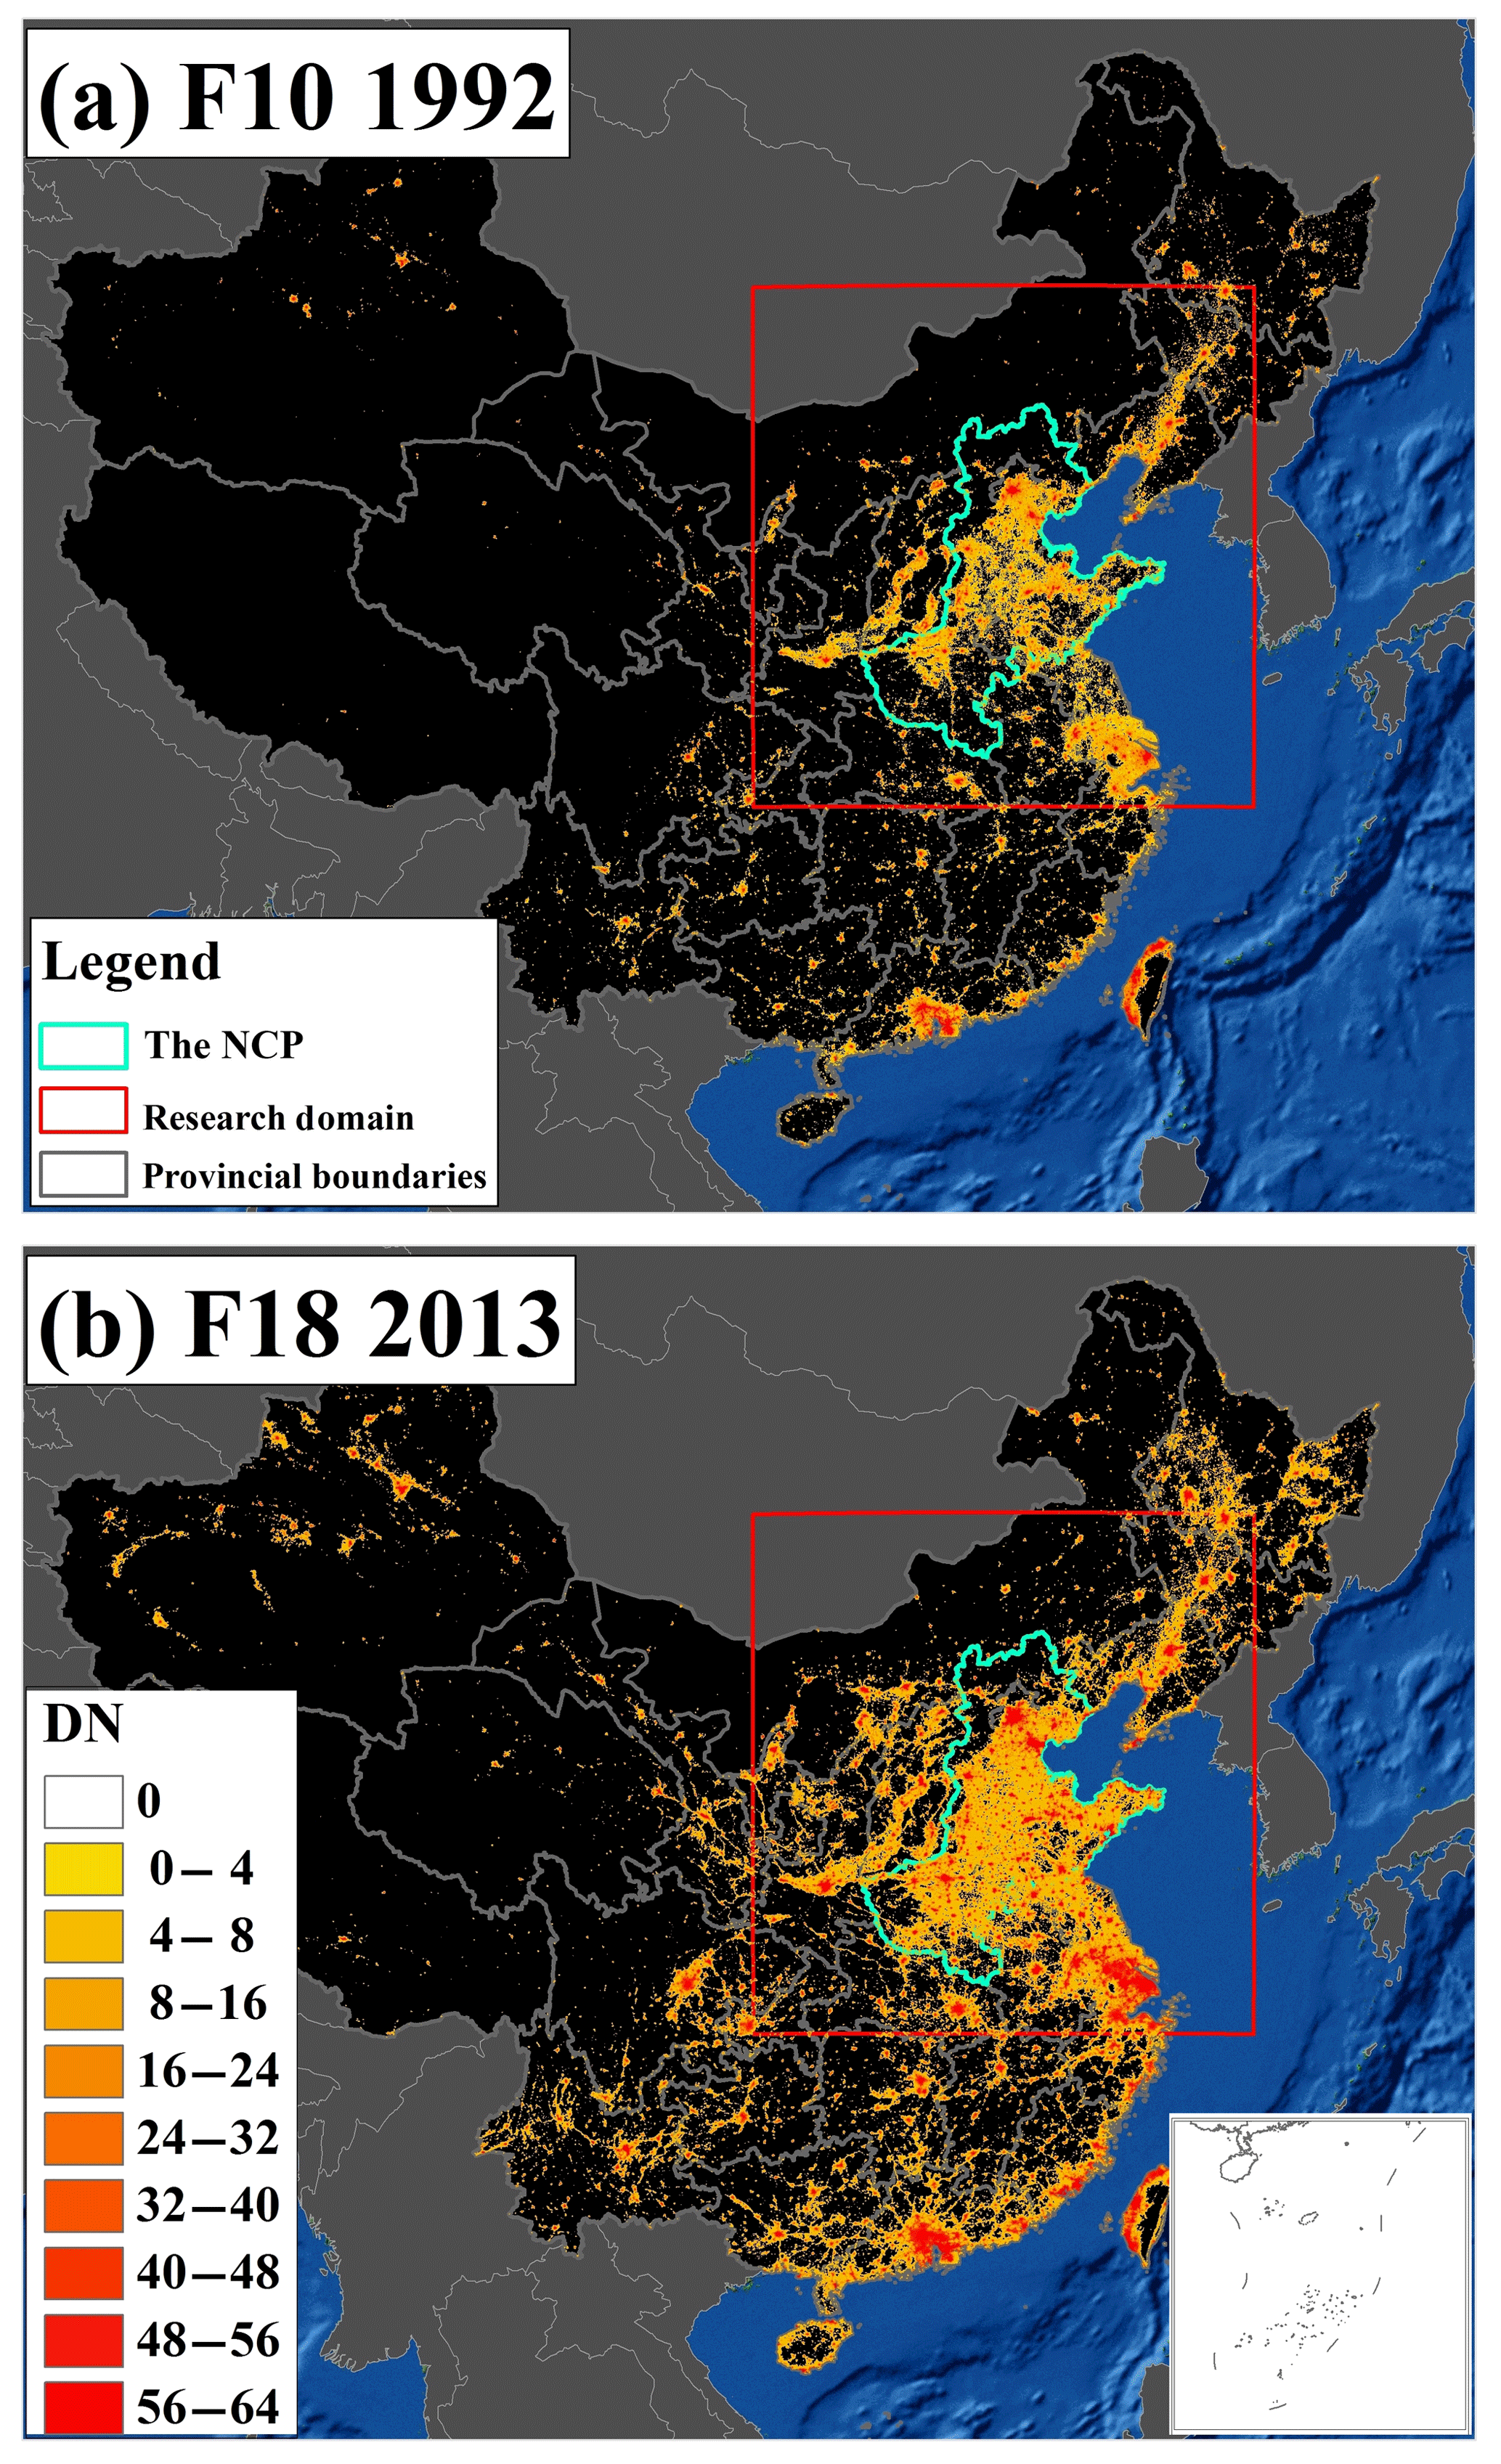
Figure 1The spatial distributions of the nighttime-light data (NLT) from DMSP/OLS DN values in (a) 1992 and in (b) 2013.
Based on the statistics of National Bureau of Statistics of China (NBS, 2000–2016) and previous studies (Liu et al., 2015; Tong et al., 2018), Fig. 2 summarizes the annual thermal power electricity, the total coal consumption for thermal power generation, and the air pollutant emissions (SO2, NOx, and PM2.5) from thermal power plants in China. The ever-increasing demand for electricity increased from 2000 (about 1012 kW h) to 2015 (about 4×10¹² kW h), most likely driven by the rapid increase in the economy. The SO2 emission from the power sector increased before 2005, corresponding to the increase in coal consumption, while after 2006, the SO2 emission from the power sector started to decrease sharply, and this is mainly caused by the widespread emission control strategies of installation of flue-gas desulfurization systems and the substitution of lower sulfur fuel (Liu et al., 2016). Distinguished from the increase trend of NOx emission from transportation (Hu et al., 2016), the decrease in NOx emission from the power sector started to decrease in 2012 due to the significant technological improvement of coal-consumption-weighted mean NOx removal efficiency (Hu et al., 2016; Tong et al., 2018). Compared to the gas-phase emissions of SO2 and NOx, the direct emission of particles (PM2.5) was relatively small (Liu et al., 2015; Tong et al., 2018). The large portion of gas-phase emissions and small portion of PM2.5 emissions (Fig. 2) from thermal power generation indicated that most PM2.5 emitted from the power plants might be in the phase of secondary particles.
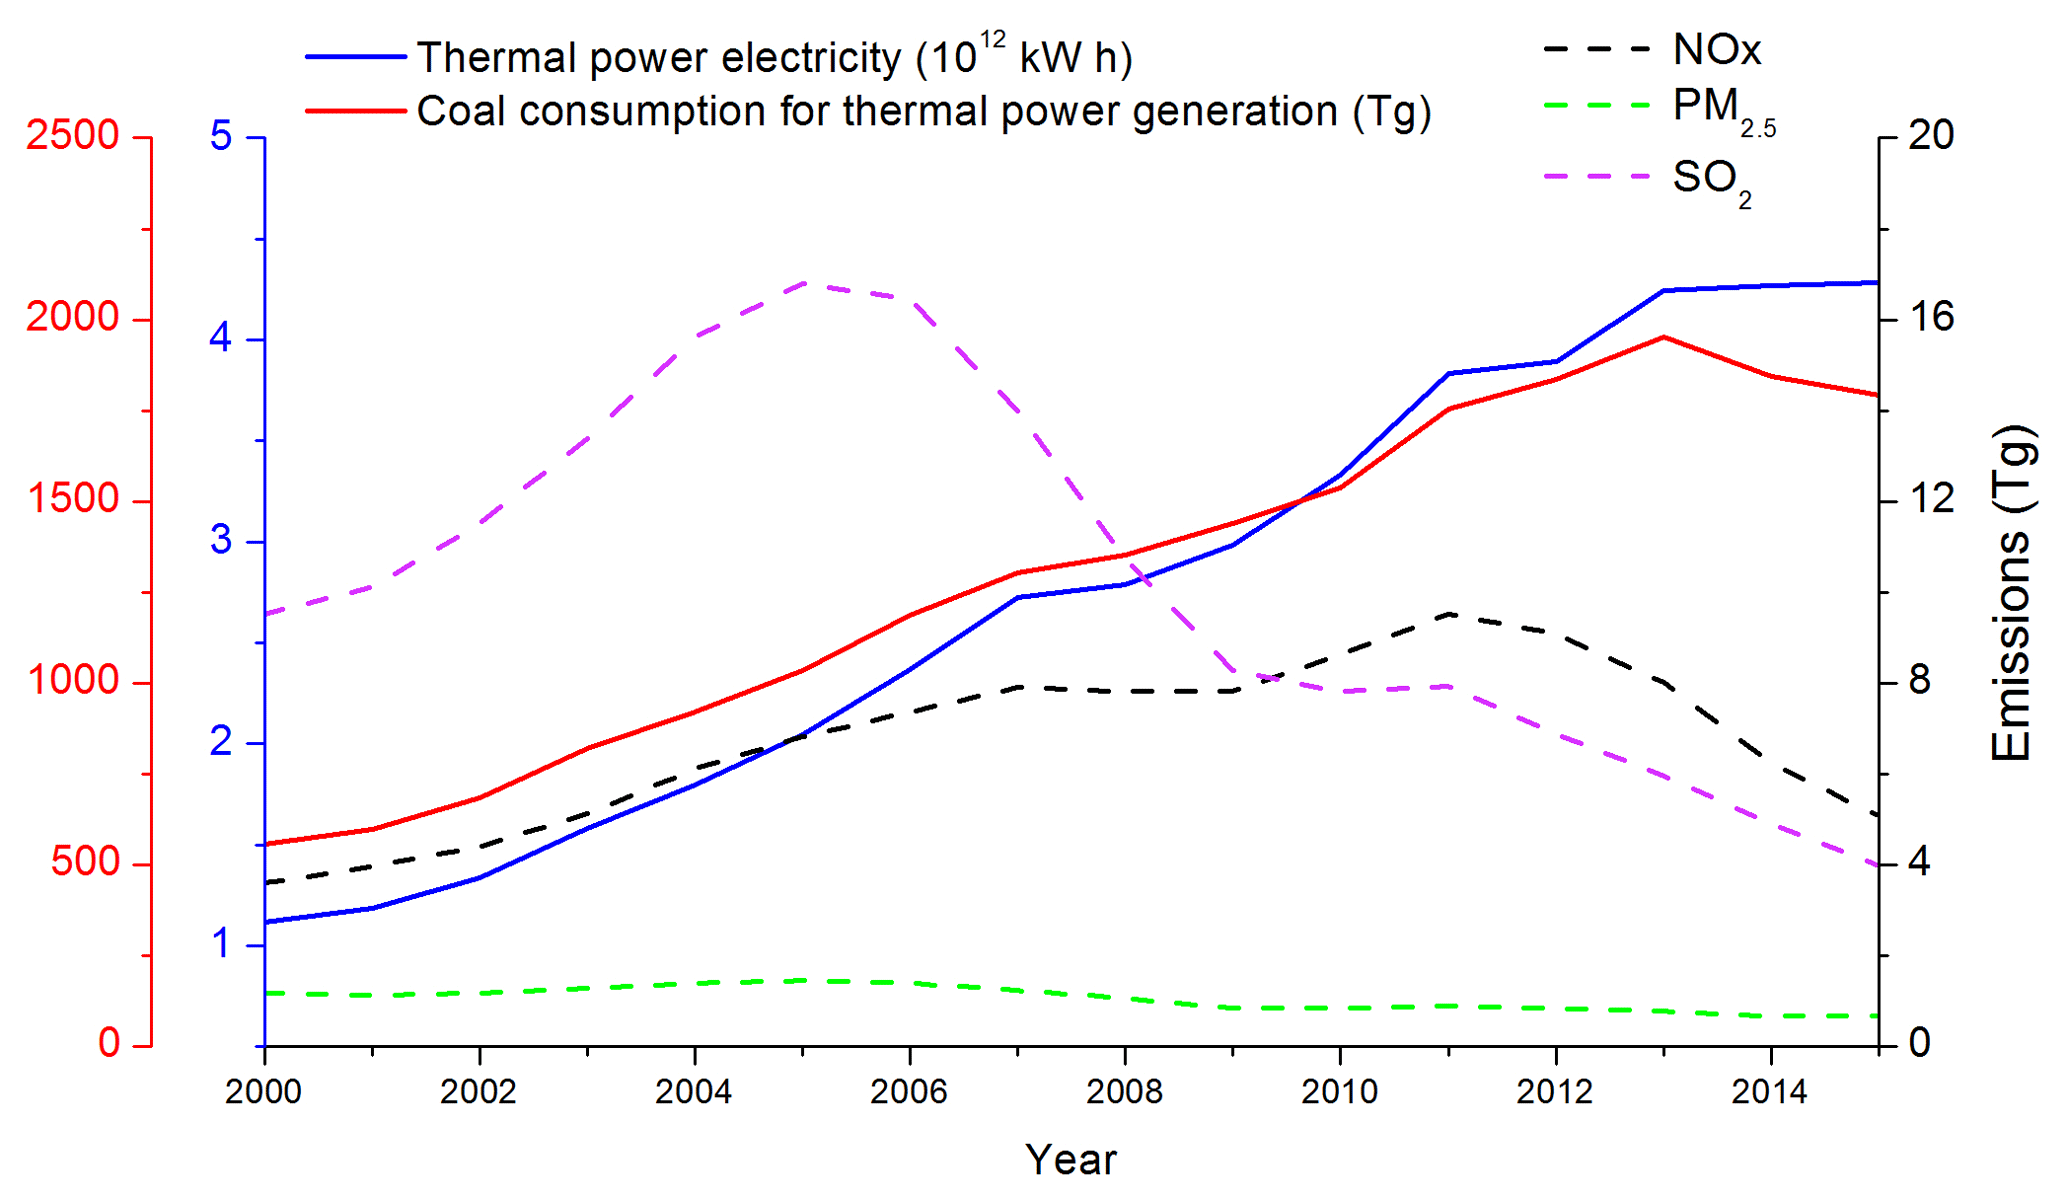
Figure 2Coal-fired power electricity and associated coal consumption for power generation, and the emissions of NOx, SO2, and PM2.5 from thermal power plants from 2000 to 2015 in China.
The GLP focused on improving the luminous efficacy, saving lighting electricity and thus reducing the coal consumption and air pollutant emissions from thermal power generation, which is inherently connected to air quality. As the business-as-usual condition (i.e., without the GLP), the increased lighting demand could cause more significant increase in thermal power electricity and produce stronger demand for coal consumption for power generation during the past decades. This study was to assess the potential effects induced by the GLP on haze in the NCP and also to display a good example to illustrate that scientific innovation can induce important benefits for environment issues. To assess the impacts of the GLP on the severely air-polluted region in China, such as in the NCP, several important tools and data were used in this study, including a regional chemical/dynamical model (WRF-CHEM), satellite data (DMSP/OLS and S-NPP), and surface measurements of air pollutants.
2.2 Description of the WRF-CHEM model
We used a specific version of the WRF-CHEM model (Grell et al., 2005). The model included a new flexible gas-phase chemical module and the Models3 community multi-scale air quality (CMAQ) aerosol module developed by the US EPA (Binkowski and Roselle, 2003). The model included the dry deposition (Wesely, 1989) and wet deposition followed the CMAQ method. The impacts of aerosols and clouds on the photochemistry (Li et al., 2011b) were considered by the photolysis rate calculation in the fast radiation transfer model (Tie et al., 2003; Li et al., 2005). The inorganic aerosols (Nenes et al., 1998) were predicted using ISORROPIA version 1.7. We also used a non-traditional secondary organic aerosol (SOA) model, including the volatility basis-set modeling approach and SOA contributions from glyoxal and methylglyoxal. Detailed information about the WRF-CHEM model can be found in previous studies (Li et al., 2010, 2011a, b, 2012).
In the present study, we simulated severe haze from 1 to 31 December 2015 in the NCP. The domain, centered at the point of (116∘ E, 38∘ N), was composed horizontally of 300 by 300 grid points spaced with a resolution of 6 km (Fig. 3) and vertically with 35 sigma levels. The physical parameterizations included the microphysics scheme (Hong and Lim, 2006), the Mellor–Yamada–Janjic turbulent kinetic energy planetary boundary layer scheme (Janjić, 2002), the unified Noah land-surface model (Chen and Dudhia, 2001), the Goddard longwave radiation parameterization (Chou and Suarez, 1999), and the shortwave radiation parameterization (Chou et al., 2001). Meteorological initial and boundary conditions were obtained from the 1∘ by 1∘ reanalysis data of the National Centers for Environmental Prediction (Kalnay et al., 1996). The spin-up time of the WRF-CHEM model is 3 d. The chemical initial and boundary conditions were constrained from the 6 h output of Model of Ozone and Related chemical Tracers, version 4 (Horowitz et al., 2003).

Figure 3The horizontal domain of the model (WRF-CHEM), with the location of sampling sites (shown by the green crosses) and topographical conditions of the NCP, which are surrounded by the mountains of Yan and Tai in the north and west, respectively.
We utilized the anthropogenic emission inventory developed by Tsinghua University (Zhang et al., 2009), including anthropogenic emission sources from transportation, agriculture, industry and power generation, and residential. The dataset is accessible from the website of the MEIC (http://www.meicmodel.org, last access: 27 August 2019), providing for the community a publicly accessible emission dataset over China with regular updates. The emission inventory used in the present study was updated and improved for the year 2015. In addition, the emissions of SO2, NOx, and CO have been adjusted according to the observations during the period. Emissions from biogenic sources were calculated online using the Model of Emissions of Gases and Aerosol from Nature (MEGAN) (Guenther et al., 2006).
2.3 Analysis of satellite data and model domain
Since the launch of the Suomi-National Polar-orbiting Partnership satellite in 2011, the Day/Night Band for the Visible Infrared Imaging Radiometer Suite (VIIRS DNB) has been widely used in recent studies, which confirmed empirical relationships with energy use (Román and Stokes, 2015; Coscieme et al., 2014). To some extent, the VIIRS NTL dataset (in 15 arcsec grid cells, about 500 m) is superior to the DMSP/OLS NTL dataset (Elvidge et al., 2013). In the present study, we used version 1 of the VIIRS NTL dataset to investigate the consumption of lighting electricity in each province, defined as provincial dynamics as follows.
where i denotes the provincial domain and w is the nationwide domain. j is the pixel of the VIIRS NTL dataset. S is the area of pixel j. L is the NTL radiance. The annual VIIRS NTL dataset contains the cloud-free average of NTL radiance by excluding any data impacted by stray light and further screening out the fires and other ephemeral lights and background (non-lights). The dataset is available at https://ngdc.noaa.gov/eog/viirs/download_dnb_composites.html (last access: 27 August 2019).
The distribution of VIIRS NTL radiance in 2015 (Fig. S1 in the Supplement) was similar to the DMSP/OLS DN values (Fig. 1). The high values of annual NTL radiance were concentrated in the densely populated and industrial developed areas of China (Fig. S1a), such as the NCP, the Yangtze River Delta, and the Pearl River Delta. There were “hotspots” located in some megacities, such as the Beijing, Tianjin, Shanghai, and Guangzhou, where the NTL radiance can reach as high as 20 mW m−2 sr−1. Statistically, 12.8 % of these Chinese land areas consume 58.3 % of the lighting electricity consumption. The high values of provincial dynamics were also concentrated in these regions, and all the provincial dynamics exceeding 5 % were coastal cities (Fig. S1b). In the NCP, in addition to the high usage of lighting, there is a large number of power plants (Liu et al., 2015). We selected the NCP (Fig. 3) as the region of interest. In addition, there are extensive measurement sites of pollutants in the domain (the green crosses in Fig. 3).
2.4 Estimation of coal saving induced by the GLP
According to the analysis for the Chinese GLP (Guo and Pachauri, 2017), the lighting activities can be defined as three clusters according to their usages: (C1) for outdoor lighting, such as road lights; (C2) household usage, mainly for residential applications; (C3) commercial and industrial buildings. In practice, the core of the GLP is to improve luminous efficiency, replacing low-efficiency lighting lamps with high-efficiency ones. The details of the GLP were as follows. For C1, the high-pressure sodium lamps (HPS) and metal halide (MH) lamps are primarily used to replace high-pressure mercury-vapor lamps (HPM). For C2, the compact fluorescent lamps (CFLs) are used to replace incandescent lamps (ILs). For C3, the T8/T5 fluorescent tubes are used to replace T12/T10 fluorescent tubes. The emerging LED lamps were not covered, and they were promoted to each of the above clusters (Pan, 2018; Wang, 2017; Asolkar and Ardhapurkar, 2017; Ge et al., 2016; Edirisinghe et al., 2016). Here the LED lamps were allocated proportionally based on the proportions of the lighting electricity consumption of C1, C2, and C3.
According to the classification above, we estimated the current equivalent luminous efficacy (ELEGLP) weighted by the proportion of their lighting electricity consumption. To investigate the potential effectiveness of the GLP, we also calculated the equivalent luminous efficacy without the implementation of the GLP (ELEno−GLP).
where k denotes the specified cluster of lighting lamps. fk is the proportion of lighting electricity consumed by the kth cluster lamps; LEk,GLP and denote the equivalent luminous efficacy of the kth cluster lamps with and without the improvement of lighting efficiency induced by the GLP. The ELE is a comprehensive parameter to reflect the lighting efficacy. In terms of current consumption levels of lighting electricity, the lighting coal consumption for power generation is proportional to ELE. As a result, the potential coal saving induced by the GLP (dC) can be estimated by
where C0 denotes the current coal consumption for thermal power generation. To get the spatial distribution of potential provincial coal savings (dCi), we spatially scaled the total potential coal saving (dC) according to the provincial dynamics factor (PDi), which is calculated based on the spatiotemporal dynamic of electric power consumption in each province (Elvidge et al., 1997; Chen and Nordhaus, 2011; He et al., 2013).
where i denotes the province; PDi reflects the provincial dynamics of lighting coal consumption, which was explained in Eq. (1).
Here we focus on the potential emission reductions derived from the potential lighting electricity savings induced by the GLP. And the emission reduction was confined to the improvement of luminous efficacy, which is the core of the GLP (Guo and Pachauri, 2017). The coal saving induced by the GLP was estimated with the same purification efficiency of air pollutant emissions between the base case (with the GLP) and sensitivity cases (without the GLP). And the ratio of power electricity going to lights is the same as the ratio of artificial lighting to the total electricity consumption, which is 10 %–14 % (Lv and Lv, 2012; Zheng et al., 2016).
It is worth noting that there were uncertainties in the present study. Thermal power generation is the primary electricity source in China, contributing about 72 %–78 % of the total electricity (NBS, 2000–2016), which indicates at least 6 % uncertainty in the estimation. Lv and Lv (2012) and Zheng et al. (2016) estimate the ratio of artificial lighting to the total electricity consumption, and the ratio is 10 %–14 %, which indicates about 4 % uncertainty in the estimation. Based on the current anthropogenic emission inventory from the MEIC (Multi-resolution Emission Inventory for China) (Liu et al., 2015; Zhang et al., 2009), the potential emission reduction (dEpower, spec) induced by the GLP was proportional to the associated potential coal saving for the thermal power generation.
where Epower,spec denotes the emission inventory from the thermal power sector; spec is the specific air pollutant of WRF-CHEM species. dC and C0 are the same as those in Eq. (4).
2.5 WRF-CHEM sensitivity studies
Based on previous studies (Guo and Pachauri, 2017), the effective luminous efficacy (ELE) increased from 50 to 70–140 lm W−1 for C1, from 15 to 50–60 lm W−1 for C2, and from 70–80 lm W−1 to 80–105 lm W−1 for C3. Simultaneously, the LED has experienced a fast growth since 2011, with the market share of LED lamps reaching 32 % in 2015, and the high-efficiency LED lamps with 150 lm W−1 had industrialized production in China (Gao and Zheng, 2016). Here we treated the market share of LED lamps as the proportion of its lighting electricity consumption. The regional diversity of LED market share would significantly influence the emission reductions derived by the luminous efficacy improvement induced by the GLP. However, the lighting electricity is transported from the power plants. The spatial dynamics of emission reductions induced by the GLP should be consistent with the distribution of power plants and the related coal consumption. The effects from regional diversity of LED market share were finally included in the distribution of emissions from the power sector. The LED market share was allocated proportionally to the clusters according to the research of Zheng et al. (2016), which reported the proportion of its lighting electricity consumption with being . More detailed information can be found in Table 1.
Table 1Effective luminous efficacy (ELE) with and without the GLP.
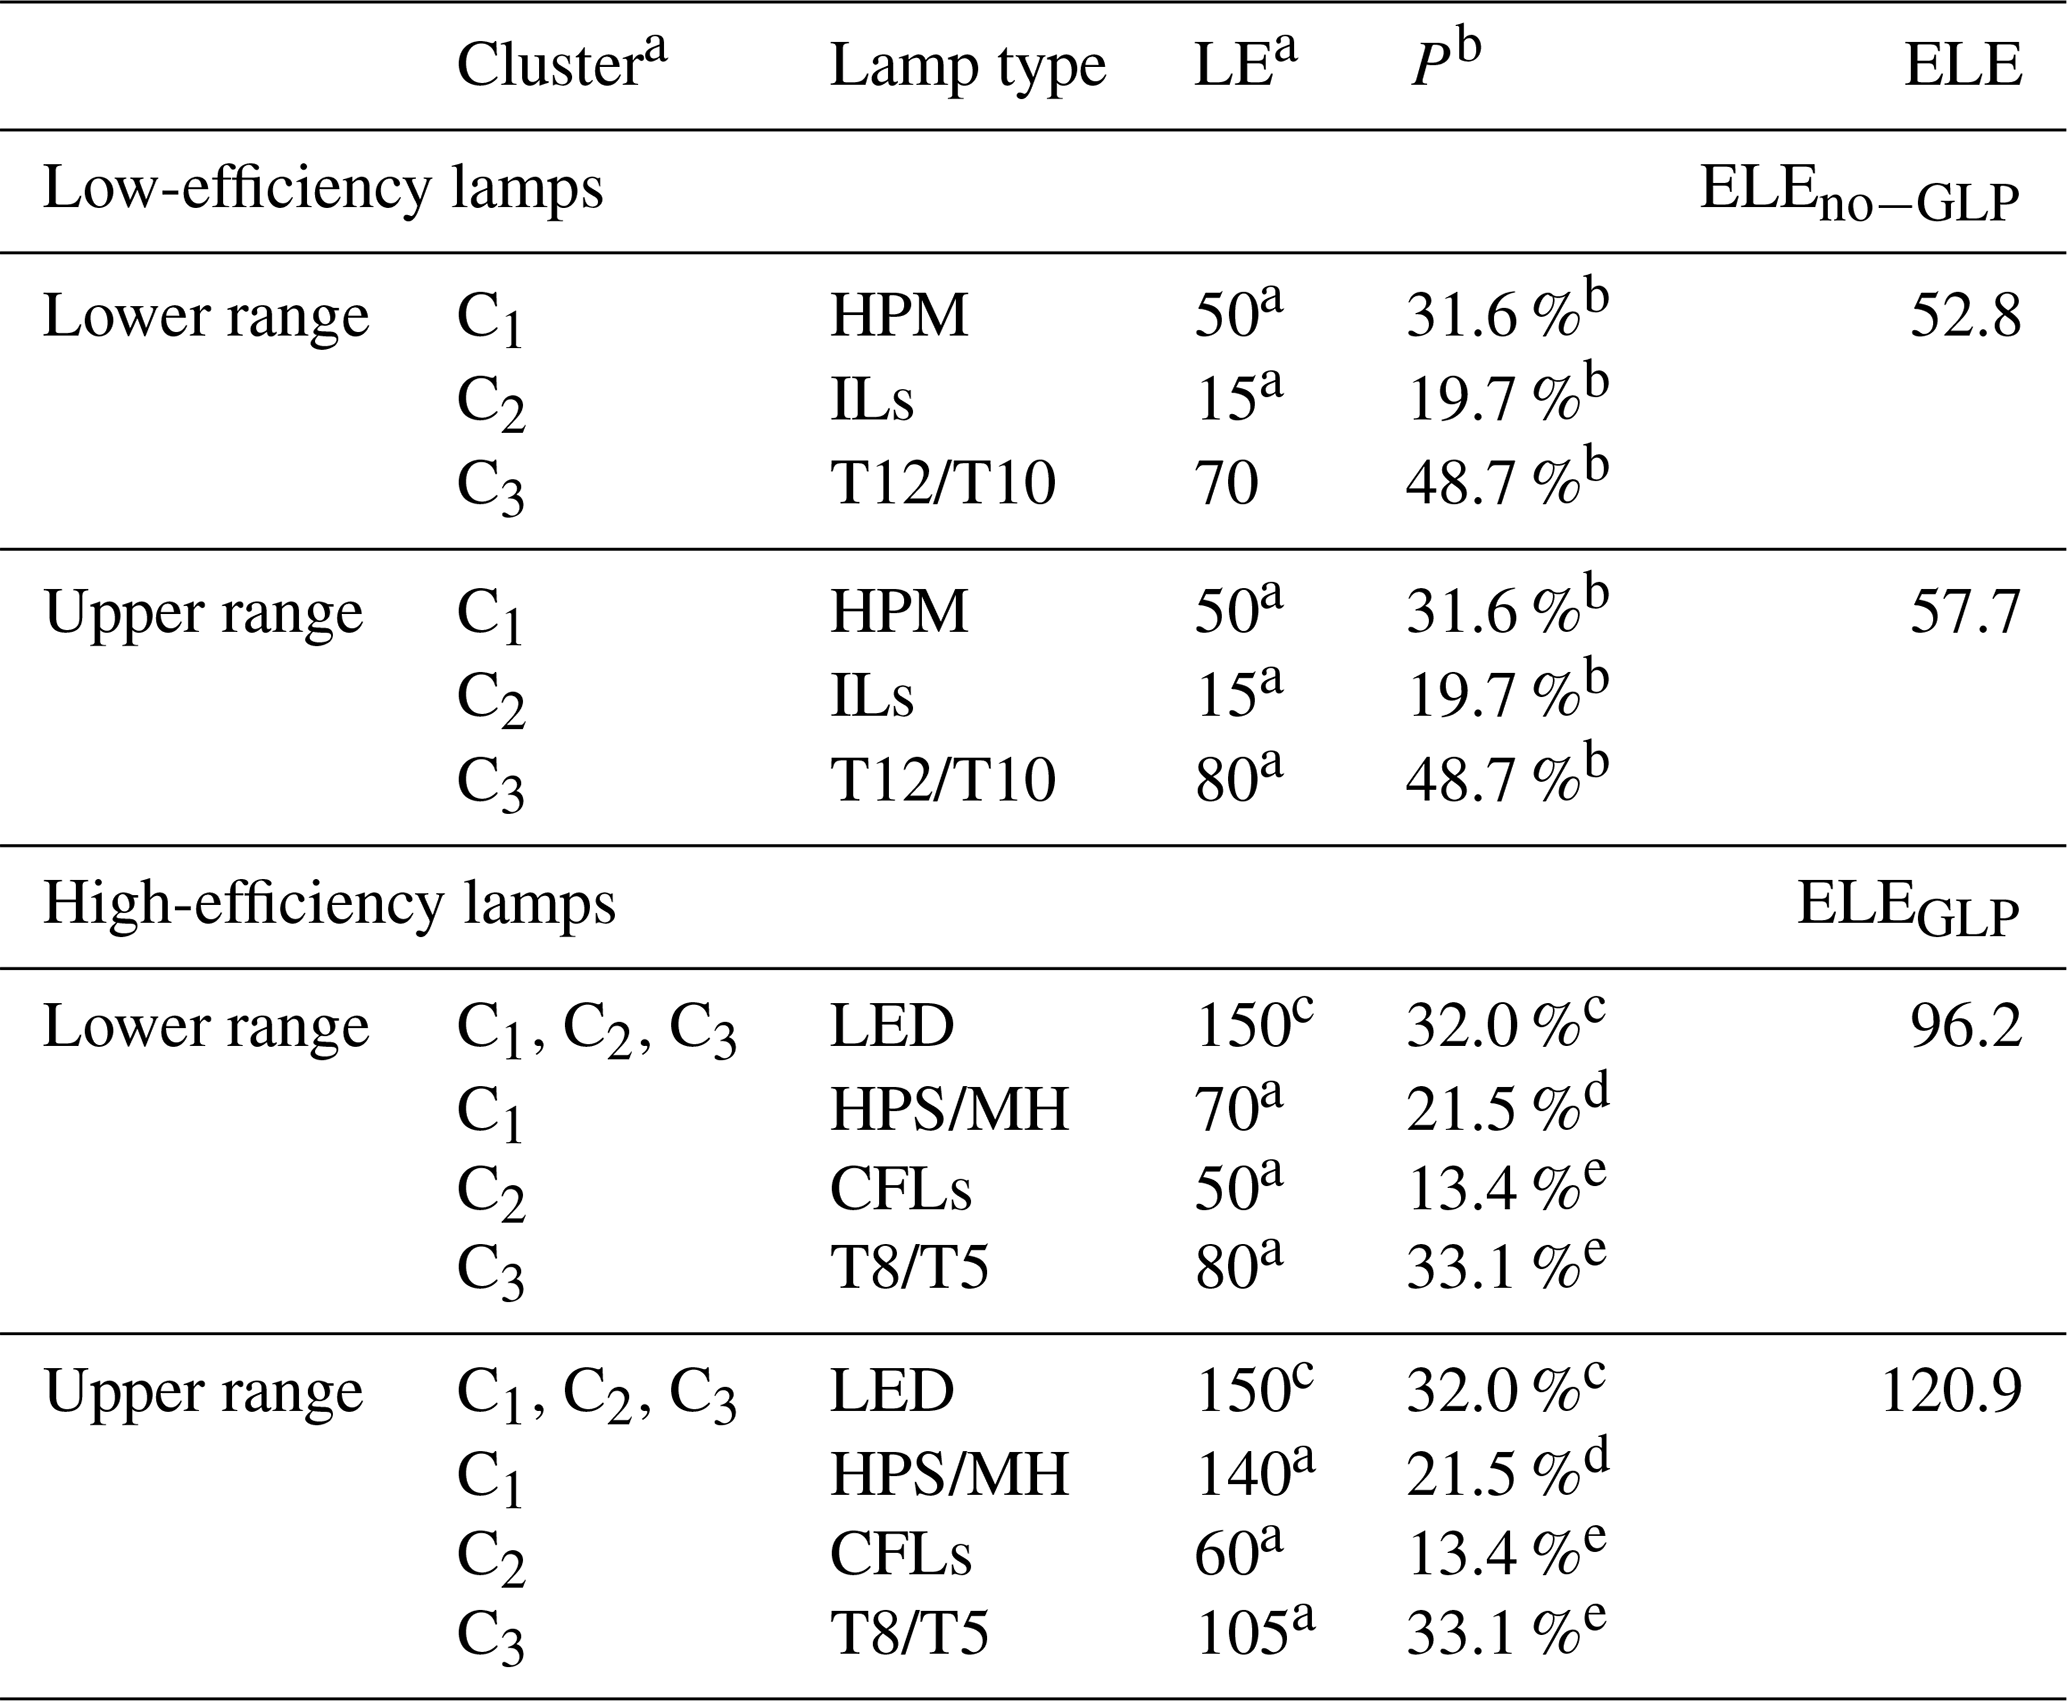
P: the proportion of lighting electricity consumed by specific cluster lamps to the total lighting electricity consumption. a The values were taken from Guo et al. (2017). b The values were taken from Zheng et al. (2016). c The values were evaluated based on Gao et al. (2016). d The values were estimated based on Zheng et al. (2016) and Ding et al. (2017). e The values were estimated based on the references of a, b, c, and d. LE and ELE: (lm W−1). LED: light-emitting diode. HPM lamps: high-pressure mercury-vapor lamps. HPS lamps: high-pressure sodium lamps; MH lamps: metal halide. ILs: incandescent lamps; CFLs: compact fluorescent lamps. T12/T10: T12/T10 fluorescent tubes; T5/T8: T5/T8 fluorescent tubes. C1: outdoor lighting, such as road lights. C2: residential applications, such as households. C3: commercial and industrial buildings.
The estimated ELE values have uncertainties for both low- and high-efficiency lamps, ranging from 52.8 to 57.7 lm W−1 and from 96.2 to 120.9 lm W−1 for the ELE with or without the GLP, respectively (see Table 1). In addition, the estimate of lighting electricity accounts for 10 %–14 % of the total electricity (Zheng et al., 2016; Lv and Lv, 2012). As a result, the model sensitivity studies included a low limit and high limit of electricity power savings. To account for all of the uncertain ranges, in the lower limit model simulation, the thermal power was estimated to increase by 6.7 % without the GLP. In the higher-limit model simulation, the thermal power was estimated to increase by 18.0 % without the GLP. Figure 4 shows that under lower- and higher-limit assumptions, the potential coal savings induced by the GLP were 120–323 million tons, respectively. According to these estimates into the reference emission inventory (E0, spec), the emissions of pollutants with the three cases (reference, low limit, and high limit) were estimated and shown in Table 2. The reference emission inventory is developed by Tsinghua University (Zhang et al., 2009), including current emission levels of thermal power plants (with considering GLP).
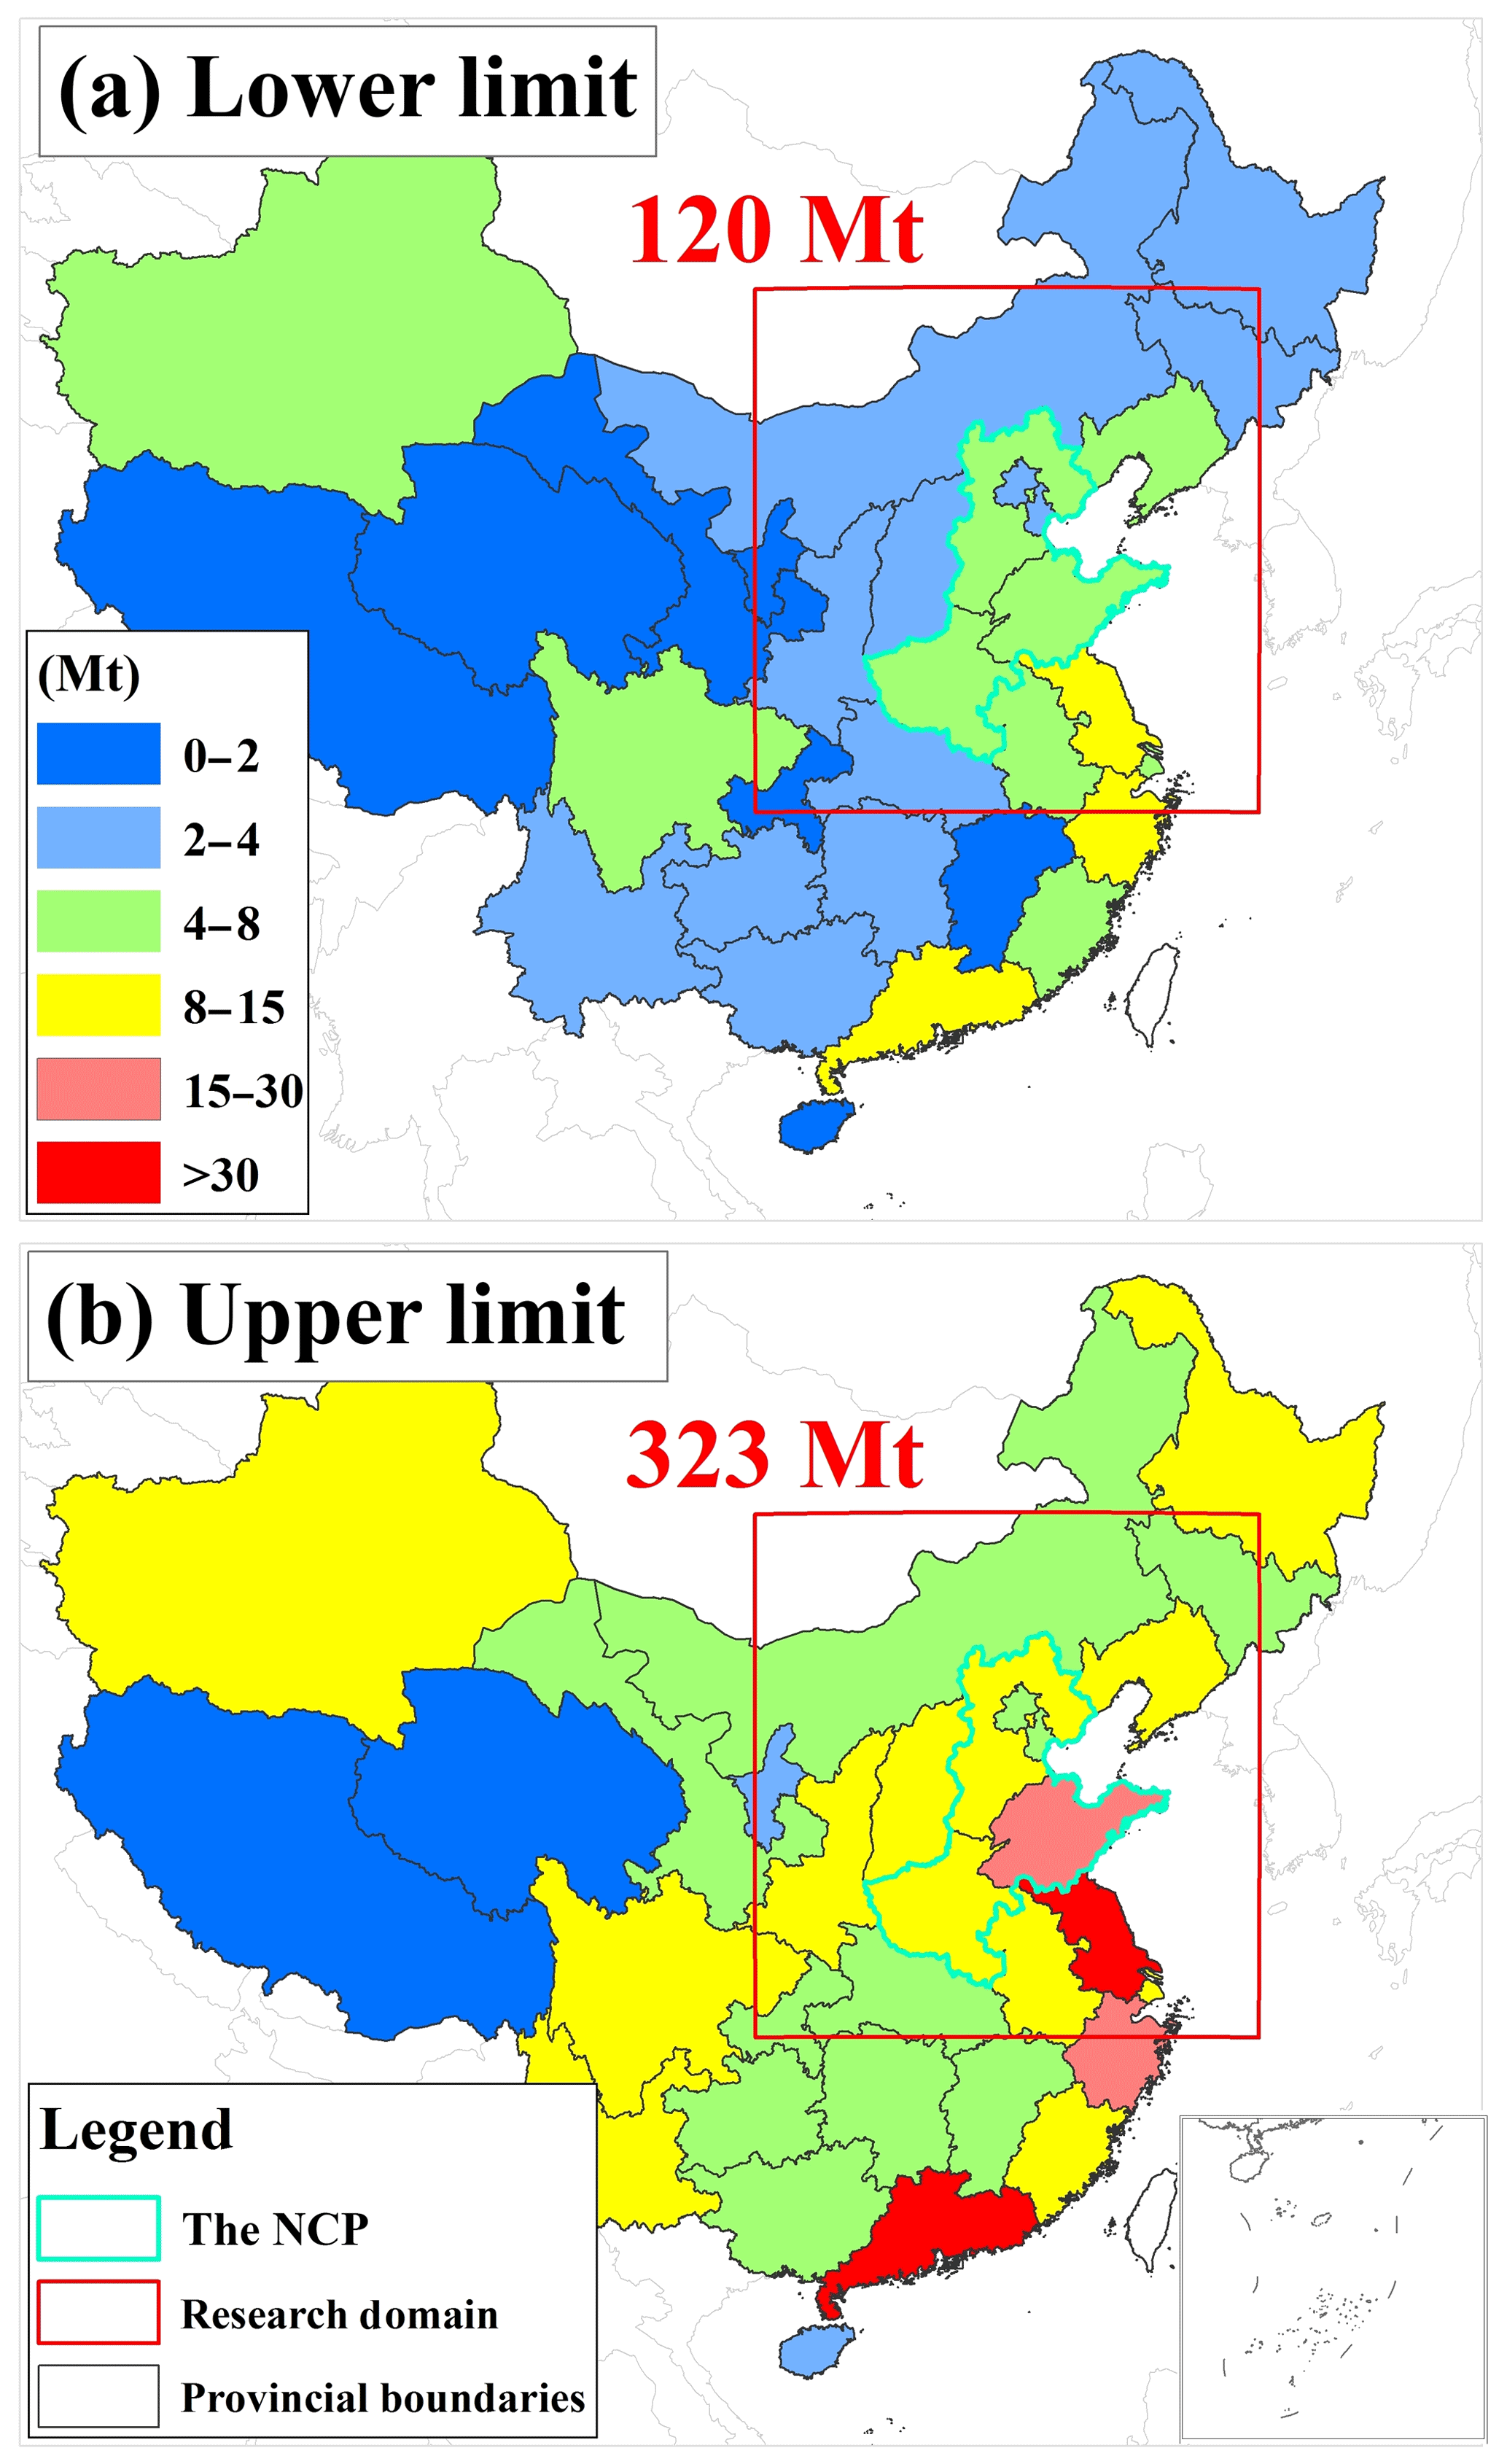
Figure 4The (a) lower and (b) upper limits of potential coal savings induced by the GLP.
Table 2 shows the emissions from power generation, including the NOx, SO2, PM2.5, and other species (represented with X), such as the BC, PM coarse, and VOC. The direct emission of PM2.5 was much smaller than the direct emission of SO2 and NOx in the gas phase. The PM2.5 concentrations included two different parts from thermal power plants. One was from the direct emission of PM2.5 in the particle phase and the other was the secondary particle (PM2.5), which was formed from the chemical transformation from SO2 and NOx. As a result, the large effect of the GLP on haze was due to the changes in the emissions of SO2 and NOx from the thermal power plants.
Table 2Coal consumptions and emissions for the reference case (REF), and the limit cases of low (SEN-GLP-low) and high (SEN-GLP-high).

3.1 Model evaluation
To better understand the effect of the GLP on the haze in the NCP, we first conducted an evaluation of the WRF-CHEM model performance. The modeled results were compared to the hourly near-surface concentrations of CO, SO2, NO2, and PM2.5. The data were measured by the Ministry of Ecology and Environmental of China and are accessible from the website at http://www.aqistudy.cn/ (last access: 27 August 2019). The locations of the measurement sites are shown in Fig. 3.
The model results were evaluated by calculating the following statistical parameters, including normalized mean bias (NMB), the index of agreement (IOA), and the correlation coefficient (r). These parameters were used to assess the performance of the REF case in simulations against measurements.
where Pi and Oi are the calculated and observed air pollutant concentrations, respectively. N is the total number of the predictions used for comparisons. and represent the average predictions and observations, respectively. The IOA ranges from 0 to 1, with 1 showing perfect agreement of the prediction with the observation. The r ranges from −1 to 1, with 1 implying perfect spatial consistency of observation and prediction.
Figure 5 shows the temporal variation of modeled results with the measured values during December 2015. The measured values of pollutants (PM2.5, NO2, SO2, and CO) averaged in the NCP were compared with the modeled results. The results indicate that there were strong episodes of the hourly PM2.5 mass concentrations, with the highest values exceeding 300 µg m−3, implying that several haze events occurred during the period. There are several peak values of PM2.5 concentrations occurring during the period, with a highest peak occurring between 22 and 24 December. Compared with CO temporal variability, the temporal variations between CO and PM2.5 were similar. The modeled PM2.5 and CO captured the strong temporal variation, with the IOA of 0.98 and the NMB of 1.3 % for PM2.5 mass concentrations and IOA of 0.89 and NMB of 4.3 % for CO mass concentrations. Since the CO variability was mainly determined by meteorological conditions, the similarity of the temporal variability suggested that the meteorological conditions had an important contribution to the several peak values of the episode, and the model simulation well captured the meteorological conditions during the study period.

Figure 5The temporal variations of predicted (red lines) and observed (black dots) profiles of near-surface mass concentrations of PM2.5, NO2, SO2, and CO averaged over all ambient monitoring sites in the NCP during December 2015.
Although there was a similarity of the temporal variability between PM2.5 and CO, the magnitude of the variability of CO was smaller than variability of PM2.5, suggesting that in addition to the meteorological conditions, the chemical formation also played important roles in producing the high peaks of PM2.5 concentrations. It is important to simulate the measured temporal variations of SO2 and NOx, because they are important chemical precursors (Seinfeld and Pandis, 1998; Laurent et al., 2014) and are the major pollutants emitted from the thermal power plants (Table 2). As shown in Fig. 5, both the measured and modeled SO2 and NOx had several episodes which corresponded to the episodes of the PM2.5. The parameters between the measured and modeled results were acceptable, with the IOA of 0.83 and the NMB of 1.3 % for SO2, and IOA of 0.93 and NMB of 6.1 % for NOx. It is interesting to note that the occurrences of the peak of SO2 and NOx are about 1–2 d ahead of the peak of PM2.5. One of the explanations was that there was chemical conversion from the gas phase of SO2 and NOx to the particle phase of PM2.5, resulting in the time lag between the peaks of SO2–NOx and PM2.5, because SO2 and NOx were the precursors of PM2.5 (Seinfeld and Pandis, 1998; Laurent et al., 2014). As we state in the previous sections, the large effect of the GLP on haze was due to the changes in the emissions of SO2 and NOx from the thermal power plants. The good statistical performance of the modeled SO2 and NOx provided confidence in using the model to study the GLP effects on haze in the NCP region.
In order to do more thoughtful validation of the model performance, Fig. 6 shows the measured and modeled spatial distributions of PM2.5, SO2, and NOx in the NCP. The model generally reproduced the spatial variations of PM2.5, NO2, and SO2, capturing the spatial characters. For example, the SO2 was largely emitted from thermal power plants and steel industrials, which were large point sources. As a result, both the modeled and measured SO2 appeared as scattered distributions (see Fig. 6d). The correlation coefficients (r) between the measured and modeled results were 0.86, 0.68, and 0.70 for PM2.5, NO2, and SO2, respectively.
In general, the NCP encountered severe haze events during December 2015. The statistical analysis showed that the WRF-CHEM model reasonably captured the spatial and temporal variations of haze in the NCP, although some model biases existed. The model validation provided confidence for further model studies.
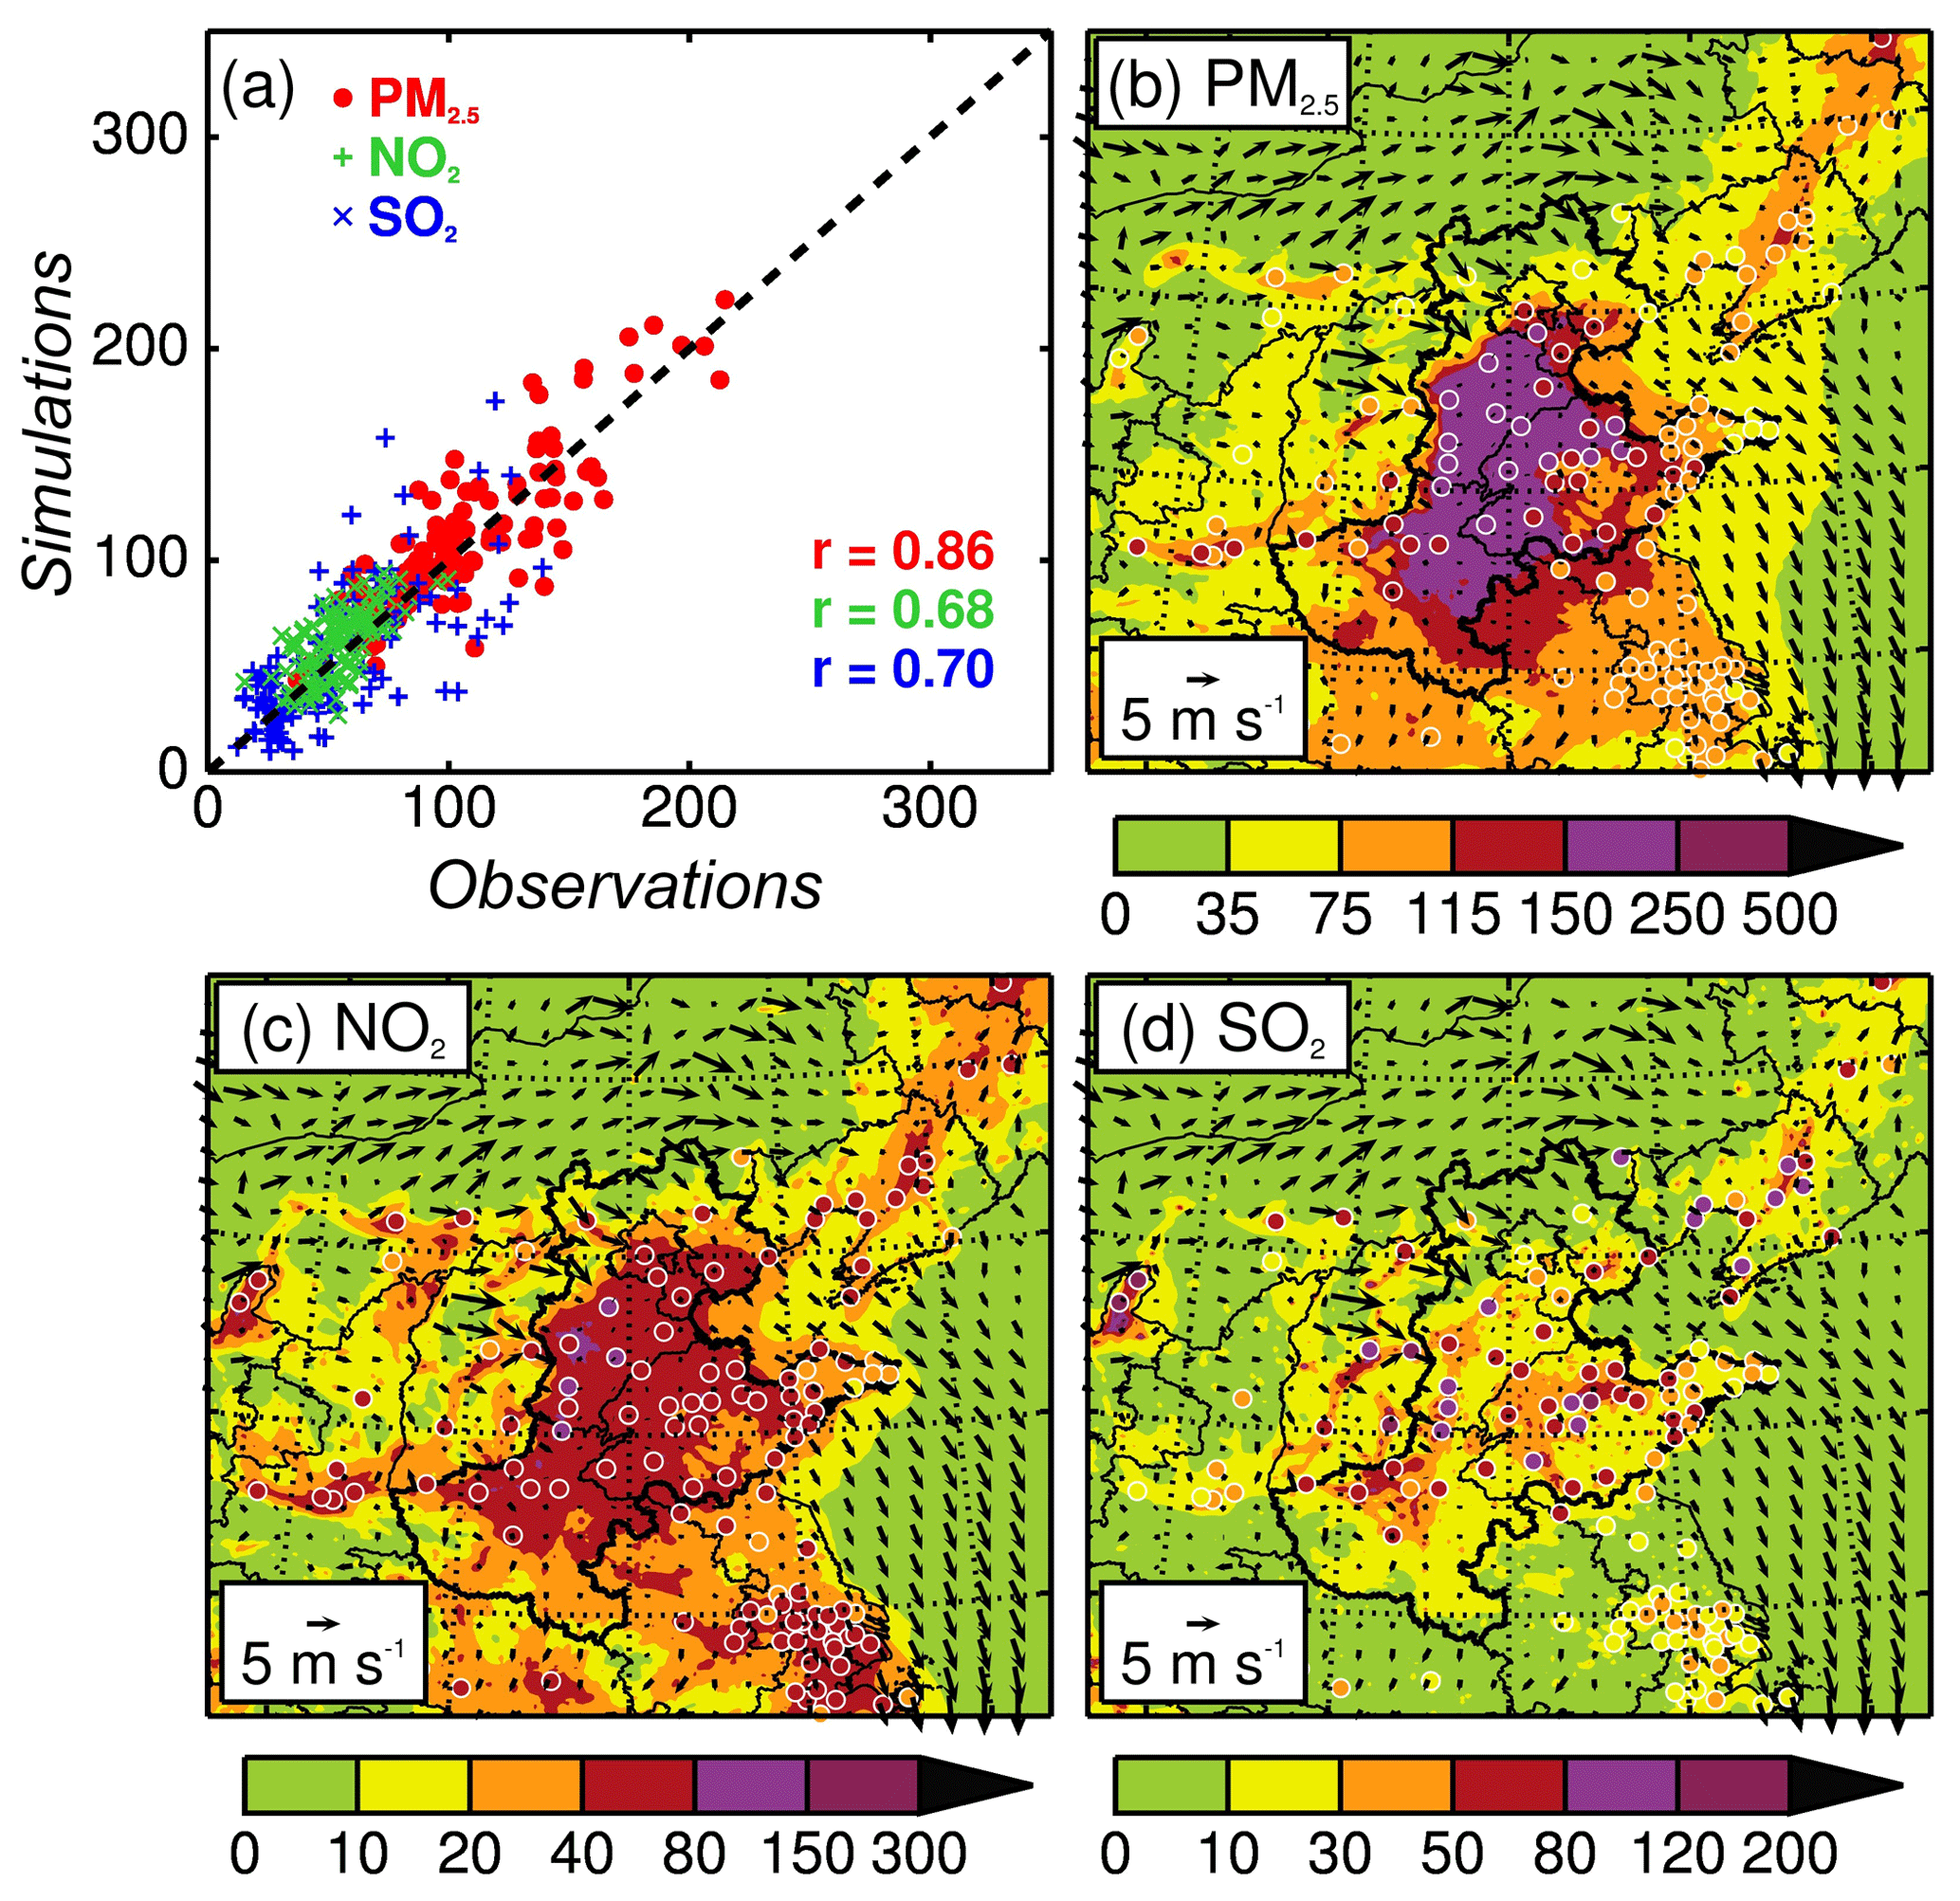
Figure 6The spatial comparisons of predicted and observed episode-averaged mass concentrations of PM2.5, NO2, and SO2. (a) Statistical comparison of predicted and observed mass concentrations, with the correlation coefficient (r). Horizontal distributions of predictions (color contour) and observations (colored circles) of (b) PM2.5, (c) NO2, and (d) SO2, along with the simulated wind fields (black arrows).
3.2 Potential benefit of the GLP to haze in the NCP
There are massive emissions of NOx and SO2 from thermal power plants in the research domain, producing 299.1 and 103.7 Gg (Table 2) during December 2015, for NOx and SO2, respectively. There is more emission amount of NOx than SO2, because the SO2 emissions from power had significantly declined since 2005, whereas the NOx emissions had slightly declined (see Fig. 2) due to lower effective NOx emission control facilities (Liu et al., 2015; Huang et al., 2016).
According to the estimate of 6.7 %–18.0 % of potential coal saving induced by the GLP (Sect. 2.5), the potential emission reductions from power generation were calculated based on Eq. (6), and the emission reductions of NOx and SO2 induced by the GLP were estimated for the WRF-CHEM model sensitivity studies. Fig. 7 shows the spatial distributions of changes in NOx and SO2 emissions in the research domain, especially the provinces of Hebei, Henan, and Shandong within the NCP, where most of the power plants are concentrated (Liu et al., 2015). The results show that under a low-limit estimate, without the GLP, the NOx and SO2 emissions would be increased by 20.0 and 6.9 Gg, respectively, in December 2015. Under a high-limit estimate, without the GLP, the NOx and SO2 emissions would be increased by 53.8 and 18.7 Gg in the NCP. These large emission changes without the GLP could cause important effects on the aerosol pollution. In the following sections, the GLP effect on the reduction of aerosol pollution was investigated by using the WRF-CHEM model.

Figure 7The potential emission reductions for low- (left panels) and high-limit (right panels) cases induced by the GLP, including the mass rates change in (a) NOx and (b) SO2. The total emission reductions are also shown in the rectangle.
According to the lower and upper limits of emission reductions induced by the GLP, we evaluated their resultant effects on air pollutants (PM2.5, NO2, and SO2), which are estimated by the difference of the SEN-GLP cases and the REF case (Fig. 8). The result shows that the GLP has important effects on PM2.5 concentrations (see Fig. 8a and b), implying the remarkable benefit to haze in the NCP. In the case of lower-limit emission reduction, the PM2.5 concentrations could be decreased by 2–5 µg m−3 in large areas within the NCP, such as southeastern Hebei, northeastern Henan, and western Shandong (Fig. 8a). In the case of upper-limit emission reduction, there is much more remarkable decrease in PM2.5 concentrations (4–10 µg m−3) in wider areas within the NCP (Fig. 8b). We can also find large-scale reductions of NO2 and SO2 in the NCP (Fig. 8c–f). For example, in the high-limit case, the reduction of NO2 ranges from 1 to 8 µg m−3 and the reduction of SO2 ranges from 1 to 4 µg m−3. We also display the species variations (PM2.5, NO2, and SO2) within the areas (see the red square in Fig. 8) with high PM2.5 changes induced by the GLP (Fig. S2).
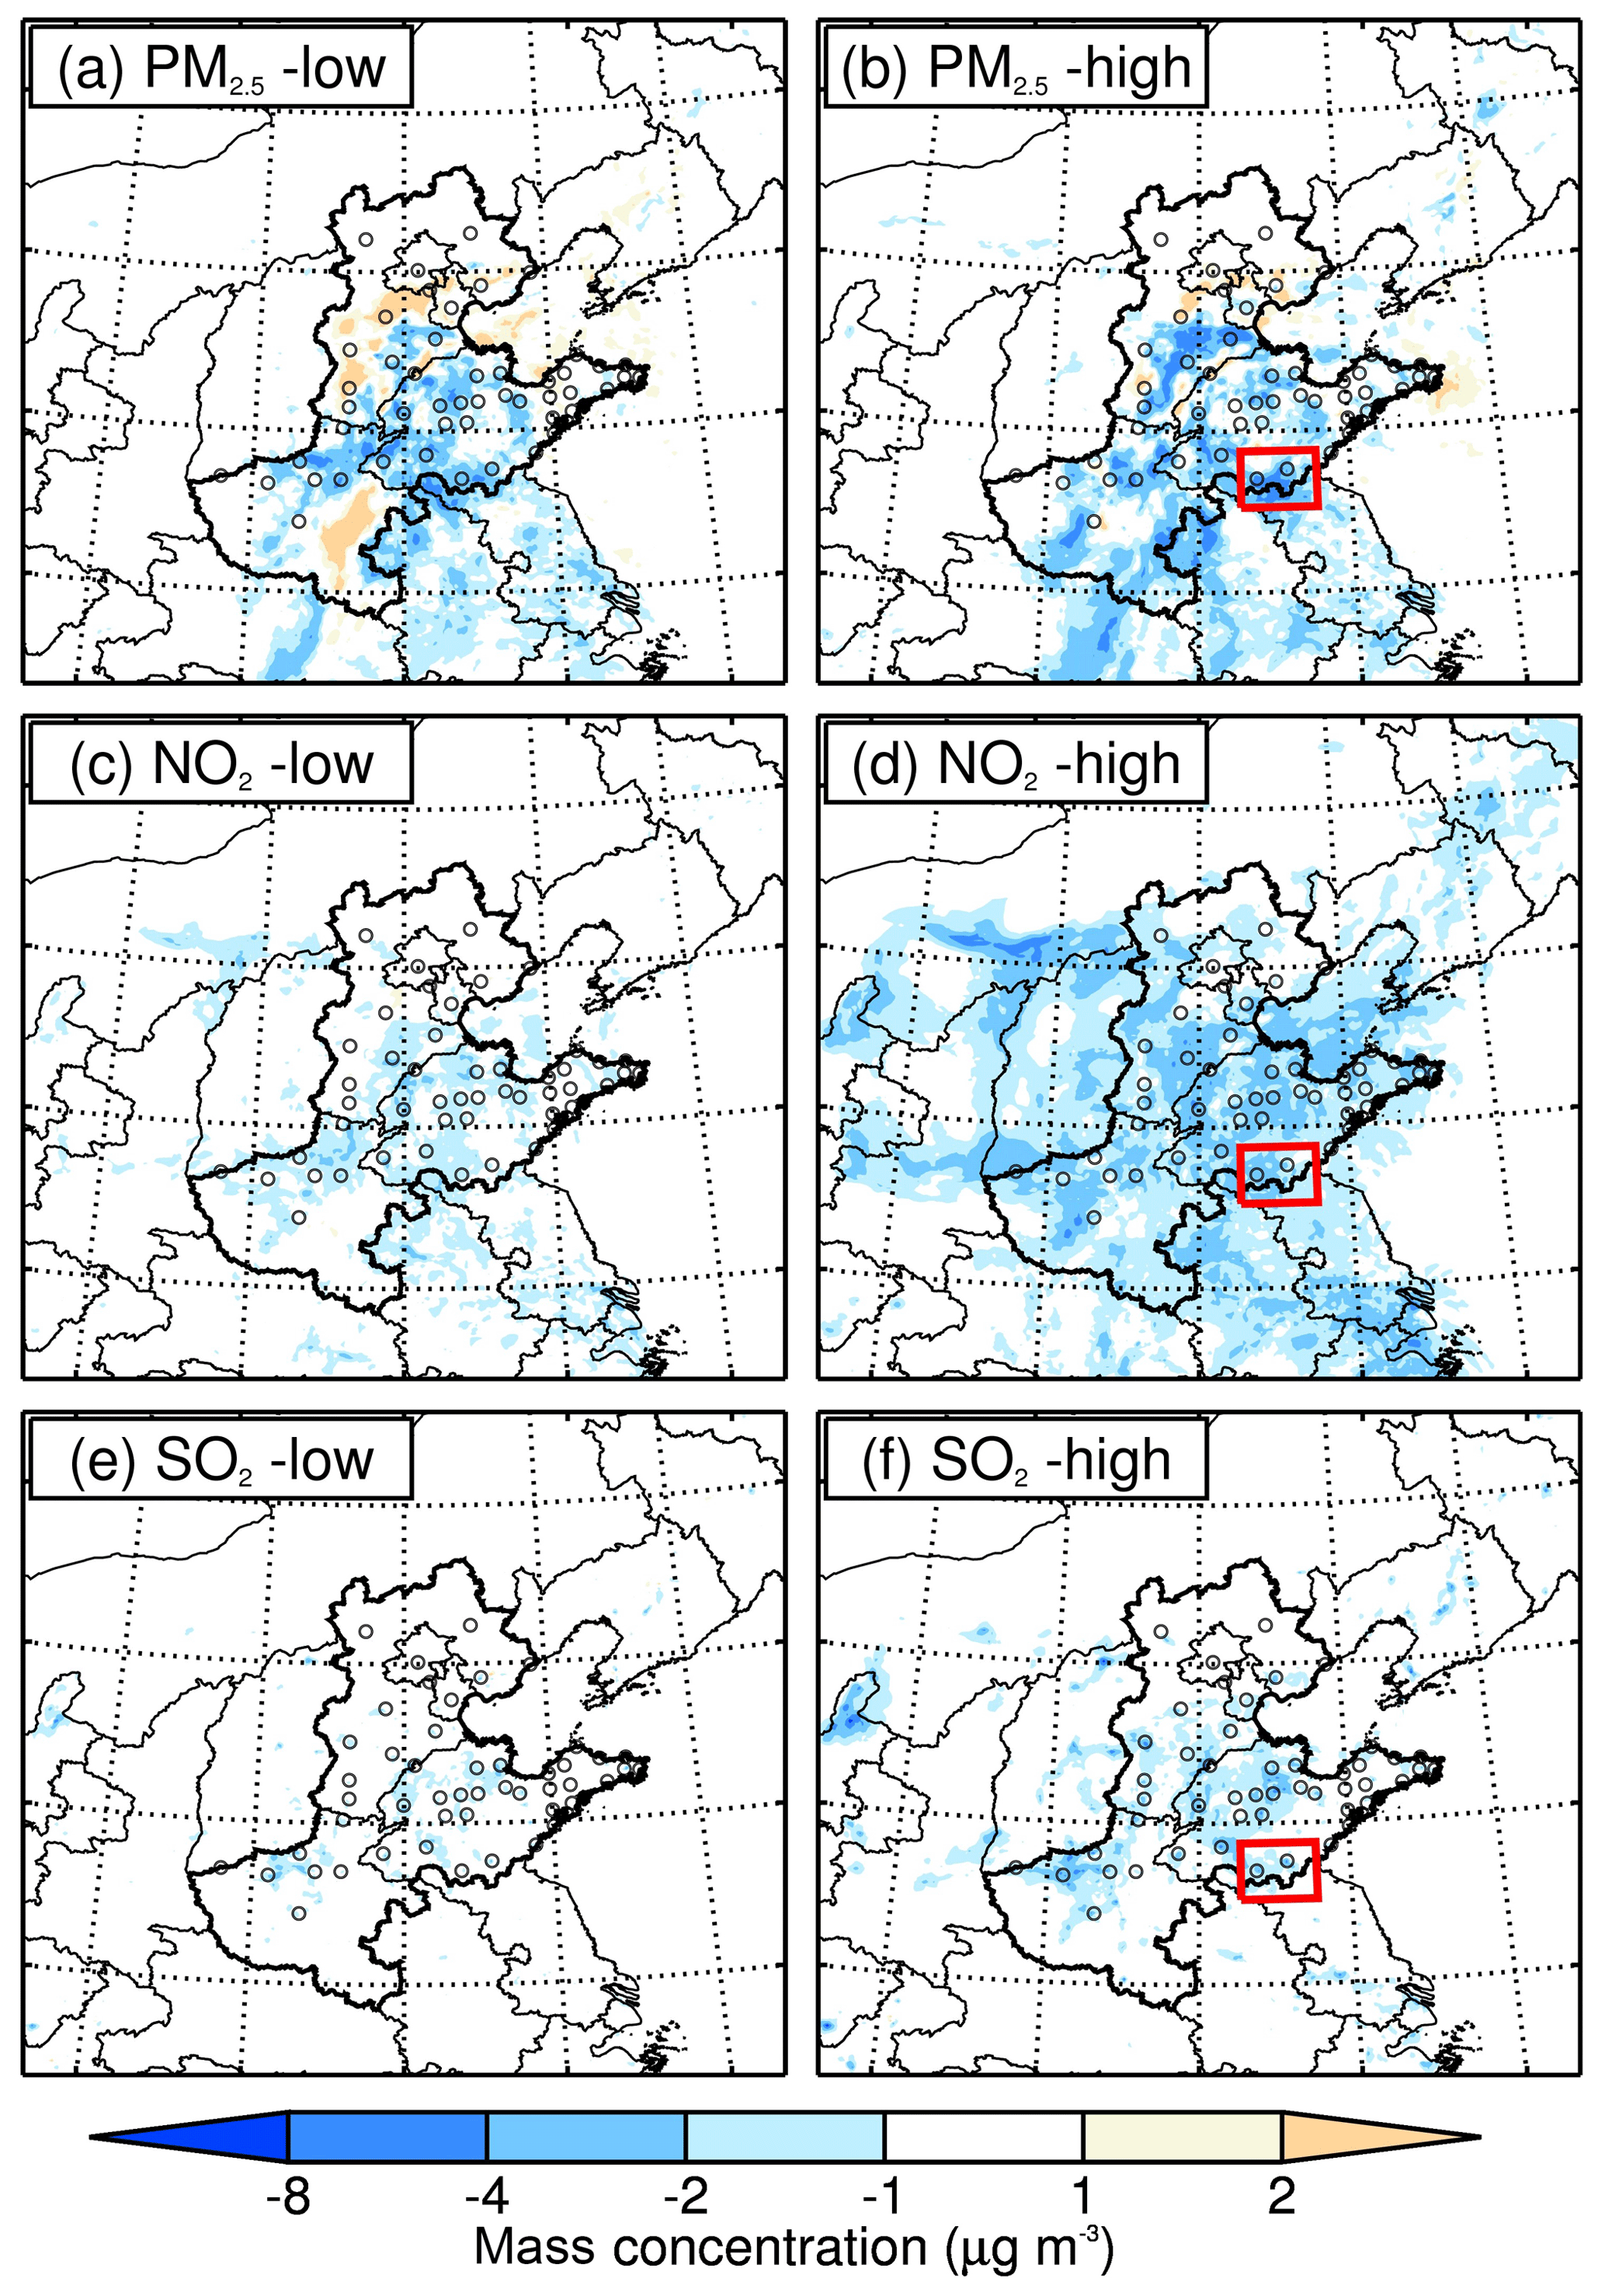
Figure 8The lower (left panels) and upper (right panels) episode-averaged variations induced by the GLP, including the mass concentrations (µg m−3) of (a) PM2.5, (b) NO2, and (c) SO2. The results refer to the spatial variations between the REF case and the SEN-GLP case (REF-SNE-GLPs).
Although the influence of the GLP is to decrease PM2.5 concentrations, there were some slight increases in PM2.5 concentrations in the north of the NCP. As indicated in Table 2, the direct emission of PM2.5 was less than the gas-phase emissions of NOx and SO2, which suggested that the decrease in PM2.5 by applying the GLP was mainly due to the chemical conversions from gas-phase NOx and SO2 to nitrate and sulfate particles (Seinfeld et al., 1998; Laurent et al., 2014). The slight increase in the PM2.5 concentrations may be induced by the changes in O3 concentrations, because the chemical conversion from NOx and SO2 to nitrate and sulfate requires the atmospheric oxidants like O3. As shown in Fig. S3, there is a slight increase in O3 (1–2 µg m−3) due to the GLP and a slight increase in the oxidation of SO2, which may cause some enhancement of sulfate concentrations (Wang et al., 2015a; Xue et al., 2016). Apparently, the NO2 reductions are more remarkable because of the more noteworthy NOx emission reductions induced by the GLP.
The GLP resulted in significant reduction of potential pollutant emissions from the thermal power generation, corresponding to potential benefit in alleviating haze in the NCP, although with few fluctuated deteriorations. It also benefits the pollution of NOx and SO2 in the NCP.
To replace low-efficiency lighting lamps with high-efficiency ones, the Green Lights Program (GLP) is a national energy conservation activity for saving lighting electricity consumption in China, resulting in an effective reduction of coal consumption for power generation. However, despite the great success of the GLP in lighting electricity, the effects of the GLP on haze are not investigated and well understood. In the present study, we try to assess the potential coal saving induced by the GLP and to estimate its resultant benefit to the haze in the NCP, China, which often suffers from severe haze. First, we used the satellite dataset of nighttime lights to evaluate the associated saving of lighting electricity consumption and its resultant coal saving in the NCP. Second, we estimated the emission reductions from thermal power generation induced by the GLP, based on the emission inventory developed by Tsinghua University (Zhang et al., 2009). Finally, we applied the WRF-CHEM model to evaluate the potential effects of the GLP on the haze in the NCP. The model results had been evaluated by a comparison with surface measurements. And two sensitivity experiments were conducted to explore the role of the GLP in benefiting the haze. Some important results are summarized as follows.
-
Due to the rapid increase in the economy, the demand for electricity is largely enhanced in China. As a result, thermal power electricity increased from 2000 (about 1012 kWh) to 2015 (about 4×10¹² kWh), suggesting that the lighting electricity consumption could produce higher emissions of air pollutants in the densely populated and industrial developed regions of China.
-
The GLP significantly improves in lighting efficiency by 66.8 %–128.8 %, implying 6.7 %–18.0 % of potential savings for electricity consumption as well as potential coal savings in thermal power generation.
-
The estimated potential coal saving induced by the GLP can reach a massive value of 120–323 million tons, accounting for 6.7 %–18.0 % of the total coal consumption for thermal power generation in China. As a result, there is a massive potential emission reduction of air pollutants from thermal power generation, involving 20.0–53.8 Gg for NOx and 6.9–18.7 Gg for SO2 in the NCP of China. The reductions of these emissions play important roles in reducing the haze formation in the NCP, because NOx and SO2 are important precursors for the particles.
-
The reduction of NOx and SO2 from power plants produces a remarkable benefit to haze in the NCP. The sensitivity studies by using the WRF-CHEM model show that the GLP has important effects on PM2.5 concentrations in the NCP. In the lower-limit case, the PM2.5 concentrations could be decreased by 2–5 µg m−3 in large areas within the NCP. In the upper-limit case, there is much more remarkable decrease in PM2.5 concentrations (4–10 µg m−3) in wider areas within the NCP.
This study is a good example to illustrate that scientific innovation can induce important benefits for environmental issues such as haze.
The real-time O3 and PM2.5 observations are provided by the China National Environmental Monitoring Centre and are accessible to the public on the website at http://106.37.208.233:20035/ (last access: 7 August 2019). One can also access the historic profile of observed ambient pollutants by visiting http://www.aqistudy.cn/ (last access: 7 August 2019). The DMSP/OLS NTL time series data are collected by the US Air Force Weather Agency and are accessible to the public on the website at https://ngdc.noaa.gov/eog/dmsp/downloadV4composites.html (last access: 27 August 2019). The VIIRS NTL dataset is provided by the Earth Observation Group, NOAA National Centers for Environmental Information (NCEI), and is accessible to the public on the website at https://ngdc.noaa.gov/eog/viirs/download_dnb_composites.html (last access: 27 August 2019).
The supplement related to this article is available online at: https://doi.org/10.5194/acp-19-11185-2019-supplement.
XT and XL designed the study. XKL provided measurement data. JMZ, WTD, FT, and GHL analyzed the data. XL and XT wrote the manuscript. JC and ZA overviewed the paper. All the authors commented on the manuscript.
The authors declare that they have no conflict of interest.
This article is part of the special issue “Regional transport and transformation of air pollution in eastern China”. It is not associated with a conference.
This research has been supported by the National Natural Science Foundation of China (grant nos. 41430424, 41730108, and 41907191) and the Ministry of Science and Technology of China (grant no. 2016YFC0203400).
This paper was edited by Renyi Zhang and reviewed by two anonymous referees.
Asolkar, K. and Ardhapurkar, S. S.: Energy Efficient Intelligent Household LED Lighting System Based On Daylight Illumination, Int. J. Eng. Tech., 9, 4258–4264, 2017.
Binkowski, F. S. and Roselle, S. J.: Models-3 Community Multiscale Air Quality (CMAQ) model aerosol component 1. Model description, J. Geophys. Res., 108, 1–18, https://doi.org/10.1029/2001JD001409, 2003.
Chen, F. and Dudhia, J.: Coupling an advanced land surface–hydrology model with the Penn State–NCAR MM5 modeling system. Part II: Preliminary model validation, Mon. Weather Rev., 129, 587–604, 2001.
Chen, X. and Nordhaus, W. D.: Using luminosity data as a proxy for economic statistics, P. Natl. Acad. Sci. USA, 108, 8589–8594, 2011.
Chou, M. D. and Suarez, M. J.: A solar radiation parameterization for atmospheric studies, NASA TM-104606, Nasa Tech. memo, 15, 1999.
Chou, M. D., Suarez, M. J., Liang, X. Z., Yan, M. H., and Cote, C.: A Thermal Infrared Radiation Parameterization for Atmospheric Studies, Tech. Rep. NASA/TM-2001-104606, 19, 55, 2001.
Coscieme, L., Pulselli, F. M., Bastianoni, S., Elvidge, C. D., Anderson, S., and Sutton, P. C.: A Thermodynamic Geography: Night-Time Satellite Imagery as a Proxy Measure of Emergy, Ambio, 43, 969–979, 2014.
Edirisinghe, K., Abeyweera, R., and Senanayake, N. S.: Evaluation of Effectiveness of LED Lighting in Buildings, SLEMA J., 19, 2, 2016.
Elvidge, C. D., Baugh, K. E., Kihn, E. A., Kroehl, H. W., Davis, E. R., and Davis, C. W.: Relation between satellite observed visible-near infrared emissions, population, economic activity and electric power consumption, Int. J. Remote Sens., 18, 1373–1379, 1997.
Elvidge, C. D., Sutton, P. C., Ghosh, T., Tuttle, B. T., Baugh, K. E., Bhaduri, B., and Bright, E.: A global poverty map derived from satellite data, Comput. Geosci., 35, 1652–1660, 2009.
Elvidge, C. D., Baugh, K. E., Zhizhin, M., and Hsu, F. C.: Why VIIRS data are superior to DMSP for mapping nighttime lights, P. Asia-Pac. Adv. Netw., 35, 62–69, 2013.
Elvidge, C. D., Hsu, K. E., Baugh, K., and Ghosh, T.: National Trends in Satellite Observed Lighting: 1992–2012, Global Urban Monitoring and Assessment Through Earth Observation, Chapter 6, 97–130, Boca Raton, FL, USA, https://doi.org/10.1201/b17012, 2014.
Gao, F. and Zheng, B.: Review of Development and Implementation of the Green Lighting Project in China, China Illum. Eng. J., 27, 1–7, 2016 (in Chinese).
Gao, J., Zhu, B., Xiao, H., Kang, H., Pan, C., Wang, D., and Wang, H.: Effects of black carbon and boundary layer interaction on surface ozone in Nanjing, China, Atmos. Chem. Phys., 18, 7081–7094, https://doi.org/10.5194/acp-18-7081-2018, 2018.
Ge, A., Shu, H., Chen, D., Cai, J., Chen, J., and Zhu, L.: Optical design of a road lighting luminaire using a chip-on-board LED array, Lighting Res. Technol., 49, 651–657, https://doi.org/10.1177/1477153515627480, 2016.
Grell, G. A., Peckham, S. E., Schmitz, R., McKeen, S. A., Frost, G., Skamarock, W. C., and Eder, B.: Fully coupled “online” chemistry within the WRF model, Atmos. Environ., 39, 6957–6975, 2005.
Guenther, A., Karl, T., Harley, P., Wiedinmyer, C., Palmer, P. I., and Geron, C.: Estimates of global terrestrial isoprene emissions using MEGAN (Model of Emissions of Gases and Aerosols from Nature), Atmos. Chem. Phys., 6, 3181–3210, https://doi.org/10.5194/acp-6-3181-2006, 2006.
Guo, F. and Pachauri, S.: China's Green Lights Program: A review and assessment, Energ. Policy, 110, 31–39, 2017.
He, C., Ma, Q., Liu, Z., and Zhang, Q.: Modeling the spatiotemporal dynamics of electric power consumption in Mainland China using saturation-corrected DMSP/OLS nighttime stable light data, Int. J. Digit. Earth, 7, 993–1014, https://doi.org/10.1080/17538947.2013.822026, 2013.
Hong, S.-Y. and Lim, J.-O. J.: The WRF Single-Moment 6-Class Microphysics Scheme (WSM6), Asia-Pac. J. Atmos. Sci., 42, 129–151, 2006.
Horowitz, L. W., Walters, S., Mauzerall, D. L., Emmons, L. K., Rasch, P. J., Granier, C., Tie, X., Lamarque, J. F., Schultz, M. G., and Tyndall, G. S.: A global simulation of tropospheric ozone and related tracers: Description and evaluation of MOZART, version 2, J. Geophys. Res.-Atmos., 108, 1–29, https://doi.org/10.1029/2002JD002853, 2003.
Hu, J., Huang, L., Chen, M., He, G., and Zhang, H.: Impacts of power generation on air quality in China – Part II: Future scenarios, Resour. Conserv. Recy., 121, 115–127, 2016.
Huang, L., Hu, J., Chen, M., and Zhang, H.: Impacts of power generation on air quality in China – part I: An overview, Resour. Conserv. Recy., 121, 103–104, https://doi.org/10.1016/j.resconrec.2016.04.010, 2016.
Huang, Q., Yang, X., Gao, B., Yang, Y., and Zhao, Y.: Application of DMSP/OLS Nighttime Light Images: A Meta-Analysis and a Systematic Literature Review, Remote Sens., 6, 6844–6866, 2014.
Janjić, Z. I.: Nonsingular implementation of the Mellor–Yamada level 2.5 scheme in the NCEP Meso model, NCEP office note, 437, 61, 2002.
Kalnay, E., Kanamitsu, M., Kistler, R., Collins, W., Deaven, D., Gandin, L., Iredell, M., Saha, S., White, G., and Woollen, J.: The NCEP/NCAR 40-Year Reanalysis Project, B. Am. Meteorol. Soc., 77, 437–472, 1996.
Laurent, O., Hu, J., Li, L., Cockburn, M., Escobedo, L., Kleeman, M. J., and Wu, J.: Sources and contents of air pollution affecting term low birth weight in Los Angeles County, California, 2001–2008, Environ. Res., 134, 488–495, 2014.
Li, G., Zhang, R., Fan, J., and Tie, X.: Impacts of black carbon aerosol on photolysis and ozone, J. Geophys. Res., 110, D23206, https://doi.org/10.1029/2005JD005898, 2005.
Li, G., Lei, W., Zavala, M., Volkamer, R., Dusanter, S., Stevens, P., and Molina, L. T.: Impacts of HONO sources on the photochemistry in Mexico City during the MCMA-2006/MILAGO Campaign, Atmos. Chem. Phys., 10, 6551–6567, https://doi.org/10.5194/acp-10-6551-2010, 2010.
Li, G., Bei, N., Tie, X., and Molina, L. T.: Aerosol effects on the photochemistry in Mexico City during MCMA-2006/MILAGRO campaign, Atmos. Chem. Phys., 11, 5169–5182, https://doi.org/10.5194/acp-11-5169-2011, 2011a.
Li, G., Zavala, M., Lei, W., Tsimpidi, A. P., Karydis, V. A., Pandis, S. N., Canagaratna, M. R., and Molina, L. T.: Simulations of organic aerosol concentrations in Mexico City using the WRF-CHEM model during the MCMA-2006/MILAGRO campaign, Atmos. Chem. Phys., 11, 3789–3809, https://doi.org/10.5194/acp-11-3789-2011, 2011b.
Li, G., Lei, W., Bei, N., and Molina, L. T.: Contribution of garbage burning to chloride and PM2.5 in Mexico City, Atmos. Chem. Phys., 12, 8751–8761, https://doi.org/10.5194/acp-12-8751-2012, 2012.
Li, Z., Guo, J., Ding, A., Liao, H., Liu, J., Sun, Y., Wang, T., Xue, H., Zhang, H., and Zhu, B.: Aerosol and boundary-layer interactions and impact on air quality, Natl. Sci. Rev., 4, 810–833, https://doi.org/10.1093/nsr/nwx117, 2017.
Lin, J.: China green lights program: A review and recommendations, Lawrence Berkeley National Laboratory, Berkeley, CA, USA, 1999.
Liu, F., Zhang, Q., Tong, D., Zheng, B., Li, M., Huo, H., and He, K. B.: High-resolution inventory of technologies, activities, and emissions of coal-fired power plants in China from 1990 to 2010, Atmos. Chem. Phys., 15, 13299–13317, https://doi.org/10.5194/acp-15-13299-2015, 2015.
Liu, H.: China's Green Lights Program: review of the past ten years and prospect, Energ. China, 28, 17–20, 2006.
Liu, H.: The concept and practice of green lights, China Electric Power Press, Beijing, China, 2009 (in Chinese).
Liu, H.: China's Green Lights Program in the past 20 years, J. China Illum. Eng., 23, 12–17, 2012.
Liu, H. and Zhao, J. P.: The Implementation Manual of China Green Lights, China Environ. Sci. Press, Beijing, 2011.
Lv, F. and Lv, W. B.: The Progress and Prospect of Green Lights Program in China, China Illum. Eng. J., 23, 1–6, 2012.
NBS (National Bureau of Statistics): China Statistical Yearbook 2000–2016, China Statistics Press, Beijing, available at: http://www.stats.gov.cn/tjsj/ndsj/ (last access: 27 August 2019), 2000–2016.
NDRC (National Development and Reform Commission of China): China Green Lights Development Report (2004), China Elect. Pow. Press, Beijing, 2005.
Nenes, A., Pandis, S. N., and Pilinis, C.: ISORROPIA: A new thermodynamic equilibrium model for multiphase multicomponent inorganic aerosols, Aquat. Geochem., 4, 123–152, 1998.
Pan, Y.: Actual Effect Tracking and Analysis of a LED Road Lighting Upgrading Project, China Light & Lighting, 2, 25–28, https://doi.org/10.3969/j.issn.1002-6150.2018.02.006, 2018 (in Chinese).
Román, M. O. and Stokes, E. C.: Holidays in lights: Tracking cultural patterns in demand for energy services, Earth. Future, 3, 182–205, 2015.
SCIO (State Council Information Office of China): NDRC press conference on Green Lights Program, available at: http://www.scio.gov.cn/xwfbh/gbwxwfbh/xwfbh/fzggw/document/313370/313370.htm (last access: 27 August 2019), 2006.
Seinfeld, J. H., Pandis, S. N., and Noone, K.: Atmospheric Chemistry and Physics: From Air Pollution to Climate Change, Environ. Sci. Policy Sust. Dev., 40, 26–26, 1998.
Tie, X. and Cao, J.: Aerosol pollution in China: Present and future impact on environment, Particuology, 8, 426–431, 2010.
Tie, X., Brasseur, G., Emmons, L., Horowitz, L., and Kinnison, D.: Effects of aerosols on tropospheric oxidants: A global model study, J. Geophys. Res.-Atmos., 106, 22931–22964, 2001.
Tie, X., Madronich, S., Walters, S., Zhang, R., Rasch, P., and Collins, W.: Effect of clouds on photolysis and oxidants in the troposphere, J. Geophys. Res., 108, 1–25, https://doi.org/10.1029/2003JD003659, 2003.
Tong, D., Zhang, Q., Liu, F., Geng, G., Zheng, Y., Xue, T., Hong, C., Wu, R., Qin, Y., Zhao, H., Yang, L., and He, K.: Current Emissions and Future Mitigation Pathways of Coal-Fired Power Plants in China from 2010 to 2030, Environ. Sci. Technol., 52, 12905–12914, 2018.
Wang, S. and Hao, J.: Air quality management in China: Issues, challenges, and options, J. Environ. Sci., 24, 2–13, 2012.
Wang, Y. J.: Study on energy saving technology of urban road lighting LED street lighting, Heilongjiang Science, 8, 50–51, 2017 (in Chinese).
Wang, Y., Zhang, Q., Jiang, J., Zhou, W., Wang, B., He, K., Duan, F., Zhang, Q., Philip, S., and Xie, Y.: Enhanced sulfate formation during China's severe winter haze episode in January 2013 missing from current models, J. Geophys. Res.-Atmos., 119, 10425–10440, https://doi.org/10.1002/2013JD021426, 2015a.
Wang, Z., Pan, L., Li, Y., Zhang, D., Ma, J., Sun, F., Xu, W., and Wang, X.: Assessment of air quality benefits from the national pollution control policy of thermal power plants in China: A numerical simulation, Atmos. Environ., 106, 288–304, 2015b.
Wesely, M.: Parameterization of surface resistances to gaseous dry deposition in regional-scale numerical models, Atmos. Environ., 23, 1293–1304, 1989.
Xue, J., Yuan, Z., Griffith, S. M., Yu, X., Lau, A. K. H., and Yu, J. Z.: Sulfate Formation Enhanced by a Cocktail of High NOx, SO2, Particulate Matter, and Droplet pH during Haze-Fog Events in Megacities in China: An Observation-Based Modeling Investigation, Environ. Sci. Technol., 50, 7325–7334, 2016.
Yu, C. and Zhou, D.: Evaluation of the implementation of China's green lights program, Energy China, 2, 8–11, 2001.
Zhang, H., Li, J., Qi, Y., Jian, Z. Y., Wu, D., Yuan, C., He, K., and Jiang, J.: Source apportionment of PM2.5 nitrate and sulfate in China using a source-oriented chemical transport model, Atmos. Environ., 62, 228–242, 2012.
Zhang, Q., Streets, D. G., Carmichael, G. R., He, K. B., Huo, H., Kannari, A., Klimont, Z., Park, I. S., Reddy, S., Fu, J. S., Chen, D., Duan, L., Lei, Y., Wang, L. T., and Yao, Z. L.: Asian emissions in 2006 for the NASA INTEX-B mission, Atmos. Chem. Phys., 9, 5131–5153, https://doi.org/10.5194/acp-9-5131-2009, 2009.
Zhao, Y., Zhang, J., and Nielsen, C. P.: The effects of recent control policies on trends in emissions of anthropogenic atmospheric pollutants and CO2 in China, Atmos. Chem. Phys., 13, 487–508, https://doi.org/10.5194/acp-13-487-2013, 2013.
Zheng, B., Gao, F., and Guo, X.: Survey Analysis of Lighting Power Consumption in China, China Light & Lighting, 10, 18–22, 2016 (in Chinese).