the Creative Commons Attribution 4.0 License.
the Creative Commons Attribution 4.0 License.
 | 23 Aug 2019
Size-resolved composition and morphology of particulate matter during the southwest monsoon in Metro Manila, Philippines
Melliza Templonuevo Cruz
Paola Angela Bañaga
Grace Betito
Rachel A. Braun
Connor Stahl
Mojtaba Azadi Aghdam
Maria Obiminda Cambaliza
Hossein Dadashazar
Miguel Ricardo Hilario
Genevieve Rose Lorenzo
Lin Ma
Alexander B. MacDonald
Preciosa Corazon Pabroa
John Robin Yee
James Bernard Simpas
Armin Sorooshian
This paper presents novel results from size-resolved particulate matter (PM) mass, composition, and morphology measurements conducted during the 2018 southwest monsoon (SWM) season in Metro Manila, Philippines. Micro-orifice uniform deposit impactors (MOUDIs) were used to collect PM sample sets composed of size-resolved measurements at the following aerodynamic cut-point diameters (Dp): 18, 10, 5.6, 3.2, 1.8, 1.0, 0.56, 0.32, 0.18, 0.10, and 0.056 µm. Each sample set was analyzed for composition of the water-soluble fraction. Analysis for mass was carried out on two sample sets, whereas black carbon (BC) and morphology analysis were analyzed on a single sample set. The bulk of the PM mass was between 0.18 and 1.0 µm with a dominant mode between 0.32 and 0.56 µm. Similarly, most of the black carbon (BC) mass was found between 0.10 and 1.0 µm, peaking between 0.18 and 0.32 µm. These peaks are located in the Greenfield gap, or the size range between 0.10 and 1.0 µm, where wet scavenging by rain is relatively inefficient. In the range between 0.10 and 0.18 µm, BC constituted 78.1 % of the measured mass. Comparable contributions of BC (26.9 %) and the water-soluble fraction (33.4 %) to total PM were observed and most of the unresolved mass, which amounted to 39.6 % in total, was for diameters exceeding 0.32 µm. The water-soluble ions and elements exhibited an average combined concentration of 8.53 µg m−3, with , , , Na+, and Cl− as the major contributors. Positive matrix factorization (PMF) was applied to identify the possible aerosol sources and estimate their contribution to the water-soluble fraction of collected PM. The factor with the highest contribution was attributed to “aged aerosol” (48.0 %), while “sea salt” (22.5 %) and “combustion” emissions (18.7 %) had comparable contributions. “Vehicular/resuspended dust” (5.6 %) and “waste processing” emissions (5.1 %) were also identified. Microscopy analysis highlighted the ubiquity of nonspherical particles regardless of size, which is significant when considering calculations of parameters such as single scattering albedo, the asymmetry parameter, and the extinction efficiency.
The significant influence from aged aerosol to Metro Manila during the SWM season indicates that local sources in this megacity do not fully govern this coastal area's aerosol properties. The fact that the majority of the regional aerosol mass burden is accounted for by BC and other insoluble components has important downstream effects on the aerosol hygroscopic properties, which depend on composition. The results are relevant for understanding the impacts of monsoonal features on size-resolved aerosol properties, notably aqueous processing and wet scavenging. Finally, the results of this work provide contextual data for future sampling campaigns in Southeast Asia such as the airborne component of the Cloud, Aerosol, and Monsoon Processes Philippines Experiment (CAMP2Ex) planned for the SWM season in 2019.
- Article
(3980 KB) - Full-text XML
-
Supplement
(172 KB) - BibTeX
- EndNote


Ambient atmospheric aerosol particles impact human health, visibility, climate, and the hydrological cycle. Major factors governing these behaviors, such as the deposition fraction in the respiratory system and activation into cloud condensation nuclei (CCN), include size and chemical composition. Therefore, size-resolved measurements of ambient aerosol particles can lend additional insights to the behavior and implications of particulate matter (PM) in the atmosphere. One region of interest for the characterization of PM is Southeast Asia due to increasing urbanization and the exposure of the population to a variety of aerosol sources, both natural and anthropogenic (Hopke et al., 2008). However, use of spaceborne remote-sensing instrumentation presents a challenge for characterization of aerosol in this region, due to issues such as varying terrain and cloud cover (Reid et al., 2013).
The Philippines represents a country in Southeast Asia with a developing economy, rapid urbanization, old vehicular technology, and less stringent air quality regulations (e.g., Alas et al., 2017). It is also highly sensitive to the effects of climate change, including prolonged dry periods and reductions in southwest monsoon (SWM) rainfall in recent decades (e.g., Cruz et al., 2013). Metro Manila is the country's capital and the center of political and economic activities. Also referred to as the National Capital Region, Metro Manila is composed of 16 cities and a municipality that collectively occupy a land area of ∼619 km2. As of 2015, Metro Manila had a population of approximately 12.88 million (Philippine Statistics Authority, 2015). Of the cities comprising the Metro Manila area, the one that is the focus of this study, Quezon City, is the most populated (2.94 million people) with a population density of ∼17 000 km−2 as of 2015 (Philippine Statistics Authority, 2015).
The rainfall pattern in Southeast Asia is governed by topographic effects and the prevailing surface winds brought by the monsoons. Mountain ranges in the Philippines are generally oriented north to south on the eastern and western coasts. As such, northeasterly winds during the East Asian winter monsoon that starts in November cause wetness (dryness) on the eastern (western) coasts of the country. In contrast, the rainy season starts in May when the western North Pacific subtropical high moves northeast and the Asian summer monsoon enables the propagation of southwesterly wind through the Philippines (Villafuerte et al., 2014). Therefore, Metro Manila, located on the western side of the Philippines, experiences wet (May–October) and dry (November–April) seasons. The large seasonal shift in the prevailing wind directions can cause changes in the source locations of aerosol transported to the Philippines and the subsequent direction in which emissions from the Philippines are transported, such as to the northwest (e.g., Chuang et al., 2013) or southwest (e.g., Farren et al., 2019). However, one interesting feature of Metro Manila is the consistency of PM2.5 ∕ PM10 mass concentrations during both the dry (44∕54 µg m−3) and wet seasons (43∕55 µg m−3) (Kim Oanh et al., 2006), which stands in contrast to typical assumptions that increased wet scavenging during rainy seasons would lead to decreases in measured PM (e.g., Liao et al., 2006). While similar results are observed in Chennai, India, this behavior is different from other cities in Asia, including Bandung (Indonesia), Bangkok (Thailand), Beijing (China), and Hanoi (Vietnam), which exhibit reduced PM2.5 levels during the wet season compared with the dry season (Kim Oanh et al., 2006). While the total PM levels may stay constant across the wet and dry seasons, seasonally resolved analyses will provide additional insights into how the composition, morphology, and sources (transported vs. local emissions) change on a seasonal basis.
Metro Manila has been drawing growing interest with respect to PM research owing to the significant levels of black carbon (BC). A large fraction of PM in Metro Manila can be attributed to BC (e.g., ∼50 % of PM2.5; Kim Oanh et al., 2006), with previously measured average values of BC at the Manila Observatory (MO) reaching ∼10 µg m−3 for PM2.5 (Simpas et al., 2014). The impacts of these high levels of BC present on human health have also received attention (Kecorius et al., 2019). Identified major sources of BC include vehicular, industrial, and cooking emissions (Bautista et al., 2014; Kecorius et al., 2017). Vehicular emissions are especially prevalent along roadways where personal cars and motorcycles, commercial trucks, and motorized public transportation, including powered tricycles and “jeepneys”, are plentiful. For instance, measurements of PM2.5 at the National Printing Office (NPO) located alongside the major thoroughfare Epifanio de los Santos Avenue (EDSA) were 72 µg m−3 on average; this value is twice the average concentration at MO, an urban mixed site located approximately 5 km from NPO (Simpas et al., 2014). In addition to local emissions, long-range transport of pollution, such as biomass burning, can also impact the study region (e.g., Xian et al., 2013; Reid et al., 2016a, b). However, most of the past work referenced above has focused on either total PM2.5 or PM10 composition; therefore, detailed size-resolved composition information has been lacking in this region. Like other monsoonal regions (Crosbie et al., 2015; Qu et al., 2015), it is of interest, for instance, to know if products of aqueous processing (e.g., sulfate, organic acids) during the monsoonal period, promoted by the high humidity, become more prominent in certain size ranges to ultimately enhance hygroscopicity, which is otherwise suppressed with higher BC influence.
A year-long sampling campaign, the Cloud, Aerosol, and Monsoon Processes Philippines Experiment (CAMP2Ex) weatHEr and CompoSition Monitoring (CHECSM) study, was established in July 2018 to collect size-resolved aerosol measurements in Metro Manila. The aim of this study was to report size-resolved PM measurements taken over the course of the SWM (July–October) in 2018 in Quezon City, Metro Manila, Philippines as part of CHECSM. The results of this study are important for the following reasons: (i) they provide size-resolved analysis of BC in an area previously characterized as having one of the highest BC mass percentages in the world; (ii) they provide a basis for better understanding the unusual phenomenon of similar observed PM levels during a wet and dry season; (iii) they provide contextual data that can be contrasted with both other coastal megacities and other monsoonal regions; and (iv) they can lend insights into the characteristics of aerosol transported both into and out of Metro Manila and how important local sources are in Metro Manila relative to transported pollution.
Outcomes of this study include (i) the first size-resolved characterization of both aerosol composition and morphology in Metro Manila for the SWM, with implications in terms of PM effects on climate, visibility, the hydrological cycle, and public health owing to the dependence of these impacts on particle size; (ii) archival data that contribute to the time line of aerosol research in Metro Manila, and more broadly Southeast Asia, where there is considerable concern regarding air pollution; and (iii) baseline data for aerosol composition to be used to inform and assist research to be conducted during future field campaigns in Southeast Asia including the same seasonal period (i.e., SWM) in 2019 as part of CAMP2Ex, which will involve both surface and airborne measurements.
2.1 Sample site
Sampling was performed at MO in Quezon City, Philippines (14.64∘ N, 121.08∘ E). Two MOUDIs were placed inside an unoccupied room on the third floor of the MO administration building (∼87 m a.s.l.). The inlet, located just outside the window, consisted of a 2 m long stainless steel tube and a reducer that was connected directly to the MOUDI inlet. Figure 1 shows the sampling location and potential surrounding aerosol sources. Past work focused on PM2.5 suggested that the study location is impacted locally mostly by traffic, various forms of industrial activity, meat cooking from local eateries, and, based on the season, biomass burning (Cohen et al., 2009). This is consistent with another source apportionment study which reported that potential sources at six sites across Metro Manila included traffic, secondary particles, and biomass burning (Kim Oanh et al., 2013).
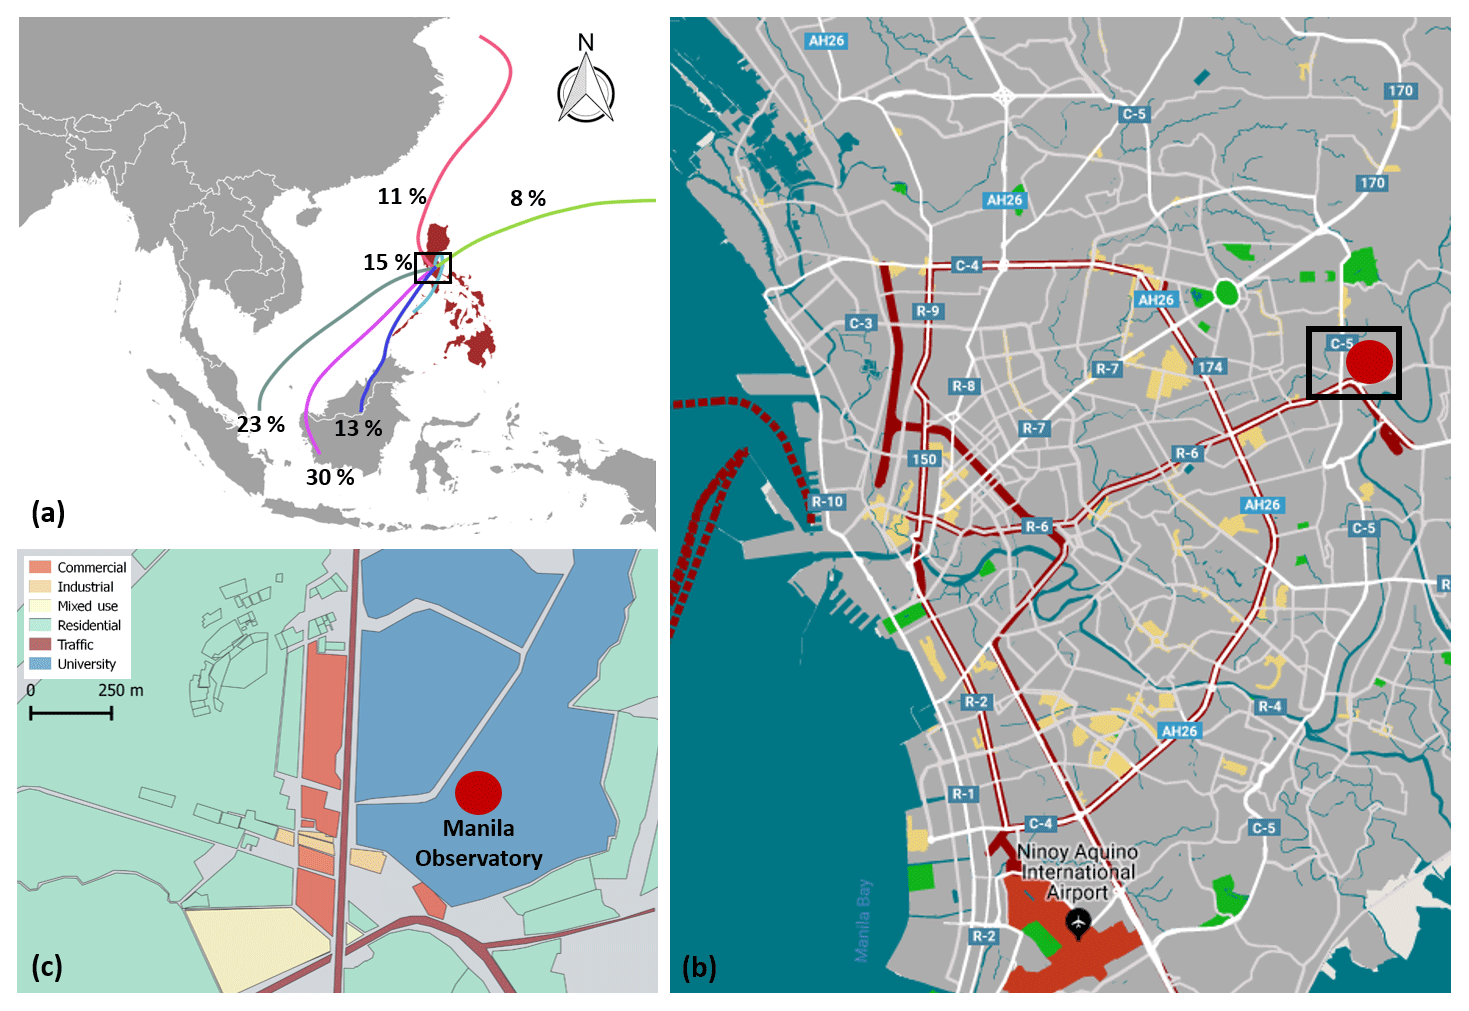
Figure 1(a) Location of Metro Manila, Philippines relative to Southeast Asia. Also shown are 5 d backward trajectory frequencies during the sampling duration based on HYSPLIT cluster analysis; note that 15 % correspond to trajectories within the black square. (b) Close-up view of Metro Manila showing the location of the Manila Observatory sampling site (black rectangle). The base map shows roads, commercial centers, and major transit lines in the city. (c) Land use classification in the vicinity of the sampling site. (Sources: GADM, Snazzy Maps, ©OpenStreetMap contributors 2019. Distributed under a Creative Commons BY-SA License, NOAA HYSPLIT, & TrajSat).
Meteorological data were collected using a Davis Vantage Pro2 Plus weather station located on the roof (∼90 m above sea level, ∼15 m above ground level) above where the MOUDIs were located. Except for precipitation, which is reported here as accumulated rainfall, reported values for each meteorological parameter represent averages for the sampling duration of each aerosol measurement. The mean temperature during the periods of MOUDI sample collection ranged from 24.9 to 28.1 ∘C, with accumulated rainfall ranging widely from no rain to up to 78.4 mm. To identify sources impacting PM via long-range transport to the Metro Manila region, Figure 1a summarizes the 5 d back-trajectories for air masses arriving at MO on the days when samples were being collected, calculated using the NOAA Hybrid Single-Particle Lagrangian Integrated Trajectory (HYSPLIT) model (Stein et al., 2015; Rolph, 2016). Trajectory calculations were started at 00:00, 06:00, 12:00, and 18:00 h at MO using a model run height of 12 m above ground level and meteorological files from the NCEP/NCAR reanalysis dataset. Trajectory cluster analysis was conducted using TrajStat (Wang et al., 2009). The back-trajectories in Figure 1a show that 66 % of the wind indeed came from the southwest during the sampling periods.
2.2 MOUDI sample sets
PM was collected on Teflon substrates (PTFE membrane, 2 µm pore, 46.2 mm, Whatman) in micro-orifice uniform deposit impactors (MOUDI, MSP Corporation, Marple et al., 2014). Size-resolved measurements were taken at the following aerodynamic cut-point diameters (Dp): 18, 10, 5.6, 3.2, 1.8, 1.0, 0.56, 0.32, 0.18, 0.10, and 0.056 µm. A total of 14 sample sets were collected during the SWM season (July–October 2018), with details regarding the operational and meteorological conditions during each sample set shown in Table 1. To determine the optimum sampling time required to collect enough sample for subsequent analyses, the collection times for the first four samples ranged from 24 to 119 h. Subsequent sample collection was then fixed at 48 h, with one sample set collected every week. The sample collection was designed to include samples from each day of the week; therefore, the collection cycled between Monday and Wednesday, Tuesday and Thursday, Wednesday and Friday, and Saturday and Monday, starting at 14:00 LT (local time) for the weekday samples and 05:00 LT for the weekend samples. The Teflon substrates were pretreated by washing with deionized water and air drying in a covered box. Substrates were placed in and retrieved from the cascade impactor inside the laboratory in an adjacent building and transported to and from the sampling site using an impactor holder (Csavina et al., 2011). Samples were immediately placed in the freezer upon retrieval.
Table 1Summary of average operating parameters, meteorological conditions, and total resolved water-soluble mass concentration for each MOUDI sample set collected at Manila Observatory (MO) during the 2018 southwest monsoon period. On two occasions, simultaneous MOUDI sets were collected so that one set could undergo gravimetric analysis (MO3 and MO13) and be compared with the mass resolved from chemical speciation of the water-soluble fraction (MO4 and MO14). One additional MOUDI set devoted to microscopy analysis was collected using aluminum substrates for 1 h on 1 August at 30 LPM (flow rate).
On two occasions, two pairs of MOUDI sets (sets MO3/MO4 and MO13/MO14) were collected simultaneously so that one set in each pair could undergo different types of analyses. Sets 3 and 13 underwent gravimetric analysis using a Sartorius ME5-F microbalance. Substrates were conditioned for at least 24 h at a mean temperature of 20–23 ∘C and a mean relative humidity of 30 %–40 % before pre- and post-weighing (US Environmental Protection Agency, 2016). MOUDI set 13 was additionally examined with a multi-wavelength absorption black carbon instrument (MABI; Australian Nuclear Science and Technology Organisation). This optically based instrument quantifies absorption and mass concentrations at seven wavelengths between 405 and 1050 nm; however, results are only reported for 870 nm to be consistent with other studies, as BC is the predominant absorber at that wavelength (e.g., Ramachandran and Rajesh, 2007; Ran et al., 2016). One additional sample set for microscopy analysis was collected for 1 h on 1 August using aluminum substrates.
2.3 Chemical composition analysis
A total of 12 sample sets, composed of 11 samples each, were analyzed for water-soluble ions and elements (Table 2). In order to preserve samples for additional analysis, each Teflon substrate was cut in half. A half of each substrate was extracted in 8 mL of Milli-Q water (18.2 MΩ cm) via sonication for 30 min in a sealed polypropylene vial. A blank substrate was processed using the same method to serve as a background control sample. Subsequent chemical analyses of the water-soluble components in the aqueous extracts were performed using ion chromatography (IC; Thermo Scientific Dionex ICS-2100 system) for the following species: cations – including Na+, , Mg2+, Ca2+, dimethylamine (DMA), trimethylamine (TMA), and diethylamine (DEA); and anions – including methanesulfonate (MSA), pyruvate, adipate, succinate, maleate, oxalate, phthalate, Cl−, , and . Owing to co-elution of TMA and DEA in the IC system, a cumulative sum of the two is reported here, which represents an underestimate of their total mass concentration owing to overlap in parts of their peaks. Limits of detection (LODs) were calculated for each species based on their respective calibration curve (Table S1), with the LOD being 3 times the standard deviation of the residuals (predicted signal minus measured signal) divided by the slope of the calibration curve (Miller and Miller, 2018).
Table 2Charge balance slopes (cations on the y axis; anions on the x axis) for the MOUDI sets shown, including the averages of all sets (All) for three size ranges: sub-micrometer stages spanning 0.056–1.0 µm, super-micrometer stages (> 1.0 µm), and all stages (> 0.056 µm). The species used in the charge balance analysis include those speciated with the IC (listed in Sect. 2.3) plus K from the ICP-QQQ analysis.

The aqueous extracts were simultaneously characterized for elemental composition using triple quadrupole inductively coupled plasma mass spectrometry (ICP-QQQ; Agilent 8800 Series) for the following species: K, Al, Fe, Mn, Ti, Ba, Zn, Cu, V, Ni, P, Cr, Co, As, Se, Rb, Sr, Y, Zr, Nb, Mo, Ag, Cd, Sn, Cs, Hf, Tl, and Pb. Limits of detection of the examined elements were calculated automatically by the ICP-QQQ instrument and were in the parts per trillion (ppt) range (Table S1 in the Supplement). The sample concentrations represent an average of three separate measurements with a standard deviation of 3 % or less.
Note that some species were detected by both IC and ICP-QQQ (i.e., Na+, K+, Mg2+, and Ca2+), and that the IC concentrations are used here for all repeated species with the exception of K+ owing to better data quality from ICP-QQQ. All IC and ICP-QQQ species concentrations for samples have been corrected by subtracting concentrations from background control samples. For more examples of the application of these methods used for substrate collection and IC/ICP analysis, the reader is referred to other recent work (Braun et al., 2017; Ma et al., 2019; Schlosser et al., 2017).
2.4 Microscopy analysis
As already noted, one MOUDI set on 1 August was devoted to microscopy analysis. Morphology and additional elemental composition analysis was carried out on this set of aluminum substrates using scanning electron microscopy equipped with energy dispersive X-ray spectroscopy (SEM-EDX) in the Kuiper Imaging cores at the University of Arizona. Secondary electron (SE) imaging and EDX elemental analysis were performed using a Hitachi S-4800 high-resolution SEM coupled to a NORAN System Six X-ray microanalysis system (Thermo Fisher Scientific). EDX analysis on individual particles was performed with 30 kV accelerating voltage to obtain weight percentages of individual elements. SEM-EDX results showed that the background control aluminum substrate was dominated by Al (88.27 %), with minor contributions from Ag (5.34 %), C (4.87 %), O (0.79 %), Fe (0.67 %), and Co (0.05 %). Such contributions were manually subtracted from spectra of individual particles on sample substrates, with the remaining elements scaled up to 100 %. Image processing was conducted with ImageJ software to measure particle dimensions and adjust the contrast and brightness of images to provide better visualization.
2.5 Computational analysis
This study reports basic descriptive statistics for chemical concentrations and correlations between different variables. Hereafter, statistical significance corresponds to 95 % significance based on a two-tailed Student's t test. To complement correlative analysis for identifying sources of species, positive matrix factorization (PMF) modeling was carried out using the United States Environmental Protection Agency's (US EPA) PMF version 5. A total of 132 samples from the 12 sets analyzed for water-soluble ions and elements were used in the PMF analysis. Species concentrations were examined before being inputted into the PMF analysis. Species considered as “strong” based on high signal-to-noise ratios (S∕N > 1) and those with at least 50 % of the concentrations above the LOD were used in the PMF modeling (Norris et al., 2014). This resulted in a 132 (samples) × 30 (species) data matrix that was inputted into the PMF analysis. Data points with concentrations exceeding the LOD had uncertainty quantified as
where σij, Xij, and LODij are the respective uncertainty, concentration, and LOD of the jth species in the ith sample (Reff et al., 2007). When concentration data were not available for a particular stage of a MOUDI set for a species, the geometric mean of the concentrations for that MOUDI stage and species was applied with uncertainty counted as 4 times the geometric mean value (Polissar et al., 1998; Huang et al., 1999). A 25 % extra modeling uncertainty was applied to account for other sources of error, such as changes in the source profiles and chemical transformations (Dumanoglu et al., 2014; Norris et al., 2014). The model was run 20 times with a randomly chosen starting point for each run.
3.1 Total mass concentrations and charge balance
The average total mass concentration (± standard deviation) of water-soluble species across all MOUDI stages (Table 1) during the study period was 8.53±4.48 µg m−3 (with a range of 2.7–16.6 µg m−3). The species contributing the most to the total water-soluble mass concentration during the SWM included (44 %±6 %), (18 %±5 %), (10 %±3 %), Na+ (8 %±3 %), and Cl− (6 %±3 %). The meteorological parameters from Table 1 best correlated with total water-soluble mass concentrations were temperature (r=0.64) and rainfall (). The highest total mass concentration (set MO13/14 with 16.6 µg m−3) occurred during the period with one of the highest average temperatures (27.8 ∘C) and second lowest total rainfall (0.8 mm). Other sampling periods with high mass concentrations (sets MO7, MO8, and MO12) coincided with the highest temperature and lowest rainfall observations. High temperatures, and thus more incident solar radiation, presumably enhanced production of secondary aerosol species via photochemical reactions as has also been observed in other regions during their respective monsoon season (Youn et al., 2013).
Low rainfall is thought to have been coincident with reduced wet scavenging of aerosol at the study site, as has been demonstrated for other regions such as North America (Tai et al., 2010) and megacities such as Tehran (Crosbie et al., 2014). However, set MO11 exhibited a very low concentration even with high temperature and lack of rainfall, which may be due to changes in the source and transport of aerosol as this sample set coincided with a significant change in the average wind direction (290.2∘ for MO11 vs. 90.1–127.5∘ for all other MOUDI sets). While the reported rainfall measurements were taken at MO, inhomogeneous rainfall patterns in the regions surrounding the Philippines could also contribute to the wet scavenging of PM, thereby lowering the quantity of transported particles reaching the sample site. Future work will address the influence of spatiotemporal patterns of precipitation on PM loadings in the Philippines as a point measurement at an aerosol observing site may be misleading.
On two occasions, two simultaneous MOUDI sets (sets MO3/MO4 and MO13/MO14) were collected in order to compare different properties that require separate substrates. The total mass concentrations based on the gravimetric analysis of sets MO3 and MO13 were 18.3 and 49.6 µg m−3, respectively (Fig. 2). Both sets exhibited a dominant concentration mode between 0.32 and 0.56 µm and the MO3 set was different in that it exhibited bimodal behavior with a second peak between 1.8 and 3.2 µm. The sum of speciated water-soluble species accounted for only 28.3 % and 33.4 % of the total gravimetric mass of sets MO3 and MO13, respectively, indicative of significant amounts of water-insoluble species undetected by IC and ICP-QQQ. When adding the total mass of BC (13.4 µg m−3) to the other resolved species from set MO13 (the only time that BC was measured), there was still 19.7 µg m−3 of unresolved mass (39.6 % of total PM). Most of the unaccounted mass was for Dp > 0.32 µm.

Figure 2Mass size distributions of total PM (blue dots) and resolved chemical species (colored bars) for MOUDI sets (a) MO3/4 and (b) MO13/14. Note that set MO13 was the only MOUDI set where BC was quantified. ICP-QQQ represents the sum of water-soluble elements except K; amines represent the sum of DMA, TMA, and DEA; organic acids represent the sum of oxalate, succinate, adipate, pyruvate, phthalate, and maleate.
The observation that BC accounts for 26.9 % of total PM (13.4 µg m−3) is consistent with past work highlighting the significant fraction of BC in the ambient aerosol in Manila (Kim Oanh et al., 2006; Bautista et al., 2014; Simpas et al., 2014; Kecorius et al., 2017). However, this fraction of BC is very high compared with measurements during the monsoon season in other parts of the world. The mass fraction of BC in total suspended PM (TSPM) was 1.6 %/2.2 % for the monsoon season in 2013/2014 in Kadapa in southern India, even though the TSPM measured was comparable to that in Manila (64.9 and 49.9 µg m−3, for 2013 and 2014 in Kadapa, respectively) (Begam et al., 2017). Multiple studies during the monsoon season in a coastal region in southwest India showed BC mass contributions of 1.9 %–5 % (Aswini et al., 2019 and references therein). Airborne measurements around North America and in Asian outflow revealed that BC accounted for only ∼1 %–2 % of PM1.0 (Shingler et al., 2016) and ∼5 %–15 % of accumulation-mode aerosol mass (Clarke et al., 2004), respectively.
To investigate the missing species further, a charge balance was carried out for all MOUDI sets (Table 2) to compare the sum of charges for cations vs. anions based on IC analysis including K from ICP-QQQ analysis (species listed in Sect. 2.3). The slope of the charge balances (cations on the y axis) for the cumulative dataset was 1.33 and ranged from 0.89 to 1.41 for the 12 individual MOUDI sets that had IC and ICP-QQQ analysis conducted on them. A total of 11 of the 12 sets exhibited slopes above unity, indicating that there was a deficit in the amount of anions detected, which presumably included species such as carbonate and various organics. To further determine if there were especially large anion or cation deficits in specific size ranges, slopes are also reported for 0.056–1 and > 1 µm. There were no obvious differences other than the fact that two MOUDI sets exhibited slopes below 1.0 for the smaller diameter range (0.056–1 µm), while all slopes exceeded unity for > 1 µm.
3.2 Mass size distributions and morphology
3.2.1 Black carbon
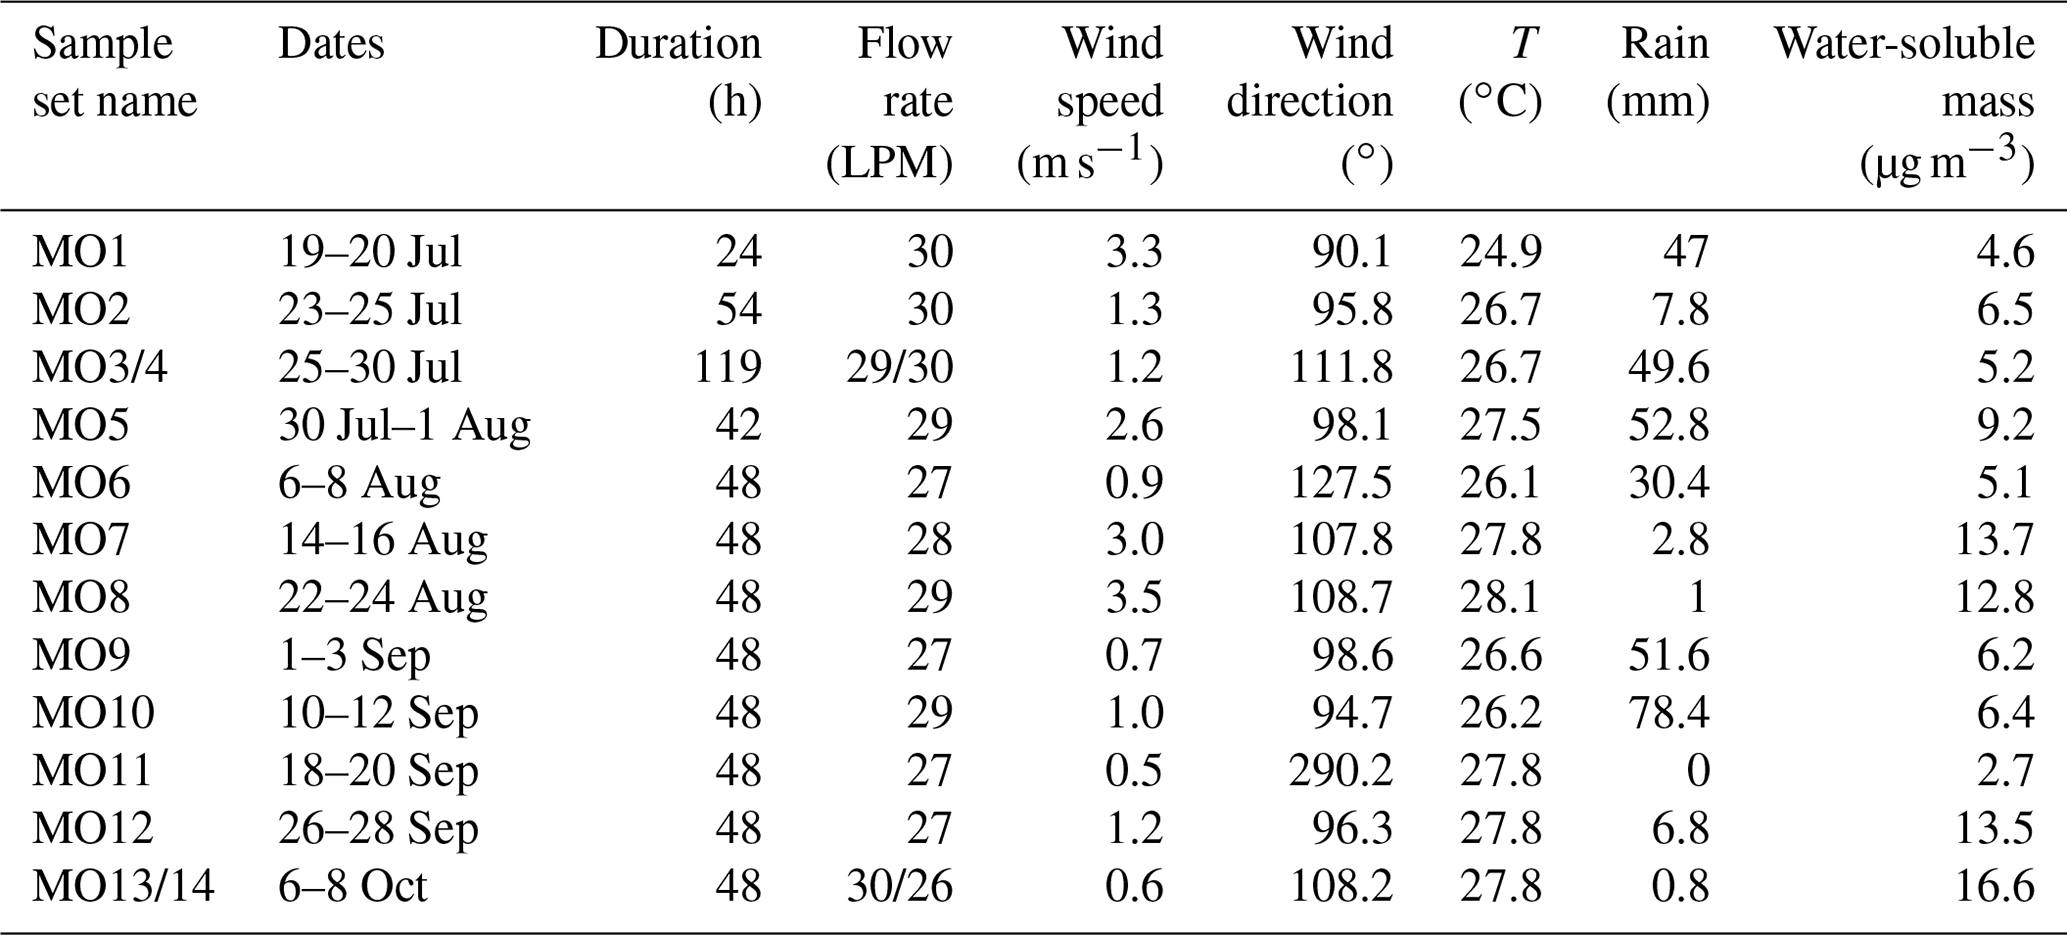
The size-resolved nature of BC has not been characterized in Manila, and MOUDI set MO13 offered a view into its mass size distribution (Fig. 3a). There was a pronounced peak between 0.18 and 0.32 µm (4.7 µg m−3), which is visually evident in the substrate's color when compared with all other stages of that MOUDI set (Fig. 3b). This observed peak in the mass size distribution of BC is similar to previous studies of the outflow of East Asian countries (Shiraiwa et al., 2008), biomass burning and urban emissions in Texas (Schwarz et al., 2008), measurements in the Finnish Arctic (Raatikainen et al., 2015), and airborne measurements over Europe (Reddington et al., 2013). In contrast, measurements in Uji, Japan, showed a bimodal size distribution for the mass concentration of BC in the sub-micrometer range (Hitzenberger and Tohno, 2001).
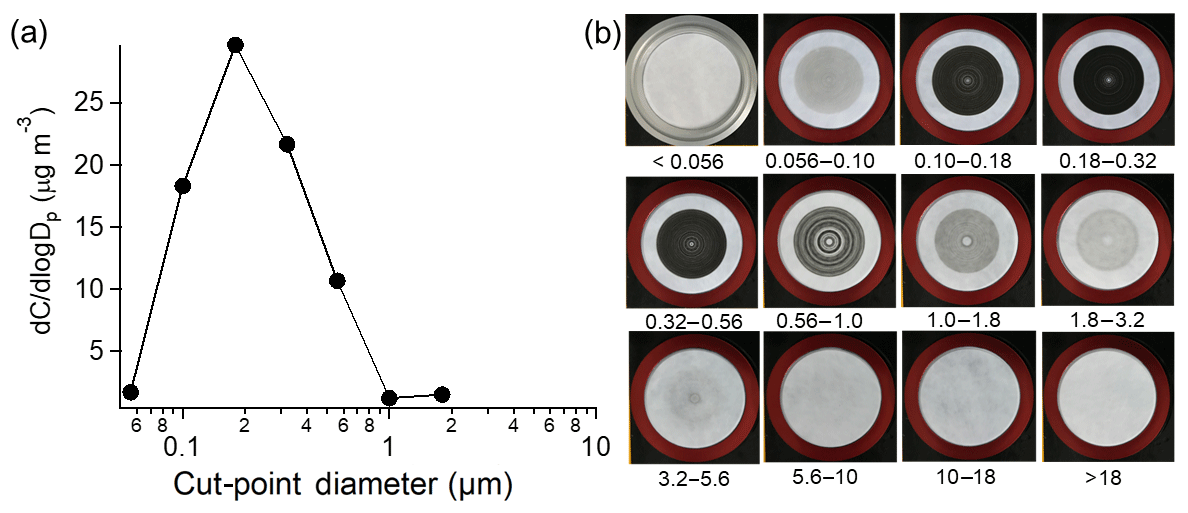
Figure 3(a) Mass size distribution of BC retrieved from the MABI optical measurement at 870 nm for set MO13. Missing values were below detection limits. (b) Photographs of each stage of set MO13 with numbers below each image representing the aerodynamic diameter ranges in units of micrometers (µm).
In the present study, there were significant amounts of BC extending to as low as the 0.056–0.1 µm MOUDI stage (0.26 µg m−3) and extending up in the super-micrometer range, with up to 0.23 µg m−3 measured between 1.8 and 3.2 µm. Remarkably, BC accounted for approximately 78.1 % (51.8 %) by mass of the total PM in the range from 0.10 to 0.18 µm (0.18–0.32 µm). For comparison, the mass percent contribution of BC measured in the megacity of Nanjing, China, was 3.3 % (1.6 %) at 0.12 (0.08) µm (Ma et al., 2017). Based on visual inspection of color on all MOUDI sets, MO13 appears to be representative of the other sets based on the relative intensity of the color black on substrates with different cut-point diameters (Fig. 3b); the 0.18–0.32 µm substrate was always the blackest, with varying degrees of blackness extending consistently into the super-micrometer stages.
Microscopy analysis revealed evidence of nonspherical particles in each MOUDI stage below 1 µm (Fig. 4), which is significant as the common theoretical assumption is that sub-micrometer particles are typically spherical (e.g., Mielonen et al., 2011). Errors in this assumption impact numerical modeling results and the interpretation of remote sensing data for aerosol particles (e.g., Kahnert et al., 2005), owing to incorrect calculations of parameters such as single scattering albedo, the asymmetry parameter, and the extinction efficiency (e.g., Mishra et al., 2015). Some studies have noted that sub-micrometer particles could be composed of an agglomeration of small spherical particles originally formed through gas-to-particle conversion processes (Almeida et al., 2019), which could potentially explain the appearance for some of the observed particles in Fig. 4. As only single particles were examined that may not be fully representative of all particles on a particular MOUDI substrate, it is noteworthy that all five particles shown between 0.056 and 1 µm were irregularly shaped with signs of both multi-layering and constituents adhered to one another.
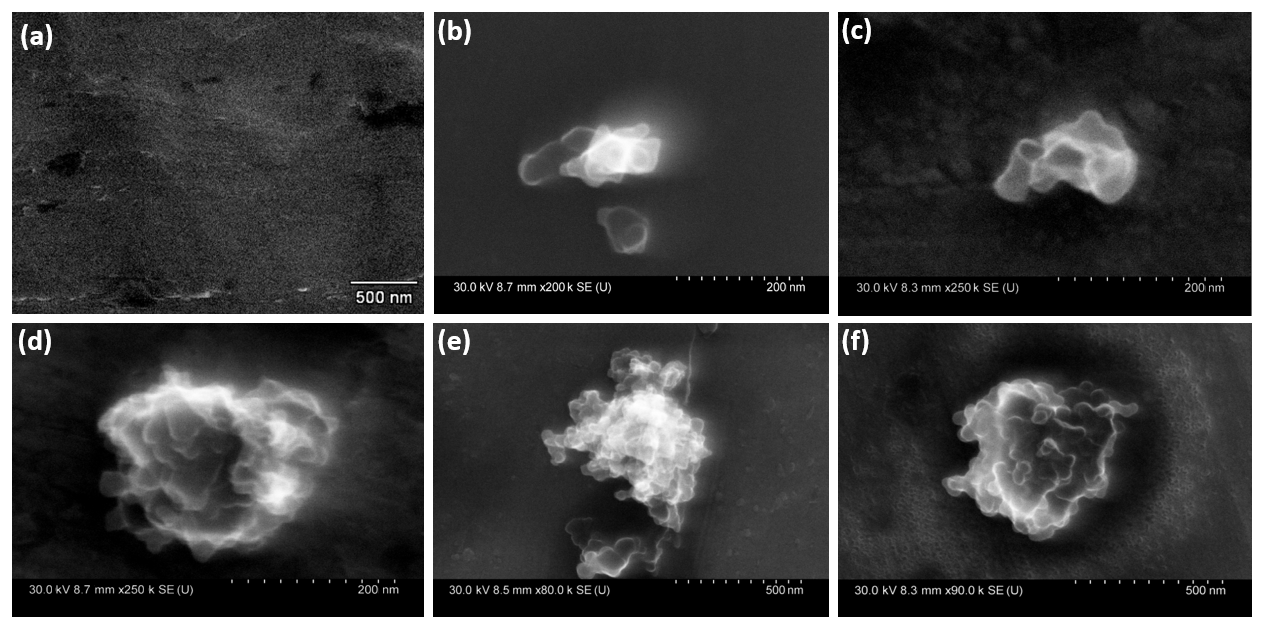
Figure 4SEM image of a (a) blank filter and (b–f) individual particles in different sub-micrometer aerodynamic diameter ranges sampled by the MOUDI: (b) 0.056–0.1, (c) 0.1–0.18, (d) 0.18–0.32, (e) 0.32–0.56, and (f) 0.56–1.0 µm.
The images show that a potentially important source of BC in the area could be soot aggregates, which are formed by a vaporization–condensation process during combustion often associated with vehicular exhaust (e.g., Chen et al., 2006; Chithra and Nagendra, 2013; Wu et al., 2017). Kecorius et al. (2017) projected that 94 % of total roadside refractory PM with number concentration modes at 20 and 80 nm was linked to jeepneys, the most popular and inexpensive mode of public transport in Metro Manila. They associated the larger mode with soot agglomerates, which is consistent with the smallest MOUDI size range examined here (0.056–0.1 µm; Fig. 4b) exhibiting signs of agglomeration.
The total BC mass concentration integrated across all stages of MOUDI set MO13 (13.4 µg m−3) was remarkably high in contrast to BC levels measured via either filters, Aethalometers, or single particle soot photometers in most other urban regions of the world (Metcalf et al., 2012 and references therein): Los Angeles Basin (airborne: 0.002–0.53 µg m−3); Atlanta, Georgia (ground: 0.5–3.0 µg m−3); Mexico City (airborne: 0.276–1.1 µg m−3); Sapporo, Japan (ground: 2.3–8.0 µg m−3); Beijing, China (ground: 6.3–11.1 µg m−3); Bangalor, India (ground: 0.4–10.2 µg m−3); Paris, France (ground: 7.9 µg m−3); Dushanbe, Russia (ground: 4–20 µg m−3); Po Valley, Italy (ground: 0.5–1.5 µg m−3); and Thessaloniki, Greece (ground: 3.3–8.9 µg m−3). This is intriguing in light of extensive precipitation, and, thus, wet scavenging of PM, during the study period, which is offset by enormous anthropogenic emissions in the region, such as those from powered vehicles like the jeepneys that are notorious for BC exhaust (Kecorius et al., 2017).
A possible explanation for the large contribution of BC to PM, and the persistence of PM after rain events (Kim Oanh et al., 2006), is that the BC is not efficiently scavenged by precipitating rain drops. Small particles enter rain drops via diffusion whereas large particles enter via impaction. However, particles with a diameter in the range from 0.1 to 1 µm (known as the Greenfield gap) are too large to diffuse efficiently and too small to impact; therefore, they are not efficiently scavenged (Seinfeld and Pandis, 2016). Absorption spectroscopy of set MO13 (Fig. 2b) reveals that 95 % of the BC mass is concentrated in the Greenfield gap; thus, the removal of BC due to precipitation is inefficient. The Greenfield gap contains 66±11 % of the total mass (calculated for MO3/MO13) and 65±10 % of the water-soluble mass (calculated for the other 12 MO sets). As noted earlier, BC observations discussed in this paper were based only on a single MOUDI set and the effect of inefficient scavenging in the Greenfield gap could just be one of the many potential processes affecting the BC mass size distribution. Subsequent work that will include BC measurements in the dry season will further investigate this hypothesis.
3.2.2 Water-soluble ions
There were two characteristic mass size distribution profiles for the water-soluble ions speciated by IC, depending on whether the species were secondarily produced via gas-to-particle conversion or associated with primarily emitted super-micrometer particles. The average IC species mass concentration profile across all MOUDI sets is shown in Fig. 5. Secondarily produced species exhibited a mass concentration mode between 0.32 and 0.56 µm, including common inorganic species (, ), MSA, amines (DMA, TMA+DEA), and a suite of organic acids, such as oxalate, phthalate, succinate, and adipate, produced via precursor volatile organic compounds (VOCs). Two organic acids with peaks in other size ranges included maleate (0.56–1 µm) and pyruvate (0.1–0.18 µm). Sources of the inorganics are well-documented: and are produced by precursor vapors SO2 and NH3, respectively, with ocean-emitted dimethylsulfide (DMS) as an additional precursor to and the primary precursor to MSA.
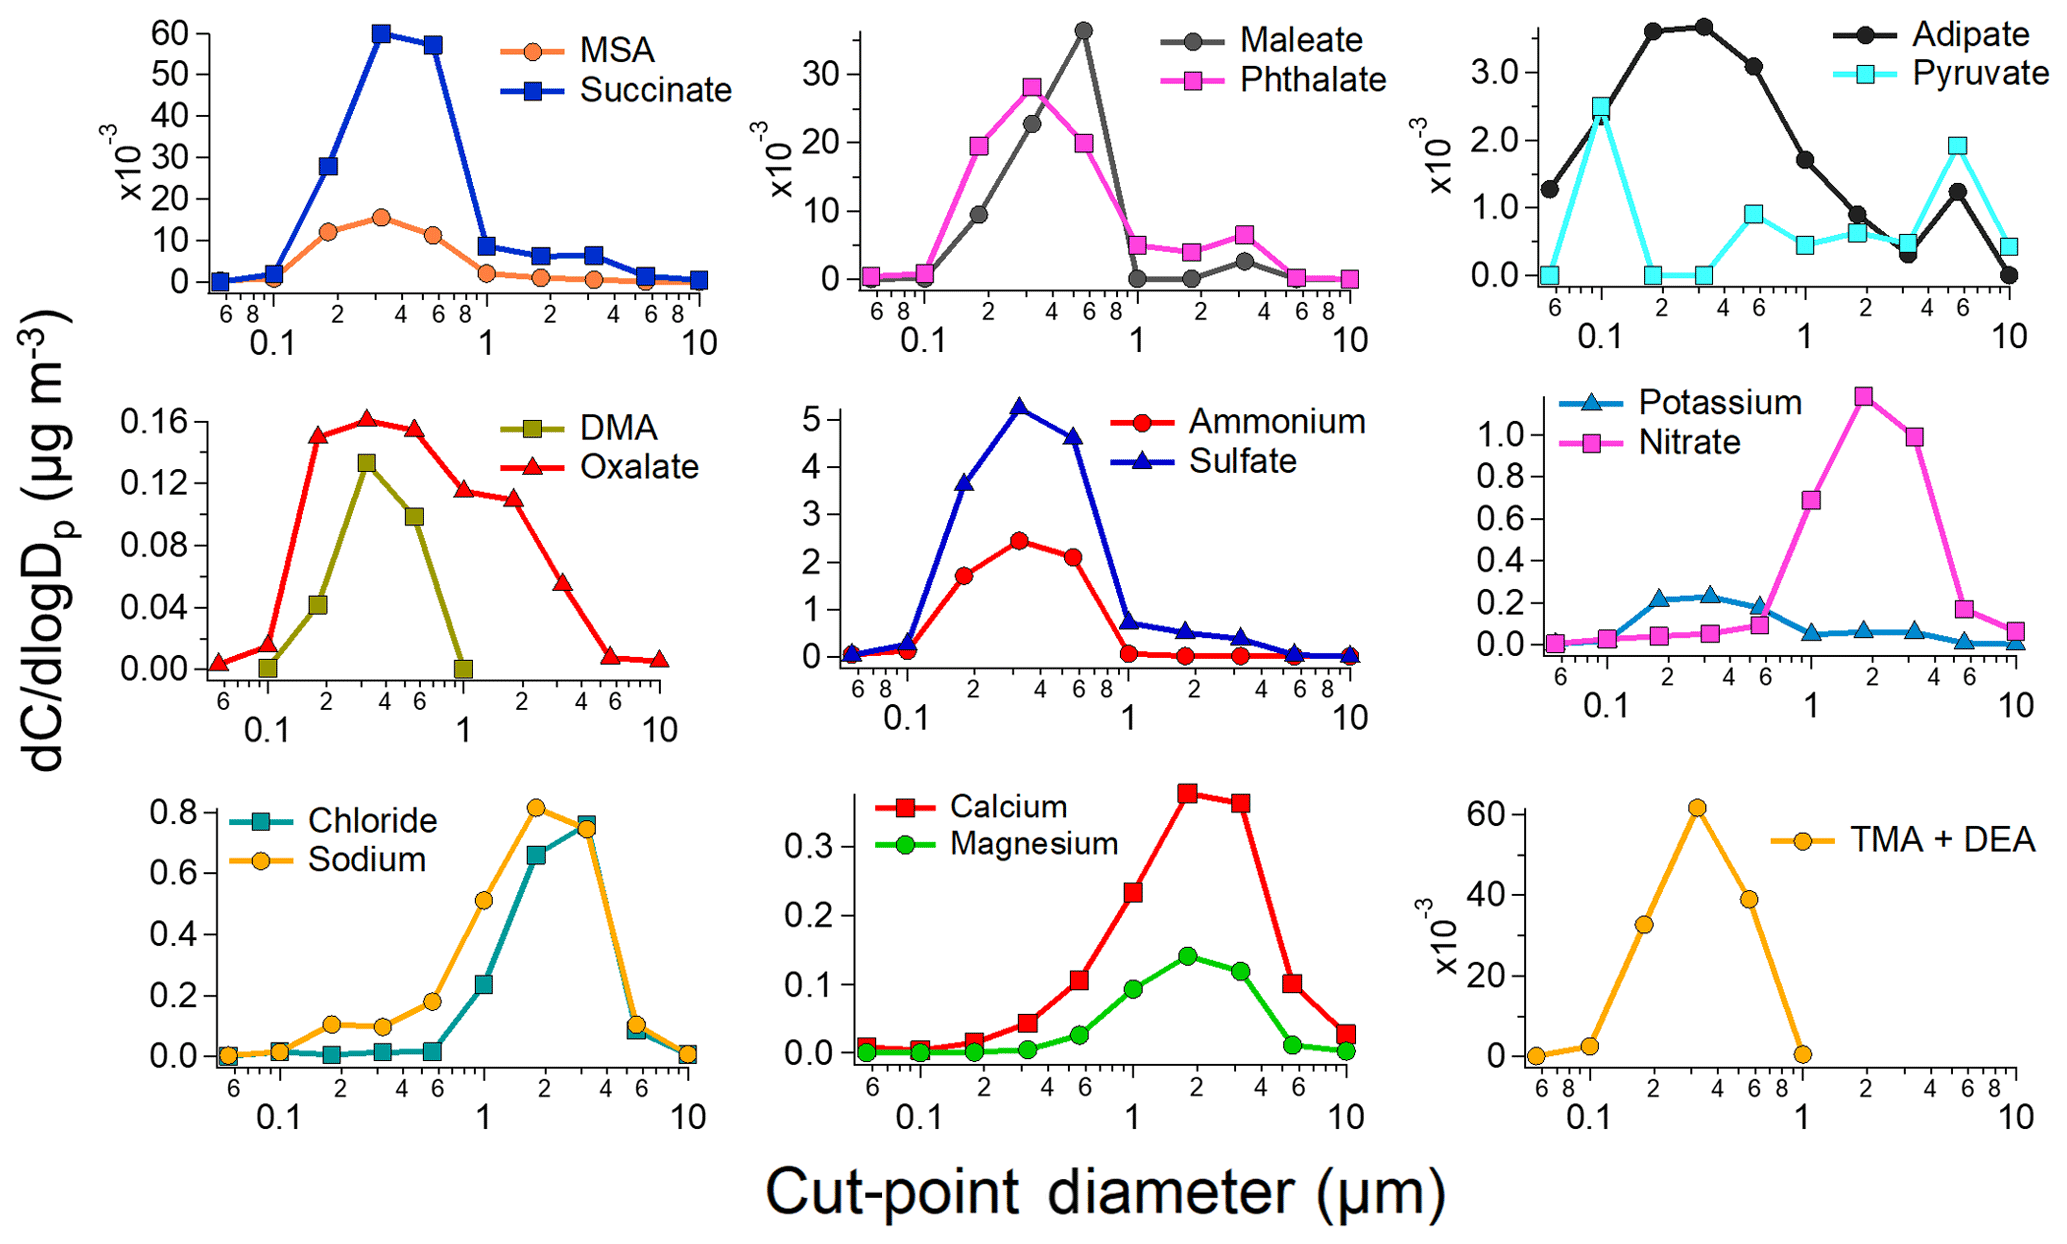
Figure 5Average mass size distribution of water-soluble ions speciated via IC in addition to potassium from ICP-QQQ analysis.
Precursors leading to secondarily produced alkyl amines such as DMA, TMA, and DEA likely originated from a combination of industrial activity, marine emissions, biomass burning, vehicular activity, sewage treatment, waste incineration, and the food industry (e.g., Facchini et al., 2008; Sorooshian et al., 2009; Ge et al., 2011; VandenBoer et al., 2011); another key source of these species – animal husbandry (Mosier et al., 1973; Schade and Crutzen, 1995; Sorooshian et al., 2008) – was ruled out owing to a scarcity of such activity in the study region. Secondarily produced amine salts were likely formed with as the chief anion owing to its much higher concentrations relative to or organic acids.
Dimethylamine was the most abundant amine, similar to other marine (Müller et al., 2009) and urban regions (Youn et al., 2015); the average concentration of DMA integrated over all MOUDI stages for all sample sets was 62.2 ng m−3 in contrast to 29.8 ng m−3 for TMA+DEA. For reference, the other key cation () participating in salt formation with acids such as H2SO4 and HNO3 was expectedly much more abundant (1.64 µg m−3). With regard to the competitive uptake of DMA vs. NH3 in particles, the molar ratio of DMA: exhibited a unimodal profile between 0.1 and 1.8 µm with a peak of 0.022 between 0.32 and 0.56 µm and the lowest values at the tails (0.004 between 0.1–0.18 and 1–1.8 µm); DMA was not above detection limits for either Dp < 0.1 µm or Dp > 1.8 µm. The molar ratios observed were consistent with values measured in the urban air of Tucson, Arizona, and coastal air in Marina, California (0–0.04; Youn et al., 2015) and near the lower end of the range measured in rural and urban air masses sampled near Toronto (0.005–0.2: VandenBoer et al., 2011).
The most abundant organic acid was oxalate (195±144 ng m−3), followed by succinate (21±41 ng m−3), phthalate (19±25 ng m−3), maleate (17±15 ng m−3), and adipate (5±8 ng m−3). The observation of mass concentrations increasing with decreasing carbon number for dicarboxylic acids (i.e., oxalate > succinate > adipate) is consistent with many past studies for other regions as larger chain acids undergo oxidative decay to eventually form oxalate (e.g., Kawamura and Ikushima, 1993; Kawamura and Sakaguchi, 1999; Sorooshian et al., 2007). Maleate is an unsaturated dicarboxylic acid emitted from gas and diesel engines (Rogge et al., 1993) and a product of the photooxidation of benzene (Kawamura and Ikushima, 1993). The aromatic dicarboxylic acid phthalate is a known photooxidation product of naphthalene and stems largely from plastic processing and fuel combustion (Fraser et al., 2003; Kautzman et al., 2010; Fu et al., 2012; Kleindienst et al., 2012). The oxidation product (MSA) of ocean-derived DMS exhibited an overall average concentration of 11±7 ng m−3, which is near the lower end of the range of levels reported in other coastal and marine environments (from undetected up to ∼200 ng m−3) (e.g., Saltzman et al., 1983, 1986; Berresheim 1987; Watts et al., 1987; Burgermeister and Georgii, 1991; Sorooshian et al., 2015; Xu and Gao, 2015).
Water-soluble species exhibiting a peak in the super-micrometer range, usually between 1.8 and 5.6 µm, include those with known affiliations with sea salt (Na+, Cl−, K+, Mg2+) and crustal materials such as dust (Ca2+). Nitrate peaked between 1.8 and 3.2 µm, and was best correlated with Na+ and Mg2+, suggestive of HNO3 partitioning to sea salt as has been observed in other coastal regions (e.g., Prabhakar et al., 2014a). There was very little in the sub-micrometer range (0.05±0.04 µg m−3) in contrast to super-micrometer sizes (0.78±0.47 µg m−3). More sub-micrometer in the form of NH4NO3 would be expected if there was an excess of NH3 after neutralizing . The mean ammonium-to-sulfate molar ratio for sub-micrometer sizes was 2.32±0.52 (range of 1.11–2.78), with full neutralization of in 10 of 12 MOUDI sets. Thus, there was a non-negligible excess in NH3 that presumably participated in salt formation with HNO3 and organic species. The significant levels of in the same mode as Na+ and Cl− contributed to the significant Cl− depletion observed, as the mean mass ratio between 1 and 10 µm (i.e., range of peak sea salt influence) was 0.81±0.28, which is much lower than the ratio for pure sea salt (1.81) (Martens et al., 1973). The subject of Cl− depletion in this region will be investigated more thoroughly in subsequent work.

Figure 6Same as Fig. 4, but for different super-micrometer aerodynamic diameter ranges sampled by the MOUDI: (a) 1.0–1.8, (b) 1.8–3.2, (c) 3.2–5.6, (d) 5.6–10, (e) 10-18, and (f) > 18 µm.
Figure 6 shows SEM images of representative single particles in each super-micrometer stage. As would be expected for sea salt and crustal material, most of the particles shown are not spherical. Interestingly, only the particle shown between 1 and 1.8 µm was close to being spherical. Its composition based on EDX analysis was accounted for mostly by carbon (93.7 %) with lower amounts of oxygen (5.8 %) and Fe (0.5 %). Sea salt particles were found in the next two stages owing to the highest combined weight percentages of Na+ and Cl− based on EDX analysis: 1.8–3.2 µm which equates to 36.9 %; and 3.2–5.6 µm which equates to 46.9 %. The salt particles are not necessarily cubical but more rounded with signs of agglomeration. These two particles were the only ones among the 11 MOUDI stages exhibiting an EDX signal for S, with contributions amounting to ∼2 % in each particle. This may be linked to natural existing in sea salt particles. Also, the particle between 3.2 and 5.6 µm contained a trace amount of Sc (1 %). The largest three particles (≥5.6 µm) were irregularly shaped, as expected, with both sharp and rounded edges, comprised mostly of oxygen, Al, Fe, and Ca based on EDX analysis.
3.2.3 Water-soluble elements
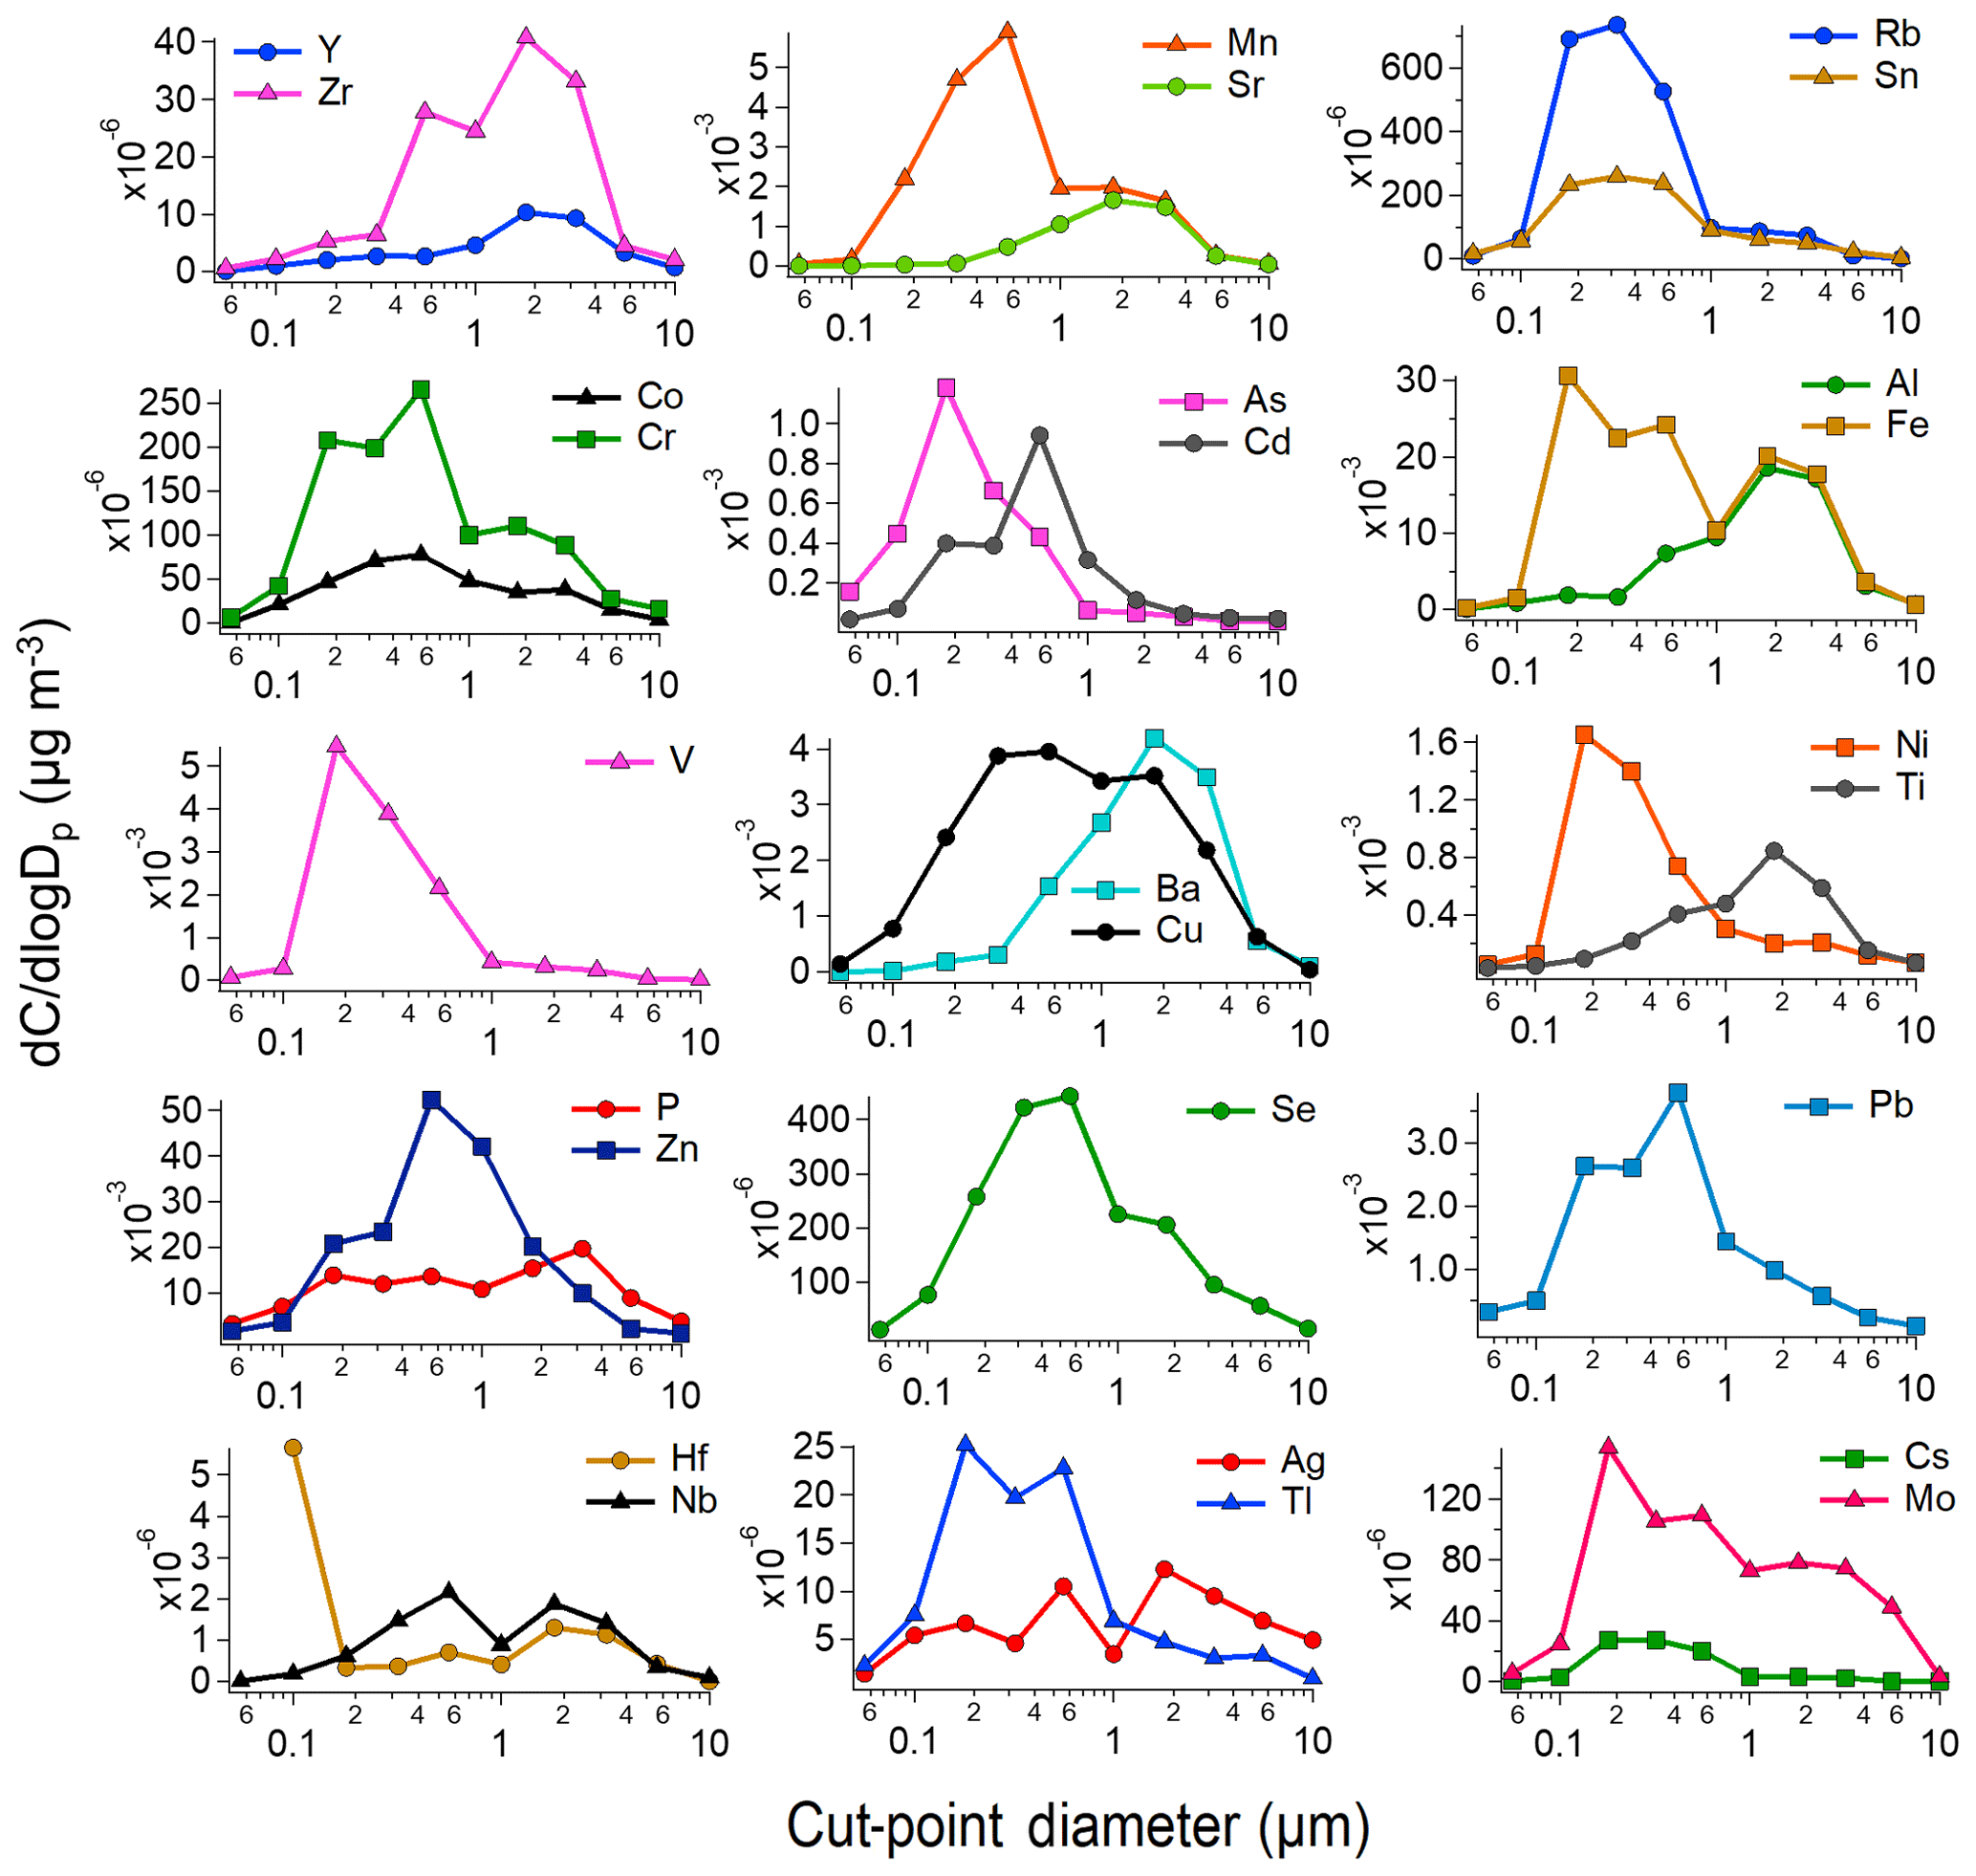
Averaged data across all MOUDI sets reveal that ICP-QQQ elements exhibited a variety of mass concentration profiles ranging from a distinct mode in either the sub- or super-micrometer range to having multiple modes below and above 1 µm (averages across all MOUDI sets shown in Fig. 7). There were several elements with only one distinct peak, which was observed in one of the two stages between 0.18 and 1.0 µm, including As, Cd, Co, Cr, Cs, Cu, Hf, Mn, Mo, Ni, Rb, Se, Sn, Tl, V, Pb, and Zn. In contrast, the following elements exhibited only one distinct peak in the super-micrometer range: Al, Ba, P, Sr, Ti, Y, and Zr. The rest of the elements exhibited more complex behavior with two distinct peaks in the sub- and super-micrometer range (Ag, Fe, and Nb). The following section discusses relationships between all of the ions and elements with a view towards identifying characteristic sources.
3.3 Characteristic sources and species relationships
A combination of PMF and correlation analysis helped identify clusters of closely related species stemming from distinct sources. The PMF solution with five factors (Fig. 8) was chosen because it passed the criteria of physical meaningfulness and it had a calculated ratio of Qtrue:Qexpected (1.2) that was very close to the theoretical value of 1.0. There was a high coefficient of determination between measured and predicted mass concentration when summing up all species for each MOUDI stage (r2=0.79; sample size, n=132), which added confidence in relying on the PMF model for source apportionment of PM. The five distinct clusters were named for their most plausible sources based on the species included in the groupings, with their overall contributions to the total mass based on PMF analysis shown in parenthesis (Table 3): aged (48.0 %), sea salt (22.5 %), combustion (18.7 %), vehicular/resuspended dust (5.6 %), and waste processing (5.1 %). For reference, a previous study near the northwestern edge of the Philippines identified six source factors for PM2.5 that are fairly similar to those here (Bagtasa et al., 2018): sea salt, resuspended fine dust, local solid waste burning, and long-range transport of (i) industrial emissions, (ii) solid waste burning, and (iii) secondary sulfate. Each of our five groupings will be discussed in detail below in decreasing order of contribution to total measured mass concentrations.
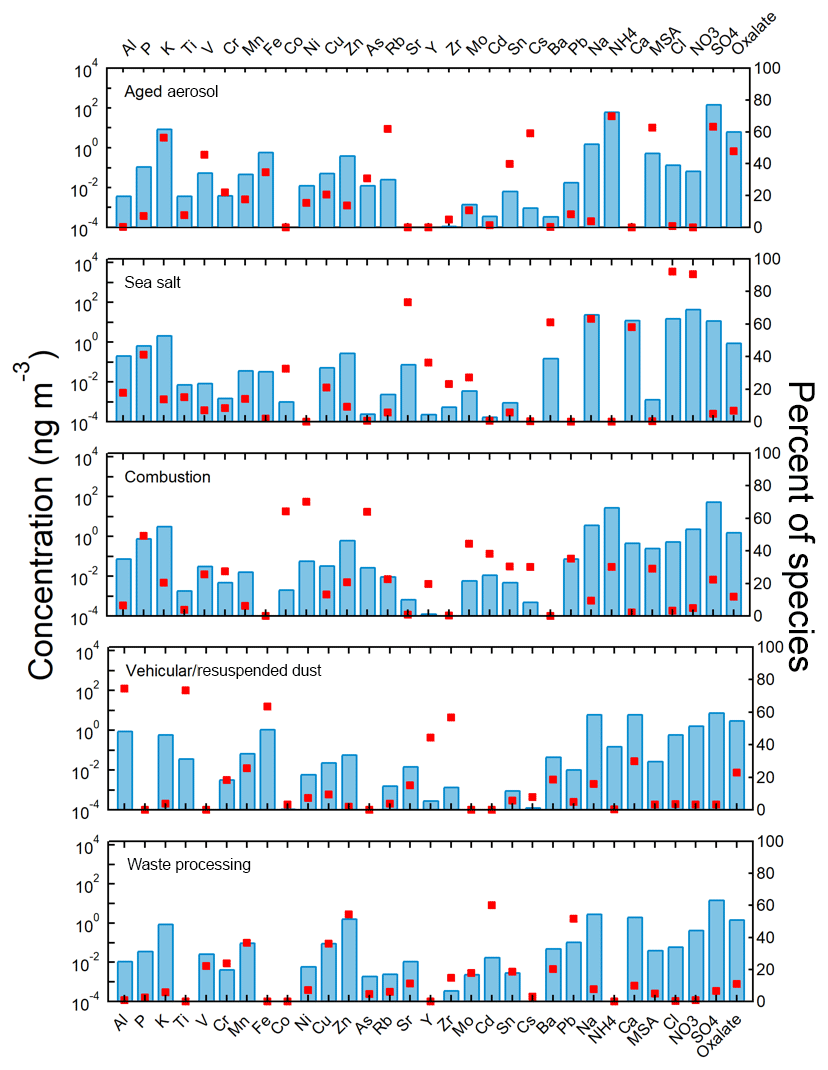
Figure 8Overview of the PMF five-factor solution with blue bars representing mass concentrations and red squares signifying the percentage of mass concentration contributed to constituents by each source factor.
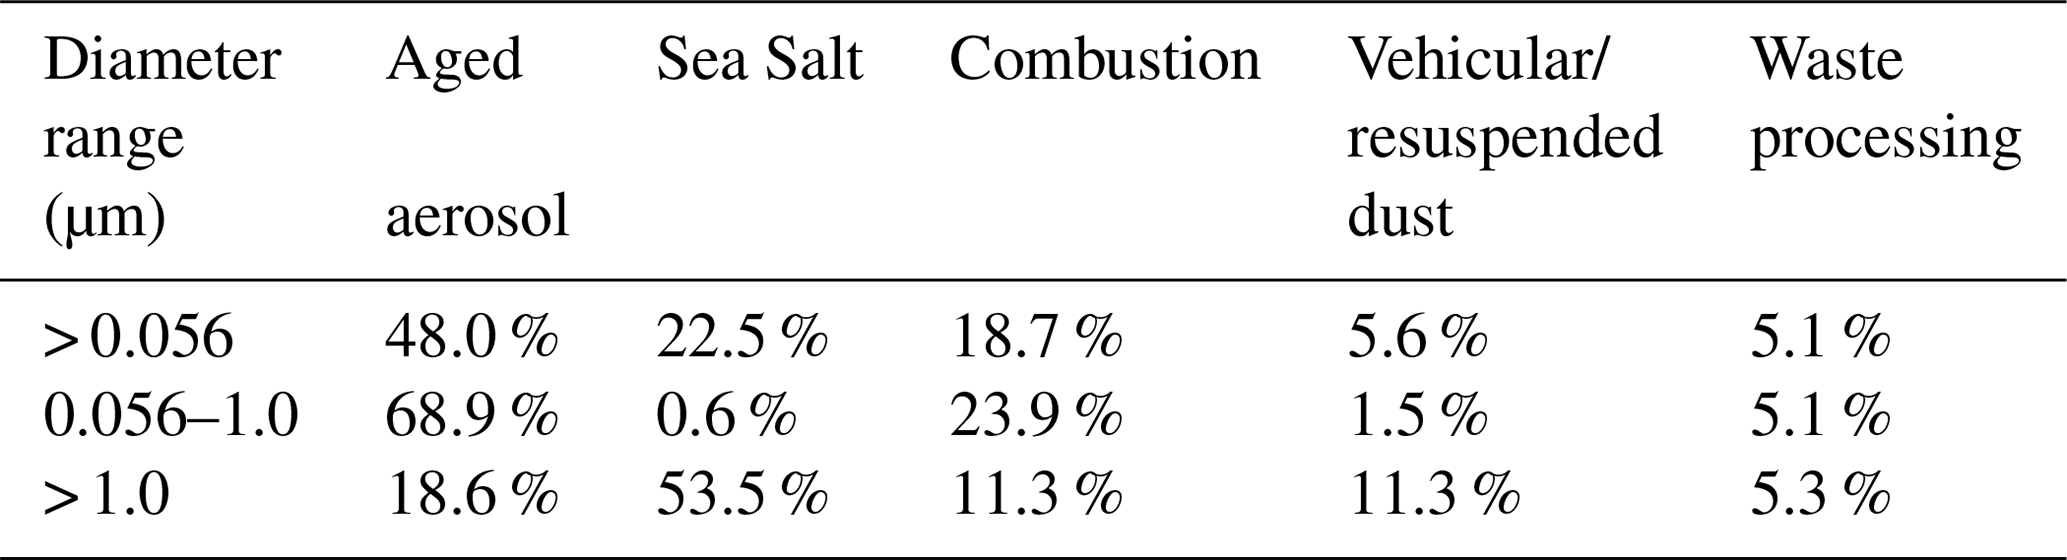
Table 3Contributions (in weight percentage) of each PMF source factor to the total mass in different diameter ranges.
3.3.1 Aged aerosol
Although not due to one individual source, there was a distinct PMF factor that included species commonly produced via gas-to-particle conversion processes (, , MSA, and oxalate). Correlation analysis (Table 4) also pointed to a large cluster of species significantly related to each other, including the aforementioned ions and a suite of other organic acids (phthalate, succinate, and adipate), MSA, and DMA. The latter three inorganic and organic acid ions exhibited significant correlations with each other (r≥0.68), but also with several elements (r≥0.36: K, V, Rb, Cs, Sn), which were likely co-emitted with the precursor vapors of the secondarily produced ions. Although BC concentrations were quantified from set MO13 only, the results showed that BC was significantly correlated (r: 0.61–0.92) with 15 species, including those mentioned above (owing to co-emission) and also a few elements that were found via PMF to be stronger contributors to the combustion source discussed in Sect. 3.3.3 (Ni, Cu, As, Se, Cd, Tl, and Pb).
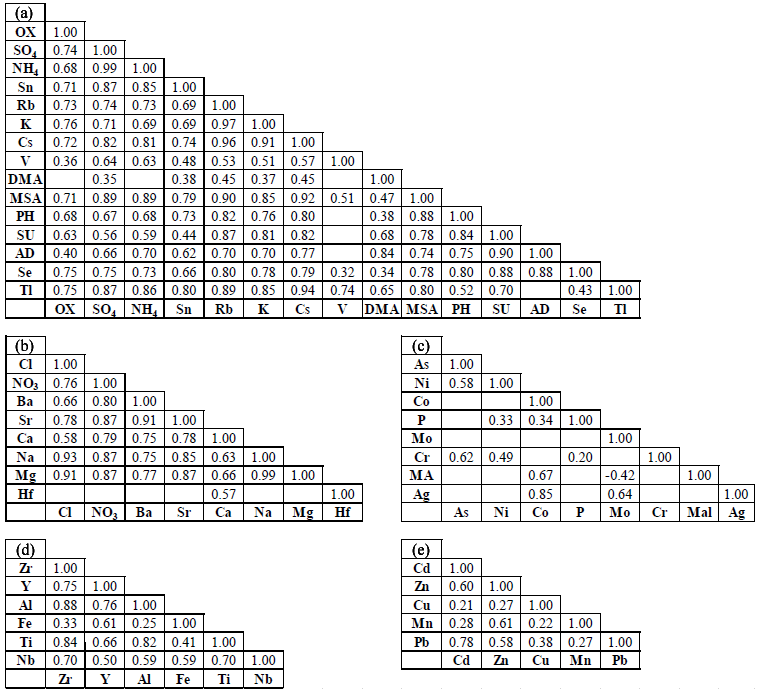
Table 4Correlation matrix (r values) between water-soluble species based on total MOUDI-integrated mass concentrations (> 0.056 µm). Blank cells represent statistically insignificant values. Results for the sub- and super-micrometer ranges are shown in Tables S2–S3. Panels (a)–(e) represent important species from each of the source profiles identified in Sect. 3.3: (a) represents aged aerosol, (b) represents sea salt, (c) represents combustion, (d) represents vehicular/resuspended dust, and (e) represents waste processing. DMA represents dimethylamine, MSA represents methanesulfonate, PH represents phthalate, OX represents oxalate, MA represents maleate, SU represents succinate, and AD represents adipate.
This PMF source factor is referred to as aged aerosol owing to its characteristic species being linked to secondary particle formation from emissions of regional and distant sources. The presence of and could be attributed to precursors from various local and regional combustion sources, while MSA and DMA are secondarily produced from ocean-derived gaseous emissions (e.g., Sorooshian et al., 2009). Biomass burning emissions from distant upwind regions such as Sumatra and Borneo (Xian et al., 2013) are likely sources of K. Previous studies (Reid et al., 2012; Wang et al., 2013) have shown that phenomena such as SWM and El Niño events not only influence biomass burning activities on the Malay Peninsula but also impact the transport and distribution of emissions in the study region. For instance, Reid et al. (2016b) showed that enhancement in monsoonal flow facilitates the advection of biomass burning and anthropogenic emissions to the Philippines from Sumatra and Borneo. Subsequent work will more deeply investigate the impact of biomass burning from those upwind regions on the sample site during the SWM.
While and require time for production owing to being secondarily produced from precursor vapors (i.e., SO2, NH3), oxalate is the smallest dicarboxylic acid and requires lengthier chemistry pathways for its production; thus, it is more likely produced in instances of aerosol transport and aging (e.g., Wonaschuetz et al., 2012; Ervens et al., 2018). The various elements associated with this cluster are co-emitted with the precursors to the aforementioned ions and are linked to a variety of sources: metallurgical processes (Anderson et al., 1988; Csavina et al., 2011; Youn et al., 2016), fuel combustion (Nriagu, 1989; Allen et al., 2001; Shafer et al., 2012; Rocha and Correa, 2018), residual oil combustion (Watson et al., 2004), biomass burning (Maudlin et al., 2015), marine and terrestrial biogenic emissions (Sorooshian et al., 2015), and plastics processing (Fraser et al., 2003). In addition, there is extensive ship traffic in the general study region, which is a major source of emissions in this cluster of species, particularly V and (e.g., Murphy et al., 2009; Coggon et al., 2012).
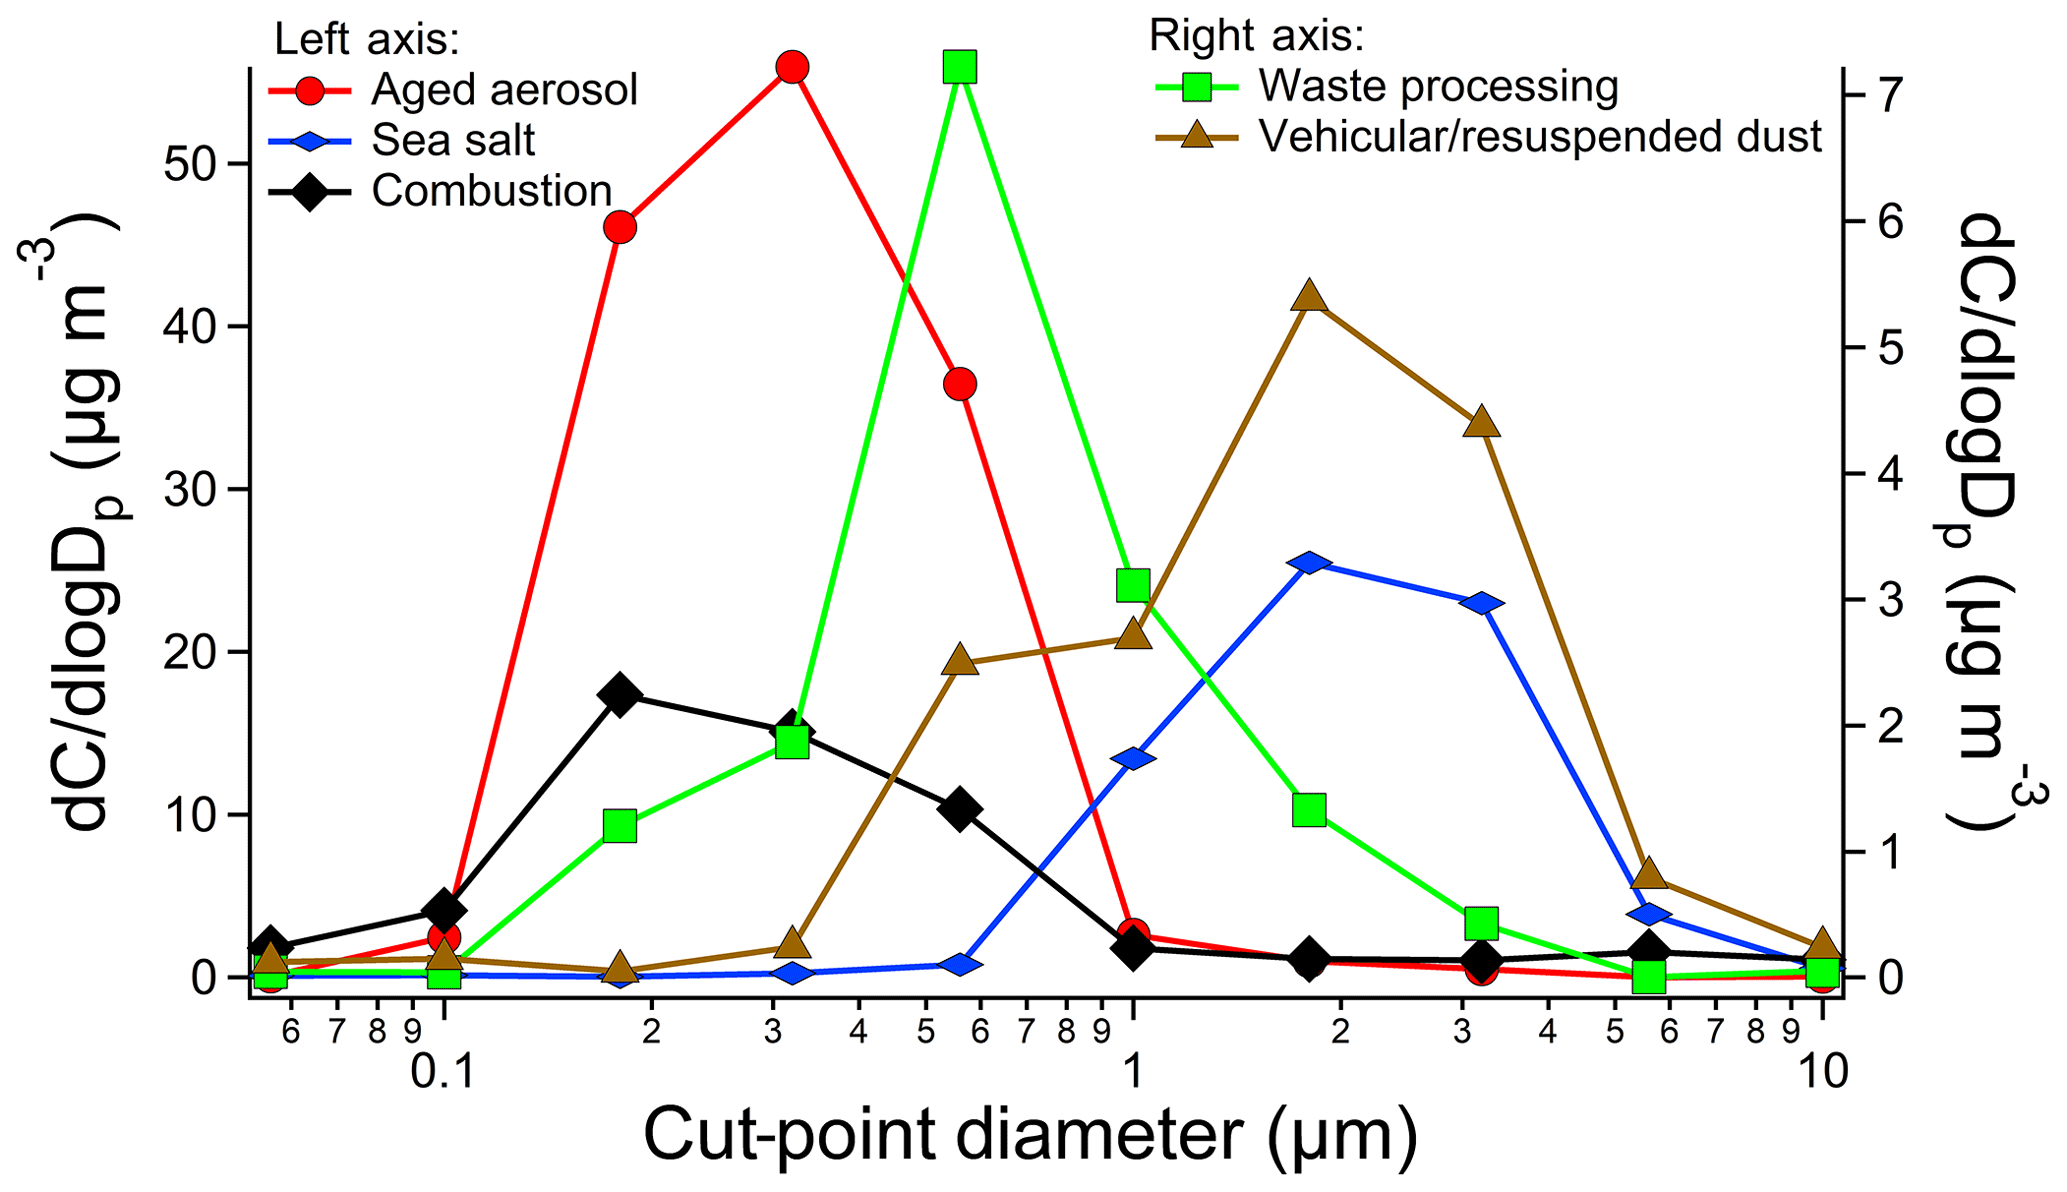
PMF analysis suggested that the aged aerosol factor contributed 48.0 % to the total water-soluble mass budget during the study period. Most of the contribution resided in the sub-micrometer range (68.9 %) unlike the super-micrometer range (18.6 %), which is consistent with the overall mass size distribution of total PM peaking in the sub-micrometer range (Fig. 2). The reconstructed mass size distribution for this PMF source factor shows the dominance of the mass in the sub-micrometer range with a peak between 0.32 and 0.56 µm (Fig. 9). The correlation matrices for the sub- and super-micrometer size ranges also show that the correlations between the species most prominent in the aged aerosol category are stronger for the former size range (Tables S2–S3). The contribution of this PMF factor to the super-micrometer range is likely associated with species secondarily produced on coarse aerosol such as dust and sea salt. This is evident in the individual species mass size distributions where there is a dominant sub-micrometer mode but also non-negligible mass above 1 µm.
Even though the PM in a heavily populated urban region, such as Metro Manila, is typically thought to be dominated by local sources of aerosol, the current PMF results show that contribution from long-range transport is still discernible. This finding is contrary to the expectation that the signal of transported aerosol would be lost in the noise of locally produced aerosol.
3.3.2 Sea salt
As the MO sampling site is approximately 13 km from the nearest shoreline (Fig. 1a) and downwind of Manila Bay in the SWM season, there was a great potential for marine emissions to impact the samples. There were several species with similar mass size distributions (mode: 1.8–5.6 µm) and highly correlated total mass concentrations (r≥0.51) that are linked to sea salt: Cl−, Na+, Ca2+, Mg2+, Ba, and Sr. The correlations between these species were stronger when examining just the super-micrometer range compared with the sub-micrometer range (Tables S2–S3). The majority of these species were used in PMF analysis and formed a distinct cluster amounting to 22.0 % of the total study period's mass budget. This source contributed only 0.6 % to the sub-micrometer mass concentration but 53.5 % for the super-micrometer size range. The reconstructed mass size distribution for this source factor is shifted farthest to the larger diameters compared with the other four sources with a peak between 1.8 and 3.2 µm (Fig. 9).
It is noteworthy that this factor has the highest share of among all identified sources. This result is consistent with mass size distributions shown in Figure 5 in which peaks in the super-micrometer range similar to sea salt constituents (e.g., Na+ and Cl−). Although sea salt particles naturally contain (Seinfeld and Pandis, 2016) (a mass ratio of of –), the extremely high ratio of (mass ratio ∼1.8) suggests that only a negligible portion of in this factor originated from primary sea salt particles. Thus, the majority of is most likely due to HNO3 partitioning to existing sea salt particles (e.g., Fitzgerald, 1991; Allen et al., 1996; Dasgupta et al., 2007; Maudlin et al., 2015). In addition, the Cl−:Na+ mass ratio in this profile (0.65) is smaller than that in sea salt particles (1.81), indicating high Cl− depletion mainly due to reactions of HNO3 with NaCl (Ro et al., 2001; Yao et al., 2003; Braun et al., 2017). Moreover, elevated loadings of trace elements (e.g., Ba, Cu, Zn, and Co) could be linked to mixing of marine emissions with urban sources (e.g., vehicle and industrial emissions) during their transport inland to the sampling site (Roth and Okada, 1998). This process of aging is consistent with the observed morphology of the sea salt particles in this study, revealing non-cubical shapes that are rounded owing to the likely addition of acidic species such as HNO3 (Fig. 6).
3.3.3 Combustion
There are numerous sources of combustion in the study region, including a variety of mobile sources (e.g., cars, utility vehicles, trucks, buses, and motorcycles) and stationary sources (e.g., power stations, cement works, oil refineries, boiler stations, and utility boilers). Consequently, the next highest contributor to total mass during the study period according to PMF (18.7 %) was the cluster of species including Ni, As, Co, P, Mo, and Cr, which is defined as the combustion factor. These species have been reported to be rich in particles emitted from combustion of fossil fuel and residual oil (Linak and Miller, 2000; Allen et al., 2001; Wasson et al., 2005; Mahowald et al., 2008; Mooibroek et al., 2011; Prabhakar et al., 2014b). Although not included in PMF analysis, other species significantly correlated with the abovementioned species include maleate and Ag, which also stem from fuel combustion (Kawamura and Kaplan, 1987; Lin et al., 2005; Sorooshian et al., 2007). Ag in particular is an element in waste incinerator fly ash (Buchholz and Landsberger, 1993; Tsakalou et al., 2018), and its strong correlation with Co (r=0.85) and Mo (r=0.64) provides support for this source factor being linked to combustion processes. Maleate is commonly found in engine exhaust (Kawamura and Kaplan, 1987), whereas Cr is a tracer for power plant emissions (Singh et al., 2002; Behera et al., 2015). Of all species examined in this study, BC was best correlated with As (r=0.92), while its correlation with Ni (r=0.85) was among the highest.
As the elements in this cluster peaked in concentration in the sub-micrometer mode, the weight percentage of this factor is more than double below 1 µm (23.9 %) compared with above 1 µm (11.3 %). The reconstructed mass size distribution for this source factor peaks between 0.18 and 0.32 µm, which is smaller than the modal diameter range for the aged source factor (0.32–0.56 µm) likely owing to closer sources and, thus, less time for growth to occur via condensation and coagulation.
3.3.4 Vehicular/resuspended dust
The next PMF source factor contains chemical signatures of dust due to high contributions to Al, Ti, Ca, and Fe. These crustal elements are strongly related to the resuspension of dust by traffic and construction activities (Singh et al., 2002; Harrison et al., 2011). Other elements that were prominent in this factor included Zr, Y, Mn, Cr, and Ba, which are associated with tire and brake wear (Adachi and Tainosho, 2004; Gietl et al., 2010; Song and Gao, 2011; Harrison et al., 2012; Vossler et al., 2016), although some of them can be linked to exhaust as well (e.g., Lin et al., 2005; Song and Gao, 2011). This source is named vehicular/resuspended dust and contributed 5.6 % to the total study period's mass concentrations.
The weight percentage contribution of this factor was much higher for the super-micrometer range (11.3 %) compared with the sub-micrometer range (1.5 %), which is consistent with the sea salt source factor owing to similar mass size distributions of the individual species associated with the two source categories (Figs. 5 and 7). Additional species correlated significantly with the crustal species included Hf and Nb, which also exhibited mass peaks between 1.8 and 3.2 µm. The reconstructed mass size distribution for this source factor is similar to that of sea salt in that there is a peak between 1.8 and 3.2 µm, but there is less of a unimodal profile owing to what appears to be a secondary mode between 0.56 and 1.0 µm (Fig. 9), which could be linked to some of the non-dust components of vehicular emissions.
3.3.5 Waste processing
The final PMF source factor, contributing the least overall to total mass (5.1 %), featured Zn, Cd, Pb, Mn, and Cu as its main components. These species are linked to waste processing, including electronic waste (e-waste) and battery burning and recycling in particular (Gullett et al., 2007; Iijima et al., 2007), which has previously been reported for Manila (Pabroa et al., 2011). The latter study reported that although there are a few licensed operations for battery recycling, there are numerous unregulated cottage melters across Manila that regularly melt metal from batteries and discard the waste freely. Fujimori et al. (2012) additionally showed that e-waste recycling led to emissions of the following elements (in agreement with this PMF cluster) around Metro Manila: Ni, Cu, Pb, Zn, Cd, Ag, in, As, Co, Fe, and Mn.
This was the only PMF factor exhibiting comparable weight percentages both below (5.1 %) and above 1 µm (5.3 %). This is reflected in the mass size distributions of the species included in this cluster being fairly uniformly distributed below and above 1 µm. This is also demonstrated in the reconstructed mass size distribution of this source factor as it clearly exhibits a mode between the other four sources (0.56–1.0 µm) and is the broadest mode (Fig. 9). The explanation for this is likely rooted in the diversity of sources contained within this source profile that lead to different sizes of particles. Examples of such sources include processing of different types of waste at varying temperatures and through various processes (e.g., burning, melting, and grinding) (Keshtkar and Ashbaugh, 2007),
This study used various analytical techniques (gravimetry, ion chromatography, triple quadrupole inductively coupled plasma mass spectrometry, black carbon spectroscopy, and microscopy), meteorological data, and a source apportionment model (positive matrix factorization) to characterize the sources, chemical composition, and morphology of size-resolved ambient particulate matter (PM) collected using micro-orifice uniform deposit impactors (MOUDIs) in Metro Manila, Philippines, during the southwest monsoon season (SWM) season of 2018. The main results of this study include the following:
-
The total mass concentrations were measured on two occasions and were 18.3 and 49.6 µg m−3. Water-soluble mass concentrations were measured on 12 occasions and were 8.53±4.48 µg m−3 on average (a range from 2.7 to 16.6 µg m−3). Simultaneous measurements of total, water-soluble, and black carbon (BC) mass revealed a composition of 26.9 % BC, 33.4 % water-soluble components, and 39.6 % unaccounted mass.
-
Size-resolved BC mass concentration was measured on one occasion, with the mass sum of all MOUDI stages reaching 13.4 µg m−3 Most of the BC mass (95 %) was contained in the 0.1–1 µm range (i.e., the Greenfield gap) where wet scavenging by rain is relatively inefficient. The measured BC peaked in the size range between 0.18 and 0.32 µm and accounted for 51.8 % of the measured PM for that stage. In the range between 0.10 and 0.18 µm, the mass percent contribution of BC to the measured PM was 78.1 %.
-
Most of the total mass resided in the sub-micrometer mode (0.32–0.56 µm); however, one MOUDI set revealed an additional super-micrometer mode (1.8–3.2 µm). Water-soluble species that peaked in the sub-micrometer mode were associated with secondarily produced species, including inorganic acids, amines, methanesulfonate (MSA), and organic acids. Water-soluble species that peaked in the super-micrometer mode were associated with sea salt and crustal material. Most of the unaccounted mass was for Dp > 0.32 µm.
-
The most abundant water-soluble species was (44 %±6 %), followed by (18 %±5 %), (10 %±3 %), Na+ (8 %±3 %), and Cl− (6 %±3 %). Correlation analysis revealed that total water-soluble mass was most correlated with temperature (r=0.64) and rainfall accumulation () among the meteorological factors considered, although other factors were likely influential such as wind direction and speed.
-
Regardless of particle size, the majority of the single particles examined with energy dispersive X-ray spectroscopy (SEM-EDX) were nonspherical with evidence of agglomeration.
-
PMF analysis suggested that there were five factors influencing the water-soluble fraction of PM collected at the sampling site. These factors, their contribution to total water-soluble mass, and the main species that permit them to be linked to a physical source are as follows: aged aerosol (48.0 %; , , MSA, and oxalate), sea salt (22.5 %; Cl−, , Ca2+, Na+, Mg2+, Ba, and Sr), combustion (18.7 %; Ni, As, Co, P, Mo, and Cr), vehicular/resuspended dust (5.6 %; Al, Ti, and Fe), and waste processing (5.1 %; Zn, Cd, Pb, Mn, and Cu). The dominant contribution of aged aerosol to water-soluble mass contradicts the expectation that locally produced sources in polluted cities should drown out the signal of transported aerosol from distant upwind areas.
Although the current study focuses exclusively on the SWM season in Metro Manila, results of this study are applicable to the study of aerosol impacts on Southeast Asia and other regions. First, the detection of aged aerosol not only from regional but also distant sources confirms previous studies that PM in the region has the ability to travel long distances during the SWM season. Therefore, characterization of aerosol in Metro Manila is important for better understanding the impacts that local emissions will have on locations downwind of Metro Manila, including other populated cities in Southeast and East Asia. Transport of pollution and decreased wet scavenging during the SWM season may become increasingly important as studies have shown a decrease in SWM rainfall and an increase in the number of no-rain days during the SWM season in the western Philippines in recent decades (e.g., Cruz et al., 2013).
Second, Southeast Asia has been named “one of the most hostile environments on the planet for aerosol remote sensing” (Reid et al., 2013) because of high cloud occurrence. Therefore, space-based remote sensing of aerosol characteristics, such as retrievals of the aerosol optical depth (AOD), in this region are difficult. In situ measurements are critical for the characterization of PM in this region, especially during seasons such as the SWM when clouds are especially prevalent and remote sensing retrievals dependent on clear-sky conditions are lacking.
Third, this study provides a valuable dataset to compare to other regions impacted by monsoons where the impacts of enhanced moisture and rainfall on size-resolved composition are not well understood. As aqueous processing results in enhanced production of water-soluble species (e.g., sulfate and organic acids), it is noteworthy for this monsoonal region that the water-soluble fraction remains low relative to BC and other insoluble components. This has major implications for the hygroscopicity of the regional PM.
Finally, the results of this study will be used to inform future sampling campaigns in this region, including CAMP2Ex planned for the SWM season of 2019 based in the Philippines. As the current MOUDI sampling campaign at the Manila Observatory is expected to extend for a full year, future work will focus on changes in aerosol characteristics and sources on a seasonal basis as well as scavenging processes upwind of the measurement site.
All data used in this work are available upon request.
The supplement related to this article is available online at: https://doi.org/10.5194/acp-19-10675-2019-supplement.
MTC, MOC, JBS, ABM, CS, and AS designed the experiments and all co-authors carried out some aspect of the data collection. MTC, RAB, CS, LM, HD, and AS conducted data analysis and interpretation. MTC and AS prepared the paper with contributions from all co-authors.
The authors declare that they have no conflict of interest.
Melliza Templonuevo Cruz acknowledges support from the Philippine Department of Science and Technology's ASTHRD program. Rachel A. Braun acknowledges support from the ARCS Foundation. Alexander B. MacDonald acknowledges support from the Mexican National Council for Science and Technology (CONACYT). We acknowledge Agilent Technologies for their support, and Shane Snyder's laboratories for the ICP-QQQ data.
This research has been supported by the National Aeronautics and Space Administration (grant no. 80NSSC18K0148).
This paper was edited by Patrick Chuang and reviewed by two anonymous referees.
Adachi, K. and Tainosho, Y.: Characterization of heavy metal particles embedded in tire dust, Environ. Int., 30, 1009–1017, https://doi.org/10.1016/j.envint.2004.04.004, 2004.
Alas, H. D., Müller, T., Birmili, W., Kecorius, S., Cambaliza, M. O., Simpas, J. B., Cayetano, M., Weinhold, K., Vallar, E., Galvez, M. C., and Wiedensohler, A.: Spatial Characterization of Black Carbon Mass Concentration in the Atmosphere of a Southeast Asian Megacity: An Air Quality Case Study for Metro Manila, Philippines, Aerosol. Air Qual. Res., 18, 2301–2317, https://doi.org/10.4209/aaqr.2017.08.0281, 2017.
Allen, H. C., Laux, J. M., Vogt, R., FinlaysonPitts, B. J., and Hemminger, J. C.: Water-induced reorganization of ultrathin nitrate films on NaCl: Implications for the tropospheric chemistry of sea salt particles, J. Phys. Chem., 100, 6371–6375, https://doi.org/10.1021/jp953675a, 1996.
Allen, A. G., Nemitz, E., Shi, J. P., Harrison, R. M., and Greenwood, J. C.: Size distributions of trace metals in atmospheric aerosols in the United Kingdom, Atmos. Environ., 35, 4581–4591, https://doi.org/10.1016/S1352-2310(01)00190-X, 2001.
Almeida, G. P., Bittencourt, A. T., Evangelista, M. S., Vieira-Filho, M. S., and Fornaro, A.: Characterization of aerosol chemical composition from urban pollution in Brazil and its possible impacts on the aerosol hygroscopicity and size distribution, Atmos. Environ., 202, 149–159, https://doi.org/10.1016/j.atmosenv.2019.01.024, 2019.
Anderson, J. R., Aggett, F. J., Buseck, P. R., Germani, M. S., and Shattuck, T. W.: Chemistry of Individual Aerosol-Particles from Chandler, Arizona, an Arid Urban-Environment, Environ. Sci. Technol., 22, 811–818, https://doi.org/10.1021/es00172a011, 1988.
Aswini, A. R., Hegde, P., Nair, P. R., and Aryasree, S.: Seasonal changes in carbonaceous aerosols over a tropical coastal location in response to meteorological processes, Sci. Total Environ., 656, 1261–1279, https://doi.org/10.1016/j.scitotenv.2018.11.366, 2019.
Bagtasa, G., Cayetano, M. G., and Yuan, C.-S.: Seasonal variation and chemical characterization of PM2.5 in northwestern Philippines, Atmos. Chem. Phys., 18, 4965–4980, https://doi.org/10.5194/acp-18-4965-2018, 2018.
Bautista, A. T., Pabroa, P. C. B., Santos, F. L., Racho, J. M. D., and Quirit, L. L.: Carbonaceous particulate matter characterization in an urban and a rural site in the Philippines, Atmos. Pollut. Res., 5, 245–252, https://doi.org/10.5094/Apr.2014.030, 2014.
Begam, G. R., Vachaspati, C. V., Ahammed, Y. N., Kumar, K. R., Reddy, R. R., Sharma, S. K., Saxena, M., and Mandal, T. K.: Seasonal characteristics of water-soluble inorganic ions and carbonaceous aerosols in total suspended particulate matter at a rural semi-arid site, Kadapa (India), Environ. Sci. Pollut. Res., 24, 1719–1734, https://doi.org/10.1007/s11356-016-7917-1, 2017.
Behera, S. N., Betha, R., Huang, X., and Balasubramanian, R.: Characterization and estimation of human airway deposition of size-resolved particulate-bound trace elements during a recent haze episode in Southeast Asia, Environ. Sci. Pollut. Res., 22, 4265–4280, https://doi.org/10.1007/s11356-014-3645-6, 2015.
Berresheim, H.: Biogenic Sulfur Emissions from the Sub-Antarctic and Antarctic Oceans, J. Geophys. Res.-Atmos., 92, 13245–13262, https://doi.org/10.1029/JD092iD11p13245, 1987.
Braun, R. A., Dadashazar, H., MacDonald, A. B., Aldhaif, A. M., Maudlin, L. C., Crosbie, E., Aghdam, M. A., Mardi, A. H., and Sorooshian, A.: Impact of Wildfire Emissions on Chloride and Bromide Depletion in Marine Aerosol Particles, Environ. Sci. Technol., 51, 9013–9021, https://doi.org/10.1021/acs.est.7b02039, 2017.
Buchholz, B. A. and Landsberger, S.: Trace-Metal Analysis of Size-Fractioned Municipal Solid-Waste Incinerator Fly-Ash and Its Leachates, J. Environ. Sci. Heal. A, 28, 423–441, https://doi.org/10.1080/10934529309375887, 1993.
Burgermeister, S. and Georgii, H. W.: Distribution of Methanesulfonate, Nss Sulfate and Dimethylsulfide over the Atlantic and the North-Sea, Atmos. Environ. A-Gen., 25, 587–595, https://doi.org/10.1016/0960-1686(91)90056-D, 1991.
Chen, Y. Z., Shah, N., Huggins, F. E., and Huffman, G. P.: Microanalysis of ambient particles from Lexington, KY, by electron microscopy, Atmos. Environ., 40, 651–663, https://doi.org/10.1016/j.atmosenv.2005.09.036, 2006.
Chithra, V. S. and Nagendra, S. M. S.: Chemical and morphological characteristics of indoor and outdoor particulate matter in an urban environment, Atmos. Environ., 77, 579–587, https://doi.org/10.1016/j.atmosenv.2013.05.044, 2013.
Chuang, M.-T., Chang, S.-C., Lin, N.-H., Wang, J.-L., Sheu, G.-R., Chang, Y.-J., and Lee, C.-T.: Aerosol chemical properties and related pollutants measured in Dongsha Island in the northern South China Sea during 7-SEAS/Dongsha Experiment, Atmos. Environ., 78, 82–92, https://doi.org/10.1016/j.atmosenv.2012.05.014, 2013.
Clarke, A. D., Shinozuka, Y., Kapustin, V. N., Howell, S., Huebert, B., Doherty, S., Anderson, T., Covert, D., Anderson, J., Hua, X., Moore, K. G., McNaughton, C., Carmichael, G., and Weber, R.: Size distributions and mixtures of dust and black carbon aerosol in Asian outflow: Physiochemistry and optical properties, J. Geophys. Res.-Atmos., 109, D15S09, https://doi.org/10.1029/2003jd004378, 2004.
Coggon, M. M., Sorooshian, A., Wang, Z., Metcalf, A. R., Frossard, A. A., Lin, J. J., Craven, J. S., Nenes, A., Jonsson, H. H., Russell, L. M., Flagan, R. C., and Seinfeld, J. H.: Ship impacts on the marine atmosphere: insights into the contribution of shipping emissions to the properties of marine aerosol and clouds, Atmos. Chem. Phys., 12, 8439–8458, https://doi.org/10.5194/acp-12-8439-2012, 2012.
Cohen, D. D., Stelcer, E., Santos, F. L., Prior, M., Thompson, C., and Pabroa, P. C. B.: Fingerprinting and source apportionment of fine particle pollution in Manila by IBA and PMF techniques: A 7-year study, X-Ray Spectrom, 38, 18–25, https://doi.org/10.1002/xrs.1112, 2009.
Crosbie, E., Sorooshian, A., Monfared, N. A., Shingler, T., and Esmaili, O.: A Multi-Year Aerosol Characterization for the Greater Tehran Area Using Satellite, Surface, and Modeling Data, Atmosphere-Basel, 5, 178–197, https://doi.org/10.3390/atmos5020178, 2014.
Crosbie, E., Youn, J. S., Balch, B., Wonaschutz, A., Shingler, T., Wang, Z., Conant, W. C., Betterton, E. A., and Sorooshian, A.: On the competition among aerosol number, size and composition in predicting CCN variability: a multi-annual field study in an urbanized desert, Atmos. Chem. Phys., 15, 6943–6958, https://doi.org/10.5194/acp-15-6943-2015, 2015.
Cruz, F. T., Narisma, G. T., Villafuerte, M. Q., Chua, K. U. C., and Olaguera, L. M.: A climatological analysis of the southwest monsoon rainfall in the Philippines, Atmos. Res., 122, 609–616, https://doi.org/10.1016/j.atmosres.2012.06.010, 2013.
Csavina, J., Landazuri, A., Wonaschutz, A., Rine, K., Rheinheimer, P., Barbaris, B., Conant, W., Saez, A. E., and Betterton, E. A.: Metal and Metalloid Contaminants in Atmospheric Aerosols from Mining Operations, Water Air Soil Poll., 221, 145–157, https://doi.org/10.1007/s11270-011-0777-x, 2011.
Dasgupta, P. K., Campbell, S. W., Al-Horr, R. S., Ullah, S. M. R., Li, J. Z., Amalfitano, C., and Poor, N. D.: Conversion of sea salt aerosol to NaNO3 and the production of HCl: Analysis of temporal behavior of aerosol chloride/nitrate and gaseous HCl∕HNO3 concentrations with AIM, Atmos. Environ., 41, 4242–4257, https://doi.org/10.1016/j.atmosenv.2006.09.054, 2007.
Dumanoglu, Y., Kara, M., Altiok, H., Odabasi, M., Elbir, T., and Bayram, A.: Spatial and seasonal variation and source apportionment of volatile organic compounds (VOCs) in a heavily industrialized region, Atmos. Environ., 98, 168–178, https://doi.org/10.1016/j.atmosenv.2014.08.048, 2014.
Ervens, B., Sorooshian, A., Aldhaif, A. M., Shingler, T., Crosbie, E., Ziemba, L., Campuzano-Jost, P., Jimenez, J. L., and Wisthaler, A.: Is there an aerosol signature of chemical cloud processing?, Atmos. Chem. Phys., 18, 16099–16119, https://doi.org/10.5194/acp-18-16099-2018, 2018.
Facchini, M. C., Decesari, S., Rinaldi, M., Carbone, C., Finessi, E., Mircea, M., Fuzzi, S., Moretti, F., Tagliavini, E., Ceburnis, D., and O'Dowd, C. D.: Important Source of Marine Secondary Organic Aerosol from Biogenic Amines, Environ. Sci. Technol., 42, 9116–9121, https://doi.org/10.1021/es8018385, 2008.
Farren, N. J., Dunmore, R. E., Mead, M. I., Mohd Nadzir, M. S., Samah, A. A., Phang, S. M., Bandy, B. J., Sturges, W. T., and Hamilton, J. F.: Chemical characterisation of water-soluble ions in atmospheric particulate matter on the east coast of Peninsular Malaysia, Atmos. Chem. Phys., 19, 1537–1553, https://doi.org/10.5194/acp-19-1537-2019, 2019.
Fitzgerald, J. W.: Marine Aerosols – a Review, Atmos. Environ. A-Gen., 25, 533–545, https://doi.org/10.1016/0960-1686(91)90050-H, 1991.
Fraser, M. P., Cass, G. R., and Simoneit, B. R. T.: Air quality model evaluation data for organic, 6. C-3-C-24 organic acids, Environ. Sci. Technol., 37, 446–453, https://doi.org/10.1021/es0209262, 2003.
Fu, P. Q., Kawamura, K., Chen, J., Li, J., Sun, Y. L., Liu, Y., Tachibana, E., Aggarwal, S. G., Okuzawa, K., Tanimoto, H., Kanaya, Y., and Wang, Z. F.: Diurnal variations of organic molecular tracers and stable carbon isotopic composition in atmospheric aerosols over Mt. Tai in the North China Plain: an influence of biomass burning, Atmos. Chem. Phys., 12, 8359–8375, https://doi.org/10.5194/acp-12-8359-2012, 2012.
Fujimori, T., Takigami, H., Agusa, T., Eguchi, A., Bekki, K., Yoshida, A., Terazono, A., and Ballesteros, F. C.: Impact of metals in surface matrices from formal and informal electronic-waste recycling around Metro Manila, the Philippines, and intra-Asian comparison, J. Hazard Mater., 221/222, 139–146, https://doi.org/10.1016/j.jhazmat.2012.04.019, 2012.
Ge, X. L., Wexler, A. S., and Clegg, S. L.: Atmospheric amines – Part I. A review, Atmos. Environ., 45, 524–546, https://doi.org/10.1016/j.atmosenv.2010.10.012, 2011.
Gietl, J. K., Lawrence, R., Thorpe, A. J., and Harrison, R. M.: Identification of brake wear particles and derivation of a quantitative tracer for brake dust at a major road, Atmos. Environ., 44, 141–146, https://doi.org/10.1016/j.atmosenv.2009.10.016, 2010.
Gullett, B. K., Linak, W. P., Touati, A., Wasson, S. J., Gatica, S., and King, C. J.: Characterization of air emissions and residual ash from open burning of electronic wastes during simulated rudimentary recycling operations, J. Mater. Cycles Waste, 9, 69–79, https://doi.org/10.1007/s10163-006-0161-x, 2007.
Harrison, R. M., Beddows, D. C. S., and Dall'Osto, M.: PMF Analysis of Wide-Range Particle Size Spectra Collected on a Major Highway, Environ. Sci. Technol., 45, 5522–5528, https://doi.org/10.1021/es2006622, 2011.
Harrison, R. M., Jones, A. M., Gietl, J., Yin, J. X., and Green, D. C.: Estimation of the Contributions of Brake Dust, Tire Wear, and Resuspension to Nonexhaust Traffic Particles Derived from Atmospheric Measurements, Environ. Sci. Technol., 46, 6523–6529, https://doi.org/10.1021/es300894r, 2012.
Hitzenberger, R. and Tohno, S.: Comparison of black carbon (BC) aerosols in two urban areas – concentrations and size distributions, Atmos. Environ., 35, 2153–2167, https://doi.org/10.1016/S1352-2310(00)00480-5, 2001.
Hopke, P. K., Cohen, D. D., Begum, B. A., Biswas, S. K., Ni, B., Pandit, G. G., Santoso, M., Chung, Y. S., Davy, P., Markwitz, A., Waheed, S., Siddique, N., Santos, F. L., Pabroa, P. C. B., Seneviratne, M. C. S., Wimolwattanapun, W., Bunprapob, S., Vuong, T. B., Duy Hien, P., and Markowicz, A.: Urban air quality in the Asian region, Sci. Total Environ., 404, 103–112, https://doi.org/10.1016/j.scitotenv.2008.05.039, 2008.
Huang, S. L., Rahn, K. A., and Arimoto, R.: Testing and optimizing two factor-analysis techniques on aerosol at Narragansett, Rhode Island, Atmos. Environ., 33, 2169–2185, https://doi.org/10.1016/S1352-2310(98)00324-0, 1999.
Iijima, A., Sato, K., Yano, K., Tago, H., Kato, M., Kimura, H., and Furuta, N.: Particle size and composition distribution analysis of automotive brake abrasion dusts for the evaluation of antimony sources of airborne particulate matter, Atmos. Environ., 41, 4908–4919, https://doi.org/10.1016/j.atmosenv.2007.02.005, 2007.
Kahnert, M., Nousiainen, T., and Veihelmann, B.: Spherical and spheroidal model particles as an error source in aerosol climate forcing and radiance computations: A case study for feldspar aerosols, J. Geophys. Res.-Atmos., 110, D18S13, https://doi.org/10.1029/2004jd005558, 2005.
Kautzman, K. E., Surratt, J. D., Chan, M. N., Chan, A. W. H., Hersey, S. P., Chhabra, P. S., Dalleska, N. F., Wennberg, P. O., Flagan, R. C., and Seinfeld, J. H.: Chemical Composition of Gas- and Aerosol-Phase Products from the Photooxidation of Naphthalene, J. Phys. Chem. A, 114, 913–934, https://doi.org/10.1021/jp908530s, 2010.
Kawamura, K. and Ikushima, K.: Seasonal-Changes in the Distribution of Dicarboxylic-Acids in the Urban Atmosphere, Environ. Sci. Technol., 27, 2227–2235, https://doi.org/10.1021/es00047a033, 1993.
Kawamura, K. and Kaplan, I. R.: Motor Exhaust Emissions as a Primary Source for Dicarboxylic-Acids in Los-Angeles Ambient Air, Environ. Sci. Technol., 21, 105–110, https://doi.org/10.1021/es00155a014, 1987.
Kawamura, K. and Sakaguchi, F.: Molecular distributions of water soluble dicarboxylic acids in marine aerosols over the Pacific Ocean including tropics, J. Geophys. Res.-Atmos., 104, 3501–3509, https://doi.org/10.1029/1998jd100041, 1999.
Kecorius, S., Madueño, L., Löndahl, J., Vallar, E., Galvez, M. C., Idolor, L. F., Gonzaga-Cayetano, M., Müller, T., Birmili, W., and Wiedensohler, A.: Respiratory tract deposition of inhaled roadside ultrafine refractory particles in a polluted megacity of South-East Asia, Sci. Total Environ., 663, 265–274, https://doi.org/10.1016/j.scitotenv.2019.01.338, 2019.
Kecorius, S., Madueno, L., Vallar, E., Alas, H., Betito, G., Birmili, W., Cambaliza, M. O., Catipay, G., Gonzaga-Cayetano, M., Galvez, M. C., Lorenzo, G., Muller, T., Simpas, J. B., Tamayo, E. G., and Wiedensohler, A.: Aerosol particle mixing state, refractory particle number size distributions and emission factors in a polluted urban environment: Case study of Metro Manila, Philippines, Atmos. Environ., 170, 169–183, https://doi.org/10.1016/j.atmosenv.2017.09.037, 2017.
Keshtkar, H. and Ashbaugh, L. L.: Size distribution of polycyclic aromatic hydrocarbon particulate emission factors from agricultural burning, Atmos. Environ., 41, 2729–2739, https://doi.org/10.1016/j.atmosenv.2006.11.043, 2007.
Kim Oanh, N. T., Upadhyay, N., Zhuang, Y. H., Hao, Z. P., Murthy, D. V. S., Lestari, P., Villarin, J. T., Chengchua, K., Co, H. X., Dung, N. T., and Lindgren, E. S.: Particulate air pollution in six Asian cities: Spatial and temporal distributions, and associated sources, Atmos. Environ., 40, 3367–3380, https://doi.org/10.1016/j.atmosenv.2006.01.050, 2006.
Kim Oanh, N. T., Pongkiatkul, P., Cruz, M. T., Trung Dung, N., Phillip, L., Zhang, G., and Lestari, P.: Monitoring and Source Apportionment for Particulate Matter Pollution in Six Asian Cities, in: Integrated Air Quality Management: Asian Case Studies, edited by: Kim Oanh, N. T., CRC Press, Taylor & Francis Group, USA, 97–124, 2013.
Kleindienst, T. E., Jaoui, M., Lewandowski, M., Offenberg, J. H., and Docherty, K. S.: The formation of SOA and chemical tracer compounds from the photooxidation of naphthalene and its methyl analogs in the presence and absence of nitrogen oxides, Atmos. Chem. Phys., 12, 8711–8726, https://doi.org/10.5194/acp-12-8711-2012, 2012.
Liao, H., Chen, W. T., and Seinfeld, J. H.: Role of climate change in global predictions of future tropospheric ozone and aerosols, J. Geophys. Res.-Atmos., 111, D12304, https://doi.org/10.1029/2005jd006852, 2006.
Lin, C. C., Chen, S. J., Huang, K. L., Hwang, W. I., Chang-Chien, G. P., and Lin, W. Y.: Characteristics of metals in nano/ultrafine/fine/coarse particles collected beside a heavily trafficked road, Environ. Sci. Technol., 39, 8113–8122, https://doi.org/10.1021/es048182a, 2005.
Linak, W. P. and Miller, C. A.: Comparison of particle size distributions and elemental partitioning from the combustion of pulverized coal and residual fuel oil, J. Air Waste Manage., 50, 1532–1544, https://doi.org/10.1080/10473289.2000.10464171, 2000.
Ma, Y., Li, S., Zheng, J., Khalizov, A., Wang, X., Wang, Z., and Zhou, Y.: Size-resolved measurements of mixing state and cloud-nucleating ability of aerosols in Nanjing, China, J. Geophys. Res.-Atmos., 122, 9430–9450, https://doi.org/10.1002/2017jd026583, 2017.
Ma, L., Dadashazar, D., Braun, R. A., MacDonald, A. B., Aghdam, M. A., Maudlin, L. C., and Sorooshian, A.: Size-resolved characteristics of water-soluble particulate elements in a coastal area: Source identification, influence of wildfires, and diurnal variability, Atmos. Environ., 206, 72–84, https://doi.org/10.1016/j.atmosenv.2019.02.045, 2019.
Mahowald, N., Jickells, T. D., Baker, A. R., Artaxo, P., Benitez-Nelson, C. R., Bergametti, G., Bond, T. C., Chen, Y., Cohen, D. D., Herut, B., Kubilay, N., Losno, R., Luo, C., Maenhaut, W., McGee, K. A., Okin, G. S., Siefert, R. L., and Tsukuda, S.: Global distribution of atmospheric phosphorus sources, concentrations and deposition rates, and anthropogenic impacts, Global Biogeochem. Cy., 22, GB4026, https://doi.org/10.1029/2008gb003240, 2008.
Marple, V., Olson, B., Romay, F., Hudak, G., Geerts, S. M., and Lundgren, D.: Second generation micro-orifice uniform deposit impactor, 120 MOUDI-II: Design, Evaluation, and application to long-term ambient sampling, Aerosol Sci. Technol., 48, 427–433, https://doi.org/10.1080/02786826.2014.884274, 2014.
Martens, C. S., Wesolowski, J. J., Harriss, R. C., and Kaifer, R.: Chlorine Loss from Puerto-Rican and San-Francisco-Bay Area Marine Aerosols, J. Geophys. Res., 78, 8778–8792, https://doi.org/10.1029/JC078i036p08778, 1973.
Maudlin, L. C., Wang, Z., Jonsson, H. H., and Sorooshian, A.: Impact of wildfires on size-resolved aerosol composition at a coastal California site, Atmos. Environ., 119, 59–68, https://doi.org/10.1016/j.atmosenv.2015.08.039, 2015.
Metcalf, A. R., Craven, J. S., Ensberg, J. J., Brioude, J., Angevine, W., Sorooshian, A., Duong, H. T., Jonsson, H. H., Flagan, R. C., and Seinfeld, J. H.: Black carbon aerosol over the Los Angeles Basin during CalNex, J. Geophys. Res.-Atmos., 117, D00V13, https://doi.org/10.1029/2011jd017255, 2012.
Mielonen, T., Levy, R. C., Aaltonen, V., Komppula, M., de Leeuw, G., Huttunen, J., Lihavainen, H., Kolmonen, P., Lehtinen, K. E. J., and Arola, A.: Evaluating the assumptions of surface reflectance and aerosol type selection within the MODIS aerosol retrieval over land: the problem of dust type selection, Atmos. Meas. Tech., 4, 201–214, https://doi.org/10.5194/amt-4-201-2011, 2011.
Miller, J. and Miller, J. C.: Statistics and chemometrics for analytical chemistry, Pearson Education, 312 pp., 2018.
Mishra, S. K., Agnihotri, R., Yadav, P. K., Singh, S., Prasad, M. V. S. N., Praveen, P. S., Tawale, J. S., Rashmi, Mishra, N. D., Arya, B. C., and Sharma, C.: Morphology of Atmospheric Particles over Semi-Arid Region (Jaipur, Rajasthan) of India: Implications for Optical Properties, Aerosol Air Qual. Res., 15, 974–984, https://doi.org/10.4209/aaqr.2014.10.0244, 2015.
Mooibroek, D., Schaap, M., Weijers, E. P., and Hoogerbrugge, R.: Source apportionment and spatial variability of PM2.5 using measurements at five sites in the Netherlands, Atmos. Environ., 45, 4180–4191, https://doi.org/10.1016/j.atmosenv.2011.05.017, 2011.
Mosier, A. R., Andre, C. E., and Viets, F. G.: Identification of Aliphatic-Amines Volatilized from Cattle Feedyard, Environ. Sci. Technol., 7, 642–644, https://doi.org/10.1021/es60079a009, 1973.
Müller, C., Iinuma, Y., Karstensen, J., van Pinxteren, D., Lehmann, S., Gnauk, T., and Herrmann, H.: Seasonal variation of aliphatic amines in marine sub-micrometer particles at the Cape Verde islands, Atmos. Chem. Phys., 9, 9587–9597, https://doi.org/10.5194/acp-9-9587-2009, 2009.
Murphy, S. M., Agrawal, H., Sorooshian, A., Padro, L. T., Gates, H., Hersey, S., Welch, W. A., Jung, H., Miller, J. W., Cocker, D. R., Nenes, A., Jonsson, H. H., Flagan, R. C., and Seinfeld, J. H.: Comprehensive Simultaneous Shipboard and Airborne Characterization of Exhaust from a Modern Container Ship at Sea, Environ. Sci. Technol., 43, 4626–4640, https://doi.org/10.1021/es802413j, 2009.
Norris, G., Duvall, R., Brown, S., and Bai, S.: EPA Positive Matrix Factorization (PMF) 5.0 fundamentals and User Guide Prepared for the US Environmental Protection Agency Office of Research and Development, Washington, DC. Inc., Petaluma, 124 pp., 2014.
Nriagu, J. O.: A Global Assessment of Natural Sources of Atmospheric Trace-Metals, Nature, 338, 47–49, https://doi.org/10.1038/338047a0, 1989.
Pabroa, P. C. B., Santos, F. L., Morco, R. P., Racho, J. M. D., Bautista, A. T., and Bucal, C. G. D.: Receptor modeling studies for the characterization of air particulate lead pollution sources in Valenzuela sampling site (Philippines), Atmos. Pollut. Res., 2, 213–218, https://doi.org/10.5094/Apr.2011.027, 2011.
Philippine Statistics Authority: available at: https://psa.gov.ph/, last access: 28 August 2018.
Polissar, A., Hopke, P., Paatero, P., Malm, W., and Sisler, J.: Atmospheric aerosol over Alaska 2, Elemental composition and sources, J. Geophys. Res., 103, 19045–19057, 1998.
Prabhakar, G., Ervens, B., Wang, Z., Maudlin, L. C., Coggon, M. M., Jonsson, H. H., Seinfeld, J. H., and Sorooshian, A.: Sources of nitrate in stratocumulus cloud water: Airborne measurements during the 2011 E-PEACE and 2013 NiCE studies, Atmos. Environ., 97, 166–173, https://doi.org/10.1016/j.atmosenv.2014.08.019, 2014a.
Prabhakar, G., Sorooshian, A., Toffol, E., Arellano, A. F., and Betterton, E. A.: Spatiotemporal distribution of airborne particulate metals and metalloids in a populated arid region, Atmos. Environ., 92, 339–347, https://doi.org/10.1016/j.atmosenv.2014.04.044, 2014b.
Qu, W. J., Wang, J., Zhang, X. Y., Wang, D., and Sheng, L. F.: Influence of relative humidity on aerosol composition: Impacts on light extinction and visibility impairment at two sites in coastal area of China, Atmos. Res., 153, 500–511, https://doi.org/10.1016/j.atmosres.2014.10.009, 2015.
Raatikainen, T., Brus, D., Hyvärinen, A. P., Svensson, J., Asmi, E., and Lihavainen, H.: Black carbon concentrations and mixing state in the Finnish Arctic, Atmos. Chem. Phys., 15, 10057–10070, https://doi.org/10.5194/acp-15-10057-2015, 2015.
Ramachandran, S. and Rajesh, T. A.: Black carbon aerosol mass concentrations over Ahmedabad, an urban location in western India: Comparison with urban sites in Asia, Europe, Canada, and the United States, J. Geophys. Res.-Atmos., 112, D06211, https://doi.org/10.1029/2006jd007488, 2007.
Ran, L., Deng, Z. Z., Wang, P. C., and Xia, X. A.: Black carbon and wavelength-dependent aerosol absorption in the North China Plain based on two-year aethalometer measurements, Atmos. Environ., 142, 132–144, https://doi.org/10.1016/j.atmosenv.2016.07.014, 2016.
Reddington, C. L., McMeeking, G., Mann, G. W., Coe, H., Frontoso, M. G., Liu, D., Flynn, M., Spracklen, D. V., and Carslaw, K. S.: The mass and number size distributions of black carbon aerosol over Europe, Atmos. Chem. Phys., 13, 4917–4939, https://doi.org/10.5194/acp-13-4917-2013, 2013.
Reff, A., Eberly, S. I., and Bhave, P. V.: Receptor modeling of ambient particulate matter data using positive matrix factorization: Review of existing methods, J. Air Waste Manage., 57, 146–154, 2007.
Reid, J. S., Xian, P., Hyer, E. J., Flatau, M. K., Ramirez, E. M., Turk, F. J., Sampson, C. R., Zhang, C., Fukada, E. M., and Maloney, E. D.: Multi-scale meteorological conceptual analysis of observed active fire hotspot activity and smoke optical depth in the Maritime Continent, Atmos. Chem. Phys., 12, 2117–2147, https://doi.org/10.5194/acp-12-2117-2012, 2012.
Reid, J. S., Hyer, E. J., Johnson, R. S., Holben, B. N., Yokelson, R. J., Zhang, J. L., Campbell, J. R., Christopher, S. A., Di Girolamo, L., Giglio, L., Holz, R. E., Kearney, C., Miettinen, J., Reid, E. A., Turk, F. J., Wang, J., Xian, P., Zhao, G. Y., Balasubramanian, R., Chew, B. N., Janjai, S., Lagrosas, N., Lestari, P., Lin, N. H., Mahmud, M., Nguyen, A. X., Norris, B., Oanh, N. T. K., Oo, M., Salinas, S. V., Welton, E. J., and Liew, S. C.: Observing and understanding the Southeast Asian aerosol system by remote sensing: An initial review and analysis for the Seven Southeast Asian Studies (7SEAS) program, Atmos. Res., 122, 403–468, https://doi.org/10.1016/j.atmosres.2012.06.005, 2013.
Reid, J. S., Xian, P., Holben, B. N., Hyer, E. J., Reid, E. A., Salinas, S. V., Zhang, J. L., Campbell, J. R., Chew, B. N., Holz, R. E., Kuciauskas, A. P., Lagrosas, N., Posselt, D. J., Sampson, C. R., Walker, A. L., Welton, E. J., and Zhang, C. D.: Aerosol meteorology of the Maritime Continent for the 2012 7SEAS southwest monsoon intensive study – Part 1: regional-scale phenomena, Atmos. Chem. Phys., 16, 14041–14056, https://doi.org/10.5194/acp-16-14041-2016, 2016a.
Reid, J. S., Lagrosas, N. D., Jonsson, H. H., Reid, E. A., Atwood, S. A., Boyd, T. J., Ghate, V. P., Xian, P., Posselt, D. J., Simpas, J. B., Uy, S. N., Zaiger, K., Blake, D. R., Bucholtz, A., Campbell, J. R., Chew, B. N., Cliff, S. S., Holben, B. N., Holz, R. E., Hyer, E. J., Kreidenweis, S. M., Kuciauskas, A. P., Lolli, S., Oo, M., Perry, K. D., Salinas, S. V., Sessions, W. R., Smirnov, A., Walker, A. L., Wang, Q., Yu, L. Y., Zhang, J. L., and Zhao, Y. J.: Aerosol meteorology of Maritime Continent for the 2012 7SEAS southwest monsoon intensive study – Part 2: Philippine receptor observations of fine-scale aerosol behavior, Atmos. Chem. Phys., 16, 14057–14078, https://doi.org/10.5194/acp-16-14057-2016, 2016b.
Rocha, L. D. S. and Correa, S. M.: Determination of size-segregated elements in diesel-biodiesel blend exhaust emissions, Environ. Sci. Pollut. Res., 25, 18121–18129, https://doi.org/10.1007/s11356-018-1980-8, 2018.
Rogge, W. F., Mazurek, M. A., Hildemann, L. M., Cass, G. R., and Simoneit, B. R. T.: Quantification of Urban Organic Aerosols at a Molecular-Level – Identification, Abundance and Seasonal-Variation, Atmos. Environ. A-Gen., 27, 1309–1330, https://doi.org/10.1016/0960-1686(93)90257-Y, 1993.
Ro, C. U., Oh, K. Y., Kim, H., Kim, Y. P., Lee, C. B., Kim, K. H., Kang, C. H., Osan, J., De Hoog, J., Worobiec, A., and Van Grieken, R.: Single-particle analysis of aerosols at Cheju Island, Korea, using low-Z electron probe X-ray microanalysis: A direct proof of nitrate formation from sea salts, Environ. Sci. Technol., 35, 4487–4494, https://doi.org/10.1021/es0155231, 2001.
Rolph, G. D.: Real-time Environmental Applications and Display sYstem (READY) website (http://ready.Arl.NOAA.Gov, last access: 5 February 2019), NOAA Air Resour. Lab., Silver Spring, Md., 2016.
Roth, B. and Okada, K.: On the modification of sea-salt particles in the coastal atmosphere, Atmos. Environ., 32, 1555–1569, https://doi.org/10.1016/S1352-2310(97)00378-6, 1998.
Saltzman, E. S., Savoie, D. L., Zika, R. G., and Prospero, J. M.: Methane Sulfonic-Acid in the Marine Atmosphere, J. Geophys. Res.-Ocean., 88, 897–902, https://doi.org/10.1029/JC088iC15p10897, 1983.
Saltzman, E. S., Savoie, D. L., Prospero, J. M., and Zika, R. G.: Methanesulfonic-Acid and Non-Sea-Salt Sulfate in Pacific Air – Regional and Seasonal-Variations, J. Atmos. Chem., 4, 227–240, https://doi.org/10.1007/Bf00052002, 1986.
Schade, G. W. and Crutzen, P. J.: Emission of Aliphatic-Amines from Animal Husbandry and Their Reactions – Potential Source of N2O and HCN, J. Atmos. Chem., 22, 319–346, https://doi.org/10.1007/Bf00696641, 1995.
Schlosser, J. S., Braun, R. A., Bradley, T., Dadashazar, H., MacDonald, A. B., Aldhaif, A. M., Aghdam, M. A., Mardi, A. H.., Xian, P., and Sorooshian, A.: Analysis of Aerosol Composition Data for Western United States Wildfires Between 2005–2015: Dust Emissions, Chloride Depletion, and Most Enhanced Aerosol Constituents, J. Geophys. Res., 122, 8951–8966, https://doi.org/10.1002/2017JD026547, 2017.
Schwarz, J. P., Gao, R. S., Spackman, J. R., Watts, L. A., Thomson, D. S., Fahey, D. W., Ryerson, T. B., Peischl, J., Holloway, J. S., Trainer, M., Frost, G. J., Baynard, T., Lack, D. A., de Gouw, J. A., Warneke, C., and Del Negro, L. A.: Measurement of the mixing state, mass, and optical size of individual black carbon particles in urban and biomass burning emissions, Geophys. Res. Lett., 35, L13810, https://doi.org/10.1029/2008gl033968, 2008.
Seinfeld, J. H. and Pandis, S. N.: Atmospheric chemistry and physics, 3rd Edn., New York, Wiley-Interscience, 1152 pp., 2016.
Shafer, M. M., Toner, B. M., Oyerdier, J. T., Schauer, J. J., Fakra, S. C., Hu, S. H., Herner, J. D., and Ayala, A.: Chemical Speciation of Vanadium in Particulate Matter Emitted from Diesel Vehicles and Urban Atmospheric Aerosols, Environ. Sci. Technol., 46, 189–195, https://doi.org/10.1021/es200463c, 2012.
Shingler, T., Sorooshian, A., Ortega, A., Crosbie, E., Wonaschutz, A., Perring, A. E., Beyersdorf, A., Ziemba, L., Jimenez, J. L., Campuzano-Jost, P., Mikoviny, T., Wisthaler, A., and Russell, L. M.: Ambient observations of hygroscopic growth factor and f(RH) below 1: Case studies from surface and airborne measurements, J. Geophys. Res.-Atmos., 121, 13661–13677, https://doi.org/10.1002/2016jd025471, 2016.
Shiraiwa, M., Kondo, Y., Moteki, N., Takegawa, N., Sahu, L. K., Takami, A., Hatakeyama, S., Yonemura, S., and Blake, D. R.: Radiative impact of mixing state of black carbon aerosol in Asian outflow, J. Geophys. Res.-Atmos., 113, D24210, https://doi.org/10.1029/2008jd010546, 2008.
Simpas, J., Lorenzo, G., and Cruz, M. T.: Monitoring Particulate Matter Levels and Composition for Source Apportionment Study in Metro Manila, Philippines, in: Improving Air Quality in Asian Developing Countries: Compilation of Research Findings, edited by: Kim Oanh, N. T., NARENCA, Vietnam Publishing House of Natural Resources, Environment and Cartography, Vietnam, 239–261, 2014.
Singh, M., Jaques, P. A., and Sioutas, C.: Size distribution and diurnal characteristics of particle-bound metals in source and receptor sites of the Los Angeles Basin, Atmos. Environ., 36, 1675–1689, https://doi.org/10.1016/S1352-2310(02)00166-8, 2002.
Song, F. and Gao, Y.: Size distributions of trace elements associated with ambient particular matter in the affinity of a major highway in the New Jersey-New York metropolitan area, Atmos. Environ., 45, 6714–6723, https://doi.org/10.1016/j.atmosenv.2011.08.031, 2011.
Sorooshian, A., Ng, N. L., Chan, A. W. H., Feingold, G., Flagan, R. C., and Seinfeld, J. H.: Particulate organic acids and overall water-soluble aerosol composition measurements from the 2006 Gulf of Mexico Atmospheric Composition and Climate Study (GoMACCS), J. Geophys. Res.-Atmos., 112, D13201, https://doi.org/10.1029/2007jd008537, 2007.
Sorooshian, A., Murphy, S. N., Hersey, S., Gates, H., Padro, L. T., Nenes, A., Brechtel, F. J., Jonsson, H., Flagan, R. C., and Seinfeld, J. H.: Comprehensive airborne characterization of aerosol from a major bovine source, Atmos. Chem. Phys., 8, 5489–5520, https://doi.org/10.5194/acp-8-5489-2008, 2008.
Sorooshian, A., Padro, L. T., Nenes, A., Feingold, G., McComiskey, A., Hersey, S. P., Gates, H., Jonsson, H. H., Miller, S. D., Stephens, G. L., Flagan, R. C., and Seinfeld, J. H.: On the link between ocean biota emissions, aerosol, and maritime clouds: Airborne, ground, and satellite measurements off the coast of California, Global Biogeochem. Cy., 23, GB4007, https://doi.org/10.1029/2009gb003464, 2009.
Sorooshian, A., Crosbie, E., Maudlin, L. C., Youn, J. S., Wang, Z., Shingler, T., Ortega, A. M., Hersey, S., and Woods, R. K.: Surface and airborne measurements of organosulfur and methanesulfonate over the western United States and coastal areas, J. Geophys. Res.-Atmos., 120, 8535–8548, https://doi.org/10.1002/2015jd023822, 2015.
Stein, A. F., Draxler, R. R., Rolph, G. D., Stunder, B. J. B., Cohen, M. D., and Ngan, F.: NOAA's Hysplit Atmospheric Transport and Dispersion Modeling System, B. Am. Meteorol. Soc., 96, 2059–2077, https://doi.org/10.1175/Bams-D-14-00110.1, 2015.
Tai, A. P. K., Mickley, L. J., and Jacob, D. J.: Correlations between fine particulate matter (PM2.5) and meteorological variables in the United States: Implications for the sensitivity of PM2.5 to climate change, Atmos. Environ., 44, 3976–3984, https://doi.org/10.1016/j.atmosenv.2010.06.060, 2010.
Tsakalou, C., Papamarkou, S., Tsakiridis, P. E., Bartzas, G., and Tsakalakis, K.: Characterization and leachability evaluation of medical wastes incineration fly and bottom ashes and their vitrification outgrowths, J. Environ. Chem. Eng., 6, 367–376, https://doi.org/10.1016/j.jece.2017.12.012, 2018.
US Environmental Protection Agency: Monitoring PM2.5 in Ambient Air Using Designated Reference or Class I Equivalent Methods, Report No. EPA-454/B-16-001, US Environmental Protection Agency, Research Triangle Park, NC, 174 pp., 2016.
VandenBoer, T. C., Petroff, A., Markovic, M. Z., and Murphy, J. G.: Size distribution of alkyl amines in continental particulate matter and their online detection in the gas and particle phase, Atmos. Chem. Phys., 11, 4319–4332, https://doi.org/10.5194/acp-11-4319-2011, 2011.
Villafuerte, M. Q., Matsumoto, J., Akasaka, I., Takahashi, H. G., Kubota, H., and Cinco, T. A.: Long-term trends and variability of rainfall extremes in the Philippines, Atmos. Res., 137, 1–13, https://doi.org/10.1016/j.atmosres.2013.09.021, 2014.
Vossler, T., Cernikovsky, L., Novak, J., and Williams, R.: Source apportionment with uncertainty estimates of fine particulate matter in Ostrava, Czech Republic using Positive Matrix Factorization, Atmos. Pollut. Res., 7, 503–512, https://doi.org/10.1016/j.apr.2015.12.004, 2016.
Wang, J., Ge, C., Yang, Z. F., Hyer, E. J., Reid, J. S., Chew, B. N., Mahmud, M., Zhang, Y. X., and Zhang, M. G.: Mesoscale modeling of smoke transport over the Southeast Asian Maritime Continent: Interplay of sea breeze, trade wind, typhoon, and topography, Atmos. Res., 122, 486–503, https://doi.org/10.1016/j.atmosres.2012.05.009, 2013.
Wang, Y. Q., Zhang, X. Y., and Draxler, R. R.: TrajStat: GIS-based software that uses various trajectory statistical analysis methods to identify potential sources from long-term air pollution measurement data, Environ. Modell. Softw., 24, 938–939, https://doi.org/10.1016/j.envsoft.2009.01.004, 2009.
Wasson, S. J., Linak, W. P., Gullett, B. K., King, C. J., Touati, A., Huggins, F. E., Chen, Y. Z., Shah, N., and Huffman, G. P.: Emissions of chromium, copper, arsenic, and PCDDs/Fs from open burning of CCA-treated wood, Environ. Sci. Technol., 39, 8865–8876, https://doi.org/10.1021/es050891g, 2005.
Watson, J. G.: Protocol for Applying and Validating the CMB Model for PM2.5 and VOC, Report No. EPA-451/R-04-001, US Environmental Protection Agency, Research Triangle Park, NC, 173 pp., 2004.
Watts, S. F., Watson, A., and Brimblecombe, P.: Measurements of the Aerosol Concentrations of Methanesulfonic Acid, Dimethyl-Sulfoxide and Dimethyl Sulfone in the Marine Atmosphere of the British-Isles, Atmos. Environ., 21, 2667–2672, https://doi.org/10.1016/0004-6981(87)90198-3, 1987.
Wonaschuetz, A., Sorooshian, A., Ervens, B., Chuang, P. Y., Feingold, G., Murphy, S. M., de Gouw, J., Warneke, C., and Jonsson, H. H.: Aerosol and gas re-distribution by shallow cumulus clouds: An investigation using airborne measurements, J. Geophys. Res.-Atmos., 117, D17202, https://doi.org/10.1029/2012jd018089, 2012.
Wu, D., Zhang, F., Lou, W. H., Li, D., and Chen, J. M.: Chemical characterization and toxicity assessment of fine particulate matters emitted from the combustion of petrol and diesel fuels, Sci. Total Environ., 605, 172–179, https://doi.org/10.1016/j.scitotenv.2017.06.058, 2017.
Xian, P., Reid, J. S., Atwood, S. A., Johnson, R. S., Hyer, E. J., Westphal, D. L., and Sessions, W.: Smoke aerosol transport patterns over the Maritime Continent, Atmos. Res., 122, 469–485, https://doi.org/10.1016/j.atmosres.2012.05.006, 2013.
Xu, G. J. and Gao, Y.: Characterization of marine aerosols and precipitation through shipboard observations on the transect between 31∘ N–32∘ S in the West Pacific, Atmos. Pollut. Res., 6, 154–161, https://doi.org/10.5094/Apr.2015.018, 2015.
Yao, X. H., Fang, M., and Chan, C. K.: The size dependence of chloride depletion in fine and coarse sea-salt particles, Atmos. Environ., 37, 743–751, https://doi.org/10.1016/S1352-2310(02)00955-X, 2003.
Youn, J. S., Wang, Z., Wonaschutz, A., Arellano, A., Betterton, E. A., and Sorooshian, A.: Evidence of aqueous secondary organic aerosol formation from biogenic emissions in the North American Sonoran Desert, Geophys. Res. Lett., 40, 3468–3472, https://doi.org/10.1002/grl.50644, 2013.
Youn, J. S., Crosbie, E., Maudlin, L. C., Wang, Z., and Sorooshian, A.: Dimethylamine as a major alkyl amine species in particles and cloud water: Observations in semi-arid and coastal regions, Atmos. Environ., 122, 250–258, https://doi.org/10.1016/j.atmosenv.2015.09.061, 2015.
Youn, J. S., Csavina, J., Rine, K. P., Shingler, T., Taylor, M. P., Saez, A. E., Betterton, E. A., and Sorooshian, A.: Hygroscopic Properties and Respiratory System Deposition Behavior of Particulate Matter Emitted By Mining and Smelting Operations, Environ. Sci. Technol., 50, 11706–11713, https://doi.org/10.1021/acs.est.6b03621, 2016.