the Creative Commons Attribution 4.0 License.
the Creative Commons Attribution 4.0 License.
Aerosol sources in the western Mediterranean during summertime: a model-based approach
Mounir Chrit
Karine Sartelet
Jean Sciare
Jorge Pey
José B. Nicolas
Nicolas Marchand
Evelyn Freney
Karine Sellegri
Matthias Beekmann
François Dulac
In the framework of ChArMEx (the Chemistry-Aerosol Mediterranean Experiment), the air quality model Polyphemus is used to understand the sources of inorganic and organic particles in the western Mediterranean and evaluate the uncertainties linked to the model parameters (meteorological fields, anthropogenic and sea-salt emissions and hypotheses related to the model representation of condensation/evaporation). The model is evaluated by comparisons to in situ aerosol measurements performed during three consecutive summers (2012, 2013 and 2014). The model-to-measurement comparisons concern the concentrations of PM10, PM1, organic matter in PM1 (OM1) and inorganic aerosol concentrations monitored at a remote site (Ersa) on Corsica Island, as well as airborne measurements performed above the western Mediterranean Sea. Organic particles are mostly from biogenic origin. The model parameterization of sea-salt emissions has been shown to strongly influence the concentrations of all particulate species (PM10, PM1, OM1 and inorganic concentrations). Although the emission of organic matter by the sea has been shown to be low, organic concentrations are influenced by sea-salt emissions; this is owing to the fact that they provide a mass onto which gaseous hydrophilic organic compounds can condense. PM10, PM1, OM1 are also very sensitive to meteorology, which affects not only the transport of pollutants but also natural emissions (biogenic and sea salt). To avoid large and unrealistic sea-salt concentrations, a parameterization with an adequate wind speed power law is chosen. Sulfate is shown to be strongly influenced by anthropogenic (ship) emissions. PM10, PM1, OM1 and sulfate concentrations are better described using the emission inventory with the best spatial description of ship emissions (EDGAR-HTAP). However, this is not true for nitrate, ammonium and chloride concentrations, which are very dependent on the hypotheses used in the model regarding condensation/evaporation. Model simulations show that sea-salt aerosols above the sea are not mixed with background transported aerosols. Taking the mixing state of particles with a dynamic approach to condensation/evaporation into account may be necessary to accurately represent inorganic aerosol concentrations.
- Article
(3630 KB) - Full-text XML
- BibTeX
- EndNote
Fine particulate matter (PM) in the atmosphere is of concern due to its effects on health, climate, ecosystems and biological cycles, and visibility. These effects are especially important in the Mediterranean region. The western Mediterranean basin experiences high gaseous pollution levels originating from Europe (Debevec et al., 2017; Doche et al., 2014; Menut et al., 2015; Millán et al., 1997; Nabat et al., 2013; Safieddine et al., 2014) in particular during summer, when photochemical activity is at its maximum. Furthermore, the western Mediterranean basin is impacted by various natural sources: Saharan dust, intense biogenic emissions in summer, oceanic emissions and biomass burning, all of which emit gases (e.g., volatile organic compounds (VOC), nitrogen oxides (NOx)) and/or primary particles (Bossioli et al., 2016; Gerasopoulos et al., 2006; Monks et al., 2009; Tyrlis and Lelieveld, 2012). During the TRAQA 2012 and SAFMED 2013 measurement campaigns, Di Biagio et al. (2015) observed that aerosols in the western Mediterranean basin are strongly impacted by dust outflows and continental pollution. A large part of this continental pollution is secondary, i.e., it is formed in the atmosphere by chemical reactions (Sartelet et al., 2012). These reactions involve compounds, which may be emitted from different sources (e.g., biogenic and anthropogenic). Using measurements and/or modeling, several studies have shown that as much as 70 to 80 % of organic aerosol in summer in the western Mediterranean region is secondary and from contemporary origins (Chrit et al., 2017; El Haddad et al., 2011).
Air quality models are powerful tools to simulate and predict the atmospheric chemical composition and the properties of aerosols at regional scales. In spite of the tremendous efforts made recently, the sources and transformation mechanisms of atmospheric aerosols are not fully characterized nor fully understood. For organic aerosols, modeling difficulties partly lie in the representation of volatile and semi-volatile organic precursors, which can only take a limited number of compounds or classes of compounds into account(Chrit et al., 2017; Kim et al., 2011a). Difficulties in modeling atmospheric particles are strongly linked to uncertainties in meteorology and emissions (Roustan et al., 2010). For example, turbulent vertical mixing affects the dilution and chemical processing of aerosols and their precursors (Aan de Brugh et al., 2012; Nilsson et al., 2001), clouds affect aerosol chemistry and size distribution (Ervens et al., 2011; Fahey and Pandis, 2001) and photochemistry (Feng et al., 2004; Tang et al., 2003), and precipitation controls wet deposition processes (Barth et al., 2007; Wang et al., 2013; Yang et al., 2012). Over the Mediterranean region, uncertainties due to meteorology and transport may strongly impact pollutant concentrations. This is due to the fact that the basin is influenced by pollution transported from different regions, such as dust from Algeria, Tunisia and Morocco as well as both biogenic and anthropogenic species from Europe (Chrit et al., 2017; Denjean et al., 2016). Chrit et al. (2017) and Cholakian et al. (2018) have shown that although organic aerosol concentrations at a remote marine site in the western Mediterranean are mostly of biogenic origin, they are strongly influenced by air masses transported from the continent and by maritime shipping emissions.
In addition to the meteorological uncertainties, uncertainties in emission inventories are also important. There are uncertainties in biogenic emissions (Sartelet et al., 2012), as well as in anthropogenic emission inventories. For anthropogenic emissions, uncertainties concern not only the emissions themselves, but also the pollutants that are to be considered in the inventory and the spatial and temporal distributions of the emissions. For example, intermediate and semi-volatile organic compounds are missing from emission inventories, even though they may strongly affect the formation of organic aerosols (Couvidat et al., 2012; Denier van der Gon et al., 2015). The spatial distribution of ships and harbor traffic differs depending on emission inventories; however, over the Mediterranean Sea, ships and harbor traffic emissions may strongly affect the formation of particles. Becagli et al. (2017) found that the minimum ship emission contributions to PM10 were 11 % at Lampedusa Island, and 8 % at Capo Granitola on the southern coast of Sicily. Aksoyoglu et al. (2016) showed that ship emissions in the Mediterranean may contribute up to 60 % of sulfate concentrations, as SO2 is a major pollutant emitted from maritime transport. However, in comparison to on-road vehicles, ship emissions are still poorly characterized (Berg et al., 2012). Furthermore, the multiplicity of Mediterranean pollution sources and their interactions makes it difficult to quantify ship contributions to aerosol concentrations.
Seas and oceans are a significant source of sea-spray aerosols (SSA), which strongly affect the formation of cloud condensation nuclei and particle concentrations. However, according to Grythe et al. (2014), sea-spray aerosols (SSA) have one of the largest uncertainties among all emissions. The modeling of sea-salt emissions is based on empirical or semi-empirical formulas. There is a tremendous amount of parameterization of the SSA emission fluxes (Grythe et al., 2014). The SSA emission parameterization of Monahan et al. (1986) is commonly used to model sea-salt emissions of coarse particles (Kim et al., 2017; Sartelet et al., 2012; Solazzo et al., 2017). However, the strong non-linearity of the source function versus wind speed (power law with an exponent of 3.41) may lead to an overestimation of emissions at high-speed regimes, as suggested by Guelle et al. (2001) and Witek et al. (2007). Many studies have shown that wind speed is the dominant influence on sea-salt emissions (Grythe et al., 2014; Hoppel et al., 1989). However, other parameterizations use different power laws with different exponents for the wind speed (e.g., 2.07 for Jaeglé et al., 2011) and have introduced other parameters like sea-surface temperature (Jaeglé et al., 2011; Schwier et al., 2017; Sofiev et al., 2011) and water salinity (Grythe et al., 2014). Although the influence of marine emissions on primary organic aerosols is low for the Mediterranean (Chrit et al., 2017), their influence on inorganic aerosols is not (Claeys et al., 2017).
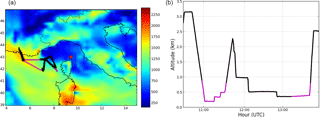
Figure 1Mediterranean domain used for the simulations and planetary boundary layer (PBL) height on 10 July 2014 at noon, as obtained from the ECMWF meteorological fields (a). Ersa is located at the red point on northern tip of Corsica Island. The (black and purple) crosses/lines indicate the trajectory of the flight on 10 July 2014 over the Mediterranean Sea. The altitudes during the flight are displayed in (b). The portions conducted above the continent at the beginning and at the end of the flight from/to Avignon airport have been removed. For the model-to-measurement comparisons, only the transects indicated by purple crosses/lines are considered.
The aim of this work is to evaluate some of the processes that strongly affect inorganic and organic aerosol concentrations in the western Mediterranean in summer (transport and emissions), and to establish how the data/parameterizations commonly used in air quality models affect the concentrations. To that end, sensitivity studies relative to transport (meteorology) and emissions (anthropogenic and sea salt) are performed using the Polyphemus air quality model. The model results are then compared to measurements performed at the remote marine Ersa super-site (Cap Corsica, France) during the summer campaigns of 2012 and 2013, and to airborne measurements performed above the Western Mediterranean Sea in summer (July) 2014.
This paper is structured as follows. The Polyphemus air quality model setup is first described for the different input datasets/parameterizations used, as well as the measurements. Second, the meteorological fields used as input for the air quality model are evaluated. Third, the model is evaluated by comparisons to the measurements and comparisons of the sensitivities studies to meteorology, sea-salt emission parameterizations and anthropogenic emissions are performed to determine the main aerosol sources and sensitivities.
In order to simulate aerosol formation over the western Mediterranean, the Polair3d/Polyphemus air quality model is used, with the setup described in Chrit et al. (2017) and summarized here. For parameters/parameterizations that are particularly related to uncertainties (anthropogenic emissions, meteorology, sea-salt emissions and modeling of condensation/evaporation), the alternative parameters/parameterizations that are used in the sensitivity studies are also detailed for emissions and meteorology. For computational reasons, alternative parameterizations for the modeling of condensation/evaporation are only used in the comparisons to airborne measurements in Sect. 4.4 (where they are also detailed).

Figure 2Average NOx emissions over the summer campaign 2013 from the EMEP emission inventory (a), and absolute differences (µg m−2 s−1) of NOx emissions between HTAP and EMEP inventories (b). The horizontal and vertical axes show longitude and latitude in degrees, respectively.
2.1 Simulation setups and alternative parameterizations
Simulations are performed over the same domains and using the same input data as in Chrit et al. (2017).
Two nested simulations are performed: one over Europe (nesting domain, horizontal resolution: 0.5∘ × 0.5∘) and one over a Mediterranean domain centered around Corsica (nested domain, horizontal resolution: 0.125∘ × 0.125∘), which is also centered around the Ersa surface super-site (red point in Fig. 1). Vertically, 14 levels are used in Polair3d/Polyphemus. The heights of the cell interfaces are 0, 30, 60, 100, 150, 200, 300, 500, 750, 1000, 1500, 2400, 3500, 6000 and 12 000 m.
Simulations are performed during the summers of 2012, 2013 and 2014. The dates of simulations are chosen to match the periods of observations performed during ChArMEx (Chemistry-Aerosol Mediterranean Experiment). The Mediterranean simulations (nested domain) are performed from 6 June to 8 July 2012, from 6 June to 10 August 2013 and from 9 to 10 July 2014. In the reference simulation, meteorological data are provided by the European Center for Medium-Range Weather Forecasts (ECMWF) model (horizontal resolution: 0.25∘ × 0.25∘), which are interpolated to the Europe and Mediterranean study domains. The vertical diffusion is computed using the Troen and Mahrt (1986) parameterization. In the sensitivity study relative to meteorology, meteorological fields from the Weather Research and Forecasting model (WRF, Skamarock et al., 2008) are used in the Mediterranean simulation. WRF is forced with NCEP (National Centers for Environmental Prediction) meteorological fields for initial and boundary conditions (1∘ horizontal grid spacing). To simulate WRF meteorological fields over the Mediterranean domain, one-way nested WRF simulations with 24 vertical levels are conducted on two nested domains: one over Europe and one over the Mediterranean. Before conducting the sensitivity study relative to meteorology (Sect. 3), using two different meteorological datasets, WRF is run with a number of different configurations, which are compared to measurements in Sect. 3. In these configurations, the same physical parameterizations are used, but with different horizontal coordinates.
The WRF configuration used for this study consists of the Single Moment-5 class microphysics scheme (Hong et al., 2004), the RRTM radiation scheme (Mlawer et al., 1997), the Monin–Obukhov surface layer scheme (Janjic, 2003), and the NOAA land surface model scheme for land surface physics (Chen and Dudhia, 2001). Sea surface temperature update and surface grid nudging (Bowden et al., 2012; Liu et al., 2012) options are activated.
In the first configuration (WRF-Lon-Lat), horizontal resolutions of 0.5∘ × 0.5∘ and 0.125∘ × 0.125∘ are used for the nesting and nested domains, respectively, with a longitude–latitude projection. In the second configuration (WRF-Lambert), a Lambert (conic conform) projection is used with horizontal resolutions of 55.65 km × 55.65 km and 13.9 km × 13.9 km for the nesting and nested domains, respectively. The third configuration (WRF-Lambert-OBSGRID) also uses a Lambert projection, but the meteorological fields are improved by nudging global observations of temperature, humidity and wind from surface and radiosonde measurements (NCEP operational global surface and upper-air observation subsets, as archived by the Data Support Section (DSS) at NCAR (National Center for Atmospheric Research)).
Jaeglé et al. (2011)Jaeglé et al. (2011)Monahan et al. (1986)Jaeglé et al. (2011)Jaeglé et al. (2011)Table 1Summary of the different simulations and their input data. S1, S2, S3, S4 and S5 represent the simulation number.

Biogenic emissions are estimated using MEGAN (Model of Emissions of Gases and Aerosols from Nature) with the standard MEGAN LAIv database (MEGAN-L, Guenther et al., 2006) and the EFv2.1 dataset. For the different simulations, these emissions are recalculated with the meteorological data used for transport. In the reference simulation, yearly anthropogenic emissions are generated using the EDGAR-HTAP_V2 inventory for 2010 (http://edgar.jrc.ec.europa.eu/htap_v2/). The EDGAR-HTAP_V2 inventory uses total national emissions from the European Monitoring and Evaluation Program (EMEP) emission inventory that are spatially reallocated using the EDGAR4.1 proxy subset (Janssens-Maenhout et al., 2012). The differences between the two inventories do not only lie in the spatial allocation of emissions, but also in the spatial resolution. EMEP provides a resolution of 0.5∘ × 0.5∘, while the resolution of EDGAR-HTAP_V2 is 0.1∘ × 0.1∘. To illustrate the differences between the two inventories, NOx emissions from the EMEP emission inventory and absolute differences of NOx emissions between the HTAP and EMEP inventories are shown in Fig. 2. The highest discrepancies between the two inventories mostly concern shipping emissions (very low in the EMEP emission inventory (< 0.2 µg m−2 s−1), whereas they can be as high as 2.8 µg m−2 s−1 over the sea in the HTAP emission inventory) as well as for emissions over large cities, primarily Genoa, Marseille and Rome (with emissions as high as 2.5 µg m−2 s−1 higher than in the HTAP emission inventory). HTAP emissions are used in the reference simulation and EMEP emissions are used in the sensitivity study as shown in Table 1.
Sea-salt emissions are parameterized using Jaeglé et al. (2011) in the reference simulation and utilizing the commonly-used Monahan et al. (1986) parameterization for the sensitivity study. These two parameterizations are based on open-sea measurements but are different in terms of the source function, which is defined as the total mass of sea-salt aerosol (SSA) released by area and time units. Furthermore, the source functions of these two parameterizations have a different dependency on the wind speed.
In terms of emitted sea-salt mass, the largest differences are located over the sea in the south of France (with differences as high as 1400 %), where the shear stress exerted by the wind on the sea surface is highest. Following Schwier et al. (2015), the emitted dry sea-salt mass is assumed to be made up of 25.40 % chloride, 30.61 % sodium and 4.22 % sulfate.
The boundary conditions for the European simulation are calculated from the global model MOZART4 (Horowitz et al., 2003) (https://www.acom.ucar.edu/wrf-chem/mozart.shtml), whilst those for the Mediterranean domain are obtained from the European simulation. Mineral dust emissions are not calculated in the model, but are provided from the boundaries, and their heterogeneous reactions to form nitrate and sulfate are not taken into account.
The numerical algorithms used for transport and the parameterizations used for dry and wet depositions are detailed in Sartelet et al. (2007). Gas-phase chemistry is modeled with the carbon bond 05 mechanism (CB05) (Yarwood et al., 2005), to which reactions are added to model the formation of secondary organic aerosols (Chrit et al., 2017; Kim et al., 2011b).
The Size Resolved Aerosol Model (SIREAM; Debry et al., 2007) is used for simulating the dynamics of the aerosol size distribution by coagulation and condensation/evaporation. SIREAM uses a sectional approach and the aerosol distribution is described here using 20 sections of bound diameters: 0.01, 0.0141, 0.0199, 0.0281, 0.0398, 0.0562, 0.0794, 0.1121, 0.1585, 0.2512, 0.3981, 0.6310, 1.0, 1.2589, 1.5849, 1.9953, 2.5119, 3.5481, 5.0119, 7.0795 and 10.0 µm. The condensation/evaporation of inorganic aerosols is determined using the thermodynamic model ISORROPIA (Nenes et al., 1998) with a bulk equilibrium approach in order to compute the partitioning between the gaseous and particle phases of aerosols. Because the concentrations and the partitioning between gaseous and particle phases of chloride, nitrate and ammonium are strongly affected by condensation/evaporation and reactions with other pollutants, sensitivities of these concentrations to the hypotheses used in the modeling (thermodynamic equilibrium, mixed sea-salt and anthropogenic aerosols) are also performed (Sect. 4.4.2). For organic aerosols, the gas–particle partitioning of the surrogates is computed using SOAP (Secondary Organic Aerosol Processor), assuming bulk equilibrium (Couvidat and Sartelet, 2015). The gas–particle partitioning of hydrophobic surrogates is modeled following Pankow (1994), with absorption by the organic phase (hydrophobic surrogates). The gas–particle partitioning of hydrophilic surrogates is computed using Henry's law modified to extrapolate infinite dilution conditions to all conditions using an aqueous-phase partitioning coefficient with absorption by the aqueous phase (hydrophilic organics, inorganics and water). Activity coefficients are computed with the thermodynamic model UNIFAC (UNIversal Functional Activity Coefficient; (Fredenslund et al., 1975)). After condensation/evaporation, the moving diameter algorithm is used for mass redistribution among size bins. As detailed in Chrit et al. (2017), anthropogenic intermediate/semi-volatile organic compounds' (I/S-VOC) emissions are emitted as three primary surrogates of different volatilities (characterized by their saturation concentrations C*: log(C*) = −0.04, 1.93 and 3.5). The ageing of each primary surrogate is represented through a single oxidation step, without NOx dependency, to produce a secondary surrogate of lower volatility (log(C*) = −2.4, −0.064 and 1.5, respectively) but higher molecular weight. Gaseous I/S-VOC emissions are missing from emission inventories and are estimated here as detailed in Zhu et al. (2016): by multiplying the primary organic emissions (POA) by 1.5, and by assigning them to species of different volatilities. A sensitivity study where I-S/VOC emissions are not taken into account is also performed.
Sensitivity studies to meteorology fields, anthropogenic emission inventory, I/S-VOC emissions and sea-salt emissions are outlined in Sect. 4. These studies are performed using two different inputs for the parameter of interest in the sensitivity test and fixing the others. Table 1 summarizes the simulations performed as well as the different input data used. Table 2 summarizes the different simulation comparisons, as performed in the conducted sensitivity studies.
2.2 Measured data
The model results are compared against observational data collected in the framework of several ChArMEx campaigns. Simulated concentrations in the first vertical level of the model are compared to ground-based measurements performed at Ersa (43∘00′ N, 9∘21.5′ E), which is located on the northern edge of Corsica Island, at a height of about 530 m above sea level (Fig. 1). A Campbell meteorological station was used to measure air temperature and wind speed. Continuous measurements of PM10 and PM1 were performed using TEOM (Thermo Scientific, model 1400) and TEOM-FDMS (Thermo Scientific, model 1405) instruments, respectively. The composition of particles, nitrate, sulfate, ammonium and organic concentrations in PM1 were characterized using an ACSM (aerosol chemical speciation monitor); in PM10 they were characterized using a PILS-IC (particle into liquid sampler coupled with ion chromatography), which also allowed for an estimation of chloride and sodium concentrations (see Michoud et al., 2017 for more details). The inorganic precursors HNO3, HCl and SO2 were measured using a WAD-IC (wet-annular denuder coupled with ion chromatography).
Airborne measurements based in Avignon, France were performed aboard the ATR-42, run by SAFIRE (French aircraft service for environmental research, http://safire.fr, last access: 4 July 2017). Full details of the aerosol measurements aboard the aircraft as well as the flight details are provided in Freney et al. (2018). On 10 July 2014, a flight was dedicated to measure concentrations above the sea under a “mistral” regime (northern and northwestern high-speed winds). This flight was approximately 3 h in duration and the aircraft flew over the south of France and the Mediterranean Sea at altitudes varying from 100 to 3000 meters above sea level (m a.s.l). Comparisons between the model and the measurements are not performed during transit; they are only performed above the sea at altitudes below 800 m a.s.l. and in the boundary layer. A horizontal projection of the aircraft path during this flight is presented in Fig. 1. The purple crosses/lines indicate the locations where model and measurement comparisons are performed. Measurements of the non-refractory submicron aerosol chemical properties were performed using a compact aerosol time-of-flight mass spectrometer (C-ToF-AMS) providing mass concentrations of organic sulfate, ammonia and chloride particles with a time resolution of less than 5 min.
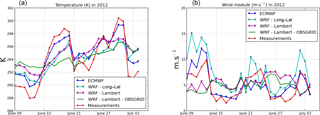
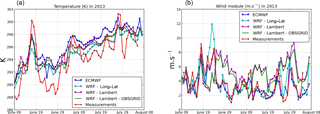
Aerosol phenomenology on the Corsica Cape is influenced by diverse meteorological situations as well as transport of pollutants from a number of sources. Therefore, it is crucial to estimate the input meteorological data used in the air quality model as accurately as possible. The four meteorological datasets (ECMWF, WRF-Lon-Lat, WRF-Lambert and WRF-Lambert-Obsgrid) are compared to observations of air temperature and wind at Ersa in Fig. B1 for the summer campaign periods of 2012 and in Fig. B2 for the summer 2013 (Appendix B).
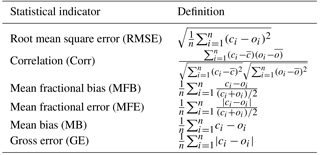
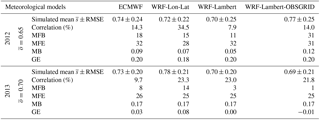
The observed and simulated temperature, wind speed, wind direction and relative humidity at Ersa during these summers, the statistical scores defined in Table A1 of Appendix A and the comparison of the four model results to measurements (hourly time series) are shown in Tables 3–6, respectively.
As mentioned in the 2007 EPA report, Emery et al. (2001) proposed benchmarks for temperature (mean bias (MB) within ±0.5 K and a gross error (GE) of 2.0 K), wind speed (MB within ±0.5 m s−1 and a RMSE < 2 m s−1) and wind direction (MB within ±10∘ and a GE < 30∘). McNally (2009) suggested an alternative set of benchmarks for temperature (MB within ±1.0 K and a GE < 3.0 K).
Table 3Temperature (observed and simulated means) from the observations and the four meteorological models at Ersa during the 2012 and 2013 summer campaigns, and statistics of comparison of model results to observations (correlation, mean fractional bias, mean fractional error, mean bias and gross error). The temperature means and RMSEs are in Kelvin. refers to the measured mean.
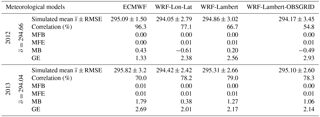
Table 4Wind speed statistics for the four meteorological models at Ersa during the 2012 and 2013 summer campaigns. The wind speed means and the RMSEs are in m s−1. refers to the measured mean.
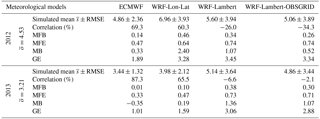
Table 5Wind direction statistics for the four meteorological models at Ersa during the 2012 and 2013 summer campaigns. The wind direction means and the RMSEs are in degrees. refers to the measured mean.
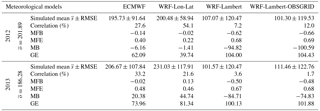
Table 6Relative humidity statistics for the four meteorological models at Ersa during the 2012 and 2013 summers. The relative humidity means and the RMSEs are dimensionless. refers to the measured mean.
The four meteorological simulations reproduce the ground temperature measured at Ersa well. Whilst only the ECMWF temperature in 2012 verifies the US EPA criteria, all simulations verify the criterion from McNally (2009) for the GE. Statistically, the correlation to temperature measurements is high (between about 54 and 96 % for all models), and the root mean square error (RMSE) is low (below 3.4 K). The best model differs depending on the year: the correlation of ECMWF to measurements is the highest (96 %) and the RMSE the lowest (1.5 K) in 2012, but in 2013, the correlation of ECMWF is the lowest (70 %) and its RMSE the highest (3.2 K). The mean fractional biases and errors (MFB and MBE) of the simulated temperatures are almost zero.
For wind speed, ECMWF systematically leads to better statistics than WRF, despite the fine horizontal resolution of WRF (0.125∘ × 0.125∘). ECMWF agrees best with the measurements, with the highest correlation (between 69 and 87 %) and the lowest errors (MFE is between 33 and 47 %). It also verifies the US EPA criteria for both the 2012 and 2013 summers. WRF-Lon-Lat also performs well with correlations between 60 and 65 % and MFEs between 47 and 64 %. WRF-Lambert and WRF-Lambert-Obsgrid have poorer statistics with negative correlations and MFEs between 71 and 74 %.
The average wind direction is quite similar for the 2012 and 2013 summers (202 and 186∘, respectively). The mean wind direction is best represented by ECMWF for the 2013 summer, and WRF-Lon-Lat for the 2012 summer. However, the modeled wind speed does not respect the US EPA criteria. Errors are higher with the two models using the Lambert projection, which tend to underestimate the wind direction angle. For relative humidity, the observed mean relative humidity is 0.65 in 2012 and 0.70 in 2013. It is relatively well reproduced by the models (between 0.70 and 0.77 in 2012 and between 0.69 and 0.78 in 2013). All models perform well with a MFE below 32 % and a MFB below 18 %. WRF-Lon-Lat leads to the best statistics in 2012 and WRF-Lambert-Obsgrid leads to the best statistics in 2013.
As ECMWF and WRF-Lon-Lat show better overall performance than the other two models (Tables 3–6), they are used for the meteorological sensitivity study.
The model performances presented above compare well to other studies (Cholakian et al., 2018; Kim et al., 2013). In this study, for ECMWF and WRF-Lon-Lat during the summers of 2012 and 2013, the RMSE ranges between 1.5 and 3.2 K for temperature, between 1.3 and 3.9 m s−1 for wind speed and between 58 and 118∘ for wind direction. At Ersa, for the summer 2013 (not exactly the same period – 10 July to 5 August 2013), Cholakian et al. (2018) found a RMSE between 1.5 and 2.3 K for temperature, between 1.6 and 1.9 m s−1 for wind speed and between 92 and 117∘ for wind direction using the mesoscale WRF model. Moreover, Kim et al. (2013) reported a RMSE ranging between 1 and 4 K for temperature, and 0.6 to 3.0 m s−1 for wind speed over Greater Paris during May 2005 using the WRF model with a longitude–latitude map projection.
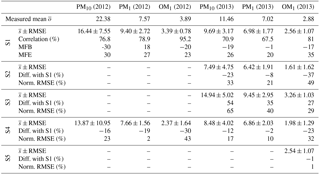
This section focuses on the evaluation of the reference simulation (S1) against aerosol measurements (PM10, PM1, OM1 and inorganic aerosols (IA) species), in addition to the factors controlling simulated aerosol concentrations (meteorology, sea-salt and anthropogenic emissions). This evaluation is performed against ground-based measurements during the 2012 and 2013 summers, and against airborne measurements from the ATR-42 flight on 10 July 2014. The criteria of Boylan and Russell (2006) are used to evaluate the model-to-measurement comparisons. The performance criterion is verified if |MFB| ≤ 60 % and MFE ≤ 75 % (MFB and MFE stand for the respective mean fractional bias and the mean fractional error and are defined in Table A1 of Appendix A), while the goal criterion is verified if |MFB| ≤ 30 % and MFE ≤ 50 %. To evaluate the sensitivity of the modeled concentrations to input data, the different simulations summarized in Table 1 are compared to the reference simulation S1 by computing the normalized root mean square error (RMSE of the concentration differences between a simulation and S1, divided by the mean concentration of S1).
Table 7Comparisons of simulated PM10, PM1 and OM1 daily concentrations to observations (concentrations and RMSE are in µg m−3) during the summer campaign periods of 2012 (between 9 June and 3 July) and 2013 (between 7 June and 3 August). stands for simulated mean and stands for observed mean. Simulation details are given in Table 1.
4.1 PM10 and PM1
The statistical scores of the simulated PM1 and PM10 are shown in Table 7 for the summer campaigns of 2012 and 2013. The time series of measured and simulated PM10 and PM1 during the 2013 summer are presented in Fig. C1 of Appendix C.
PM10 and PM1 are well modeled during both the 2012 and 2013 summer campaigns, and the performance and goal criteria are always met. The measured mean concentration of PM1 is very similar in 2012 and 2013 (7.6 and 7.0 µg m−3, respectively). However, the mean PM10 concentration in 2012 is double that of 2013 (22.4 and 11.5 µg m−3, respectively), which is most likely due to the higher occurrence of transported desert dust in 2012 (Nabat et al., 2015).
Although the mean PM1 and PM10 concentrations are well modeled in 2013, the mean PM1 concentration is slightly underestimated during summer 2013 and the mean PM10 concentration is slightly underestimated in 2012. The underestimation of PM10 may be due to difficulties in accurately representing the transported dust episodes, which are frequent in summer in the western Mediterranean (Moulin et al., 1998) and are represented in the Mediterranean simulation by dust boundary conditions from the global model MOZART4.
The comparisons of the different simulations at Ersa in Table 7 show that both PM10 and PM1 concentrations are strongly influenced by sea-salt emissions (S3, with a normalized RMSE of 65 and 40 %, respectively), especially as the emissions of the two parameters differ by as much as 1400 % over the sea in southern France (Sect. 2.1). PM10 and PM1 concentrations are also very sensitive to meteorology (S2, with a normalized RMSE of 33 and 21 %, respectively) and anthropogenic emissions (S4, with a normalized RMSE of 17 and 10 %, respectively).
Knowing the chemical composition of PM10 and PM1 provides important information to aid with deciphering the different sources of aerosol particles arriving at Ersa, and to understand the sensitivities presented above. Figure 3 shows the simulated composition of PM10 and PM1, the percentage contribution of each compound to PM in 2013, and the associated variability.
According to simulation, inorganic aerosols account for a large part of the PM10 mass: during the summer campaign periods of 2012 and 2013, the inorganic fraction in PM10 is 31 and 39 %, respectively. Among inorganics, sulfate, largely originating from anthropogenic sources, occupies a large portion of PM10 (18 % in 2012 and 19 % in 2013). The organic mass (OM) also largely contributes to PM10 (30 % in 2012 and 33 % in 2013). Black carbon (originating from traffic and shipping emissions and industrial activities in big cities in the south of France and the north of Italy) contributes to a small portion of PM10 (5 % in 2012 and 7 % in 2013). Saharan dust can be transported by air masses to the Mediterranean atmosphere via medium-range transport and is an important component of PM10, with respective contributions of 34 and 21 % during the summer campaigns of 2012 and 2013.
The PM1 mass is dominated by organic matter (41 % in 2012 and 38 % in 2013) and sulfate (30 % in 2012 and 24 % in 2013). The percentage of sodium (from sea salt) is significant in PM10 (4 % in 2012 and 10 % in 2013); however, it is negligible in the PM1 mass (less than 1 %).
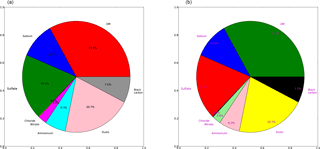
Figure 3PM10 (a) and PM1 (b) average relative simulated composition during the summer 2013 campaign period.
4.2 OM1
The statistical evaluation of OM1 during the summer campaigns of 2012 and 2013 is available in Table 7. As discussed in Chrit et al. (2017), the performance and goal criteria are both satisfied, due to the addition of highly oxidized species (extremely low volatility organic compounds, organic nitrate and the carboxylic acid MBTCA (3-methyl-1,2,3-butanetricarboxylic acid) as a second generation oxidation product of α-pinene) in the model. Adding these species to the model was also required to correctly model OM properties (oxidation state and affinity to water). The time series of measured and simulated OM1 concentrations during the summer 2013 campaign are presented in Fig. C1 of Appendix C. The comparison of the different simulations at Ersa in Table 7 shows that OM1 is particularly influenced by meteorology (S2 with a normalized RMSE of 49 %), because meteorology influences biogenic emissions; however, OM1 is also affected by inorganic sea-salt emissions (S3 with a normalized RMSE of 29 %), which provide mass onto which hydrophilic SOA (secondary organic aerosol) can condense (especially sulfate). Furthermore, anthropogenic emissions (S4 with a normalized RMSE of 32 %), which affect the formation of oxidants through photochemistry and emit anthropogenic precursors also impact OM1. The sensitivity to anthropogenic I/S-VOC emissions is low (S5, with a normalized RMSE of only 1 %).
Table 9Comparisons of simulated PM10 inorganic daily concentrations to observations (concentrations are in µg m−3) using S1, S2, S3 and S4 during the 2013 summer.
4.3 Inorganic species
4.3.1 Ground-based evaluation
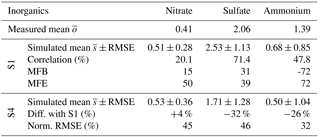
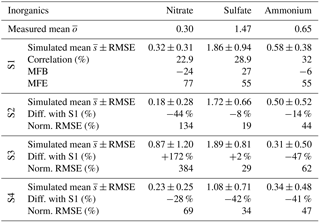
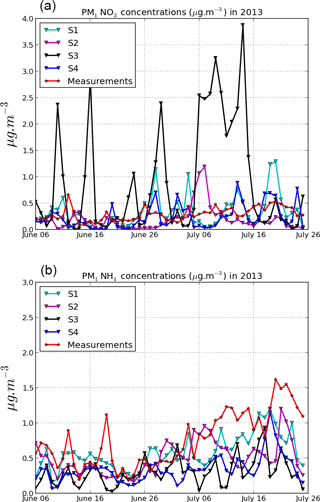
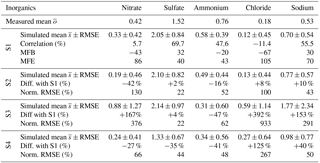
The statistical scores of the simulated inorganic concentrations are shown in Table 8 for PM1 concentrations during the summer 2012 campaign and in Tables 9 and 10 for PM10 and PM1 inorganic concentrations, respectively, during the 2013 summer campaign. The time series of measured and simulated inorganic concentrations during the 2013 summer campaign are presented in Figs. C2 and C3 of Appendix C.
Inorganic concentrations of PM1 aerosol were measured in 2012, and both PM1 and PM10 were measured in 2013. Some of the inorganic gaseous precursors (SO2, HNO3 and HCl) were also measured for just a few days in 2013 (between 21 and 26 July 2013).
For the 2012 reference simulation (S1), the PM1, sulfate and nitrate concentrations satisfy both the performance and goal criteria. However, ammonium concentrations are underestimated, despite the performance criterion being satisfied in terms of the MFE. This underestimation of ammonium increases if the EMEP emission inventory with lower ship emissions over the Mediterranean Sea is used, suggesting that ammonium nitrate formation is strongly dependent on ship NOx emissions (because they lead to the formation of the gaseous precursors of ammonium nitrate).
For the 2013 reference simulation (S1), PM10, sulfate and ammonium satisfy the both performance and goal criteria, while sodium satisfies only the performance criterion. The mean concentrations of modeled chloride and nitrate are both underestimated. This underestimation is probably due to uncertainties in the measurements. In fact, nitrate and chloride are difficult to measure, as there can be negative artifacts (volatilization of the aerosol phase during sampling) or positive artefacts (condensation of gaseous phase onto the particles or filters during sampling), depending on the sampling conditions. Moreover, this underestimation may be also due to uncertainties in the modeled temperature (with bias as high as about 5 K in daily points) and difficulties in representing the partitioning between gas and particle phases. For chloride, as shown in Fig. C2 in Appendix C, although the mean concentration is underestimated, the peaks are overestimated. For example, between 21 and 26 July 2013, the particle-phase chloride concentration is 0.34 µg m−3 in the simulation, but only 0.05 µg m−3 in the measurements. The total chloride (gas + particle phase) is well modeled (1.2 µg m−3 in the measurements and 1 µg m−3 simulated), but the gas ∕ particle ratio is much higher in the measurements (18.4) than in the model (2.4). For nitrate, the total nitrate (gas + particle phase) is overestimated between 21 and 26 July 2013 (2.7 µg m−3 in the measurements and 6.6 µg m−3 simulated), and most of it is in the gas phase (only 0.4 µg m−3 in the particle phase in the measurements and 0.2 simulated). Contrary to chloride, the gas ∕ particle ratio for nitrate is much higher in the model (28.2) than in the measurements (5.4). The reason for the difficulties in representing the gas ∕ particle ratios of chloride is that the measured PILS chloride concentrations only include non-refractory chloride. The reason for the difference in the nitrate ratio is likely related to the internal mixing hypothesis and the bulk-equilibrium assumption in the modeling of condensation/evaporation. This is investigated in the following section, during the comparison to airborne measurements.
For the 2013 reference simulation (S1), PM1, PM10, sulfate and ammonium satisfy the performance criterion, which is also almost satisfied for nitrate. The measured and simulated PM1 and PM10 concentrations are relatively similar for sulfate and ammonium, suggesting that most of the mass is in PM1.
The comparisons of the different simulations at Ersa in Tables 9 and 10 show that inorganics in PM10 and PM1 have similar sensitivities, because of the bulk equilibrium assumption made in the modeling of condensation/evaporation. Sulfate is more sensitive to anthropogenic (ship) emissions (with a normalized RMSE of 44 % in PM10) than meteorology (with a normalized RMSE of 22 %) and sea-salt emissions (with a normalized RMSE of 22 %). Nitrate, chloride and sodium, and ammonium to a lower extent, are highly sensitive to sea-salt emissions with normalized RMSEs between 62 and 933 % (the Jaegle et al. (2011) parameterization has a lower dependance on wind speed than the Monahan et al. (1986) parameterization). They are also strongly affected by meteorology (with normalized RMSEs between 43 and 130 %), because meteorology affects natural emissions (sea salt and biogenic), as discussed in Sect. 5. By influencing biogenic emissions, meteorology affects the formation of organics (Sartelet et al., 2012), as they are mostly of biogenic origin in summer (Chrit et al., 2017). The influence of meteorology on biogenic emissions also affects the formation of inorganics, due to the modification of oxidant concentrations (Aksoyoglu et al., 2017) and the temperature bias that can be as high as 5 K, in addition to the formation of organic nitrate (Ng et al., 2017). Inorganic concentrations are also strongly affected by anthropogenic emissions (with normalized RMSEs between 44 and 267 %), owing to the fact that anthropogenic emissions affect the NOx emissions; hence, the oxidants and the formation of both organic and inorganic nitrate is also impacted. Because nitrate, ammonium and chloride partition between the gas and particle phases, their uncertainties are linked and they are strongly affected by assumptions in the modeling of condensation/evaporation, as detailed in the Sect. 4.4.
4.4 Airborne evaluation
The measurement flight considered in this study (10 July 2014, 10:21–14:09 UTC) was conducted by the French ATR-42 aircraft deployed by SAFIRE in the south of France above the Mediterranean Sea. The purpose of the flight was to study aerosol formation, evolution and properties in marine conditions, under the mistral regime (north/northwest winds coming from the Rhône Valley characterized by high wind speeds). Altitudes and a horizontal projection of the trajectory of the aircraft during the flight are presented in Fig. 1. The aircraft flew at low altitudes (under 800 m a.s.l.) over the Mediterranean Sea for about 2 h, allowing us to evaluate the modeling of sea-salt aerosols. As shown in Fig. 1, the planetary boundary layer height, as modeled by ECMWF meteorological fields, exhibit strong spatial variations.
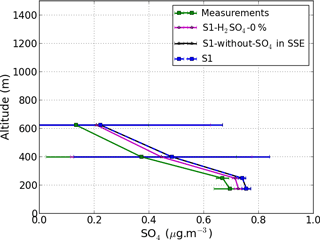
Figure 4Measurements are averaged at four model levels from airborne observations below 800 m a.g.l along the flight path shown in Fig. 1 on 10 July 2014. The concentrations of the S1 simulations (standard and with options; see text for details) are also averaged in time along the flight path. Results from S1 and from S1-without-SO4 in SSE (sea-salt emissions) are quite similar.
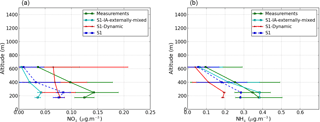
Figure 5Vertical profile averaged at four model levels of NO3 (a) and NH4 (b). Measurements are averaged at the same four model levels from airborne observations below 800 m a.g.l along the flight shown in Fig. 1 on 10 July 2014 (around noon).
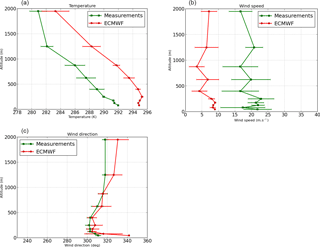
For the comparisons of inorganic concentrations to airborne measurements, the reference simulation S1 is run a few days during the summer 2014. The simulated concentrations are extracted along the flight path from the corresponding grid cells and layers. For the model-to-measurement comparisons, only the cells were the plane was flying above the sea, at low altitudes (below 800 m a.s.l.) with a spatially uniform boundary layer (above 1200 m) are considered. The transects where model-to-measurement comparisons are performed are indicated by purple crosses/lines in Fig. 1. The meteorological fields during this flight are compared with measured data in Appendix F. The mistral regime is simulated with wind directions that are well modeled, although wind speeds are underestimated.
4.4.1 Sulfate
Figure 4 shows the comparison of sulfate to the airborne measurements using different model configurations. Sulfate is the inorganic compound with the highest PM1 concentrations (about 0.54 µg m−3).
As shown in Fig. 4, the PM1 sulfate concentration is overestimated in the simulation with a mean concentration of about 0.55 µg m−3 compared to 0.47 µg m−3 in the measurements. To understand the reasons for this overestimation, different sensitivity simulations are performed. The first sensitivity simulation (referred to as “S1-without-SO4 in SSE”, where SSE stands for sea-salt emissions) differs from the S1 simulation due to the fact that sulfate is only emitted from anthropogenic sources and marine sulfate is not taken into account. The second sensitivity simulation (referred to as “S1-H2SO4-0 %”) differs from S1 in that SOx emissions are split into 100 % of SO2 and 0 % of H2SO4, instead of 98 % of SO2 and 2 % of H2SO4 (as in S1). The measurement-to-model comparison of the vertical profile of the PM1 sulfate concentrations using the three simulations is shown in Fig. 4. The influence of marine sulfate is negligible: the simulated means using S1 with and without the emissions of marine sulfate are nearly equal (≈ 0.55 µg m−3) indicating that the PM1 sulfate concentration is almost totally from anthropogenic sources. A comparison of PM10 sulfate concentrations for the two simulations show that this is also the case for PM10. This is indicative of the overestimation of sulfate or sulfuric acid emissions, or of issues with the treatment of emissions from ship stacks in the model . However, PM1 sulfate concentrations are strongly influenced by anthropogenic emissions. For example, PM1 sulfate concentrations are lower if the fraction of H2SO4 in the SOx emissions is lower than in the reference simulation (the simulated mean concentrations with and without H2SO4 in SOx emissions are 0.55 and 0.52 µg m−3, respectively), because of the rapid condensation of H2SO4 (which has a saturation vapor pressure of almost zero) onto particles.
4.4.2 Ammonium and nitrate
Figure 5 shows the comparison of nitrate and ammonium concentrations in PM1. The simulated means of ammonium and nitrate are about 0.32 and 0.14 µg m−3, respectively. In the reference simulation ,S1, ammonium and nitrate are underestimated compared to the measurements.
Figure 5 shows the comparison of nitrate and ammonium concentrations in PM1 to the airborne measurements using different model configurations. Because ammonium, nitrate and chloride are semi-volatile inorganic species, their concentrations may depend on the assumptions made in the modeling of condensation/evaporation. In the reference simulation, bulk thermodynamic equilibrium is assumed between the gas and particle phases for all inorganic species. In the first sensitivity simulation (referred to as “S1-Dynamic”), the condensation/evaporation is computed dynamically rather than assuming thermodynamic equilibrium. In the second sensitivity simulation (referred to as “S1-IA-externally-mixed”), sea-salt (chloride and sodium) emissions are assumed not to be mixed with the other aerosols. In S1-IA-externally-mixed, bulk equilibrium is assumed for ammonium, nitrate and sulfate, while chloride and sodium do not interact with the other inorganic species.
Under the thermodynamic equilibrium approach (S1), nitrate is underestimated (the measured and simulated means are 0.10 and 0.05 µg m−3, respectively). This is likely because the sulfate is overestimated, as detailed in Sect. 4.4.1, but also because the assumption of thermodynamic equilibrium between the gas and particle phases is not verified. Nitrate concentrations are closer to measurements if condensation/evaporation is computed dynamically, especially between 400 and 600 m in altitude, where the mean concentrations are 0.07 µg m−3 in the measurements (0.02 µg m−3 with S1 and 0.07 µg m−3 with S1-Dynamic). If sea-salt aerosols are externally mixed, than nitrate is even more underestimated than in S1. This is because nitrate tends to replace chloride in sea salt if thermodynamic considerations are taken into account.
For ammonium, the comparisons to the measurements are best if sea-salt particles are assumed not to be mixed (the measured and simulated means are 0.27 and 0.26 µg m−3, respectively). The differences of the vertical profiles between the dynamic and the equilibrium approaches indicates that the assumption of thermodynamic equilibrium is not verified (the condensation/evaporation process is not instantaneous). For instance, the simulated mean of ammonium using the equilibrium and dynamic approaches is 0.20 and 0.13 µg m−3, respectively.
Because both the mixing-state of particles and the dynamics of condensation/evaporation strongly influence PM1 inorganic concentrations over the Mediterranean Sea, a model capable of representing the mixing state of particles with the dynamic of condensation/evaporation (Zhu et al., 2015) may allow a better representation of inorganic concentrations.
Section 4 was dedicated to explaining how the simulated concentrations of particles at Ersa are influenced by the different input data used (meteorology, sea salt and anthropogenic emissions) and the modeling hypotheses. This section generalizes the sensitivity study of Sect. 4 by investigating how the concentrations over the Mediterranean domain are influenced by the input data.
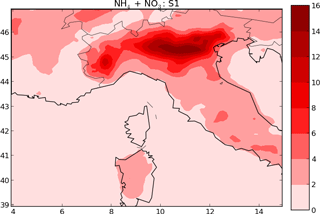
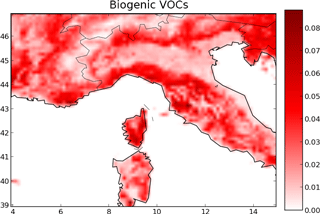
Figure D1 of Appendix D shows maps of the concentrations of PM10, OM1, sulfate and other secondary inorganic aerosols (nitrate, ammonium and chloride)over the Mediterranean domain from simulation S1 during the 2013 summer. The highest PM10 concentrations correspond to high OM1, sulfate or ammonium, nitrate and chloride concentrations. OM1 concentrations are high near locations with high biogenic emissions such as Italy and Corsica (Fig. E1 of Appendix E). Sulfate concentrations are particularly high over the Mediterranean Sea, near main shipping routes (Fig. 2). Ammonium nitrate concentrations are high in places of high anthropogenic emissions, such as the north of Italy, as well as in major cities. Hereafter, the term VIA (volatile inorganic aerosol) is used to refer to chloride, ammonium and nitrate aerosols.
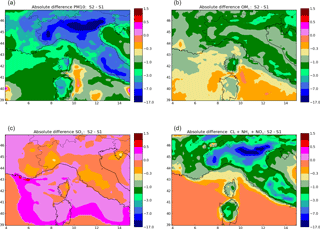
Figure D2 of Appendix D shows maps of the relative difference of the concentrations of PM10, OM1, sulfate and VIA between S2 and S1 (sensitivity to meteorology). VIA concentrations show the highest sensitivity to meteorology, with relative concentration differences between S2 and S1 ranging between −90 and −60 % locally over Italy. Sulfate shows the lowest sensitivity with relative concentration differences mostly ranging between −20 and 20 %. The larger influence of meteorology on VIA than on sulfate concentrations is partly explained by the influence of temperature on the partitioning of VIA between the gas and particle phases, as VIA is highly semi-volatile. OM1 concentrations are quite sensitive to meteorology over the whole Mediterranean domain, with relative concentration differences mostly between −60 and −20 %, especially near regions where the biogenic emissions are the highest. The regions of the highest OM1 concentrations also correspond to the areas where VIA concentrations are the most sensitive to meteorology. By influencing biogenic emissions, meteorology influences the formation of organics (OM1) and in turn the formation of VIA by the formation of organic nitrate. The influence of meteorology on sulfate concentrations is limited in this study, because the formation of organosulfates is not modeled in our simulations.
Figure D3 of Appendix D shows maps of the relative differences of the concentrations of PM10, OM1, sulfate and VIA between S3 and S1 (sensitivity to sea-salt emissions).
As sulfate is assumed to comprise only 4 % of sea-salt emissions (Sect. 2.1), the influence of sea-salt emissions on sulfate concentrations at Ersa is low (the relative concentration difference is between 0 and 20 %). The effect is stronger over the western part of the Mediterranean domain (with relative concentration differences between S3 and S1 of between 20 and 60 %). Chloride concentrations are also strongly influenced by sea-salt emissions, as it is directly emitted (it is assumed to make up 25 % of sea-salt emissions). Furthermore, nitrate and ammonium concentrations are strongly impacted by sea-salt emissions, due to thermodynamic exchanges between the gas and particle phases of chloride, nitrate and ammonium.
The influence of sea-salt emissions on OM1 concentrations is also important, but it is less important than VIA (the relative concentration differences of VIA are between 90 and 180 %) over the western Mediterranean part of the domain, compared to between 20 and 60 % for OM1 and between 40 and 60 % for sulfate. The increase of OM1 concentrations when sea-salt emissions are high is due to the hydrophilic organic compounds in OM1, which are absorbed onto inorganic concentrations. The organic concentrations originating from sea-salt emissions are very low, as discussed in Chrit et al. (2017); therefore, they are not taken into account here.
Figure D4 of Appendix D shows maps of the relative difference of the concentrations of PM10, OM1, sulfate and VIA between S4 and S1 (sensitivity to anthropogenic emissions). Sensitivities to sulfate and VIA concentrations are more spatially localized than sensitivities to OM1 concentrations, and are higher, with relative concentration differences between S4 and S1 of between −40 and 20 % for OM1 and between −40 and 60 % for VIA. Sulfate concentrations are strongly sensitive to anthropogenic emissions near main shipping routes, with negative (S4 − S1) concentrations between −60 and −40 %. This is due to the fact that shipping routes are not well represented in the EMEP emission inventory (simulation S4). For VIA concentrations, the influence of anthropogenic emissions can either be negative or positive (increase or decrease of concentrations); this is owing to the different spatial distributions of the two emission inventories, which directly affect nitrate formation.
This work presents a sensitivity study to different input data and model parameterizations to better understand aerosol sources over the Mediterranean and the parameters influencing the aerosol concentrations. Aerosol sources are different depending on aerosol chemical compounds. Comparisons to observations are performed at the Ersa station to estimate how realistic the concentrations simulated with the different parameters (meteorological fields, anthropogenic and marine emissions, intermediate/semi-volatile organic compounds (I/S-VOC) emissions and different options for condensation/evaporation modeling) are. For most pollutants, the best model performance is obtained when the meteorological fields that represent the best wind direction are used together with the emission inventory with the most accurate spatial description of ship emissions (EDGAR-HTAP).
Using ECMWF and WRF to model the meteorological fields, secondary pollutants (inorganics and organics) show a high sensitivity to meteorology. This highlights the importance of accurate meteorological modeling and the potential strong influence of climate change on the concentrations of these secondary pollutants.
The influence of meteorology on concentrations is due to its impact on sea salt and biogenic emissions, which directly influence the formation of ammonium, nitrate, chloride and OM; furthermore, temperature, humidity and radiation influence secondary aerosol formation. Sulfate is less sensitive to meteorology than volatile inorganic aerosols (VIA), because it is not volatile. However, this low sensitivity may change if the formation of organosulfates are modeled (not carried out in this study). Both inorganic and organic concentrations are highly sensitive to sea-salt emissions, although great discrepancies exist between different published parameterizations. The commonly used Monahan parameterization of sea-salt emissions leads to an overestimation of all particulate concentrations, especially sodium concentrations. A parameterization with a lower exponent in the wind speed power law is chosen to model sea-salt emissions (Jaeglé et al., 2011) and leads to better model performance. The overestimation of the modeled sea-salt concentrations using Monahan parameterization has an incidence on the overestimation of the modeled concentrations of inorganic compounds such as nitrate, which replaces chloride in the particles when the thermodynamic equilibrium approach is used to model condensation/evaporation. This assumption (the thermodynamic equilibrium approach) was shown not to be accurate at Ersa and over the Mediterranean Sea. At Ersa, the gas ∕ particle ratio was too high for nitrate and too low for chloride if the thermodynamic equilibrium approach was used, as the exchange between the gas and particle phases was dynamic not instantaneous. This dynamic exchange is strongly influenced by the particle composition, and comparisons to measurements over the Mediterranean Sea suggest that sea-salt particles are not mixed with background (transported) particles. Overall, secondary pollutants such as nitrate, ammonium and chloride in the particle-phase are strongly influenced by the gas ∕ particle phase partitioning, as a high percentage of their concentrations are in the gas phase. This underlines the need to develop aerosol models able to accurately represent this gas-phase partitioning.
Sulfate primarily originates from maritime traffic. Shipping emissions lead to the formation of oxidants that in turn enhance the formation of biogenic aerosols, with the potential formation of organic nitrate and organosulfates. Organics are mostly from biogenic origins during summer. Even if the contribution of sea-salt emissions to organic concentrations is low, organic concentrations are strongly influenced by sea-salt emissions because they partition between the gas and particle phases and they are hydrophilic. This underlines the need to better characterize the properties (affinity with water) of secondary organic aerosols. The emissions of I/S-VOC played a limited role in OM1 concentrations during the 2013 summer, suggesting that the influence of ship emissions on OM1 is mostly due to anthropogenic VOC precursors (aromatics) and NOx emissions. These substances lead to the formation of oxidants that may oxidize biogenic aerosol precursors (and form organic nitrate, for example).
Data can be requested from the corresponding author (mounir.chrit@enpc.fr).
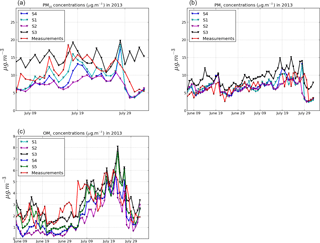
Figure C1Comparisons of PM10 (a), PM1 (b) and OM (c) concentrations simulated and observed at Ersa during the summer 2013.
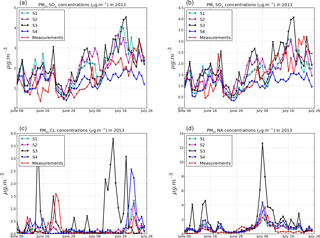
Figure C2Comparisons of simulated and observed PM10 sulfate (a), PM1 sulfate (b), PM10 chloride (c) and PM10 sodium (d) concentrations at Ersa during the summer 2013.
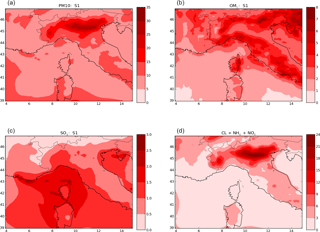
Figure D1Maps of the concentrations of PM10 (a), OM1 (b), PM10 sulfate (c) and other PM10 inorganics (nitrate + ammonium + chloride) (d) during the summer 2013 in µg m−3.
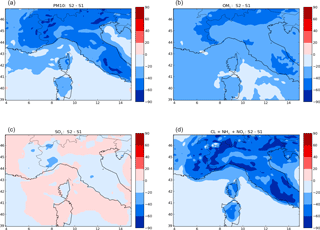
Figure D2Maps of the relative differences of the concentrations of PM10 (a), OM1 (b), sulfate (c) and other inorganics (nitrate, ammonium and chloride) (d) in % between S1 and S2 (b, d) during the summer 2013.
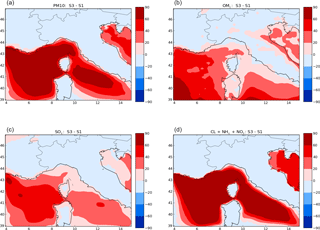
Figure D3Maps of the relative differences of the concentrations of PM10 (a), OM1 (b), sulfate (c) and other inorganics (nitrate, ammonium and chloride) (d) in % between S1 and S3 (b, d) during the summer 2013.
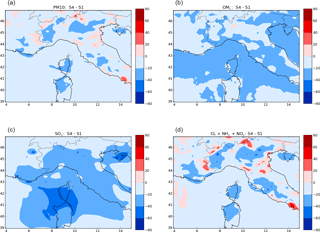
Figure D4Maps of the relative differences of the concentrations of PM10 (a), OM1 (b), sulfate (c) and other inorganics (nitrate, ammonium and chloride) (d) in % between S1 and S4 (b, d) during the summer 2013.
MC and KS performed the simulations. The other co-authors performed experiments and carried out measurements.
The authors declare that they have no conflict of interest.
This article is part of the special issue “CHemistry and AeRosols Mediterranean EXperiments (ChArMEx) (ACP/AMT inter-journal SI)”. It does not belong to a conference.
This research has received funding from the French National Research Agency
(ANR) projects SAF-MED (grant ANR-12-BS06-0013). This work is part of the
ChArMEx project supported by ADEME, CEA, CNRS-INSU and Météo-France
through the multidisciplinary program MISTRALS (Mediterranean Integrated
Studies aT Regional And Local Scales). The station at Ersa was partly
supported by the CORSiCA project funded by the Collectivité Territoriale de
Corse through the Fonds Européen de Développement Régional of the
European Operational Program 2007–2013 and the Contrat de Plan
Etat-Région. Eric Hamounou is acknowledged for his great help in organizing
the campaigns at Ersa. CEREA is a member of Institut Pierre-Simon Laplace
(IPSL).
Edited by: Nikolaos
Mihalopoulos
Reviewed by: three anonymous referees
Aan de Brugh, J. M. J., Henzing, J. S., Schaap, M., Morgan, W. T., van Heerwaarden, C. C., Weijers, E. P., Coe, H., and Krol, M. C.: Modelling the partitioning of ammonium nitrate in the convective boundary layer, Atmos. Chem. Phys., 12, 3005–3023, https://doi.org/10.5194/acp-12-3005-2012, 2012. a
Aksoyoglu, S., Baltensperger, U., and Prévôt, A. S. H.: Contribution of ship emissions to the concentration and deposition of air pollutants in Europe, Atmos. Chem. Phys., 16, 1895–1906, https://doi.org/10.5194/acp-16-1895-2016, 2016. a
Aksoyoglu, S., Ciarelli, G., El-Haddad, I., Baltensperger, U., and Prévôt, A. S. H.: Secondary inorganic aerosols in Europe: sources and the significant influence of biogenic VOC emissions, especially on ammonium nitrate, Atmos. Chem. Phys., 17, 7757–7773, https://doi.org/10.5194/acp-17-7757-2017, 2017. a
Barth, M. C., Kim, S.-W., Wang, C., Pickering, K. E., Ott, L. E., Stenchikov, G., Leriche, M., Cautenet, S., Pinty, J.-P., Barthe, Ch., Mari, C., Helsdon, J. H., Farley, R. D., Fridlind, A. M., Ackerman, A. S., Spiridonov, V., and Telenta, B.: Cloud-scale model intercomparison of chemical constituent transport in deep convection, Atmos. Chem. Phys., 7, 4709–4731, https://doi.org/10.5194/acp-7-4709-2007, 2007. a
Becagli, S., Anello, F., Bommarito, C., Cassola, F., Calzolai, G., Di Iorio, T., di Sarra, A., Gómez-Amo, J.-L., Lucarelli, F., Marconi, M., Meloni, D., Monteleone, F., Nava, S., Pace, G., Severi, M., Sferlazzo, D. M., Traversi, R., and Udisti, R.: Constraining the ship contribution to the aerosol of the central Mediterranean, Atmos. Chem. Phys., 17, 2067–2084, https://doi.org/10.5194/acp-17-2067-2017, 2017. a
Berg, N., Mellqvist, J., Jalkanen, J.-P., and Balzani, J.: Ship emissions of SO2 and NO2: DOAS measurements from airborne platforms, Atmos. Meas. Tech., 5, 1085–1098, https://doi.org/10.5194/amt-5-1085-2012, 2012. a
Bossioli, E., Tombrou, M., Kalogiros, J., Allan, J., Bacak, A., Bezantakos, S., Biskos, G., Coe, H., Jones, B. T., Kouvarakis, G., Mihalopoulos, N., and Percival, C. J.: Atmospheric composition in the Eastern Mediterranean: Influence of biomass burning during summertime using the WRF-Chem model, Atmos. Environ., 132, 317–331, https://doi.org/10.1016/j.atmosenv.2016.03.011, 2016. a
Bowden, J. H., Otte, T. L., Nolte, C. G., and Otte, M. J.: Examining interior grid nudging techniques using two-way nesting in the wrf model for regional climate modeling, J. Climate, 25, 2805–2823, https://doi.org/10.1175/JCLI-D-11-00167.1, 2012. a
Boylan, J. W. and Russell, A. G.: PM and light extinction model performance metrics, goals, and criteria for three-dimensional air quality models, Atmos. Environ., 40, 4946–4959, https://doi.org/10.1016/j.atmosenv.2005.09.087, 2006. a
Chen, F. and Dudhia, J.: Coupling an advanced land surface-hydrology model with the Penn State-NCAR MM5 modeling system. Part I : Model implementation and sensitivity, Mon. Weather Rev., 129, 569–585, 2001. a
Cholakian, A., Beekmann, M., Colette, A., Coll, I., Siour, G., Sciare, J., Marchand, N., Couvidat, F., Pey, J., Gros, V., Sauvage, S., Michoud, V., Sellegri, K., Colomb, A., Sartelet, K., Langley DeWitt, H., Elser, M., Prévôt, A. S. H., Szidat, S., and Dulac, F.: Simulation of fine organic aerosols in the western Mediterranean area during the ChArMEx 2013 summer campaign, Atmos. Chem. Phys., 18, 7287–7312, https://doi.org/10.5194/acp-18-7287-2018, 2018. a, b, c
Chrit, M., Sartelet, K., Sciare, J., Pey, J., Marchand, N., Couvidat, F., Sellegri, K., and Beekmann, M.: Modelling organic aerosol concentrations and properties during ChArMEx summer campaigns of 2012 and 2013 in the western Mediterranean region, Atmos. Chem. Phys., 17, 12509–12531, https://doi.org/10.5194/acp-17-12509-2017, 2017. a, b, c, d, e, f, g, h, i, j, k
Claeys, M., Roberts, G., Mallet, M., Arndt, J., Sellegri, K., Sciare, J., Wenger, J., and Sauvage, B.: Optical, physical and chemical properties of aerosols transported to a coastal site in the western Mediterranean: a focus on primary marine aerosols, Atmos. Chem. Phys., 17, 7891–7915, https://doi.org/10.5194/acp-17-7891-2017, 2017. a
Couvidat, F. and Sartelet, K.: The Secondary Organic Aerosol Processor (SOAP v1.0) model: a unified model with different ranges of complexity based on the molecular surrogate approach, Geosci. Model Dev., 8, 1111–1138, https://doi.org/10.5194/gmd-8-1111-2015, 2015. a
Couvidat, F., Debry, É., Sartelet, K., and Seigneur, C.: A hydrophilic/hydrophobic organic (H2O) model: Model development, evaluation and sensitivity analysis, J. Geophys. Res., 117, D10304, https://doi.org/10.1029/2011JD017214, 2012. a
Debevec, C., Sauvage, S., Gros, V., Sciare, J., Pikridas, M., Stavroulas, I., Salameh, T., Leonardis, T., Gaudion, V., Depelchin, L., Fronval, I., Sarda-Esteve, R., Baisnée, D., Bonsang, B., Savvides, C., Vrekoussis, M., and Locoge, N.: Origin and variability in volatile organic compounds observed at an Eastern Mediterranean background site (Cyprus), Atmos. Chem. Phys., 17, 11355–11388, https://doi.org/10.5194/acp-17-11355-2017, 2017. a
Debry, É., Seigneur, C., and Sartelet, K.: Organic aerosols in the air quality platform Polyphemus: oxidation pathways, hydrophilic/hydrophobic partitioning and oligomerization, International Aerosol Modeling Algorithms, Univ. of California, Davis, 2007. a
Denier van der Gon, H. A. C., Bergström, R., Fountoukis, C., Johansson, C., Pandis, S. N., Simpson, D., and Visschedijk, A. J. H.: Particulate emissions from residential wood combustion in Europe – revised estimates and an evaluation, Atmos. Chem. Phys., 15, 6503-6519, https://doi.org/10.5194/acp-15-6503-2015, 2015. a
Denjean, C., Cassola, F., Mazzino, A., Triquet, S., Chevaillier, S., Grand, N., Bourrianne, T., Momboisse, G., Sellegri, K., Schwarzenbock, A., Freney, E., Mallet, M., and Formenti, P.: Size distribution and optical properties of mineral dust aerosols transported in the western Mediterranean, Atmos. Chem. Phys., 16, 1081–1104, https://doi.org/10.5194/acp-16-1081-2016, 2016. a
Di Biagio, C., Doppler, L., Gaimoz, C., Grand, N., Ancellet, G., Raut, J.-C., Beekmann, M., Borbon, A., Sartelet, K., Attié, J.-L., Ravetta, F., and Formenti, P.: Continental pollution in the western Mediterranean basin: vertical profiles of aerosol and trace gases measured over the sea during TRAQA 2012 and SAFMED 2013, Atmos. Chem. Phys., 15, 9611–9630, https://doi.org/10.5194/acp-15-9611-2015, 2015. a
Doche, C., Dufour, G., Foret, G., Eremenko, M., Cuesta, J., Beekmann, M., and Kalabokas, P.: Summertime tropospheric-ozone variability over the Mediterranean basin observed with IASI, Atmos. Chem. Phys., 14, 10589–10600, https://doi.org/10.5194/acp-14-10589-2014, 2014. a
El Haddad, I., Marchand, N., Wortham, H., Piot, C., Besombes, J.-L., Cozic, J., Chauvel, C., Armengaud, A., Robin, D., and Jaffrezo, J.-L.: Primary sources of PM2.5 organic aerosol in an industrial Mediterranean city, Marseille, Atmos. Chem. Phys., 11, 2039–2058, https://doi.org/10.5194/acp-11-2039-2011, 2011. a
Emery, C., Tai, E., and Yarwood, G.: Enhanced meteorological modeling and performance evaluation for two Texas episodes, CorpInternational, report to the Texas Natural Resources Conservation Commission, p.b.E., 2001. a
Ervens, B., Turpin, B. J., and Weber, R. J.: Secondary organic aerosol formation in cloud droplets and aqueous particles (aqSOA): a review of laboratory, field and model studies, Atmos. Chem. Phys., 11, 11069–11102, https://doi.org/10.5194/acp-11-11069-2011, 2011. a
Fahey, K. M. and Pandis, S. N.: Optimizing model performance: variable size resolution in cloud chemistry modeling, Atmos. Environ., 35, 4471–4478, https://doi.org/10.1016/S1352-2310(01)00224-2, 2001. a
Feng, Y., Penner, J. E., Sillman, S., and Liu, X.: Effects of cloud overlap in photochemical models, J. Geophys. Res., 109, D04310, https://doi.org/10.1029/2003JD004040, 2004. a
Fredenslund, A., Jones, R. L., and Prausnitz, J. M.: Group-Contribution Estimation of Activity Coefficients in Nonideal Liquid Mixtures, AIChE J., 21, 1086–1099, 1975. a
Freney, E., Sellegri, K., Chrit, M., Adachi, K., Brito, J., Waked, A., Borbon, A., Colomb, A., Dupuy, R., Pichon, J.-M., Bouvier, L., Delon, C., Jambert, C., Durand, P., Bourianne, T., Gaimoz, C., Triquet, S., Féron, A., Beekmann, M., Dulac, F., and Sartelet, K.: Aerosol composition and the contribution of SOA formation over Mediterranean forests, Atmos. Chem. Phys., 18, 7041–7056, https://doi.org/10.5194/acp-18-7041-2018, 2018. a
Gerasopoulos, E., Zanis, P., Papastefanou, C., Zerefos, C., Ioannidou, A., and Wernli, H.: A complex case study of down to the surface intrusions of persistent stratospheric air over the Eastern Mediterranean, Atmos. Environ., 40, 4113–4125, https://doi.org/10.1016/j.atmosenv.2006.03.022, 2006. a
Grythe, H., Ström, J., Krejci, R., Quinn, P., and Stohl, A.: A review of sea-spray aerosol source functions using a large global set of sea salt aerosol concentration measurements, Atmos. Chem. Phys., 14, 1277–1297, https://doi.org/10.5194/acp-14-1277-2014, 2014. a, b, c, d
Guelle, W., Schulz, M., Balkanski, Y., and Dentener, F.: Influence of the source formulation on modeling the atmospheric global distribution of sea salt aerosol, J. Geophys. Res., 106, 27509–27524, https://doi.org/10.1029/2001JD900249, 2001. a
Guenther, A., Karl, T., Harley, P., Wiedinmyer, C., Palmer, P. I., and Geron, C.: Estimates of global terrestrial isoprene emissions using MEGAN (Model of Emissions of Gases and Aerosols from Nature), Atmos. Chem. Phys., 6, 3181–3210, https://doi.org/10.5194/acp-6-3181-2006, 2006. a
Hong, S.-Y., Dudhia, J., Chen, S.-H., Hong, S.-Y., Dudhia, J., and Chen, S.-H.: A Revised Approach to Ice Microphysical Processes for the Bulk Parameterization of Clouds and Precipitation, Mon. Weather Rev., 132, 103–120, https://doi.org/10.1175/1520-0493(2004)132<0103:ARATIM>2.0.CO;2, 2004. a
Hoppel, W., Fitzgerald, J., Frick, G., Larson, R., and Mack, E.: Atmospheric aerosol size distributions and optical properties in the marine boundary layer over the Atlantic Ocean, NRL report 9188, 1989. a
Horowitz, L. W., Walters, S., Mauzerall, D. L., Emmons, L. K., Rasch, P. J., Granier, C., Tie, X., Lamarque, J.-F., Schultz, M. G., Tyndall, G. S., Orlando, J. J., and Brasseur, G. P.: A global simulation of tropospheric ozone and related tracers: Description and evaluation of MOZART, version 2, J. Geophys. Res., 108, 4784, https://doi.org/10.1029/2002JD002853, 2003. a
Jaeglé, L., Quinn, P. K., Bates, T. S., Alexander, B., and Lin, J.-T.: Global distribution of sea salt aerosols: new constraints from in situ and remote sensing observations, Atmos. Chem. Phys., 11, 3137–3157, https://doi.org/10.5194/acp-11-3137-2011, 2011. a, b, c, d, e, f, g, h
Janjic, Z. I.: A nonhydrostatic model based on a new approach, Meteorol. Atmos. Phys., 82, 271–285, https://doi.org/10.1007/s00703-001-0587-6, 2003. a
Janssens-Maenhout, G., Dentener, F., van Aardenne, J., Monni, S., Pagliari, V., Orlandini, L., Klimont, Z., Kurokawa, J., Akimoto, H., Ohara, T., Wankmüller, R., Battye, B., Grano, D., Zuber, A., and Keating, T.: a Harmonized Gridded Air Pollution Emission Dataset Based on National Inventories, european Commission, Joint Research Centre, Institute for Environment and Sustainability, https://doi.org/10.2788/14102, 2012. a
Kim, H., Kim, S., Kim, B.-U., Jin, C.-S., Hong, S., Park, R., Son, S.-W., Bae, C., Bae, M., Song, C.-K., and Stein, A.: Recent increase of surface particulate matter concentrations in the Seoul Metropolitan Area, Korea, Sci. Rep.-UK, 7, 4710, https://doi.org/10.1038/s41598-017-05092-8, 2017. a
Kim, Y., Couvidat, F., Sartelet, K., and Seigneur, C.: Comparison of different gas-phase mechanisms and aerosol modules for simulating particulate matter formation, J. Air Waste Manage. Assoc., 61, 1218–1226, https://doi.org/10.1080/10473289.2011.603999, 2011a. a
Kim, Y., Sartelet, K., and Seigneur, C.: Formation of secondary aerosols over Europe: comparison of two gas-phase chemical mechanisms, Atmos. Chem. Phys., 11, 583–598, https://doi.org/10.5194/acp-11-583-2011, 2011b. a
Kim, Y., Sartelet, K., Raut, J.-C., and Chazette, P.: Evaluation of the Weather Research and Forecast/urban model over Greater Paris, Bound.-Lay. Meteorol., 149, 105–132, https://doi.org/10.1007/s10546-013-9838-6, 2013. a, b
Liu, S., Shilling, J. E., Song, C., Hiranuma, N., Zaveri, R. A., and Russell, L.: Hydrolysis of Organonitrate Functional Groups in Aerosol Particle, Aerosol Sci. Technol., 46, 1359–1369, https://doi.org/10.1080/02786826.2012.716175, 2012. a
McNally, D. E.: 12km MM5 Performance Goals, pPresentation to the Ad-Hoc Meteorology Group, 25 June 2009, available at: http://www.epa.gov/scram001/adhoc/mcnally2009.pdf (last access: 4 July 2017), 2009. a, b
Menut, L., Rea, G., Mailler, S., Khvorostyanov, D., and Turquety, S.: Aerosol forecast over the Mediterranean area during July 2013 (ADRIMED/CHARMEX), Atmos. Chem. Phys., 15, 7897–7911, https://doi.org/10.5194/acp-15-7897-2015, 2015. a
Michoud, V., Sciare, J., Sauvage, S., Dusanter, S., Léonardis, T., Gros, V., Kalogridis, C., Zannoni, N., Féron, A., Petit, J.-E., Crenn, V., Baisnée, D., Sarda-Estève, R., Bonnaire, N., Marchand, N., DeWitt, H. L., Pey, J., Colomb, A., Gheusi, F., Szidat, S., Stavroulas, I., Borbon, A., and Locoge, N.: Organic carbon at a remote site of the western Mediterranean Basin: sources and chemistry during the ChArMEx SOP2 field experiment, Atmos. Chem. Phys., 17, 8837–8865, https://doi.org/10.5194/acp-17-8837-2017, 2017. a
Millán, M. M., Salvador, R., Mantilla, E., and Kallos, G.: Photooxidant dynamics in the Mediterranean basin in summer: results from European research projects, Geophys. Res. Lett., 102, 8811–8823, 1997. a
Mlawer, E. J., Taubman, S. J., Brown, P. D., Iacono, M. J., and Clough, S. A.: Radiative transfer for inhomogeneous atmospheres: RRTM, a validated correlated-k model for the longwave, J. Geophys. Res., 102, 16663–16682, 1997. a
Monahan, E. C., Spiel, D. E., and Davidson, K. L.: A model of marine aerosol generation via whitecaps and wave disruption, in: Oceanic whitecaps and their role in air-sea exchange processes, D. Reidel, Netherlands, 167–174, 1986. a, b, c
Monks, P. S., Granier, C., Fuzzi, S., Stohl, A., Williams, M. L., Akimoto, H., Amann, M., Baklanov, A., Baltensperger, U., Bey, I., Blake, N., Blake, R. S., Carslaw, K., Cooper, O. R., Dentener, F., Fowler, D., Fragkou, E., Frost, G. J., Generoso, S., Ginoux, P., Grewe, V., Guenther, A., Hansson, H. C., Henne, S., Hjorth, J., Hofzumahaus, A., Huntrieser, H., Isaksen, I. S. A., Jenkin, M. E., Kaiser, J., Kanakidou, M., Klimont, Z., Kulmala, M., Laj, P., Lawrence, M. G., Lee, J. D., Liousse, C., Maione, M., Mciggans, G., Metzger, A., Mieville, A., Moussiopoulos, N., Orlando, J. J., O'Dowd, C. D., Palmer, P. I., Parrish, D. D., Petzold, A., Platt, U., Poschl, U., Prévôt, A. S. H., Reeves, C. E., Reimann, S., Rudich, Y., Sellegri, K., Steinbrecher, R., Simpson, D., ten Brinkt, H., Theloke, J., vander Werf, G. R., Vautard, R., Vestreng, V., Vlachokostas, C., and von Glasow, R.: Atmospheric composition change – Global and regional air quality, Atmos. Environ., 43, 5268–5350, https://doi.org/10.1016/j.atmosenv.2009.08.021, 2009. a
Moulin, C., Lambert, C. E., Dayan, U., Masson, V., Ramonet, M., Bousquet, P., Legrand, M., Balkanski, Y., Guelle, W., Marticorena, B., Bergametti, G., and Dulac, F.: Satellite climatology of African dust transport in the Mediterranean atmosphere, J. Geophys. Res., 103, 13137–13144, https://doi.org/10.1029/98JD00171, 1998. a
Nabat, P., Somot, S., Mallet, M., Chiapello, I., Morcrette, J. J., Solmon, F., Szopa, S., Dulac, F., Collins, W., Ghan, S., Horowitz, L. W., Lamarque, J. F., Lee, Y. H., Naik, V., Nagashima, T., Shindell, D., and Skeie, R.: A 4-D climatology (1979–2009) of the monthly tropospheric aerosol optical depth distribution over the Mediterranean region from a comparative evaluation and blending of remote sensing and model products, Atmos. Meas. Tech., 6, 1287–1314, https://doi.org/10.5194/amt-6-1287-2013, 2013. a
Nabat, P., Somot, S., Mallet, M., Michou, M., Sevault, F., Driouech, F., Meloni, D., di Sarra, A., Di Biagio, C., Formenti, P., Sicard, M., Léon, J.-F., and Bouin, M.-N.: Dust aerosol radiative effects during summer 2012 simulated with a coupled regional aerosol–atmosphere-ocean model over the Mediterranean, Atmos. Chem. Phys., 15, 3303–3326, https://doi.org/10.5194/acp-15-3303-2015, 2015. a
Nenes, A., Pandis, S. N., and Pilinis, C.: ISORROPIA: A new thermodynamic equilibrium model for multiphase multicomponent inorganic aerosols, Aquat. Geochem., 4, 123–152, https://doi.org/10.1023/A:1009604003981, 1998. a
Ng, N. L., Brown, S. S., Archibald, A. T., Atlas, E., Cohen, R. C., Crowley, J. N., Day, D. A., Donahue, N. M., Fry, J. L., Fuchs, H., Griffin, R. J., Guzman, M. I., Herrmann, H., Hodzic, A., Iinuma, Y., Jimenez, J. L., Kiendler-Scharr, A., Lee, B. H., Luecken, D. J., Mao, J., McLaren, R., Mutzel, A., Osthoff, H. D., Ouyang, B., Picquet-Varrault, B., Platt, U., Pye, H. O. T., Rudich, Y., Schwantes, R. H., Shiraiwa, M., Stutz, J., Thornton, J. A., Tilgner, A., Williams, B. J., and Zaveri, R. A.: Nitrate radicals and biogenic volatile organic compounds: oxidation, mechanisms, and organic aerosol, Atmos. Chem. Phys., 17, 2103-2162, https://doi.org/10.5194/acp-17-2103-2017, 2017. a
Nilsson, E. D., Rannik, U., Buzorius, G., Kulmala, M., and O'Dowd, C.: Effects of the continental boundary layer evolution, convection, turbulence and entrainment on aerosol formation, Tellus B, 53, 441–461, 2001. a
Roustan, Y., Sartelet, K., Tombette, M., Debry, É., and Sportisse, B.: Simulation of aerosols and gas-phase species over Europe with the Polyphemus system, Part II: Model sensitivity analysis for 2001, Atmos. Environ., 44, 4219–4229, https://doi.org/10.1016/j.atmosenv.2010.07.005, 2010. a
Safieddine, S., Boynard, A., Coheur, P.-F., Hurtmans, D., Pfister, G., Quennehen, B., Thomas, J. L., Raut, J.-C., Law, K. S., Klimont, Z., Hadji-Lazaro, J., George, M., and Clerbaux, C.: Summertime tropospheric ozone assessment over the Mediterranean region using the thermal infrared IASI/MetOp sounder and the WRF-Chem model, Atmos. Chem. Phys., 14, 10119–10131, https://doi.org/10.5194/acp-14-10119-2014, 2014. a
Sartelet, K., Couvidat, F., Seigneur, C., and Roustan, Y.: Impact of biogenic emissions on air quality over Europe and North America, Atmos. Environ., 53, 131–141, https://doi.org/10.1016/j.atmosenv.2011.10.046, 2012. a, b, c, d
Sartelet, K. N., Debry, E., Fahey, K., Roustan, Y., Tombette, M., and Sportisse, B.: Simulation of aerosols and related species over Europe with the Polyphemus system, Part I: model-to-data comparison for 2001, Atmos. Environ., 41, 6116–6131, https://doi.org/10.1016/j.atmosenv.2007.04.024, 2007.
Schwier, A. N., Rose, C., Asmi, E., Ebling, A. M., Landing, W. M., Marro, S., Pedrotti, M.-L., Sallon, A., Iuculano, F., Agusti, S., Tsiola, A., Pitta, P., Louis, J., Guieu, C., Gazeau, F., and Sellegri, K.: Primary marine aerosol emissions from the Mediterranean Sea during pre-bloom and oligotrophic conditions: correlations to seawater chlorophyll a from a mesocosm study, Atmos. Chem. Phys., 15, 7961–7976, https://doi.org/10.5194/acp-15-7961-2015, 2015. a
Schwier, A. N., Sellegri, K., Mas, S., Charrière, B., Pey, J., Rose, C., Temime-Roussel, B., Jaffrezo, J.-L., Parin, D., Picard, D., Ribeiro, M., Roberts, G., Sempéré, R., Marchand, N., and D'Anna, B.: Primary marine aerosol physical flux and chemical composition during a nutrient enrichment experiment in mesocosms in the Mediterranean Sea, Atmos. Chem. Phys., 17, 14645-14660, https://doi.org/10.5194/acp-17-14645-2017, 2017. a
Skamarock, W., Klemp, J., Dudhia, J., Gill, D., Barker, D., Duda, M., Huang, X., Wang, W., and Powers, J.: A description of the advanced research WRF version 3, NCAR Technical Note, NCAR/TN/u2013475? STR, 123 pp, 2008. a
Sofiev, M., Soares, J., Prank, M., de Leeuw, G., and Kukkonen, J.: A regional-to-global model of emission and transport of sea salt particles in the atmosphere, J. Geophys. Res., 116, D21302, https://doi.org/10.1029/2010JD014713, 2011. a
Solazzo, E., Bianconi, R., Hogrefe, C., Curci, G., Tuccella, P., Alyuz, U., Balzarini, A., Baró, R., Bellasio, R., Bieser, J., Brandt, J., Christensen, J. H., Colette, A., Francis, X., Fraser, A., Vivanco, M. G., Jiménez-Guerrero, P., Im, U., Manders, A., Nopmongcol, U., Kitwiroon, N., Pirovano, G., Pozzoli, L., Prank, M., Sokhi, R. S., Unal, A., Yarwood, G., and Galmarini, S.: Evaluation and error apportionment of an ensemble of atmospheric chemistry transport modeling systems: multivariable temporal and spatial breakdown, Atmos. Chem. Phys., 17, 3001–3054, https://doi.org/10.5194/acp-17-3001-2017, 2017. a
Tang, Y., Carmichael, G. R., Uno, I., Woo, J.-H., Kurata, G., Lefer, B., Shetter, R. E., Huang, H., Anderson, B. E., Avery, M. A., Clarke, A. D., and Blake, D. R.: Impacts of aerosols and clouds on photolysis frequencies and photochemistry during TRACE-P: 2. Three-dimensional study using a regional chemical transport model, J. Geophys. Res., 108, 8822, https://doi.org/10.1029/2002JD003100, 2003. a
Troen, I. B. and Mahrt, L.: A simple model of the atmospheric boundary layer; sensitivity to surface evaporation, Bound.-Lay. Meteorol., 37, 129–148, https://doi.org/10.1007/BF00122760, 1986. a
Tyrlis, E. and Lelieveld, J.: Aspects of a climatology and dynamics of the summer Etesians, EGU General Assembly Conference Abstracts, 14, 2144, available at: http://adsabs.harvard.edu/abs/2012EGUGA..14.2144T (last access: 11 April 2014), 2012. a
Wang, H., Easter, R. C., Rasch, P. J., Wang, M., Liu, X., Ghan, S. J., Qian, Y., Yoon, J.-H., Ma, P.-L., and Vinoj, V.: Sensitivity of remote aerosol distributions to representation of cloud–aerosol interactions in a global climate model, Geosci. Model Dev., 6, 765–782, https://doi.org/10.5194/gmd-6-765-2013, 2013. a
Witek, M. L., Flatau, P. J., Quinn, P. K., and Westphal, D. L.: Global sea-salt modeling: Results and validation against multicampaign shipboard measurement, J. Geophys. Res., 112, 8215–8229, https://doi.org/10.1029/2006JD007779, 2007. a
Yang, Q., Gustafson Jr., W. I., Fast, J. D., Wang, H., Easter, R. C., Wang, M., Ghan, S. J., Berg, L. K., Leung, L. R., and Morrison, H.: Impact of natural and anthropogenic aerosols on stratocumulus and precipitation in the Southeast Pacific: a regional modelling study using WRF-Chem, Atmos. Chem. Phys., 12, 8777–8796, https://doi.org/10.5194/acp-12-8777-2012, 2012. a
Yarwood, G., Rao, S., Yocke, M., and Whitten, G.: Updates to the carbon bond chemical mechanism: CB05 Rep. RT-0400675, 246 pp., available at: http://www.camx.com/files/cb05_final_report_120805.aspx (last access 27 March 2017), 2005. a
Zhu, S., Sartelet, K. N., and Seigneur, C.: A size-composition resolved aerosol model for simulating the dynamics of externally mixed particles: SCRAM (v 1.0), Geosci. Model Dev., 8, 1595–1612, https://doi.org/10.5194/gmd-8-1595-2015, 2015. a
Zhu, S., Sartelet, K., Healy, R., and Wenger, J.: Simulation of particle diversity and mixing state over Greater Paris: A model-measurement inter-comparison, Faraday Discuss., 189, 547–566, https://doi.org/10.1039/C5FD00175G, 2016.
- Abstract
- Introduction
- Simulation setups and measured data
- Meteorological evaluation
- Evaluation and sensitivities
- Sensitivity studies over the western Mediterranean region
- Conclusions
- Data availability
- Appendix A: statistical indicators
- Appendix B: meteorological evaluation
- Appendix C: model-to-measurement comparisons in 2013
- Appendix D: concentration sensitivities in the summer 2013
- Appendix E: Biogenic VOCs
- Appendix F: meteorological evaluation during the flight on 10 July 2014
- Author contributions
- Competing interests
- Special issue statement
- Acknowledgements
- References


