the Creative Commons Attribution 4.0 License.
the Creative Commons Attribution 4.0 License.
 | 28 Jun 2018
The impact of future emission policies on tropospheric ozone using a parameterised approach
Steven T. Turnock
Oliver Wild
Frank J. Dentener
Yanko Davila
Louisa K. Emmons
Johannes Flemming
Gerd A. Folberth
Daven K. Henze
Jan E. Jonson
Terry J. Keating
Sudo Kengo
Meiyun Lin
Marianne Lund
Simone Tilmes
Fiona M. O'Connor
This study quantifies future changes in tropospheric ozone (O3) using a simple parameterisation of source–receptor relationships based on simulations from a range of models participating in the Task Force on Hemispheric Transport of Air Pollutants (TF-HTAP) experiments. Surface and tropospheric O3 changes are calculated globally and across 16 regions from perturbations in precursor emissions (NOx, CO, volatile organic compounds – VOCs) and methane (CH4) abundance only, neglecting any impact from climate change. A source attribution is provided for each source region along with an estimate of uncertainty based on the spread of the results from the models. Tests against model simulations using the Hadley Centre Global Environment Model version 2 – Earth system configuration (HadGEM2-ES) confirm that the approaches used within the parameterisation perform well for most regions. The O3 response to changes in CH4 abundance is slightly larger in the TF-HTAP Phase 2 than in the TF-HTAP Phase 1 assessment (2010) and provides further evidence that controlling CH4 is important for limiting future O3 concentrations. Different treatments of chemistry and meteorology in models remain one of the largest uncertainties in calculating the O3 response to perturbations in CH4 abundance and precursor emissions, particularly over the Middle East and south Asia regions. Emission changes for the future Evaluating the CLimate and Air Quality ImPacts of Short-livEd Pollutants (ECLIPSE) scenarios and a subset of preliminary Shared Socioeconomic Pathways (SSPs) indicate that surface O3 concentrations will increase regionally by 1 to 8 ppbv in 2050. Source attribution analysis highlights the growing importance of CH4 in the future under current legislation. A change in the global tropospheric O3 radiative forcing of +0.07 W m−2 from 2010 to 2050 is predicted using the ECLIPSE scenarios and SSPs, based solely on changes in CH4 abundance and tropospheric O3 precursor emissions and neglecting any influence of climate change. Current legislation is shown to be inadequate in limiting the future degradation of surface ozone air quality and enhancement of near-term climate warming. More stringent future emission controls provide a large reduction in both surface O3 concentrations and O3 radiative forcing. The parameterisation provides a simple tool to highlight the different impacts and associated uncertainties of local and hemispheric emission control strategies on both surface air quality and the near-term climate forcing by tropospheric O3.
- Article
(1563 KB) - Full-text XML
-
Supplement
(2357 KB) - BibTeX
- EndNote


The works published in this journal are distributed under
the Creative Commons Attribution 4.0 License. This license does not affect
the Crown copyright work, which is reusable under the Open Government
Licence (OGL). The Creative Commons Attribution 4.0 License and the OGL are
interoperable and do not conflict with, reduce or limit each
other.
© Crown copyright 2018
Tropospheric ozone (O3) is an air pollutant at both regional and global scales. It is harmful to human health (Brunekreef and Holgate, 2002; Jerrett et al., 2009; Turner et al., 2016; Malley et al., 2017), whilst also affecting climate (Myhre et al., 2013) and causing damage to natural and managed ecosystems (Fowler et al., 2009; United Nations Economic Commission for Europe (UNECE), 2016). Long-range transport of air pollutants and their precursors can degrade air quality at locations remote from their source region (Fiore et al., 2009). Predicting source–receptor relationships for O3 is complex due to large natural background sources, formation of O3 from local emissions, non-linear chemistry and intercontinental transport processes (TF-HTAP, 2010). In particular, it is uncertain how the interaction of local and regional emission controls with global changes (e.g. of methane and climate) could affect O3 concentrations in the near-term future (2050s) (Jacob and Winner, 2009; Fiore et al., 2012; von Schneidemesser et al., 2015). This is evident from the wide range of modelled O3 responses in future emission and climate scenarios (Kawase et al., 2011; Young et al., 2013; Kim et al., 2015). The setting and achieving of effective future emission control policies is therefore difficult, as a substantial proportion of O3 comes from outside individual countries and regions.
Phase 1 of the Task Force on Hemispheric Transport of Air Pollutants (TF-HTAP1) (TF-HTAP, 2010) coordinated several sets of experiments using multiple models to study the source–receptor relationships from the intercontinental transport of O3 and its precursors. It found that at least 30 % of the total change in surface ozone concentration within a particular source region can be attributed to emission changes of similar magnitude that are external to the source region (TF-HTAP, 2010). This highlights the importance of source contributions outside the control of local/regional air pollutant policies, including those of stratospheric origin, natural sources and intercontinental transport. Changes in global methane (CH4) concentrations are also an important contributor to baseline O3 concentrations and are shown to be as important as changes in local source region emissions (TF-HTAP, 2010). Improving our understanding of the impact of anthropogenic emission changes on the source–receptor relationships arising from the intercontinental transport of tropospheric O3 and its precursors will ultimately reduce the uncertainty in the impact of O3 on air quality and climate, improving future predictions.
To predict how O3 concentrations might respond to future changes in emissions, a simple parameterisation was developed based upon the surface O3 response in different chemistry models contributing to TF-HTAP1 (Wild et al., 2012). The surface O3 response in these models was calculated from simulations with reductions in tropospheric O3 precursor emissions across the four major Northern Hemisphere emission regions (Europe, North America, east Asia and south Asia). The parameterisation using these results provided a fast and simple tool to predict future surface O3 concentrations for the Intergovernmental Panel on Climate Change (IPCC) Representative Concentration Pathways (RCPs), highlighting the importance of future changes in emissions and CH4 abundance for surface O3 concentrations and quantifying the associated uncertainty.
A second phase of model experiments, TF-HTAP2, was initiated to extend the work from TF-HTAP1 and further consider the source–receptor relationships between regional emission reductions and air pollutants. Major advances in TF-HTAP2 include more policy-relevant source–receptor regions aligned to geopolitical borders, a larger variety of idealised 20 % emission reduction experiments, more recent (2008–2010) emission inventories that are consistent across all models and the use of new and updated models (Galmarini et al., 2017).
Here, we improve and extend the parameterisation of Wild et al. (2012) by including additional information from TF-HTAP2 to refine the source–receptor relationships arising from emission changes, long-range transport and surface O3 formation. The parameterisation provides the contribution from local, remote and methane sources to the total surface O3 response in each emission scenario. The range of responses from the models contributing to the parameterisation provides an estimate of the uncertainty involved. The parameterisation is extended to estimate changes in tropospheric O3 burden and its impact on O3 radiative forcing. It is then used with the latest emission scenarios from Evaluating the CLimate and Air Quality ImPacts of Short-livEd Pollutants (ECLIPSE) V5a (Klimont et al., 2017, 2018) and the sixth Coupled Model Intercomparison Project (CMIP6) (Rao et al., 2017) to explore how source–receptor relationships change in the future, informing the future direction of emission control policies. These predictions of changes in surface and tropospheric O3 are based solely on changes in precursor emissions, as the parameterisation does not represent any impact from future changes in climate. Future climate change is expected to alter surface concentrations of ozone through changes to meteorological variables such as temperature, precipitation, water vapour, clouds, advection and mixing processes (Doherty et al., 2017).
Section 2 of this paper describes the parameterisation and the updates from TF-HTAP1 to TF-HTAP2, including the extension from surface O3 to global tropospheric O3 and its radiative forcing. Section 3 outlines the testing and validation of the parameterisation. A comparison is made to results from TF-HTAP1, highlighting changes in the O3 response to changes in methane abundance. In Sect. 4, the parameterisation is applied to the ECLIPSE V5a and CMIP6 emission scenarios to predict future surface O3 concentrations over the period 2010 to 2050. Section 5 uses the same future emission scenarios to predict future tropospheric O3 burden and radiative forcing. We conclude by suggesting how this approach could be used to inform future emission policy in relation to O3 concentrations.
2.1 Parameterisation of ozone
The parameterisation developed in this study is based on an earlier version developed from the TF-HTAP1 experiments by Wild et al. (2012). This simple parameterisation enabled the regional response in surface O3 concentrations to be estimated based on changes in precursor emissions and CH4 abundance. The input for this parameterisation came from 14 different models that contributed to TF-HTAP1. All the models ran the same emission perturbation experiments (20 % reduction in emissions of oxides of nitrogen (NOx), carbon monoxide (CO), non-methane volatile organic compounds (NMVOCs) individually and all together) over the four major Northern Hemisphere source regions of Europe, North America, east Asia and south Asia. Additional experiments included global perturbations of emission precursors (E), as well as a 20 % reduction in global CH4 abundance. The multi-model O3 responses from the 20 % emission perturbation experiments (ΔO3e for emissions of NOx, CO and NMVOCs and ΔO3m for CH4) are then scaled by the fractional emission changes (r) from a given emission scenario over each source region (Eq. 1).
The monthly mean O3 response (ΔO3) is calculated as the sum over each receptor region (k) of the scaled O3 response from each model to the individual precursor species (i−CO, NOx and NMVOCs) in each of the five source regions (j – Europe, North America, east Asia, south Asia and the rest of the world), including the response from the change in global CH4 abundance (Eq. 2, reproduced from Wild et al., 2012).
Linear scaling of O3 response is
Scaling accounting for reduced O3 increases from NOx and CH4 is
Scaling for titration regimes where decreasing NOx increases O3 is
A linear emission scale factor (Eq. 3) is used in Eq. (2) for each emission scenario involving the precursor emissions of CO and NMVOCs, and is defined as the ratio of the fractional emission change to the 20 % emission reduction in the TF-HTAP1 simulations. A similar scale factor for methane (fm) is based on the ratio of the change in the global abundance of CH4 to that from the 20 % reduced CH4 simulation (. Perturbations to emissions of CO, NOx and NMVOCs induce a long-term (decadal) change in tropospheric O3 from the change in the oxidising capacity of the atmosphere (OH) and the CH4 lifetime (Wild and Akimoto, 2001; Collins et al., 2002; Stevenson et al., 2004). The long-term impacts from 20 % global emission reductions can reduce the O3 response by 6–14 % from NOx emission changes and increase the O3 response by 16–21 % from CO changes (West et al., 2007). This long-term response is not accounted for in the simulations used here, as CH4 abundances are fixed.
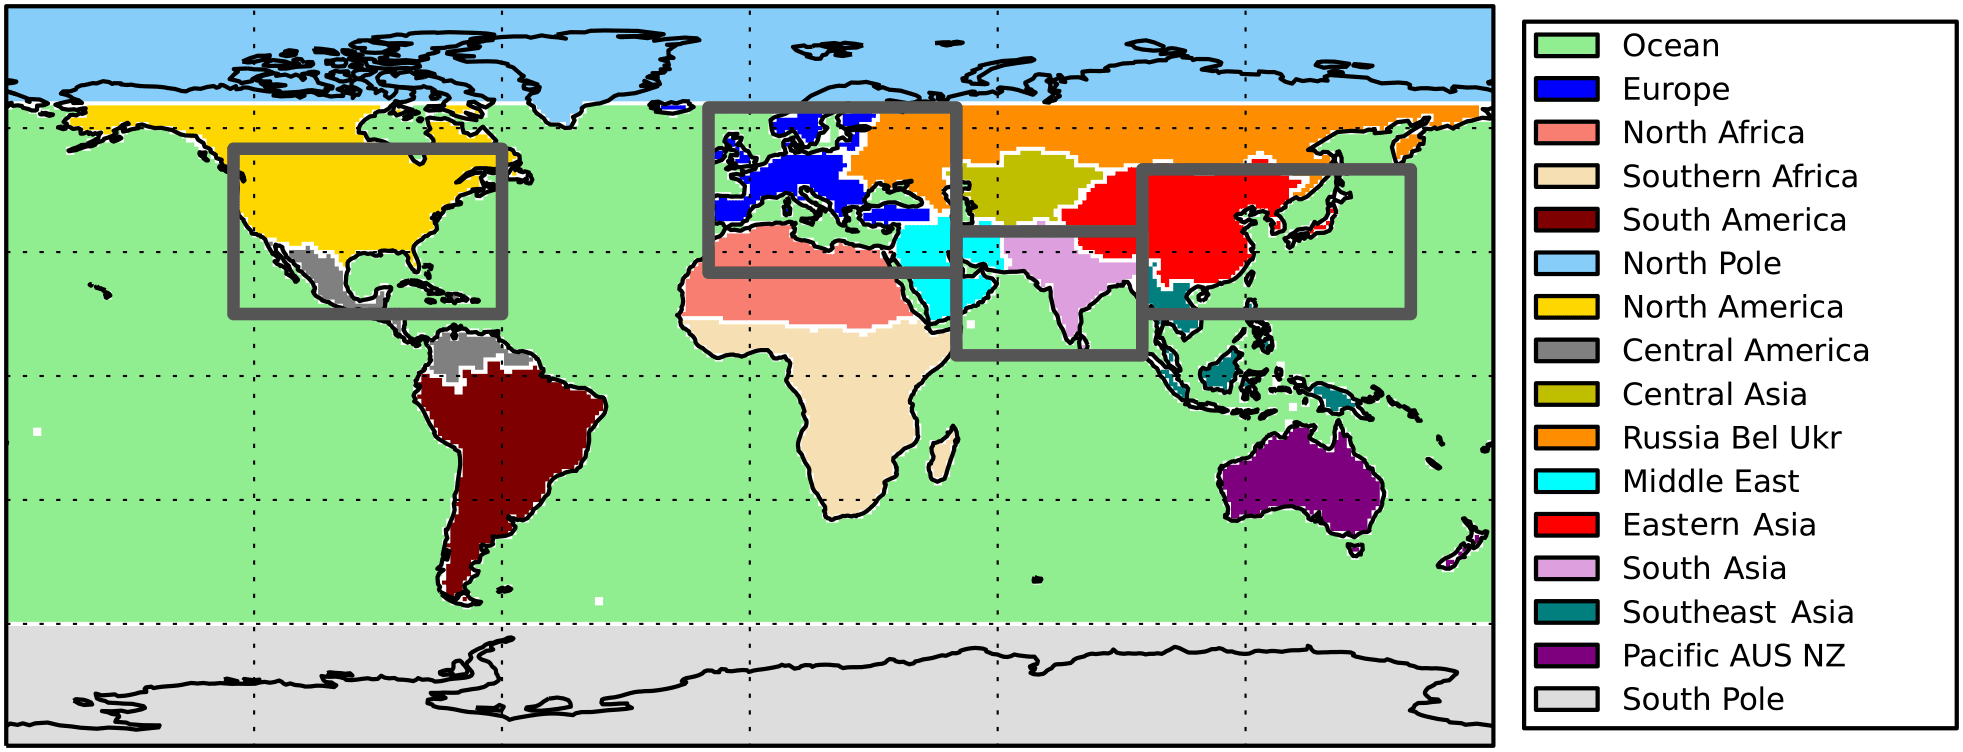
Figure 1Source–receptor regions used in TF-HTAP2 (coloured regions) and TF-HTAP1 (solid grey line boxes) experiments.
Wild et al. (2012) found that this simple linear scaling relationship between emissions and surface O3 was sufficient for small emission perturbations, but that the relationship started to exhibit larger non-linear behaviour for larger perturbations, particularly for NOx. The linear scaling factor was found to be sufficient for the surface O3 response from emission perturbations of CO and NMVOCs, as non-linear behaviour from these precursors is small (Wu et al. (2009). To account for non-linear behaviour of surface O3 to NOx emission changes, a quadratic scaling factor (Eq. 4) is used, based on additional simulations of surface O3 response over a larger range of emission perturbations in Wild et al. (2012).
For the special case of source regions that are under titration regimes, where a reduction in NOx emissions may lead to an increase in O3, the curvature of the response is reversed for NOx emission decreases (Eq. 5), as described in Wild et al. (2012). A linear scale factor is used for emission increases under these conditions (Eq. 3). The spatial extent of ozone titration is assumed constant as the parameterisation is based on differences between two model simulations and is therefore unable to represent any future changes in chemical regime.
The surface O3 response to changes in global CH4 abundances shows a similar degree of non-linearity as that from changes in NOx emissions (Wild et al., 2012). Therefore, the non-linear scale factor (Eq. 4) is also used to represent the O3 response to changes in CH4 abundances.
In summary, the surface O3 response to CO and NMVOC emission perturbations is represented by the linear scale factor (Eq. 3) and to changes in NOx emissions and CH4 abundances by the non-linear scale factor (Eq. 4). For source regions under titration regimes, the surface O3 response to NOx emissions is limited by Eq. (5) for emission decreases but uses the linear scale factor (Eq. 3) for emission increases. The parameterisation is represented schematically in Fig. S1 of the Supplement.
2.2 Phase 2 of TF-HTAP
A second phase of simulations has been undertaken as part of TF-HTAP to further study the transport of air pollutants and their impacts and to assess potential mitigation options (Galmarini et al., 2017). Phase 2 (TF-HTAP2) involved experiments using new and/or updated models that conducted idealised 20 % perturbation simulations of O3 emission precursors for different source regions and source sectors over the years 2008 to 2010. A 20 % emission perturbation was chosen to generate a sizeable response, whilst still being small enough to minimise non-linear chemistry effects. To determine the O3 response to CH4 changes, simulations increasing methane to 2121 ppbv (18 %) and decreasing to 1562 ppbv (−13 %) from a baseline of 1798 ppbv were undertaken in TF-HTAP2. This range in CH4 abundances was selected to encompass the uncertainty in CH4 changes in 2030 from the fifth Coupled Model Intercomparison Project (CMIP5) scenarios of RCP8.5 and RCP2.6 (Galmarini et al., 2017).
The source regions were updated in TF-HTAP2 to represent 14 new regions (excluding the North Pole and South Pole), aligned on geopolitical and land–sea boundaries (Fig. 1). Emission inventories (consistent across all models; Janssens-Maenhout et al., 2015) and meteorology (driving data specific to individual models) were updated to consider the years 2008 to 2010 (the focus of TF-HTAP1 was 2001). The Global Fire Emission Database version 3 (GFED3 – http://globalfiredata.org/, last access: 25 October 2017) biomass burning (grassland and forest fires) emissions were recommended for TF-HTAP2 experiments, although some models selected other inventories. Individual modelling groups used their own information for other natural emission sources (e.g. biogenic VOCs, lightning NOx), as many of these are based on internal model calculations and not externally prescribed datasets.
Priority in TF-HTAP2 was placed on conducting a baseline simulation, a simulation with increased CH4 concentrations and seven regional simulations involving 20 % reductions of all precursor emissions across the globe, North America, Europe, east Asia, south Asia, Russia/Belarus/Ukraine and the Middle East in the year 2010. A lower priority was given to emission perturbation experiments across the remaining source regions and experiments with individual emission perturbations and perturbations to individual source sectors. Models conducted a consistent core set of 10–20 simulations and then undertook other experiments of their own choosing (see Galmarini et al., 2017 for a full list of models and experiments), resulting in sparse coverage for many of the experiments. This contrasts with TF-HTAP1 where all models conducted the same set of 20 % emission perturbation experiments covering all precursor emissions (individually and combined) and CH4 across four source regions.
2.3 Improvements to the surface ozone parametric model for TF-HTAP2
Differences in the experimental setup in TF-HTAP1 and TF-HTAP2 mean that it is not straightforward to replace the simulations underpinning the parameterisation of Wild et al. (2012) with those from TF-HTAP2. The larger number of simulations and fewer models involved preclude the development of a robust parameterisation based solely on TF-HTAP2 simulations. We therefore extend the existing parameterisation by including additional information from the new simulations in TF-HTAP2. To maintain a robust response over the major source regions of Europe, North America, east Asia and south Asia, results from the 14 models contributing to TF-HTAP1 over these regions were retained in the parameterisation. Results from the models contributing to TF-HTAP2 were then incorporated, accounting for the different baseline year for emissions (2010 rather than 2001) and the change in size and number of source regions. The following sections discuss in detail how the results from TF-HTAP2 have been incorporated into the parameterisation.
2.3.1 New baseline year
The baseline year used in the parameterisation was first adjusted from 2001 (TF-HTAP1) to 2010 (TF-HTAP2), to reflect changes in anthropogenic emissions between these years. It should be noted that the emission inventories used in TF-HTAP1 were not consistent between models, particularly for NMVOCs, and this partially contributed to the different O3 responses (Fiore et al., 2009). In TF-HTAP2, the same anthropogenic emission inventory was used in all models to prevent uncertainty in anthropogenic emissions dominating the variability across models.
Table 1Summary of annual mean NOx, CO and NMVOC emission changes (%) between 2000 and 2010 over TF-HTAP1 source regions (values are mean differences from the MACCity and Emissions Database for Global Atmospheric Research (EDGAR) v4.3.1 emission inventories).
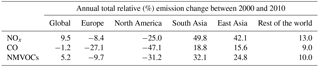
The parameterisation of Wild et al. (2012) was used to calculate new baseline O3 concentrations in 2010 for use in this version of the parameterisation and for comparison to the TF-HTAP2 multi-model mean. To account for different CH4 abundances, the change between TF-HTAP1 and TF-HTAP2 was used. The mean fractional change in NOx, CO and NMVOC emissions between 2000 and 2010 across the TF-HTAP1 source regions from two different emission inventories, MACCity (Granier et al., 2011) and Emissions Database for Global Atmospheric Research (EDGAR) v4.3.1 (Crippa et al., 2016), was used (Table 1), as the use of a specific emissions inventory was not prescribed for the TF-HTAP1 experiments (see Fiore et al., 2009). The MACCity and EDGAR inventories provide a consistent set of emissions in 2000 and 2010, enabling the change in emissions between future and historical time periods to be explored. Table 1 shows that the emissions of NOx, CO and NMVOCs increased in Asia and decreased across Europe and North America over the period 2000 to 2010. The year 2000 was used as a consistent starting point for both emission inventories and can be considered the equivalent of 2001 in representing changes to 2010.
Table 2Summary of multi-model annual mean surface ozone values from all TF-HTAP1 models in 2001 (H-1), the parameterisation of TF-HTAP1 models scaled for emissions in 2010 (H-P) and all TF-HTAP2 models in 2010 (H-2, seven models contributing).
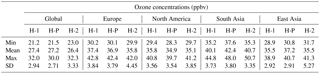
NB: the TF-HTAP2 models used to provide the 2010 ozone concentrations are CAMchem, Chaser_re1, Chaser_t106, C-IFS, GEOS-Chem adjoint, HadGEM2-ES and Oslo CTM.
The parameterised surface ozone response in 2010 was calculated using the method of Wild et al. (2012), based on the individual response of 14 TF-HTAP1 models using the fractional emission changes in Table 1. The parameterised ozone response across the original TF-HTAP1 source–receptor regions was compared to a multi-model ozone concentration in 2010 from the baseline simulations of seven TF-HTAP2 models that use the TF-HTAP2 emissions (Janssens-Maenhout et al., 2015). Table 2 shows that the O3 concentrations from the parameterisation (H-P) are within the spread of the individual model values from TF-HTAP2 (H-2), represented by 1 standard deviation, over most of the receptor regions. The large range and standard deviation in Table 2 highlight the large spread in O3 concentrations over the models in both sets of experiments (H-1 and H-2). The range in O3 concentrations is much larger than the differences between the parameterised values and the TF-HTAP2 multi-model mean in 2010. This indicates that the range of responses over the models dominates the uncertainty in O3 concentrations and is much greater than differences due to the subset of models contributing to each study or from changing emissions over the period 2000 to 2010.
2.3.2 Source region adjustment
The original parameterisation was based on the continental-scale emission source regions defined in TF-HTAP1. To continue using these results in an improved parameterisation, the O3 response fields were adjusted to represent the equivalent source regions in TF-HTAP2. The different regional definitions used within TF-HTAP1 and TF-HTAP2 experiments are shown in Fig. 1 and are particularly large for Europe, where the TF-HTAP1 source region covers parts of five TF-HTAP2 source regions (Europe, Ocean, north Africa, Middle East and Russia/Belarus/Ukraine). O3 response fields from TF-HTAP1 models that formed the basis of the original parameterisation were adjusted to be more representative of the equivalent TF-HTAP2 source region.
No single model contributed experiments in both TF-HTAP1 and TF-HTAP2 to inform the adjustment of source regions. Therefore, 20 % emission perturbation simulations were conducted with the Hadley Centre Global Environment Model version 2 – Earth system configuration (HadGEM2-ES) (Collins et al., 2011; Martin et al., 2011), which contributed to TF-HTAP2 experiments, for the TF-HTAP1 source regions of Europe, North America, east Asia and south Asia. The ratio of the O3 responses between the simulations using TF-HTAP1 and TF-HTAP2 source regions was then applied to the O3 response fields from each of the TF-HTAP1 models used in the parameterisation of Wild et al. (2012). We assume that each model behaves in a similar way as HadGEM2-ES when the source regions are adjusted in this way. This generates an O3 response field from emission perturbations within the equivalent TF-HTAP2 source regions of Europe, North America, east Asia and south Asia. The resulting O3 parameterisation is based on a larger number of models (14 adjusted TF-HTAP1 models) than would have been available from using TF-HTAP2 simulations alone (seven TF-HTAP2 models), allowing for a larger diversity of model responses to represent the four major emission source regions.
Table 3Models contributing to each of the TF-HTAP2 emission perturbation experiments, in addition to those for the source regions of Europe, North America, south Asia and east Asia.
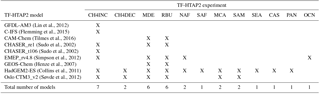
MDE – Middle East, RBU – Russia/Belarus/Ukraine, NAF – north Africa, SAF – southern (Sub-Saharan/Sahel) Africa, MCA – Mexico and Central America, SAM – South America, SEA – southeast Asia, CAS – central Asia, PAN – Pacific Australia and New Zealand, OCN – Ocean (for region definitions, see Koffi et al., 2016).
2.3.3 Additions from TF-HTAP2
The O3 responses from emission perturbations for the other 10 TF-HTAP2 source regions were then used to augment the source-region-adjusted O3 response fields from TF-HTAP1. This extends the parameterisation to cover a much larger range of source regions (14 in total) than was previously possible. Here, receptor regions are defined in accordance with those in TF-HTAP2 (16 in total), although it is possible to define any required receptor regions using the global distribution of O3 responses. Table 3 lists the number of model simulations available for the TF-HTAP2 source regions over and above the four main source regions of Europe, North America, south Asia and east Asia, highlighting the sparseness of results for some of the TF-HTAP2 regions.
The monthly O3 response fields from the additional 10 TF-HTAP2 emission source regions were converted onto the same standard grid (1∘ × 1∘ in the horizontal, with 21 vertical levels based on regular pressure intervals from the surface at 1000 hPa to an upper level of 10 hPa) as used for the four source regions from the adjusted TF-HTAP1 models. In addition, the fields from the TF-HTAP1 models are based on the O3 response to the individual emission perturbations of NOx, CO and NMVOCs, whereas the regional emission perturbation simulations for TF-HTAP2 are based on all emission precursors together (due to the limited availability of results from regional individual precursor emission simulations in TF-HTAP2). To maintain consistency with the TF-HTAP1 parameterisation, the O3 response for each TF-HTAP2 emission perturbation simulation is divided up to represent the response from individual emission precursors, as Wild et al. (2012) and Fiore et al. (2009) previously showed that O3 responses from individual emission perturbations matched closely to those from combined emission changes (within 2–7 %). Therefore, the fractional contribution from individual emissions to the total O3 response in the multi-model mean of TF-HTAP1 models is used to apportion the contribution from individual emissions in TF-HTAP2 simulations to the total O3 response.
The CH4 perturbation experiments in TF-HTAP2 were based on global changes of −13 and +18 % to reflect the expected atmospheric abundance in RCP2.6 and RCP8.5, respectively. These were adjusted to the 20 % reduction used in TF-HTAP1 using the parameterisation, allowing O3 responses to CH4 from the original 14 TF-HTAP1 models and the five TF-HTAP2 models that provided sufficient results to be combined.
2.3.4 Extension to tropospheric ozone
The parameterisation has been extended from the surface through the depth of the troposphere, enabling the calculation of the tropospheric O3 burden. The three-dimensional monthly O3 fields from the model simulations are interpolated onto 21 vertical levels at regularly spaced mid-level pressure intervals from 1000 to 10 hPa. These O3 fields were then used with the parameterisation to generate global and regional tropospheric O3 burdens for each scenario, with the tropopause defined as an O3 concentration of 150 ppbv (Prather et al., 2001). An O3 radiative forcing is derived by using the tropospheric O3 burden from the parameterisation and the relationship between radiative forcing and tropospheric column O3 change based on multi-model ensemble mean results from the Atmospheric Chemistry and Climate Model Intercomparison Project (ACCMIP) (Stevenson et al., 2013). This relationship is provided as a two-dimensional global map, enabling regional and global O3 radiative forcing to be calculated from the parameterisation.
The original parameterisation developed by Wild et al. (2012) was based on the surface O3 response to 20 % continental-scale emission perturbations from TF-HTAP1 for 2001. We have adopted the same approach but have made a number of major improvements: updating the base year to 2010, including additional models from TF-HTAP2, extending the number of source regions to 14 and generating three-dimensional O3 responses to permit calculation of tropospheric O3 burden and O3 radiative forcing for any scenario. To test and verify the improved parameterisation, additional simulations have been conducted with HadGEM2-ES, which are discussed in the following sections.
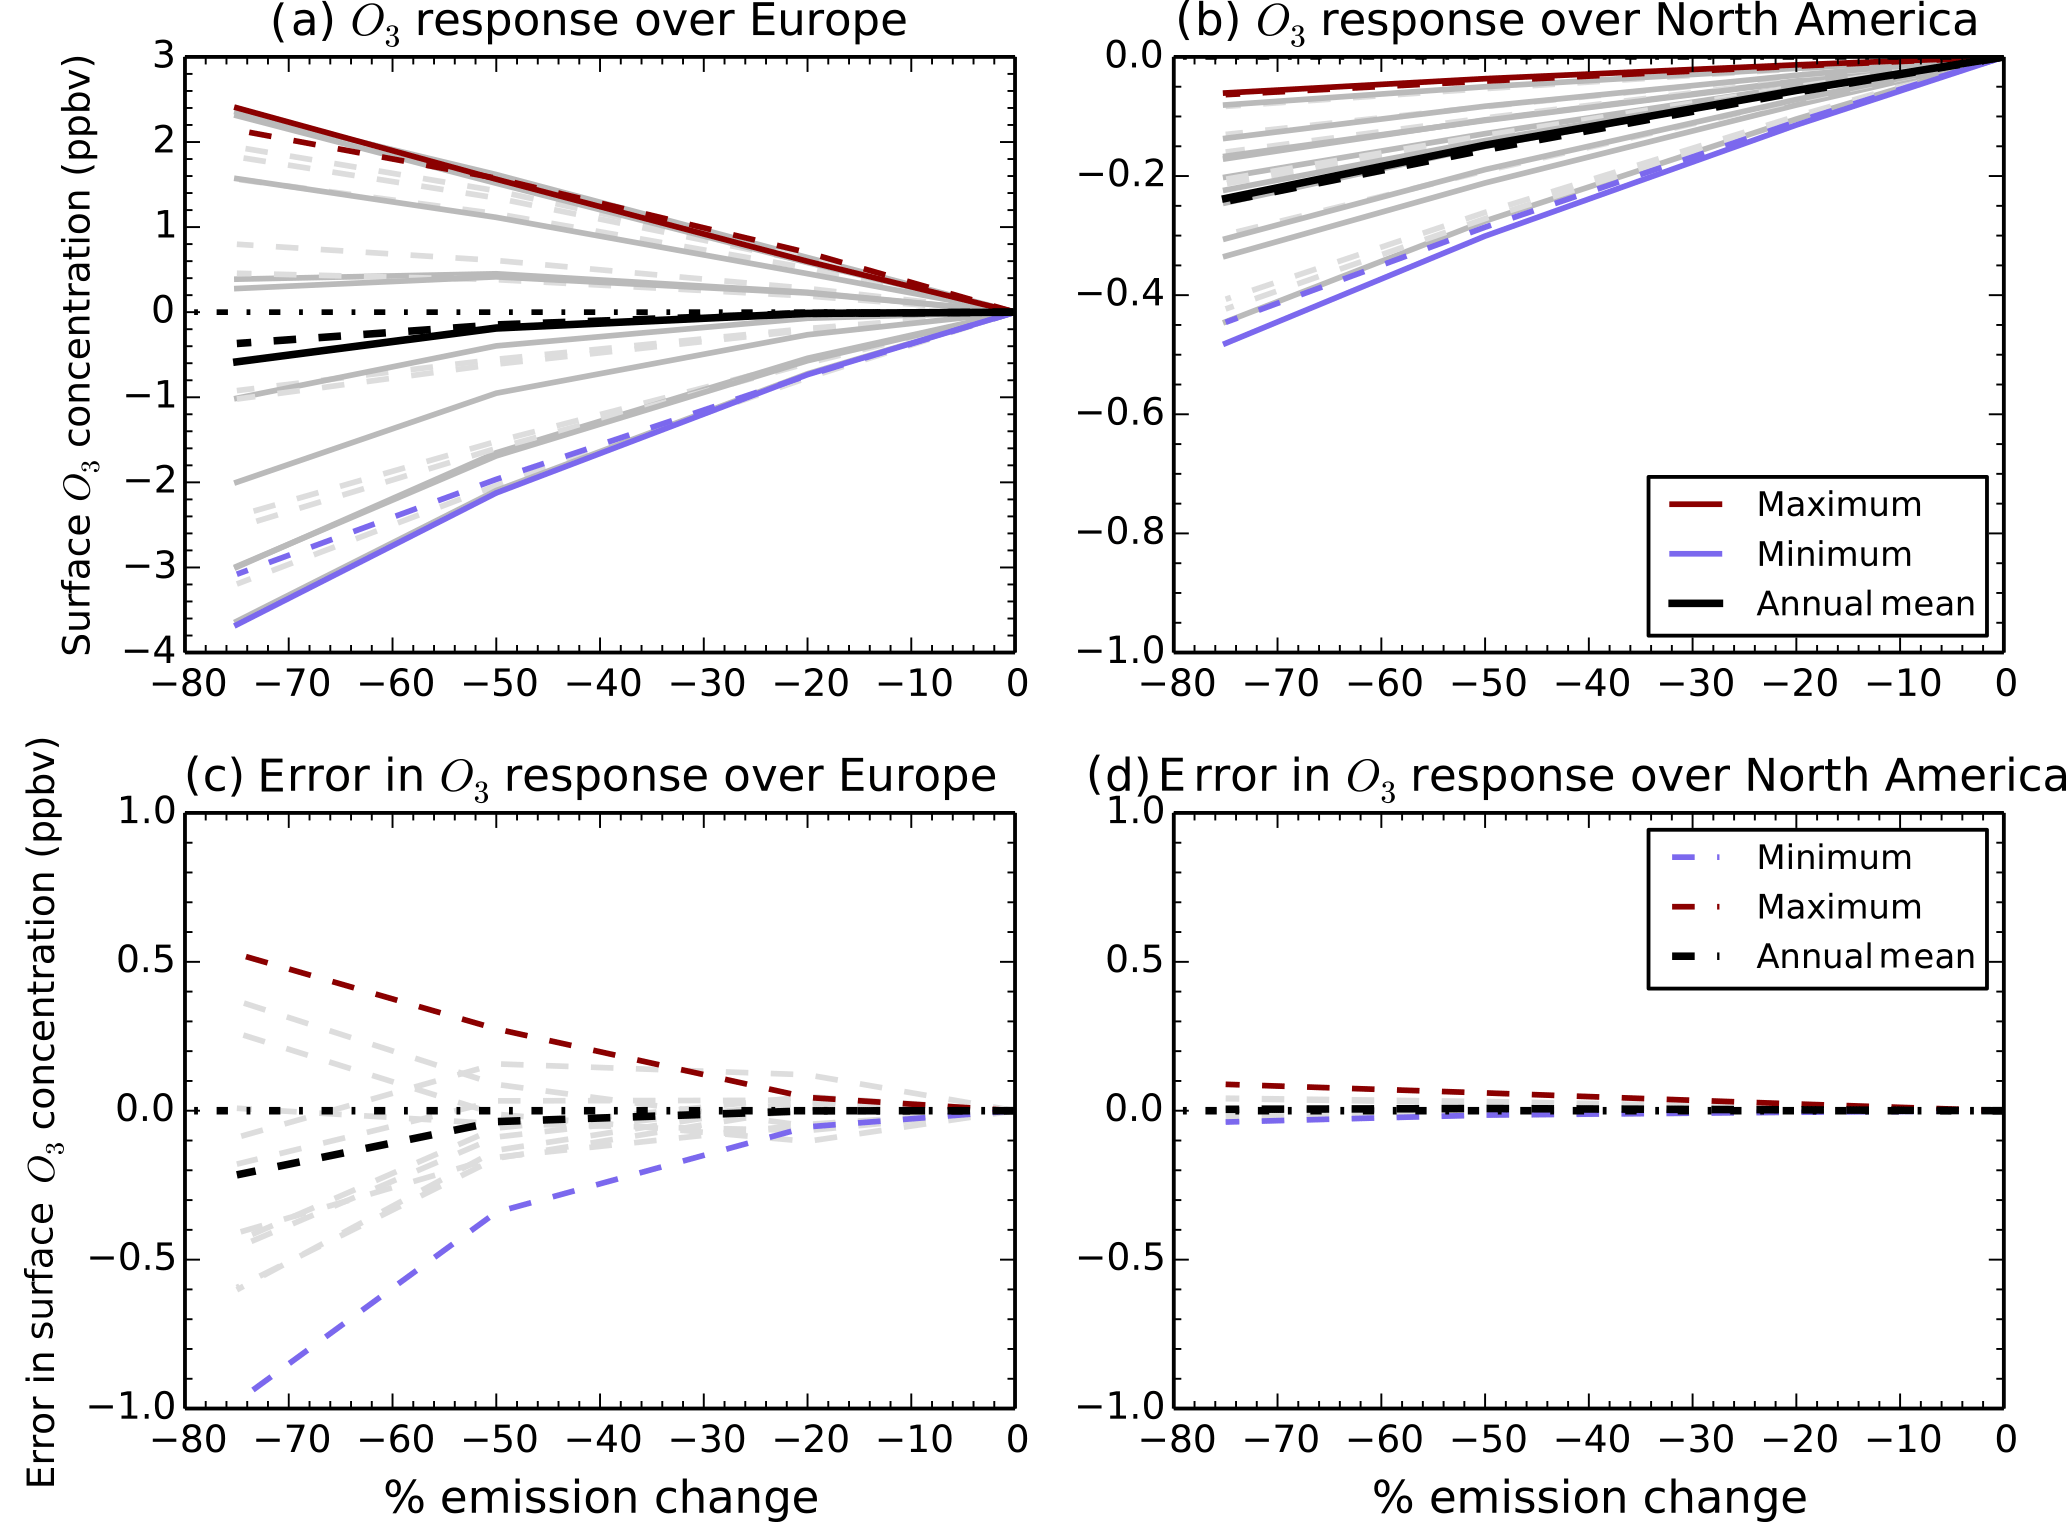
Figure 2Sensitivity of monthly surface O3 changes in HadGEM2-ES (solid lines) and that of the parameterised response using solely HadGEM2-ES as input (dashed lines) to 20, 50 and 75 % reductions in all precursor emissions over the European source region (a) and the remote receptor region of North America (b). The difference (error) between HadGEM2-ES and the parameterised response is shown over Europe (c) and North America (d). Annual mean values are in black with monthly responses in grey, and the highest and lowest months are highlighted in red and blue.
3.1 Limits of linear scaling
We conducted experiments with HadGEM2-ES where all O3 anthropogenic precursor emissions were reduced by 50 and 75 % over Europe, to complement the existing 20 % emission reduction scenarios performed as part of TF-HTAP2. Figure 2 shows a comparison of the annual and monthly surface O3 response from the 20, 50 and 75 % European emission reduction simulations across Europe (a local receptor) and North America (remote receptor) using HadGEM2-ES and the parameterisation based on the O3 response fields from HadGEM2-ES alone (a self-consistent test of the parameterisation). The largest errors of <1 ppbv occur over the source region (Fig. 2c), with smaller errors of <0.1 ppbv for the remote receptor region (Fig. 2d). This small internal error between the parameterisation based on HadGEM2-ES and HadGEM2-ES simulations indicates that the parameterisation of O3 is working well for emission changes at least as great as 50 %. This is similar to the results of Wild et al. (2012) where more detailed testing found that the parameterisation resulted in errors of <1 ppbv for emission perturbations of up to 60 %. Here, monthly mean errors are <1 ppbv even for a 75 % emission reduction (Fig. 2). The parameterisation is not expected to perform as well for emission perturbations of larger than ±60 % and in source regions under titration regimes. Figure S2 compares the output of HadGEM2-ES simulations with the parameterisation based on O3 response fields from multiple models. The magnitude of error is larger at ∼ 2.0 ppbv over Europe and ∼ 0.3 ppbv over North America for a 75 % reduction. This highlights that the uncertainty in the parameterised O3 response is dominated by the large spread in O3 responses over the different models rather than by errors in the parameterisation itself.
3.2 Global emission perturbation
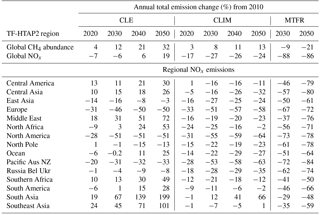
To further test the parameterisation, we compare the surface O3 response from the parameterisation to a HadGEM2-ES model simulation using the ECLIPSE V5a current legislation scenario (CLE) in 2030 (see http://www.iiasa.ac.at/web/home/research/researchPrograms/air/Global_emissions.html (last access: 2 August 2017); Klimont et al., 2017, 2018). The ECLIPSE V5a emission scenarios provide future greenhouse gas and air pollutant emissions based on assumptions of energy use, economic growth and emission control policies for different anthropogenic emission sectors from the International Energy Authority (IEA). Three scenarios from ECLIPSE V5a are used in this study: CLE assumes future implementation of existing environmental legislation, current legislation with climate policies (CLIM) is an energy and climate scenario targeting 2 ∘C of climate warming in which air pollutants and CH4 are reduced, and maximum technical feasible reduction (MTFR) is the introduction of maximum feasible available technology assuming no economic or technological constraints. Emissions of O3 precursor species and CH4 are available at decadal increments over the period 2010 to 2050 for each ECLIPSE scenario (MTFR is only available for 2030 and 2050). The CH4 abundance was derived from the CH4 emissions at decadal increments by using a simple box model that accounts for the sources and sinks of CH4 and the feedbacks on its chemical lifetime following Holmes et al. (2013). Table 4 shows changes in annual CH4 abundances and NOx emissions from the ECLIPSE scenario, with changes in CO and NMVOCs shown in Tables S1 and S2 of the Supplement, respectively. An ECLIPSE CLE 2030 scenario was generated by scaling the anthropogenic emissions in the TF-HTAP2 BASE scenario by the fractional emission changes in NOx, CO and NMVOCs in CLE. A HadGEM2-ES simulation was performed using the change in emissions based on CLE for comparison to the parameterisation.
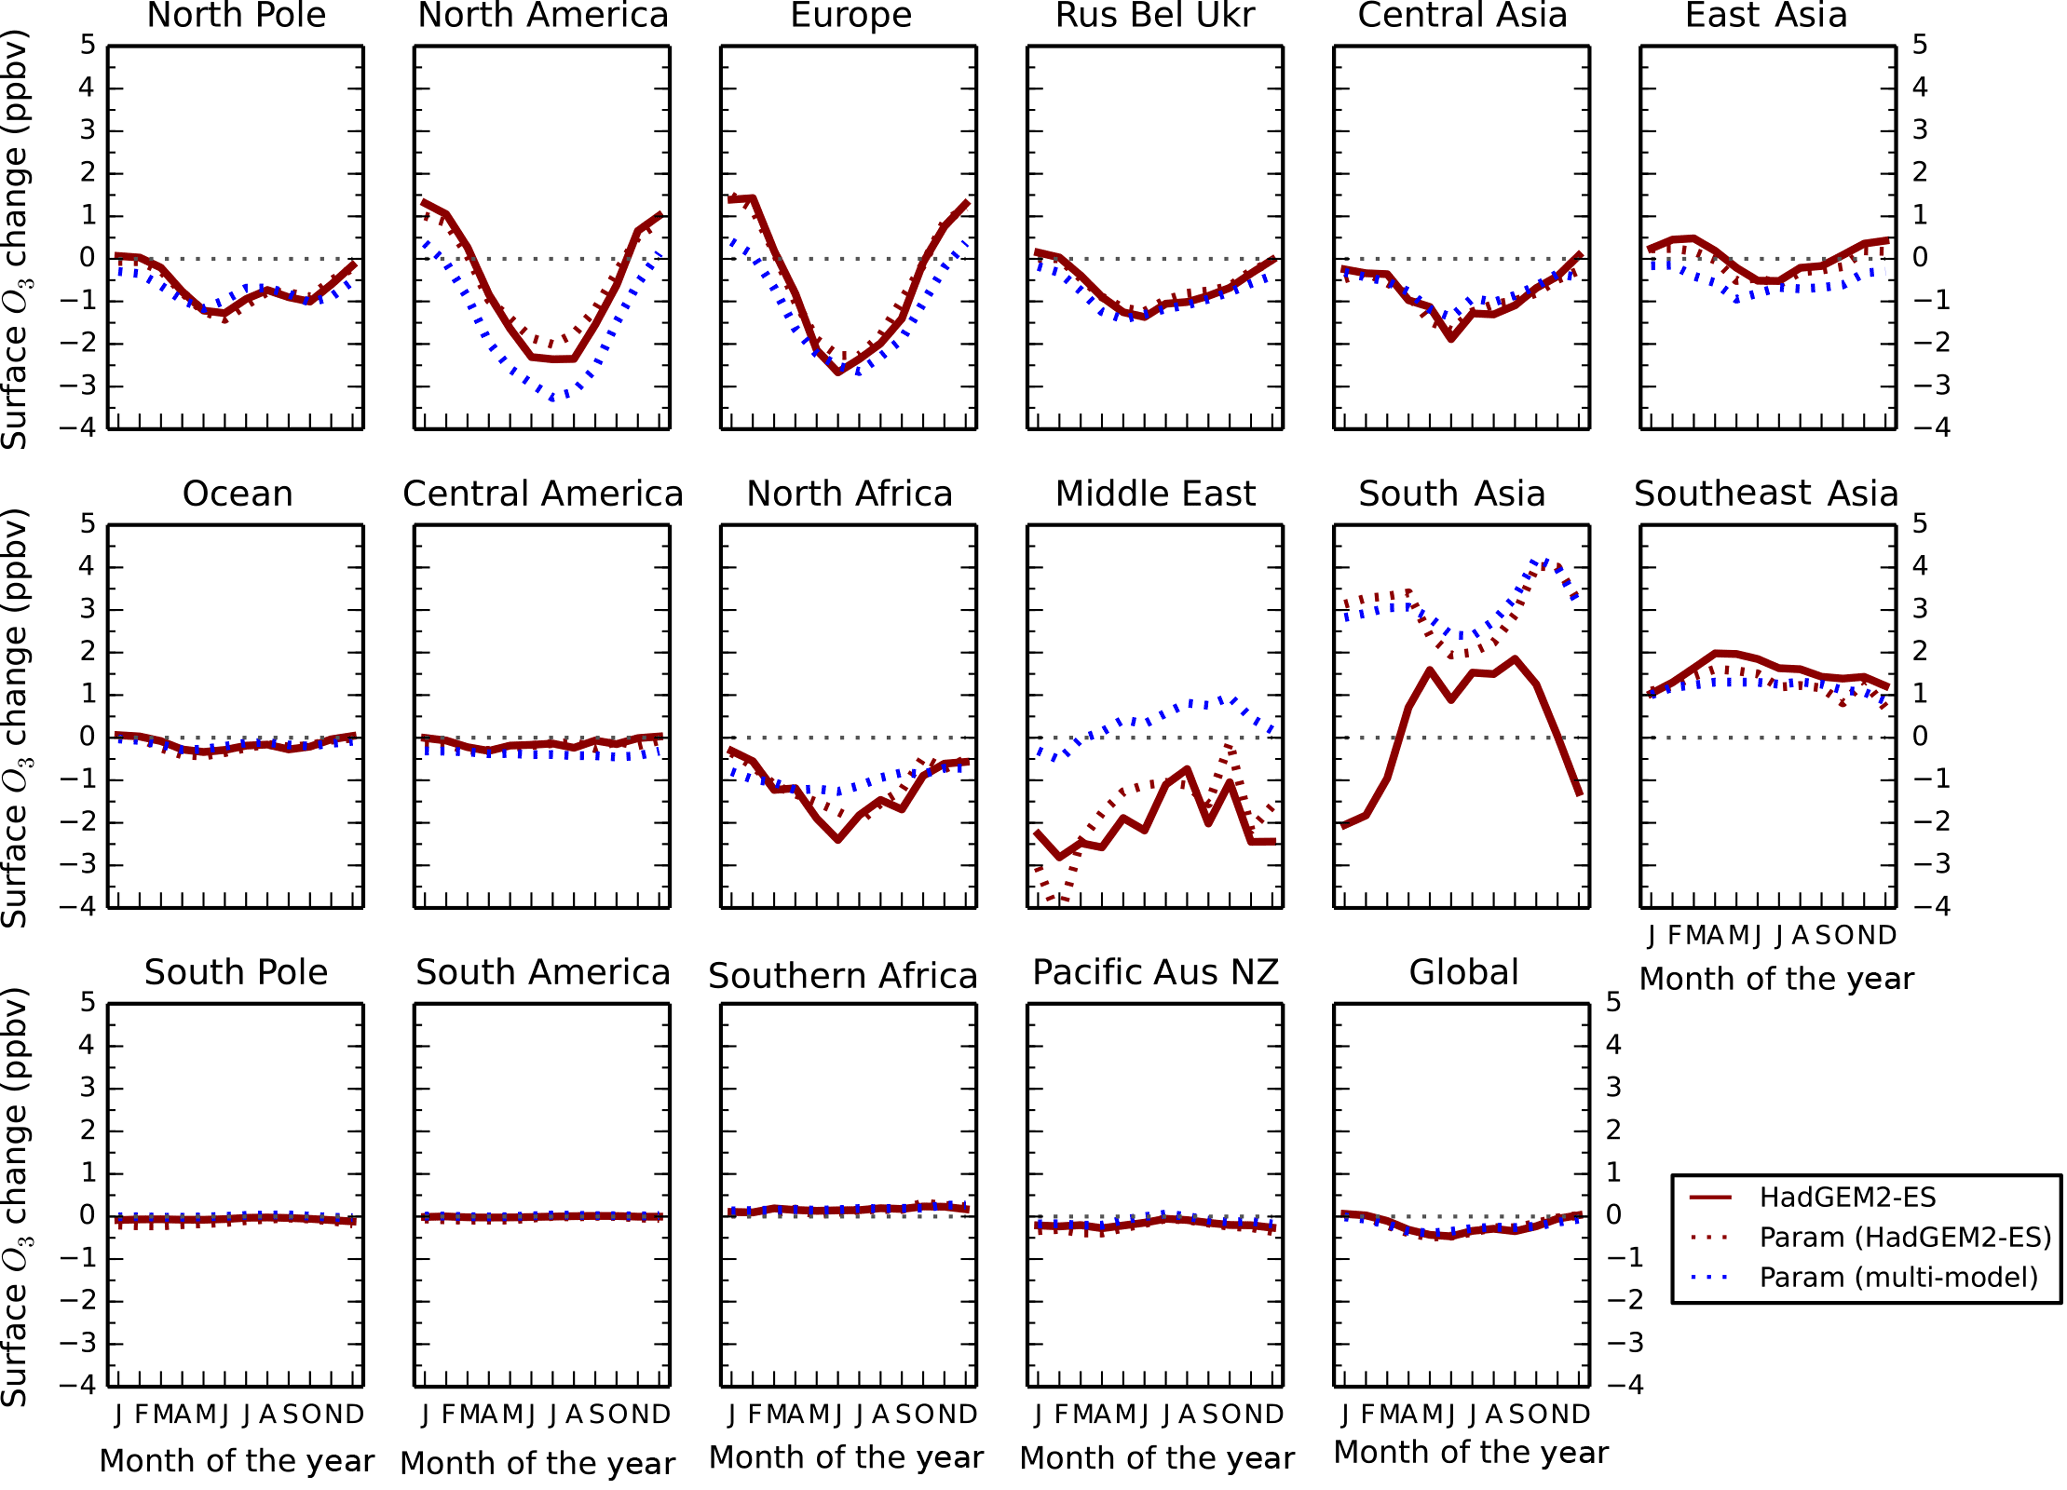
Figure 3Monthly mean regional surface O3 changes between 2010 and 2030 for the ECLIPSE V5a CLE scenario in HadGEM2-ES (red) and the parameterised response based on only HadGEM2-ES inputs (red dashed) and multiple model inputs (blue dashed).
Monthly (Fig. 3) and annual (Table 5) surface O3 changes between 2010 and 2030 over the TF-HTAP2 regions for the ECLIPSE V5a CLE scenario from the HadGEM2-ES simulation are compared to those from the parameterisation (based solely on HadGEM2-ES model responses and based on responses from all models). This shows that the parameterisation is able to reproduce the magnitude and seasonality of surface O3 changes over different regions when compared to the responses from a full global emission perturbation simulation. In particular, the parameterisation is able to reproduce the seasonality in O3 across Europe and North America, indicating that the adjustment to represent the new TF-HTAP2 sources regions is valid. Differences between the parameterisations highlight regions where HadGEM2-ES model responses differ from those of the multi-model mean. This is particularly evident for the Middle East, where there are differences of as much as 2 ppb. However, the parameterisation based on results of the HadGEM2-ES model alone agrees relatively well with the model simulation, as expected.
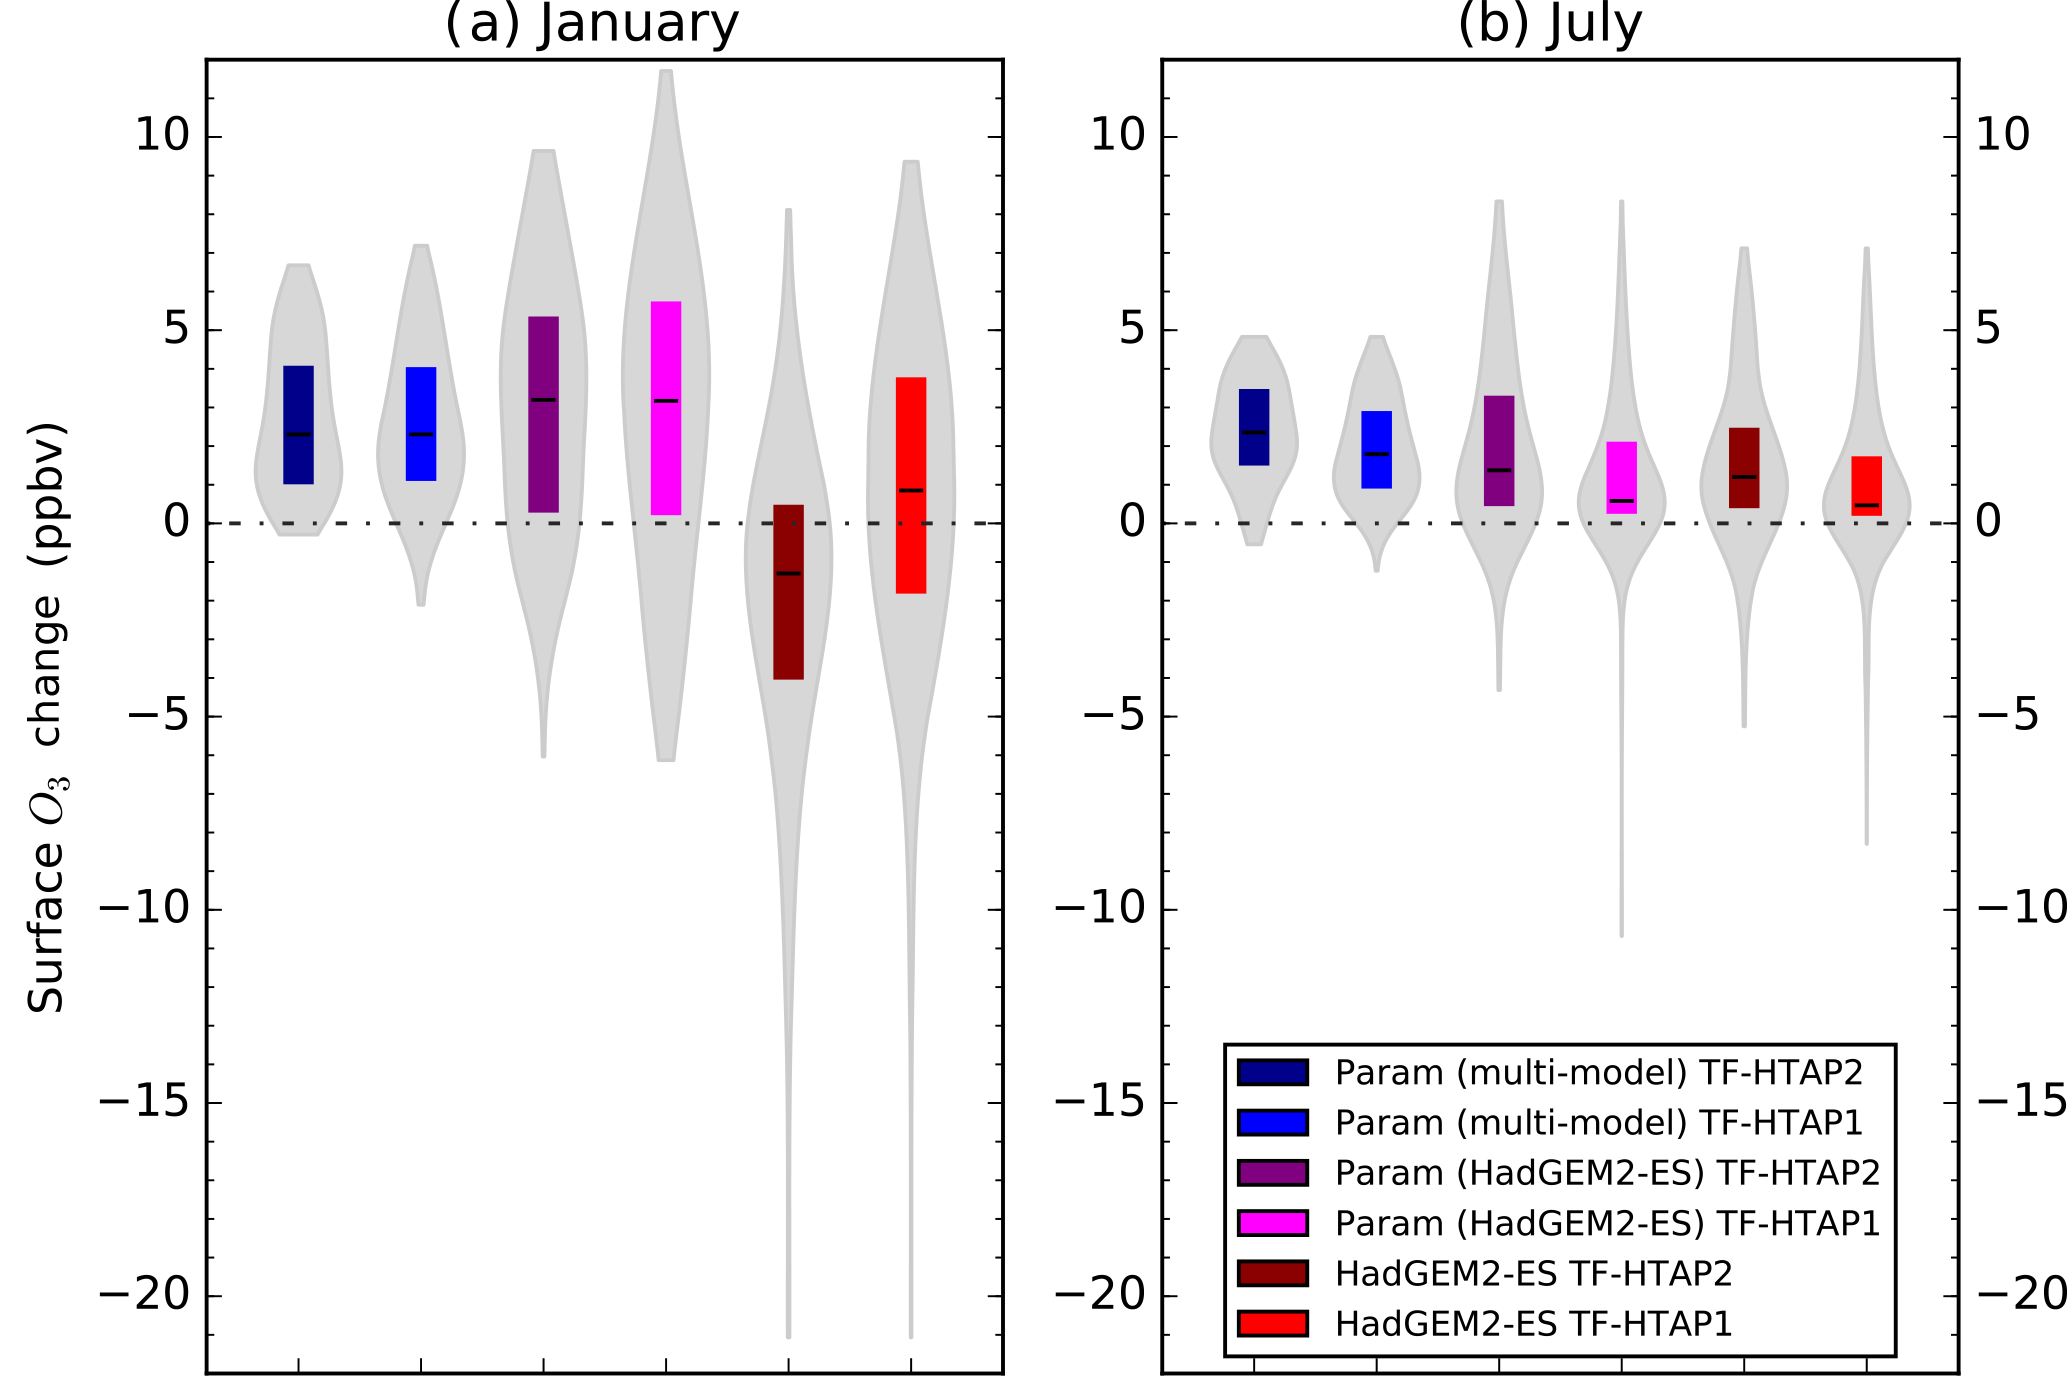
Figure 4January (a) and July (b) monthly mean surface O3 changes over south Asia between 2010 and the ECLIPSE V5a CLE emission scenario in 2030 for HadGEM2-ES and the parameterised response based only on HadGEM2-ES and on multiple models. O3 responses are calculated over the south Asia region as defined in both TF-HTAP1 and TF-HTAP2 (Fig. 1). Grey shading represents the spatial distribution of O3 changes across all grid boxes, coloured boxes show the range of the 25th to 75th percentile values, and the solid line shows the median value over the south Asia region.
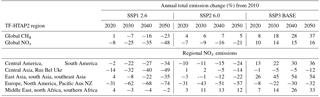
Table 4Percentage change in global CH4 abundance and global and regional annual NOx emissions relative to 2010 over each TF-HTAP2 region for the different ECLIPSE V5a emission scenarios (CLE, CLIM and MTFR). MTFR scenarios are only available for 2030 and 2050.
For south Asia, the parameterisation based on HadGEM2-ES and on the multi-model responses agrees well but differs substantially (in sign and magnitude) from the HadGEM2-ES simulated O3 changes. The largest difference in surface O3 concentrations of 5 ppbv between the model and the parameterisation occurs in the winter months (December–February), with differences in summer being much smaller (0.5 to 1 ppbv). Over the south Asia region, the ECLIPSE CLE emission scenario predicts a ∼ 70 % increase in NOx emissions by 2030 (Table 4). The large increase in emissions causes the chemical environment in HadGEM2-ES in January to shift from O3 production to that of titration (Fig. S3). The parameterisation is not able to represent this shift (Fig. S4) as it is based on a single ozone response to a 20 % emission reduction (Fig. S5) and is unable to capture the strongly non-linear transition into a net ozone titration regime. This is a smaller problem over North America, Europe or east Asia, as wintertime titration regimes are already present over these regions. This effect seen over south Asia highlights a weakness in the parameterised approach in representing strongly non-linear chemical regimes where there are large emission changes, although we note that the errors would be worse if a linear scaling was used. The boundary layer mixing in HadGEM2-ES over south Asia (a region with challenging topography) has been shown to be insufficient, particularly in winter (Hayman et al., 2014; O'Connor et al., 2014), and a large increase in NOx emissions could lead to a transition to O3 titration over this region, accounting for some of the discrepancy in surface O3 responses. However, it is able to represent the O3 responses in the TF-HTAP2 models for a smaller emission change of 20 % over south Asia (Table 6).
Table 5Parameterised responses based only on HadGEM2-ES input for annual mean surface ozone, global ozone burden and ozone radiative forcing using the ECLIPSE CLE emission scenarios in 2030, with changes calculated relative to the year 2010.
1 Parameterisation based only on HadGEM2-ES input.
2 Ozone radiative forcing is calculated by applying the same methodology as
in the parameterisation (using the relationship between radiative forcing
and tropospheric column O3 change based on multi-model ensemble mean
results from ACCMIP).
As the parameterisation of Wild et al. (2012) did not show a similar discrepancy over south Asia for large emission perturbations, a comparison has been made between the monthly surface O3 response from HadGEM2-ES and the parameterisation across both the TF-HTAP1 and TF-HTAP2 definitions of south Asia in January and July (Fig. 4). This shows that continental O3 titration in January is less evident in the HadGEM2-ES simulation over the larger TF-HTAP1 south Asia region, as it includes a large area of ocean. The TF-HTAP2 south Asia region is only continental and HadGEM2-ES shows the larger impact of O3 titration over the continental region in January. The parameterisation and HadGEM2-ES O3 responses agree much better over south Asia in July when there is less evidence of O3 titration effects. The parameterisation, using only HadGEM2-ES as input, is not able to represent the O3 response in HadGEM2-ES over TF-HTAP2 south Asia as it is based on a 20 % emission reduction simulation of HadGEM2-ES, where the extent of O3 titration over the continental area is small. Additional model simulations conducted with large emission increases over south Asia would be valuable to further explore this issue, although none are currently available.
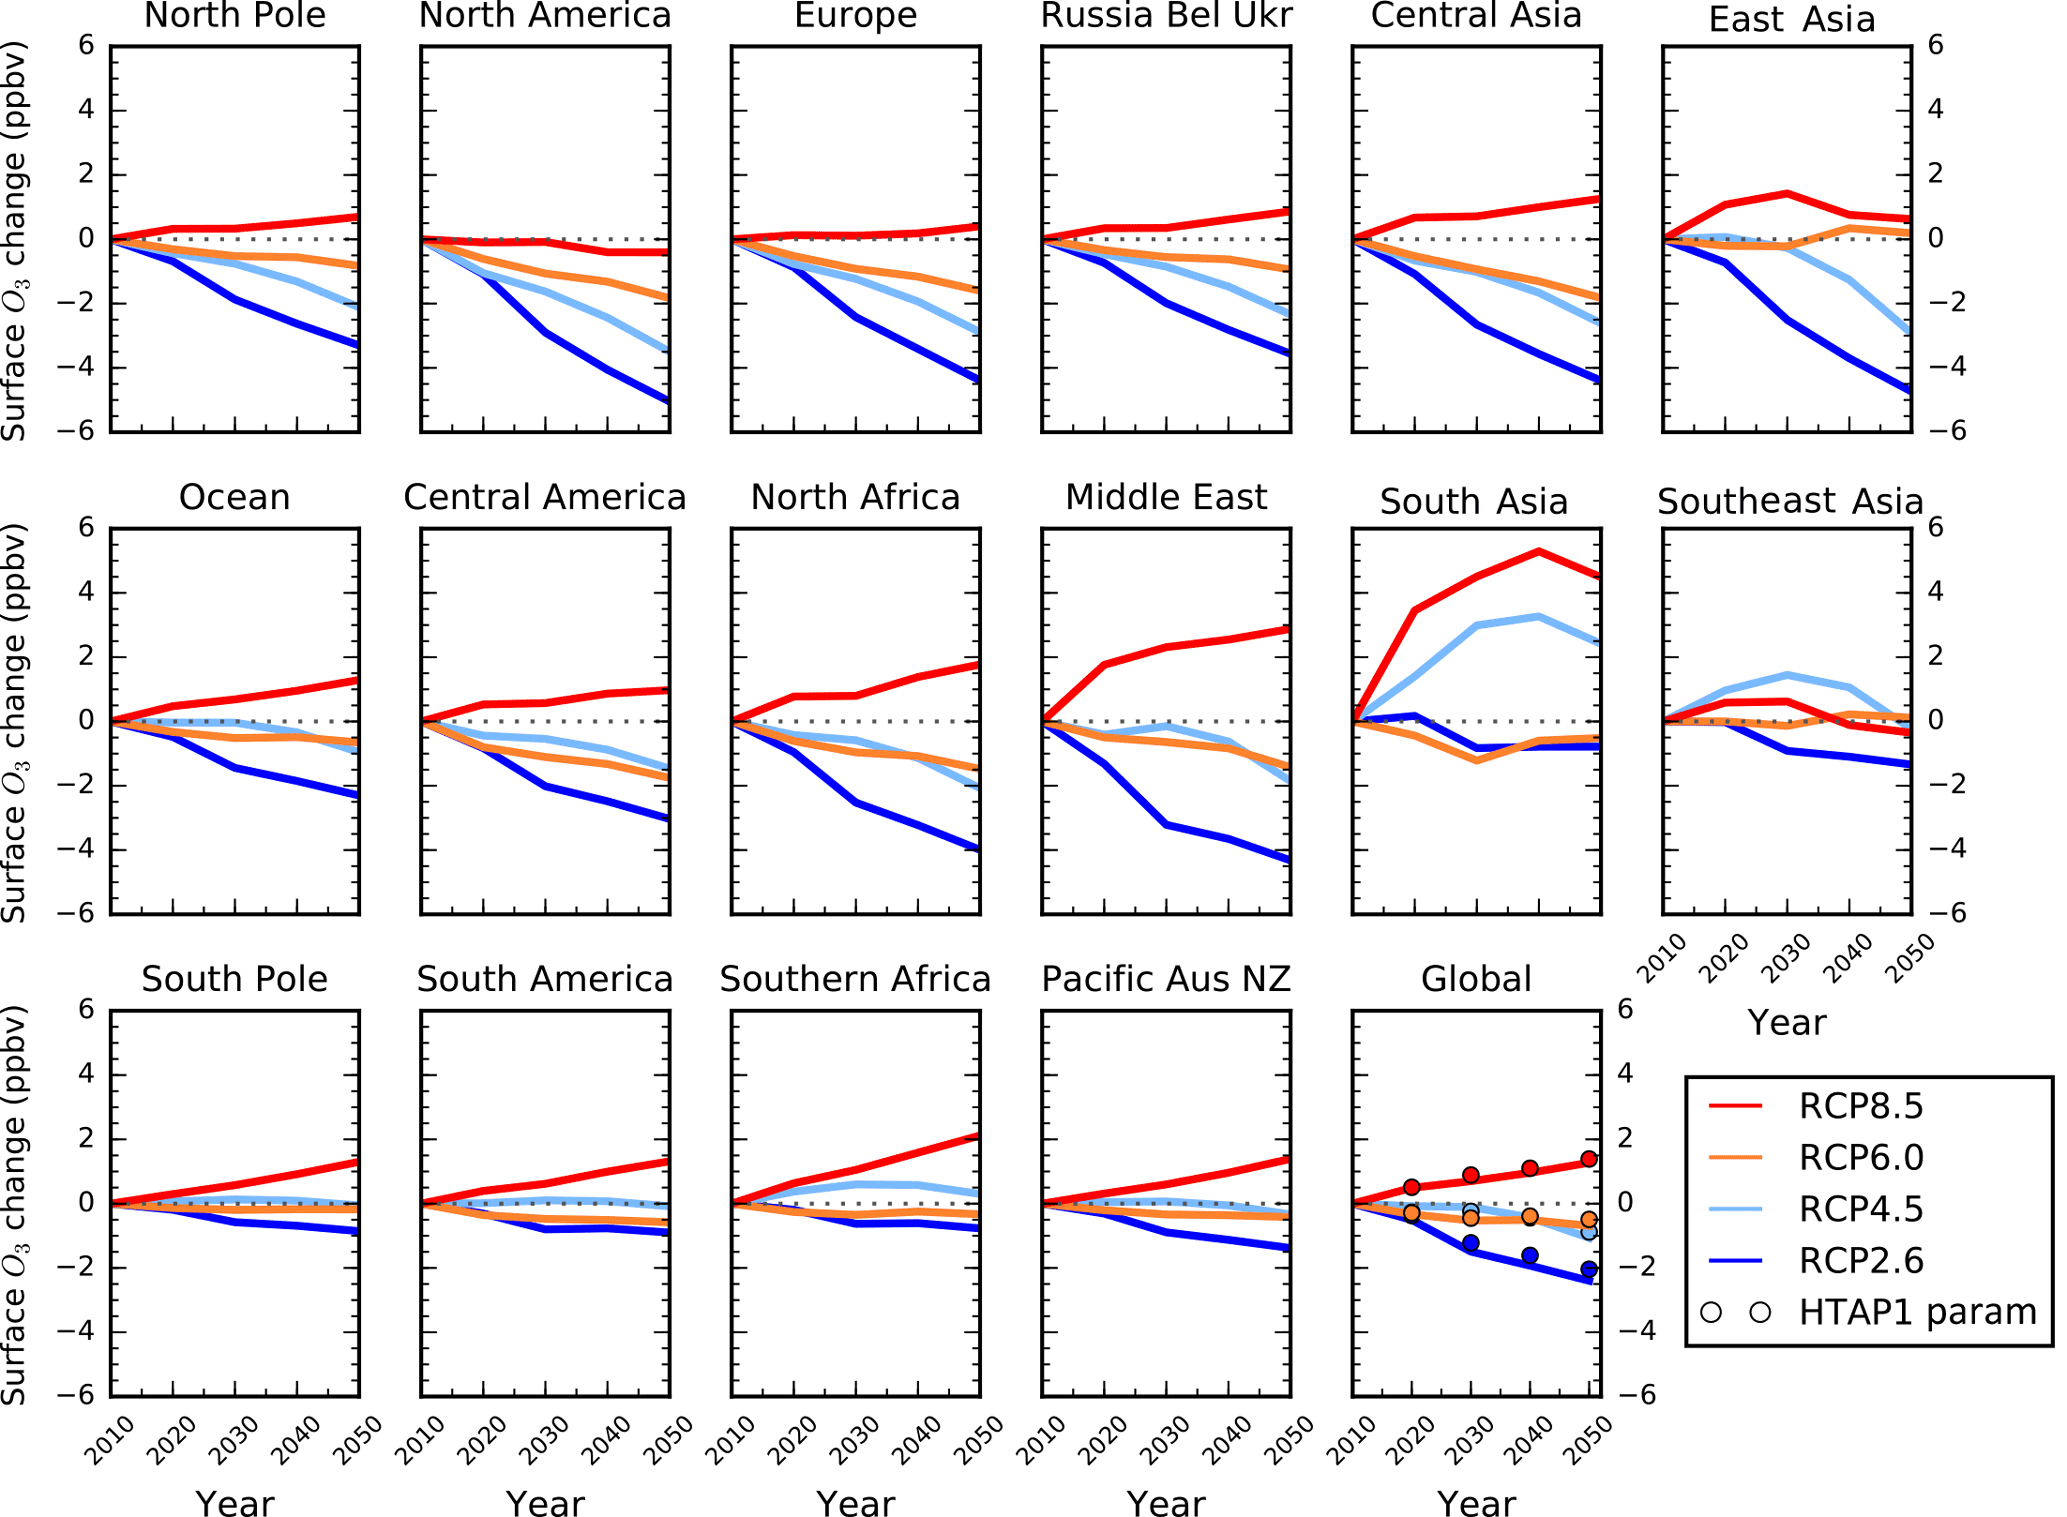
Figure 5Annual mean regional surface O3 changes between 2010 and 2050 from the parameterisation for the CMIP5 emission scenarios of RCP8.5 (red), RCP6.0 (orange), RCP4.5 (light blue) and RCP2.6 (blue). The global surface O3 response from the parameterisation of Wild et al. (2012) for each scenario is represented as circles, but due to differences in regional definitions a straightforward comparison with TF-HTAP1 regions (Europe, North America, south Asia and east Asia) is not possible.
Table 6Monthly and annual mean surface O3 changes (ppbv) over south Asia due to a 20 % reduction in anthropogenic precursor emissions over this region. Multi-model mean values are shown with ±1 SD for the available TF-HTAP2 models and the parameterised approach based on multiple models.
NB: models contributing to the multi-model mean are C-IFSv2, CAMchem, CHASER_re1, CHASER_t106, GEOSCHEM-adjoint, HadGEM2-ES and Oslo CTM3v2.
These results highlight that caution is needed when applying the parameterisation with emission changes larger than 50–60 %, as noted previously in Wild et al. (2012). In particular, the shift into O3 chemical titration regimes cannot be represented easily in a simple parameterisation. For smaller emission changes, the parameterisation is shown to be relatively robust at representing monthly surface O3 changes.
3.3 Comparison to HTAP1
3.3.1 CMIP5 scenarios
We now use the improved parameterisation described above to explore how future predictions of regional surface O3 for the RCPs used in CMIP5 have changed since TF-HTAP1. The four RCPs assume different amounts of climate mitigation to reach a target anthropogenic radiative forcing in 2100: RCP2.6, RCP4.5, RCP6.0 and RCP8.5 (van Vuuren et al., 2011). Emissions of O3 precursor species and CH4 are available at decadal increments over the period 2010 to 2050 for each RCP. CH4 emissions are converted to CH4 abundances in each RCP using the MAGICC model which takes into account feedbacks on the CH4 lifetime (Meinshausen et al., 2011). The parameterisation only accounts for the impact from changes in anthropogenic emissions over the period 2010 to 2050 and does not account for changes in climate, but on this near-term timescale changes in O3 are dominated by emission changes rather than climate effects (Fiore et al., 2012). There are large differences in global CH4 abundances in the four scenarios, and this strongly influences the O3 responses.
Figure 5 shows the change in surface O3 across TF-HTAP2 regions for each of the RCPs. Surface O3 decreases across most regions in the majority of the scenarios as O3 precursor emissions are reduced. The largest increases in surface O3 occur over south Asia in RCP8.5 due to the expected increases in O3 precursor emissions from 2010 to 2050, although we note that this effect may be exaggerated by the large increase in NOx emissions here in RCP4.5 and RCP8.5. Surface O3 concentrations are predicted to increase over most regions in RCP8.5 with increases of 2 ppbv by 2050 over the Middle East and southern Africa (Table S3). The results in Fig. 5 across Europe, North America, south Asia, east Asia and globally are similar to those based on TF-HTAP1 in Wild et al. (2012) (Fig. 5 and Table 7) but differ slightly in magnitude due to the change in the spatial extent of the individual source regions from TF-HTAP1 to TF-HTAP2. Additionally, the parameterisation here provides O3 changes for other regions that were not previously available, including the Middle East and Africa. This provides useful additional information on surface O3 over these important regions under future emission change.
Table 7Annual mean surface O3 change (ppbv plus 1 standard deviation) in 2030 and 2050 (relative to 2000) for each RCP scenario derived from the parameterisation in this study and that of Wild et al. (2012).
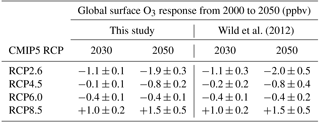
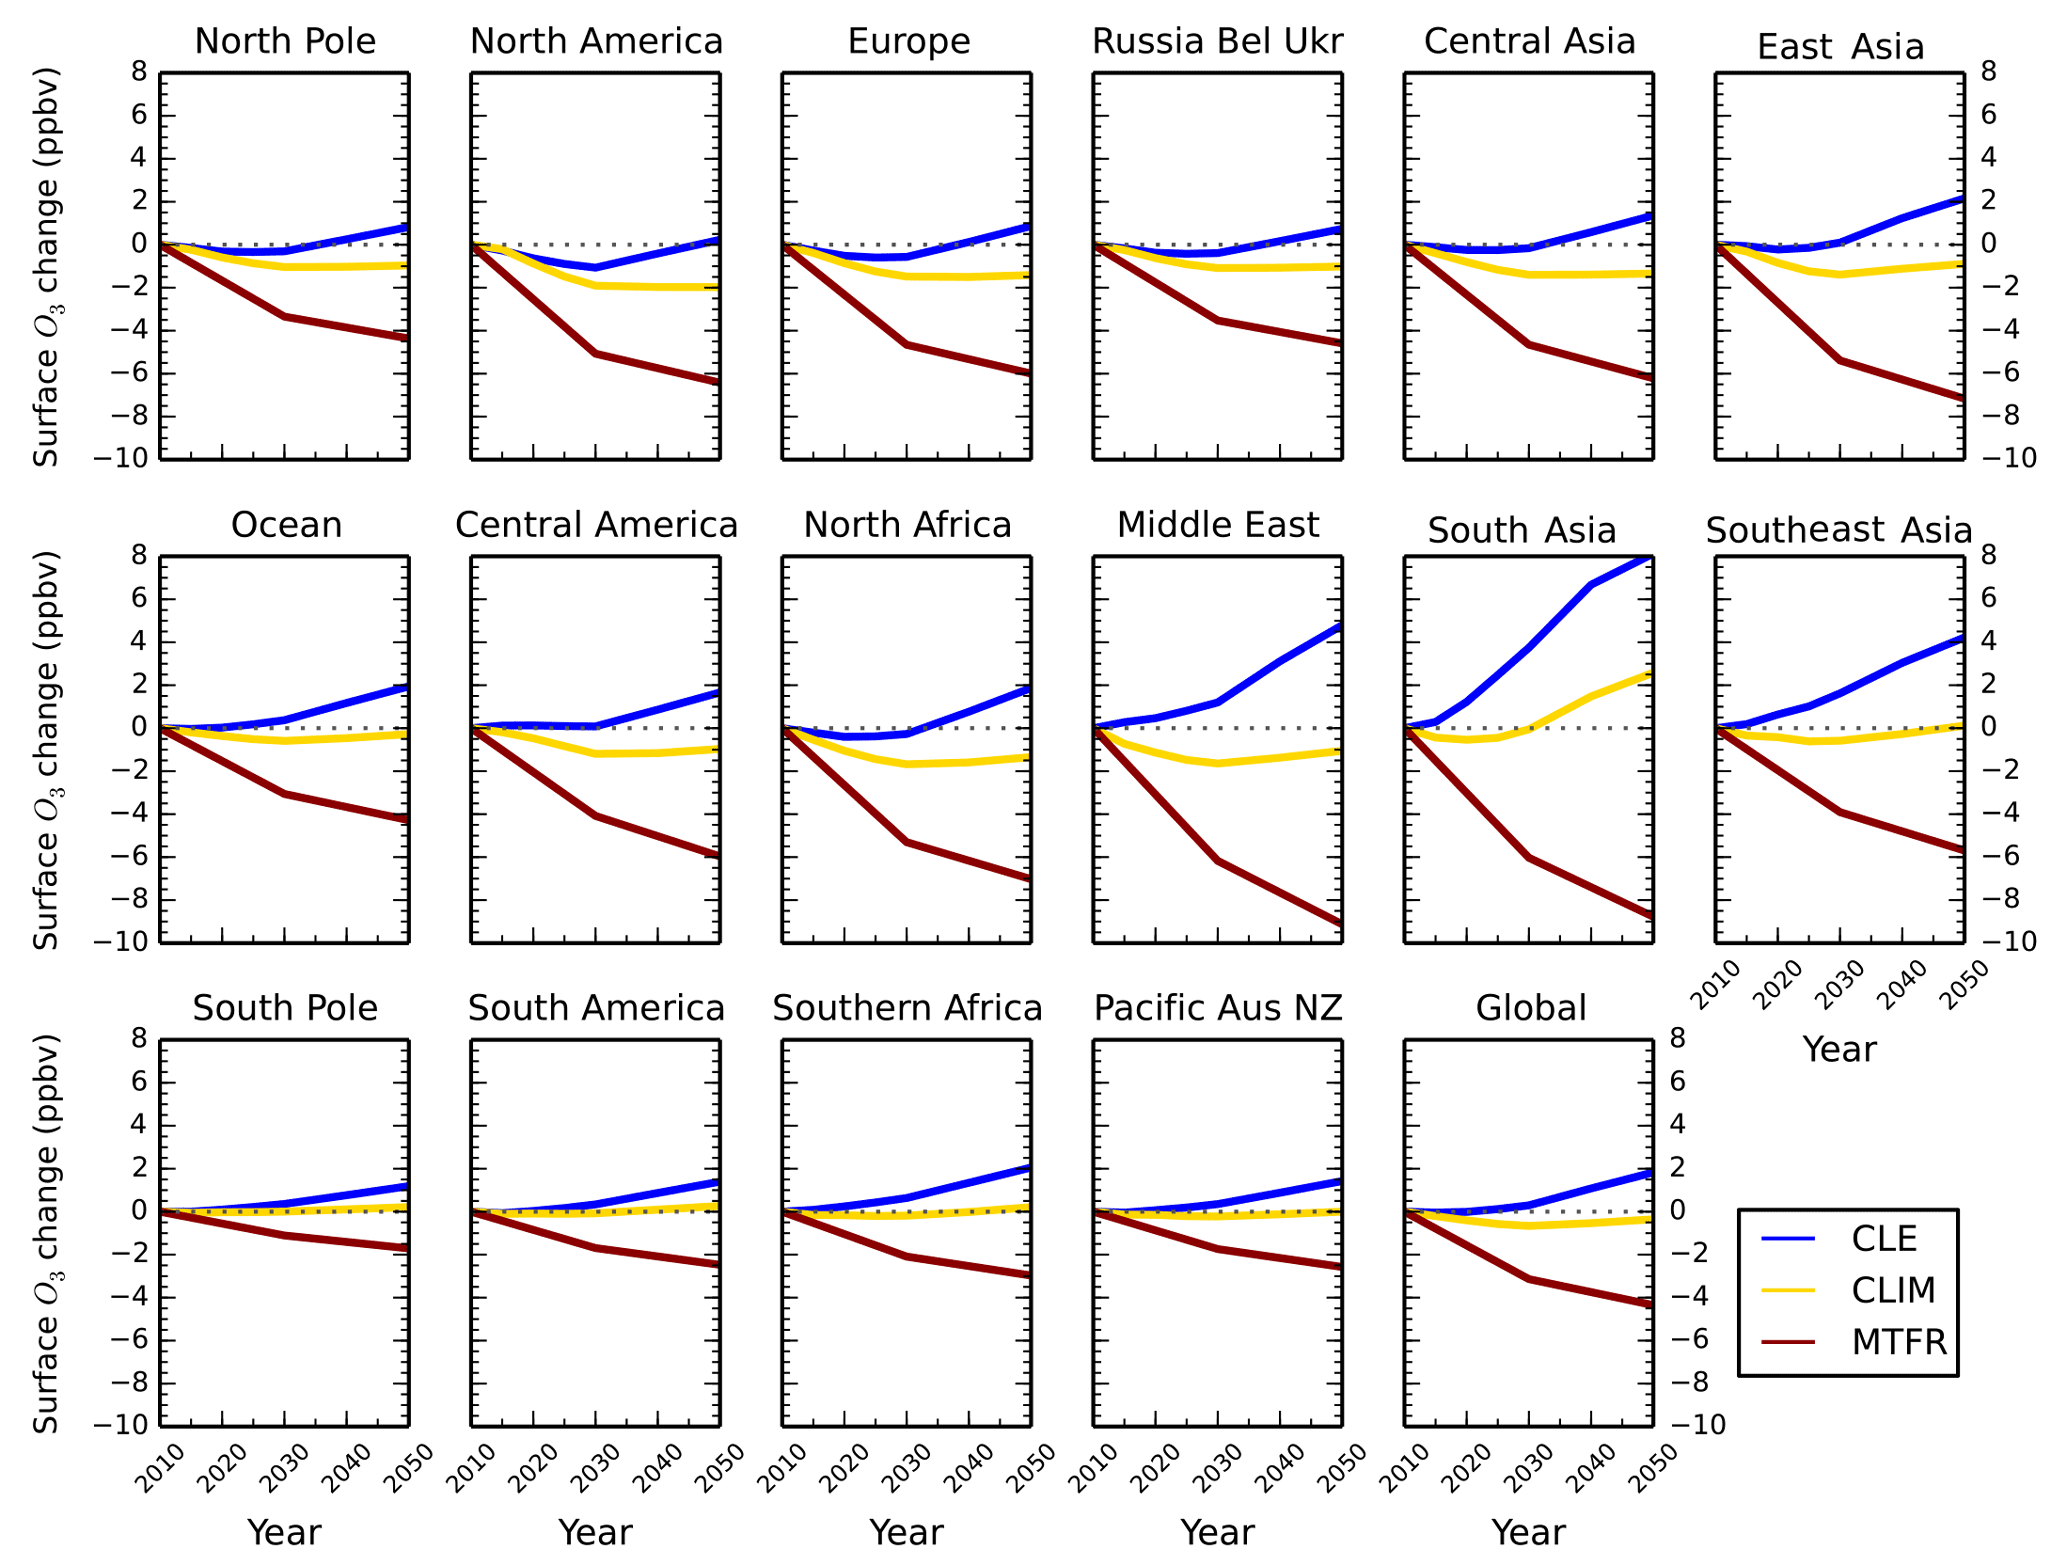
Figure 6Annual mean change in regional surface O3 concentrations between 2010 and 2050 from the parameterisation for the ECLIPSE V5a emissions under the CLE (blue), CLIM (gold) and MTFR (red) scenarios.
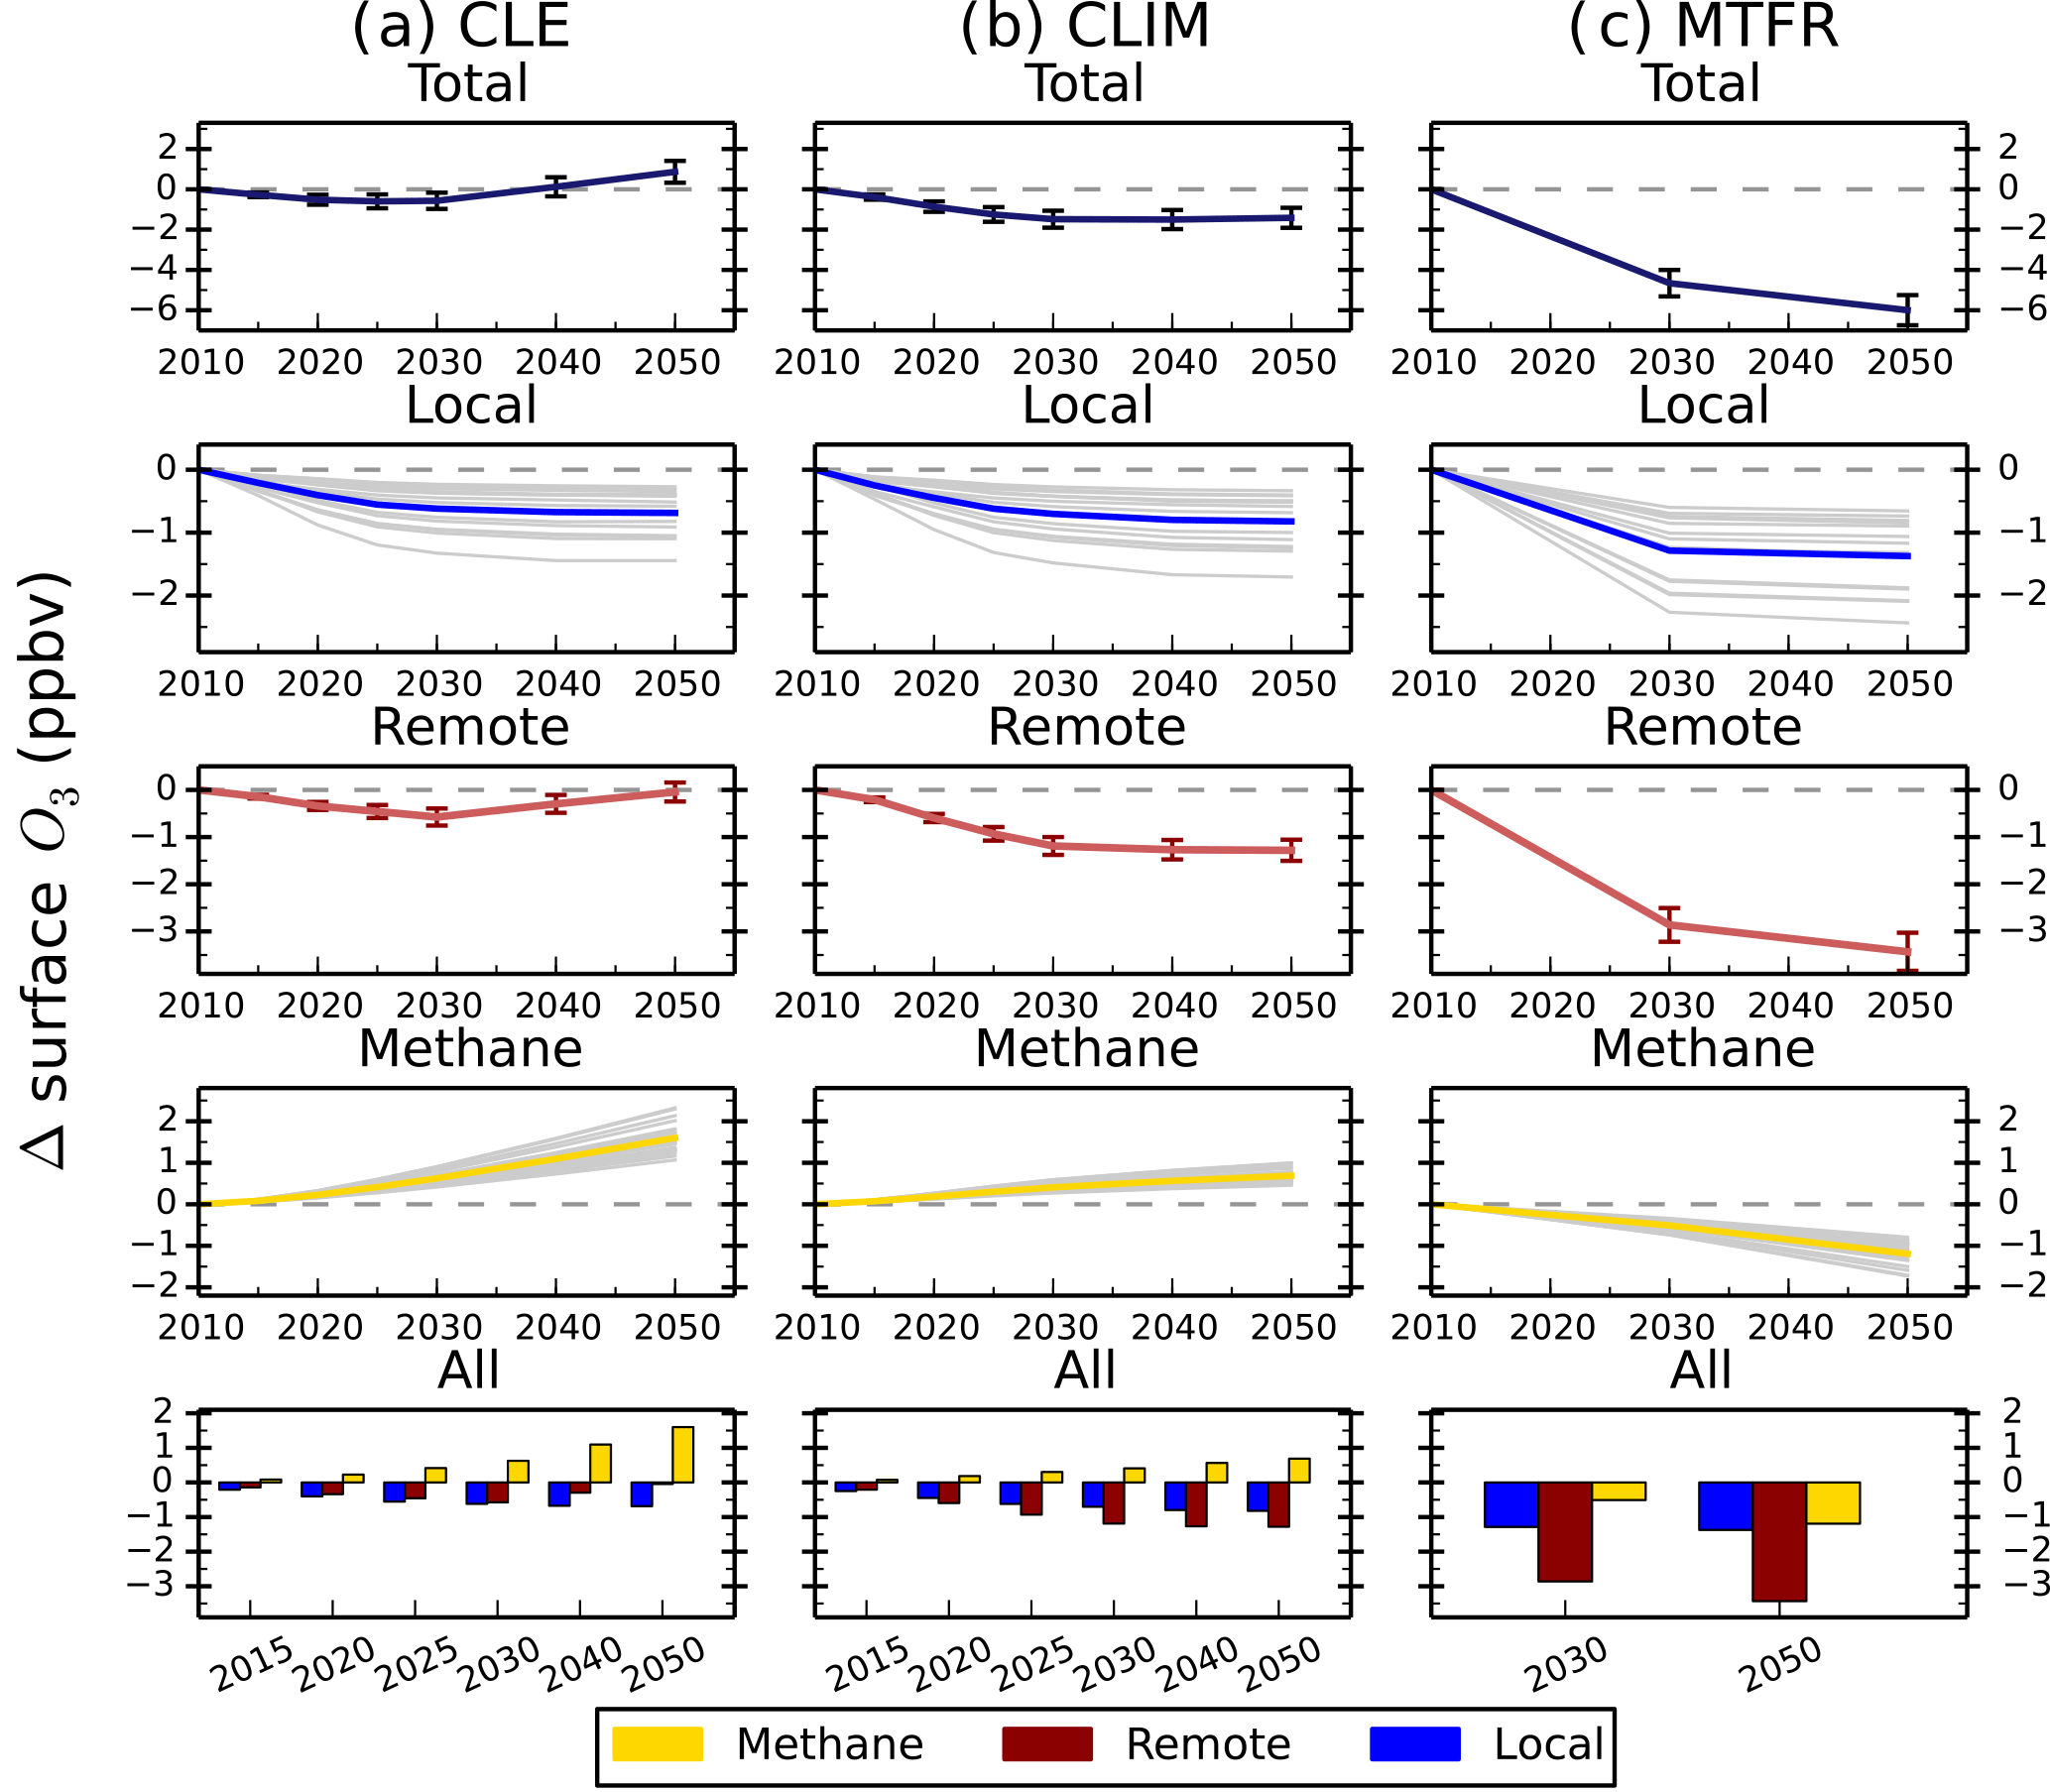
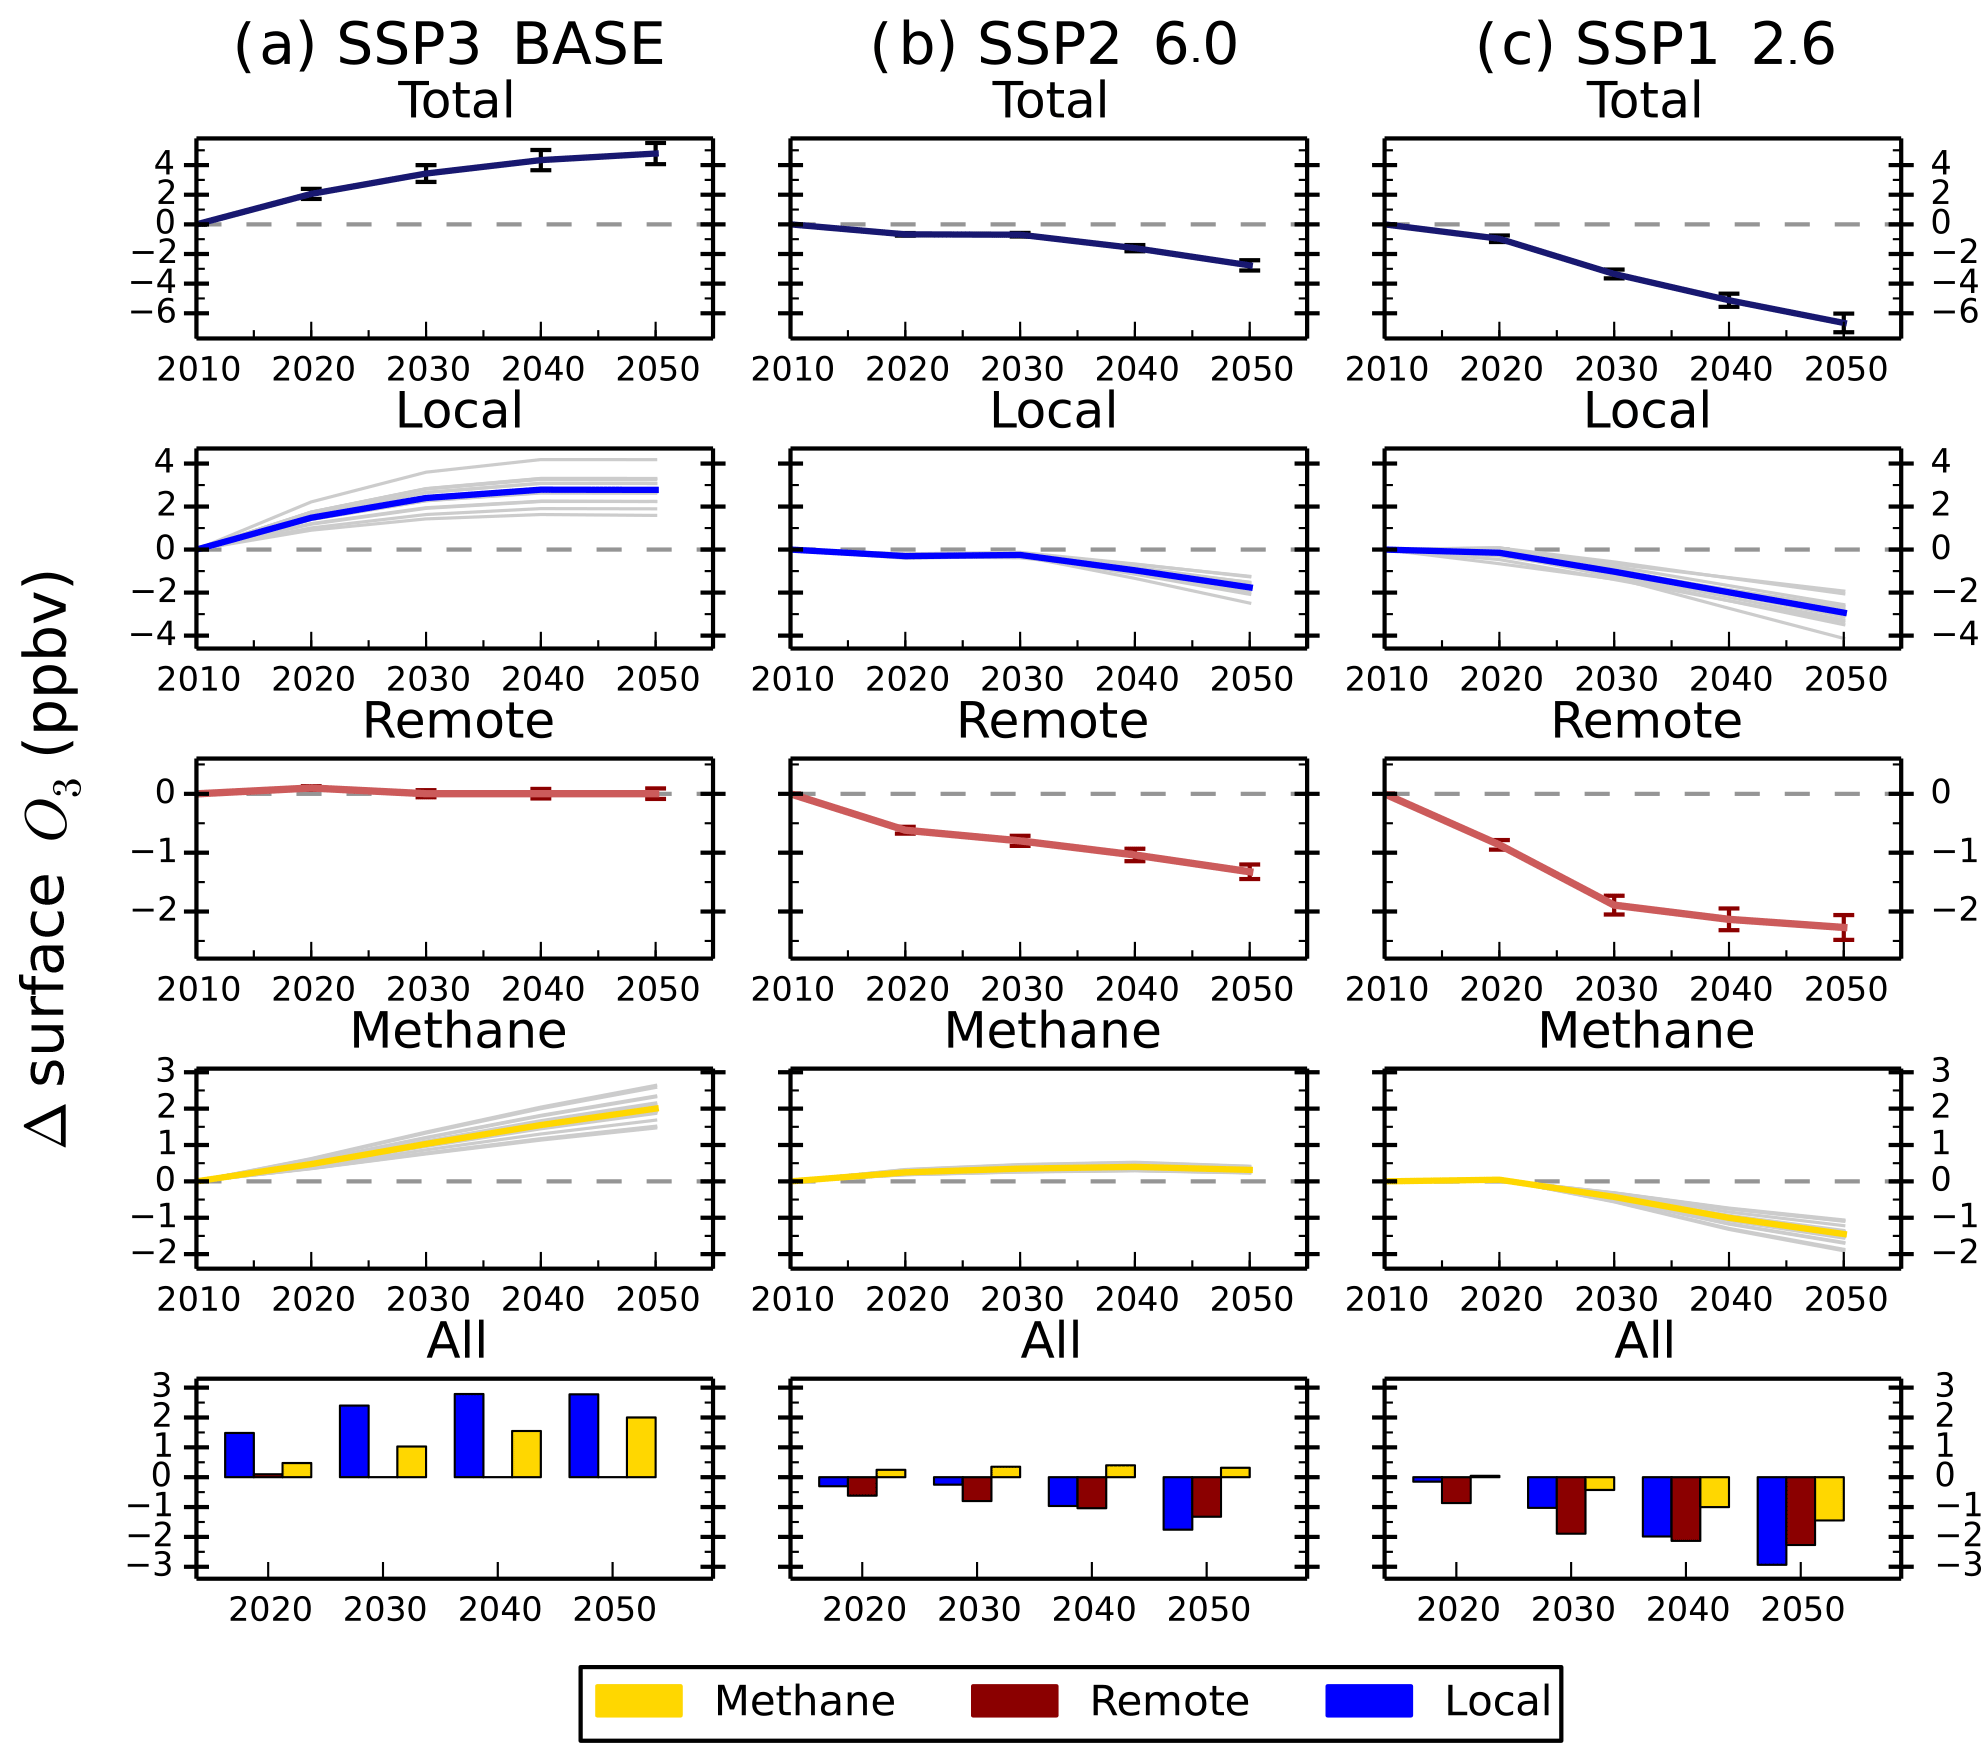
Figure 7Total annual mean change in regional surface O3 concentrations over Europe and the contribution of local (blue), remote (red) and methane (gold) sources between 2010 and 2050 from the parameterisation for the ECLIPSE V5a emissions under the CLE (a), CLIM (b) and MTFR (c) scenarios. Grey lines on the local and methane panels represent individual model estimates of O3 changes, showing the spread in model responses; solid lines show the multi-model mean. Error bars represent 1 standard deviation over the model range. The last row of panels shows the O3 response from individual sources plotted together for each year.
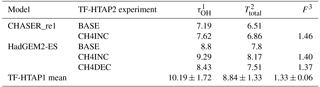
Table 8Methane lifetime (τ) and feedback factor in TF-HTAP2 models that provided appropriate data (OH and CH4 concentrations).
1 CH4 lifetime for loss by tropospheric OH (years)
is defined as atmospheric burden in each experiment divided by the tropospheric
CH4 loss rate with OH using a tropopause defined as a concentrations
of O3
of 150 ppb.
2 Total atmospheric CH4 lifetime (years) is defined as the
reciprocal mean of τOH and assuming a lifetime in the
stratosphere and soils of 120 years and 160 years, respectively (Prather
et al., 2001).
3 The feedback factor is the ratio of the atmospheric response (or
perturbation) time to the global atmospheric lifetime. It is defined as , where S is determined from the BASE and CH4
perturbation simulations and defined as and
CH4 abundances for TF-HTAP2 are 1798 ppbv in BASE, 1562 ppbv in
CH4DEC and 2121 ppbv for CH4INC (Prather et al., 2001).
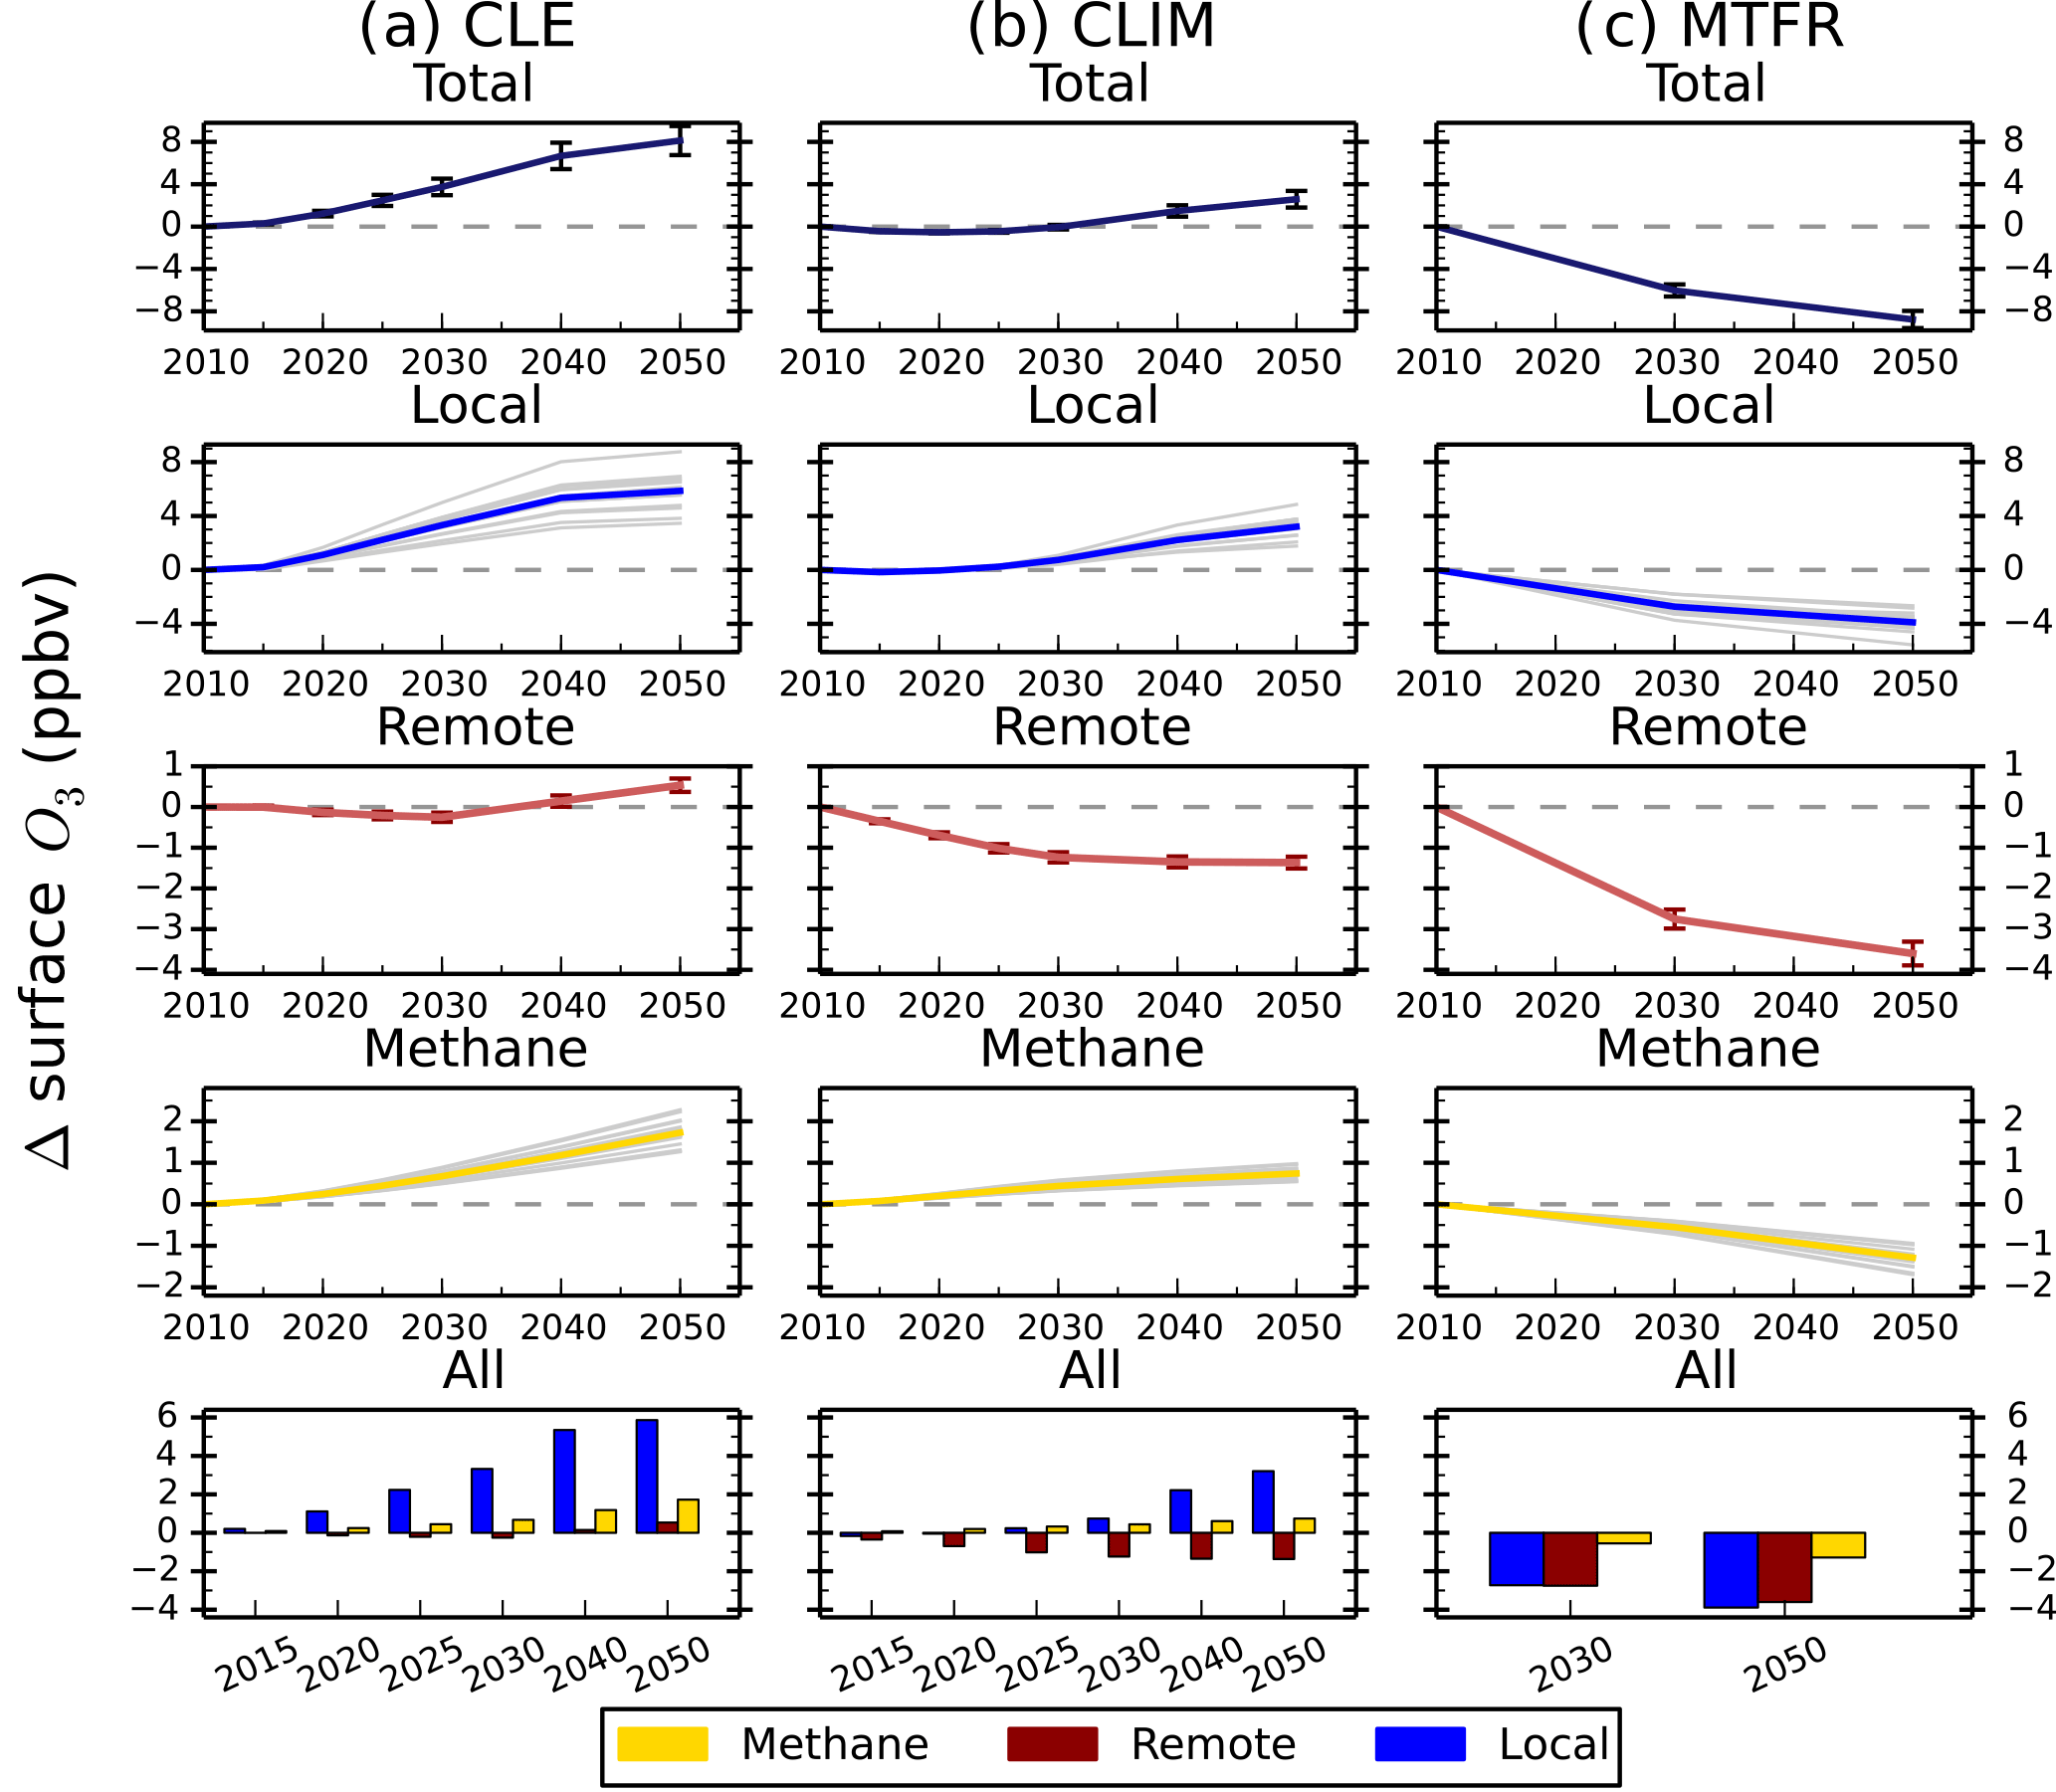
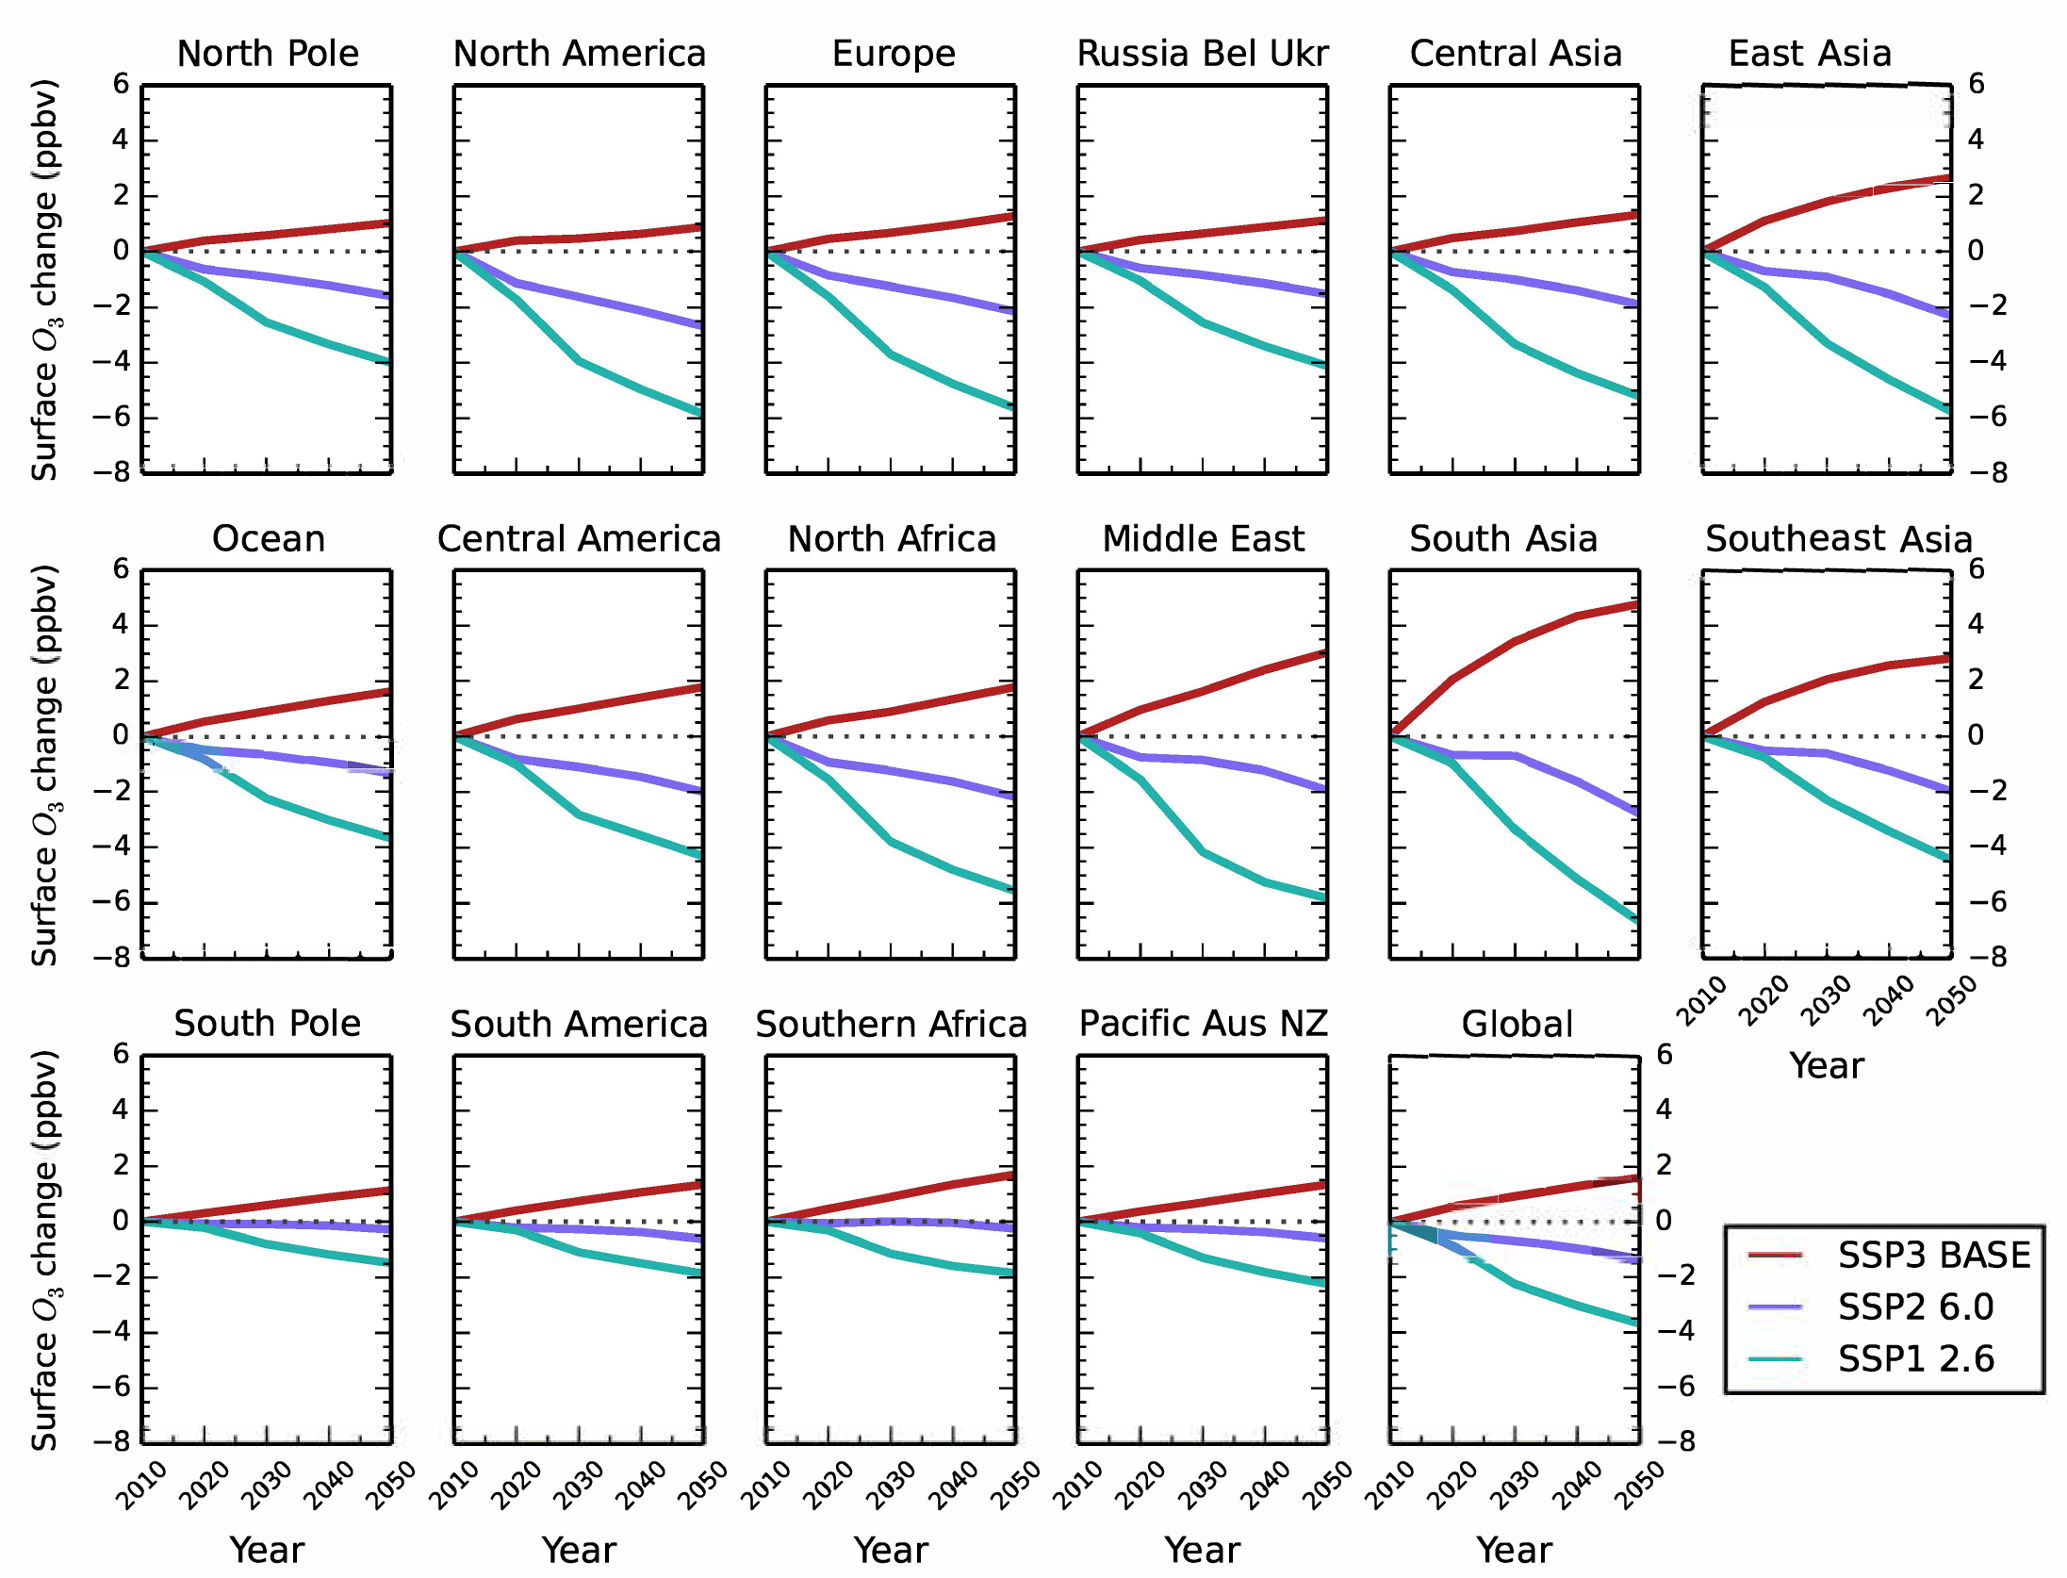
Figure 9Annual mean change in regional surface O3 concentrations between 2010 and 2050 from the parameterisation for the CMIP6 emission scenarios of Shared Socioeconomic Pathway 3 (SSP3) baseline (red), SSP2 with a radiative forcing target of 6.0 W m−2 (purple) and SSP1 with a radiative forcing target of 2.6 W m−2 (green).
Table 9Percentage change in global CH4 abundance and global and regional NOx emissions relative to 2010 over each TF-HTAP2 region for the different CMIP6 emission scenarios (SSP1 2.6, SSP2 6.0 and SSP3 BASE).
3.4 Sensitivity of ozone to methane
The importance of controlling CH4 to achieve future reductions in O3 has been highlighted in earlier studies, along with the large uncertainty in the response of O3 to CH4 changes (Fiore et al., 2009; Wild et al., 2012). The inclusion of new models provides an opportunity to assess whether the sensitivity of O3 to CH4 identified in TF-HTAP1 remains the same. Experiments with both increased (CH4INC) and decreased (CH4DEC) global abundance of CH4 were conducted in TF-HTAP2. However, these experiments used an increase of 18 % and a reduction of 13 % to align with 2010 to 2030 changes in global CH4 abundance under RCP8.5 and RCP2.6, in contrast to the 20 % reduction used in TF-HTAP1.
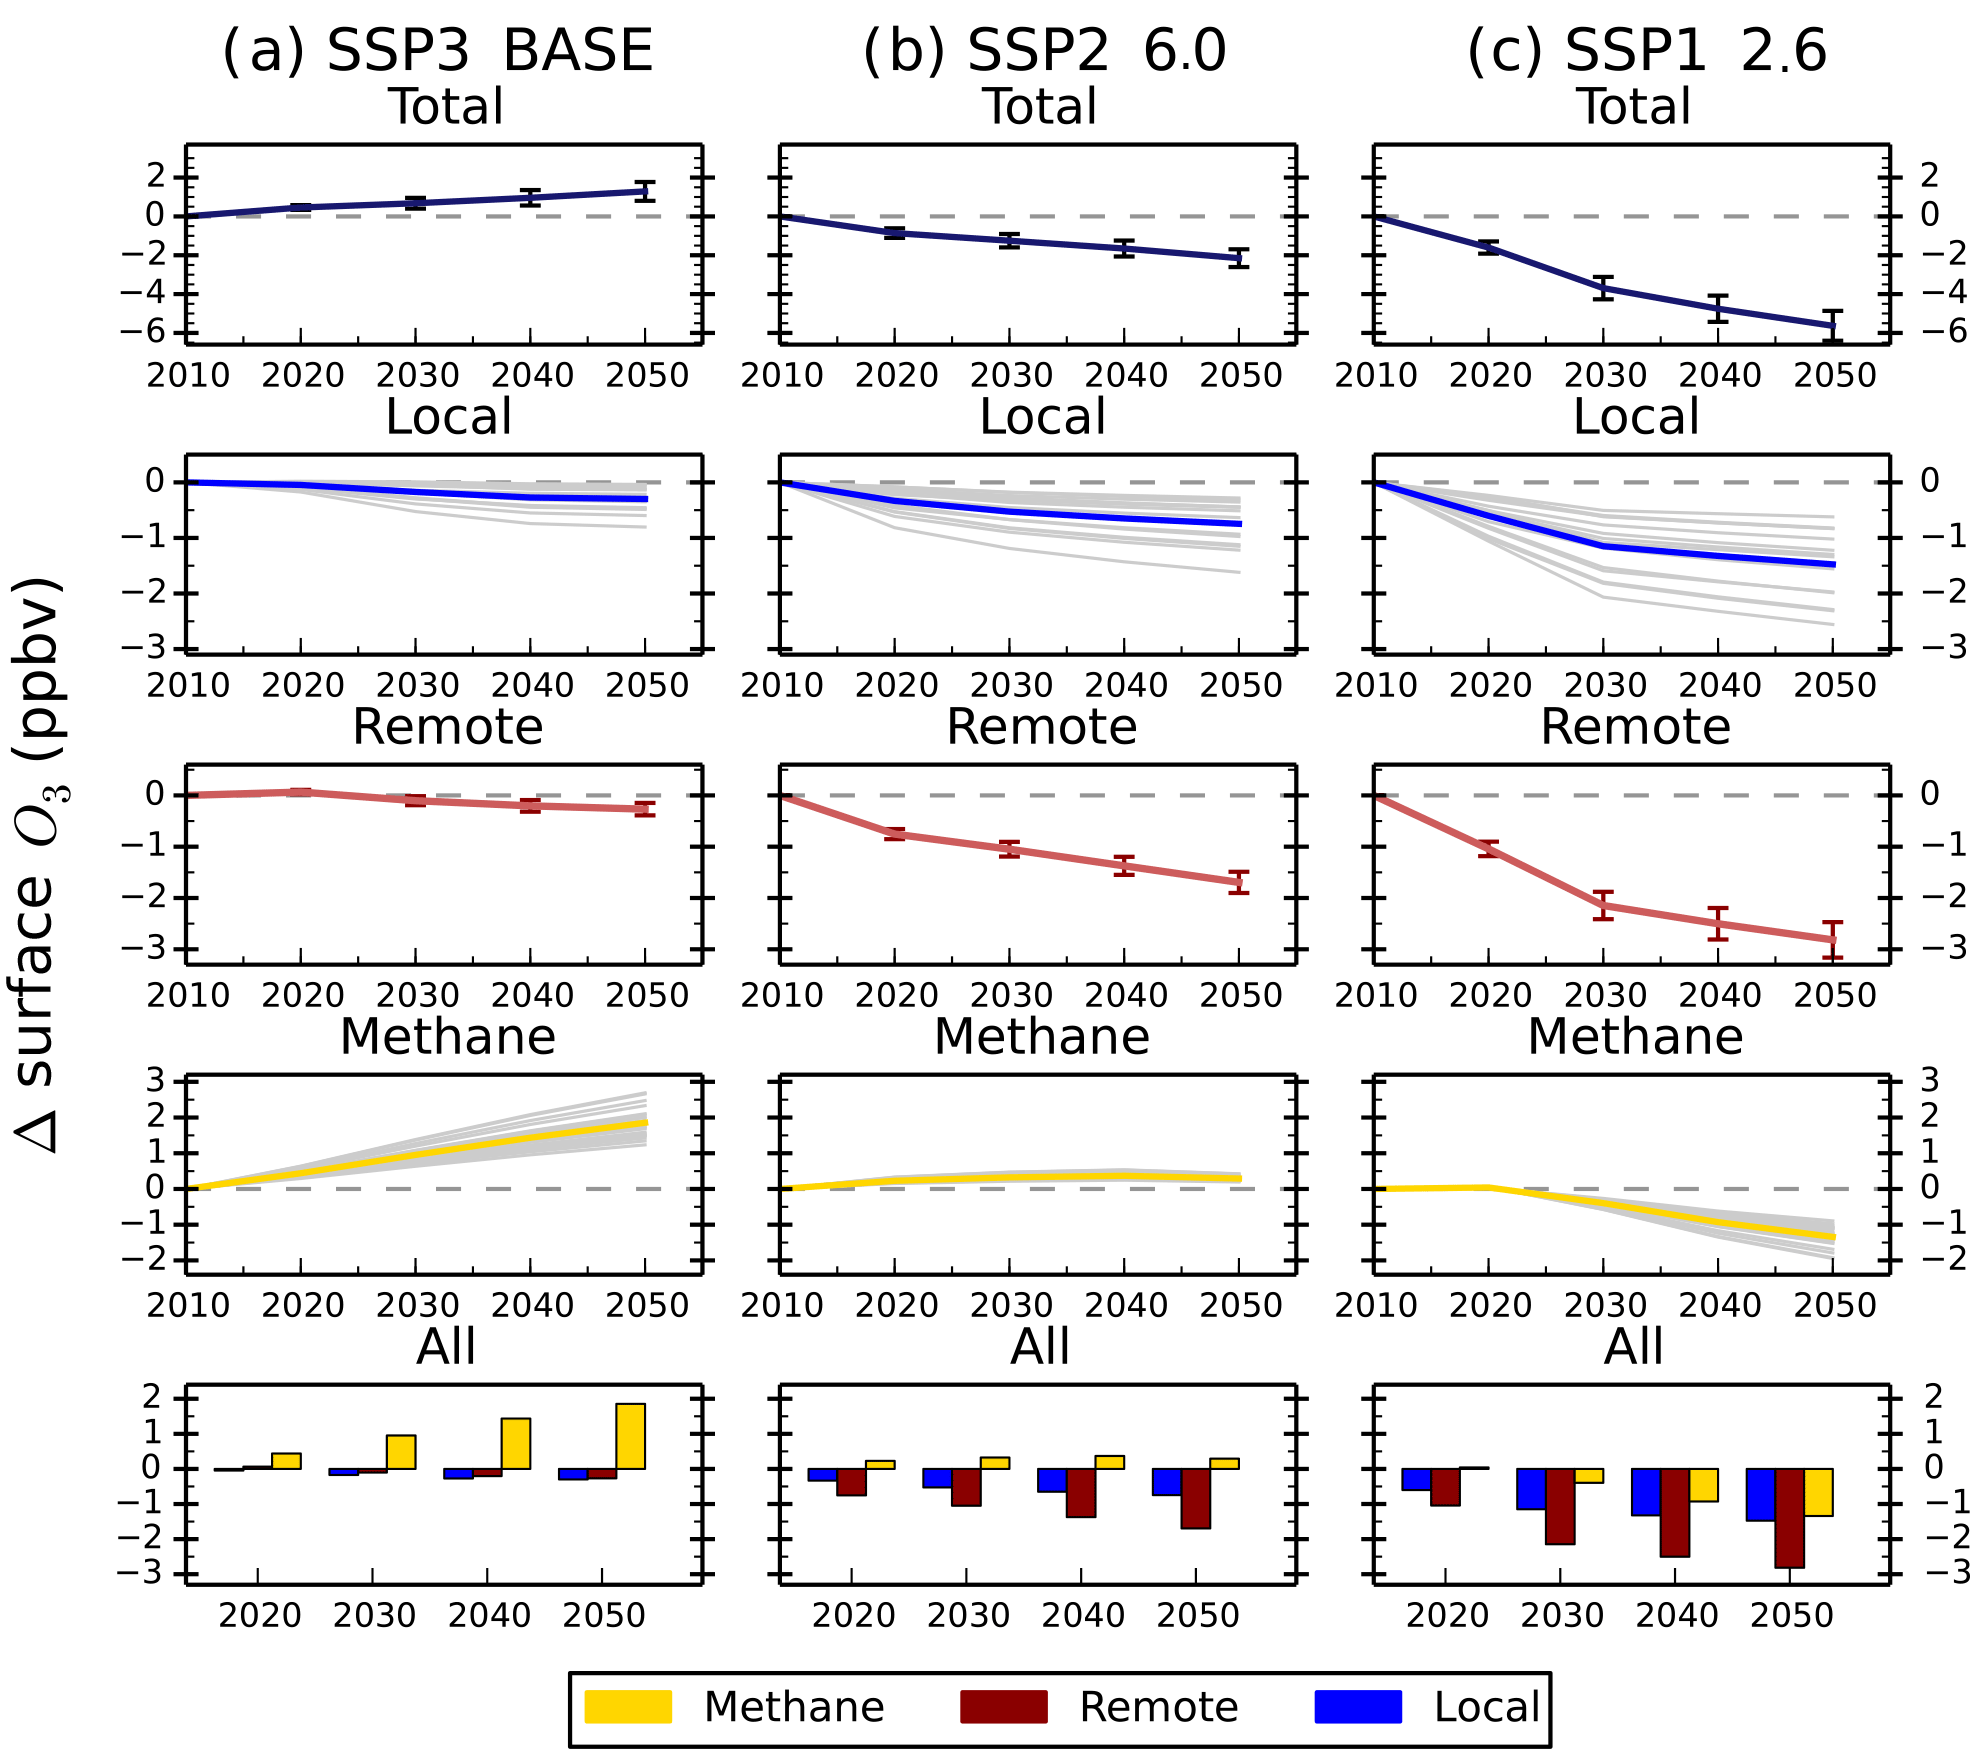
Figure 10Total annual mean change in regional surface O3 concentrations over Europe and the contribution of local (blue), remote (red) or methane (gold) sources between 2010 and 2050 from the parameterisation for the CMIP6 emission scenarios of SSP3 BASE (a), SSP2 6.0 (b) and SSP1 2.6 (c). Grey lines on the local and methane panels represent individual model estimates of O3 changes, showing the spread in model responses; solid lines show the multi-model mean. Error bars represent 1 standard deviation over the model range. The last row of panels shows the O3 response from individual sources plotted together for each year.
Wild et al. (2012) found that a 20 % increase in CH4 abundance yielded an 11.4 % smaller surface O3 response than that from a 20 % decrease in CH4. For simplicity, the parameterisation used the same non-linear scaling factor as for NOx emissions (Eq. 4), which represents a 10 % smaller response for successive 20 % emission increases. The two TF-HTAP2 models that contributed results to both CH4DEC and CH4INC simulations allow us to check the expression used here. We find a slightly larger sensitivity, with both models yielding a 12.6 % smaller surface O3 response for an increase in CH4 than a decrease. Since this O3 response to CH4 in TF-HTAP2 is comparable to that from TF-HTAP1, for simplicity and consistency, we chose to retain the same representation of non-linearity for both NOx and CH4 (Eq. 4), as used in Wild et al. (2012).
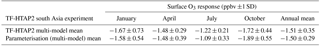
To enable a direct comparison with TF-HTAP1 results, the O3 response from the CH4DEC and CH4INC experiments in TF-HTAP2 are scaled to represent the response from a 20 % reduction in CH4 abundances. An adjustment factor is calculated based on the global mean difference between the TF-HTAP2 O3 response in each experiment and that of an equivalent 20 % reduction in CH4 abundance, resulting in a factor of 1.557 for CH4DEC and −1.256 for CH4INC. The global mean O3 responses from CH4DEC (−0.69 ± 0.01 ppbv, two models) and CH4INC (0.81 ± 0.14 ppbv, seven models) are adjusted to generate the equivalent O3 responses to a 20 % reduction in CH4 abundance, which are used in the parameterisation (−1.05 ± 0.12 ppbv). This response is ∼ 14 % larger globally than that in TF-HTAP1 (−0.90 ± 0.14 ppbv, 14 models), highlighting a slightly increased sensitivity of O3 to CH4.
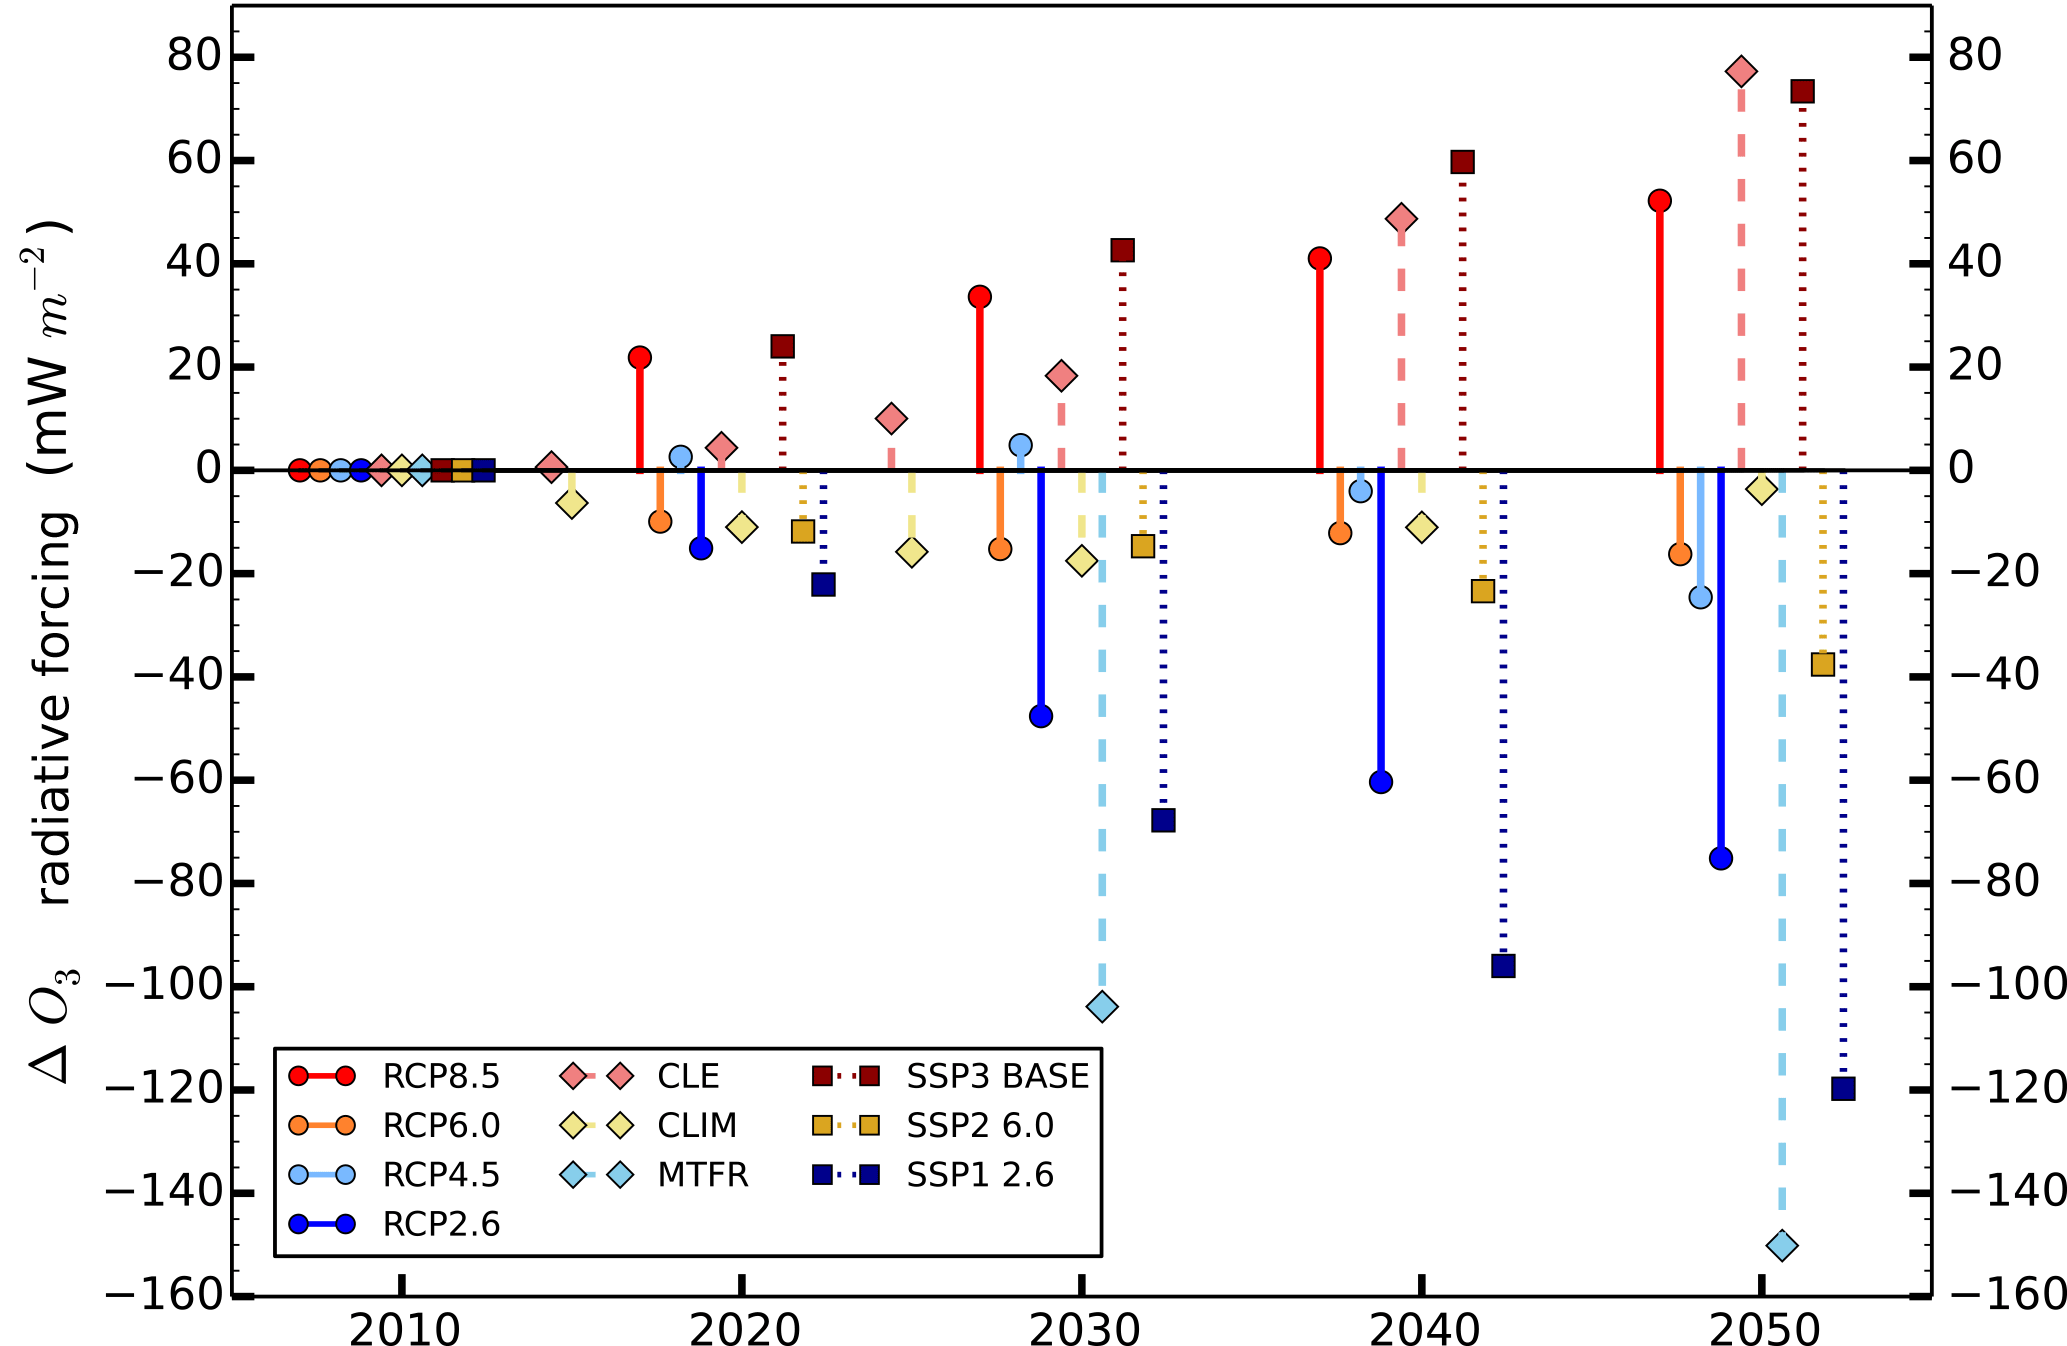
Figure 12Parameterised response in the global annual mean ozone radiative forcing relative to 2010 for the different CMIP5 RCPs (circles), ECLIPSE scenarios (diamonds) and CMIP6 SSPs (squares).
To explore the differences between TF-HTAP1 and TF-HTAP2 models, the CH4 lifetime and feedback factor for each TF-HTAP2 model (where data are available) can be calculated in accordance with Fiore et al. (2009). The feedback factor is the ratio of the atmospheric response (or perturbation) time to global atmospheric lifetime and describes how the atmospheric CH4 abundance responds to a perturbation in CH4 emissions; e.g. a feedback factor of 1.25 means that a 1 % increase in emissions would ultimately generate a 1.25 % increase in CH4 concentrations (Fiore et al., 2009). The feedback factors can be used in conjunction with CH4 emission changes for a region to relate the O3 response from the reduction in CH4 abundance in TF-HTAP scenarios to that equivalent from emissions, taking into account both the long-term and short responses of O3 to emissions (Fiore et al., 2009). Table 8 summarises the calculated CH4 lifetime and feedback factors for the two TF-HTAP2 models that have provided CH4 chemical loss rates. These two models show slightly shorter methane lifetimes and a higher feedback factor (F) than the TF-HTAP1 mean values. This suggests that the sensitivity of O3 to changes in CH4 in the two TF-HTAP2 models is slightly larger than that in the TF-HTAP1 multi-model mean. The increased feedback factor also indicates that a slightly larger reduction in methane emissions is required to achieve a comparable reduction in O3 concentrations.

Figure 13Annual mean percentage change in the regional and global tropospheric O3 burden over the period 2010 to 2050 from the parameterisation for the ECLIPSE V5a emissions under CLE (blue), CLIM (gold) and MTFR (red) scenarios.
Overall, the sensitivity of O3 to a change in CH4 abundance is slightly larger in the two TF-HTAP2 models considered here than in TF-HTAP1 models but still within the range of the TF-HTAP1 multi-model ensemble. The results from TF-HTAP2 will not significantly change any conclusions from TF-HTAP1 but suggest that the previous O3 changes estimated from TF-HTAP1 are conservative. The O3 response to CH4 remains one of the most important processes to understand for controlling future O3 concentrations.
4.1 Surface ozone under ECLIPSE V5a emissions
The parameterised approach is used with the ECLIPSE V5a emission scenarios described above to determine regional changes in future surface O3 concentrations. Surface O3 concentrations for the CLE (current legislation) scenario are predicted to increase from 2010 to 2050 across all regions (Fig. 6). Annual mean surface O3 concentrations increase by 4 to 8 ppbv across the south Asia and Middle East regions due to the large increases expected in NOx emissions (Table 4), although there is substantial uncertainty in the parameterisation over these regions. Surface O3 concentrations over Europe and North America in 2050 are similar to those in 2010, even though their regional NOx emissions decrease by ∼ 50 %. The contributions of different sources to the total surface O3 change has been analysed for each source region (Figs. S6 to S17). Results for Europe (Fig. 7) and south Asia (Fig. 8) are shown here, as these regions experience contrasting changes in surface O3. Across Europe, surface O3 from local and remote (mainly North American) sources is reduced in response to emission decreases, and the contribution from CH4 increases by 1.6 ppbv in 2050 (Fig. 7). The increase in global CH4 abundance in the CLE scenario increases surface O3 over Europe, offsetting the reduction in O3 from local and remote sources. This contrasts strongly with south Asia, where local sources dominate the total O3 response. This demonstrates how different local and hemispheric emission control strategies are needed in different regions.
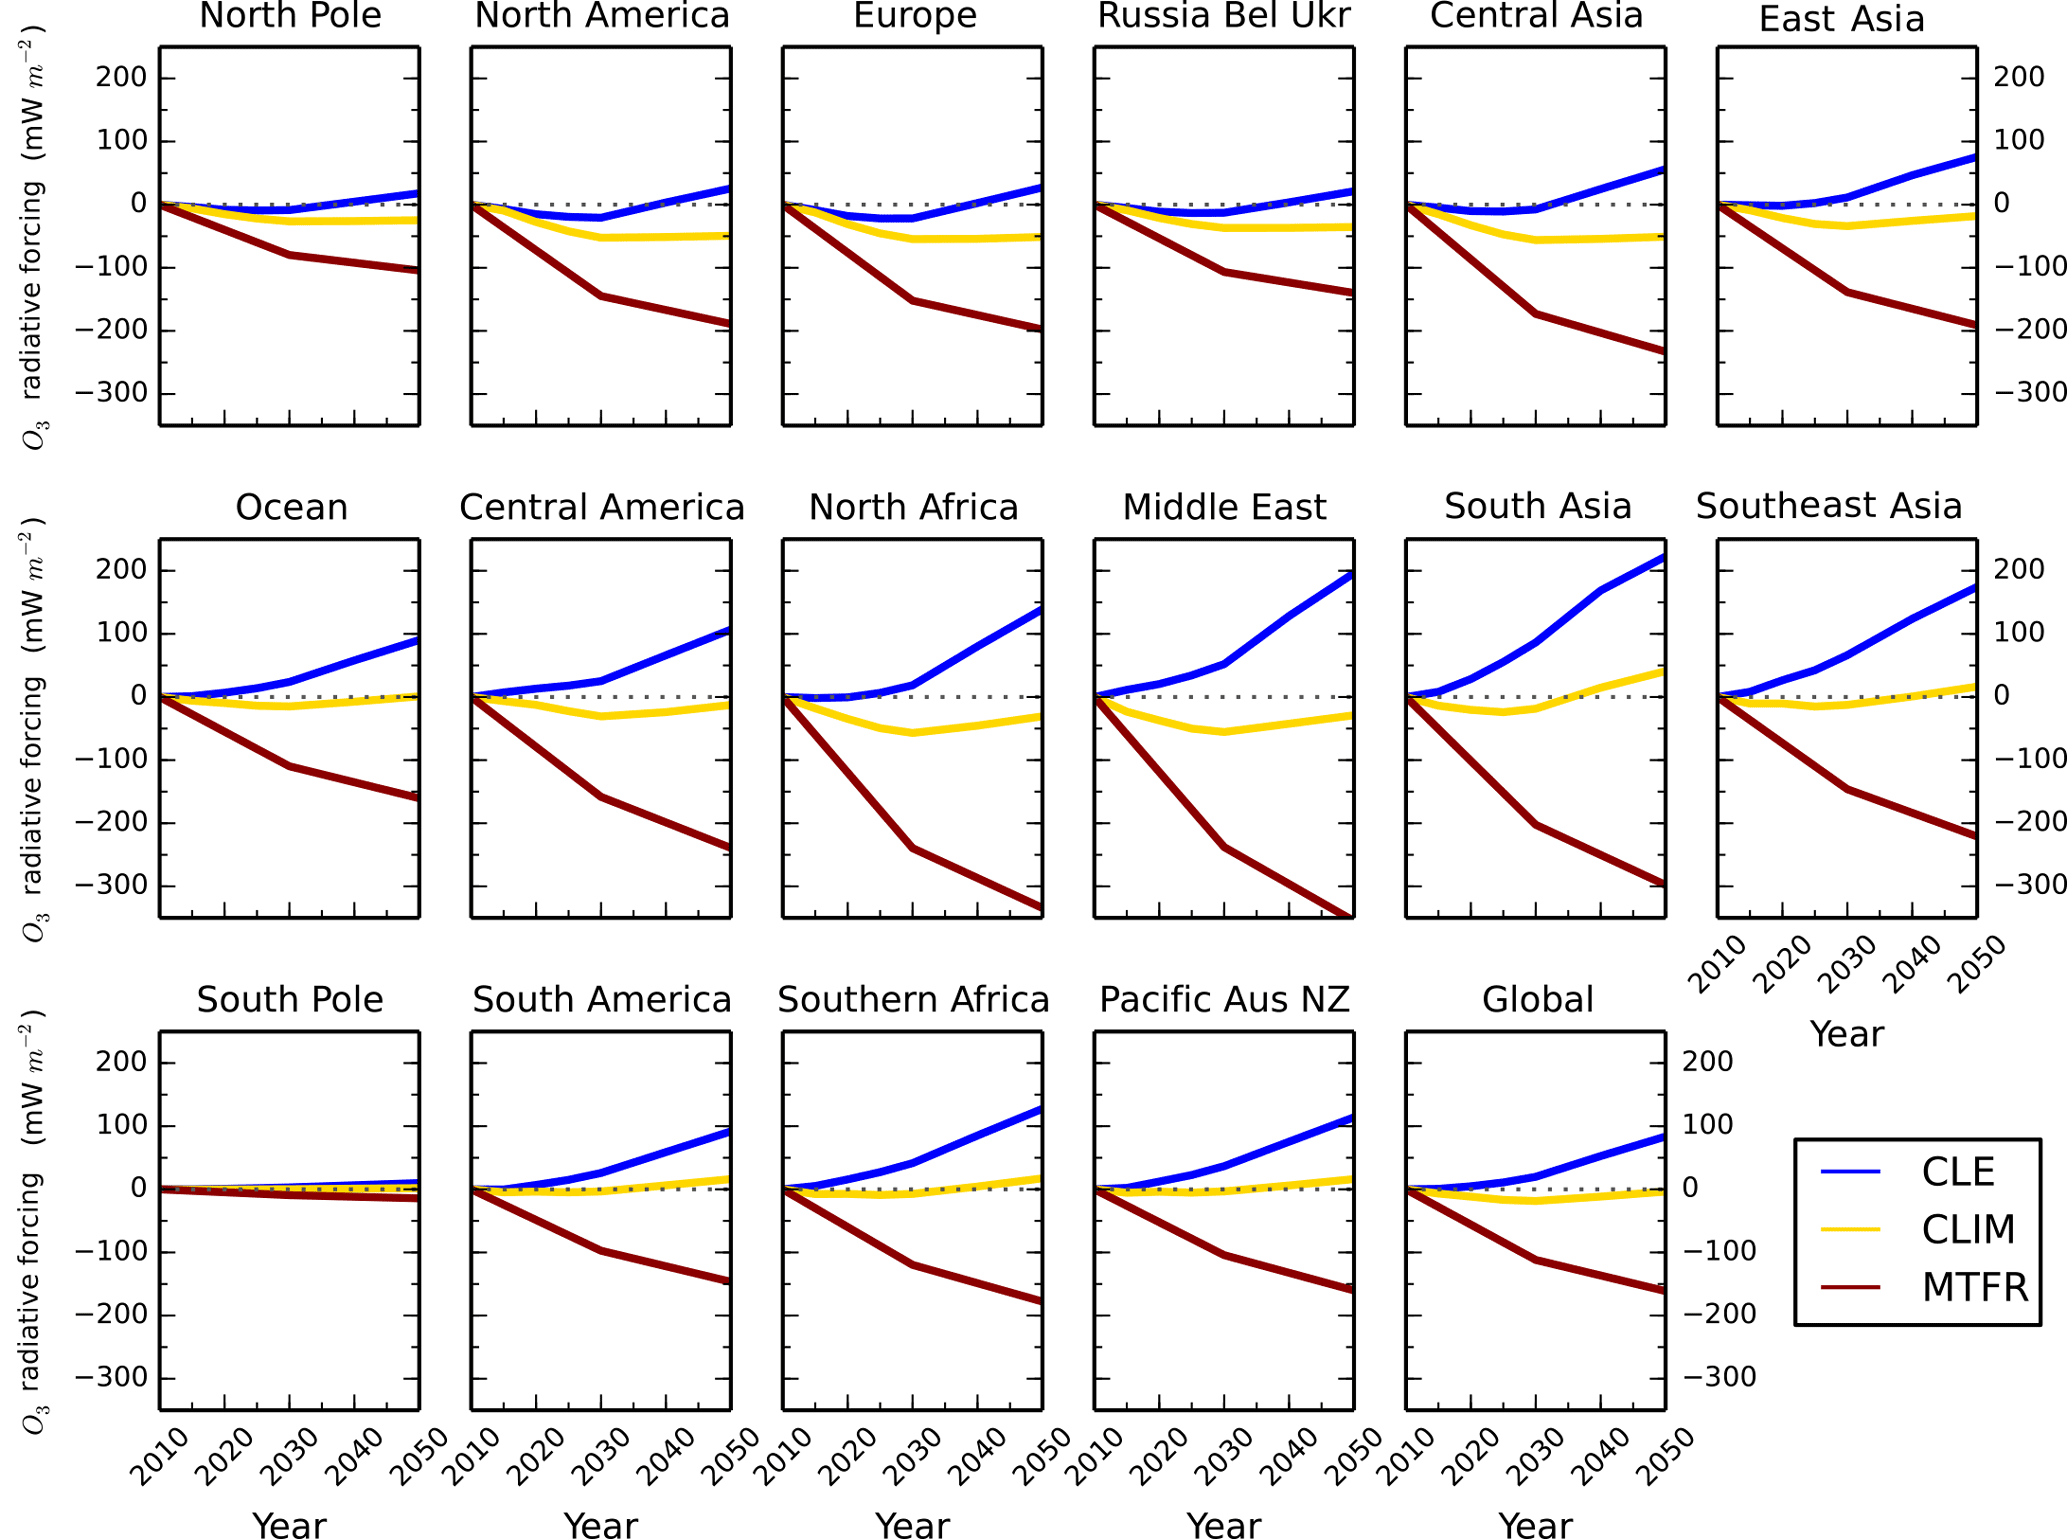
Figure 14Annual mean regional O3 radiative forcing relative to 2010 from the parameterisation for the ECLIPSE V5a emissions under the CLE (blue), CLIM (gold) and MTFR (red) scenarios.
For the CLIM (climate policies on current legislation) scenario, annual mean surface O3 concentrations in 2050 decrease slightly or stay at 2010 concentrations due to reductions in anthropogenic emissions and control of CH4 emissions leading to a decrease in its abundance (Table 4). The source contribution analysis for Europe (Fig. 7) and south Asia (Fig. 8) shows that CH4 contributes much less to the total surface O3 change under this scenario than CLE. For south Asia, there is also a reduction in the contribution from local sources to surface O3. Under CLIM, remote sources start to dominate the contribution to European surface O3 changes in 2050, increasing to −1.3 ppbv. However, across south Asia, the contribution from local sources (+3.2 ppbv) is greater than from remote sources (−1.4 ppbv) in 2050, reflecting the importance of local emissions in this region. The contribution of CH4 sources to the total surface O3 response is smaller in CLIM due to the targeting of CH4 for climate mitigation purposes. The implementation of these climate policy measures shifts the dominant factor driving future O3 changes within a receptor region towards extra-regional sources.
Table 10The response in annual mean surface, global ozone burden and ozone radiative forcing in 1980 and for the CMIP5 emission scenarios in 2030 (relative to 2000) from the parameterisation (based on multiple models) and the multi-model mean value from ACCMIP (±1 SD of multi-model responses).
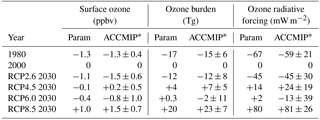
∗ Mean change in the tropospheric ozone burden and radiative forcing between 2030 and 2000 from the ACCMIP models that provided results for each scenario, as presented in Table 5 of Young et al. (2013) and Table 12 of Stevenson et al. (2013).
The MTFR scenario (maximum technically feasible reduction) considers large reductions in emissions (Table 4) and consequently predicts reductions in surface O3 concentrations of up to 9 ppbv by 2050. Reductions of surface O3 in Europe (Fig. 7) are dominated by changes in remote sources, although changes in CH4 become increasingly important by 2050. For south Asia, the surface O3 response is dominated by changes to local and remote emission sources. This highlights that achieving decreases in surface O3 concentrations from the maximum feasible emission reductions depends not only on local emission policies but on reducing emissions across other regions too.
4.2 Surface ozone under CMIP6 emissions
We provide an initial assessment of surface O3 changes from a subset of the preliminary emission scenarios developed for the CMIP6 project (https://tntcat.iiasa.ac.at/SspDb, last access: 16 November 2017; Rao et al., 2017) based on shared Shared Socioeconomic Pathways (SSPs). Five baseline SSPs are defined (SSP1–5) based on different combinations of future social, economic and environmental development trends over centennial timescales (O'Neill et al., 2014). Different climate targets, defined in terms of anthropogenic radiative forcing by 2100, are combined with the baseline SSPs to develop future scenarios for climate mitigation, including additional assumptions on international cooperation, timing of mitigation and extent of fragmentation between low and high income economies (van Vuuren et al., 2014; Riahi et al., 2017). Scenarios of strong, medium and weak future air pollutant emission pathways are mapped onto the SSPs and represent differing targets for pollution control, the speed at which developing countries implement strict controls and the pathways to control technologies (Rao et al., 2017). Increasingly stringent air pollutant emission controls are assumed to occur with rising income levels because of the increased focus on human health effects and the declining costs of control technology. SSP2 is a medium pollution control scenario that follows current trajectories of increasing levels of regulation. SSP1 and SSP5 are strong control scenarios where pollution targets become increasingly strict. A weak pollution control scenario is adopted in SSP3 and SSP4 where the implementation of future controls is delayed (Rao et al., 2017).
We select three preliminary SSPs to represent scenarios of business-as-usual (SSP3 BASE), middle-of-the-road (SSP2 6.0) and enhanced mitigation (SSP1 2.6). The SSP2 6.0 and SSP1 2.6 scenarios have climate mitigation targets of 6.0 and 2.6 W m−2 in 2100 applied to them. Currently, air pollutant emissions for each SSP are available globally and across five world regions from https://tntcat.iiasa.ac.at/SspDb/ (last access: 9 April 2018). The air pollutant emissions for each region have been mapped onto the equivalent TF-HTAP2 source regions and the grouping of regions is shown in Table 9 along with the percentage change in global CH4 abundance and NOx emissions over the period 2010 to 2050. The relative changes in CO and NMVOC emissions are shown in Tables S4 and S5. Gridded versions of these emission scenarios will be made available in due course (K. Riahi, personal communication, 2017), which will allow a more accurate evaluation of the impacts arising from these scenarios.
Surface O3 concentrations increase across all regions in 2050 for the SSP3 BASE scenario (Fig. 9). Europe, North America and east Asia show an increase in surface O3 of 1 to 3 ppbv, a larger response than in the ECLIPSE CLE scenario. Smaller increases in surface O3 are predicted over the Middle East (∼ 3 ppbv) and south Asia (∼ 5 ppbv) compared to CLE. Methane dominates the total surface O3 response over Europe in SSP3 BASE, with small contributions from local and remote emission sources over the period 2010 to 2050 (Fig. 10). Local emissions are the main contribution to O3 changes over south Asia, with a slightly larger influence from CH4 than in CLE (Fig. 11).
For SSP2 6.0 (middle-of-the-road scenario), surface O3 concentrations reduce slightly by 2050 and to a greater extent than in ECLIPSE CLIM due to the larger reductions in NOx emissions and global CH4 abundances (Tables 4 and 9). Over south Asia, NOx emissions in SSP2 6.0 decrease by 22 % from 2010 to 2050, with a corresponding O3 change of −3 ppbv, compared to CLIM where NOx emissions increase by 66 % and the corresponding O3 change is +3 ppbv. However, this difference could arise from using preliminary SSP emissions based on five large world regions, where emission changes in south Asia and nearby regions such as east Asia are combined together. For Europe and south Asia, the source contributions for each region (Figs. 10 and 11) are similar to those in CLIM. Remote sources are more important under this intermediate climate mitigation scenario, with local emission sources becoming more important by 2050 over south Asia.
Large reductions in surface O3 concentrations are predicted across all regions in the strong mitigation scenario (SSP1 2.6) (Fig. 9). The improvements in O3 concentrations are less than predicted under the ECLIPSE MTFR due to a smaller reduction in NOx emissions. Northern midlatitude regions show reductions in surface O3 concentrations of up to 6 ppbv under SSP1 2.6, similar to MTFR. Over south Asia, surface O3 is predicted to be reduced by up to 7 ppbv, which is less than under MTFR. The source contributions for both Europe (Fig. 10) and south Asia (Fig. 11) are similar to MTFR with the importance of remote sources and the increasing importance of CH4 by 2050 evident over Europe. Over south Asia, the increasing importance of local and CH4 sources is clear by 2050.
This analysis of preliminary CMIP6 emission scenarios highlights the large range of future regional surface O3 responses that are possible depending on the climate and air pollutant policies applied. The assumptions within each of the future SSPs, particularly for CH4, results in different sources dominating the contribution to the total surface O3 response. Uncertainties in the assumed growth rate of CH4 under the two current legislation scenarios (CLE and SSP3 BASE) result in a 1 ppbv difference in surface O3 over Europe and North America, highlighting the importance for future air quality of reducing CH4 on a global scale. The CMIP6 scenarios allow a larger range of pathways to be explored than were available in ECLIPSE or the CMIP5 RCPs, including those of strong, medium and weak policies on air pollutants and climate change. The parameterisation can be used to provide a rapid assessment of the impact of differing policy measures on surface O3 concentrations across different regions, along with a clear source attribution. This can ultimately inform selection of policies that are most beneficial to future air quality.
As discussed in Sect. 2.3, the parameterisation has been extended to generate three-dimensional O3 distributions throughout the troposphere, using a tropopause defined as a O3 concentration of 150 ppbv (Prather et al., 2001). Tropospheric O3 column burdens are calculated in each grid cell for each emission scenario. These are used to infer changes in O3 radiative forcing by using the relationship between radiative forcing and tropospheric column O3 (W m−2 DU−1) and its spatial variation with latitude and longitude from the ACCMIP multi-model ensemble (Stevenson et al., 2013). Tropospheric O3 burdens and O3 radiative forcings are calculated for the CMIP5 RCPs to evaluate the parameterisation against values from the ACCMIP multi-model study (Stevenson et al., 2013). Additionally, future projections of O3 radiative forcing are made for the ECLIPSE and CMIP6 SSPs.
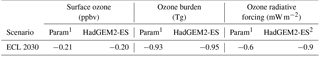
The change in tropospheric O3 burden and O3 radiative forcing for the ECLIPSE CLE scenario in 2030 from the parameterisation was evaluated against the change from the equivalent HadGEM2-ES simulation (Table 5), a self-consistent test based only on emission perturbations with no influence from climate change. The parameterisation is able to reproduce the change in global tropospheric O3 burden (−0.93 Tg) and O3 radiative forcing (−0.6 mW m−2) simulated by HadGEM2-ES (−0.95 Tg and −0.9 mW m−2), with any slight differences due to the discrepancies identified over south Asia (Fig. 3).
In comparison to the ACCMIP multi-model mean, the predicted changes between 2000 to 2030 in both global annual mean surface O3 and global O3 burden from the parameterisation are within the range of the ACCMIP multi-model responses (±1 SD) for all the CMIP5 RCPs (Table 10). The predictions of O3 radiative forcing in 2030 from the parameterisation across all the RCPs, when the influence of climate change is anticipated to be small, are also consistent with those from ACCMIP. The sign and magnitude of change in global O3 burden and O3 radiative forcing with the parameterisation for RCP6.0 is different from the ACCMIP results but is still within the range of model responses, which is the largest for this scenario. The comparison with ACCMIP results shows that the parameterisation is able to reproduce changes in global O3 burden and O3 radiative forcing on near-term timescales, when the influence of climate change is small.
A global O3 radiative forcing of +0.05 to +0.08 W m−2 in 2050, relative to 2010, is estimated under the low mitigation scenarios (RCP8.5, CLE and SSP3 BASE) (Fig. 12). The intermediate mitigation scenarios of RCP4.5, RCP6.0 and SSP2 6.0 show an O3 radiative forcing of 0 to −0.04 W m−2 in 2050, with almost no change under CLIM. The more stringent mitigation scenarios (RCP2.6, MTFR and SSP1 2.6) exhibit an O3 radiative forcing of between −0.07 and −0.15 W m−2 by 2050. The parameterisation is able to predict the wide range of impacts that climate and air quality policies could have on short-term climate forcing from O3. It can be used as a rapid screening tool to select the most appropriate climate scenarios to explore further in full model simulations that can provide more detailed predictions. The current business-as-usual scenarios for CMIP5, ECLIPSE and CMIP6 increase the climate forcing of O3 by approximately 0.06 W m−2 in 2050, whereas the strong mitigation scenarios have a larger effect on reducing the near-term climate forcing of O3 by about 0.10 W m−2.
The parameterisation generates gridded changes in the tropospheric O3 column burden and radiative forcing, which can be used to calculate changes over different regions. Figures 13 and 14 show that the largest relative changes in O3 burden for the ECLIPSE scenarios occur over the Middle East, south Asia and southeast Asia (>10 %), with a corresponding larger impact on O3 radiative forcing (−0.3 W m−2 in MTFR). Smaller relative changes in the tropospheric O3 burden are found for CLE over Europe and North America. For MTFR, a 15 % reduction in O3 burden is predicted over Europe and North America, similar to that over south Asia, but the change in O3 radiative forcing is not as large (−0.2 W m−2 compared to −0.3 W m−2 over south Asia). The parameterisation allows the regional near-term climate implications (in terms of O3 radiative forcing) from future emission changes to be explored under different air quality and climate policy scenarios. It also highlights the wide range of near-term climate forcing that is possible over particular regions from future emission policies.
In this study, we describe improvements and extensions to a simple parameterisation of regional surface O3 responses to changes in precursor emissions and CH4 abundances based on multiple models. We incorporate results from Phase 2 of the Hemispheric Transport of Air Pollutants project to create an enhanced parameterisation that includes new models from TF-HTAP2, a greater number of source regions (14 in total), a new base year (2010) and an extension to three dimensions to represent O3 changes throughout the troposphere. These improvements allow impacts on surface O3 concentrations and the near-term O3 radiative forcing to be calculated from different emission scenarios. Model simulations using HadGEM2-ES confirm the validity of the parameterisation and adjustments made here. However, larger errors may occur when using emission changes of greater than ±60 % and when considering long-term future scenarios where there may be a significant influence from climate change. In addition, the parameterisation may not perform well over regions where chemical titration is expected to become dominant in the future under large emission increases, e.g. south Asia, as it is based on the ozone responses in 2010. There is a slight increase in the response of O3 to CH4 for the TF-HTAP2 models, resulting in a slightly higher sensitivity of O3 to CH4 changes. The extent of the difference varies on a regional basis but is within the range of model responses in TF-HTAP1.
Emission changes from the RCPs are used with the parameterisation and it predicts similar changes in surface O3 concentrations to those from the original parameterisation (Wild et al., 2012), although now across a larger number of source regions. Tropospheric O3 burden and O3 radiative forcing calculated using the parameterisation are within the spread of the response from the ACCMIP models for all of the CMIP5 RCPs in 2030, where the influence from climate change is anticipated to be small. The parameterised approach permits rapid assessment of the impact of future emission changes over 14 source regions and associated uncertainties on both surface and tropospheric O3 concentrations, and allows identification of the differing contributions of local, remote and CH4 sources to the O3 response. This enables quantification of the impacts of future air quality and climate emission policies on surface air quality and near-term climate forcing by O3.
Applying future emissions from ECLIPSE V5a and the preliminary SSPs, we show that annual mean surface O3 concentrations are likely to increase across most world regions by 2050 under current legislation scenarios, with large increases of 4 to 8 ppbv over the Middle East and south Asia. These changes in O3 concentrations are driven mainly by local emissions and changes in global CH4 abundance. This demonstrates that current legislation is inadequate in preventing future increases in surface O3 concentrations across the world. Implementing energy-related climate policies on top of current legislation maintains future surface O3 concentrations at or slightly below 2010 concentrations, counteracting the increases that occur under current legislation. This is achieved mainly through reductions in CH4, highlighting the importance of controlling CH4 in limiting future changes in O3 concentrations, as shown in Wild et al. (2012). Policies that have stringent emission controls lead to substantial reductions in surface O3 concentrations across all world regions of up to 8 ppbv and could potentially provide large beneficial impacts.
A global O3 radiative forcing of +0.07 W m−2 is predicted by 2050 (relative to 2010) under the current legislation scenarios of the SSPs and ECLIPSE. There is a large and diverse regional response in O3 radiative forcing with some regions, e.g. Middle East and south Asia, more sensitive to changes in emissions than others, and these show a large positive O3 radiative forcing under current legislation. However, application of aggressive emission mitigation measures leads to large reductions in O3 radiative forcing (−0.10 W m−2), lessening the near-term impact on climate.
The new parameterisation provides a valuable assessment tool to evaluate the impact of future emission policies on both surface air quality and near-term climate forcing from O3. It also provides a full source attribution along with a simple measure of uncertainty, given by the spread of the multi-model responses that reflect different transport and chemistry processes in models. Whilst not replacing full chemistry simulations, it provides a quick way of assessing where to target future modelling efforts. However, these O3 responses are based on changes to anthropogenic emissions only, with no account taken of the impact on O3 and/or its natural precursor emissions due to future changes in chemistry or climate. The parameterisation could be extended further by including a feedback factor to take some account of the impact of future climate change on O3. Additional improvements could include coupling the output to an offline radiation model to enable improved calculation of O3 radiative forcing, using O3 fields from the parameterisation within a land surface model to assess the impacts of O3 on vegetation and the carbon cycle or with O3 dose–response functions to calculate impacts on human health.
Data are available upon request by contacting the author.
The supplement related to this article is available online at: https://doi.org/10.5194/acp-18-8953-2018-supplement.
The authors declare that they have no conflict of interest.
This article is part of the special issue “Global and regional assessment of intercontinental transport of air pollution: results from HTAP, AQMEII and MICS”. It is not associated with a conference.
Steven Turnock, Fiona O'Connor and Gerd Folberth would like to acknowledge
the BEIS Met Office Hadley Centre Climate Programme (GA01101). Steven Turnock
also acknowledges the UK-China Research and Innovation Partnership Fund
through the Met Office Climate Science for Service Partnership (CSSP) China
as part of the Newton Fund. Simone Tilmes would like to acknowledge
high-performance computing support from Yellowstone (ark:/85065/d7wd3xhc)
provided by NCAR's Computational and Information Systems Laboratory,
sponsored by the National Science Foundation. The CESM project is supported
by the National Science Foundation and the Office of Science (BER) of the U.S. Department of Energy. Frank Dentener acknowledges support from the
AMITO2 Administrative Arrangement with DG ENV. The authors acknowledge
access to the preliminary version of the SSP air pollution database hosted
at the International Institute for Applied Systems Analysis.
Edited by: Christian Hogrefe
Reviewed by: two anonymous referees
Brunekreef, B. and Holgate, S. T.: Air pollution and health, Lancet, 360, 1233–1242, https://doi.org/10.1016/S0140-6736(02)11274-8, 2002.
Collins, W. J., Derwent, R. G., Johnson, C. E., and Stevenson, D. S.: The Oxidation of Organic Compounds in the Troposphere and their Global Warming Potential, Clim. Change, 52, 453–479, 2002.
Collins, W. J., Bellouin, N., Doutriaux-Boucher, M., Gedney, N., Halloran, P., Hinton, T., Hughes, J., Jones, C. D., Joshi, M., Liddicoat, S., Martin, G., O'Connor, F., Rae, J., Senior, C., Sitch, S., Totterdell, I., Wiltshire, A., and Woodward, S.: Development and evaluation of an Earth-System model – HadGEM2, Geosci. Model Dev., 4, 1051–1075, https://doi.org/10.5194/gmd-4-1051-2011, 2011.
Crippa, M., Janssens-Maenhout, G., Dentener, F., Guizzardi, D., Sindelarova, K., Muntean, M., Van Dingenen, R., and Granier, C.: Forty years of improvements in European air quality: regional policy-industry interactions with global impacts, Atmos. Chem. Phys., 16, 3825–3841, https://doi.org/10.5194/acp-16-3825-2016, 2016.
Fiore, A. M., Dentener, F. J., Wild, O., Cuvelier, C., Schultz, M. G., Hess, P., Textor, C., Schulz, M., Doherty, R. M., Horowitz, L. W., MacKenzie, I. A., Sanderson, M. G., Shindell, D. T., Stevenson, D. S., Szopa, S., Van Dingenen, R., Zeng, G., Atherton, C., Bergmann, D., Bey, I., Carmichael, G., Collins, W. J., Duncan, B. N., Faluvegi, G., Folberth, G., Gauss, M., Gong, S., Hauglustaine, D., Holloway, T., Isaksen, I. S. A., Jacob, D. J., Jonson, J. E., Kaminski, J. W., Keating, T. J., Lupu, A., Manner, E., Montanaro, V., Park, R. J., Pitari, G., Pringle, K. J., Pyle, J. A., Schroeder, S., Vivanco, M. G., Wind, P., Wojcik, G., Wu, S., and Zuber, A.: Multimodel estimates of intercontinental source-receptor relationships for ozone pollution, J. Geophys. Res.-Atmos., 114, 1–21, https://doi.org/10.1029/2008JD010816, 2009.
Fiore, A. M., Naik, V., Spracklen, D. V, Steiner, A., Unger, N., Prather, M., Bergmann, D., Cameron-Smith, P. J., Cionni, I., Collins, W. J., Dalsøren, S., Eyring, V., Folberth, G. a, Ginoux, P., Horowitz, L. W., Josse, B., Lamarque, J.-F., MacKenzie, I. a, Nagashima, T., O'Connor, F. M., Righi, M., Rumbold, S. T., Shindell, D. T., Skeie, R. B., Sudo, K., Szopa, S., Takemura, T., and Zeng, G.: Global air quality and climate., Chem. Soc. Rev., 41, 6663–6683, https://doi.org/10.1039/c2cs35095e, 2012.
Flemming, J., Huijnen, V., Arteta, J., Bechtold, P., Beljaars, A., Blechschmidt, A.-M., Diamantakis, M., Engelen, R. J., Gaudel, A., Inness, A., Jones, L., Josse, B., Katragkou, E., Marecal, V., Peuch, V.-H., Richter, A., Schultz, M. G., Stein, O., and Tsikerdekis, A.: Tropospheric chemistry in the Integrated Forecasting System of ECMWF, Geosci. Model Dev., 8, 975–1003, https://doi.org/10.5194/gmd-8-975-2015, 2015.
Fowler, D., Pilegaard, K., Sutton, M. A., Ambus, P., Raivonen, M., Duyzer, J., Simpson, D., Fagerli, H., Fuzzi, S., Schjoerring, J. K., Granier, C., Neftel, A., Isaksen, I. S. A., Laj, P., Maione, M., Monks, P. S., Burkhardt, J., Daemmgen, U., Neirynck, J., Personne, E., Wichink-Kruit, R., Butterbach-Bahl, K., Flechard, C., Tuovinen, J. P., Coyle, M., Gerosa, G., Loubet, B., Altimir, N., Gruenhage, L., Ammann, C., Cieslik, S., Paoletti, E., Mikkelsen, T. N., Ro-Poulsen, H., Cellier, P., Cape, J. N., Horváth, L., Loreto, F., Niinemets, Ü., Palmer, P. I., Rinne, J., Misztal, P., Nemitz, E., Nilsson, D., Pryor, S., Gallagher, M. W., Vesala, T., Skiba, U., Brüggemann, N., Zechmeister-Boltenstern, S., Williams, J., O'Dowd, C., Facchini, M. C., de Leeuw, G., Flossman, A., Chaumerliac, N., and Erisman, J. W.: Atmospheric composition change: Ecosystems–Atmosphere interactions, Atmos. Environ., 43, 5193–5267, https://doi.org/10.1016/j.atmosenv.2009.07.068, 2009.
Galmarini, S., Koffi, B., Solazzo, E., Keating, T., Hogrefe, C., Schulz, M., Benedictow, A., Griesfeller, J. J., Janssens-Maenhout, G., Carmichael, G., Fu, J., and Dentener, F.: Technical note: Coordination and harmonization of the multi-scale, multi-model activities HTAP2, AQMEII3, and MICS-Asia3: simulations, emission inventories, boundary conditions, and model output formats, Atmos. Chem. Phys., 17, 1543–1555, https://doi.org/10.5194/acp-17-1543-2017, 2017.
Granier, C., Bessagnet, B., Bond, T. C., D'Angiola, A., Denier van der Gon, H., Frost, G. J., Heil, A., Kaiser, J. W., Kinne, S., Klimont, Z., Kloster, S., Lamarque, J.-F., Liousse, C., Masui, T., Meleux, F., Mieville, A., Ohara, T., Raut, J.-C., Riahi, K., Schultz, M. G., Smith, S. J., Thompson, A., Aardenne, J., Werf, G. R., and Vuuren, D. P.: Evolution of anthropogenic and biomass burning emissions of air pollutants at global and regional scales during the 1980–2010 period, Clim. Change, 109, 163–190, https://doi.org/10.1007/s10584-011-0154-1, 2011.
Hayman, G. D., O'Connor, F. M., Dalvi, M., Clark, D. B., Gedney, N., Huntingford, C., Prigent, C., Buchwitz, M., Schneising, O., Burrows, J. P., Wilson, C., Richards, N., and Chipperfield, M.: Comparison of the HadGEM2 climate-chemistry model against in situ and SCIAMACHY atmospheric methane data, Atmos. Chem. Phys., 14, 13257–13280, https://doi.org/10.5194/acp-14-13257-2014, 2014.
Henze, D. K., Hakami, A., and Seinfeld, J. H.: Development of the adjoint of GEOS-Chem, Atmos. Chem. Phys., 7, 2413–2433, https://doi.org/10.5194/acp-7-2413-2007, 2007.
Holmes, C. D., Prather, M. J., Søvde, O. A., and Myhre, G.: Future methane, hydroxyl, and their uncertainties: key climate and emission parameters for future predictions, Atmos. Chem. Phys., 13, 285–302, https://doi.org/10.5194/acp-13-285-2013, 2013.
Jacob, D. J. and Winner, D. A.: Effect of climate change on air quality, Atmos. Environ., 43, 51–63, https://doi.org/10.1016/j.atmosenv.2008.09.051, 2009.
Janssens-Maenhout, G., Crippa, M., Guizzardi, D., Dentener, F., Muntean, M., Pouliot, G., Keating, T., Zhang, Q., Kurokawa, J., Wankmüller, R., Denier van der Gon, H., Kuenen, J. J. P., Klimont, Z., Frost, G., Darras, S., Koffi, B., and Li, M.: HTAP_v2.2: a mosaic of regional and global emission grid maps for 2008 and 2010 to study hemispheric transport of air pollution, Atmos. Chem. Phys., 15, 11411–11432, https://doi.org/10.5194/acp-15-11411-2015, 2015.
Jerrett, M., Burnett, R. T., Pope, C. A., Ito, K., Thurston, G., Krewski, D., Shi, Y., Calle, E., and Thun, M.: Long-Term Ozone Exposure and Mortality, N. Engl. J. Med., 360, 1085–1095, https://doi.org/10.1056/NEJMoa0803894, 2009.
Kawase, H., Nagashima, T., Sudo, K., and Nozawa, T.: Future changes in tropospheric ozone under Representative Concentration Pathways (RCPs), Geophys. Res. Lett., 38, L05801, https://doi.org/10.1029/2010GL046402, 2011.
Kim, M. J., Park, R. J., Ho, C.-H., Woo, J.-H., Choi, K.-C., Song, C.-K., and Lee, J.-B.: Future ozone and oxidants change under the RCP scenarios, Atmos. Environ., 101, 103–115, https://doi.org/10.1016/J.ATMOSENV.2014.11.016, 2015.
Klimont, Z., Kupiainen, K., Heyes, C., Purohit, P., Cofala, J., Rafaj, P., Borken-Kleefeld, J., and Schöpp, W.: Global anthropogenic emissions of particulate matter including black carbon, Atmos. Chem. Phys., 17, 8681–8723, https://doi.org/10.5194/acp-17-8681-2017, 2017.
Klimont, Z., Hoglund-Isaksson, L., Heyes, C., Rafaj, P., Schopp, W., Cofala, J., Purohit, P., Borken-Kleefeld, J., Kupiainen, K., Kiesewetter, G., Winiwarter, W., Amann, M., Zhao, B., Bertok, I. and Sander, R.: Global scenarios of air pollutants and methane: 1990–2050, in prep., 2018.
Koffi, B., Dentener, F., Janssens-Maenhout, G., Guizzardi, D., Crippa, M., Diehl, T., Galmarini, S., and Solazzo, E.: Hemispheric Transport of Air Pollution (HTAP): Specification of the HTAP2 experiments – Ensuring harmonized Modelling, EUR 28255 EN, Luxembourg: Publications Office of the European Union., 2016.
Lin, M., Fiore, A. M., Horowitz, L. W., Cooper, O. R., Naik, V., Holloway, J., Johnson, B. J., Middlebrook, A. M., Oltmans, S. J., Pollack, I. B., Ryerson, T. B., Warner, J. X., Wiedinmyer, C., Wilson, J., and Wyman, B.: Transport of Asian ozone pollution into surface air over the western United States in spring, J. Geophys. Res. Atmos., 117, 1–20, https://doi.org/10.1029/2011JD016961, 2012.
Malley, C. S., Henze, D. K., Kuylenstierna, J. C. I., Vallack, H. W., Davila, Y., Anenberg, S. C., Turner, M. C. and Ashmore, M. R.: Updated Global Estimates of Respiratory Mortality in Adults ≥30 Years of Age Attributable to Long-Term Ozone Exposure, Environ. Health Perspect, 125, 087021 https://doi.org/10.1289/EHP1390, 2017.
Meinshausen, M., Raper, S. C. B., and Wigley, T. M. L.: Emulating coupled atmosphere-ocean and carbon cycle models with a simpler model, MAGICC6 – Part 1: Model description and calibration, Atmos. Chem. Phys., 11, 1417–1456, https://doi.org/10.5194/acp-11-1417-2011, 2011.
Myhre, G., Shindell, D., Breon, F.-M., Collins, W., Fuglestvedt, J., Huang, J., Koch, D., Lamarque, J.-F., Lee, D., Mendoza, B., Nakajima, T., Robock, A., Stephens, G., Takemura, T. and Zhang, H.: Anthropogenic and Natural Radiative Forcing, in: Climate Change 2013: The Physical Science Basis. Contribution of Working Group I to the Fifth Assessment Report of the Intergovernemental Panel on Cliamte Change, edited by: Stocker, T. F., Qin, D., Plattner, G.-K., Tignore, M., Allen, S. K., Boschung, J., Nauels, A., Xia, Y., Bex, V., and Midgley, P. M., Cambridge University Press, Cambridge, United Kingdom and New York, NY, USA, 2013.
O'Connor, F. M., Johnson, C. E., Morgenstern, O., Abraham, N. L., Braesicke, P., Dalvi, M., Folberth, G. A., Sanderson, M. G., Telford, P. J., Voulgarakis, A., Young, P. J., Zeng, G., Collins, W. J., and Pyle, J. A.: Evaluation of the new UKCA climate-composition model –Part 2: The Troposphere, Geosci. Model Dev., 7, 41–91, https://doi.org/10.5194/gmd-7-41-2014, 2014.
O'Neill, B. C., Kriegler, E., Riahi, K., Ebi, K. L., Hallegatte, S., Carter, T. R., Mathur, R., and van Vuuren, D. P.: A new scenario framework for climate change research: the concept of shared socioeconomic pathways, Clim. Change, 122, 387–400, https://doi.org/10.1007/s10584-013-0905-2, 2014.
Prather, M., Ehhalt, D., Dentener, F., Derwent, R., Dlugokencky, E., Holland, E., Isaksen, I., Katima, J., Kirchhoff, V., Matson, P., Midgley, P., Wang, M., Berntsen, T., Bey, I., Brasseur, G., Buja, L., Collins, W. J., Daniel, J., DeMore, W. B., Derek, N., Dickerson, R., Etheridge, D., Feichter, J., Fraser, P., Friedl, R., Fuglestvedt, J., Gauss, M., Grenfell, L., Grubler, A., Harris, N., Hauglustaine, D., Horowitz, L., Jackman, C., Jacob, D., Jaegle, L., Jain, A., Kanakidou, M., Karlsdottir, S., Ko, M., Kurylo, M., Lawrence, M., Logan, J. A., Manning, M., Mauzerall, D., McConnell, J., Mickley, L., Montzka, S., Muller, J. F., Olivier, J., Pickering, K., Pitari, G., Roelofs, G. J., Rogers, H., Rognerud, B., Smith, S., Solomon, S., Staehelin, J., Steele, P., Stevenson, D., Sundet, J., Thompson, A., van Weele, M., von Kuhlmann, R., Wang, Y., Weisenstein, D., Wigley, T., Wild, O., Wuebbles, D., and Yantosca, R.: Atmospheric Chemistry and Greenhouse Gases, in: Climate Change 2001: The Scientific Basis. Contribution of Working Group I to the Third Assessment Report of the Intergovernmental Panel on Climate Change, edited by: Houghton, J. T., Ding, Y., Griggs, D. J., Noguer, M., van der Linden, P. J., Dai, X., Maskell, K., and Jonson, C. A., 239–287, Cambridge University Press, Cambridge, United Kingdom and New York, NY, USA, 2001.
Rao, S., Klimont, Z., Smith, S. J., Dingenen, R. Van, Dentener, F., Bouwman, L., Riahi, K., Amann, M., Bodirsky, B. L., Van Vuuren, D. P., Reis, L. A., Calvin, K., Drouet, L., Fricko, O., Fujimori, S., Gernaat, D., Havlik, P., Harmsen, M., Hasegawa, T., Heyes, C., Hilaire, J., Luderer, G., Masui, T., Stehfest, E., Strefler, J., Van Der Sluis, S., and Tavoni, M.: Future air pollution in the Shared Socio-economic Pathways, Glob. Environ. Chang., 42, 346–358, https://doi.org/10.1016/j.gloenvcha.2016.05.012, 2017.
Riahi, K., Van Vuuren, D. P., Kriegler, E., Edmonds, J., O 'neill, B. C., Fujimori, S., Bauer, N., Calvin, K., Dellink, R., Fricko, O., Lutz, W., Popp, A., Cuaresma, J. C., Kc, S., Leimbach, M., Jiang, L., Kram, T., Rao, S., Emmerling, J., Ebi, K., Hasegawa, T., Havlik, P., Humpenöder, F., Aleluia, L., Silva, D., Smith, S., Stehfest, E., Bosetti, V., Eom, J., Gernaat, D., Masui, T., Rogelj, J., Strefler, J., Drouet, L., Krey, V., Luderer, G., Harmsen, M., Takahashi, K., Baumstark, L., Doelman, J. C., Kainuma, M., Klimont, Z., Marangoni, G., Lotze-Campen, H., Obersteiner, M., Tabeau, A., and Tavoni, M.: The Shared Socioeconomic Pathways and their energy, land use, and greenhouse gas emissions implications: An overview, Glob. Environ. Chang., 42, 153–168, https://doi.org/10.1016/j.gloenvcha.2016.05.009, 2017.
Simpson, D., Benedictow, A., Berge, H., Bergström, R., Emberson, L. D., Fagerli, H., Flechard, C. R., Hayman, G. D., Gauss, M., Jonson, J. E., Jenkin, M. E., Nyíri, A., Richter, C., Semeena, V. S., Tsyro, S., Tuovinen, J.-P., Valdebenito, Á., and Wind, P.: The EMEP MSC-W chemical transport model –technical description, Atmos. Chem. Phys., 12, 7825–7865, https://doi.org/10.5194/acp-12-7825-2012, 2012.
Søvde, O. A., Prather, M. J., Isaksen, I. S. A., Berntsen, T. K., Stordal, F., Zhu, X., Holmes, C. D., and Hsu, J.: The chemical transport model Oslo CTM3, Geosci. Model Dev., 5, 1441–1469, https://doi.org/10.5194/gmd-5-1441-2012, 2012.
Stevenson, D. S., Doherty, R. M., Sanderson, M. G., Collins, W. J., Johnson, C. E., and Derwent, R. G.: Radiative forcing from aircraft NOx emissions: Mechanisms and seasonal dependence, J. Geophys. Res., 109, D17307, https://doi.org/10.1029/2004JD004759, 2004.
Stevenson, D. S., Young, P. J., Naik, V., Lamarque, J.-F., Shindell, D. T., Voulgarakis, A., Skeie, R. B., Dalsoren, S. B., Myhre, G., Berntsen, T. K., Folberth, G. A., Rumbold, S. T., Collins, W. J., MacKenzie, I. A., Doherty, R. M., Zeng, G., van Noije, T. P. C., Strunk, A., Bergmann, D., Cameron-Smith, P., Plummer, D. A., Strode, S. A., Horowitz, L., Lee, Y. H., Szopa, S., Sudo, K., Nagashima, T., Josse, B., Cionni, I., Righi, M., Eyring, V., Conley, A., Bowman, K. W., Wild, O., and Archibald, A.: Tropospheric ozone changes, radiative forcing and attribution to emissions in the Atmospheric Chemistry and Climate Model Intercomparison Project (ACCMIP), Atmos. Chem. Phys., 13, 3063–3085, https://doi.org/10.5194/acp-13-3063-2013, 2013.
Sudo, K., Takahashi, M., Kurokawa, J., and Akimoto, H.: CHASER: A global chemical model of the troposphere 1, Model description, J. Geophys. Res.-Atmos., 107, ACH 7-1-ACH 7-20, https://doi.org/10.1029/2001JD001113, 2002.
Task Force on Hemispheric Transport of air Pollution (TF-HTAP): Hemispheric Transport of Air Pollution, Part A: Ozone and Particulate Matter, Air Pollution Studies No. 17, edited by: Dentener, F., Keating, T., and Akimoto, H., United Nations, New York and Geneva, 2010.
The HadGEM2 Development Team: G. M. Martin, Bellouin, N., Collins, W. J.,Culverwell, I. D., Halloran, P. R., Hardiman, S. C., Hinton, T. J., Jones, C. D., McDonald, R. E., McLaren, A. J., O'Connor, F. M., Roberts, M. J., Rodriguez, J. M., Woodward, S., Best, M. J., Brooks, M. E., Brown, A. R., Butchart, N., Dearden, C., Derbyshire, S. H., Dharssi, I., Doutriaux-Boucher, M., Edwards, J. M., Falloon, P. D., Gedney, N., Gray, L. J., Hewitt, H. T., Hobson, M., Huddleston, M. R., Hughes, J., Ineson, S., Ingram, W. J., James, P. M., Johns, T. C., Johnson, C. E., Jones, A., Jones, C. P., Joshi, M. M., Keen, A. B., Liddicoat, S., Lock, A. P., Maidens, A. V., Manners, J. C., Milton, S. F., Rae, J. G. L., Ridley, J. K., Sellar, A., Senior, C. A., Totterdell, I. J., Verhoef, A., Vidale, P. L., and Wiltshire, A.: The HadGEM2 family of Met Office Unified Model climate configurations, Geosci. Model Dev., 4, 723–757, https://doi.org/10.5194/gmd-4-723-2011, 2011.
Tilmes, S., Lamarque, J.-F., Emmons, L. K., Kinnison, D. E., Marsh, D., Garcia, R. R., Smith, A. K., Neely, R. R., Conley, A., Vitt, F., Val Martin, M., Tanimoto, H., Simpson, I., Blake, D. R., and Blake, N.: Representation of the Community Earth System Model (CESM1) CAM4-chem within the Chemistry-Climate Model Initiative (CCMI), Geosci. Model Dev., 9, 1853–1890, https://doi.org/10.5194/gmd-9-1853-2016, 2016.
Turner, M. C., Jerrett, M., Pope, C. A., Krewski, D., Gapstur, S. M., Diver, W. R., Beckerman, B. S., Marshall, J. D., Su, J., Crouse, D. L., and Burnett, R. T.: Long-Term Ozone Exposure and Mortality in a Large Prospective Study, Am. J. Respir. Crit. Care Med., 193, 1134–1142, https://doi.org/10.1164/rccm.201508-1633OC, 2016.
United Nations Economic Commission for Europe (UNECE): Towards Cleaner Air. Scientific Assessment Report 2016, edited by: Maas, R. and Grennfelt, P., Oslo, 2016.
van Vuuren, D. P., Edmonds, J., Kainuma, M., Riahi, K., Thomson, A., Hibbard, K., Hurtt, G. C., Kram, T., Krey, V., Lamarque, J.-F., Masui, T., Meinshausen, M., Nakicenovic, N., Smith, S. J., and Rose, S. K.: The representative concentration pathways: an overview, Clim. Change, 109, 5–31, https://doi.org/10.1007/s10584-011-0148-z, 2011.
van Vuuren, D. P., Kriegler, E., O'Neill, B. C., Ebi, K. L., Riahi, K., Carter, T. R., Edmonds, J., Hallegatte, S., Kram, T., Mathur, R., and Winkler, H.: A new scenario framework for Climate Change Research: scenario matrix architecture, Clim. Change, 122, 373–386, https://doi.org/10.1007/s10584-013-0906-1, 2014.
von Schneidemesser, E., Monks, P. S., Allan, J. D., Bruhwiler, L., Forster, P., Fowler, D., Lauer, A., Morgan, W. T., Paasonen, P., Righi, M., Sindelarova, K., and Sutton, M. A.: Chemistry and the Linkages between Air Quality and Climate Change, Chem. Rev., 115, 3856–3897, https://doi.org/10.1021/acs.chemrev.5b00089, 2015.
West, J. J., Fiore, A. M., Naik, V., Horowitz, L. W., Schwarzkopf, M. D., and Mauzerall, D. L.: Ozone air quality and radiative forcing consequences of changes in ozone precursor emissions, Geophys. Res. Lett., 34, L06806, https://doi.org/10.1029/2006GL029173, 2007.
Wild, O. and Akimoto, H.: Intercontinental transport of ozone and its precursors in a three-dimensional global CTM, J. Geophys. Res.-Atmos., 106, 27729–27744, https://doi.org/10.1029/2000JD000123, 2001.
Wild, O., Fiore, A. M., Shindell, D. T., Doherty, R. M., Collins, W. J., Dentener, F. J., Schultz, M. G., Gong, S., MacKenzie, I. A., Zeng, G., Hess, P., Duncan, B. N., Bergmann, D. J., Szopa, S., Jonson, J. E., Keating, T. J., and Zuber, A.: Modelling future changes in surface ozone: a parameterized approach, Atmos. Chem. Phys., 12, 2037–2054, https://doi.org/10.5194/acp-12-2037-2012, 2012.
Wu, S., Duncan, B. N., Jacob, D. J., Fiore, A. M., and Wild, O.: Chemical nonlinearities in relating intercontinental ozone pollution to anthropogenic emissions, Geophys. Res. Lett., 36, L05806, https://doi.org/10.1029/2008GL036607, 2009.
Young, P. J., Archibald, A. T., Bowman, K. W., Lamarque, J.-F., Naik, V., Stevenson, D. S., Tilmes, S., Voulgarakis, A., Wild, O., Bergmann, D., Cameron-Smith, P., Cionni, I., Collins, W. J., Dalsøren, S. B., Doherty, R. M., Eyring, V., Faluvegi, G., Horowitz, L. W., Josse, B., Lee, Y. H., MacKenzie, I. A., Nagashima, T., Plummer, D. A., Righi, M., Rumbold, S. T., Skeie, R. B., Shindell, D. T., Strode, S. A., Sudo, K., Szopa, S., and Zeng, G.: Pre-industrial to end 21st century projections of tropospheric ozone from the Atmospheric Chemistry and Climate Model Intercomparison Project (ACCMIP), Atmos. Chem. Phys., 13, 2063–2090, https://doi.org/10.5194/acp-13-2063-2013, 2013.