the Creative Commons Attribution 4.0 License.
the Creative Commons Attribution 4.0 License.
 | 27 Jun 2018
Impact of surface and near-surface processes on ice crystal concentrations measured at mountain-top research stations
Alexander Beck
Jan Henneberger
Jacob P. Fugal
Robert O. David
Larissa Lacher
Ulrike Lohmann
In situ cloud observations at mountain-top research stations regularly measure ice crystal number concentrations (ICNCs) orders of magnitudes higher than expected from measurements of ice nucleating particle (INP) concentrations. Thus, several studies suggest that mountain-top in situ cloud microphysical measurements are influenced by surface processes, e.g., blowing snow, hoar frost or riming on snow-covered trees, rocks and the snow surface. This limits the relevance of such measurements for the study of microphysical properties and processes in free-floating clouds.
This study assesses the impact of surface processes on in situ cloud observations at the Sonnblick Observatory in the Hohen Tauern region, Austria. Vertical profiles of ICNCs above a snow-covered surface were observed up to a height of 10 m. The ICNC decreases at least by a factor of 2 at 10 m if the ICNC at the surface is larger than 100 L−1. This decrease can be up to 1 order of magnitude during in-cloud conditions and reached its maximum of more than 2 orders of magnitudes when the station was not in cloud. For one case study, the ICNC for regular and irregular ice crystals showed a similar relative decrease with height. This suggests that either surface processes produce both irregular and regular ice crystals or other effects modify the ICNCs near the surface. Therefore, two near-surface processes are proposed to enrich ICNCs near the surface. Either sedimenting ice crystals are captured in a turbulent layer above the surface or the ICNC is enhanced in a convergence zone because the cloud is forced over a mountain. These two processes would also have an impact on ICNCs measured at mountain-top stations if the surrounding surface is not snow covered. Conclusively, this study strongly suggests that ICNCs measured at mountain-top stations are not representative of the properties of a cloud further away from the surface.
- Article
(7836 KB) - Full-text XML
- BibTeX
- EndNote


Cloud microphysical properties (e.g., phase composition, cloud particle number concentrations and size distributions) next to dynamical processes are key parameters for the cloud's lifetime, the cloud extent and the intensity of precipitation they produce (Rotunno and Houze, 2007). In particular, orographic precipitation plays a crucial role for the world's water resources, as the headwaters of many rivers are located in alpine regions (Roe, 2015). In the midlatitudes, mixed-phase clouds (MPCs) consisting of a mixture of ice crystals and supercooled liquid droplets produce 30 to 50 % of liquid precipitation (Mülmenstädt et al., 2015) due to the rapid growth of ice crystals to precipitation size in the presence of supercooled liquid droplets. This is due to a higher saturation vapor pressure over liquid water than over ice, and thus ice crystals grow at the expense of evaporating cloud droplets. This process was first described in the works of Bergeron (1935), Findeisen (1938) and Wegener (1911) and is referred to as the Wegener–Bergeron–Findeisen (WBF) process. As such, correctly representing the fraction of ice in orographic MPCs is crucial for accurate weather and water resource predictions in alpine terrain.
In situ measurements are important to further improve our understanding of the microphysical properties and fundamental processes of orographic MPCs (Baumgardner et al., 2011) and are frequently conducted at mountain-top research stations. Despite an improved understanding of the origin of ice crystals from nucleation (DeMott et al., 2010; Hoose and Möhler, 2012; Murray et al., 2012; Boose et al., 2016) and secondary ice-multiplication processes (Field et al., 2017), the source of most of the ice crystals observed at mountain-top stations and their impact on the development of the cloud remains an enigma (Lohmann et al., 2016).
In situ observations with aircraft usually observe ICNCs on the order of 1–10 L−1 (Gultepe et al., 2001), whereas at mountain-top research stations (e.g., Elk Mountain, USA or Jungfraujoch, Switzerland) or near the snow surface in the Arctic ICNCs of several hundreds to thousands per liter are frequently reported (Rogers and Vali, 1987; Lachlan-Cope et al., 2001; Lloyd et al., 2015), which exceeds the number of measured ice nuclei by several orders of magnitude (see Fig. 18). This discrepancy between ice nuclei and ICNC may be explained by so-called secondary ice-multiplication processes. A commonly accepted secondary ice-multiplication process to enhance ICNCs in free-floating clouds is the rime-splintering or Hallett–Mossop process. This process describes the production of small splinters after the impact of cloud droplets on ice crystals and a subsequent burst of the cloud droplet during its freezing process. It is active only in a small temperature range of −3 to −8 ∘C and the presence of small (< ∼ 13 µm) and large (> ∼ 25 µm) cloud droplets is required (Hallett and Mossop, 1974; Choularton et al., 1980). Another secondary ice-multiplication process is the fracturing of fragile ice crystals upon collision with other solid cloud particles (Vardiman, 1978; Griggs and Choularton, 1986). Although this process has been studied in the lab and is expected to occur at temperatures of ∼ −15 ∘C, there is little evidence from field measurements for this process to significantly contribute to the ICNC (e.g., Lloyd et al., 2014; Crosier et al., 2011; Crawford et al., 2012). Other processes that produce secondary ice crystals are associated with the freezing of cloud droplets and the subsequent breakup or ejection of small spicules (Lauber et al., 2018). In previous studies, the described secondary ice-multiplication in free-floating clouds like fragmentation (Rangno and Hobbs, 2001) or the Hallett–Mossop process (Hallett and Mossop, 1974) is usually ruled out as the source of the observed ice crystals due to the absence of large ice crystals necessary for fragmentation or the absence of large cloud droplets and the right temperature range necessary for the Hallett–Mossop process. Instead, surface processes are proposed to produce such enormous ICNCs. Rogers and Vali (1987) suggested two possible processes as a source of the observed ICNC: riming on trees, rocks and the snow surface or the lofting of snow particles from the surface, i.e., blowing snow. Riming as a surface process is similar to the previously described rime-splintering process in free-floating clouds. For this process to be active, cloud droplets need to be present near the surface, as is typically the case with orographic mixed-phase clouds. Blowing snow, on the other hand, can also occur without a cloud present and can be frequently observed visually in winter at mountain ridges (Geerts et al., 2015). In addition, Lloyd et al. (2015) suggested hoar frost as a wind-independent surface process causing ICNCs larger than 100 L−1 for which they did not observe a wind speed dependency as expected for blowing snow. Hoar frost describes the formation of vapor-grown ice crystals on the crystalline snow surface, which may be detached due to mechanical fracture. Although different studies are strife about the mechanisms to explain the measured high ICNCs, they agree on a strong influence by surface processes.
While the influence of surface processes on ICNCs observed at mountain-top stations has received more attention in recent years (Lloyd et al., 2015), the impact of surface processes on the development of supercooled orographic clouds, e.g., a more rapid glaciation and enhanced precipitation, has not been studied extensively (Geerts et al., 2015). Whether the proposed surface processes have the potential to impact the development of a cloud depends primarily on the penetration depth of the resuspended particle into a cloud, i.e., the maximum height above the surface to which the particles get lofted.
The height dependence of blowing snow has been studied in the context of snow redistribution (“snow drift”) and reduced visibility due to resuspended ice crystals by observing ice crystals up to several meters above a snow surface (Schmidt, 1982; Nishimura and Nemoto, 2005). It has been reported that blowing snow occurs above a certain wind speed threshold. This threshold varies between 4 and 13 m s−1 (Bromwich, 1988; Li and Pomeroy, 1997; Mahesh et al., 2003; Déry and Yau, 1999) because the concentration of blowing snow depends on snowpack properties (e.g., snow type, density, wetness) in addition to atmospheric conditions (e.g., wind speed, temperature, humidity) (Vionnet et al., 2013). Nishimura and Nemoto (2005) observed resuspended ice crystals from the surface up to a height of 9.6 m and found that the ICNCs usually decreased to as low as 1–10 particles per liter. Meanwhile, during a precipitation event, the relative importance of the small ice crystals (< 100 µm) decreases from nearly 100 % at 1.1 m to below 20 % at 9.6 m. The rapid decrease in ICNC with height observed in these studies may limit the impact of blowing snow on orographic clouds. The applicability of these results to orographic cloud may be restricted because most of these studies were conducted in dry air conditions under which ice crystals undergo rapid sublimation (Yang and Yau, 2008), and lofting of ice crystals is more likely in orographic terrain because updrafts are higher than over flat surfaces.
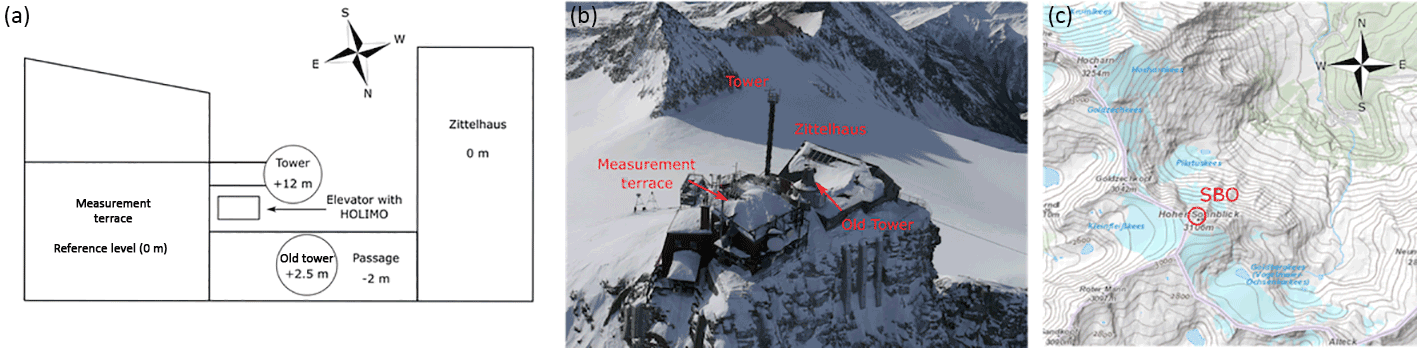
Figure 1Sketch of the experimental setup and the surrounding structures (a) with their heights relative to the bottom of the measurement terrace. Aerial image of the Sonnblick Observatory (b, courtesy of Michael Staudinger, ZAMG) and a topographic map of the Hohen Tauern region surrounding the Sonnblick Observatory (c, https://basemap.at/, last access: 24 September 2017).
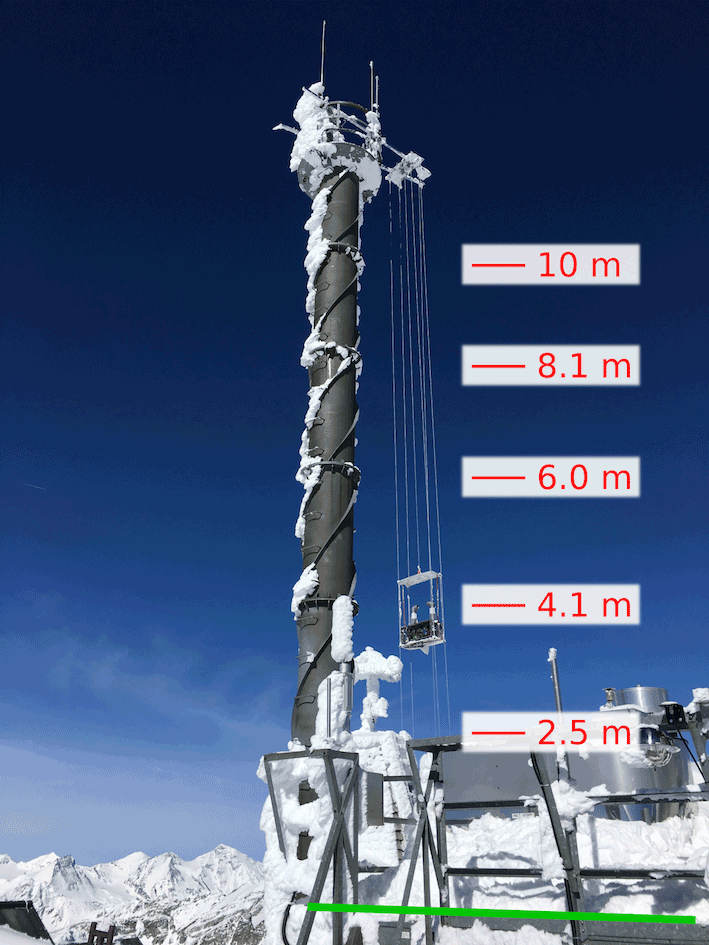
Figure 2Setup of the elevator with the holographic imager HOLIMO mounted on the meteorological tower at the SBO (courtesy of Monika Burkert, ETH Zürich). The red lines and numbers indicate the five different heights at which the elevator was repeatedly positioned to obtain vertical profiles of the ICNC. The reference height of 0.0 m is the bottom of the measurement platform (green line).
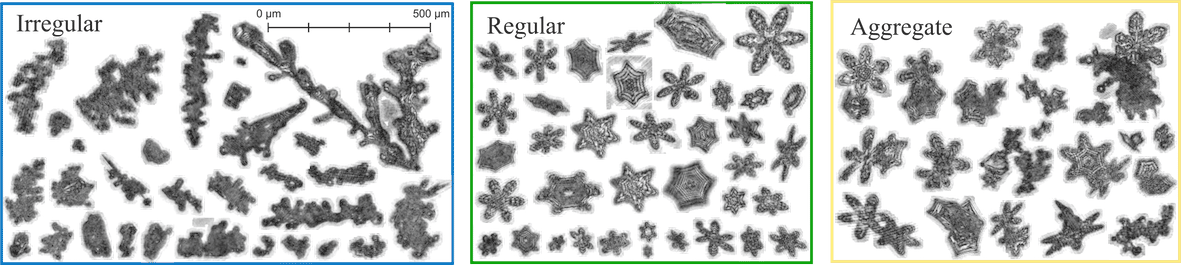
Figure 3Examples of 2-D images taken by the holographic imager HOLIMO for the three subclassifications of ice crystal habits (irregular, regular and aggregates). The images are a collection recorded during the field campaign at different heights of the elevator.
Lloyd et al. (2015) suggested that vapor-grown ice crystals on the crystalline surface of the snow cover, i.e., hoar frost, may be detached by mechanical fracturing due to turbulence, independent of wind speed. To our knowledge, only one modeling study exists that assesses the impact of hoar frost on the development of a cloud. Farrington et al. (2015) increased the IN concentration and simulated secondary ice processes in the WRF (Weather Research and Forecasting) model to produce such high ICNCs measured at the Jungfraujoch by Lloyd et al. (2015). In addition, they implemented a flux of surface hoar crystals based on a frost flower aerosol flux. They concluded that an increased IN concentration can better represent the high ICNCs observed at the Jungfraujoch, but also removed the liquid water from the model and prevented the existence of mixed-phase clouds. They also found that secondary ice processes are not sufficient to explain such high ICNCs at cold temperatures. However, they found that a flux of surface-based ice crystals, i.e., hoar frost, provided a good agreement with the ICNCs measured by Lloyd et al. (2015). On the other hand, surface-based ice crystals are not advected high into the atmosphere and as such have a limited impact on orographic clouds. To verify their findings regarding the impact of a surface flux on orographic clouds, more measurements of ice crystal fluxes from the snow-covered surface are necessary (Farrington et al., 2015).
In contrast to these findings, several remote sensing (i.e., satellite, lidar and radar) studies measured ice crystals advected as high as 1 km above the surface that suggest an impact of surface-originated ice crystals on clouds (e.g., Rogers and Vali, 1987; Geerts et al., 2015). Satellite observations of blowing snow from MODIS and CALIOP over Antarctica (Palm et al., 2011) observed ice crystals up to 1 km above the surface with an average height of 120 m for all observed blowing snow events. Similar observations from lidar measurements exist from the South Pole with observed ice crystal heights of usually less than 400 m, with some rare cases when a subvisible layer exceeded a height of 1 km (Mahesh et al., 2003). However, the suspension of clear-sky precipitation could not be ruled out as a source of the observed ice crystal layers. Radar measurements of ice crystals from an aircraft in the vicinity of the Medicine Bow Mountains (Vali et al., 2012) detected subvisible ground-layer snow clouds most of the time. Indeed, Geerts et al. (2015) presented evidence for ice crystals becoming lofted up to 250 m in the atmosphere by boundary layer separation behind terrain crests and by hydraulic jumps. They proposed that these ice crystals from the surface may lead to a rapid glaciation of supercooled orographic clouds and enhanced precipitation. However, they also mentioned the limitation of radar and lidar measurements to separate the small ice crystals produced by surface processes from the larger falling snow particles and more abundant cloud droplets. They even concluded that “to explore BIP (blowing snow ice particles) lofting into orographic clouds, ice particle imaging devices need to be installed on a tall tower, or on a very steep mountain like the Jungfraujoch”.
In this study we assess the influence of surface processes on in situ cloud observations at mountain-top stations and the potential impact on orographic mixed-phase clouds. Vertical profiles of the ICNC up to a height of 10 m above the surface were for the first time observed on a high-altitude mountain station with the holographic imager HOLIMO (Beck et al., 2017). HOLIMO is capable of imaging ice crystals larger than 25 µm and the shape of these ice crystals can be analyzed.
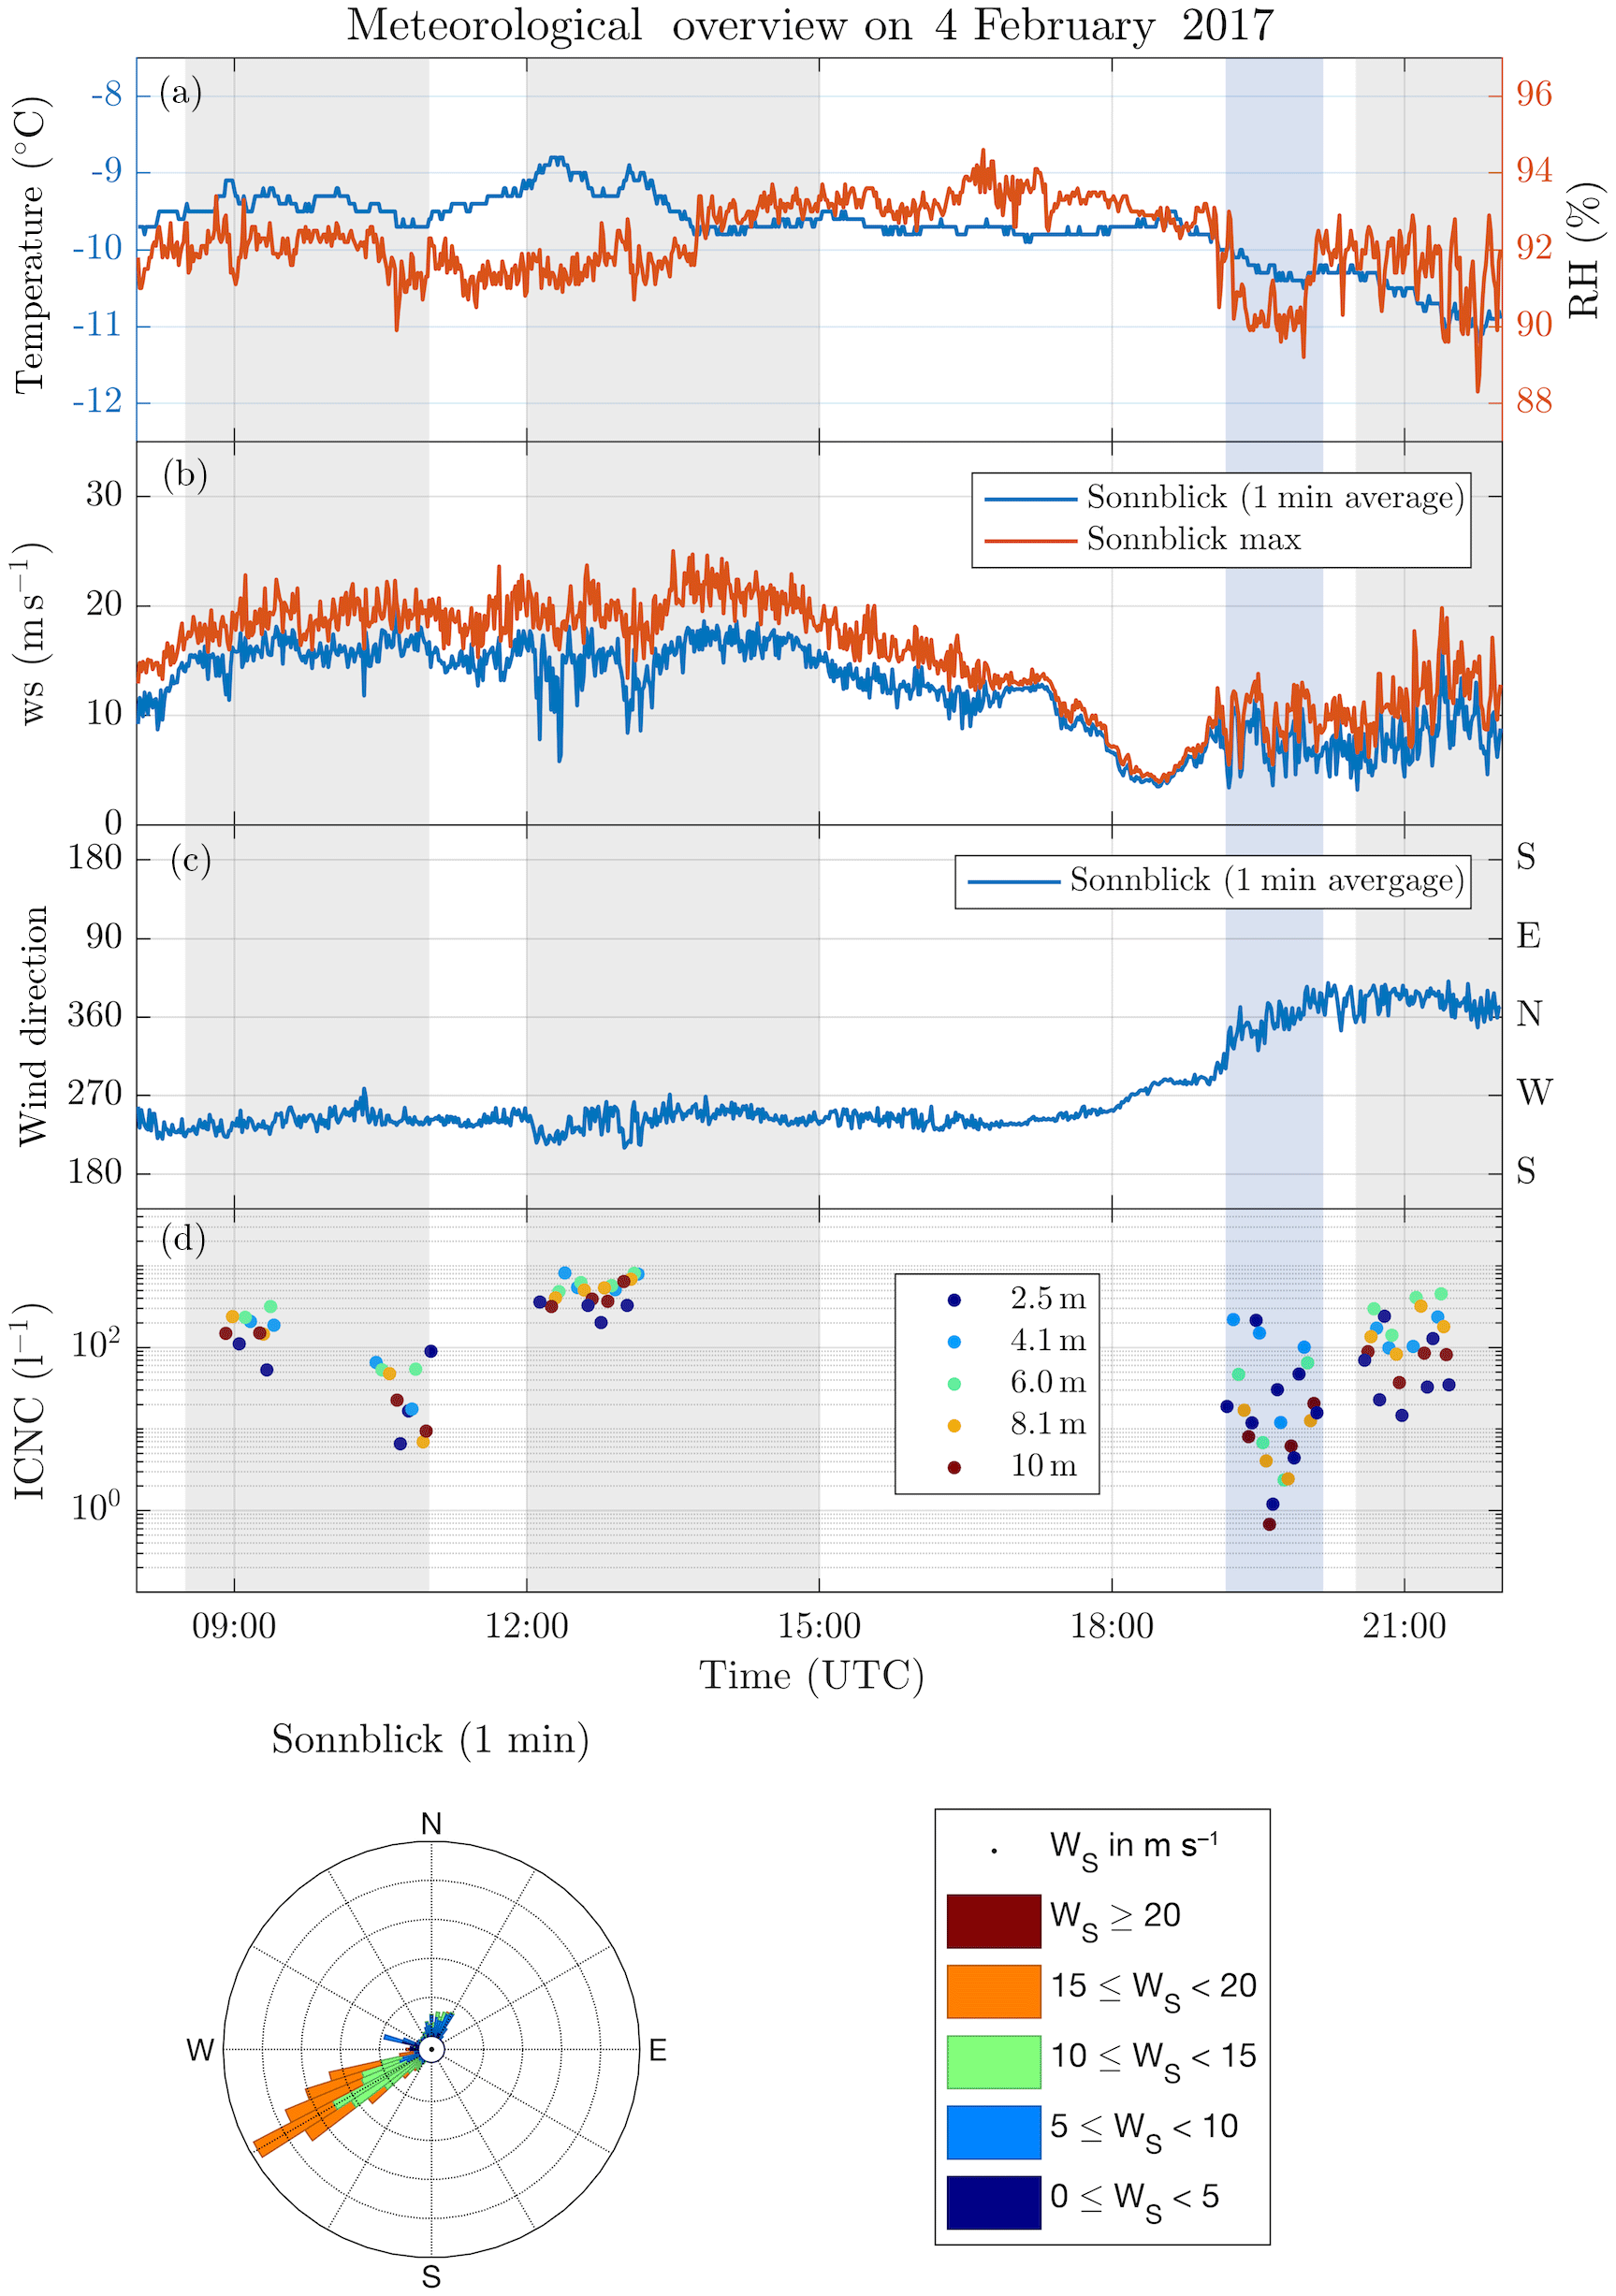
Figure 4Overview of the meteorological and microphysical parameters on 4 February 2017. Meteorological measurements are 1 min averages except for the maximum wind speed (ws), which corresponds to the maximum wind speed observed during a 1 min average. The shaded areas represent intervals with ice crystal measurements with the SBO in cloud (gray) and not in cloud (blue). Shown are the temperature and relative humidity (a), wind speed (b) and wind direction (c). A wind rose plot is shown in the bottom panel. The ICNC measurements (d) are averages for each height level during a single profile.
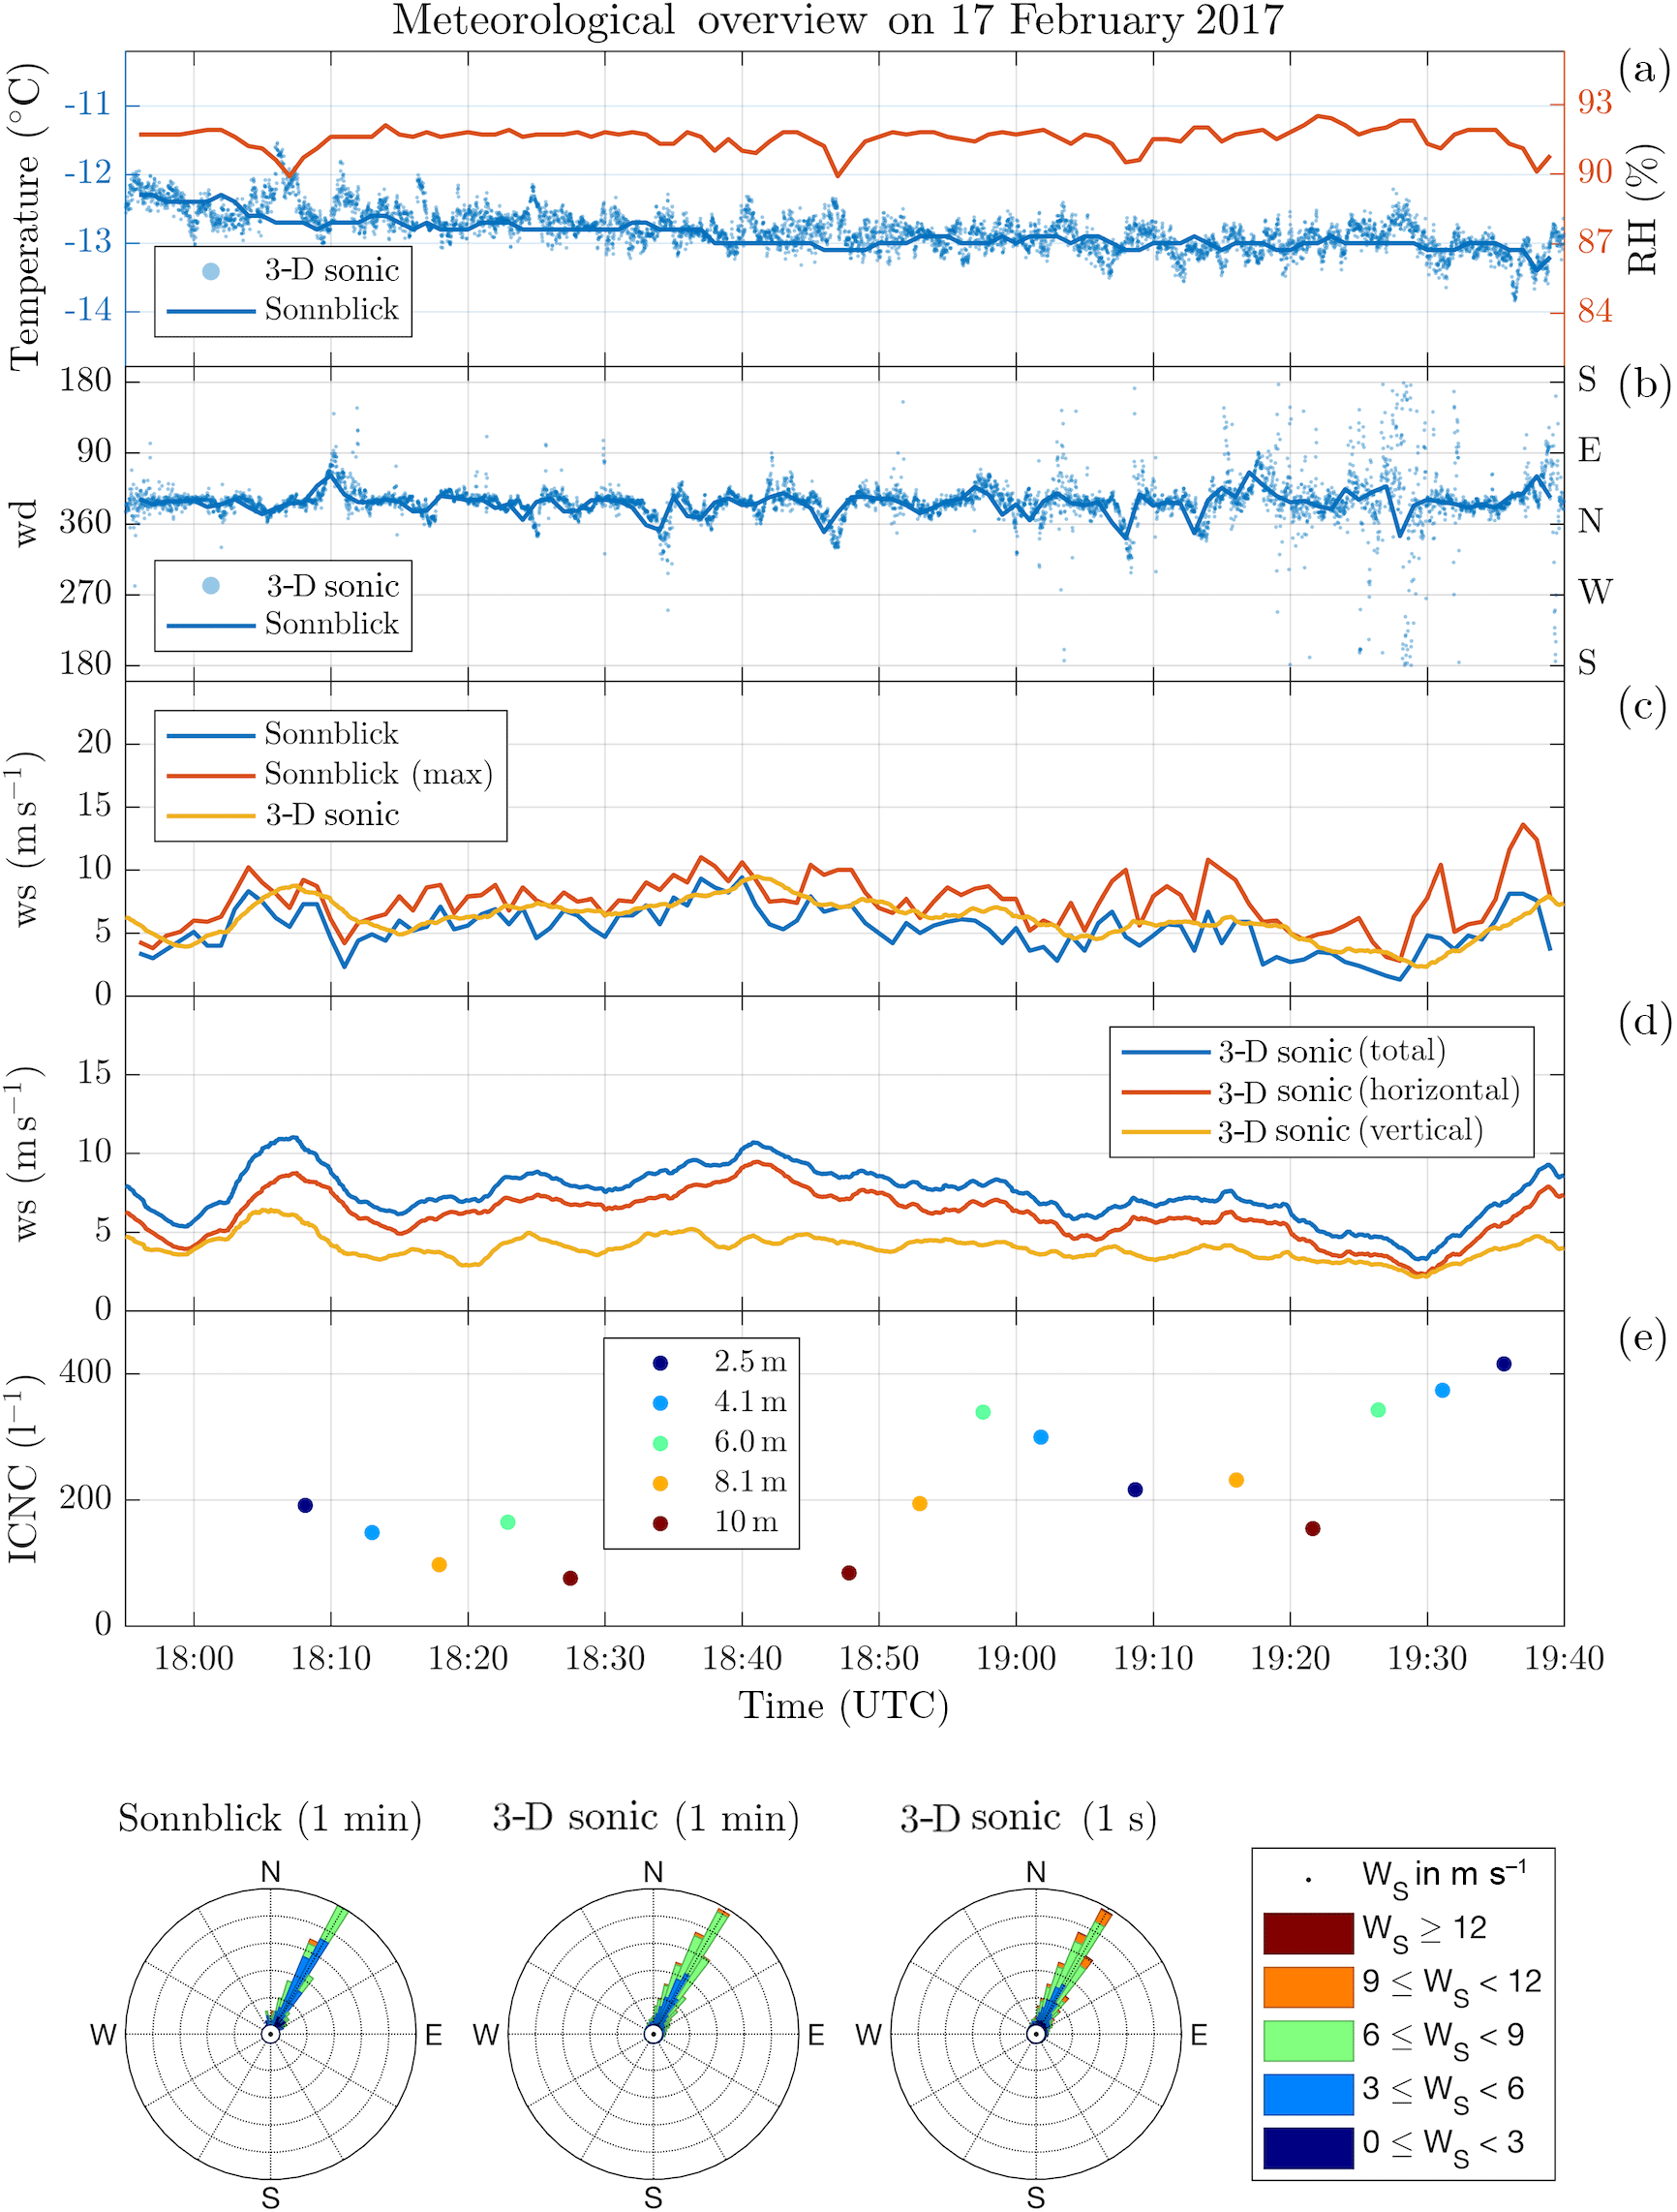
Figure 5As Fig. 4, but for 17 February 2017. On this day temperature and wind measurements are available from the SBO and the 3-D sonic anemometer. Shown are the temperature and relative humidity (a), wind direction (b), a comparison of the horizontal wind speed from the SBO and the 3-D sonic anemometer (c), and detailed wind speed from the 3-D sonic anemometer (d) and the ICNC (e).
2.1 Site description
This field campaign was conducted at the Sonnblick Observatory (SBO) situated at the summit of Mt. Sonnblick at 3106 (12∘57′ E, 47∘03′ N) in the Hohen Tauern National Park in the Austrian Alps. The SBO is a meteorological observatory operated all year by the ZAMG (Central Institute for Meteorology and Geodynamics). To the east and south, the SBO is surrounded by large glacier fields with a moderate slope, whereas to the northeast a steep wall of approximately 800 m descends into the valley (Fig. 1b, c). Part of the SBO is a 15 m high tower used for meteorological measurements by the ZAMG. The data presented in this paper were collected during a field campaign in February 2017.
2.2 Instrumentation
The properties of hydrometeors were observed with the holographic imager HOLIMO, which is part of the HoloGondel platform (Beck et al., 2017). HOLIMO was mounted on an elevator that was attached to the meteorological tower of the SBO (Fig. 2) to obtain vertical profiles of the hydrometeor properties up to a height of 10 m above the surface. The elevator was repeatedly positioned at five different heights as indicated in Fig. 2. To reduce the impacts of the tower on observed microphysical properties, HOLIMO was mounted 1.5 m from the east–northeast side of the tower (Fig. 1c).
A single vertical profile was observed within a time interval of 10–12 min by positioning the holographic imager HOLIMO at individual heights for 2 min and recording holograms at 4 frames per second. This allowed for 8 L of air to be sampled at each vertical position.
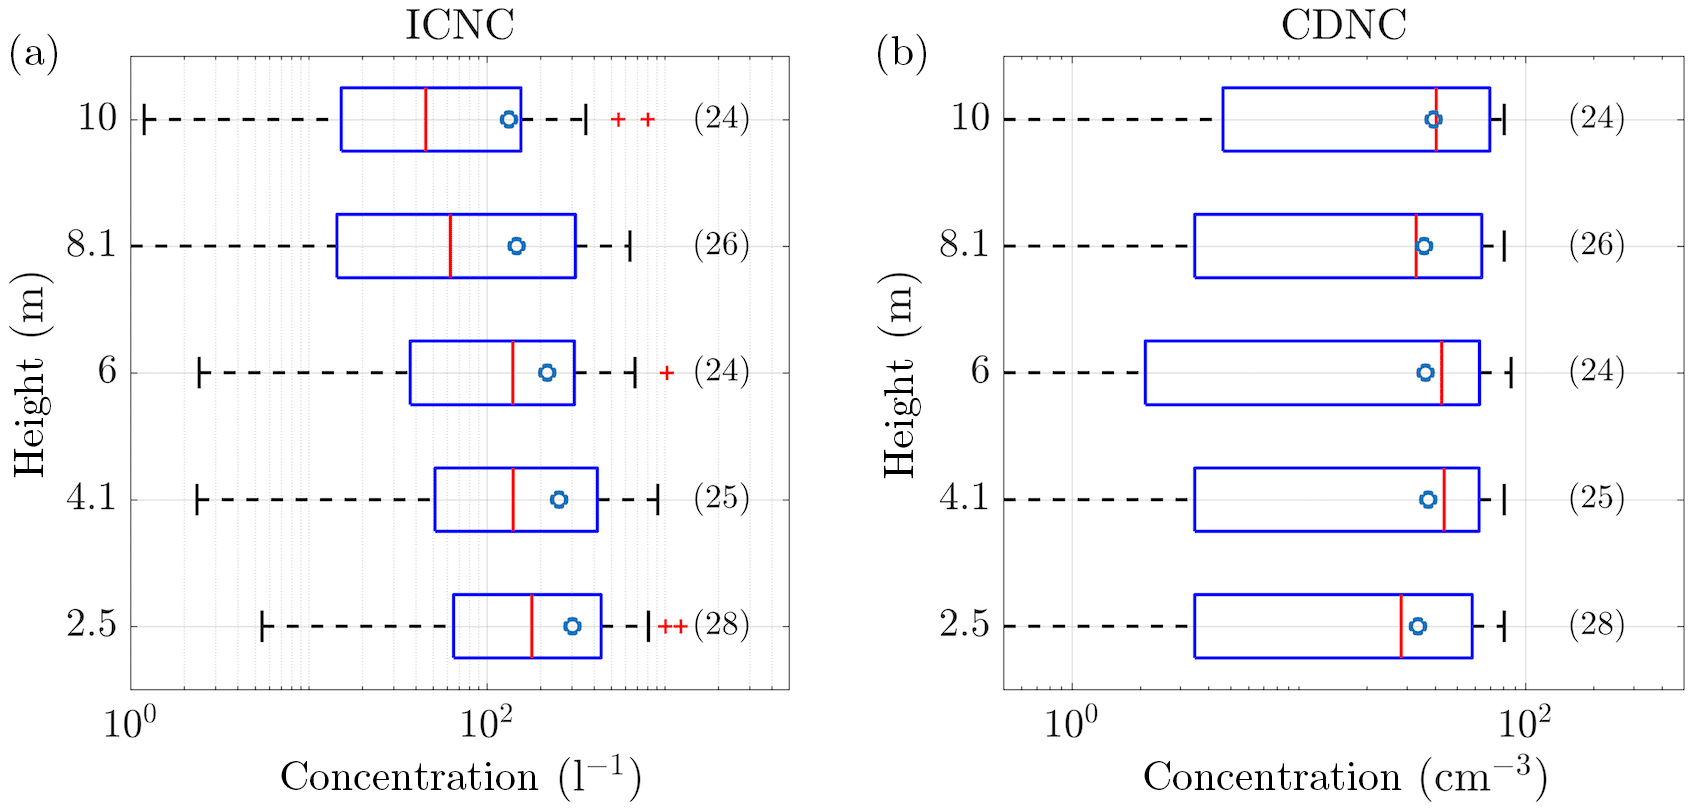
Figure 6ICNC (a) and CDNC (b) as a function of the height of the elevator at the meteorological tower of the SBO. This plot is a summary of the 24 profiles obtained on 4 February 2017. The data were averaged for each height over the entire time period. In brackets are the number of measurements per height. For each box, the central line marks the median value of the measurement and the left and right edges of the box represent the 25th and the 75th percentiles, respectively. The whiskers extend to the minima and maxima of the data; outliers are marked as red pluses. The mean values of the measurements are indicated as blue circles.
Coinciding meteorological measurements were made by the ZAMG, which include 1 min averages of temperature, relative humidity and horizontal wind speed and direction at the top of the meteorological tower. Snow cover depth was manually observed by the operators of the SBO everyday. Based on these measurements, the change in the snow cover was calculated. This calculation includes all the changes in the snow cover depth, e.g., snow drift, sublimation, melting and fresh snow. Daily measurements of the total precipitation are available on the north and south side of the SBO. A ceilometer located in the valley north of the SBO measured the cloud base and cloud depth.
In addition, a 3-D sonic anemometer was mounted at the top of the meteorological tower. However, the data are intermittent as the heating of the anemometer was frequently insufficient to prevent the riming of the measurement arms.
The data presented were observed on 4 and 17 February 2017. Figures 4 and 5 show an overview of the meteorological conditions on both days. The main difference is the wind direction, which was southwesterly on most of 4 February and northerly on 17 February.

Figure 7ICNCs as a function of the height of the elevator for four different time intervals during 4 February, representing different conditions (Fig. 4). From the 24 profiles observed on 4 February 2017 the individual profiles (left) show only 16 for better readability of the figure. The circles indicate the mean and the error bars the standard error of the mean. The shaded areas extend from the minima to the maxima of the measured ICNCs. Each color represents one profile with the elevator in the corresponding time interval. The box plots (right) show a summary of all 24 profiles in the respective time interval as in Fig. 6.
3.1 Case study on 4 February 2017
On 4 February a low-pressure system tracked eastwards from the Atlantic Ocean over northern France and reached western Germany, where it slowly dissipated. Influenced by this low-pressure system, the wind at the SBO predominantly came from the west–southwest with wind speeds between 10 and 25 m s−1 (Fig. 4b and c). By late afternoon at around 19:00 UTC, the low-pressure system dissipated over western Germany, the wind direction shifted to the north and wind speeds decreased to a minimum of 5 m s−1. After 19:00 UTC the wind speed increased again to up to 15 m s−1. Due to riming of the 3-D sonic anemometer, 1 min averages of wind speed and direction from the ZAMG measurements were used. The temperature remained between −10 and −9 ∘C until 19:00 UTC when the wind direction shifted to the north and the temperature decreased to −11 ∘C by 22:00 UTC. The SBO was in cloud for most of the measurements, except for a short time interval between 19:10 and 20:20 UTC.
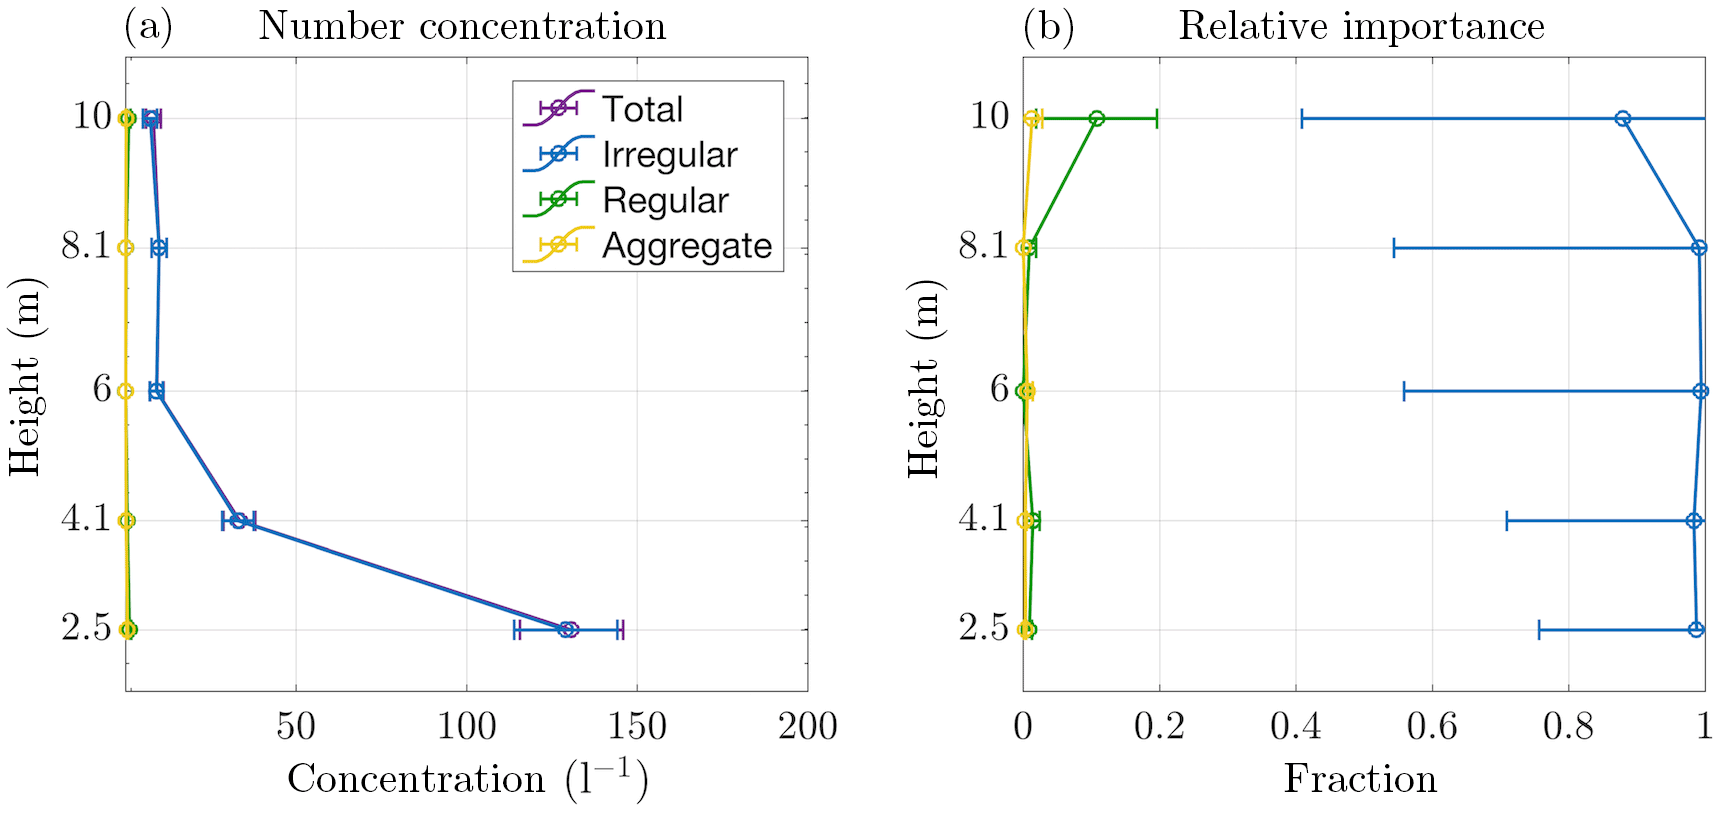
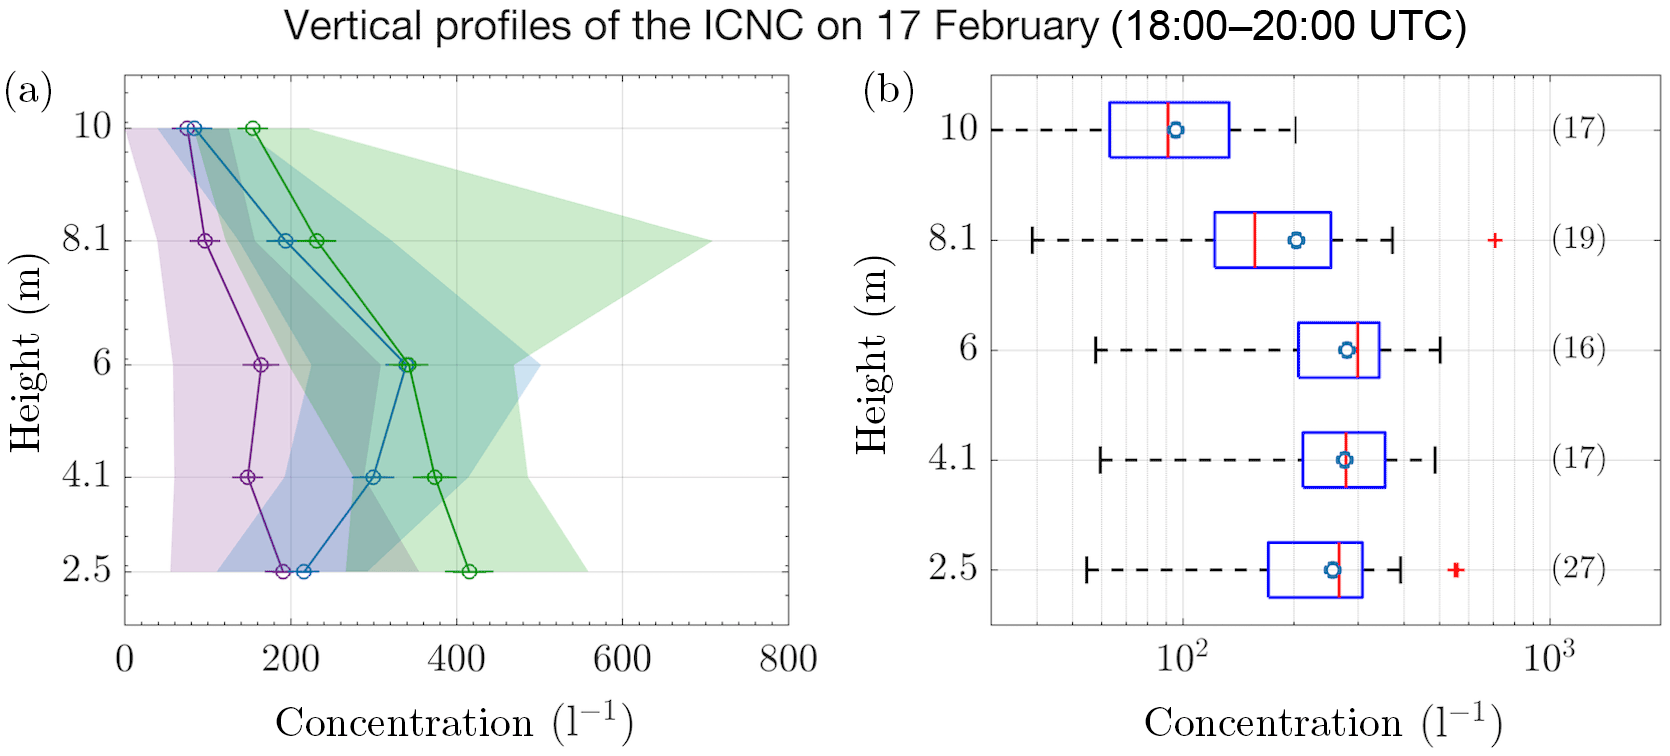
Figure 8Vertical profile of the concentration (a) and the fraction (b) of individual ice crystal habits for the profiles between 19:10 and 20:20 UTC on 4 February 2017. The concentration of regular crystals and aggregates is below 1 L−1 for all heights. For the fraction, the ICNCs of individual habits were divided by the total ICNCs. The circles represent the mean and the error bars represent the standard error of the mean.
Figure 6 shows a summary of the height dependence of ICNCs and CDNCs for all 24 profiles. Averaged over the time period of a single measurement at an individual height, the ICNC reached a maximum of 200 L−1 at 2.5 m above the surface and decreased by a factor of 2 at a height of 10 m, while the median decreased by a factor of 4 in the same height interval. The CDNC, on the other hand, stayed constant with height. The decrease in ICNCs with height and the height independence of CDNCs suggest that surface processes strongly influence the ICNC close to the surface. For a more detailed presentation of the results, the measurement period is divided into four time intervals representing different meteorological conditions as indicated by the shaded areas in Fig. 4. The most important features of the profiles for the different time intervals are summarized in Table 1.
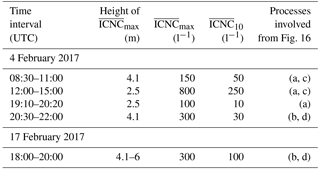
Table 1Summary of important features of the ICNC profiles observed on 4 February (Fig. 7) and 17 February (Fig. 10) 2017. refers to the observed maximum of the mean ICNC over height. refers to the average ICNC at 10 m.
Between 19:10 and 20:10 UTC (Fig. 7, third row) there were clear-sky conditions at the SBO. The ICNC reached a maximum instantaneous value of 600 L−1 in a single hologram at 2.5 m. The large shaded area represents the high variability of the ICNC over the respective measurement period. The average ICNC of all clear-sky data in this time period decreases by a factor of 10 within 7.5 m, and more than 98 % of the observed ice crystals had irregular shapes (Fig. 8b). Since there were clear-sky conditions in this time interval, the ice crystals had to originate from the surface.
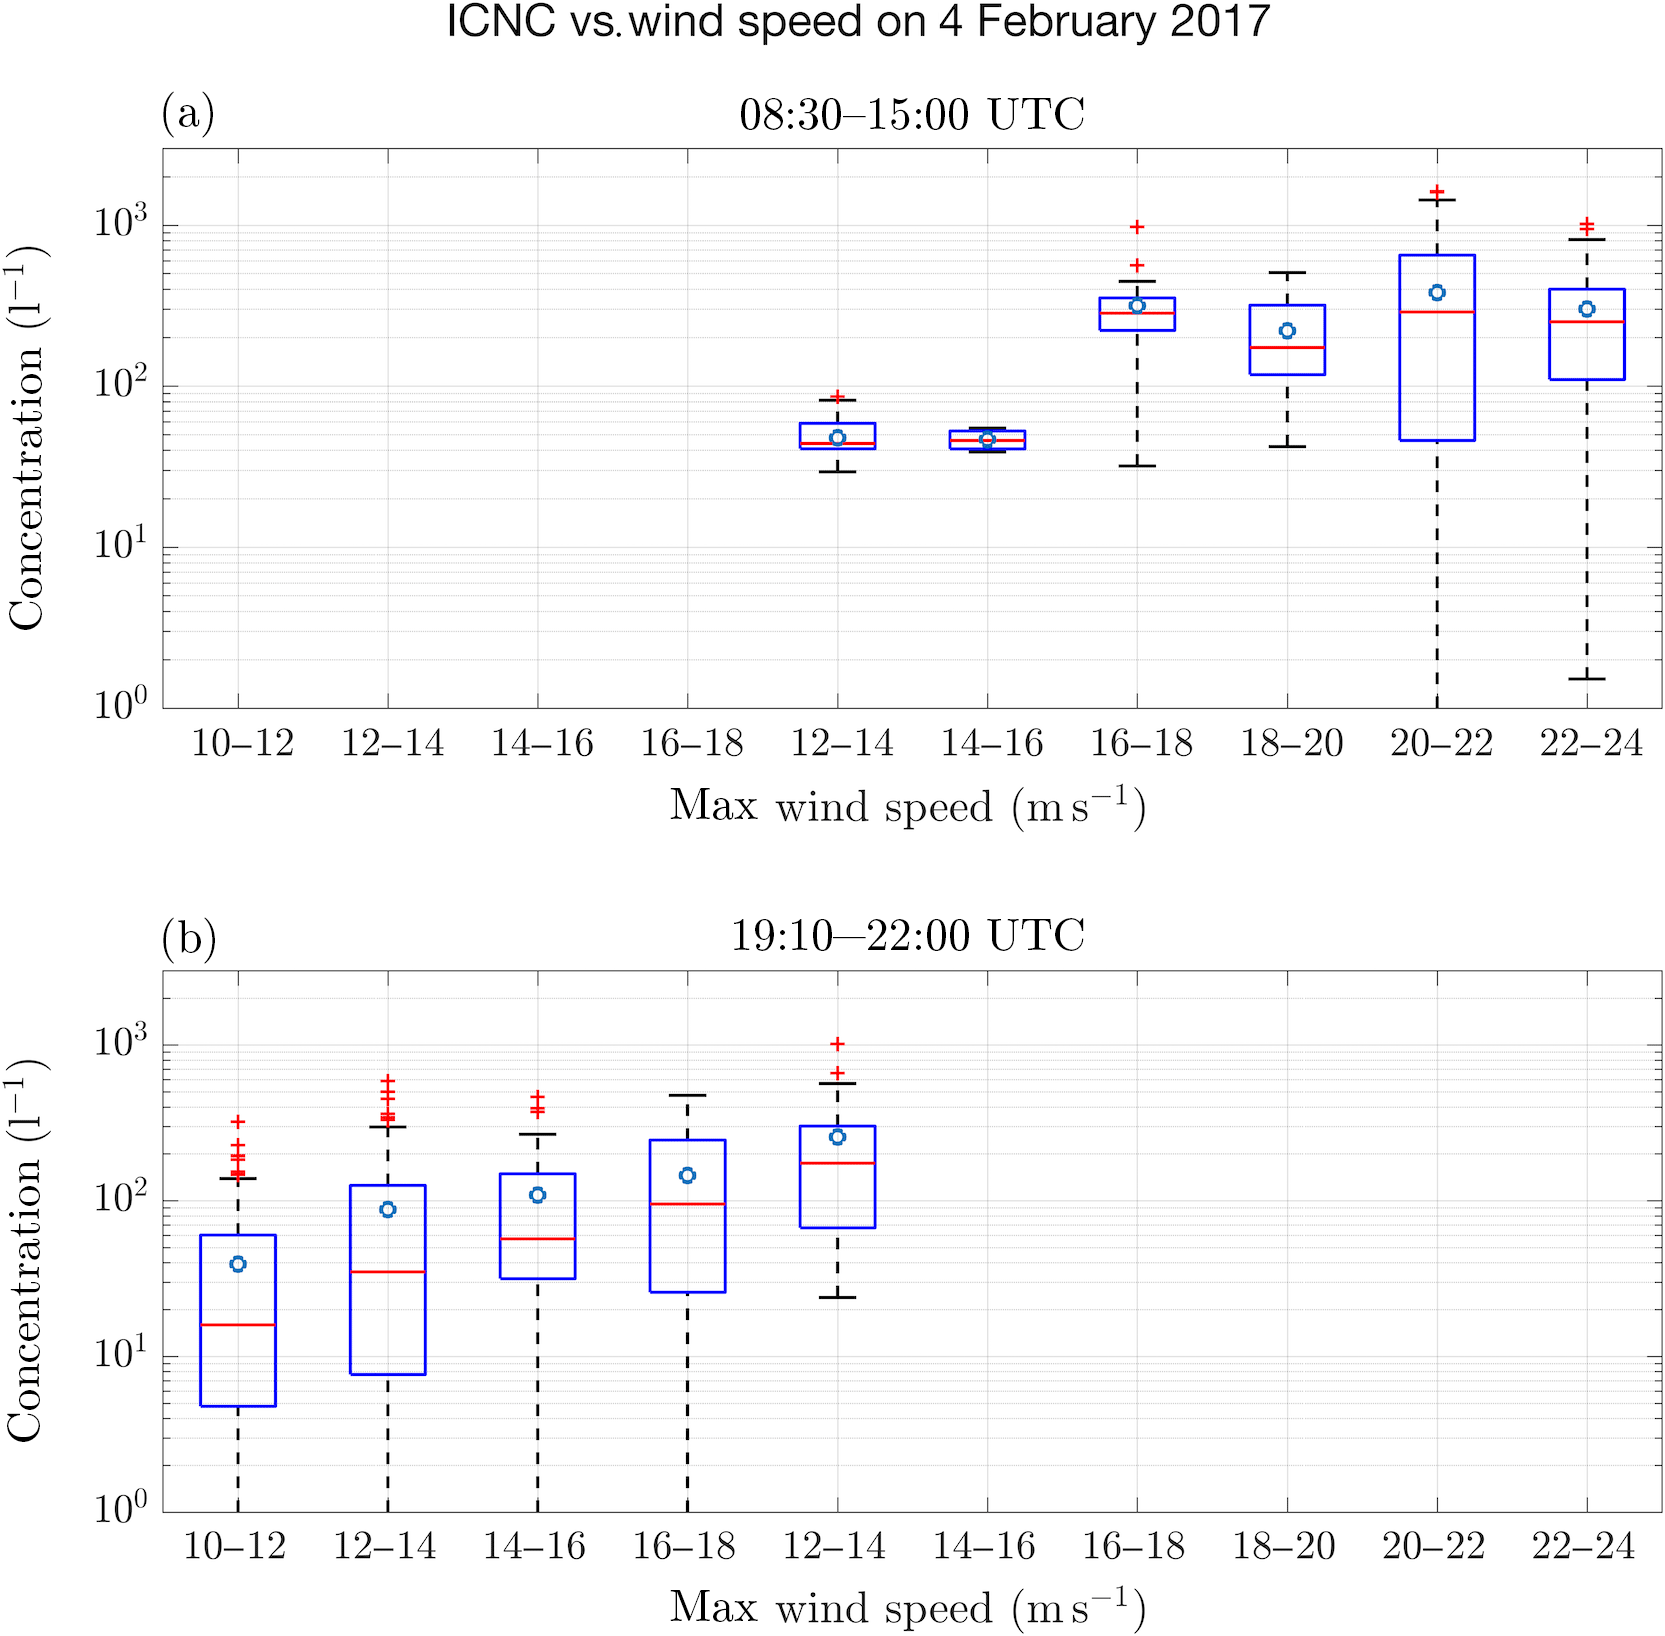
Figure 9As Fig. 6, but for ICNC as a function of the horizontal wind speed for the time periods between 08:30 and 15:00 UTC when the wind direction was from the west–southwest (a) and between 19:10 and 22:00 UTC when the wind direction was from the north (b). The ICNCs from HOLIMO are 1 min averages and the wind speeds from the SBO are the maxima in the respective 1 min intervals.
In the morning between 08:30 and 11:00 UTC when the SBO was in cloud, the observed mean ICNCs (Fig. 7, first row) decreases by a factor of 2 between the height of 2.5 m and the top of the elevator. The ICNCs in this time period are much lower than between 12:00 and 15:00 UTC, although wind speeds were as high as 20 m s−1. A possible reason is that the last snowfall was observed 3 days before the measurements. During this time, the loose ice crystals at the surface were blown away and the snowpack was solidified by temporal melting and refreezing. Consequently, fewer ice crystals are expected to be resuspended from the surface (e.g., Vionnet et al., 2013).
The highest ICNCs were observed in the time period between 12:00 and 15:00 UTC (Fig. 7, second row) when the SBO was in cloud. The ICNC reached its maximum at 2.5 m with a mean value of 800 L−1 and decreased by a factor of 2 within 7.5 m (Fig. 7b, second row). Between different profiles ICNCs changed by a factor of up to 2; however, consistently for all profiles a decrease in ICNCs with height was observed.
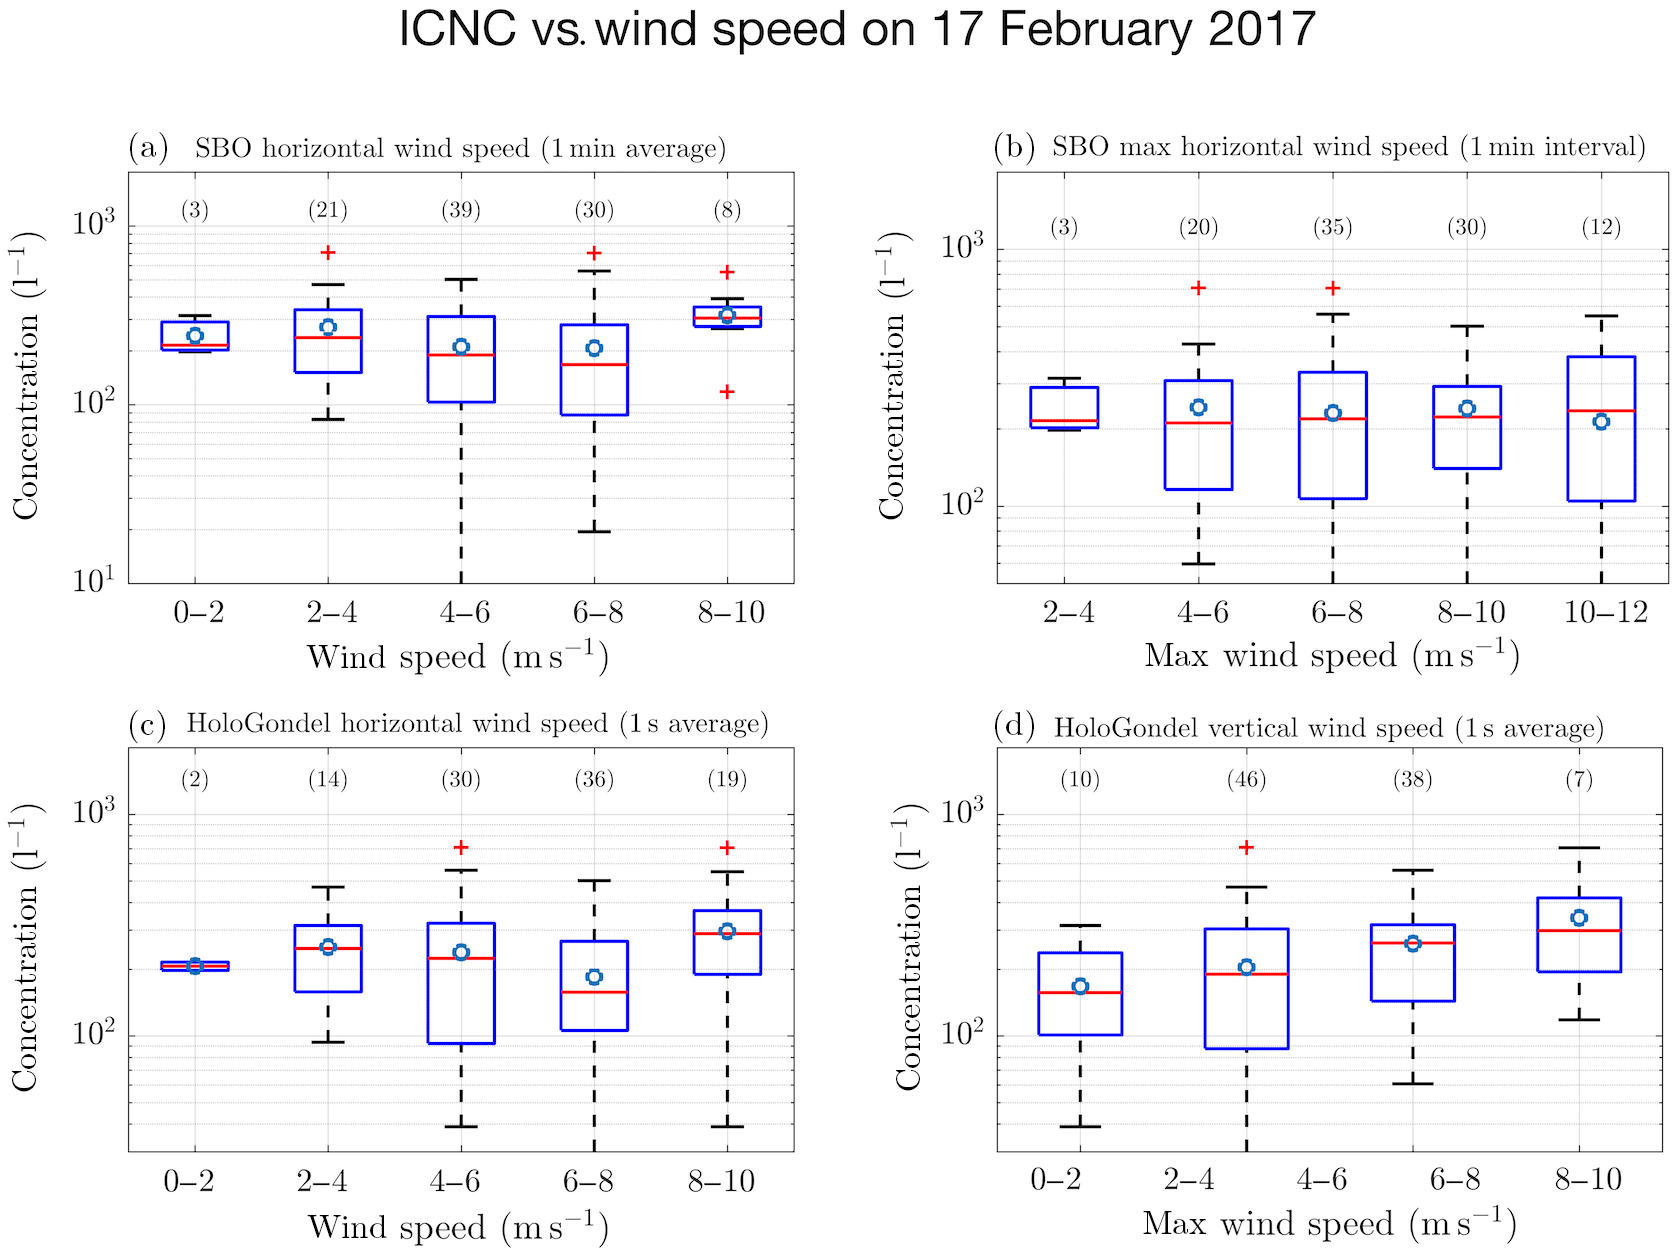
Figure 11As Fig. 9, but only for 17 February and four different wind speed measurements: (a) 1 min averages of the horizontal wind speed from the SBO, (b) maximum wind speed of the corresponding time interval in (a), (c) 1 s averages of the horizontal wind speed and (d) 1 s average of the vertical wind speed from both 3-D sonic anemometers.
Between 20:30 and 22:00 UTC (Fig. 7, last row), when the SBO was in cloud again, the maximum instantaneous ICNC is observed at a height of 4.1 m. In this time period the ICNC decreased by a factor of 9 between 4.1 m and the top of the tower. The observation of a maximum in ICNCs at an elevated level of 4.1 m is not in agreement with the expectations about the height dependence of blowing snow and will be further discussed in Sect. 4.1.1 and 4.1.2.
The correlation between wind speed and ICNCs for 1 min time intervals is shown in Fig. 9. Instead of the average wind speed, the maximum wind speed is used because gusts, i.e., the highest wind speed in a time interval, are most relevant for resuspending ice crystals from the surface. From 08:30 to 15:00 UTC, when the wind direction was west–southwest, no correlation is observed between ICNC and wind speed for wind speeds higher than 14 m s−1 (Fig. 9a). However, between 19:10 and 22:30 UTC, when the wind direction was north, a much more pronounced dependency of the ICNC on wind speed is observed for wind speeds lower than 14 m s−1 (Fig. 9b). This suggests that in strong winds (here greater than 14 m s−1) the ICNC near the surface due to surface processes is saturated and no longer increases with increasing wind speed. A further discussion of the wind dependence of surface processes follows in Sect. 4.2.
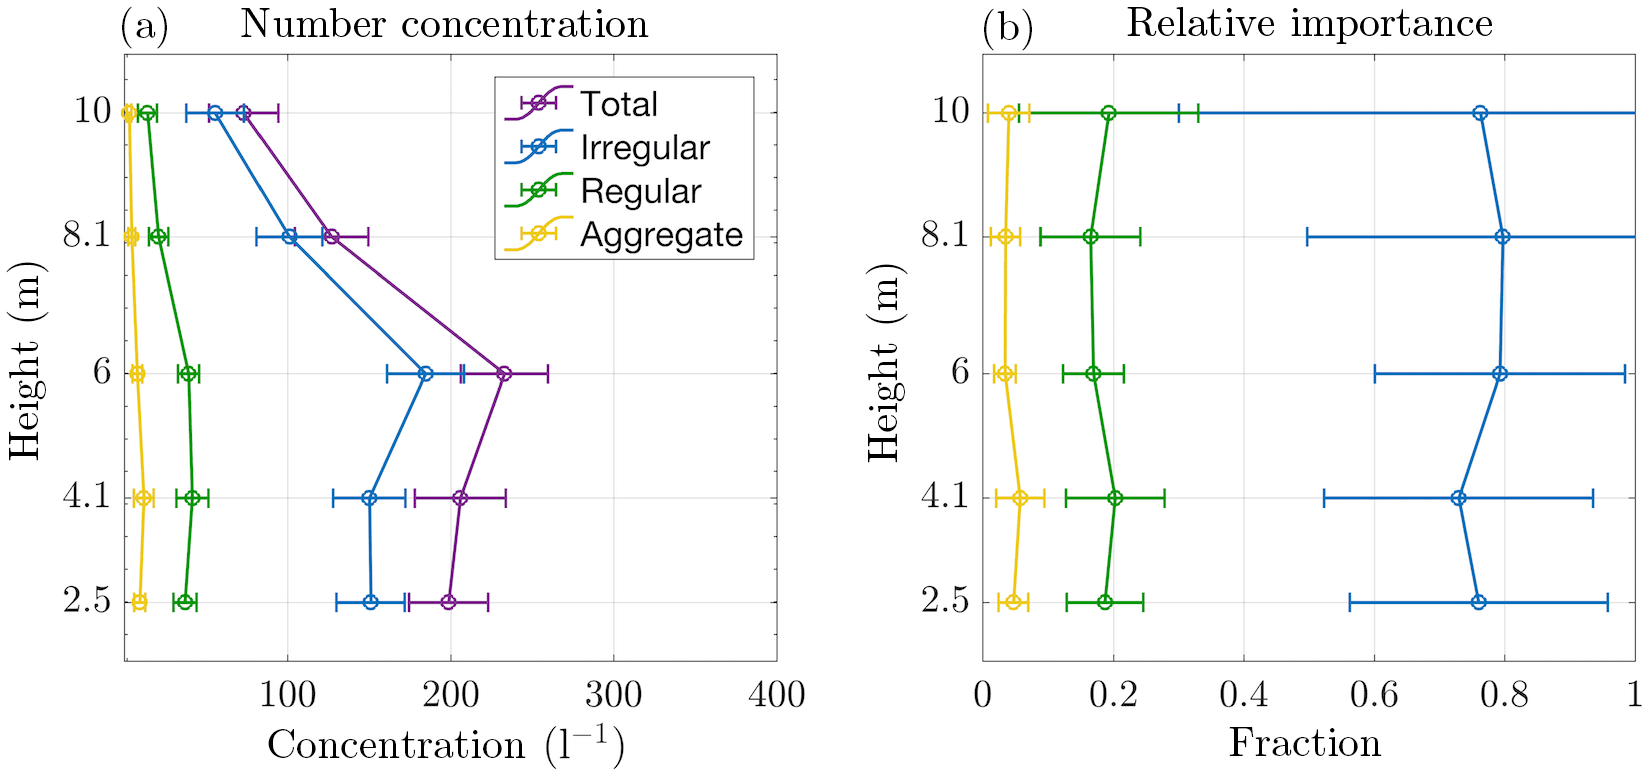
Figure 12Vertical profile of the concentration (a) and the fraction (b) of individual ice crystal habits for the profiles on 17 February 2017. For the fraction, the ICNCs of individual habits were divided by the total ICNC. The circles represent the mean and the error bars represent the standard error of the mean.
3.2 Case study on 17 February 2017
On 17 February a cold front over northern Europe was dropping southwards, producing northerly flow across the Alps and at the SBO (Fig. 5b). Wind speeds observed at the SBO in the time interval between 18:00 and 20:00 UTC were between 5 and 10 m s−1. During this period, the temperature decreased by 1 K from −12.5 to −13.5 ∘C. The SBO was in cloud starting at 13:00 UTC with varying visibility between several meters up to several hundreds of meters. Some snowfall was observed in the afternoon between 13:00 and 15:00 UTC.
For this day, wind data from the 3-D sonic anemometer were available, which allow for a more detailed analysis of the correlation between the observed ICNCs and wind speed. However, only four vertical profiles were obtained due to hardware problems with the computer. The first profile was measured in the morning at 12:00 UTC when the SBO was not in cloud and no ice crystals were observed. Three more profiles were taken in the evening starting at 18:00 UTC. For these profiles the ice crystals were manually classified into three categories: regular, irregular and aggregates.
For the three profiles, the ICNC reached its maximum instantaneous value of several hundreds per liter at the height level of 2.5 or 6 m (Fig. 10a). The minimum ICNC was consistently observed at the top of the elevator with values less than 150 L−1. As such, the ICNCs decreased by a factor of 2 to 4 in the observed height interval (Fig. 10). The habits of the ice crystals are primarily irregular, which is in agreement with ground-based observations at the Jungfraujoch (Schlenczek et al., 2017) and with observations in free-floating clouds (e.g., Korolev et al., 1999, 2006; Wolf et al., 2018). In addition, the observed fraction of regular to irregular ice crystals stays constant with height (Fig. 12b). This implies that either surface processes also produce a significant number of regular-shaped ice crystals or additional processes need to be active to explain these results. A further discussion of these results follows in Sect. 4.1.
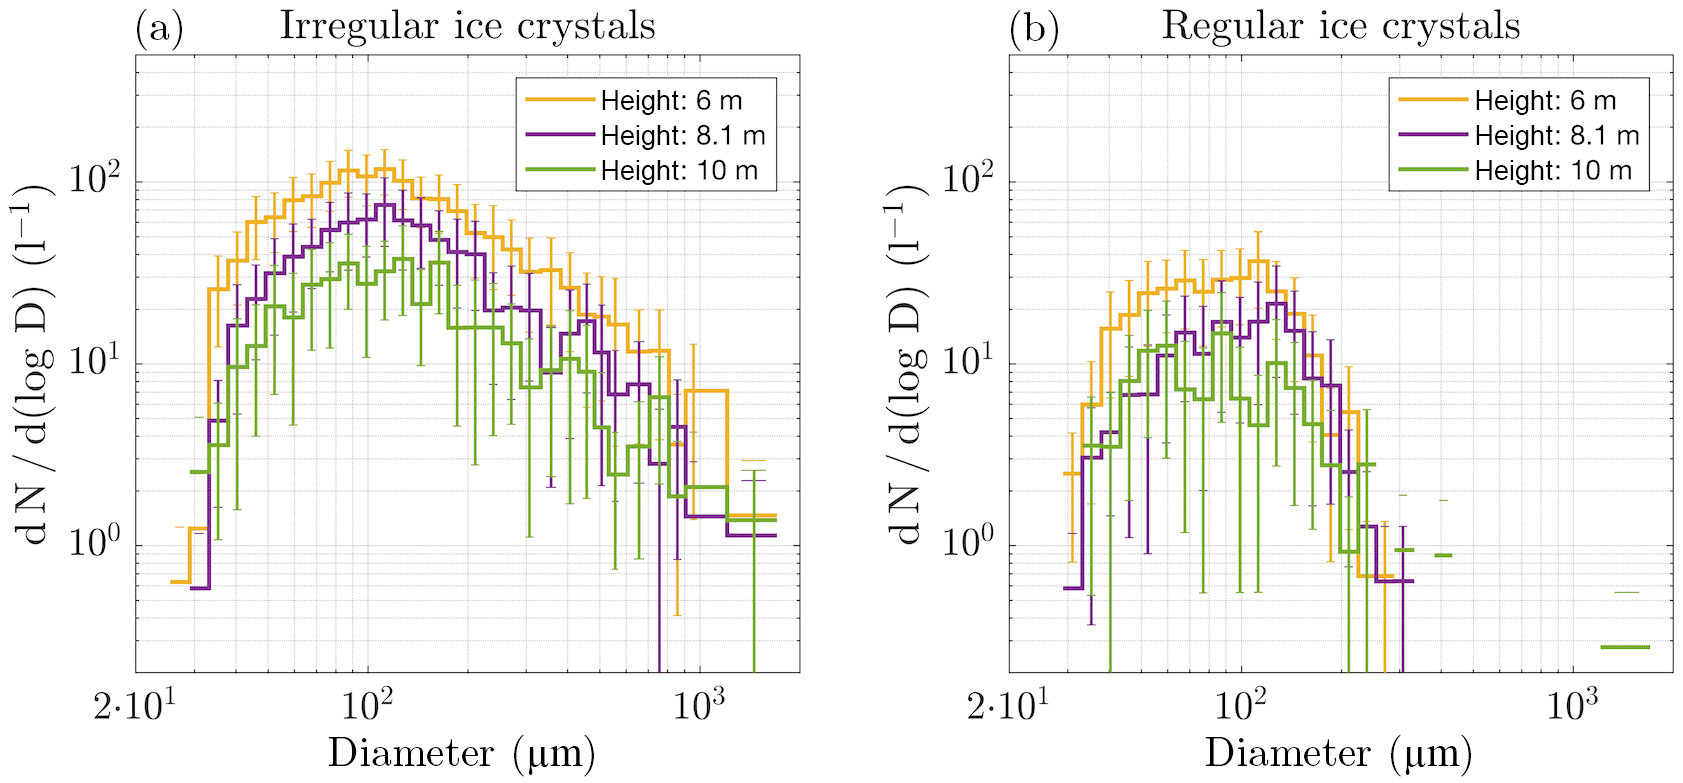
Figure 14Number size distribution of the irregular (a) and regular (b) ice crystals observed on 17 February 2017 as a function of height. The error bars represent the standard error of the mean. Aggregates are not shown because of their low concentrations.

Figure 15Comparison of the height dependence of the ice water content for the time intervals between 12:00 and 15:00 UTC (red box plots) and 19:10 and 20:20 UTC (blue box plots) using the blowing snow parameterization of Mellor and Fellers (1986). The wind speed in the time interval between 12:00 and 15:00 UTC was around 20 m s−1 and between 19:10 and 20:20 around 10 m s−1. The gray shaded area indicates the calculated ice water content from the parameterization for wind speeds between 10 (blue line) and 20 m s−1 (red line).
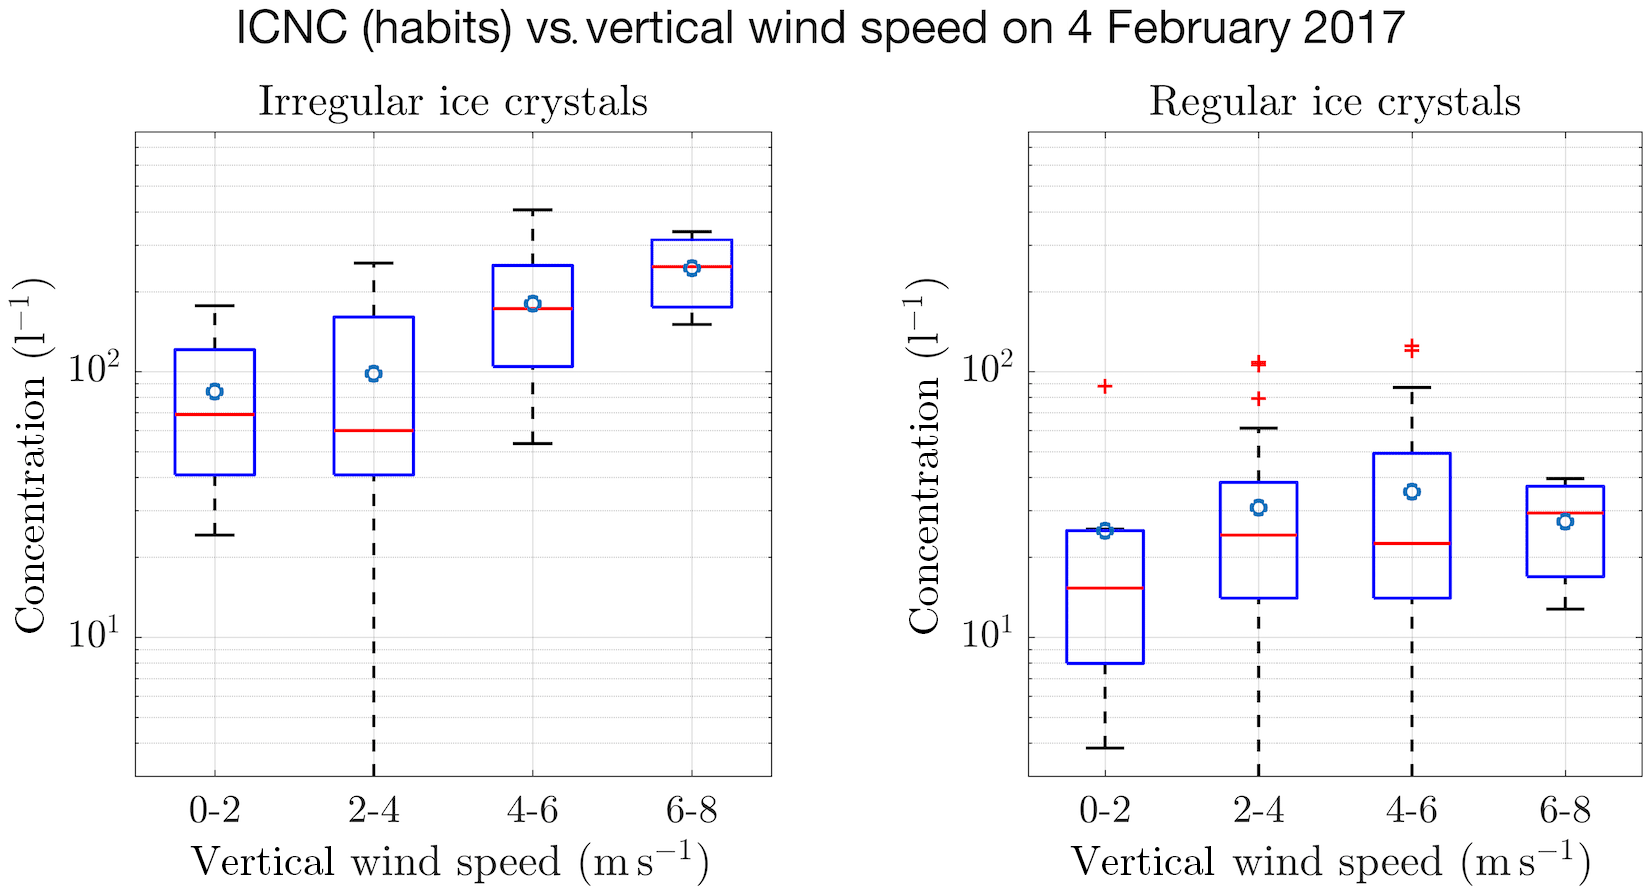
In contrast to the data from 4 February, no correlation between ICNCs and the horizontal wind speed is observed (Fig. 11). This holds true for the 1 min mean and maximum wind speeds observed by the SBO and the 1 s averages observed with the 3-D sonic anemometer. However, ICNCs increased with vertical wind speed. The wind speed dependence of irregular and regular ICNCs is comparable, and both increase by a factor of 2 when the vertical wind speed increases from 0–2 to 4–6 m s−1 (Fig. 13). Whereas the shape of the size distribution of the irregular ice crystals hardly varies with height, larger regular ice crystals are more strongly reduced with height than smaller regular ice crystals (Fig. 14).
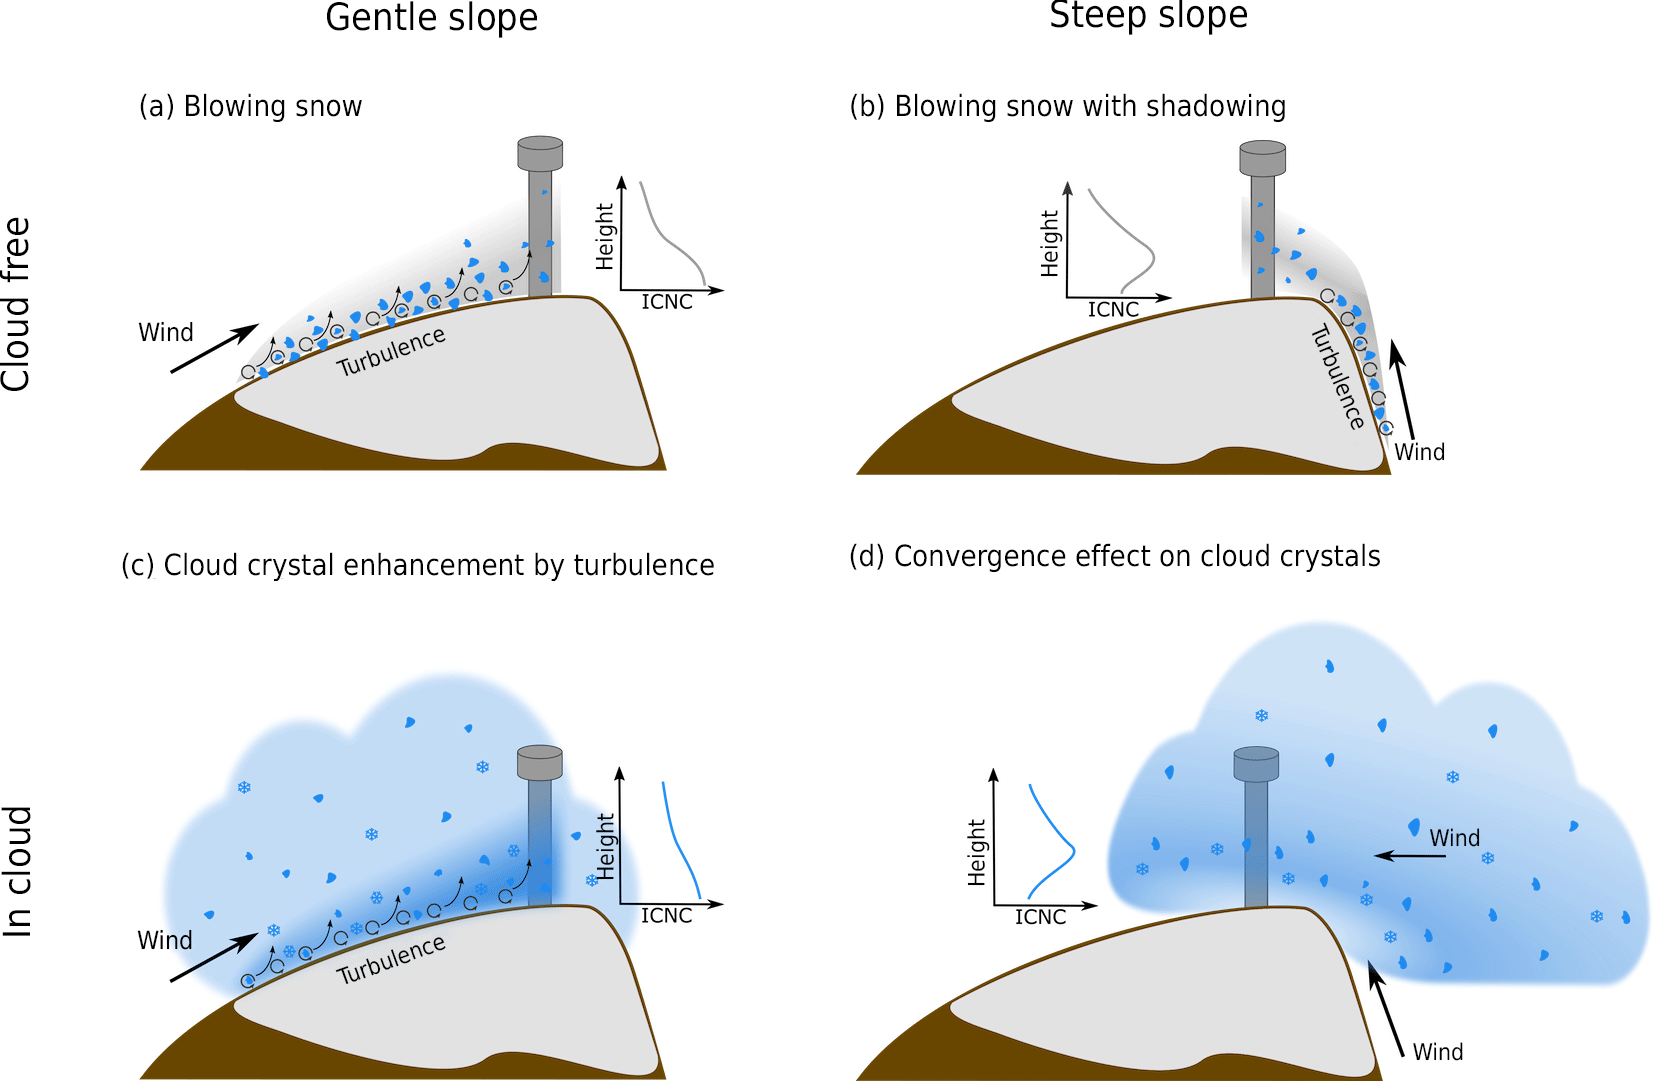
Figure 16Illustration of surface and near-surface processes that impact the measured ICNC at mountain-top research stations. Panels (a) and (b) illustrate the difference in the height dependence of blowing snow over a surface with a gentle and a convergence effect on the ICNC of regular and irregular ice crystals if a cloud is forced over a mountain.
4.1 Sources of enhanced ICNC observed at mountain-top research stations
To disentangle possible sources and mechanisms that enhance the observed ICNCs at mountain-top research stations, the following discussion will be based on the observed height profile of the ICNC and the observed ice crystal shape.
In the context of snow redistribution, blowing snow has been studied thoroughly. For blowing snow, two main layers are distinguished. In the saltation layer, with a typical thickness of 0.01–0.02 m, snow particles are lofted and follow ballistic trajectories. Depending on the crystal size, the crystals in the saltation layer either impact onto the snow surface or are transported by turbulent eddies into the suspension layer Comola et al. (e.g., 2017); Gordon et al. (e.g., 2009), which can extend up to a height of several tens of meters above the surface. Nishimura and Nemoto (2005) and Mellor and Fellers (1986) observed the height dependence of blowing snow up to 10 m over a flat surface in the Arctic and in Antarctica and found that particles reaching layers higher than 1 m above the surface are usually smaller than 100 µm, and the particle concentration gradually decreases with height (Fig. 16a). Similar to blowing snow we expect such a height dependence for any other surface process. As such, a gradual decrease in ICNCs with height is expected for any surface process and no height dependence is expected for ice crystals produced in free-floating clouds.
While ice crystals observed in free-floating clouds have mainly (> 80 %) irregular habits (e.g., Korolev et al., 1999, 2006; Wolf et al., 2018), no studies have investigated the ice crystal shape produced by surface processes like hoar frost, blowing snow or riming on trees, rocks or the snow surface. We expect irregular shapes for resuspended ice crystals, i.e., blowing snow, due to mechanical fracturing upon their impact on the surface or due to the successive melting and freezing of the ice crystals on the snow surface.
Ice crystals originating as hoar frost grow in regular shapes on the snow surface. Whether these vapor-grown ice crystals keep their regular shape depends on the exact physical process through which they are detached from the surface. While some ice crystals may keep their initial regular habit, for other ice crystals this regular habit may be destroyed when they are detached from the surface due to mechanical fracturing as described by Lloyd et al. (2015). Similar to blowing snow, the ICNC from hoar frost is likely to be increased near the surface because only smaller ice crystals are lofted higher up. In this layer ice crystals are likely to collide and fracture. On the one hand, this reduces the probability to observe regular ice crystals from surface processes. On the other hand, if small regular and irregular ice crystals (µm) are produced, they have the potential to grow into larger regular-shaped ice crystals being observed at the measurement location.
4.1.1 Impact of surface processes
During the clear-sky period on 4 February 2017 between 19:10 and 20:20 UTC the observed ice crystals have predominantly irregular habits (Fig. 8). Since no cloud was present at or above the SBO, the observed ice crystals have to originate from the surface. As such, this observation confirms our expectations that surface processes mainly produce irregular ice crystals.
The observed ICNCs on 4 February 2017 before 20:30 UTC gradually decrease with height as expected for surface processes, and this is consistent with observations of blowing snow in the Arctic and Antarctica. The west–southwest wind during this time period (Fig. 4c) transported the ice crystals from an area with a gentle slope towards the station. The gentle nature of the slope may explain why the height dependence of the ICNC close to the surface is similar to observations of blowing snow over a flat terrain (Fig. 16a). Mellor and Fellers (1986) reported the height dependence of ice water content for different wind speeds up to a height of 10 m. The observations between 12:00 and 15:00 UTC and between 19:10 and 20:20 UTC are compared to a parameterization by Mellor and Fellers (1986) for the ice water content as a function of wind speed and height for blowing snow observed in the Arctic (Fig. 15). Although there is roughly an order of magnitude difference between the IWC predicted by the parameterization and the observations, the decrease in IWC as a function of height is consistent. Thus, the height dependence of the ICNC at the SBO is likely due to blowing snow or a similar surface-based process.
The maximum in the ICNCs at an elevated level as observed on 4 February 2017 between 20:30 and 22:00 UTC and on 17 February 2017 cannot be explained by surface processes over a gentle slope. However, these observations correspond to periods when the wind direction was from the north (Fig. 4c). With the change in wind direction the location of the origin of the lofted ice crystals also changed. While the terrain to the west has a gentle slope, the terrain to the north is characterized by a steep wall (Fig. 1). If the wind direction is north, a wind rotor may develop to the lee of the ridge, where the elevator was located in north wind cases, and shadow the lower levels of the vertical profiles. This possibly explains the elevated maximum of ICNCs (Fig. 16b), as observed during north wind events (4 February between 20:30 and 22:00 UTC; see Fig. 7).
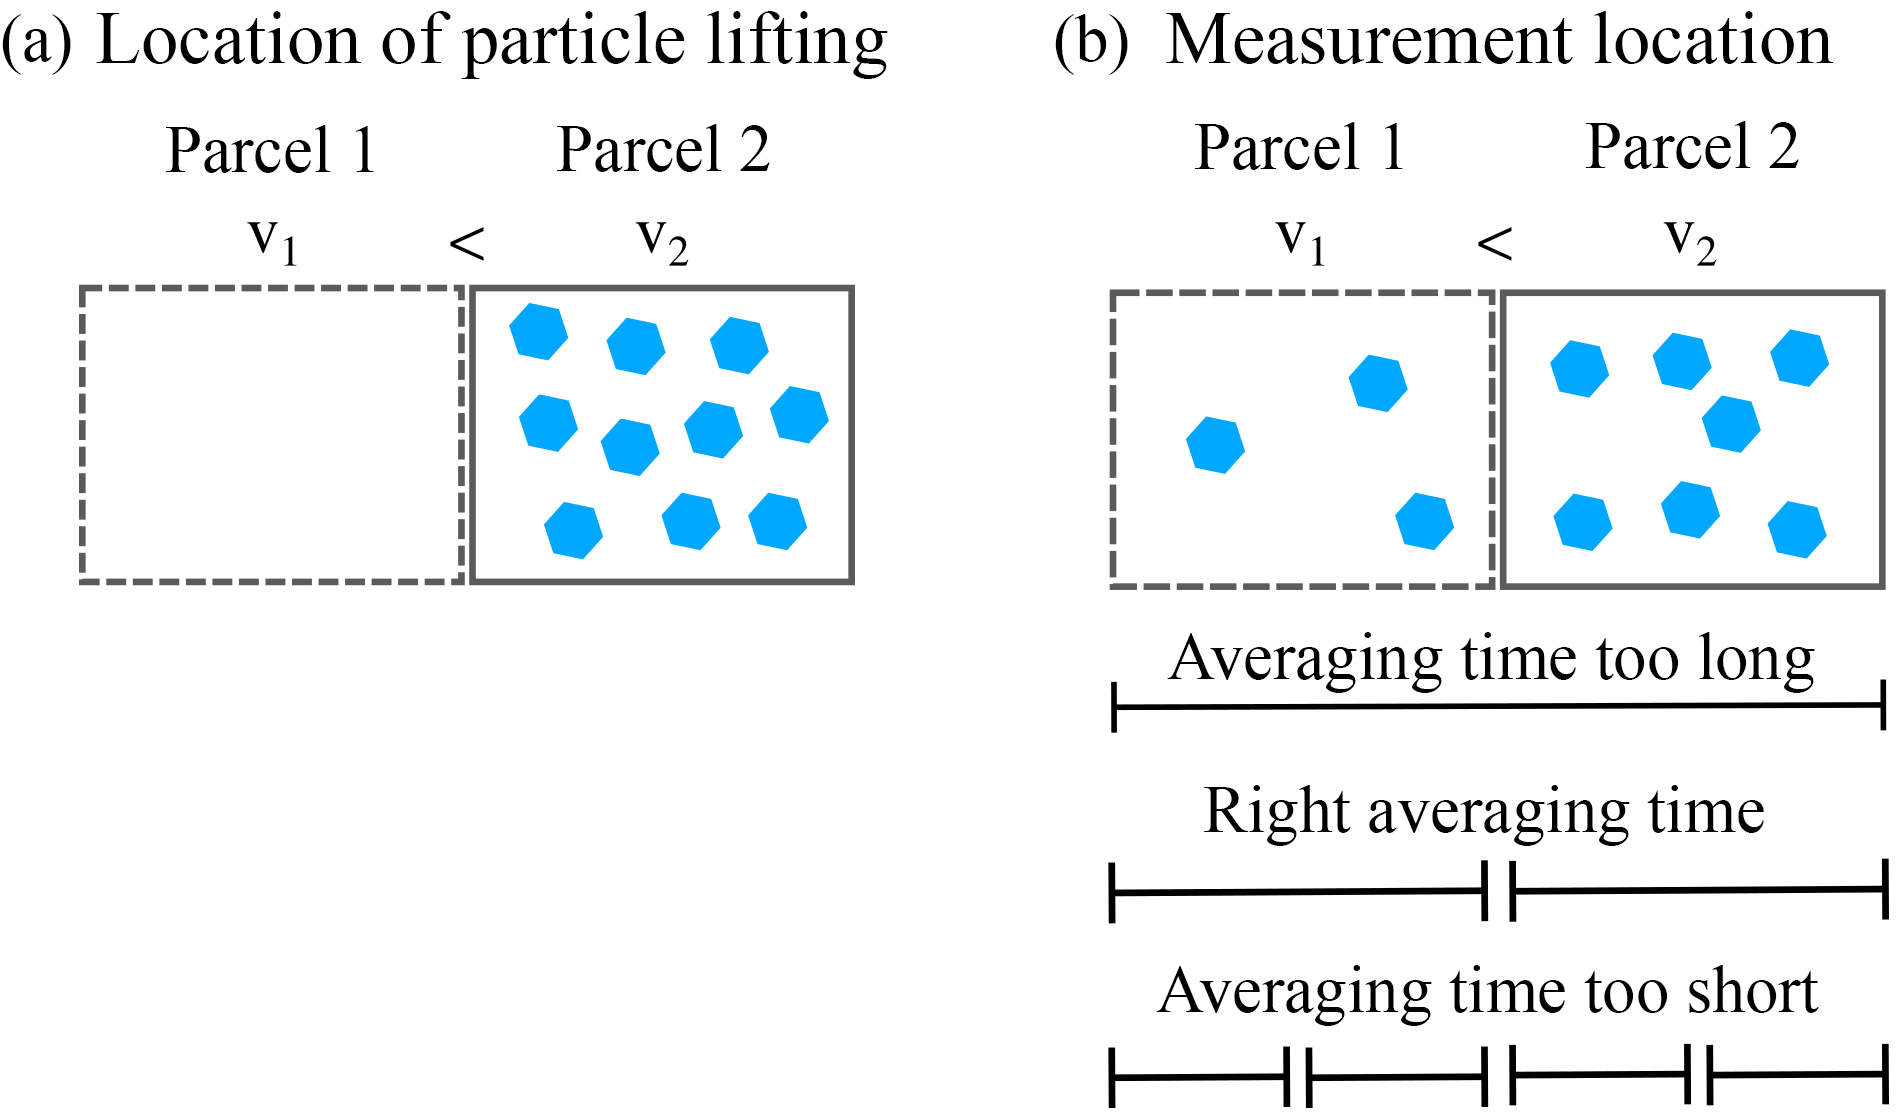
Figure 17Illustration of the challenges of observing the wind dependence of blowing snow (Sect. 4.2). The two squares represent two air parcels with a duration Δt of 10–15 s, which is typical for a gust. Parcel 2 represents a gust with a higher wind speed v2 than the average wind speed v1 in parcel 1. At the location of particle lofting (a) ice crystals are lofted due to the high turbulence in air parcel 2. On the way to the measurement location (b) some of the ice crystals were transported to the other air parcel, e.g., by sedimentation or turbulence. Also, the effect of different averaging times is illustrated (b).
Regardless, the majority of crystals produced by surface processes are expected to have irregular habits. As such, it is expected that the ratio of irregular to regular ice crystals decreases with height if the irregular crystals are solely produced through surface processes. This is in contrast to our observations on 17 February 2017, when the fraction of irregular to regular crystals remained constant with height (Fig. 12b). Although the contribution of regular ice crystals from surface processes like hoar frost and riming cannot be completely excluded, we give an additional and/or alternative explanation for these observations in the following section.
4.1.2 Impact of near-surface processes
Two near-surface processes are proposed to potentially modify ICNCs in the presence of a cloud in contact with a mountain. When a cloud is forced over a mountain and the cloud base is below the mountain top, a convergence zone of enriched ICNCs could develop if cloud particles below the mountain top are entrained into the flow over the mountain (Fig. 16d). If irregular and regular ice crystals are well mixed within the cloud below the mountain top, they will maintain their respective fractions in such a convergence zone. The fraction of irregular ice crystals on 17 February 2017 is also in good agreement with observations in free-floating clouds in the Arctic (Korolev et al., 2003, 2006; Wolf et al., 2018). Thus, this near-surface process could explain the height independent of irregular and regular ice crystals that was observed on 17 February 2017.
Additionally, sedimenting ice crystals originating in cloud may remain lofted near the surface in a turbulent layer (Fig. 16c), similar to the lofting of ice crystals in the suspension layer of blowing snow. However, in this case the sedimenting particles may maintain their habits because they do not reach the surface. Therefore, such an effect can enrich both irregular and regular ice crystals near the surface, resulting in the same gradual decrease in the ICNC, while keeping the ratio of regular to irregular crystals constant.
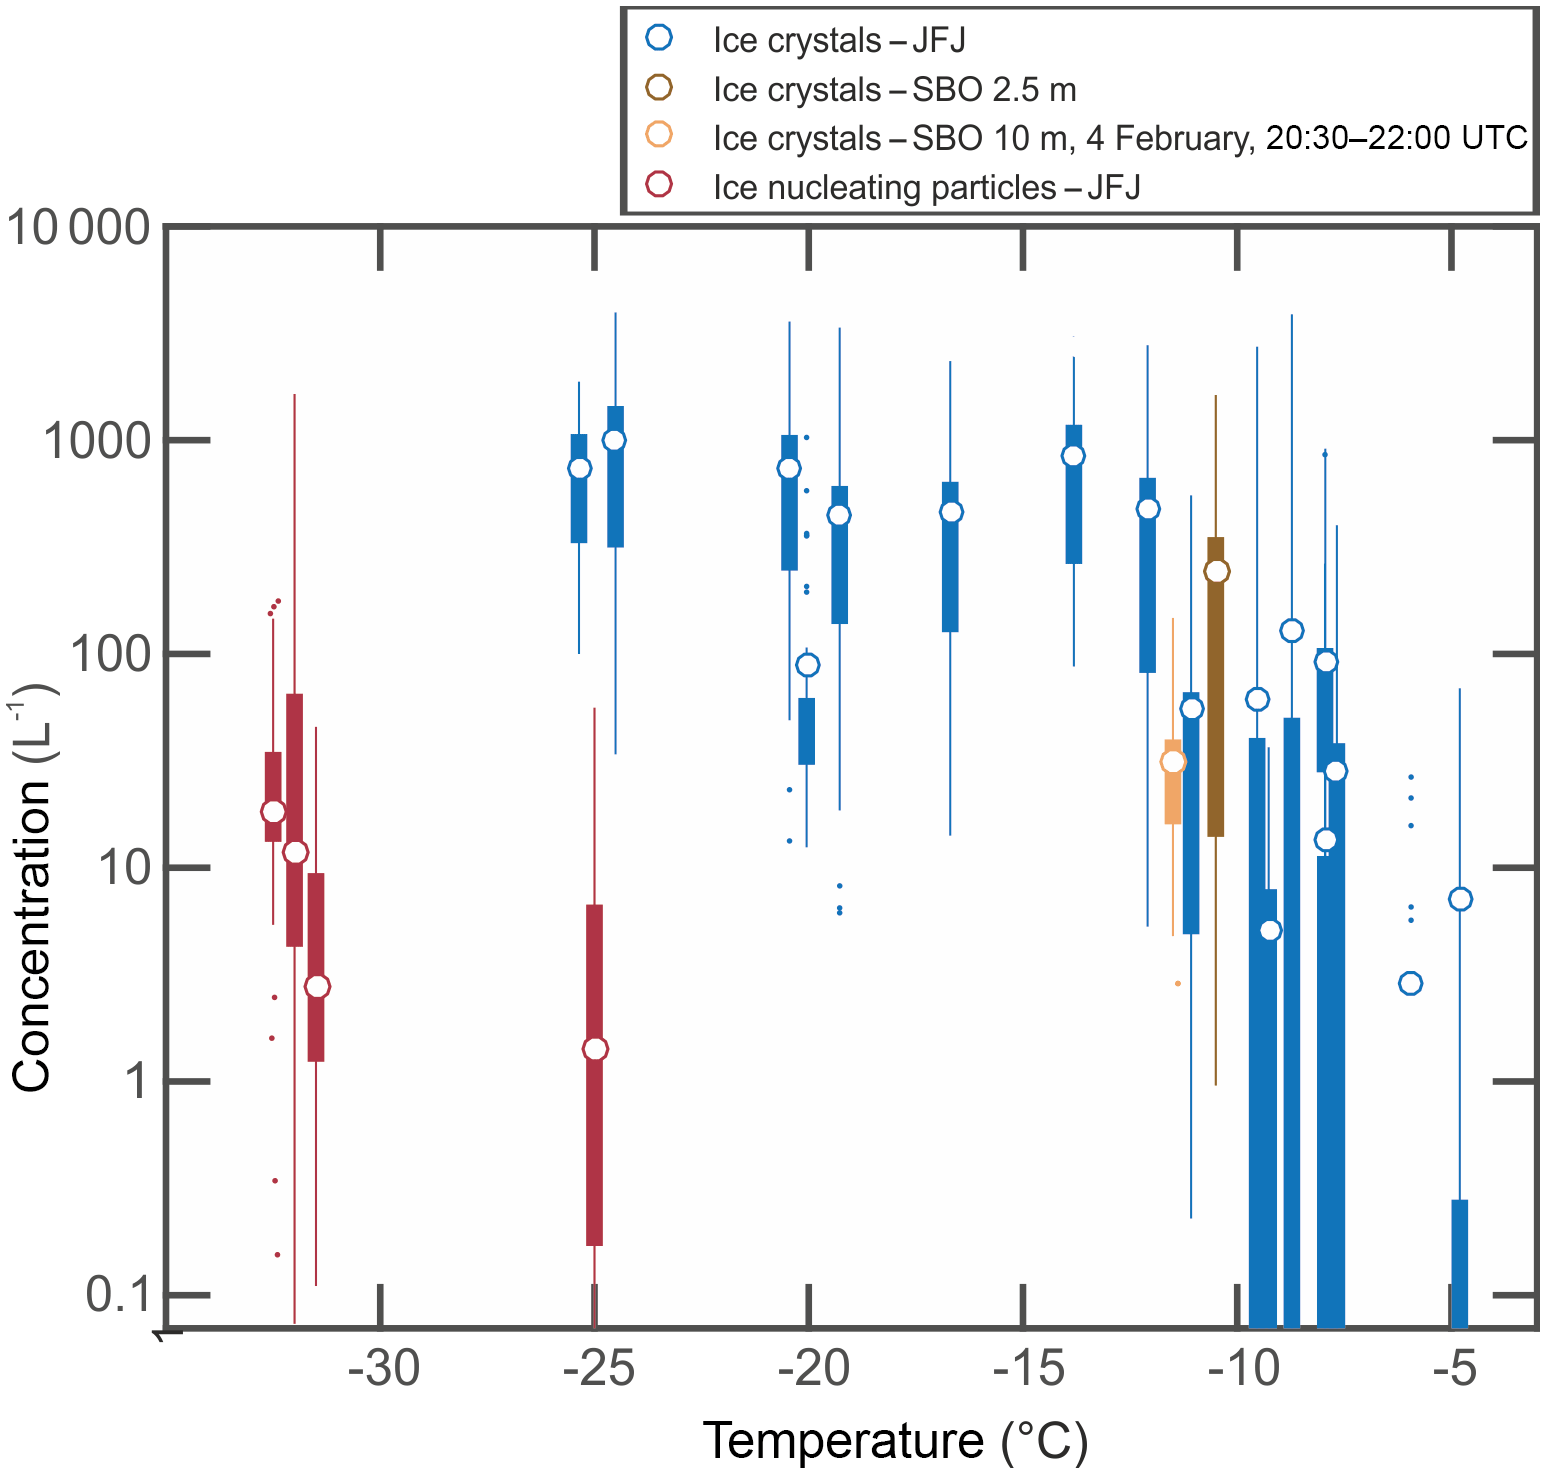
Figure 18Ice crystal number concentrations (ICNCs; orange and brown) measured on the elevator at the SBO are compared to the ICNCs (blue) and ice nucleating particle (INP) concentrations (red) measured at the High Altitude Research Station, Jungfraujoch (JFJ). The ICNCs at the JFJ were measured with HOLIMO II during the winter 2012 and 2013 (Lohmann et al., 2016). Each box represents a cloud case. The INP concentrations were measured with the Horizontal Ice Nucleation Chamber (Lacher et al., 2017, and additional measurements) at a relative humidity with respect to water (RHw) of 103–104 %. The three boxes on the left were taken during (from the left) Sahara dust events, summer seasons and winter seasons at a temperature of −31 ∘C, but shifted slightly to visualize them. The measurements at −25 ∘C were taken during a summer season. The left and right edges of each box represent the 25th and 75th percentiles, the circle is the mean value and the small dots are outliers.
The mechanisms illustrated in Fig. 16 cannot only be considered separately, but can also occur in combination with each other. For example, the observed decrease in the ICNC with height during the first two time periods on 4 February 2017 (Fig. 7) could be blowing snow over a moderate slope in the presence of a cloud at the SBO (Fig. 16a) and/or an enrichment by cloud ice crystals captured in a turbulent layer near the surface (Fig. 16c). It is also important to note that the proposed near-surface processes (Fig. 16c and d) could impact the observed ICNC at mountain-top research stations even without a snow-covered surface.
4.2 Wind dependence of the observed ICNCs
Turbulent eddies near the surface are responsible for the lofting of snow particles into the suspension layer (see Sect. 4.1.1). Observations in the Arctic or Antarctica usually use wind measurements close to the surface (< 3 m) to estimate these turbulent eddies using friction velocity. In this study, only wind measurements on top of the meteorological tower at a height of 15 m are available. For 4 February 2017 only the horizontal wind speed averaged over 1 min is available from the 2-D sonic anemometer operated by the SBO. On 17 February 2017, 1 s averages are also available for horizontal and vertical wind speed from our own 3-D sonic anemometer.
Similar to Lloyd et al. (2015), who observed a dependence of the observed ICNCs on horizontal wind speed only for a small fraction of cloud events (27 % in 2013 and 13 % in 2014), we observed a dependence of ICNCs on horizontal wind speed on 4 February only when horizontal wind speeds were less than 14 m s−1. At higher wind speeds and on 17 February such a dependence was not observed. While Lloyd et al. (2015) proposed blowing snow to explain observations when a correlation was observed between ICNCs and horizontal wind speed, they proposed hoar frost to explain observations when no such correlation was present. However, in our opinion the orography in the proximity of the measurement site and the positioning of the different measurement instruments (i.e., cloud probes and sonic anemometers) have an impact on the observable correlation between ICNC and wind speed. As such, it is much more difficult to distinguish between blowing snow and hoar frost as the processes responsible for enhanced ICNCs.
For example, the lack of dependence of ICNC on horizontal wind speed on 17 February may be explained by a process that lofts ice crystals from a steep mountain slope to form a mountain-induced ice crystal convergence zone near the surface on the leeward side of the mountain ridge (Fig. 13). In such a case, horizontal wind speed may not be a good predictor for the presence of turbulent eddies near the surface capable of lofting ice crystals from the surface, but vertical wind speed may be a better indicator as was observed on 17 February. Additionally, a dependence on horizontal wind speed may be lost due to the exact setup of the measurement instruments at the measurement site (Fig. 17). In the following we discuss factors that possibly mask the wind dependence of the observed ICNCs.
Firstly, ice crystals are resuspended from the surface by local turbulence and captured in the same air parcel (Fig. 17b). For a certain time after their resuspension, the ice crystals are transported in the same air parcel as the local turbulence. However, with time they can leave this air parcel, for example by sedimentation or through additional turbulence. If the measurements are performed too far away from the place where the ice crystals were resuspended, either the turbulence responsible for the resuspension may have already dissipated or ice crystals may have already been transported to other air parcels (Fig. 17b). Both effects mask the correlation between the ICNC of resuspended ice crystals and the responsible turbulence.
Secondly, at mountain-top research stations local turbulence is also created by nearby structures. Since it is difficult to observe all of the turbulence responsible for lofting ice crystals from the surface, wind measurements at a height of 15 m above the surface are expected to be a good estimation of the strength of such turbulence.
Thirdly, the averaging time is crucial to observe the correlation between ICNCs and wind speed (Fig. 17b). If the averaging time is too large, any correlation is averaged out. Meanwhile, if the averaging time is too short, any enriched ICNCs can also be measured at lower wind speeds due to a lag between the turbulence responsible for lofting the crystals and the entrainment time required for the crystals to be established in the flow. In this study we average over 10–15 s, which is the expected timescale of gusts responsible for the resuspension of ice crystals.
Finally, the ICNC of resuspended particles not only depends on wind speed, but also on the age of the snow cover and atmospheric conditions, and a possible correlation may be suppressed in a data set with different snowpack and atmospheric conditions. Between 19:00 and 20:30 UTC on 4 February 2017 when no cloud was present at the SBO, a decrease in the ICNC was observed with time at a height of 2.5 m although the wind speed remained constant at approximately 10 m s−1. A possible reason for the decrease in the ICNC in this time period is that the very loose ice crystals on top of the snow cover were gradually blown away, changing the snowpack properties over time.
4.3 Origin of crystals measured at mountain-top stations
The origin of ice crystals observed at mountain-top research stations is an open question because the ICNC exceeds the measured ice nucleating particle (INP) concentration by several orders of magnitudes (Fig. 18). Thus, additional processes, i.e., ice-multiplication (Field et al., 2017) as well as surface and near-surface processes, have to contribute significantly to the ICNC.
The contribution of ice crystals from the surface is on the order of several hundreds of ice crystals per liter, which is estimated from the measurements after 19:10 UTC on 4 February 2017. Without cloud (19:10–20:20 UTC), several hundred ice crystals of blowing snow were observed (see Sect. 4.1.1 and Fig. 16a). With a cloud present (20:30–22:00 UTC), several hundred ice crystals were also observed near the surface and only several tens to 100 L−1 above 8.1 m. Assuming that the upper ICNCs are representative for the cloud, the contribution from the surface is similar.
An estimation of the impact of the proposed near-surface processes (Fig. 16) is difficult. The profiles observed on 17 February that are possibly affected by such a near-surface process still have a decreasing tendency in the upper levels. Therefore, no information about the ICNC in cloud is available (Fig. 10). However, the contribution of near-surface processes is at least on the order of 100–250 L−1. The ICNCs near the surface at the SBO (2.5 m) are comparable with similar measurements at the Jungfraujoch (JFJ) at a height of 2 m above the ground (Fig. 18) (Lloyd et al., 2015; Lohmann et al., 2016), which indicates a similar origin of the observed ice crystals at both stations.
The contribution of surface and near-surface processes of several hundreds per liter can explain most of the gap between the measured INP concentration and the observed ICNC (Fig. 18). However, even at a height of 10 m the observed ICNCs of several tens to 100 L−1 exceed the expected INP concentration (Fig. 18). This discrepancy is either because even at a height of 10 m the cloud is influenced from the surface or ice-multiplication processes contribute significantly.
4.4 Impact of the surface on ICNCs in clouds
To assess the impact of surface and near-surface processes on the properties and the development of a cloud, understanding the height dependence of the resuspended ice crystals is crucial. If ice crystals are lofted only several meters off the surface, clouds are expected to be influenced only locally (Farrington et al., 2015). As most vertical profiles do not show constant ICNCs at the top of the tower, it is likely that resuspended ice crystals reach heights greater than 10 m where they can influence clouds. For example, between 12:00 and 15:00 UTC (Fig. 7, second row) when wind speeds are greater than 20 m s−1, ICNCs gradually decreased with height and were larger than 300 L−1 at the top of the tower. In this case it is likely that ice crystals from the surface were lofted higher into the cloud than 10 m. As such, due to the limited vertical extent of the profiles, it is unclear whether and to what extent clouds are influenced by ice crystals produced by surface processes. Already a low concentration of ice crystals from the surface can have a significant impact on cloud properties, e.g., extent and lifetime. Therefore, a final statement on the impact on clouds is not possible.
This study assessed the impact of surface and near-surface processes on ICNCs measured at mountain-top stations and possible implications on the atmospheric relevance of such measurements. To achieve this, an elevator was attached to the meteorological tower of the SBO and vertical profiles of the ICNC were observed with the holographic imager HOLIMO on two days in February 2017. The main findings are the following.
-
ICNCs decrease with height. ICNCs near the ground are at least a factor of 2 larger than at a height of 10 m if ICNCs near the ground are larger than 100 L−1. The increase in ICNCs near the ground can be up to an order of magnitude during cloud events and even 2 orders of magnitudes during cloud-free periods. Therefore, in situ measurements of ICNCs at mountain-top research stations overestimate ICNCs.
-
Some observations show a similar decrease in the ICNC of irregular and regular ice crystals with height. This suggests that either surface processes like hoar frost or enhanced rime splintering produce a significant number of regular ice crystals or that alternative and/or additional processes need to be active. In the presence of a cloud, two near-surface processes are proposed as an alternative to enrich the ICNC of irregular and regular ice crystals near the surface. Either sedimenting ice crystals are captured in turbulence near the surface or ice crystals are enriched in a convergence zone when a cloud is forced over a mountain. In both cases, the observed ICNC at mountain-top research stations is not representative of the cloud further away from the surface, even without the presence of a snow-covered surface.
-
On 4 February 2017 the observed ICNC shows a dependence on horizontal wind speed for wind speeds up to 14 ms−1. On 17 February a dependence of the ICNC on horizontal wind speed was not observed, but instead on vertical wind speeds. Possibly, horizontal or vertical wind speeds measured 15 m above the surface are not a good estimate for the turbulent eddies responsible for the resuspension of blowing snow particles.
-
The contribution of surface and near-surface processes to the observed ICNC at mountain-top research stations is estimated to account for several hundred ice crystals per liter. ICNCs in clouds without any contribution from surface and near-surface processes are estimated to be several tens per liter based on the observations between 20:30 and 22:00 UTC on 4 February 2017. This is still orders of magnitude higher than the measured INP concentration (Fig. 18). As such, additional processes must be active, e.g., ice-multiplication processes, and contribute significantly to the ICNC in orographic clouds.
-
The strong influence of surface and near-surface processes on the ICNC measured at mountain-top stations limits the atmospheric relevance of such mountain-top cloud measurements. However, the data set obtained is too small to make a clear statement regarding under which conditions in situ measurements at mountain-top research stations may represent the real properties of a cloud in contact with the surface.
To better understand the processes that are responsible for enhanced ICNCs close to the surface and to further investigate the processes proposed in this study, we suggest a more thorough field campaign with additional 3-D sonic anemometers. Ideally, one 3-D sonic anemometer should be placed upwind of the ICNC measurement to observe the turbulent eddies that are responsible for the resuspension of ice crystals, one 3-D sonic anemometer should be placed on the elevator and one on the top of the tower. This may help to better understand the dependence of ICNC on wind and to find the origin of the observed ice crystals. At best, three cloud-imaging probes would be part of such a campaign and would be installed in parallel to the 3-D sonic anemometers. In addition, to get a better estimate of the impact of resuspended particles on cloud properties, especially for high wind speeds, the vertical profiles have to be extended to larger heights above the surface. Such a field campaign could be conducted using a tethered balloon system equipped with cloud-imaging probes, which can be lofted several hundred meters into the atmosphere.
The data and software are available from the authors upon request.
The authors declare that they have no conflict of interest.
The authors would like to thank Hannes Wydler, Olga Henneberg, Fabiola
Ramelli and Monika Burkert for their assistance during the field campaign and
Eric Sulmoni for his help with classifying ice particles. We also thank the
head of the Sonnblick Observatory, Elke Ludewig, for access to the
measurement site and the entire staff (Hermann Scheer, Norbert Daxbacher, Lug
Rasser, Hias Daxbacher) for their hospitality and their excellent support and
assistance during the field campaign. The meteorological measurements at the
Sonnblick Observatory were provided by the Zentralanstalt für Meteorologie
und Geodynamik (ZAMG). This project was supported by ETH Zurich under grant
ETH-30 13-2.
Edited by: Ottmar Möhler
Reviewed by: two anonymous referees
Baumgardner, D., Brenguier, J., Bucholtz, A., Coe, H., DeMott, P., Garrett, T., Gayet, J., Hermann, M., Heymsfield, A., Korolev, A., Krämer, M., Petzold, A., Strapp, W., Pilewskie, P., Taylor, J., Twohy, C., Wendisch, M., Bachalo, W., and Chuang, P.: Airborne instruments to measure atmospheric aerosol particles, clouds and radiation: A cooks tour of mature and emerging technology, Atmos. Res., 102, 10–29, https://doi.org/10.1016/j.atmosres.2011.06.021, 2011. a
Beck, A., Henneberger, J., Schöpfer, S., Fugal, J., and Lohmann, U.: HoloGondel: in situ cloud observations on a cable car in the Swiss Alps using a holographic imager, Atmos. Meas. Tech., 10, 459–476, https://doi.org/10.5194/amt-10-459-2017, 2017. a, b
Bergeron, T.: On the physics of clouds and precipitation, in: Proces Verbaux de l'Association de Météorologie, Int. Union of Geodesy and Geophys., 156–178, 1935. a
Boose, Y., Welti, A., Atkinson, J., Ramelli, F., Danielczok, A., Bingemer, H. G., Plötze, M., Sierau, B., Kanji, Z. A., and Lohmann, U.: Heterogeneous ice nucleation on dust particles sourced from nine deserts worldwide – Part 1: Immersion freezing, Atmos. Chem. Phys., 16, 15075–15095, https://doi.org/10.5194/acp-16-15075-2016, 2016. a
Bromwich, D. H.: Snowfall in high southern latitudes, Rev. Geophys., 26, 149–168, https://doi.org/10.1029/RG026i001p00149, 1988. a
Choularton, T. W., Griggs, D. J., Humood, B. Y., and Latham, J.: Laboratory studies of riming, and its relation to ice splinter production, Q. J. Roy. Meteor. Soc., 106, 367–374, https://doi.org/10.1002/qj.49710644809, 1980. a
Comola, F., Kok, J. F., Gaume, J., Paterna, E., and Lehning, M.: Fragmentation of wind-blown snow crystals, Geophys. Res. Lett., 44, 4195–4203, https://doi.org/10.1002/2017GL073039, 2017GL073039, 2017. a
Crawford, I., Bower, K. N., Choularton, T. W., Dearden, C., Crosier, J., Westbrook, C., Capes, G., Coe, H., Connolly, P. J., Dorsey, J. R., Gallagher, M. W., Williams, P., Trembath, J., Cui, Z., and Blyth, A.: Ice formation and development in aged, wintertime cumulus over the UK: observations and modelling, Atmos. Chem. Phys., 12, 4963–4985, https://doi.org/10.5194/acp-12-4963-2012, 2012. a
Crosier, J., Bower, K. N., Choularton, T. W., Westbrook, C. D., Connolly, P. J., Cui, Z. Q., Crawford, I. P., Capes, G. L., Coe, H., Dorsey, J. R., Williams, P. I., Illingworth, A. J., Gallagher, M. W., and Blyth, A. M.: Observations of ice multiplication in a weakly convective cell embedded in supercooled mid-level stratus, Atmos. Chem. Phys., 11, 257–273, https://doi.org/10.5194/acp-11-257-2011, 2011. a
DeMott, P. J., Prenni, A. J., Liu, X., Kreidenweis, S. M., Petters, M. D., Twohy, C. H., Richardson, M. S., Eidhammer, T., and Rogers, D. C.: Predicting global atmospheric ice nuclei distributions and their impacts on climate, P. Natl. Acad. Sci. USA, 107, 11217–11222, https://doi.org/10.1073/pnas.0910818107, 2010. a
Déry, S. J. and Yau, M. K.: A climatology of adverse winter-type weather events, J. Geophys. Res.-Atmos., 104, 16657–16672, https://doi.org/10.1029/1999JD900158, 1999. a
Farrington, R. J., Connolly, P. J., Lloyd, G., Bower, K. N., Flynn, M. J., Gallagher, M. W., Field, P. R., Dearden, C., and Choularton, T. W.: Comparing model and measured ice crystal concentrations in orographic clouds during the INUPIAQ campaign, Atmos. Chem. Phys., 15, 25647–25694, https://doi.org/10.5194/acpd-15-25647-2015, 2015. a, b, c
Field, P. R., Lawson, R. P., Brown, P. R. A., Lloyd, G., Westbrook, C., Moisseev, D., Miltenberger, A., Nenes, A., Blyth, A., Choularton, T., Connolly, P., Buehl, J., Crosier, J., Cui, Z., Dearden, C., DeMott, P., Flossmann, A., Heymsfield, A., Huang, Y., Kalesse, H., Kanji, Z. A., Korolev, A., Kirchgaessner, A., Lasher-Trapp, S., Leisner, T., McFarquhar, G., Phillips, V., Stith, J., and Sullivan, S.: Secondary Ice Production: Current State of the Science and Recommendations for the Future, Meteor. Monogr., 58, 7.1–7.20, https://doi.org/10.1175/AMSMONOGRAPHS-D-16-0014.1, 2017. a, b
Findeisen, W.: Kolloid-meteorologische Vorgänge bei Neiderschlagsbildung, Meteor. Z, 55, 121–133, 1938. a
Geerts, B., Pokharel, B., and Kristovich, D. a. R.: Blowing Snow as a Natural Glaciogenic Cloud Seeding Mechanism, Mon. Weather Rev., 143, 5017–5033, https://doi.org/10.1175/MWR-D-15-0241.1, 2015. a, b, c, d
Gordon, M., Savelyev, S., and Taylor, P. A.: Measurements of blowing snow, part II: Mass and number density profiles and saltation height at Franklin Bay, NWT, Canada, Cold Reg. Sci. Technol., 55, 75–85, https://doi.org/10.1016/j.coldregions.2008.07.001, 2009. a
Griggs, D. J. and Choularton, T. W.: A laboratory study of secondary ice particle production by the fragmentation of rime and vapour-grown ice crystals, Q. J. Roy. Meteor. Soc., 112, 149–163, https://doi.org/10.1002/qj.49711247109, 1986. a
Gultepe, I., Isaac, G., and Cober, S.: Ice crystal number concentration versus temperature for climate studies, Int. J. Climatol., 21, 1281–1302, https://doi.org/10.1002/joc.642, 2001. a
Hallett, J. and Mossop, S.: Production of secondary ice particles during the riming process, Nature, 249, 26–28, https://doi.org/10.1038/249026a0, 1974. a, b
Hoose, C. and Möhler, O.: Heterogeneous ice nucleation on atmospheric aerosols: a review of results from laboratory experiments, Atmos. Chem. Phys., 12, 9817–9854, https://doi.org/10.5194/acp-12-9817-2012, 2012. a
Korolev, A. V., Isaac, G. A., and Hallett, J.: Ice particle habits in Arctic clouds, Geophys. Res. Lett., 26, 1299–1302, https://doi.org/10.1029/1999GL900232, 1999. a, b
Korolev, A., Isaac, G. A., and Hallett, J.: Ice particle habits in stratiform clouds, Q. J. Roy. Meteor. Soc., 126, 2873–2902, https://doi.org/10.1002/qj.49712656913, 2006. a, b, c
Korolev, A. V., Isaac, G. A., Cober, S. G., Strapp, J. W., and Hallett, J.: Microphysical characterization of mixed-phase clouds, Q. J. Roy. Meteor. Soc., 129, 39–65, https://doi.org/10.1256/qj.01.204, 2003. a
Lacher, L., Lohmann, U., Boose, Y., Zipori, A., Herrmann, E., Bukowiecki, N., Steinbacher, M., and Kanji, Z. A.: The Horizontal Ice Nucleation Chamber (HINC): INP measurements at conditions relevant for mixed-phase clouds at the High Altitude Research Station Jungfraujoch, Atmos. Chem. Phys., 17, 15199–15224, https://doi.org/10.5194/acp-17-15199-2017, 2017. a
Lachlan-Cope, T., Ladkin, R., Turner, J., and Davison, P.: Observations of cloud and precipitation particles on the Avery Plateau, Antarctic Peninsula, Antarct. Sci., 13, 339–348, https://doi.org/10.1017/S0954102001000475, 2001. a
Lauber, A., Kiselev, A., Pander, T., Handmann, P., and Leisner, T.: Secondary ice formation during freezing of levitated droplets, J. Atmos. Sci., accepted, 2018. a
Li, L. and Pomeroy, J. W.: Estimates of Threshold Wind Speeds for Snow Transport Using Meteorological Data, J. App. Meteorol., 36, 205–213, https://doi.org/10.1175/1520-0450(1997)036<0205:EOTWSF>2.0.CO;2, 1997. a
Lloyd, G., Dearden, C., Choularton, T. W., Crosier, J., and Bower, K. N.: Observations of the Origin and Distribution of Ice in Cold, Warm, and Occluded Frontal Systems during the DIAMET Campaign, Mon. Weather Rev., 142, 4230–4255, https://doi.org/10.1175/MWR-D-13-00396.1, 2014. a
Lloyd, G., Choularton, T. W., Bower, K. N., Gallagher, M. W., Connolly, P. J., Flynn, M., Farrington, R., Crosier, J., Schlenczek, O., Fugal, J., and Henneberger, J.: The origins of ice crystals measured in mixed-phase clouds at the high-alpine site Jungfraujoch, Atmos. Chem. Phys., 15, 12953–12969, https://doi.org/10.5194/acp-15-12953-2015, 2015. a, b, c, d, e, f, g, h, i, j
Lohmann, U., Henneberger, J., Henneberg, O., Fugal, J. P., Bühl, J., and Kanji, Z. A.: Persistence of orographic mixed-phase clouds, Geophys. Res. Lett., 43, 10512–10519, https://doi.org/10.1002/2016GL071036, 2016GL071036, 2016. a, b, c
Mahesh, A., Eager, R., Campbell, J. R., and Spinhirne, J. D.: Observations of blowing snow at the South Pole, J. Geophys. Res.-Atmos., 108, 4707, https://doi.org/10.1029/2002JD003327, 2003. a, b
Mellor, M. and Fellers, G.: Concentration and flux of wind-blown snow, Special Report 86-11, U.S. Army Cold Regions Research and Engineering Laboratory, Hanover, New Hampshire 03755-1290, 1986. a, b, c, d
Mülmenstädt, J., Sourdeval, O., Delanoë, J., and Quaas, J.: Frequency of occurrence of rain from liquid-, mixed-, and ice-phase clouds derived from A-Train satellite retrievals, Geophys. Res. Lett., 42, 6502–6509, https://doi.org/10.1002/2015GL064604, 2015. a
Murray, B. J., O'Sullivan, D., Atkinson, J. D., and Webb, M. E.: Ice nucleation by particles immersed in supercooled cloud droplets, Chem. Soc. Rev., 41, 6519–6554, https://doi.org/10.1039/C2CS35200A, 2012. a
Nishimura, K. and Nemoto, M.: Blowing snow at Mizuho station, Antarctica, Philos. T. Roy. Soc. A, 363, 1647–1662, https://doi.org/10.1098/rsta.2005.1599, 2005. a, b, c
Palm, S. P., Yang, Y., Spinhirne, J. D., and Marshak, A.: Satellite remote sensing of blowing snow properties over Antarctica, J. Geophys. Res.-Atmos., 116, d16123, https://doi.org/10.1029/2011JD015828, 2011. a
Rangno, A. L. and Hobbs, P. V.: Ice particles in stratiform clouds in the Arctic and possible mechanisms for the production of high ice concentrations, J. Geophys. Res.-Atmos., 106, 15065–15075, https://doi.org/10.1029/2000JD900286, 2001. a
Roe, G. H.: Orographic Precipitation, Annu. Rev. Earth Pl. Sc., 33, 645–671, https://doi.org/10.1146/annurev.earth.33.092203.122541, 2015. a
Rogers, D. C. and Vali, G.: Ice Crystal Production by Mountain Surfaces, J. Clim. Appl. Meteorol., 26, 1152–1168, https://doi.org/10.1175/1520-0450(1987)026<1152:ICPBMS>2.0.CO;2, 1987. a, b, c
Rotunno, R. and Houze, R. A.: Lessons on orographic precipitation from the Mesoscale Alpine Programme, Q. J. Roy. Meteor. Soc., 133, 811–830, https://doi.org/10.1002/qj.67, 2007. a
Schlenczek, O., Fugal, J. P., Lloyd, G., Bower, K. N., Choularton, T. W., Flynn, M., Crosier, J., and Borrmann, S.: Microphysical Properties of Ice Crystal Precipitation and Surface-Generated Ice Crystals in a High Alpine Environment in Switzerland, J. Appl. Meteorol., 56, 433–453, https://doi.org/10.1175/JAMC-D-16-0060.1, 2017. a
Schmidt, R. A.: Vertical profiles of wind speed, snow concentration, and humidity in blowing snow, Bound.-Lay. Meteorol., 23, 223–246, https://doi.org/10.1007/BF00123299, 1982. a
Vali, G., Leon, D., and Snider, J. R.: Ground-layer snow clouds, Q. J. Roy. Meteor. Soc., 138, 1507–1525, https://doi.org/10.1002/qj.1882, 2012. a
Vardiman, L.: The Generation of Secondary Ice Particles in Clouds by Crystal-Crystal Collision, J. Atmos. Sci., 35, 2168–2180, https://doi.org/10.1175/1520-0469(1978)035<2168:TGOSIP>2.0.CO;2, 1978. a
Vionnet, V., Guyomarch, G., Bouvet, F. N., Martin, E., Durand, Y., Bellot, H., Bel, C., and Pugliese, P.: Occurrence of blowing snow events at an alpine site over a 10-year period: Observations and modelling, Adv. Water Resour., 55, 53–63, https://doi.org/10.1016/j.advwatres.2012.05.004, 2013. a, b
Wegener, A.: Thermodynamik der Atmosphäre, Barth, Leipzig, 1911. a
Wolf, V., Kuhn, T., Milz, M., Voelger, P., Krämer, M., and Rolf, C.: Ice particle properties of Arctic cirrus, Atmos. Chem. Phys. Discuss., https://doi.org/10.5194/acp-2018-386, in review, 2018. a, b, c
Yang, J. and Yau, M. K.: A New Triple-Moment Blowing Snow Model, Bound.-Lay. Meteorol., 126, 137–155, https://doi.org/10.1007/s10546-007-9215-4, 2008. a