the Creative Commons Attribution 4.0 License.
the Creative Commons Attribution 4.0 License.
 | 18 Jun 2018
Widespread air pollutants of the North China Plain during the Asian summer monsoon season: a case study
Jiarui Wu
Naifang Bei
Xia Li
Junji Cao
Tian Feng
Yichen Wang
Xuexi Tie
Guohui Li
During the Asian summer monsoon season, prevailing southeasterly–southwesterly winds are subject to delivering air pollutants from the North China Plain (NCP) to northeast and northwest China. In the present study, the WRF-CHEM model is used to evaluate contributions of trans-boundary transport of NCP emissions to the air quality in northeast and northwest China during a persistent air pollution episode from 22 to 28 May 2015. The WRF-CHEM model generally performs well in capturing the observed temporal variation and spatial distribution of fine particulate matter (PM2.5), ozone (O3), and NO2. The simulated temporal variation of aerosol species is also in good agreement with measurements in Beijing during the episode. Model simulations show that NCP emissions contribute substantially to the PM2.5 level in Liaoning and Shanxi provinces, the adjacent downwind areas of the NCP, with an average of 24.2 and 13.9 µg m−3 during the episode, respectively. The PM2.5 contributions in Jilin and Shaanxi provinces are also appreciable, with an average of 9.6 and 6.5 µg m−3, respectively. The average percentage contributions of NCP emissions to the PM2.5 level in Liaoning, Jilin, Shanxi, and Shaanxi provinces are 40.6, 27.5, 32.2, and 20.9 %, respectively. The NCP emissions contribute remarkably to the O3 level in Liaoning province, with an average of 46.5 µg m−3, varying from 23.9 to 69.5 µg m−3. The O3 level in Shanxi province is also influenced considerably by NCP emissions, with an average contribution of 35.1 µg m−3. The O3 level in Shanxi province is also influenced considerably by NCP emissions, with an average contribution of 35.1 µg m−3. The average O3 contributions of NCP emissions to Jilin and Shaanxi provinces are 28.7 and 20.7 µg m−3, respectively. The average percentage contributions of NCP emissions to the afternoon O3 level in Liaoning, Jilin, Shanxi, and Shaanxi provinces are 27.4, 19.5, 21.2, and 15.8 %, respectively. However, the effect of NCP emissions on the air quality in Inner Mongolia is generally insignificant. Therefore, effective mitigation of NCP emissions not only improves the local air quality, but is also beneficial to the air quality in northeast and northwest China during the Asian summer monsoon season.
- Article
(23149 KB) - Full-text XML
-
Supplement
(2577 KB) - BibTeX
- EndNote


With the rapid growth of industrialization, urbanization, and transportation, China has recently experienced severe air pollution with high levels of fine particulate matter (PM2.5) and ozone (O3) (e.g., Chan and Yao, 2008; Zhang et al., 2013; Kurokawa et al., 2013; G. Li et al., 2017b). Although the Chinese State Council issued the “Atmospheric Pollution Prevention and Control Action Plan” in September 2013, with the aim of improving China's air quality, heavy haze or photochemical smog still frequently plagues China, especially in the North China Plain (NCP), Yangtze River Delta (YRD), and Pearl River Delta (PRD). Elevated O3 and PM2.5 concentrations in the atmosphere not only perturb regional and global climates, but also exert adverse effects on air quality, ecosystems, and human health (Weinhold, 2008; Parrish and Zhu, 2009).
The NCP has become one of the most polluted areas in the world due to a large amount of emissions of pollutants and frequent occurrence of unfavorable meteorological situations, as well as the topography (e.g., Tang et al., 2012; Zhang et al., 2013; Zhuang et al., 2014; Pu et al., 2015; Long et al., 2016). Heavy haze with extremely high PM2.5 concentrations often covers the NCP during wintertime, partially attributable to coal combustion for domestic heating (e.g., He et al., 2001; Cao et al., 2007; H. Li et al., 2017). However, even in summer, with improvement of the evacuation conditions and increase of precipitation, photochemical smog with high levels of PM2.5 and O3 still engulfs the NCP (e.g., Gao et al., 2011; Hu et al., 2014; Cao et al., 2015; Wu et al., 2017). The PM2.5 concentrations during summertime in the NCP are generally lower than those in winter, but are still much higher than 35 µg m−3, the first grade of National Ambient Air Quality Standards (NAAQS) in China (Feng et al., 2016; Z. S. Wang et al., 2016; Sun et al., 2016). The average summertime PM2.5 concentrations in the NCP are 77.0 ± 41.9 µg m−3 in 2013, much more than those in other regions of China and also exceeding the second grade of NAAQS (Hu et al., 2014). In addition, increasing O3 precursor emissions have caused serious O3 pollution during summertime in the NCP (e.g., Zhang et al., 2009; Xu et al., 2011; Kurokawa et al., 2013). G. Li et al. (2017b) reported that the maximum 1h O3 concentration exceeded 200 µg m−3 in almost all the cities in eastern China from April to September 2015, mainly concentrated in the NCP and YRD, showing widespread and persistent O3 pollution. Ma et al. (2016) found a growth trend of surface O3 at a rural site in the NCP from 2003 to 2015, with an average rate of 1.13 ppb per year. Wu et al. (2017) showed that the average afternoon O3 concentration in the summer of 2015 in Beijing was about 163 µg m−3.
China is located in a large monsoon domain, and the Asia summer monsoon (ASM) tends to substantially influence the distribution and trans-boundary transport of air pollutants in China. Zhu et al. (2004) have proposed that the summertime high O3 concentration over western China is due to the monsoonal transport from eastern China and long-range transport from south/central Asia and even Europe. Zhao et al. (2010) have also indicated that O3 transported from south/central Asia to western China increases from May to August because of the northward movement of the India summer monsoon. Huang et al. (2015) have suggested that an earlier onset of the ASM would lead to more O3 enhancement in the lower troposphere over the NCP in later spring and early summer. Numerous studies have also reported that the strength and temporospatial extension of the ASM influences the spatial and temporal distribution of aerosol mass concentrations over eastern China (Cao et al., 2015; Li et al., 2016; Cheng et al., 2016). For example, Zhang et al. (2010) have emphasized that the east ASM plays a major role in determining the seasonal and interannual variations of the PM2.5 concentration over eastern China. Using the GEOS-CHEM model, Zhu et al. (2012) have shown that the weakening of the ASM increases the aerosol concentration in eastern China. Wu et al. (2016) have pointed out that the regional transport and tempo-spatial distribution of air pollutants are directly influenced by the East Asian monsoon at seasonal, interannual, and decadal scales.
During the ASM season, meteorological conditions are characterized by prevailing southwesterly–southeasterly winds over eastern China. Air pollutants originated from the NCP are likely to be transported northwards and affect the air quality in its downwind areas, so it is imperative to quantitatively evaluate the effect of NCP emissions on the air quality in its neighboring regions. Previous studies have concentrated on the composition, characteristics, and sources of the air pollutants over the NCP (e.g., Han et al., 2006; Liu et al., 2012; Zhao et al., 2013; Li et al., 2015). However, few studies have been performed to investigate the effect of trans-boundary transport of air pollutants originated from the NCP on the air quality in northeast and northwest China under the prevailing southerly wind associated with the ASM.
In this study, we first analyze the role of synoptic situations during the ASM (from May to September) in the trans-boundary transport over northern China and further evaluate the contribution of trans-boundary transport of pollutants originated from the NCP to the air quality in northeast and northwest China using the WRF-CHEM model. The model configuration and methodology are described in Sect. 2. Analysis results and discussions are presented in Sect. 3, and conclusions are given in Sect. 4.
2.1 WRF-CHEM model and configuration
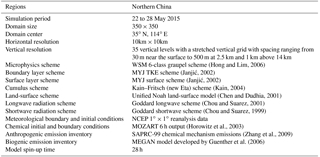
A persistent air pollution episode with high levels of PM2.5 and O3 from 22 to 28 May 2015 in northern China is simulated using the WRF-CHEM model, which was developed by Li et al. (2010, 2011a, b, 2012) at the Molina Center for Energy and the Environment. Table 1 provides detailed model configurations and Fig. 1 shows the WRF-CHEM model simulation domain. It is worth noting that the horizontal resolution of 10 km adopted in this study is the lower bound for the WRF model to turn on the cumulus scheme, so the new Kain–Fritsch scheme is used in the present study (Table 1). Further description of the model is presented in the Supplement.
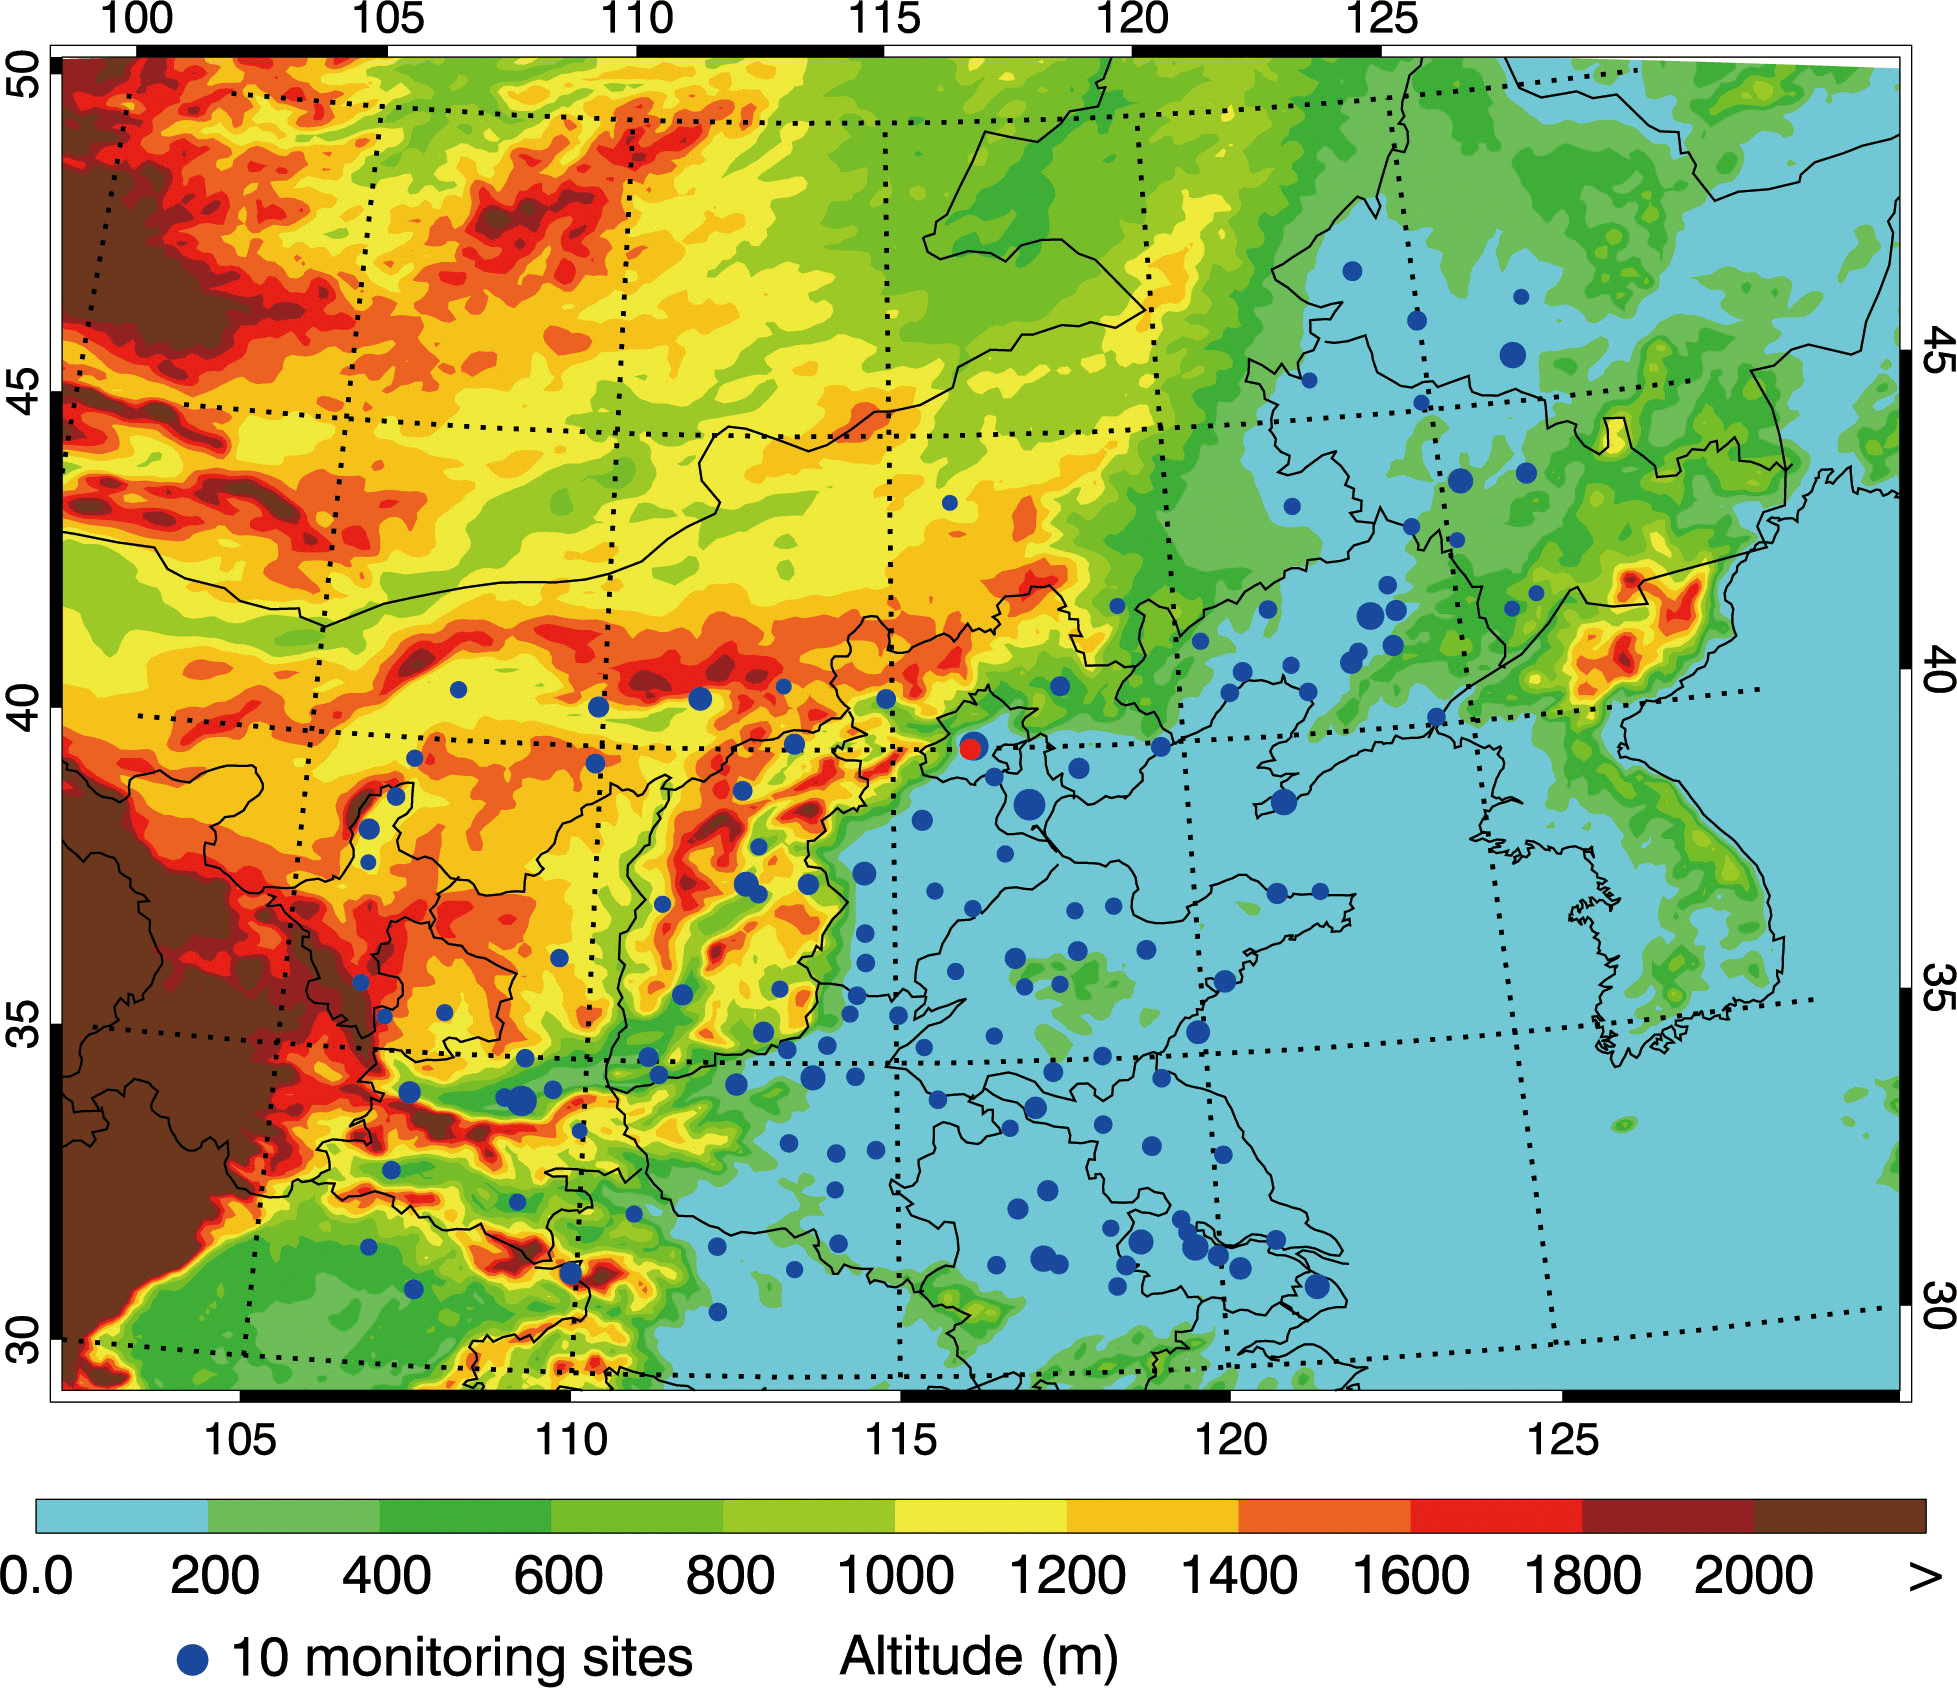
Figure 1WRF-CHEM simulation domain with topography. The blue circles represent centers of cities with ambient monitoring sites and the red circle denotes the NCNST site. The size of the blue circle represents the number of ambient monitoring sites of cities.
The key characteristics of the aerosol pollution in China are frequently associated with rather efficient secondary formation, including aerosol nucleation and rapid growth under favorable conditions (Zhang et al., 2012, 2015; Qiu and Zhang, 2013; Guo et al., 2014). The new particle production rate in the WRF-CHEM model is calculated due to the binary nucleation of H2 SO4 and H2O vapor. The nucleation rate is a parameterized function of temperature, relative humidity, and the vapor-phase H2SO4 concentration, following the work of Kulmala et al. (1998), and the new particles are assumed to have a diameter of 2.0 nm. Recent studies have shown that organic vapors are involved in the nucleation process (Zhang et al., 2012) and further studies need to be conducted to consider the contributions of organic vapors to the nucleation process. The secondary organic aerosol (SOA) formation is simulated using a nontraditional SOA model including the volatility basis-set modeling method in which primary organic components are assumed to be semi-volatile and photochemically reactive and are distributed in logarithmically spaced volatility bins (Li et al., 2011a). The contributions of glyoxal and methylglyoxal to the SOA formation are also included in the SOA module. The SOA formation from glyoxal and methylglyoxal is parameterized as a first-order irreversible uptake by aerosol particles, with a reactive uptake coefficient of 3.7 × 10⁻³ for glyoxal and methylglyoxal (Zhao et al., 2006). The simulation of inorganic aerosols in the WRF-CHEM model adopts the ISORROPIA version 1.7 (Nenes et al., 1998).
For the discussion convenience, northern China is divided into three regions (Fig. S1 in the Supplement): (1) the North China Plain (including Beijing, Tianjin, Hebei, Shandong, Henan, and the south of Jiangsu and Anhui, hereafter referred to as the NCP), (2) northeast China (including Heilongjiang, Jilin, Liaoning, and the east part of Inner Mongolia, hereafter referred to as NEC), and (3) northwest China (including Shanxi, Shaanxi, and the west part of Inner Mongolia, hereafter referred to as NWC). During the episode, the observed average daily PM2.5 concentration was 75.5 µg m−3 and the mean O3 concentration in the afternoon was 151.2 µg m−3 in the NCP. Figure S2 presents the distributions of the anthropogenic emission rates of volatile organic compounds (VOCs), nitrogen oxide (NOx), organic carbon (OC), and SO2 in mainland China, showing that the high emission rates of VOCs, NOx, OC, and SO2 are generally concentrated in the NCP. It is worth noting that uncertainties in the emission inventory used in this study are rather large, considering the rapid changes in anthropogenic emissions that are not fully reflected in the current emission inventory and the complexity of pollutants' precursors.
2.2 Data and methodology
In the present study, the model performance is validated using the hourly measurements of O3, NO2, and PM2.5 concentrations released by China's Ministry of Environment Protection (China MEP), which can be accessed at http://www.aqistudy.cn/ (last access: 8 June 2018). In addition, the simulated submicron sulfate, nitrate, ammonium, and organic aerosols are compared to the measurements by the Aerodyne Aerosol Chemical Speciation Monitor (ACSM), which was deployed at the National Center for Nanoscience and Technology (NCNST), Chinese Academy of Sciences in Beijing (Fig. 1). The observed mass spectra of organic aerosols are analyzed using the positive matrix factorization (PMF) technique and four components are identified: hydrocarbon-like organic aerosol (HOA), cooking organic aerosol (COA), coal combustion organic aerosol (CCOA), and oxygenated organic aerosol (OOA). HOA, COA, and CCOA are interpreted together as a surrogate of primary organic aerosols (POA), and OOA is a surrogate of secondary organic aerosols (SOA). Furthermore, the reanalysis data from the European Centre for Medium-Range Weather Forecasts (ECMWF) are used to analyze the synoptic patterns during the ASM season from May to September 2015.
The mean bias (MB), root mean square error (RMSE), and the index of agreement (IOA) are utilized to evaluate the performance of the WRF-CHEM model simulations against measurements. To assess the contributions of NCP emissions to the near-surface concentrations of O3 and PM2.5 in NEC and NWC, the factor separation approach (FSA) is used in this study (Stein and Alpert, 1993; Gabusi et al., 2008; Li et al., 2014). The detailed description of methodology can be found in Sect. S2.
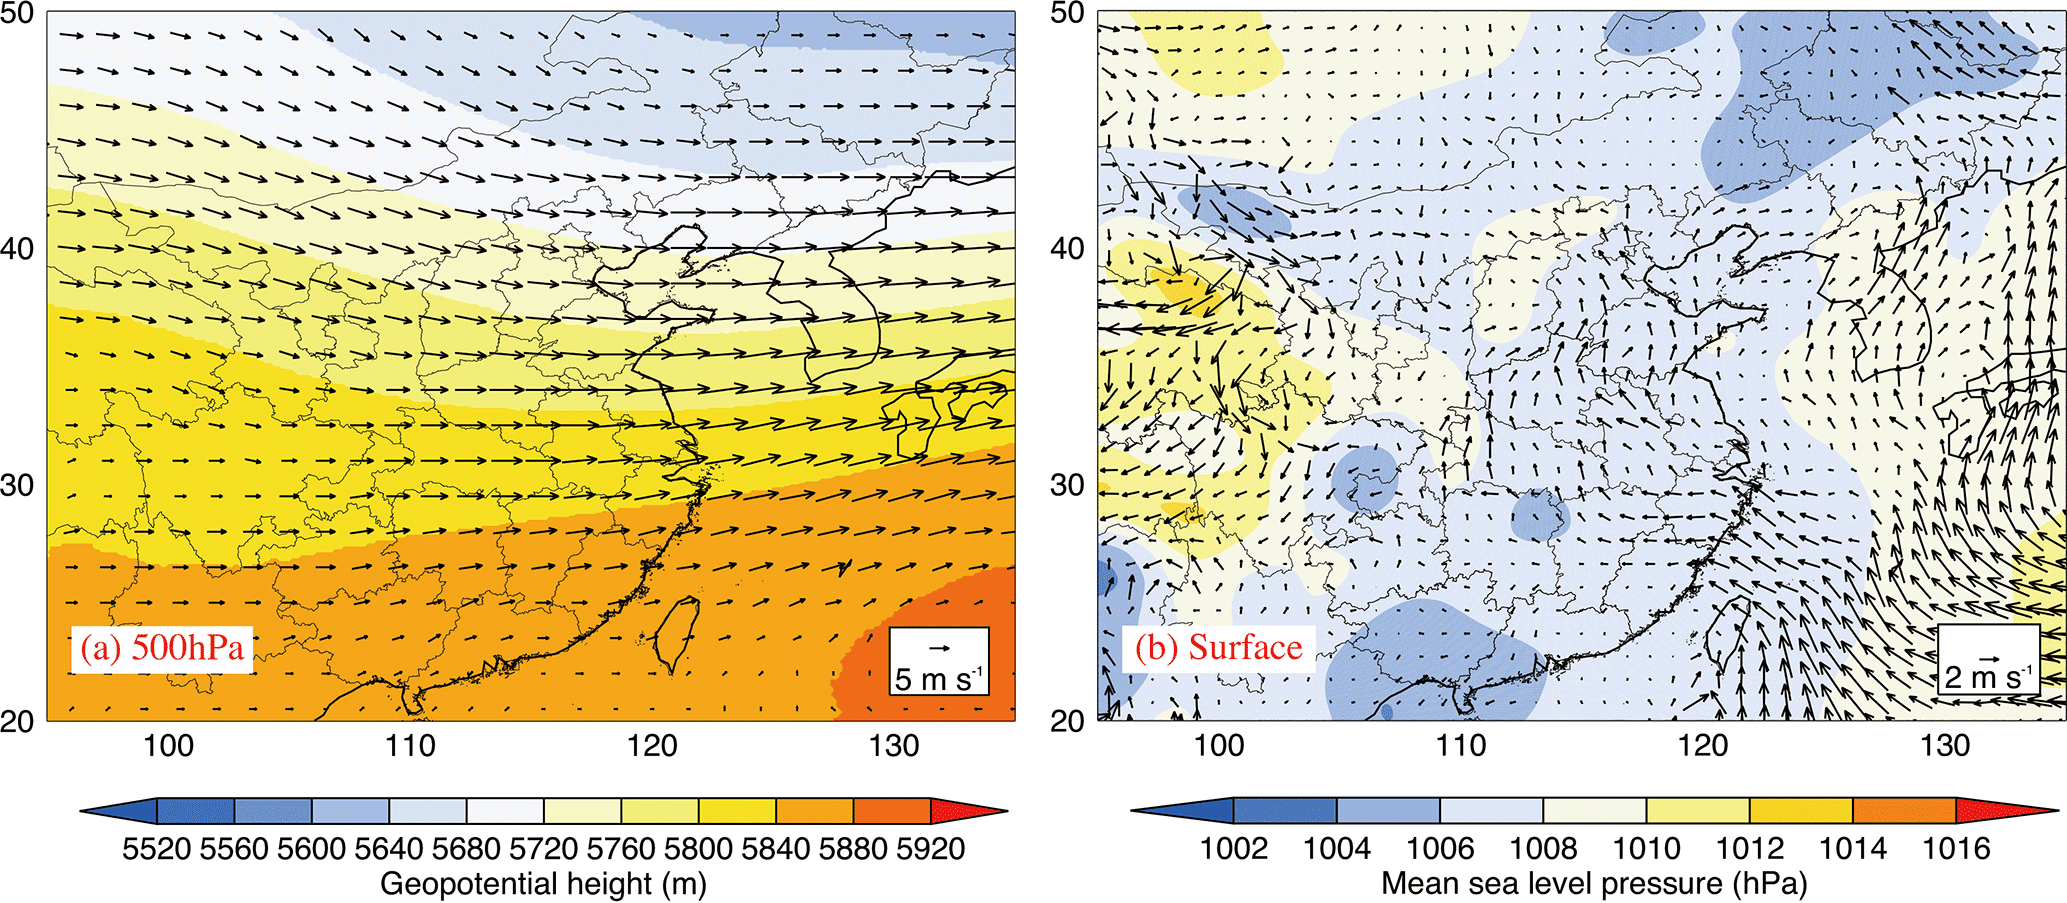
Figure 2(a) Geopotential height at 500 hPa and (b) the mean sea level pressure with wind vectors during the summer season in 2015.
3.1 Synoptic patterns during the ASM season
The ASM prevails from May to September each year in China, with strong winds blowing from oceans to eastern China and bringing warm and moist airflow to the continent. Furthermore, the western Pacific subtropical high gradually intensifies and moves from south to north, influencing the weather and climate over China and also transporting water vapor from the sea to eastern China. During the ASM season, due to the influence of the western Pacific subtropical high, rain belts and associated deep convection move from southeastern China to northern China (Ding, 1992; Ding and Chan, 2005; Kang et al., 2002; Lau, 1992; Lau et al., 1988). Figure 2 shows the geopotential heights at 500 hPa and mean sea level pressure with wind vectors during the ASM season in 2015. At 500 hPa, the main part of the subtropical high, which is represented by the scope of the contour of 5880 geopotential meter, is located in the northwestern Pacific Ocean. The mean ridgeline of the western Pacific subtropical high is located at 25∘ N, moving from south to north from May to September, which substantially affects the synoptic conditions in China. Flat westerly wind at 500 hPa prevails over the NCP and its surrounding regions, indicating a stable weather condition. The mean sea level pressure shows that most of areas in the NCP are continually influenced by the ASM and the high-pressure system centering in the western Pacific, causing the prevailing southeasterly–southwesterly wind over the NCP and its surrounding areas. The detailed description of the synoptic conditions during the study episode can be found in the Supplement.
Figure 3Relationships of observed PM2.5 and O3 concentrations in the NCP with those in NEC during May to September from 2013 to 2016.

In the region controlled by the western Pacific subtropical high, a subsidence airflow is dominant, with calm or weak winds, and the temperature is extremely high due to the strong sunlight, which is favorable for the accumulation and formation of air pollutants. The air pollutants are likely to be transported from south to north under the persistent effect of southerly winds.
Figures 3 and 4 present the relationship of PM2.5 and O3 concentrations in the NCP with those in NEC and NWC during the ASM season from 2013 to 2016, respectively. The observed PM2.5 and O3 concentrations in the NCP exhibit a positive correlation with those in NEC and NWC, with the correlation coefficients generally exceeding 0.55. There are two possible reasons for the positive correlation of PM2.5 and O3 concentrations between the NCP and its surrounding regions. One is that when the NCP and its neighboring areas are controlled by the same large-scale synoptic pattern, the concentrations of air pollutants generally vary synchronously. The other is the trans-boundary transport of air pollutants originated from the NCP to its surrounding areas due to the southerly wind associated with the ASM. The correlation coefficients of PM2.5 and O3 concentrations in the provinces of NEC with those in the NCP generally decrease from south to north, with coefficients of 0.69, 0.56, and 0.52 for PM2.5, and of 0.86, 0.76, and 0.76 for O3 in Liaoning, Jilin, and Heilongjiang, respectively. The decreasing trend of the correlation coefficients also exists from east to west in NWC, with coefficients of 0.69 and 0.62 for PM2.5, and 0.87 and 0.84 for O3 in Shanxi and Shaanxi, respectively. Hence, when severe air pollution occurs in the NCP in summer, the air quality in its adjacent provinces is likely to be deteriorated, possibly caused by the trans-boundary transport of air pollutants originated from the NCP.
It is worth noting that the intensity of ASM substantially influences the temporal variation and spatial distribution of air pollutants (Wu et al., 2016). The East Asia summer monsoon index proposed by Zhang et al. (2003) is defined as a difference of anomalous zonal wind between the 10∘–20∘ N, 100∘–150∘ E and 25∘–35∘ N, 100∘–150∘ E regions at 850 hPa during summer (June–August). A year of monsoon index greater than or equal to 2 is defined as a strong summer monsoon year, and a year of monsoon index less than or equal to −2 is defined as a weak summer monsoon year. The monsoon index calculated by the China Meteorological Administration shows that the intensity of the summer monsoon in 2015 was close to the normal (Fig. S5).
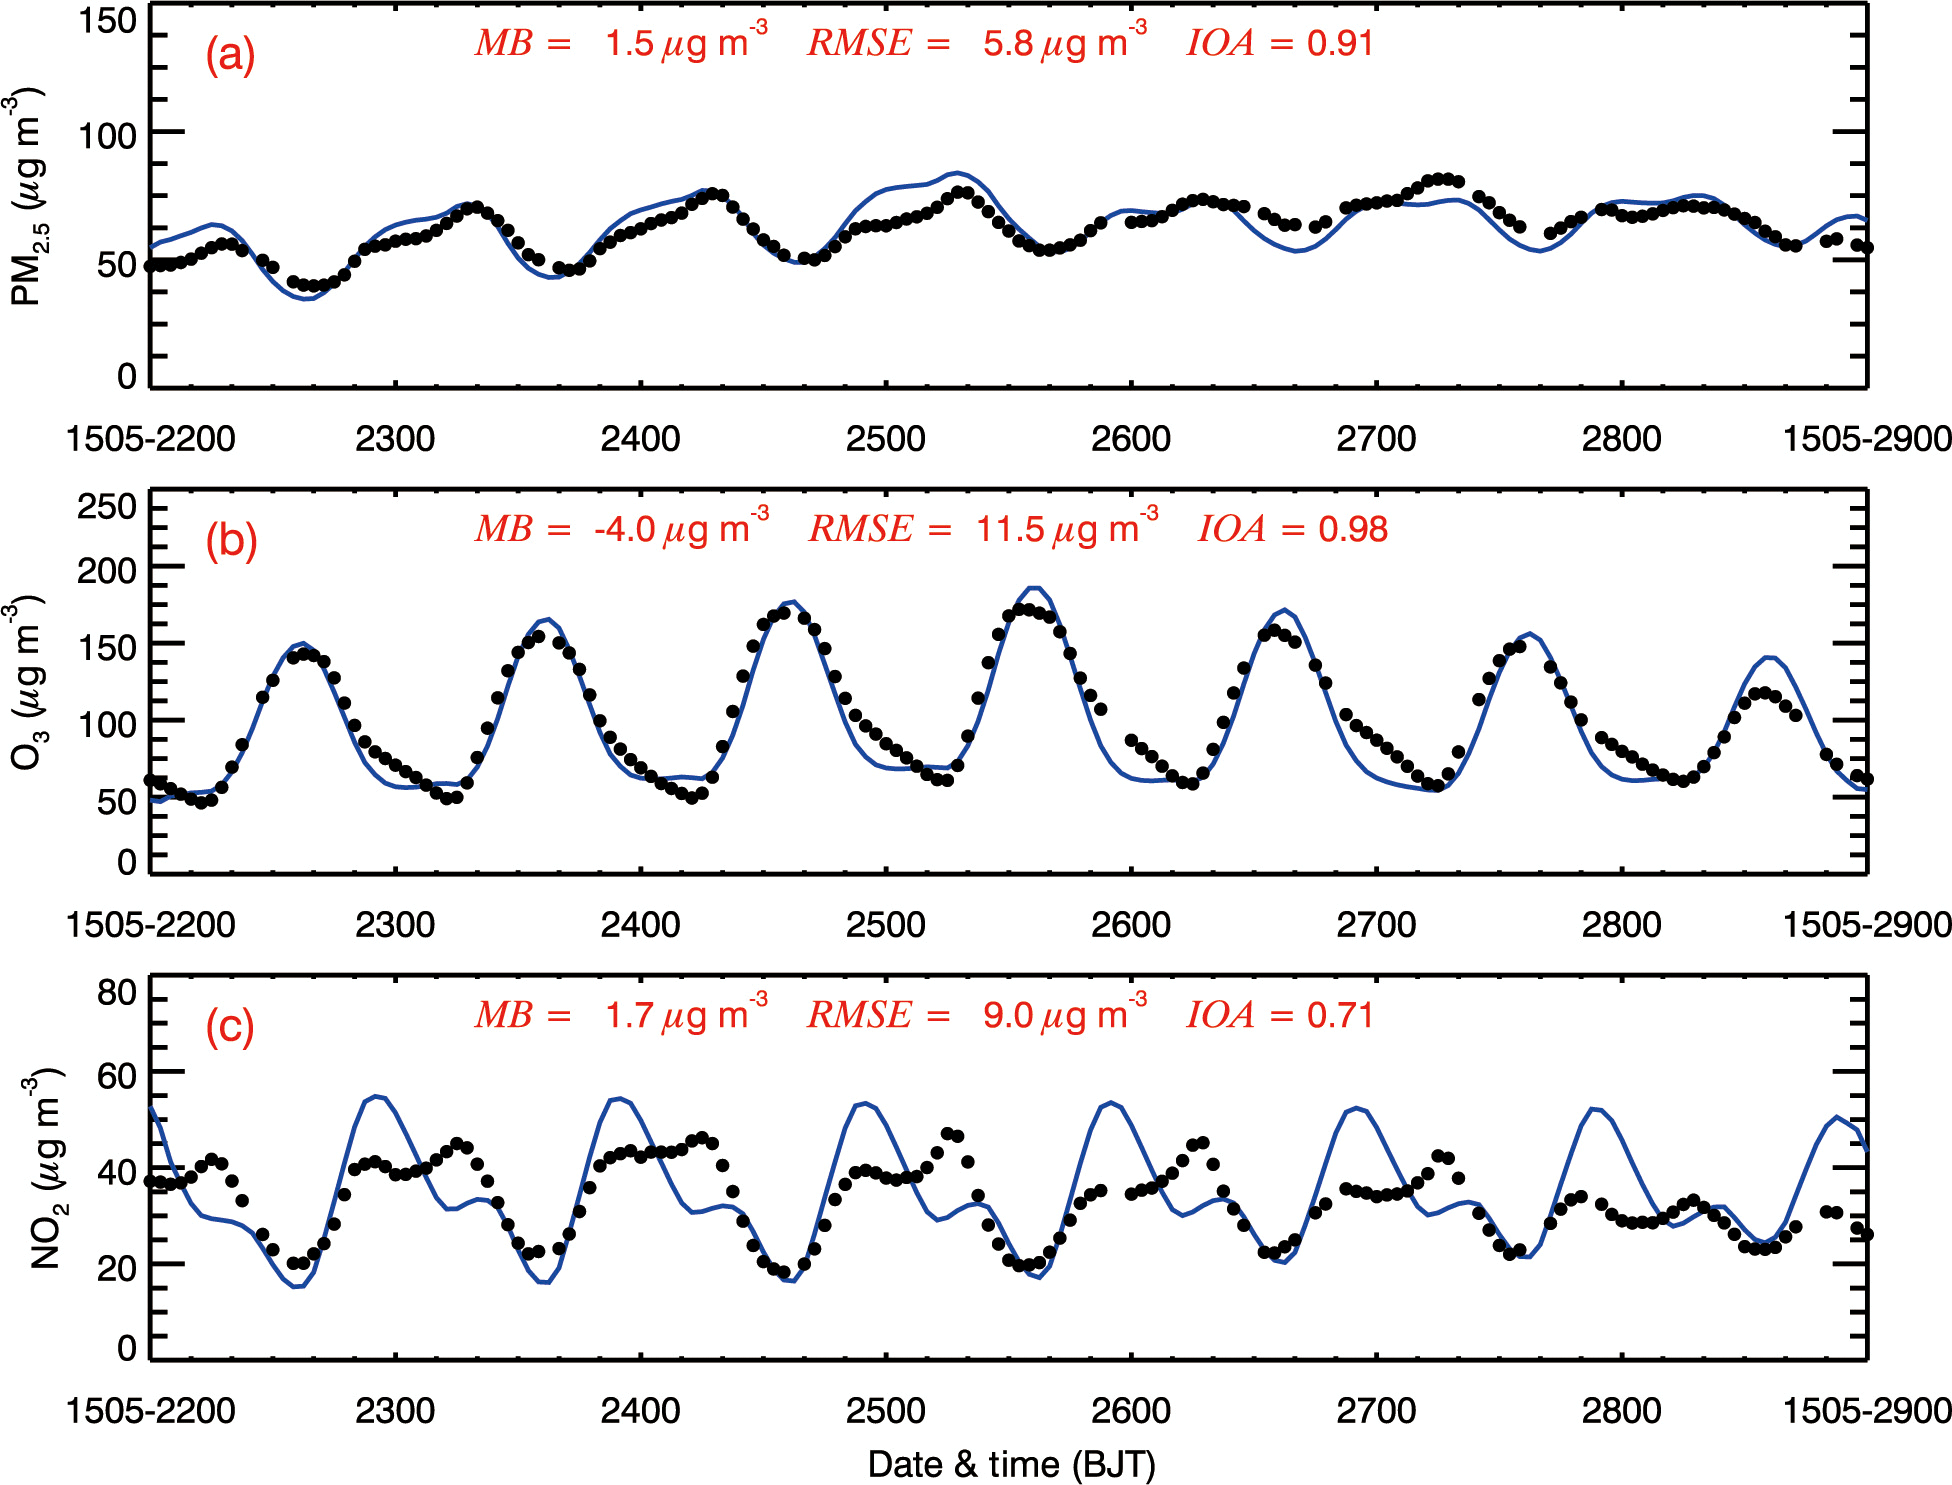
Figure 5Comparison of measured (black dots) and predicted (blue line) diurnal profiles of near-surface hourly (a) PM2.5, (b) O3, and (c) NO2 averaged over all ambient monitoring stations in northern China from 22 to 28 May 2015.
3.2 Model performance
3.2.1 PM2.5, O3 and NO2 simulations in northern China
Figure 5 shows the temporal variations of observed and simulated near-surface PM2.5, O3, and NO2 concentrations averaged over monitoring sites in northern China. The WRF-CHEM model generally simulates the diurnal variation of PM2.5 concentrations in northern China well, with an IOA of 0.91. The model successfully reproduces the temporal variations of surface O3 concentrations compared with observations in northern China, e.g., peak O3 concentrations in the afternoon due to active photochemistry and low O3 concentrations during nighttime caused by NOx titration, with an IOA of 0.98. However, the model underestimation still exists in simulating the O3 concentration, with an MB of −4.0 µg m−3. The model also reasonably produces the NO2 diurnal profiles, but frequently overestimates the NO2 concentrations in the late evening due to the simulated low planetary boundary layer (PBL) height, and underestimates the concentration in the early morning because of the uncertainties in the NOx emissions. The further analysis of the model performance of PM2.5, O3 and NO2 concentrations in northern China can be found in the Supplement.
3.2.2 Aerosol species simulations in Beijing
Figure 6 presents the temporal variations of simulated and observed aerosol species at the NCNST site in Beijing from 22 to 28 May 2015. Generally, the WRF-CHEM model predicts the temporal variations of the aerosol species against the measurements reasonably, especially for POA and nitrate aerosol, with IOAs of 0.81 and 0.90, respectively. The model has difficulties in simulating the SOA concentrations well, with an IOA and MB of 0.69 and −3.6 µg m−3, respectively. It is worth noting that many factors influence the SOA simulation, including measurements, meteorology, precursors emissions, and SOA formation mechanisms and treatments (Bei et al., 2012, 2013). The model reasonably tracks the temporal variation of the observed sulfate concentration, but the bias is still large, and the MB and IOA are −1.2 µg m−3 and 0.68, respectively. The sulfate source in the atmosphere is various, including SO2 gas-phase oxidation by hydroxyl radicals (OH) and stabilized Criegee intermediates (sCI), aqueous reactions in cloud or fog droplets, and heterogeneous reactions on aerosol surfaces, as well as direct emissions from power plants and industries (G. Li et al., 2017a). G. Wang et al. (2016) have also reported that the aqueous oxidation of SO2 by NO2 is important for efficient sulfate formation. Considering that the model fails to resolve convective clouds well due to the 10 km horizontal resolution, the sulfate formation from the cloud process is generally underestimated. Additionally, a large amount of SO2 is emitted from point sources, such as power plants or agglomerated industrial zones, which is much more sensitive to wind field simulations (Bei et al., 2010). The model performs reasonably well in simulating the ammonium aerosol, with an IOA and MB of 0.77 and −0.4 µg m−3, respectively.
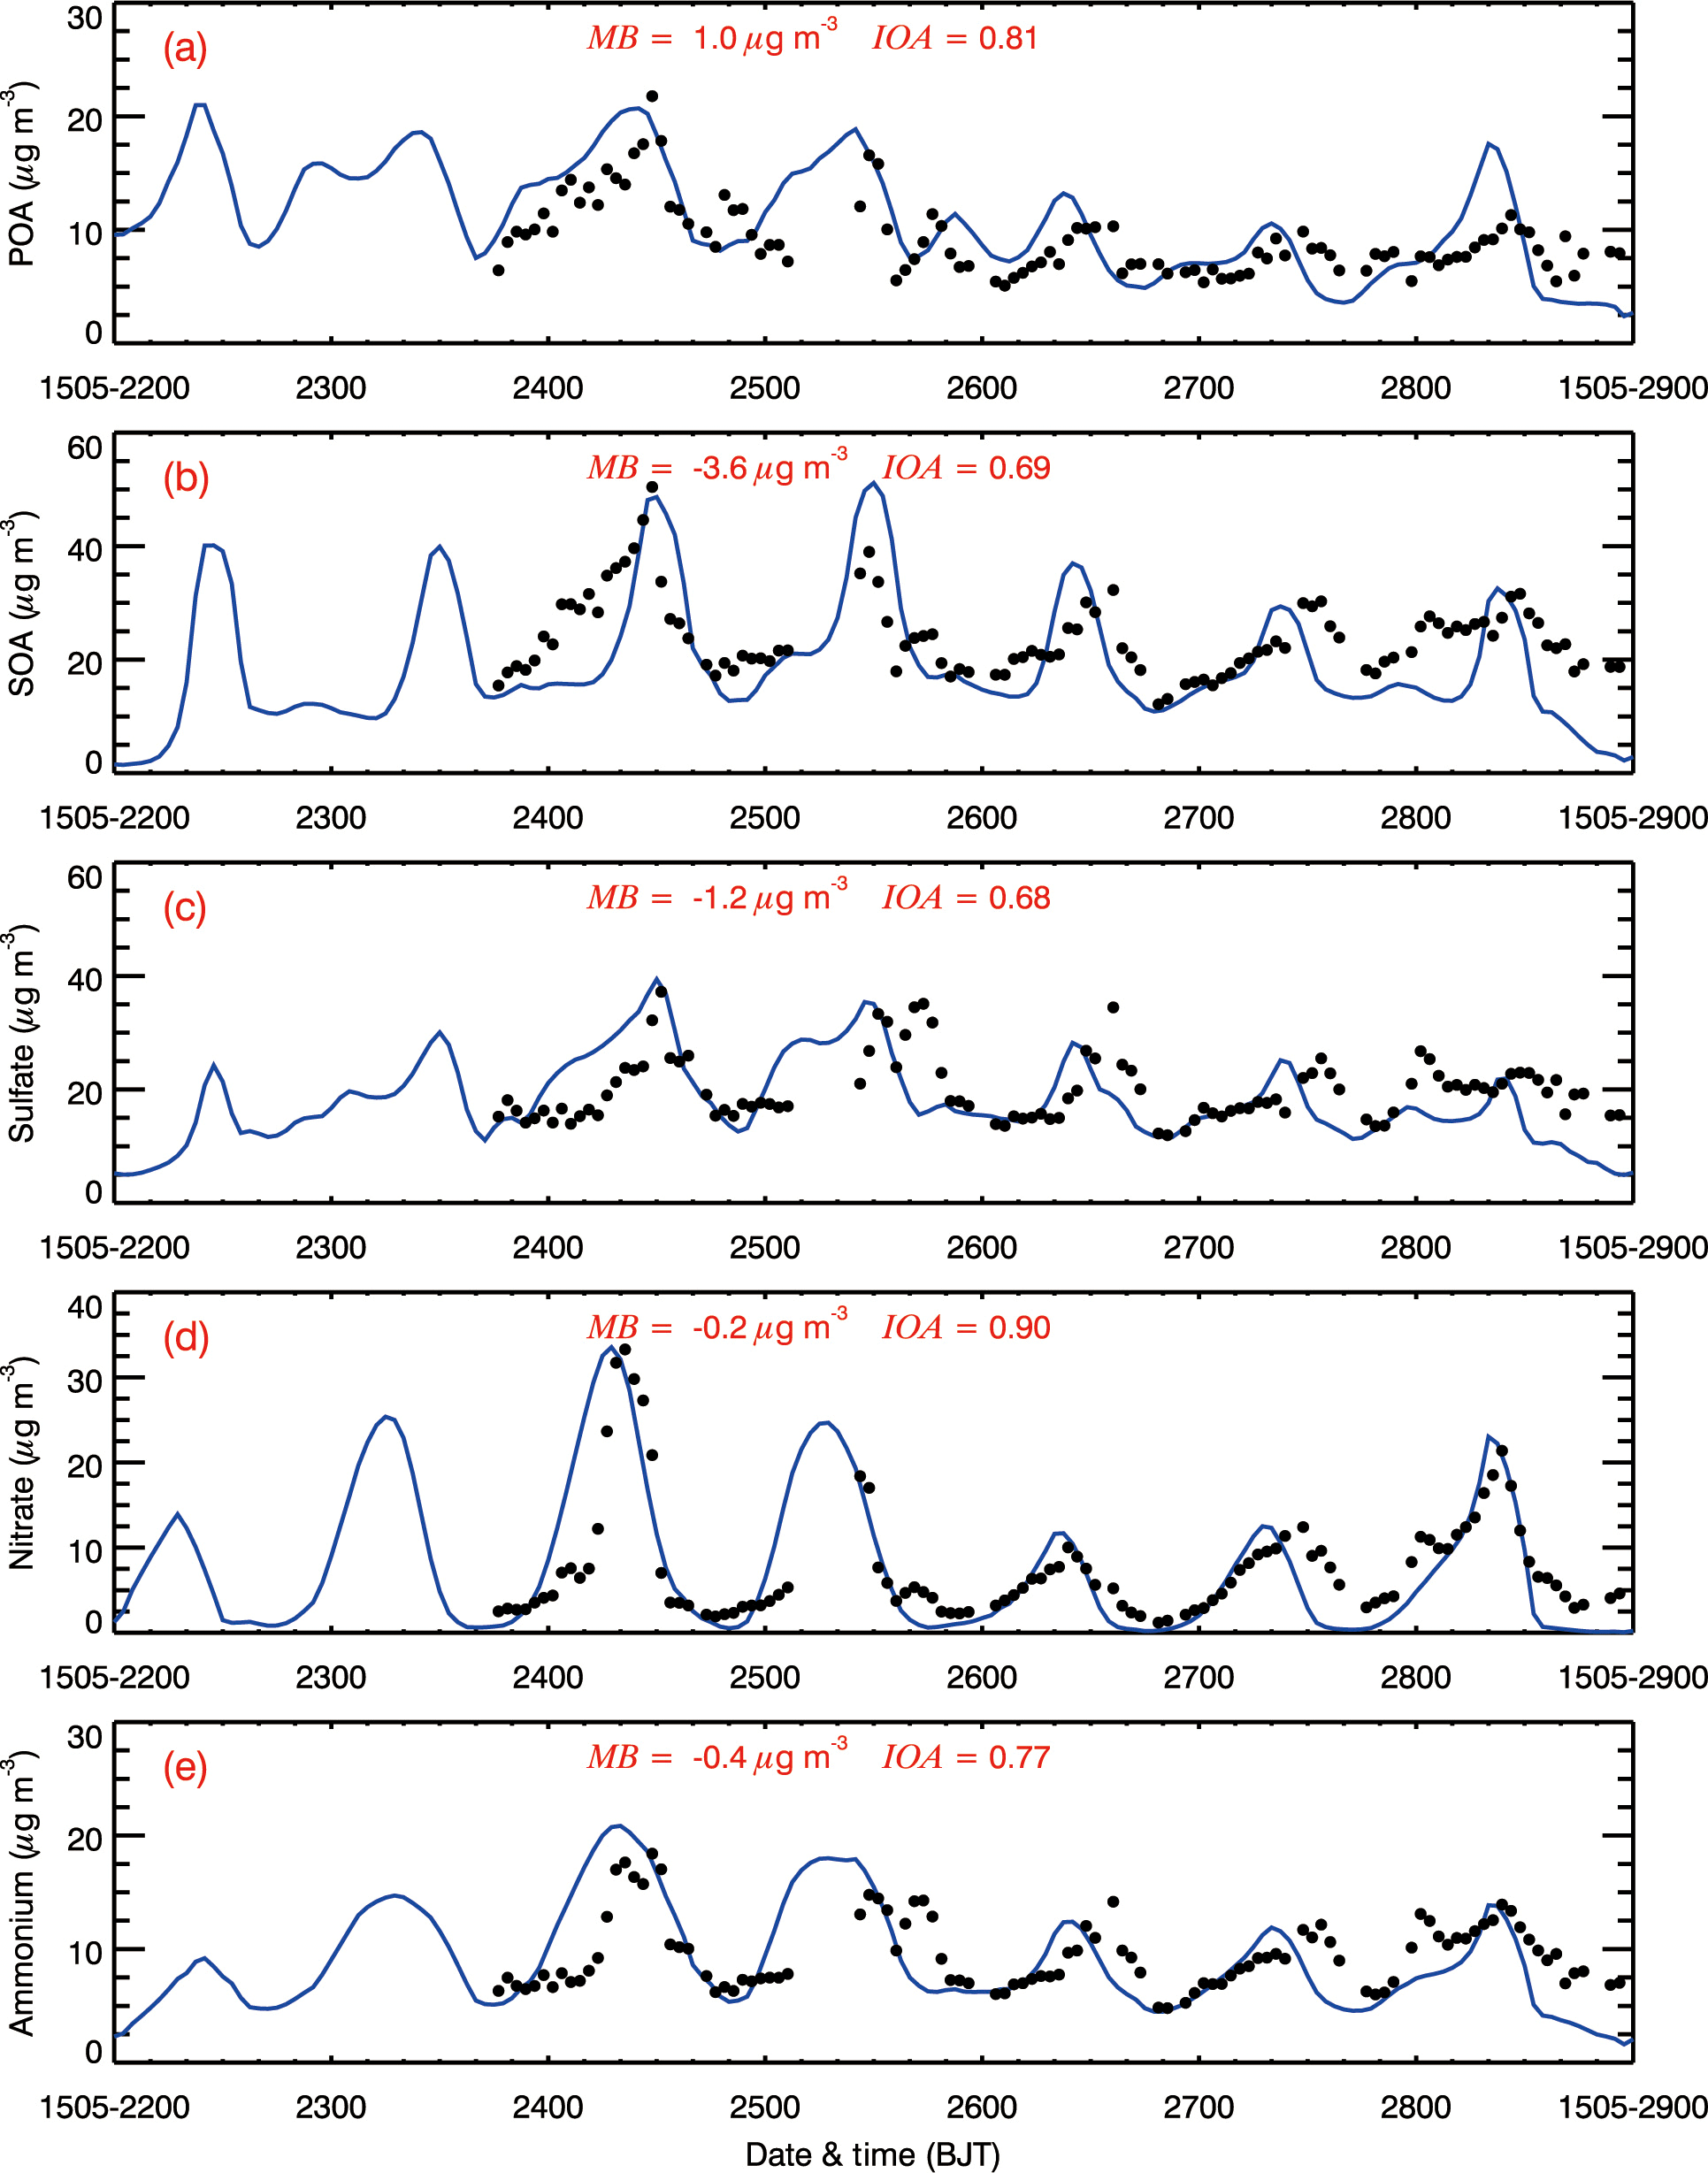
Figure 6Comparison of measured (black dots) and simulated (black line) diurnal profiles of submicron aerosol species of (a) POA, (b) SOA, (c) sulfate, (d) nitrate, and (e) ammonium at the NCNST site in Beijing from 22 to 28 May 2015.
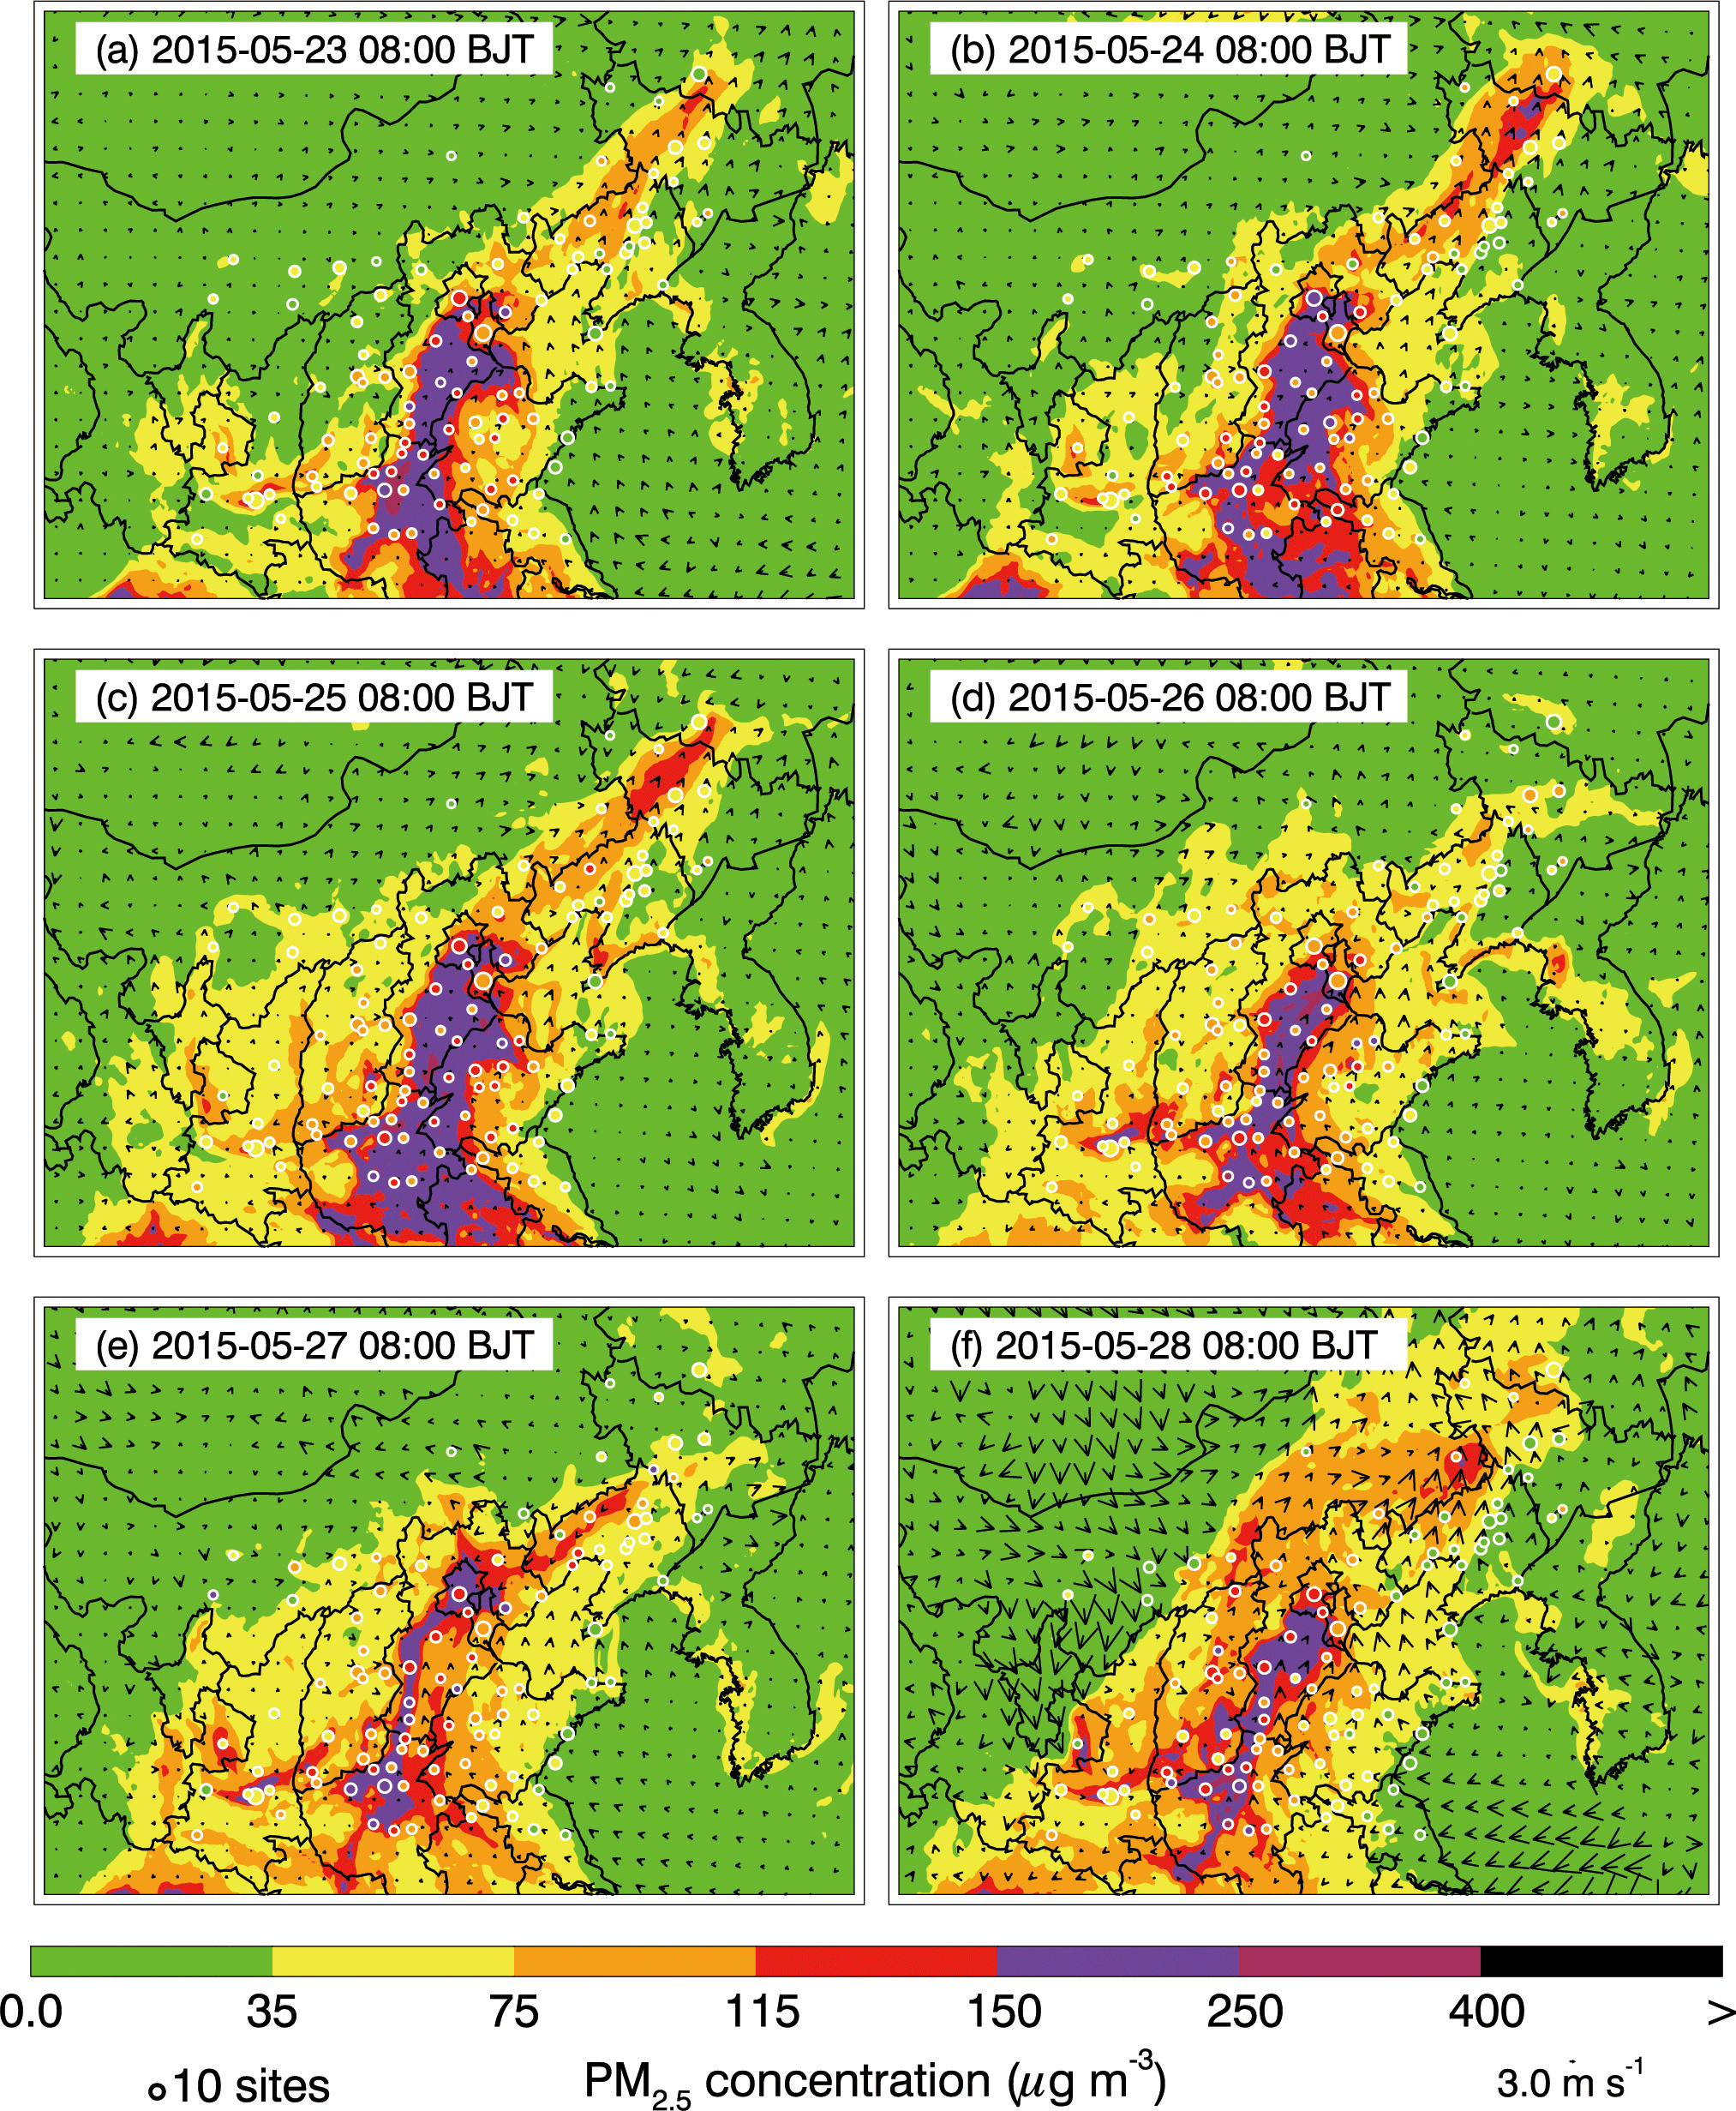
Figure 7Pattern comparison of simulated vs. observed near-surface PM2.5 at 08:00 BJT from 23 to 28 May 2015. Colored circles show PM2.5 observations, color contours show the PM2.5 simulations, and black arrows represent the simulated surface winds.
3.2.3 Simulations of the spatial distribution of PM2.5 and O3 concentrations
The peak PM2.5 concentration generally occurs from 08:00 to 10:00 Beijing Time (BJT) due to rush hour. Figure 7 provides the distributions of calculated and observed near-surface PM2.5 concentrations along with the simulated wind fields at 08:00 BJT from 23 to 28 May 2015. The calculated PM2.5 spatial patterns generally agree well with the observations at the monitoring sites. The NCP experiences more severe PM2.5 pollution than its surrounding areas, with PM2.5 concentrations frequently exceeding 150 µg m−3 in the Beijing–Tianjin–Hebei region. During the study episodes, the pollutants are likely to be transported to NEC and NWC under the prevailing southwesterly or southeasterly winds in northern China, causing the PM2.5 concentrations in most areas of NEC and NWC to be frequently higher than 75 µg m−3.
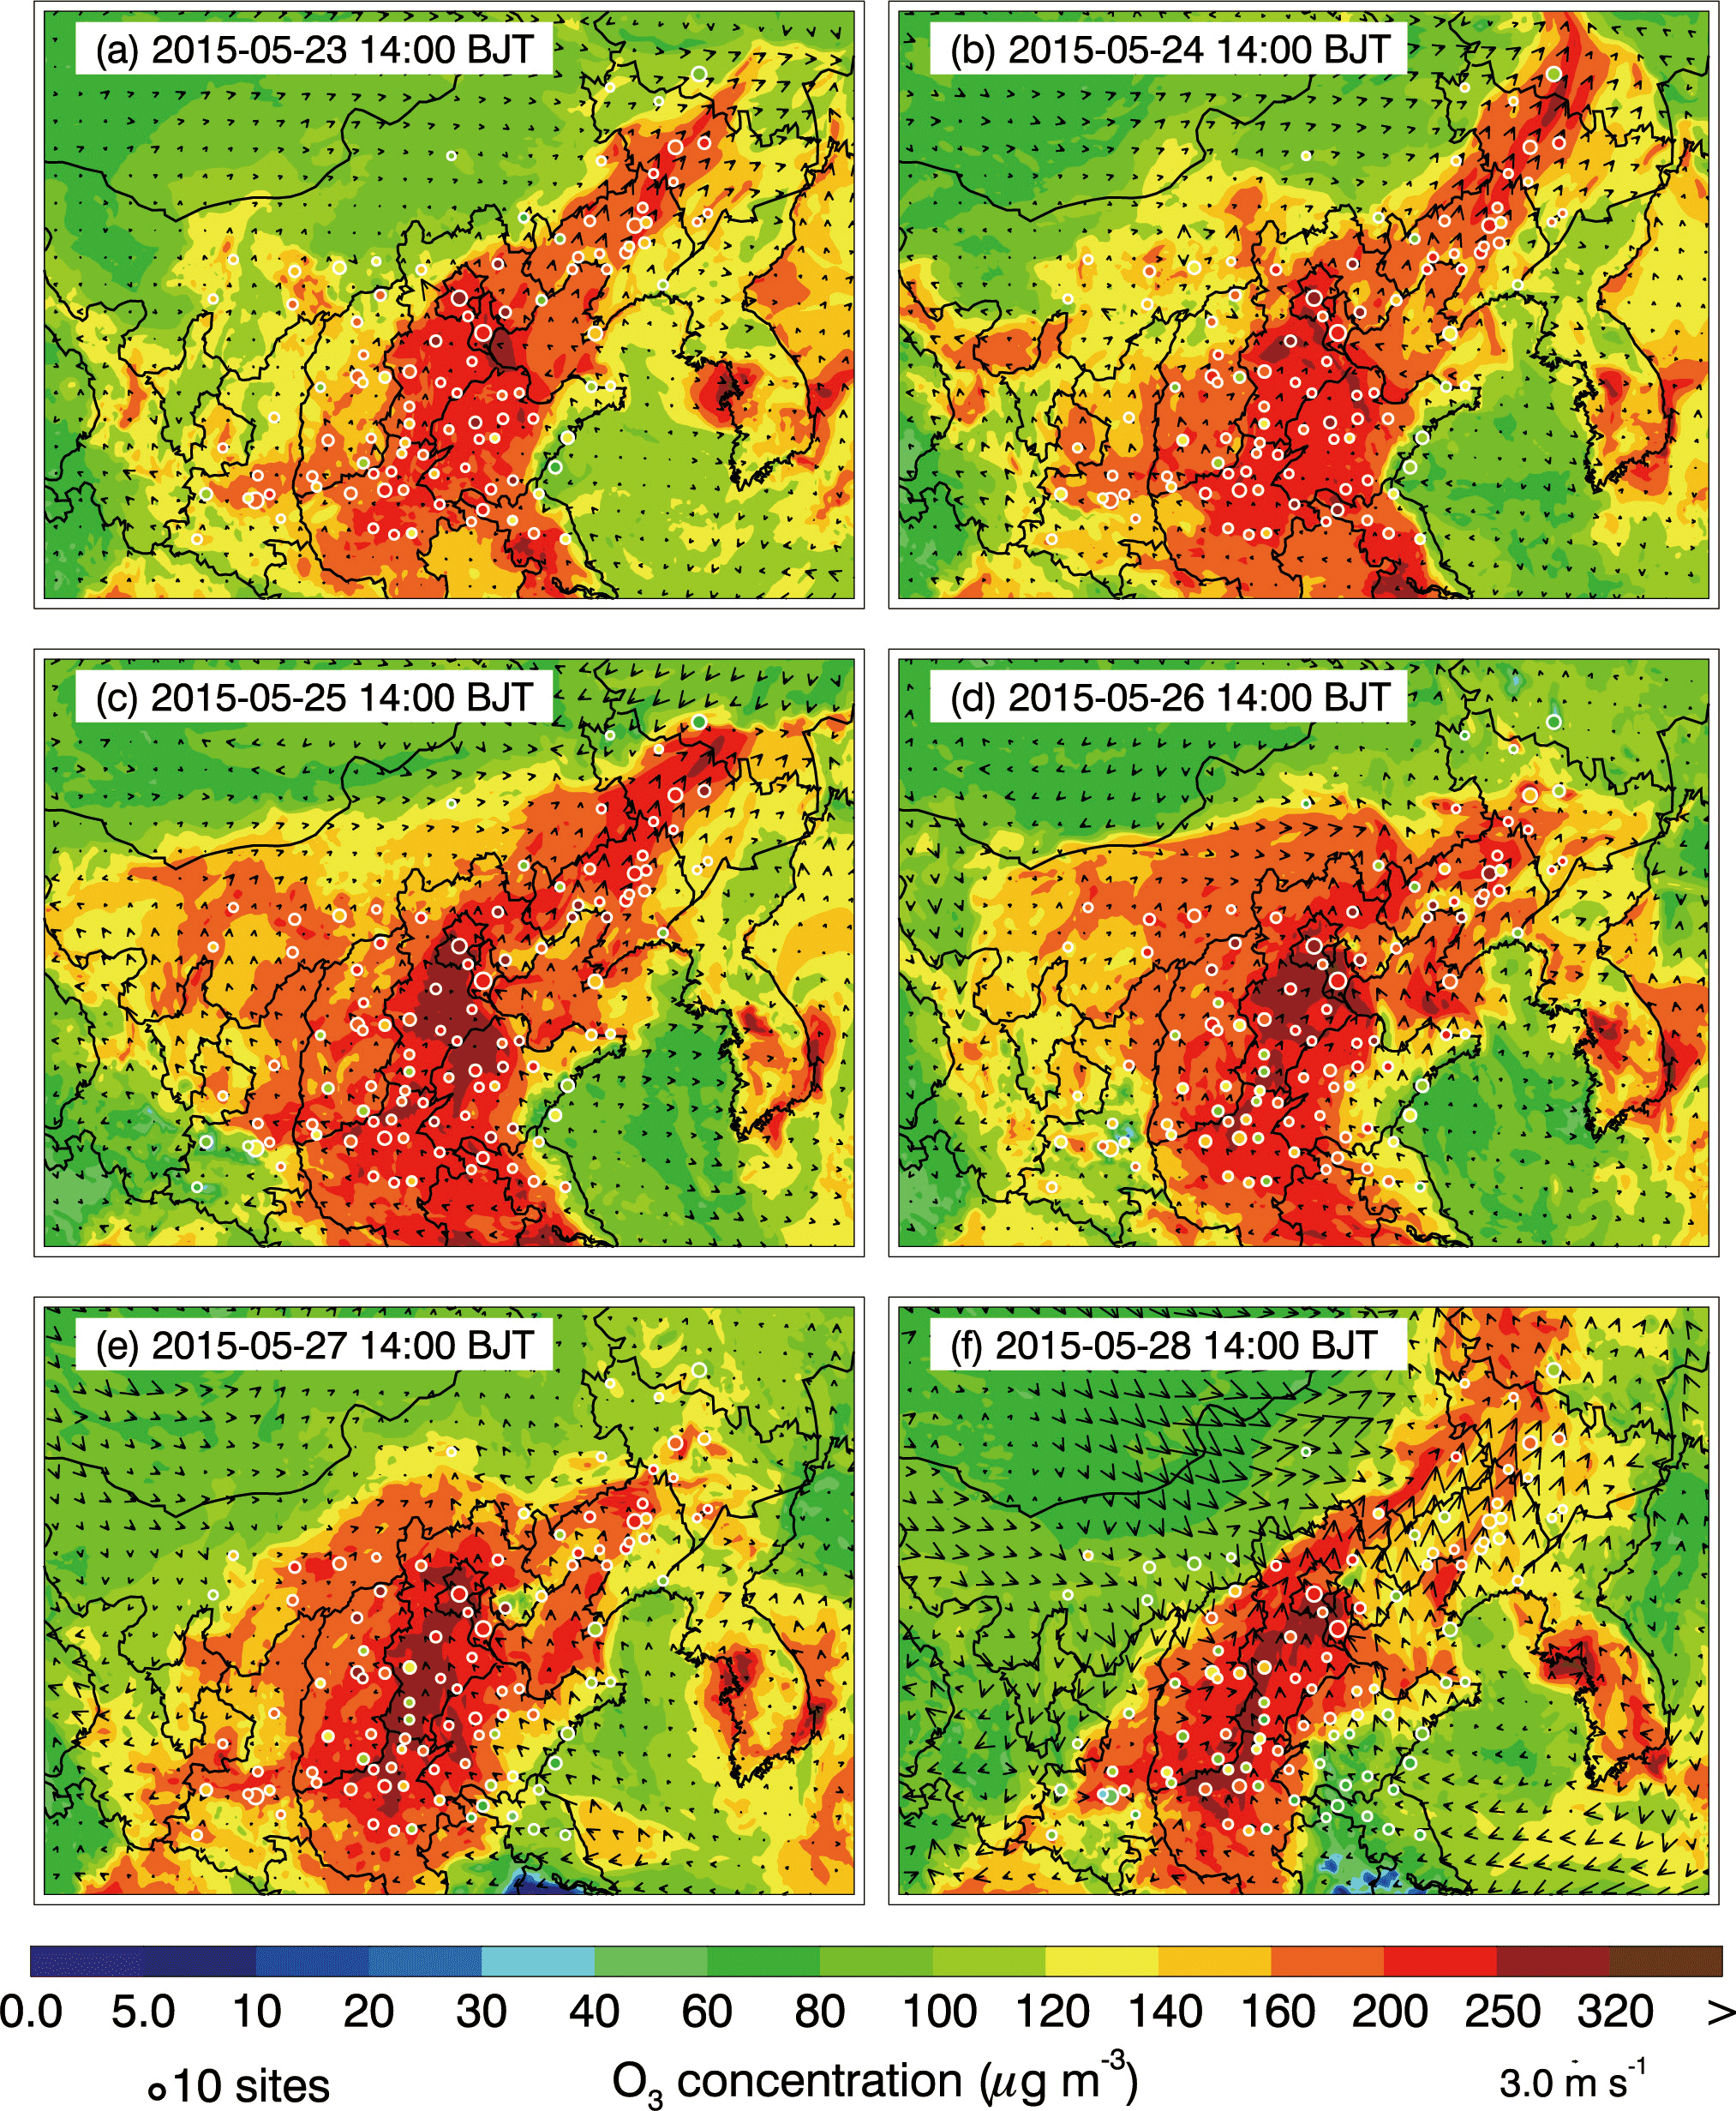
The O3 concentration during summertime generally reaches its peak from 14:00 to 16:00 BJT in northern China (Fig. 5). Figure 8 shows the spatial distribution of calculated and measured near-surface O3 concentrations at 14:00 BJT from 23 to 28 May 2015, along with the simulated wind fields. Generally, the simulated O3 spatial patterns are consistent with the observations, but the model overestimation or underestimation still exists. The simulated high O3 concentrations at 14:00 BJT, exceeding 200 µg m−3, are frequently concentrated in the NCP, which is also consistent with the measurements. The O3 transport to NEC and NWC from the NCP is obvious when the winds are southeasterly or southwesterly, inducing severe O3 pollution in NEC and NWC.
In general, the simulated variations of PM2.5, O3, NO2, and aerosol species are in good agreement with observations, indicating that the simulations of meteorological conditions and chemical processes and the emission inventory used in the WRF-CHEM model are reasonable, providing a reliable basis for the further investigation.
3.3 Effects of NCP emissions on the air quality in NEC and NWC
To evaluate the contribution of NCP emissions to the air quality in its neighboring areas, four model simulations are performed, including fNS with all anthropogenic emissions from the NCP and non-NCP areas, fN with anthropogenic emissions from the NCP only, fS with anthropogenic emissions from the non-NCP areas only, and f0 without all anthropogenic emissions. Consequently, the air pollutant concentrations in NEC and NWC can be separated into four components, including contributions from the local emissions (, fS−f0), the trans-boundary transport of NCP emissions (,fN−f0), the interactions of these two emissions (, , and the background (f0).
In the present study, the effect of NCP emissions on the PM2.5 and O3 concentrations in NEC and NWC is evaluated, considering that they have a long lifetime of several days in the troposphere and often constitute the primary air pollutant during summertime (Seinfeld and Pandis, 2006). However, the trans-boundary transport of PM10 is not considered due to its short lifetime of several hours, caused by the dry deposition and gravity, and the fact that PM10 is generally confined to its source region when the wind is not strong enough (Sun et al., 2006).
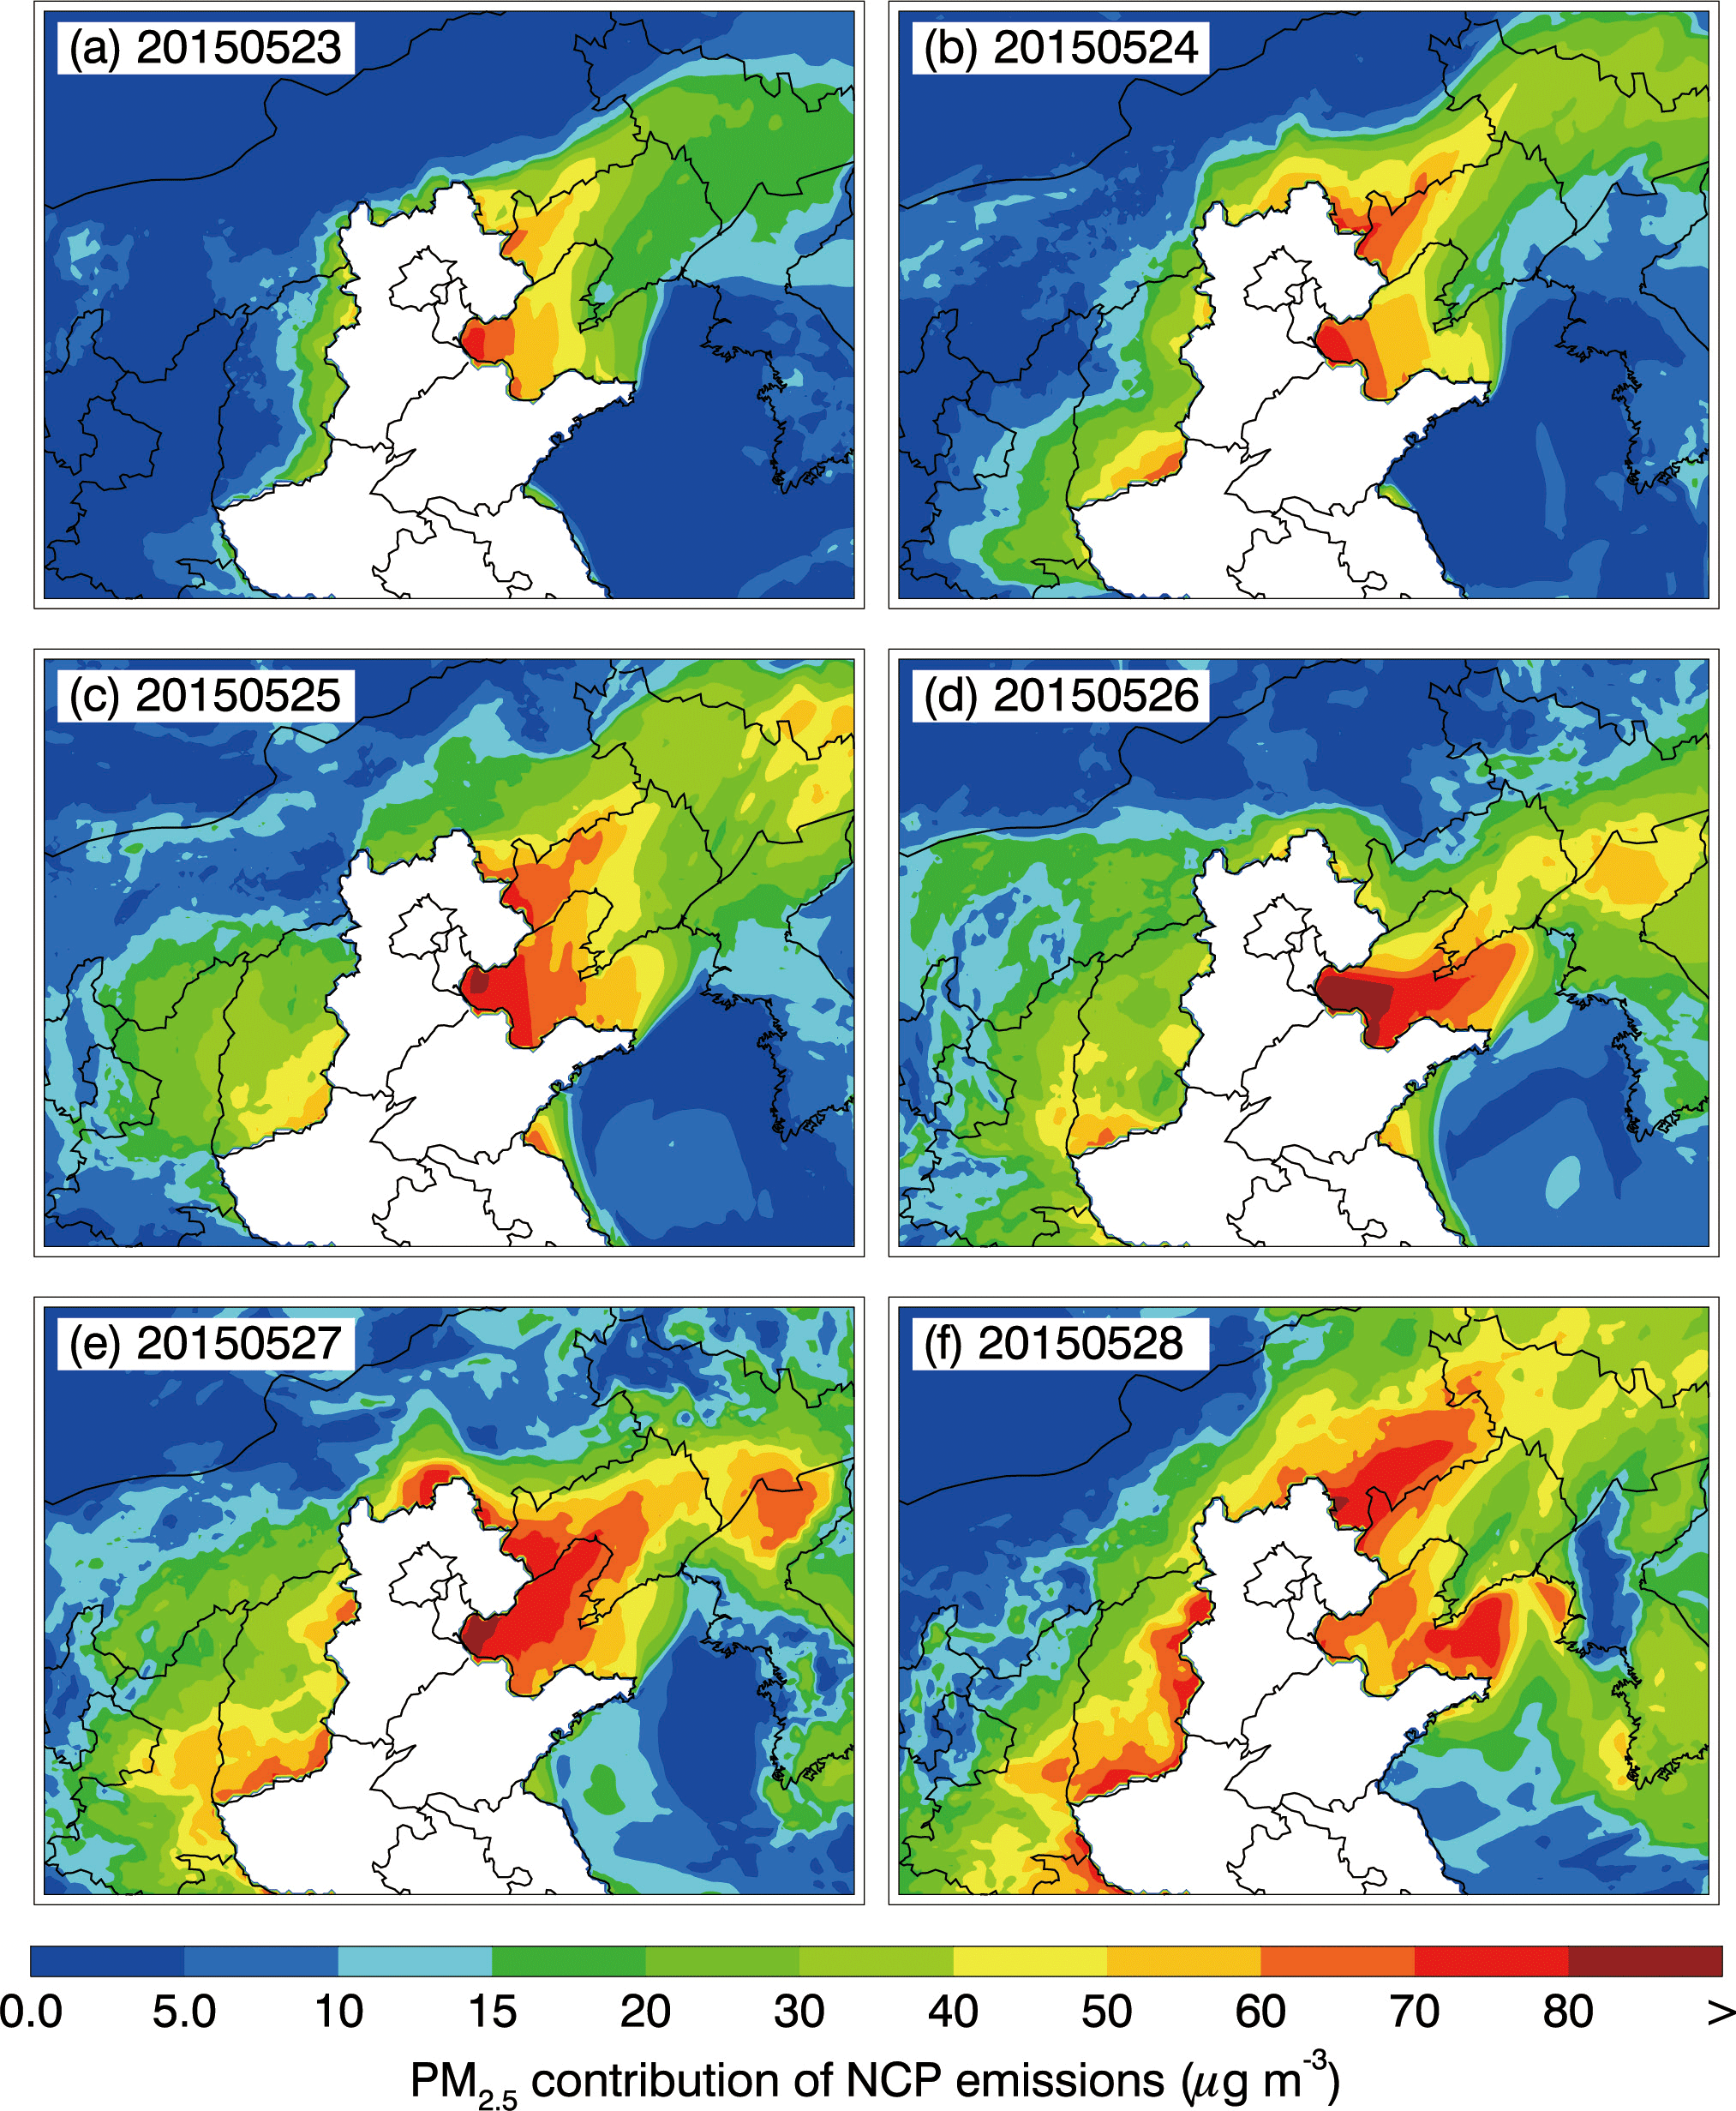
Figure 9Contributions of NCP emissions to the daily mean near-surface PM2.5 concentration in NEC and NWC from 23 to 28 May 2015.
3.3.1 Contributions of NCP emissions to PM2.5 levels in NEC and NWC
Figure 9 shows the simulated spatial distribution of daily mean PM2.5 concentrations contributed by NCP emissions in NEC and NWC from 23 to 28 May 2015. The contribution of trans-boundary transport of NCP emissions to the PM2.5 concentration is remarkable in Liaoning, frequently exceeding 30 µg m−3 in most areas of the province during the episode. NCP emissions also considerably influence the PM2.5 concentration in Jilin, contributing 5–30 µg m−3 in most areas and occasionally exceeding 40 µg m−3. The effect of NCP emissions on the PM2.5 level in Shanxi and Shaanxi is increasingly evident from 23 to 28 May 2015, with the contribution of up to 50–60 µg m−3 in the southeast of Shanxi and to a lesser extent of 30–40 µg m−3 in the middle part of Shaanxi on 27–28 May. The contribution of trans-boundary transport of NCP emissions to the PM2.5 level in Inner Mongolia is not significant, which may be attributed to the location of the low pressure and terrain characteristics. Obviously, the effect of trans-boundary transport shows a stepwise characteristic: the closer to the NCP emission sources, the more remarkable the impact on the downwind areas. As a result, Liaoning and Shanxi provinces are substantially influenced by NCP emissions, while Jilin and Shaanxi provinces are affected to a lesser extent.
Table 2Daily average PM2.5 contributions (µg m−3) of NCP emissions in NEC and NWC from 22 to 28 May 2015.
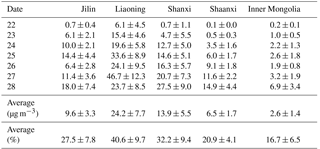
The impact of NCP emissions on the daily average PM2.5 concentration in NEC and NWC from 22 to 28 May 2015 is summarized in Table 2. On average, NCP emissions increase the PM2.5 concentrations by 24.2, 9.6, 13.9, 6.5, and 2.6 µg m−3 in Liaoning, Jilin, Shanxi, Shaanxi, and Inner Mongolia, with average percentage contributions of 40.6, 27.5, 32.2, 20.9, and 16.7 %, respectively. Figure 10 shows the episode-averaged PM2.5 percentage contribution from NCP emissions to the surrounding areas. The NCP emissions markedly affect the air quality in Liaoning, accounting for around 20–50 % of the PM2.5 concentration during the episode and with the most substantial impact on the west part of the province. The NCP emissions contribute about 15–30 % of the PM2.5 concentration in Jilin. Shanxi province is also remarkably affected by NCP emissions, with more than 25 % of PM2.5 concentration contributed by NCP emissions in most areas. Although Shaanxi province is a little far from the NCP, NCP emissions still contribute about 10–35 % of the PM2.5 concentration. NCP emissions also enhance the PM2.5 concentration by 5–50 % in the southern edge of Inner Mongolia, which is adjacent to the NCP.
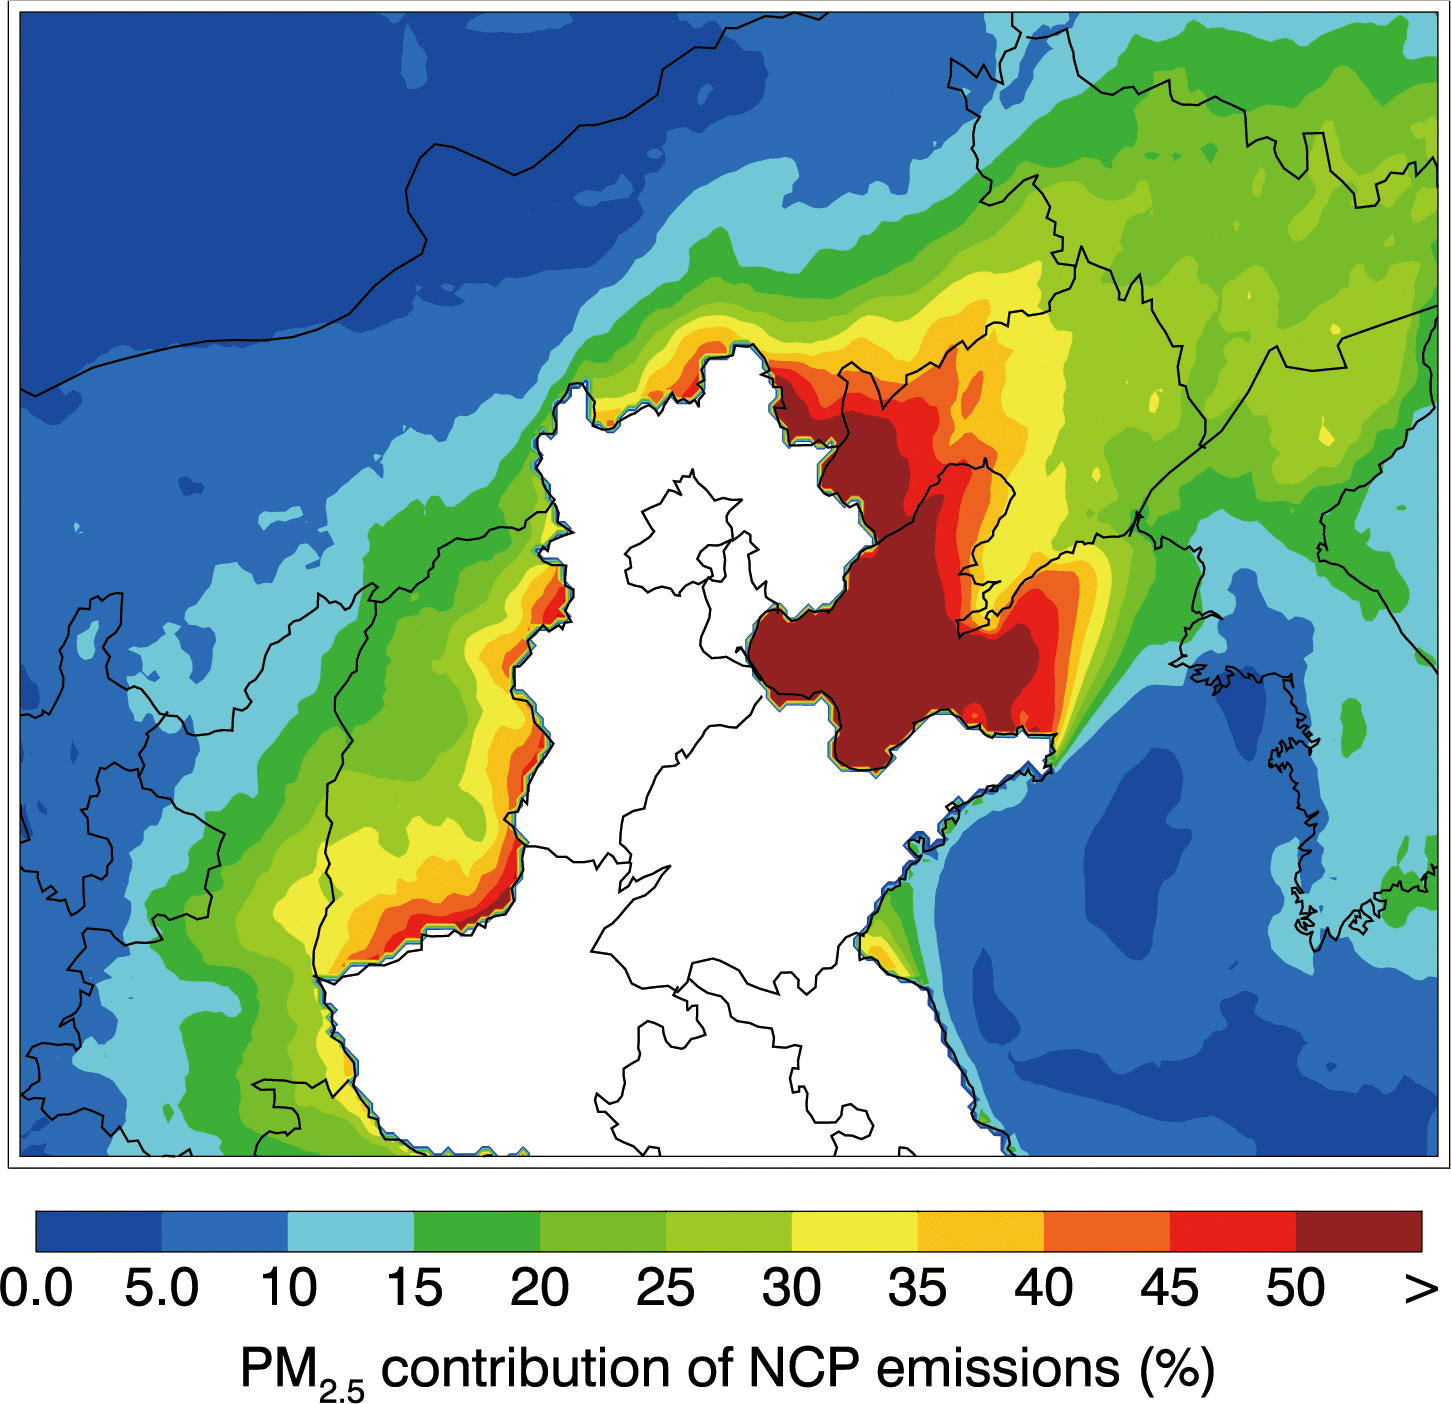
Figure 10Average percentage contribution of NCP emissions to PM2.5 concentrations in NEC and NWC from 22 to 28 May 2015.
3.3.2 Contributions of NCP emissions to O3 concentrations in NEC and NWC
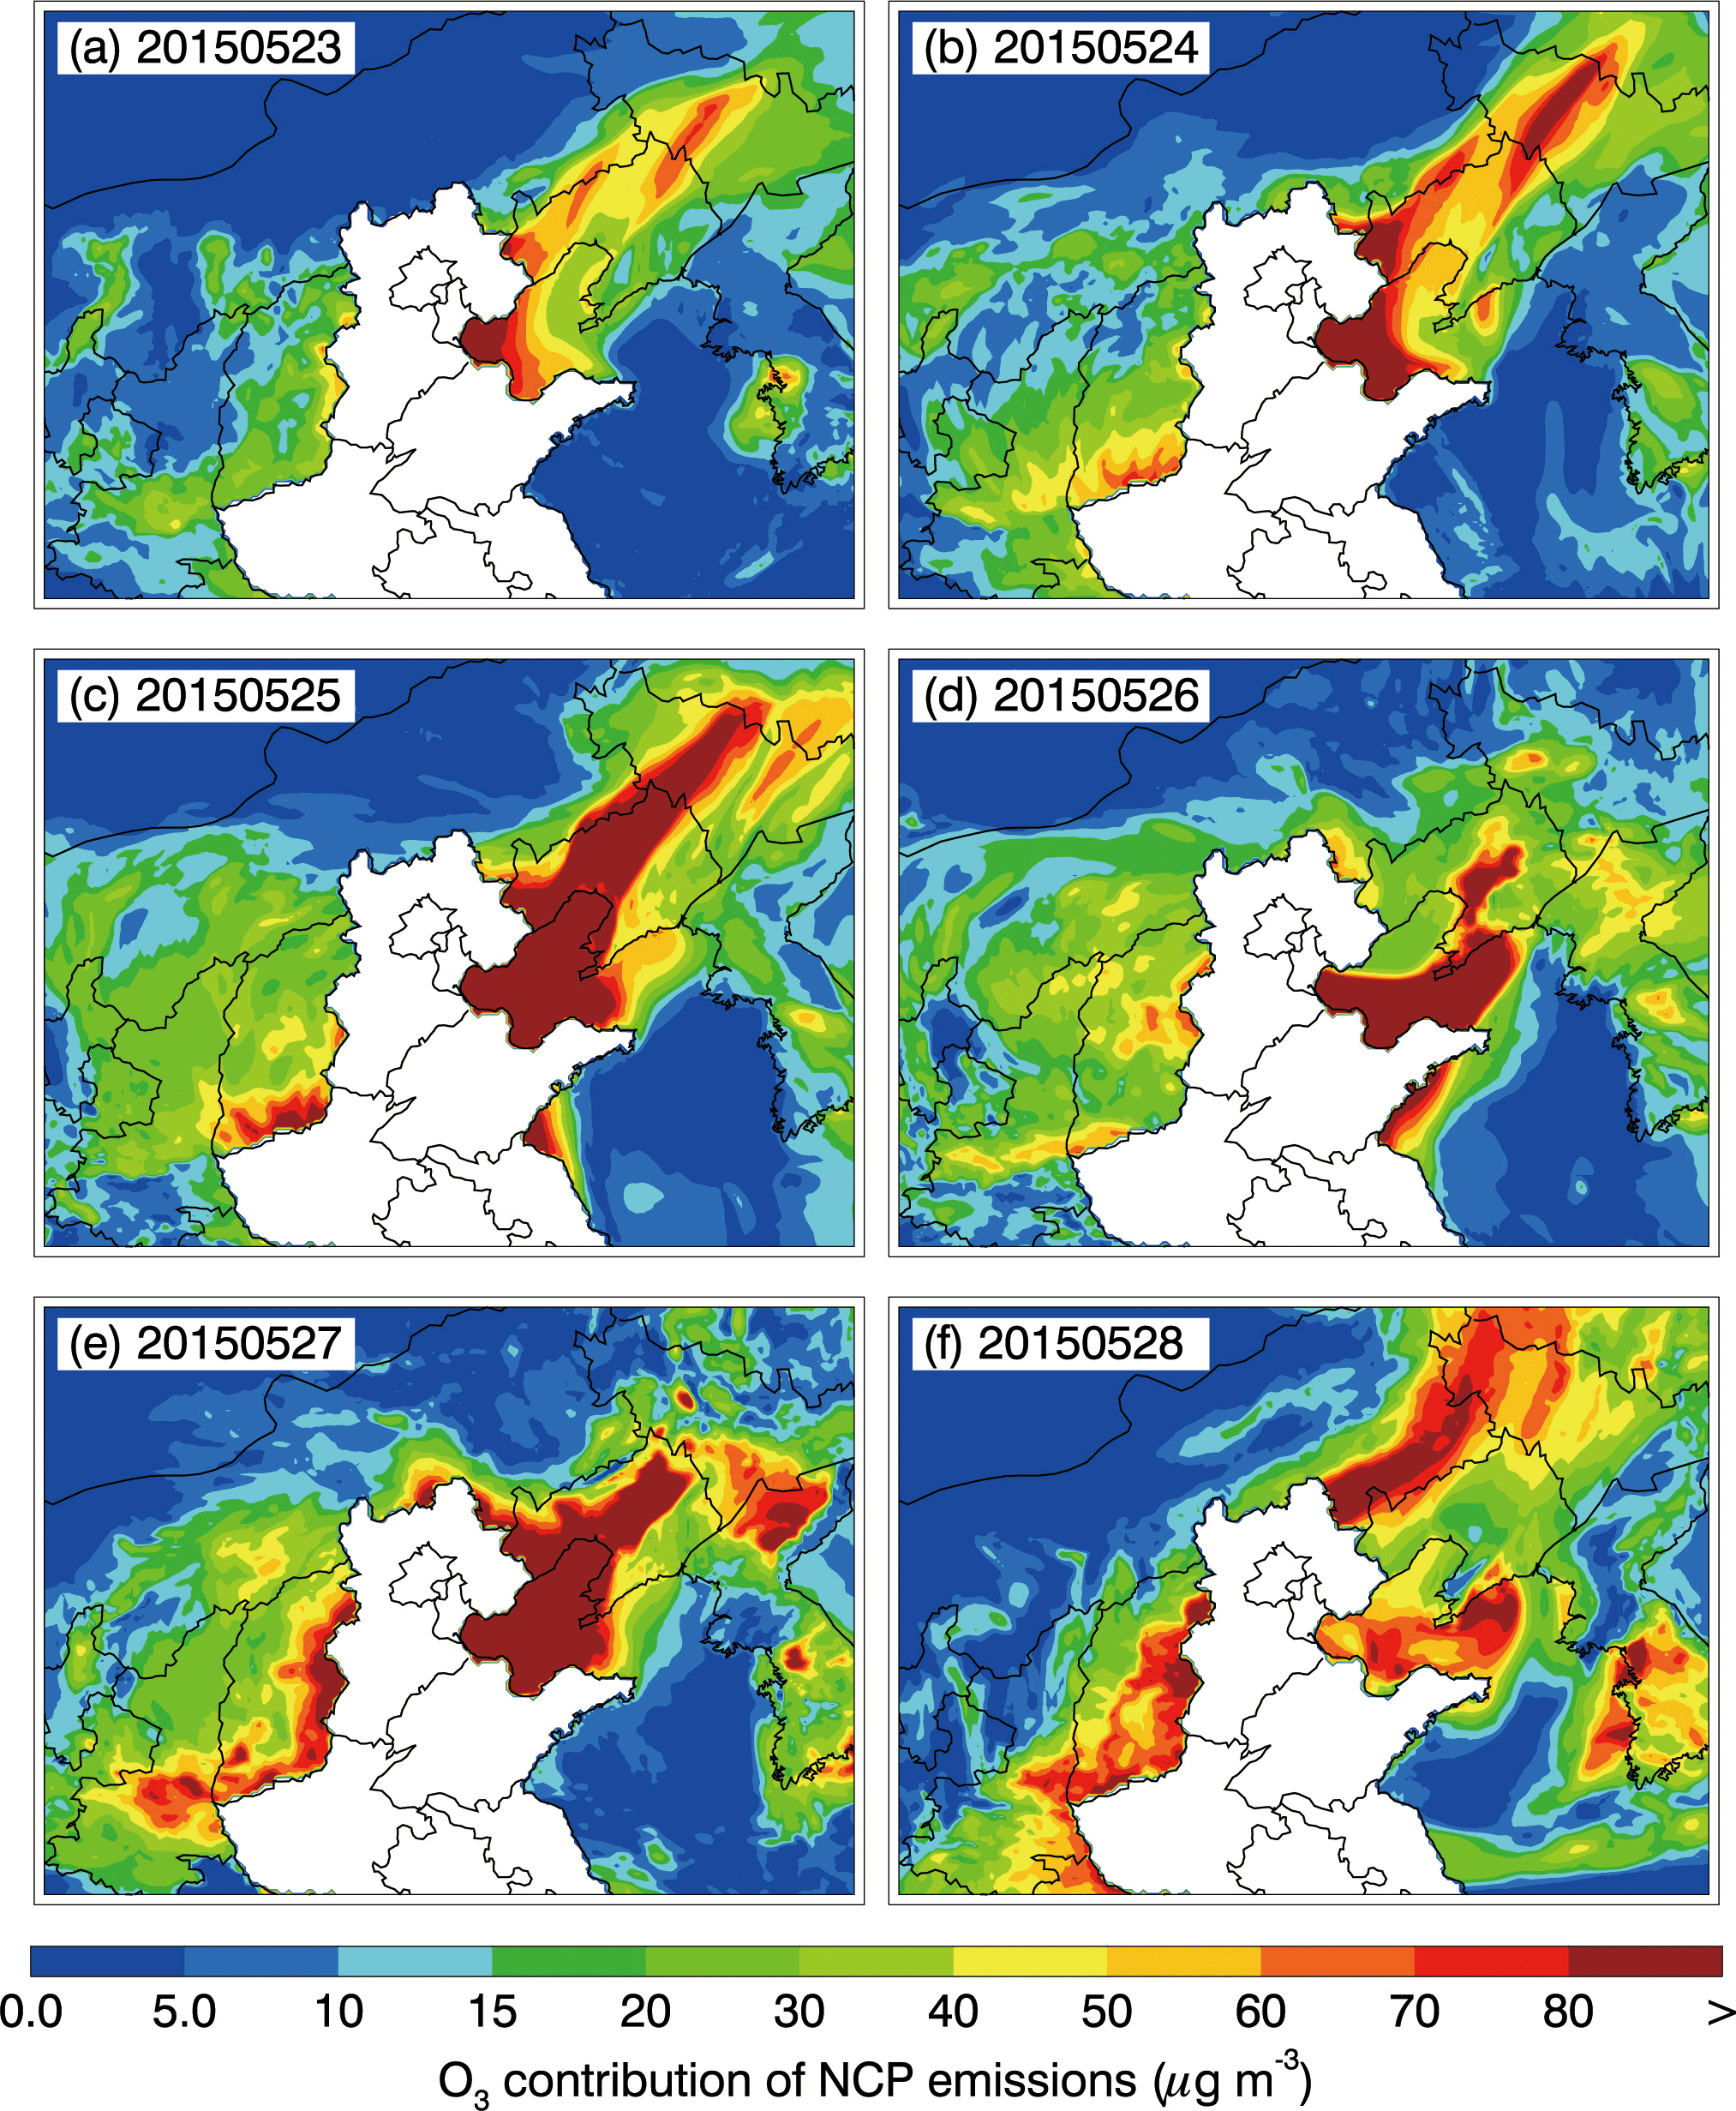
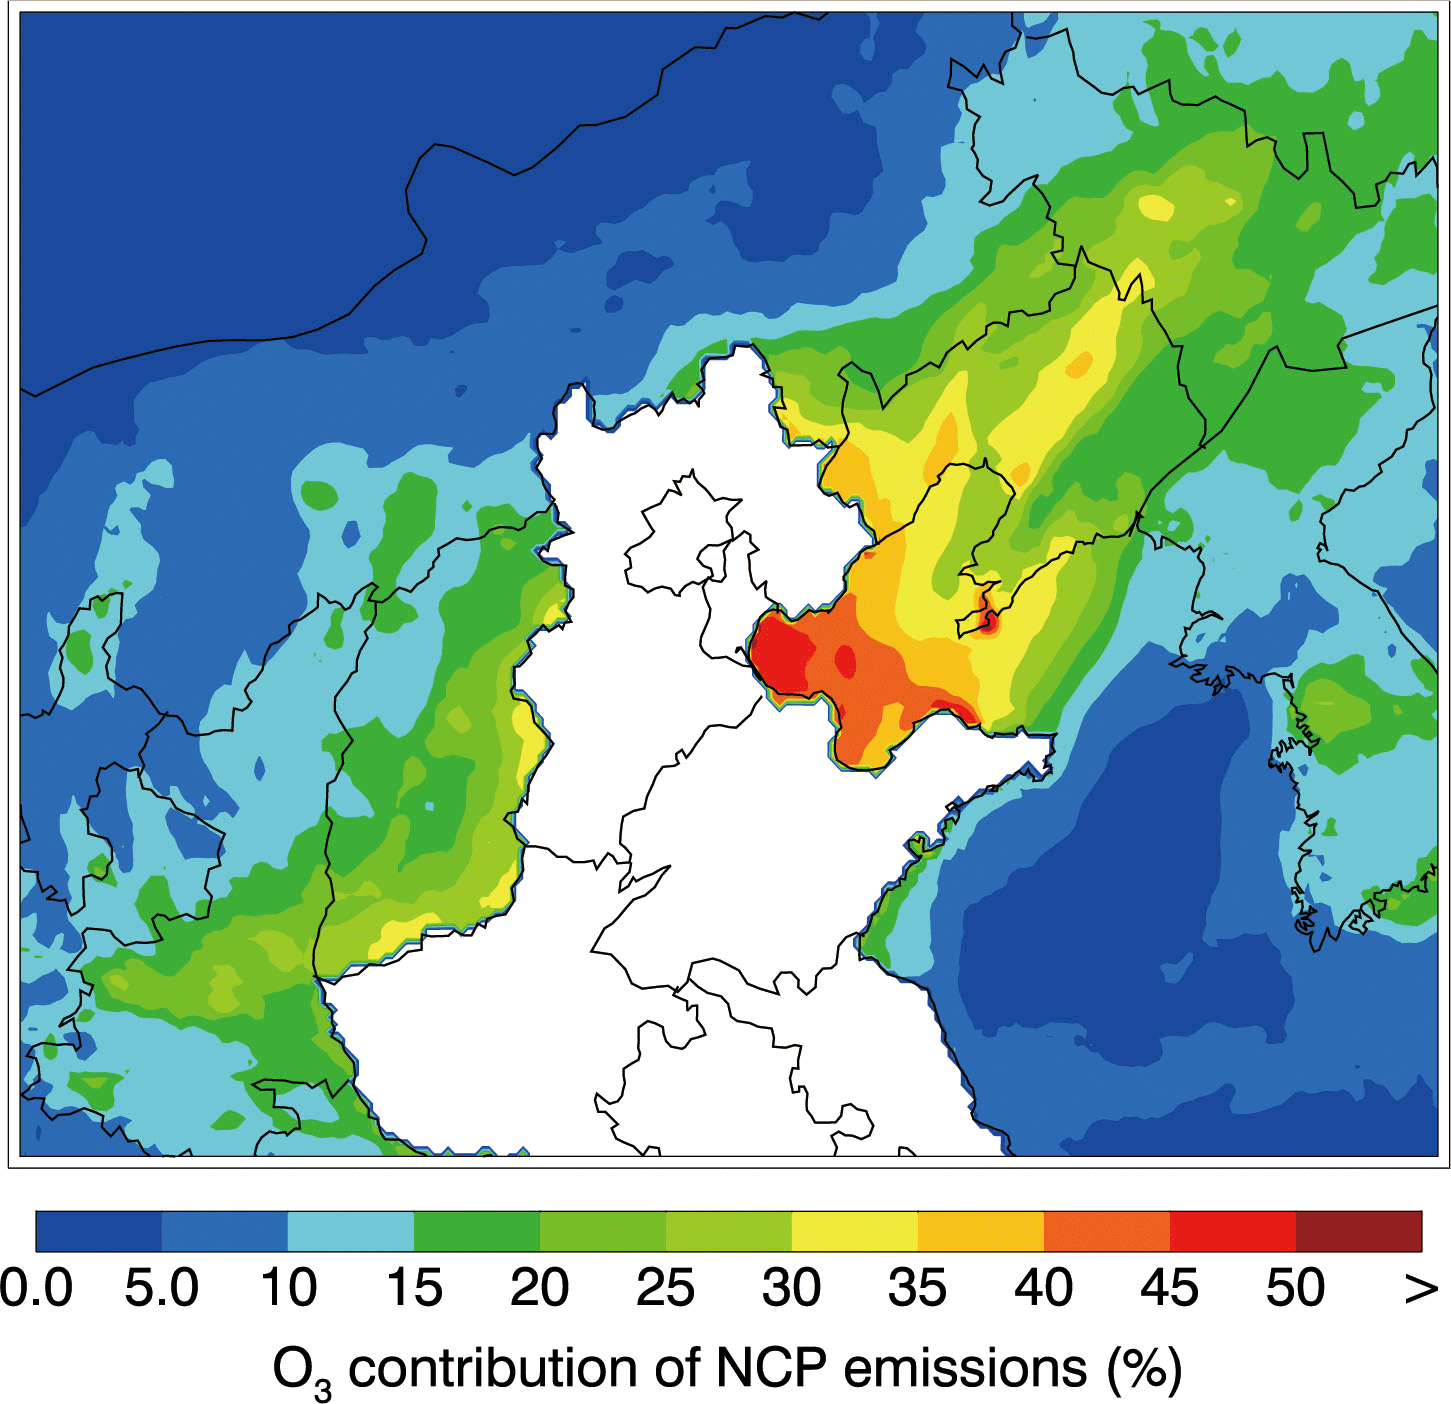
Figure 11 shows the simulated spatial distribution of the average afternoon O3 concentrations contributed by NCP emissions from 23 to 28 May 2015. Similar to the PM2.5 case, the contribution of NCP emissions to the O3 formation in Liaoning and Jilin province is increasingly enhanced during the episode (except on 26 May), and on 25 and 27 May, NCP emissions account for more than 70 µg m−3 of the O3 concentration in most areas of Liaoning. On 25 and 28 May, NCP emissions contribute more than 70 µg m−3 of the O3 concentration in some regions of Jilin. A lesser impact of NCP emissions on Jilin province on 26 May is due to the weakening of the low pressure. The NCP emissions play a progressively important role in O3 concentrations in Shanxi and Shaanxi provinces during the episode, especially on 27 and 28 May when the contribution can be up to 60 µg m−3. The impact of NCP emissions on O3 concentrations in Inner Mongolia is insignificant overall.
Table 3Daily afternoon (12:00–18:00 BJT) average O3 contributions (µg m−3) of NCP emissions in NEC and NWC from 22 to 28 May 2015.
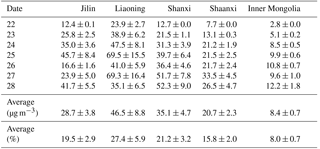
Table 3 summarizes the effects of NCP emissions on the average afternoon O3 concentration in NEC and NWC from 22 to 28 May 2015. During the episode, NCP emissions substantially influence the O3 level in Liaoning province, and the afternoon O3 contribution is about 46.5 µg m−3 on average, ranging from 23.9 to 69.5 µg m−3. The NCP emissions also contribute an average of 28.7 µg m−3 to the O3 concentration in Jilin province, varying from 12.4 to 45.7 µg m−3. The contribution of NCP emissions to Shanxi and Shanxi provinces becomes increasingly significant during the episode, with an average of 35.1 µg m−3 for Shanxi province and 20.7 µg m−3 for Shaanxi province, respectively. The O3 concentration in Inner Mongolia is less influenced by NCP emissions, with an average of 8.4 µg m−3. Figure 12 illustrates the episode-averaged afternoon O3 percentage contribution of NCP emissions to the surrounding areas. In NEC, NCP emissions account for 15–35 % of the afternoon O3 concentration in most areas of Liaoning province and 10–30 % in Jilin province. In NWC, NCP emissions contribute 10–35 % of the O3 concentration in Shanxi province and 10–25 % in Shaanxi. In Inner Mongolia, the impact of NCP emissions on O3 formation is small, generally less than 15 %, except in the southern area adjacent to the NCP and Liaoning province, where a contribution of more than 10 % is found. On average, NCP emissions distinctly increase the afternoon O3 concentrations in Liaoning, Jilin, Shanxi, Shaanxi, and Inner Mongolia, with average percentages of 27.4, 19.5, 21.2, 15.8, and 8.0 %, respectively (Table 3).
Additional sensitivity studies have also been performed to examine the potential influences of the cumulus parameterization on evaluation of the contribution of NCP emissions to the PM2.5 and O3 concentrations in NEC and NWC, in which the cumulus parameterization is turned off. The difference of the contribution of NCP emissions to the PM2.5 and O3 concentrations in NEC and NWC is less than 0.8 % between the simulations with and without the cumulus parameterization. Furthermore, it is worth noting that uncertainties from meteorological field simulations, emission inventories, and the chemical mechanism used in simulations have a large potential to influence the evaluation of the effect of NCP emissions on the PM2.5 and O3 concentrations in NEC and NWC (Carter and Atkinson, 1996; Lei et al., 2004; Song et al., 2010; Bei et al., 2017).
Analyses of the synoptic pattern during the ASM season show that the southeasterly–southwesterly winds prevail in northern China, facilitating the trans-boundary transport of air pollutants from the NCP to NEC and NWC. The good relationships of PM2.5 and O3 concentrations in the NCP with those in NEC and NWC during the ASM season also indicate the possibility that the air quality in NEC and NWC is influenced by the trans-boundary transport of air pollutants originated from the NCP.
A widespread and severe pollution episode from 22 to 28 May 2015 in northern China is further simulated using the WRF-CHEM model to investigate the impact of the trans-boundary transport of NCP emissions on PM2.5 and O3 concentrations in NEC and NWC, when the region is affected by prevailing southeasterly–southwesterly winds associated with the ASM.
In general, the WRF-CHEM model reproduces the temporal variations and spatial distributions of PM2.5, O3, and NO2 concentrations well compared to observations in northern China, although the model biases still exist due to the uncertainties in simulated meteorological fields and the emission inventory. The model also performs reasonably well in simulating the variations of aerosol constituents against the ACSM measurement at the NCNST site in Beijing.
The FSA is used to investigate the contribution of trans-boundary transport of NCP emissions to O3 and PM2.5 levels in NEC and NWC. Model results show that NCP emissions contribute approximately an average of 24.2 and 13.9 µg m−3 to the PM2.5 concentration in Liaoning and Shanxi during the episode, with average percentage contributions of 40.6 and 32.2 %, respectively. The NCP emissions enhance the PM2.5 level by 9.6 and 6.5 µg m−3 in Jilin and Shaanxi on average, with percentage contributions of 27.5 and 20.9 %, respectively. The NCP emissions also substantially influence the O3 concentration in NEC and NWC. The NCP emissions increase the afternoon (12:00–18:00 BJT) O3 concentration in Liaoning by 46.5 µg m−3 on average during the episode, followed by 35.1 µg m−3 in Shanxi, 28.7 µg m−3 in Jilin, and 20.7 µg m−3 in Shaanxi, with average percentage contributions of 27.4, 21.2, 19.5, and 15.8 %, respectively. In contrast, the contribution of the trans-boundary transport of NCP emissions to the PM2.5 and O3 concentration in Inner Mongolia is lower, with an average of 2.6 and 8.4 µg m−3, respectively. Our results demonstrate that when southerly winds are prevailing in northern China, air pollutants originated from the NCP are likely to be transported northwards and profoundly affect the air quality in NEC and NWC. Stringent control of NCP emissions not only mitigates local air pollution, but is also beneficial for the air quality in NEC and NWC during the ASM season.
It is worth noting that interactions between the air pollution in China and ASM are two-way and their relationships are complicated and interrelated, especially with regard to the aerosol–meteorology interaction. Aerosol impacts on meteorology are significant due to its direct and indirect effects, which further influence the air pollution conditions in the lower troposphere. The aerosol semi-direct effect induced by the light-absorbing aerosols in the atmosphere stabilizes the PBL and thus reduces the PBL height to exacerbate the accumulation of air pollutants within the PBL, particularly for the aging process of black carbon which considerably enhances light absorption (Wang et al., 2013; Khalizov et al., 2009; Peng et al., 2016). In addition, aerosol plays an important role in the process of cloud formation and precipitation via acting as cloud condensation nuclei (CCN) and ice nuclei (IC). Therefore, aerosol–cloud interactions modify temperature and moisture profiles and influence precipitation, leading to potential feedback on the atmospheric chemistry (Wang et al., 2011). In addition, the ASM substantially influences the spatial characteristics of the air pollutants' transport and distribution in eastern China on seasonal, interannual, and decadal scales (Wu et al., 2016). Further studies need to be performed to investigate the impacts of the ASM variation on the air pollutants' transport, which is modulated by climate changes.
Although the model performs well in simulating PM2.5, O3, and NO2 during the episode in northern China, the uncertainties from meteorological fields and the emission inventory still exist. Future studies need to be conducted to improve the WRF-CHEM model simulations and to further assess the contributions of the trans-boundary transport of NCP emissions under specific synoptic patterns, considering the rapid changes in anthropogenic emissions, which are not reflected in the present study. Therefore, more episode simulations during the ASM season should be performed to comprehensively evaluate the contribution of the trans-boundary transport of NCP emissions to the air quality in its downwind regions and support the design and implementation of effective emission control strategies.
The real-time O3 and PM2.5 observations are accessible for the public on the following website: http://106.37.208.233:20035/ (last access: 2 June 2018) (China MEP, 2013a). One can also access the historic profile of observed ambient pollutants by visiting http://www.aqistudy.cn/ (last access: 2 June 2018) (China MEP, 2013b).
The supplement related to this article is available online at: https://doi.org/10.5194/acp-18-8491-2018-supplement.
The authors declare that they have no conflict of interest.
This article is part of the special issue “Regional transport and transformation of air pollution in eastern China”. It is not associated with a conference.
This work is financially supported by the National Key R&D Plan
(Quantitative Relationship and Regulation Principle between Regional
Oxidation Capacity of Atmospheric and Air Quality (2017YFC0210000)). Naifang
Bei is supported by the National Natural Science Foundation of China (no.
41275101 and no. 41430424) and the Fundamental Research Funds for the
Central Universities of China. Guohui Li is supported by the Hundred Talents
Program of the Chinese Academy of Sciences and the National Natural Science
Foundation of China (no. 41661144020).
Edited by: Luisa Molina
Reviewed by: two anonymous referees
Bei, N., Lei, W., Zavala, M., and Molina, L. T.: Ozone predictabilities due to meteorological uncertainties in the Mexico City basin using ensemble forecasts, Atmos. Chem. Phys., 10, 6295–6309, https://doi.org/10.5194/acp-10-6295-2010, 2010.
Bei, N., Li, G., and Molina, L. T.: Uncertainties in SOA simulations due to meteorological uncertainties in Mexico City during MILAGRO-2006 field campaign, Atmos. Chem. Phys., 12, 11295–11308, https://doi.org/10.5194/acp-12-11295-2012, 2012.
Bei, N. F., Li, G. H., Zavala, M., Barrera, H., Torres, R., Grutter, M., Gutierrez, W., Garcia, M., Ruiz-Suarez, L. G., Ortinez, A., Guitierrez, Y., Alvarado, C., Flores, I., and Molina, L. T.: Meteorological overview and plume transport patterns during Cal-Mex 2010, Atmos. Environ., 70, 477–489, https://doi.org/10.1016/j.atmosenv.2012.01.065, 2013.
Bei, N., Wu, J., Elser, M., Feng, T., Cao, J., El-Haddad, I., Li, X., Huang, R., Li, Z., Long, X., Xing, L., Zhao, S., Tie, X., Prévôt, A. S. H., and Li, G.: Impacts of meteorological uncertainties on the haze formation in Beijing-Tianjin-Hebei (BTH) during wintertime: a case study, Atmos. Chem. Phys., 17, 14579–14591, https://doi.org/10.5194/acp-17-14579-2017, 2017.
Cao, J. J., Lee, S. C., Chow, J. C., Watson, J. G., Ho, K. F., Zhang, R. J., Jin, Z. D., Shen, Z. X., Chen, G. C., and Kang, Y. M.: Spatial and seasonal distributions of carbonaceous aerosols over China, J. Geophys. Res.-Atmos., 112, 22–11, 2007.
Cao, Z. Q., Sheng, L. F., Liu, Q., Yao, X. H., and Wang, W. C.: Interannual increase of regional haze-fog in North China Plain in summer by intensified easterly winds and orographic forcing, Atmos. Environ., 122, 154–162, https://doi.org/10.1016/j.atmosenv.2015.09.042, 2015.
Carter, W. P. L. and Atkinson, R.: Development and evaluation of a detailed mechanism for the atmospheric reactions of isoprene and NOx, Int. J. Chem. Kinet., 28, 497–530, 1996.
Chan, C. K. and Yao, X.: Air pollution in mega cities in China, Atmos. Environ., 42, 1–42, 2008.
Chen, F. and Dudhia, J.: Coupling an advanced land surface-hydrology model with the Penn State-NCAR MM5 modeling system. Part I: Model implementation and sensitivity, Mon. Weather Rev., 129, 569–585, https://doi.org/10.1175/1520-0493(2001)129<0569:caalsh>2.0.co;2, 2001.
Cheng, X. G., Zhao, T. L., Gong, S. L., Xu, X. D., Han, Y. X., Yin, Y., Tang, L. L., He, H. C., and He, J. H.: Implications of East Asian summer and winter monsoons for interannual aerosol variations over central-eastern China, Atmos. Environ., 129, 218–228, https://doi.org/10.1016/j.atmosenv.2016.01.037, 2016.
China MEP (Ministry of Environmental Protection, China): Air Quality Observation Real-time Release Platform of MEP Data Center, available at: http://106.37.208.233:20035/ (last access: 2 June 2018), 2013a.
China MEP (Ministry of Environmental Protection, China): Online Monitoring and Analysis Platform of China Air Quality, available at: http://www.aqistudy.cn/ (last access: 2 June 2018), 2013b.
Chou, M.-D. and Suarez, M. J.: A solar radiation parameterization for atmospheric studies, NASA Tech. Rep. NASA/TM-1999-10460, 15, 38 pp., 1999.
Chou, M.-D. and Suarez, M. J.: A thermal infrared radiation parameterization for atmospheric studies, NASA/TM-2001-104606, 19, 55 pp., 2001.
Ding, Y. H.: Summer monsoon rainfalls in china, J. Meteorol. Soc. Japan, 70, 373–396, 1992.
Ding, Y. H. and Chan, J. C. L.: The East Asian summer monsoon: an overview, Meteorol. Atmos. Phys., 89, 117–142, https://doi.org/10.1007/s00703-005-0125-z, 2005.
Feng, T., Bei, N., Huang, R.-J., Cao, J., Zhang, Q., Zhou, W., Tie, X., Liu, S., Zhang, T., Su, X., Lei, W., Molina, L. T., and Li, G.: Summertime ozone formation in Xi'an and surrounding areas, China, Atmos. Chem. Phys., 16, 4323–4342, https://doi.org/10.5194/acp-16-4323-2016, 2016.
Gabusi, V., Pisoni, E., and Volta, M.: Factor separation in air quality simulations, Ecol. Modell., 218, 383–392, https://doi.org/10.1016/j.ecolmodel.2008.07.030, 2008.
Gao, Y., Liu, X., Zhao, C., and Zhang, M.: Emission controls versus meteorological conditions in determining aerosol concentrations in Beijing during the 2008 Olympic Games, Atmos. Chem. Phys., 11, 12437–12451, https://doi.org/10.5194/acp-11-12437-2011, 2011.
Guenther, A., Karl, T., Harley, P., Wiedinmyer, C., Palmer, P. I., and Geron, C.: Estimates of global terrestrial isoprene emissions using MEGAN (Model of Emissions of Gases and Aerosols from Nature), Atmos. Chem. Phys., 6, 3181–3210, https://doi.org/10.5194/acp-6-3181-2006, 2006.
Guo, S., Hu, M., Zamora, M. L., Peng, J. F., Shang, D. J., Zheng, J., Du, Z. F., Wu, Z., Shao, M., Zeng, L. M., Molina, M. J., and Zhang, R. Y.: Elucidating severe urban haze formation in China, P. Natl. Acad. Sci. USA, 111, 17373–17378, https://doi.org/10.1073/pnas.1419604111, 2014.
Han, J. S., Moon, K. J., Lee, S. J., Kim, Y. J., Ryu, S. Y., Cliff, S. S., and Yi, S. M.: Size-resolved source apportionment of ambient particles by positive matrix factorization at Gosan background site in East Asia, Atmos. Chem. Phys., 6, 211–223, https://doi.org/10.5194/acp-6-211-2006, 2006.
He, K., Yang, F., Ma, Y., Zhang, Q., Yao, X., Chan, C. K., Cadle, S., Chan, T., and Mulawa, P.: The characteristics of PM2.5 in Beijing, China, Atmos. Environ., 35, 4959–4970, 2001.
Hong, S.-Y. and Lim, J.-O. J.: The WRF Single-Moment 6-Class Microphysics Scheme (WSM6), Asia-Pacific J. Atmos. Sci., 42, 129–151, 2006.
Horowitz, L. W., Walters, S., Mauzerall, D. L., Emmons, L. K., Rasch, P. J., Granier, C., Tie, X. X., Lamarque, J. F., Schultz, M. G., Tyndall, G. S., Orlando, J. J., and Brasseur, G. P.: A global simulation of tropospheric ozone and related tracers: Description and evaluation of MOZART, version 2, J. Geophys. Res.-Atmos., 108, 4784, https://doi.org/10.1029/2002jd002853, 2003.
Hu, J. L., Wang, Y. G., Ying, Q., and Zhang, H. L.: Spatial and temporal variability of PM2.5 and PM10 over the North China Plain and the Yangtze River Delta, China, Atmos. Environ., 95, 598–609, https://doi.org/10.1016/j.atmosenv.2014.07.019, 2014.
Huang, J., Liu, H., Crawford, J. H., Chan, C., Considine, D. B., Zhang, Y., Zheng, X., Zhao, C., Thouret, V., Oltmans, S. J., Liu, S. C., Jones, D. B. A., Steenrod, S. D., and Damon, M. R.: Origin of springtime ozone enhancements in the lower troposphere over Beijing: in situ measurements and model analysis, Atmos. Chem. Phys., 15, 5161–5179, https://doi.org/10.5194/acp-15-5161-2015, 2015.
Janjić, Z. I.: Nonsingular Implementation of the Mellor – Yamada Level 2.5 Scheme in the NCEP Meso Model, Ncep Office Note, 436, 2002.
Kain, J. S.: The Kain Fritsch Convective Parameterization: An Update, J. Appl. Meteorol., 43, 170–181, 2004.
Kang, I. S., Jin, K., Wang, B., Lau, K. M., Shukla, J., Krishnamurthy, V., Schubert, S. D., Wailser, D. E., Stern, W. F., Kitoh, A., Meehl, G. A., Kanamitsu, M., Galin, V. Y., Satyan, V., Park, C. K., and Liu, Y.: Intercomparison of the climatological variations of Asian summer monsoon precipitation simulated by 10 GCMs, Clim. Dynam., 19, 383–395, https://doi.org/10.1007/s00382-002-0245-9, 2002.
Khalizov, A. F., Xue, H. X., Wang, L., Zheng, J., and Zhang, R. Y.: Enhanced Light Absorption and Scattering by Carbon Soot Aerosol Internally Mixed with Sulfuric Acid, J. Phys. Chem. A, 113, 1066–1074, https://doi.org/10.1021/jp807531n, 2009.
Kulmala, M., Laaksonen, A., and Pirjola, L.: Parameterizations for sulfuric acid/water nucleation rates, J. Geophys. Res., 103, 8301–8307, 1998.
Kurokawa, J., Ohara, T., Morikawa, T., Hanayama, S., Janssens-Maenhout, G., Fukui, T., Kawashima, K., and Akimoto, H.: Emissions of air pollutants and greenhouse gases over Asian regions during 2000–2008: Regional Emission inventory in ASia (REAS) version 2, Atmos. Chem. Phys., 13, 11019–11058, https://doi.org/10.5194/acp-13-11019-2013, 2013.
Lau, K. M.: East-asian summer monsoon rainfall variability and climate teleconnection, J. Meteorol. Soc. Japan, 70, 211–242, 1992.
Lau, K. M., Yang, G. J., and Shen, S. H.: Seasonal and intraseasonal climatology of summer monsoon rainfall over East-Asia, Mon. Weather Rev., 116, 18–37, https://doi.org/10.1175/1520-0493(1988)116<0018:saicos>2.0.co;2, 1988.
Lei, W., Zhang, R., Tie, X., and Hess, P.: Chemical characterization of ozone formation in the Houston-Galveston area: A chemical transport model study, J. Geophys. Res.-Atmos., 109, D12301, https://doi.org/10.1029/2003JD004219, 2004.
Li, G., Lei, W., Zavala, M., Volkamer, R., Dusanter, S., Stevens, P., and Molina, L. T.: Impacts of HONO sources on the photochemistry in Mexico City during the MCMA-2006/MILAGO Campaign, Atmos. Chem. Phys., 10, 6551–6567, https://doi.org/10.5194/acp-10-6551-2010, 2010.
Li, G., Bei, N., Tie, X., and Molina, L. T.: Aerosol effects on the photochemistry in Mexico City during MCMA-2006/MILAGRO campaign, Atmos. Chem. Phys., 11, 5169–5182, https://doi.org/10.5194/acp-11-5169-2011, 2011a.
Li, G., Zavala, M., Lei, W., Tsimpidi, A. P., Karydis, V. A., Pandis, S. N., Canagaratna, M. R., and Molina, L. T.: Simulations of organic aerosol concentrations in Mexico City using the WRF-CHEM model during the MCMA-2006/MILAGRO campaign, Atmos. Chem. Phys., 11, 3789–3809, https://doi.org/10.5194/acp-11-3789-2011, 2011b.
Li, G., Lei, W., Bei, N., and Molina, L. T.: Contribution of garbage burning to chloride and PM2.5 in Mexico City, Atmos. Chem. Phys., 12, 8751–8761, https://doi.org/10.5194/acp-12-8751-2012, 2012.
Li, G. H., Bei, N. F., Zavala, M., and Molina, L. T.: Ozone formation along the California Mexican border region during Cal-Mex 2010 field campaign, Atmos. Environ., 88, 370–389, https://doi.org/10.1016/j.atmosenv.2013.11.067, 2014.
Li, G., Bei, N., Cao, J., Huang, R., Wu, J., Feng, T., Wang, Y., Liu, S., Zhang, Q., Tie, X., and Molina, L. T.: A possible pathway for rapid growth of sulfate during haze days in China, Atmos. Chem. Phys., 17, 3301–3316, https://doi.org/10.5194/acp-17-3301-2017, 2017a.
Li, G., Bei, N., Cao, J., Wu, J., Long, X., Feng, T., Dai, W., Liu, S., Zhang, Q., and Tie, X.: Widespread and persistent ozone pollution in eastern China during the non-winter season of 2015: observations and source attributions, Atmos. Chem. Phys., 17, 2759–2774, https://doi.org/10.5194/acp-17-2759-2017, 2017b.
Li, H., Zhang, Q., Zhang, Q., Chen, C., Wang, L., Wei, Z., Zhou, S., Parworth, C., Zheng, B., Canonaco, F., Prévôt, A. S. H., Chen, P., Zhang, H., Wallington, T. J., and He, K.: Wintertime aerosol chemistry and haze evolution in an extremely polluted city of the North China Plain: significant contribution from coal and biomass combustion, Atmos. Chem. Phys., 17, 4751–4768, https://doi.org/10.5194/acp-17-4751-2017, 2017.
Li, J., Xie, S. D., Zeng, L. M., Li, L. Y., Li, Y. Q., and Wu, R. R.: Characterization of ambient volatile organic compounds and their sources in Beijing, before, during, and after Asia-Pacific Economic Cooperation China 2014, Atmos. Chem. Phys., 15, 7945–7959, https://doi.org/10.5194/acp-15-7945-2015, 2015.
Li, Z. Q., Lau, W. K. M., Ramanathan, V., Wu, G., Ding, Y., Manoj, M. G., Liu, J., Qian, Y., Li, J., Zhou, T., Fan, J., Rosenfeld, D., Ming, Y., Wang, Y., Huang, J., Wang, B., Xu, X., Lee, S. S., Cribb, M., Zhang, F., Yang, X., Zhao, C., Takemura, T., Wang, K., Xia, X., Yin, Y., Zhang, H., Guo, J., Zhai, P. M., Sugimoto, N., Babu, S. S., and Brasseur, G. P.: Aerosol and monsoon climate interactions over Asia, Rev. Geophys., 54, 866–929, https://doi.org/10.1002/2015rg000500, 2016.
Liu, Z., Wang, Y., Gu, D., Zhao, C., Huey, L. G., Stickel, R., Liao, J., Shao, M., Zhu, T., Zeng, L., Amoroso, A., Costabile, F., Chang, C.-C., and Liu, S.-C.: Summertime photochemistry during CAREBeijing-2007: ROx budgets and O3 formation, Atmos. Chem. Phys., 12, 7737–7752, https://doi.org/10.5194/acp-12-7737-2012, 2012.
Long, X., Tie, X., Cao, J., Huang, R., Feng, T., Li, N., Zhao, S., Tian, J., Li, G., and Zhang, Q.: Impact of crop field burning and mountains on heavy haze in the North China Plain: a case study, Atmos. Chem. Phys., 16, 9675–9691, https://doi.org/10.5194/acp-16-9675-2016, 2016.
Ma, Z., Xu, J., Quan, W., Zhang, Z., Lin, W., and Xu, X.: Significant increase of surface ozone at a rural site, north of eastern China, Atmos. Chem. Phys., 16, 3969–3977, https://doi.org/10.5194/acp-16-3969-2016, 2016.
Nenes, A., Pandis, S. N., and Pilinis, C.: ISORROPIA: A new thermodynamic equilibrium model for multiphase multicomponent inorganic aerosols, Aqua. Geochem., 4, 123–152, https://doi.org/10.1023/a:1009604003981, 1998.
Parrish, D. D. and Zhu, T.: Clean Air for Megacities, Science, 326, 674–675, https://doi.org/10.1126/science.1176064, 2009.
Peng, J. F., Hu, M., Guo, S., Du, Z. F., Zheng, J., Shang, D. J., Zamora, M. L., Zeng, L. M., Shao, M., Wu, Y. S., Zheng, J., Wang, Y., Glen, C. R., Collins, D. R., Molina, M. J., and Zhang, R. Y.: Markedly enhanced absorption and direct radiative forcing of black carbon under polluted urban environments, P. Natl. Acad. Sci. USA, 113, 4266–4271, https://doi.org/10.1073/pnas.1602310113, 2016.
Pu, W. W., Zhao, X. J., Shi, X. F., Ma, Z. Q., Zhang, X. L., and Yu, B.: Impact of long-range transport on aerosol properties at a regional background station in Northern China, Atmos. Res., 153, 489–499, https://doi.org/10.1016/j.atmosres.2014.10.010, 2015.
Qiu, C. and Zhang, R. Y.: Multiphase chemistry of atmospheric amines, Phys. Chem. Chem. Phys., 15, 5738–5752, https://doi.org/10.1039/c3cp43446j, 2013.
Seinfeld, J. H. and Pandis, S. N.: Atmospheric Chemistry and Physics: From Air Pollution to Climate Change, 2nd Edn., John Wiley & Sons Inc., New York, 2006.
Song, J., Lei, W., Bei, N., Zavala, M., de Foy, B., Volkamer, R., Cardenas, B., Zheng, J., Zhang, R., and Molina, L. T.: Ozone response to emission changes: a modeling study during the MCMA-2006/MILAGRO Campaign, Atmos. Chem. Phys., 10, 3827–3846, https://doi.org/10.5194/acp-10-3827-2010, 2010.
Stein, U. and Alpert, P.: Factor separation in numerical simulations, J. Atmos. Sci., 50, 2107–2115, https://doi.org/10.1175/1520-0469(1993)050<2107:fsins>2.0.co;2, 1993.
Sun, Y. L., Zhuang, G. S., Tang, A. H., Wang, Y., and An, Z. S.: Chemical characteristics of PM2.5 and PM10 in haze-fog episodes in Beijing, Environ. Sci. Technology, 40, 3148–3155, https://doi.org/10.1021/es051533g, 2006.
Sun, Y., Jiang, Q., Xu, Y., Ma, Y., Zhang, Y., Liu, X., Li, W., Wang, F., Li, J., and Wang, P.: Aerosol characterization over the North China Plain: Haze life cycle and biomass burning impacts in summer, J. Geophys. Res.-Atmos., 121, 2508–2521, https://doi.org/10.1002/2015JD024261, 2016.
Tang, G., Wang, Y., Li, X., Ji, D., Hsu, S., and Gao, X.: Spatial-temporal variations in surface ozone in Northern China as observed during 2009–2010 and possible implications for future air quality control strategies, Atmos. Chem. Phys., 12, 2757–2776, https://doi.org/10.5194/acp-12-2757-2012, 2012.
Wang, G., Zhang, R., Gomez, M. E., Yang, L., Zamora, M. L., Hu, M., Lin, Y., Peng, J., Guo, S., and Meng, J.: Persistent sulfate formation from London Fog to Chinese haze, P. Natl. Acad. Sci. USA, 113, 13630–13635, 2016.
Wang, Y., Wan, Q., Meng, W., Liao, F., Tan, H., and Zhang, R.: Long-term impacts of aerosols on precipitation and lightning over the Pearl River Delta megacity area in China, Atmos. Chem. Phys., 11, 12421–12436, https://doi.org/10.5194/acp-11-12421-2011, 2011.
Wang, Y., Khalizov, A., Levy, M., and Zhang, R. Y.: New Directions: Light absorbing aerosols and their atmospheric impacts, Atmos. Environ., 81, 713–715, https://doi.org/10.1016/j.atmosenv.2013.09.034, 2013.
Wang, Z. S., Zhang, D. W., Li, Y. T., Dong, X., Sun, R. W., and Sun, N. D.: Different air pollution situations of O3 and PM2.5 during summer in Beijing, Environ. Sci., 37, 807–815, https://doi.org/10.13227/j.hjkx.2016.03.004, 2016.
Weinhold, B.: Ozone nation – EPA standard panned by the people, Environmental Health Perspectives, 116, A302–A305, 2008.
Wu, G. X., Li, Z. Q., Fu, C. B., Zhang, X. Y., Zhang, R. Y., Zhang, R. H., Zhou, T. J., Li, J. P., Li, J. D., Zhou, D. G., Wu, L., Zhou, L. T., He, B., and Huang, R. H.: Advances in studying interactions between aerosols and monsoon in China, Sci. China-Earth Sci., 59, 1–16, https://doi.org/10.1007/s11430-015-5198-z, 2016.
Wu, J., Li, G., Cao, J., Bei, N., Wang, Y., Feng, T., Huang, R., Liu, S., Zhang, Q., and Tie, X.: Contributions of trans-boundary transport to summertime air quality in Beijing, China, Atmos. Chem. Phys., 17, 2035–2051, https://doi.org/10.5194/acp-17-2035-2017, 2017.
Xu, J., Zhang, X. L., Xu, X. F., Zhao, X. J., Meng, W., and Pu, W. W.: Measurement of surface ozone and its precursors in urban and rural sites in Beijing, in: Second International Conference on Mining Engineering and Metallurgical Technology, edited by: Zhu, R., Procedia Earth and Plantetary Science, Elsevier Science Bv, Amsterdam, 255–261, 2011.
Zhang, L., Liao, H., and Li, J. P.: Impacts of Asian summer monsoon on seasonal and interannual variations of aerosols over eastern China, J. Geophys. Res.-Atmos., 115, D00k05, https://doi.org/10.1029/2009jd012299, 2010.
Zhang, Q. Y., Tao, S. Y., and Chen, L. T.: The inter-annual variability of East Asian summer monsoon indices and its association with the pattern of general circulation over East Asia (in Chinese), Acta Meteorol. Sin., 61, 559–568, 2003.
Zhang, Q., Streets, D. G., Carmichael, G. R., He, K. B., Huo, H., Kannari, A., Klimont, Z., Park, I. S., Reddy, S., Fu, J. S., Chen, D., Duan, L., Lei, Y., Wang, L. T., and Yao, Z. L.: Asian emissions in 2006 for the NASA INTEX-B mission, Atmos. Chem. Phys., 9, 5131–5153, https://doi.org/10.5194/acp-9-5131-2009, 2009.
Zhang, R., Khalizova, A. F., Wang, L., Hu, M., and Xu, W.: Nucleation and growth of nanoparticles in the atmosphere, Chem. Rev., 112, 1957–2011, 2012.
Zhang, R., Jing, J., Tao, J., Hsu, S.-C., Wang, G., Cao, J., Lee, C. S. L., Zhu, L., Chen, Z., Zhao, Y., and Shen, Z.: Chemical characterization and source apportionment of PM2.5 in Beijing: seasonal perspective, Atmos. Chem. Phys., 13, 7053–7074, https://doi.org/10.5194/acp-13-7053-2013, 2013.
Zhang, R. Y., Wang, G. H., Guo, S., Zarnora, M. L., Ying, Q., Lin, Y., Wang, W. G., Hu, M., and Wang, Y.: Formation of Urban Fine Particulate Matter, Chem. Rev., 115, 3803–3855, 10.1021/acs.chemrev.5b00067, 2015.
Zhao, C., Wang, Y. H., Yang, Q., Fu, R., Cunnold, D., and Choi, Y.: Impact of East Asian summer monsoon on the air quality over China: View from space, J. Geophys. Res.-Atmos., 115, D09301, https://doi.org/10.1029/2009jd012745, 2010.
Zhao, J., Levitt, N. P., Zhang, R. Y., and Chen, J. M.: Heterogeneous reactions of methylglyoxal in acidic media: implications for secondary organic aerosol formation, Environ. Sci. Technol., 40, 7682–7687, 2006.
Zhao, X. J., Zhao, P. S., Xu, J., Meng,, W., Pu, W. W., Dong, F., He, D., and Shi, Q. F.: Analysis of a winter regional haze event and its formation mechanism in the North China Plain, Atmos. Chem. Phys., 13, 5685–5696, https://doi.org/10.5194/acp-13-5685-2013, 2013.
Zhu, B., Akimoto, H., Wang, Z., Sudo, K., Tang, J., and Uno, I.: Why does surface ozone peak in summertime at Waliguan?, Geophys. Res. Lett., 31, L17104, https://doi.org/10.1029/2004gl020609, 2004.
Zhu, J. L., Liao, H., and Li, J. P.: Increases in aerosol concentrations over eastern China due to the decadal-scale weakening of the East Asian summer monsoon, Geophys. Res. Lett., 39, L09809, https://doi.org/10.1029/2012gl051428, 2012.
Zhuang, X. L., Wang, Y. S., He, H., Liu, J. G., Wang, X. M., Zhu, T. Y., Ge, M. F., Zhou, J., Tang, G. Q., and Ma, J. Z.: Haze insights and mitigation in China: An overview, J. Environ. Sci., 26, 2–12, https://doi.org/10.1016/s1001-0742(13)60376-9, 2014.