the Creative Commons Attribution 4.0 License.
the Creative Commons Attribution 4.0 License.
 | 28 May 2018
Identification of secondary aerosol precursors emitted by an aircraft turbofan
Doğuşhan Kılıç
Benjamin T. Brem
Emily Bruns
Carlo Bozetti
Joel Corbin
Lukas Durdina
Ru-Jin Huang
Jianhui Jiang
Felix Klein
Avi Lavi
Simone M. Pieber
Theo Rindlisbacher
Yinon Rudich
Jay G. Slowik
Jing Wang
Urs Baltensperger
Andre S. H. Prévôt
Oxidative processing of aircraft turbine-engine exhausts was studied using a potential aerosol mass (PAM) chamber at different engine loads corresponding to typical flight operations. Measurements were conducted at an engine test cell. Organic gases (OGs) and particle emissions pre- and post-PAM were measured. A suite of instruments, including a proton-transfer-reaction mass spectrometer (PTR-MS) for OGs, a multigas analyzer for CO, CO2, NOx, and an aerosol mass spectrometer (AMS) for nonrefractory particulate matter (NR-PM1) were used. Total aerosol mass was dominated by secondary aerosol formation, which was approximately 2 orders of magnitude higher than the primary aerosol. The chemical composition of both gaseous and particle emissions were also monitored at different engine loads and were thrust-dependent. At idling load (thrust 2.5–7 %), more than 90 % of the secondary particle mass was organic and could mostly be explained by the oxidation of gaseous aromatic species, e.g., benzene; toluene; xylenes; tri-, tetra-, and pentamethyl-benzene; and naphthalene. The oxygenated-aromatics, e.g., phenol, furans, were also included in this aromatic fraction and their oxidation could alone explain up to 25 % of the secondary organic particle mass at idling loads. The organic fraction decreased with thrust level, while the inorganic fraction increased. At an approximated cruise load sulfates comprised 85 % of the total secondary particle mass.
- Article
(2323 KB) - Full-text XML
-
Supplement
(149 KB) - BibTeX
- EndNote


Airport activities emit both particulate and gaseous emissions (Unal et al., 2005; Hudda et al., 2014) and are a significant source of local gas- and particle-phase pollutants (Westerdahl et al., 2008). These emissions affect public health (Lin et al., 2008) and local air quality by increasing pollutant concentrations, e.g., ultrafine particulate matter (PM) number concentrations, at the surrounding residential areas (Hudda and Fruin, 2016; Hudda et al., 2016).
The dominant source of airport aerosol is aircraft engine exhausts (Kim, 2009) and is classified as either directly emitted primary aerosol (PA) or secondary aerosol (SA). Due to the high combustion efficiency, PA from aircraft engines contains mainly black carbon (BC), whereas SA is formed by the oxidation of emitted precursor gases. PA and SA precursor emissions such as nonmethane organic gases (NMOGs) strongly depend on aircraft engine operating conditions (Kinsey et al., 2010), e.g., the BC emission index (EI, g kg−1 fuel) of a gas-turbine engine is usually higher at cruise climb-out and take-off loads (above 60 % of the maximum thrust) than at lower loads used at idle, taxi (7 %) and approach (30 %) (Liati et al., 2014; Brem et al., 2015). In contrast to BC, NMOG emissions, including aromatic hydrocarbons (HCs), aliphatic hydrocarbons and carbonyls, are clearly highest at low loads (Spicer et al., 1994; Slemr et al., 2001; Anderson et al., 2006; Herndon et al., 2006; Kilic et al., 2017).
Aging of fossil fuel combustion exhaust leads to SA to PA ratios higher than 1. Single-ring aromatics are traditionally thought to be the most important secondary organic aerosol (SOA) precursors from combustion emissions. While this has been shown to be the case for some emissions, e.g., from two-stroke engines (Platt et al., 2014), in other cases nontraditional precursors were assessed to be responsible for the bulk of the SOA mass formed, e.g., for biomass smoke (Bruns et al., 2016) or on-road vehicles (Platt et al., 2013, 2017; Pieber et al., 2017). Similar to these emissions, aging of aircraft emissions studied by Miracolo et al. (2011, 2012) in a smog chamber produced substantial amounts of secondary PM exceeding primary PM emissions severalfold. The authors showed the dominance of secondary organic aerosol at low loads, while at high loads sulfate was the main SA produced. While single-ring aromatic compounds determined using gas chromatography or mass spectrometry seemed to be important precursors of the SOA formed, a greater part of SOA was believed to originate from nontraditional precursors, whose nature remains to be identified (Miracolo et al., 2011, 2012).
In this study, we measured the SA production potential of aircraft jet engine exhaust as a function of engine load and examined the bulk gas-phase organic emissions and their SOA formation potential. SOA was produced by OH-initiated oxidation of aircraft NMOG emissions in a potential aerosol mass (PAM) flow reactor (Kang et al., 2007). Primary and secondary PM mass was characterized for different engine loads, using an aerosol mass spectrometer (AMS). SOA precursors were analyzed in real time by a proton-transfer-reaction mass spectrometer (PTR-MS) and SOA closure was examined under different conditions. The impact of these emissions and their SOA potential in typical urban atmospheres, at the proximity of airports is assessed and compared to other mobile sources.
2.1 Experimental setup
Exhaust measurements were conducted to characterize NMOG and nonrefractory submicron particulate mass (NR-PM1) emissions from an in-production CFM56 variant turbofan in the test cell of SR Technics at Zurich Airport. The test engine was fueled with standard JET A-1 fuel (see Table S1 in the Supplement for specifications) and was operated at several engine loads, selected to represent aircraft activities during a typical landing–take-off (LTO) cycle. Engine loads were set by specifying the combustion chamber inlet temperature values which correlate with a specific thrust (lbf) at standard atmospheric conditions. The selected loads included idle-taxi (3–7 % of the maximum thrust), approach (30 % of the maximum thrust), and an approximated cruise load (50–65 % of the maximum static thrust). After starting the engine, a warm-up sequence of 25 min ran before each test, consisting of 5 min long steps at thrusts of 5, 15, 7, 65, and 85 % in sequence (Table 1).
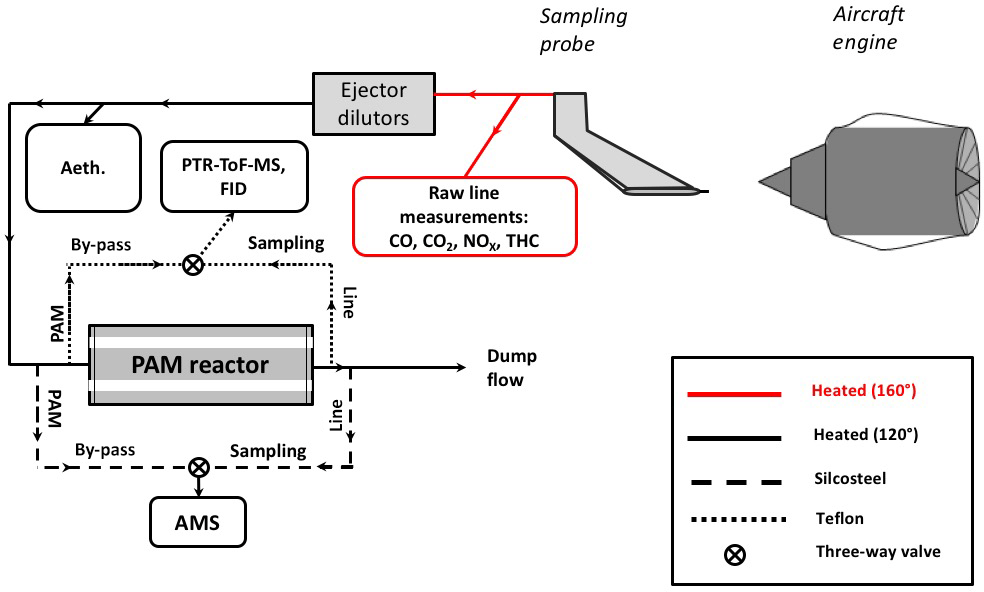
A simplified scheme of the experimental setup is shown in Fig. 1 and is discussed in detail elsewhere (Kilic et al., 2017). Details about the sampling system for nonvolatile particle emissions can be found in Durdina et al. (2017) and Brem et al. (2015). The turbine engine exhaust was sampled by a single-point probe with an inner diameter of 8 mm, located 0.7 m downstream of the engine exit plane. At this sampling location, the lubricant oil contribution to the exhaust is expected to be minimal (only due to leaking hydrodynamic seals at startup and idle) compared to the runway measurements, since the engine design studied does not vent lubricant oil through its core (where the probe was sampling). The exhaust drawn by the probe was directed through a heated (160 ∘C) transfer line to three different lines: (i) the raw gas line, (ii) diluted emissions line, and (iii) diluted aged emissions line. CO, CO2, and NOx were measured by a multigas analyzer (PG250, Horiba Inc.) installed on the raw line. On the diluted line, primary gas and particle measurements were performed. Two ejector dilutors (DEKATI DI-1000) were installed in sequence on this transfer line; after the first dilution, sampling lines were heated to 120 ∘C. The sample was diluted with synthetic air (99.999 % purity) either by a factor of 10 or 100, depending on the NMOG concentration. The NMOGs were quantified and characterized by a proton-transfer-reaction time-of-flight mass spectrometer (PTR-ToF-MS) together with a flame ionization hydrocarbon detector (FID) (APHA 370 THC Monitor). The concentration of equivalent BC (eBC) was determined by a seven-wavelength Aethalometer (Drinovec et al., 2015) based on optical absorption.
Aging of the engine exhaust emissions was achieved by using a PAM chamber with a continuous flow of 7.6 L min−1 and a volume of 13.3 L. Two mercury lamps (emission lines at wavelengths λ=182–254 nm, BHK Inc.), mounted inside the PAM, were used to irradiate nitrous acid (HONO) and O2 required for hydroxyl radical (OH) formation. Different time-integrated OH exposures (molecules cm−3 h) were achieved by modulating UV lamp intensity, e.g., 80, 90, 100 %. HONO to boost OH concentrations, and D9-butanol to trace OH exposure (Barmet et al., 2012), were injected with flows of 1.8 and 0.4 L min−1, respectively. Further, the PAM was also humidified (∼ 20 % relative humidity) by injecting synthetic air with water vapor (with a flow of 1.6 L min−1). All measurements were conducted at 295–298 K. Secondary aerosol formation was measured after the PAM, while the primary emissions were measured from the bypass line.
Aging in a PAM is not completely analogous to that in a smog chamber, due to higher oxidant concentrations. However, intercomparison studies suggest that the amount of SOA production and its bulk elemental composition are comparable for both single precursors (e.g., α-pinene) (Lambe et al., 2015) and complex emissions (e.g., wood combustion) (Bruns et al., 2015). In addition, in both the PAM and chambers, the dominant oxidation pathways are similar to those in ambient air (Peng et al., 2015, 2016).
2.2 Instrumentation
2.2.1 PTR-ToF-MS
NMOGs having a higher proton affinity than water were quantified by a PTR-ToF-MS (PTR-TOF 8000, Ionicon Analytik GmbH, Innsbruck, Austria) (Jordan et al., 2009). NMOG molecules were positively charged in the ionization unit (drift tube) of the instrument via hydronium ions (H3O+), and the generated ions and fragments were measured by a time-of-flight mass spectrometer. The PTR-ToF-MS utilized a drift voltage (Udrift) of 550 V, a drift chamber temperature (Tdrift) of 60 ∘C and a drift pressure (pdrift) of 2.2 mbar, maintaining a reduced electric field (E∕N) of ∼ 120 Townsends (Td). Data were collected with 1 s time resolution.
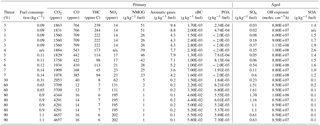
Table 1Volume mixing ratios of gaseous emissions, engine parameters and emission indices (EIs) for primary (directly emitted) and secondary (after aging) for all experiments.
Tofware postprocessing software (version 2.4.5, TOFWERK AG, Thun, Switzerland; PTR module as distributed by Ionicon Analytik GmbH, Innsbruck, Austria), running in the Igor Pro 6.3 environment (Wavemetrics Inc., Lake Oswego, OR, USA), was used for data analysis. The ion transmission function, required to convert counts (cps) to volume mixing ratios (ppbv), was quantified using a gas standard containing a mixture of 12 compounds (100 ppbv each) spanning mass-to-charge ratios (m∕z) from m∕z 33 to 181 (Carbagas AG., Zurich, Switzerland). Volume mixing ratios (ppbv) were calculated according to De Gouw and Warneke (2007) using H3O+ ∕ NMOG reaction rate constants (k) from Cappellin et al. (2012), when available, and assuming cm3 s−1 otherwise.
During the exothermic proton-transfer reaction, some molecular fragments are formed in the drift chamber, with the extent of fragmentation depending on the chamber conditions and functional groups in the molecules (Gueneron et al., 2015). In particular, hydrocarbon fragments are obtained from aldehydes and dehydration of some oxygenated ions. Assignment of these fragment ions to the corresponding parent ions is important for quantification. The NMOG mixing ratios were corrected by accounting for this fragmentation. The compounds were measured based on their parent ions, and then their fragments were subtracted based on reference fragmentation patterns. These subtractions combine a detailed fragmentation table for aldehydes using the current drift chamber conditions from Klein et al. (2016) and fragmentation patterns for aromatic compounds measured under similar chamber conditions reported (E∕N ∼ 120 Td) in other studies (Buhr et al., 2002; Brown et al., 2010; Gueneron et al., 2015). The fragmentation of detected compounds containing other functional groups (e.g., hydrocarbons and nonaldehyde oxygenated compounds) cannot be fully excluded but are not expected to cause significant error since the observed parent molecules were primarily low molecular weight alcohols and acids (e.g., methanol, formic and acetic acid) which are less susceptible to fragmentation (de Gouw and Warneke, 2007). The NMOGs were then classified (acids, alcohols, aromatics, nonaromatics hydrocarbons and unclassified hydrocarbon fragments, nitrogen- and sulfur-containing compounds, other oxygen-containing compounds, unidentified peaks) according to Kilic et al. (2017).
2.2.2 AMS
The condensed phase was continuously monitored before and after the PAM using a high-resolution time-of-flight AMS and a scanning mobility particle sizer (SMPS). The reader is referred to DeCarlo et al. (2006) for a more detailed description of the AMS operating principles, calibration protocols, and analysis procedures. Briefly, a particle beam sampled through an aerodynamic lens is alternately blocked and unblocked, yielding the bulk particle mass spectra (MS mode) of the nonrefractory (NR) species, including organic aerosols (OA), NO, SO, NH, and Cl−. The NR particles are flash vaporized by impaction on a heated tungsten surface (heated to ∼ 600 ∘C) at 1.33 × 10⁵ Pa ( Torr). The resulting gases are ionized by electron ionization (EI, 70 eV) and the mass-to-charge ratios (m∕z) of the fragments are determined by the ToF mass spectrometer. The AMS was operated in the V-mode, with a time resolution of 30 s. The AMS data were analyzed using the SQUIRREL (version 1.52 L) and PIKA (1.11 L) analysis software in Igor Pro 6.3 (WaveMetrics). Standard relative ionization efficiencies (RIEs) were assumed for the organic aerosol and chloride (RIE = 1.4 and 1.3, respectively) and experimentally determined for sulfate and ammonium (RIE = ∼ 1.1 and ∼ 4, respectively). The collection efficiency due to the particle bounce was determined to be ∼ 1 under our conditions for organic rich aerosols by comparing the AMS mass to the SMPS volume (assuming an OA density of 1.4).
For aged emissions, the CE was estimated by comparing the particle mass calculated by the AMS + BC with that estimated using the SMPS. For both thrust settings, the CE is not significantly different from 1. This is because at low thrust the aged particles consist mostly of organic matter, which had been shown to be efficiently collected on the vaporizer for chamber aerosols (Stirnweis et al., 2017; Platt et al., 2017). Meanwhile, the aged aerosol at higher thrust settings is predominantly composed of sulfuric acid; the molar ratio between NH3 and SO4 is ∼ 0.3, while fully neutralized ammonium sulfate would have a ratio of 2. As opposed to ammonium sulfate, sulfuric acid is efficiently collected on the vaporizer. Therefore, we concluded that using CE = 1 for all thrust levels is adequate. We note that because of the high contribution of the BC to fresh emissions, we could not determine the CE of primary OA and we used CE = 1. Such CE is expected for hydrocarbon like particles.
2.3 Data analysis
Emissions from the aircraft turbofan were measured at different thrust levels referred to as “test points” hereinafter. Test point durations were 18 min, except for one 60 min long run. Test points were systematically interspersed with 5 min long periods to clean the PAM and the transfer lines by flushing the setup with synthetic air. The averaging of the primary emissions started from the third minute of a test point when the engine operation was stable. After sampling primary emissions for 5 to 8 min while bypassing the PAM, secondary formation was measured after the PAM during the last 5 to 8 min of the test point. This allows SOA to reach a steady state in the PAM. During each test, the PA concentration was measured by bypassing the PAM, while the SA concentration was calculated by subtracting PA from the OA measured after aging (after the PAM). Both PA and SA concentrations were determined by AMS.
The expected SOA concentration from the sum of all NMOGs detected by the PTR-ToF-MS was also calculated by multiplying the NMOGs oxidized in the PAM by its corresponding SOA yields, according to Eq. (1):
where n is the number of NMOGs quantified and ΔNMOG is the difference between the primary NMOG concentration and the NMOG concentration after aging. The same approach was applied by Bruns et al. (2016) and yields used can be found in Table 2. SOA yields available in the literature were used when possible. Otherwise, SOA yields of 0.2 were assumed as a lower-limit estimate for aromatic and oxy-aromatics for which no SOA-yield values were reported (Presto et al., 2010; Tkacik et al., 2012), similar to Bruns et al. (2016). A yield of 0.15 was assumed for other NMOGs, including nonaromatic hydrocarbons and carbonyls. As NO is completely consumed in the PAM, we have chosen yields from low NOx conditions for aromatic hydrocarbons (Ng et al., 2007; Chan et al., 2009; Hildebrandt et al., 2009; Nakao et al., 2011). The SOA contribution from organic gases lighter than benzene (C6H6) was neglected. Predicted NMOG contributions to SOA are provided in the Results section.
Emission indices (g kg−1 fuel) were calculated using a mass balance on fuel carbon:
where X denotes the pollutant concentration (µg m−3) and MW (g mole−1) is the molecular weight of the species denoted by the subscript. Background-subtracted CO and CO2 concentrations (µg m−3) are denoted as ΔCO and ΔCO2, respectively. Cf is the carbon fraction of the JET-A1 fuel used during the campaign and was measured as 0.857 based on ASTM D 5291 method (ASTM, 1996).
Particle losses to the PAM wall were taken into account during particle mass calculations by measuring primary emissions of NR-PM1, with lights off, before and after the PAM. From this test, we estimated the losses to the PAM walls to be ∼ 5 %, consistent with previous studies (Bruns et al., 2015; Palm et al., 2016). All data presented were corrected for particle wall losses.
Table 2Precursor OGs, their corresponding functional group and protonated m∕z, SOA yield coefficients* from literature, and average SOA EI estimated for different thrusts.
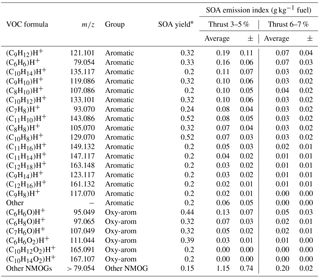
* SOA yields from Ng et al. (2007), Alvarez et al. (2009), Chan et al. (2009, 2010), Hildebrandt et al. (2009), Shakya and Griffin (2010), Chhabra et al. (2011), Nakao et al. (2011), and Yee et al. (2013).
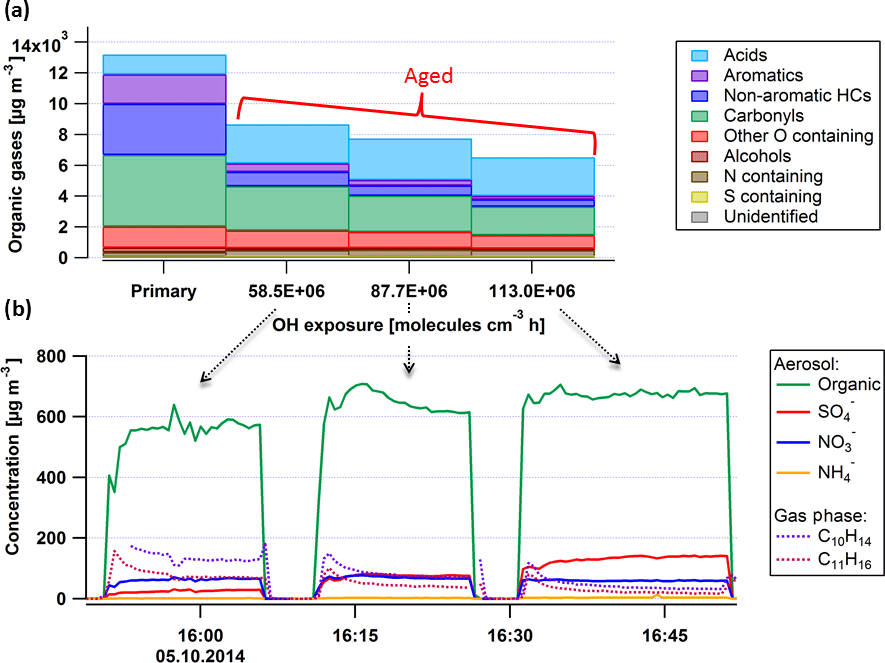
Figure 2Sample experiment showing mean NMOG emissions (a) and representative time series for particle and NMOG components (b) for varying OH exposures. Hydrocarbon concentrations (nonaromatic HCs (dark blue), aromatic HCs (purple), and carbonyls (green)) decrease in the PAM while the concentrations of acids (mostly formic and comprising ∼ 90 % of the total acids) increase. Panel (b) shows the aerosol (Organic, SO4, NO3, NH4) formed and gaseous aromatics (C10H14, C11H16) for the different OH exposures in the PAM given in (a).
3.1 SOA formation as a function of OH exposure
The evolution of the chemical composition of the primary organic gases and NR-PM1 components with increasing OH exposure is shown in Fig. 2 for engine idling operation (thrust 3 %). Measurements were conducted for primary emissions, as well as for OH exposures of 59×106, 88×106, and 113×106 molecules cm−3 h, which correspond to approximately 39, 58, and 75 h of atmospheric aging under an average tropospheric OH concentration of 1.5 × 10⁶ molecules cm−3 (Mao et al., 2009). The OH exposure, calculated using d9-butanol as a tracer, was varied by varying the light intensity.
Figure 2 shows the OG composition under these conditions with compounds classified as a function of their molecular composition, as described in Kilic et al. (2017). A stepwise increase of the OH exposure reduced the NMOG mass detected in the chamber by 35, 40, and 50 %. Except for carboxylic acids, the concentrations of all NMOGs decreased during aging, indicating that their loss rate exceed their production from other NMOGs. For example, aromatic compounds and carbonyls were oxidized in the PAM by up to 90 and 50 %, respectively, while the acids doubled after 75 h of daytime-equivalent aging.
Figure 2 also shows a time series of secondary NR-PM1 composition, as well as the concentrations of two of the most abundant aromatic gases, C10H14 and C11H16, for the same experiment. Here stable oxidation conditions were alternated with sampling of primary emissions, with OH exposures indicated in the figure. Secondary aerosol, especially SOA, dominated the total NR-PM1. By increasing the OH exposure from 59×106 to 88×106 molecules cm−3 h, the generated SOA increased by approximately 14 %. However, increasing the OH exposure further to 113×106 molecules cm−3 h yielded only an additional 3 % increase in SOA mass. This suggests that at these OH exposures, the bulk of SOA precursors have reacted and the additional SOA production did not significantly exceed its loss. Under these conditions, the formed SOA may be considered as a reasonable estimate for the total SOA potential. The observed production rate of SOA against OH exposure is consistent with precursor reaction rates of molecule−1 cm3 s−1. This estimate is based on the assumption of a constant SOA mass yield with aging and instantaneous equilibrium partitioning of the condensable gases, and is therefore lower than the reaction rates of the main identified precursors (see below). SOA production rates are thus expected to be faster in the ambient atmosphere.
3.2 Particle and gaseous emissions as a function of engine load
Figure 3 shows both average primary and secondary emissions indices for varying engine loads (left) and EIs from individual test points (right). The NMOG EI decreased from 30 to 0.8 g kg−1 fuel when the thrust level increased from 3–5 to 90 %. At thrust 3–5 %, the emissions of gaseous aromatic-hydrocarbons were highest (with an EI of ∼ 5 g kg−1 fuel) and decreased with increasing thrust (with an EI of ∼ 0.15 g kg−1 fuel at thrust 90 %). Similar to aromatic gases, SOA were formed mostly at 3–5 % thrust and had a declining trend with thrust. In contrast, eBC, POA, and secondary SO4 EIs were highest during the approximated cruise load (thrust 60 %). At these conditions, secondary NR-PM1 was mostly inorganic and SOA mass was comparable to that of primary carbonaceous emissions (eBC + POA). SOA was approximately 100 times higher than POA at idle and only 10 times higher at cruise (Fig. 3). This dependence of the aged aerosol composition on the thrust level, obtained using the PAM reactor, confirms quite readily the previous results obtained in a smog chamber (Miracolo et al., 2011, 2012).
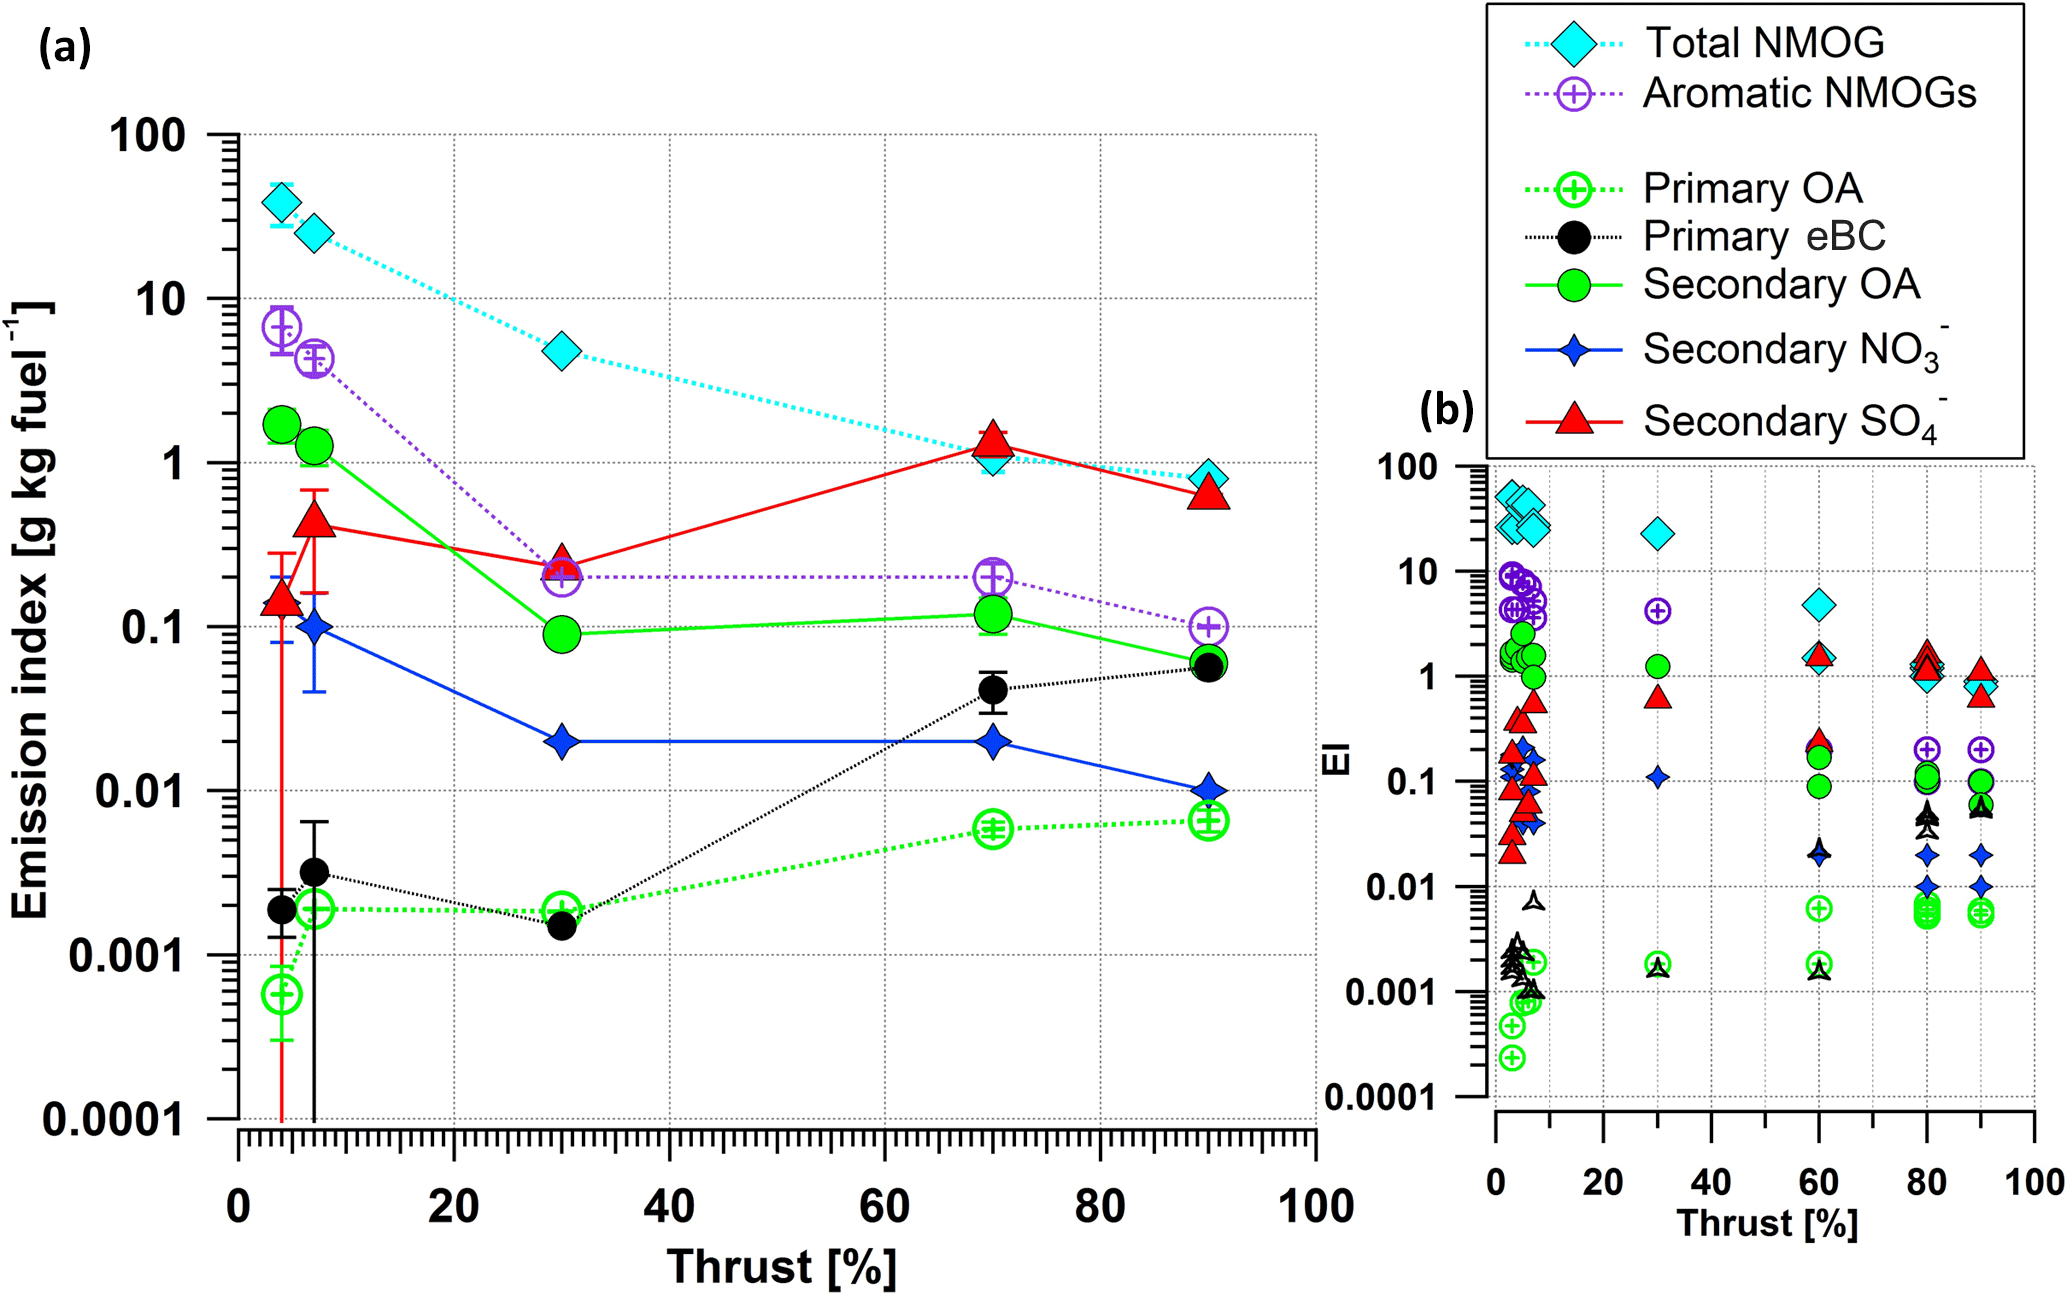
Figure 3Average emission indices (a) and EIs from individual test points (b) for primary nonmethane organic gases (NMOGs), aromatic gases, primary organic aerosol (POA), equivalent black carbon (eBC), secondary organic aerosol (SOA), nitrate (NO3), and sulfate (SO4). Error bars (±) are the standard deviations of the means with a confidence interval of 95 %. The OH exposure was in the range of 91–113 × 106 molecules cm−3 h for the secondary aerosol cases.
There is a PM fraction in the engine exhaust originating from the lubricant oil (Yu et al., 2012) that is not measured due to the sampling location and engine model studied. The EI of this PM fraction ranges from 2 to 10 mg kg−1 fuel (Yu et al., 2010) for other engine models than the engine model studied here. This PM originating from lubricant oil is less than 1 % of the SOA at idle; however, it could be a significant source at cruise loads.
3.3 Precursor gases of SOA: idling
Single-ring aromatics, such as xylenes, methylbenzenes, toluene, and benzene, were previously linked with SOA formation (e.g., Odum et al., 1997; Ng et al., 2007). These aromatic gases are important contributors in the emissions from combustion sources such as two-stroke scooters (Platt et al., 2013) or wood burning (Bruns et al., 2016). Idling exhaust contained 20 % (mass weighted) of aromatic HCs. Figure 4 presents the mass fractions of aromatic hydrocarbons in primary exhausts for an idling turbine engine. More than half of the aromatic hydrocarbons emitted were single-ring aromatics. 75–95 % of these aromatics were oxidized with an OH exposure of ∼ 90 × 106 molecules cm−3 h in the PAM.
By using previously reported SOA yields (Table 2) for NMOGs, SOA production was predicted from individual precursors according to Eq. (1). Figure 5 shows a comparison of the predicted SOA with the SOA determined by AMS measurements (top) and the predicted SOA contribution by the oxidation of NMOGs in the PAM (bottom), for two idling thrusts, 2–5 % (left) and 6–7 % (right). The predicted SOA from the NMOGs reacted are shown at the bottom panel of the figure and compound class-specific SOA fractions are separated for aromatic HCs, oxygenated-aromatics, other HCs, N-containing OGs, and other OGs.
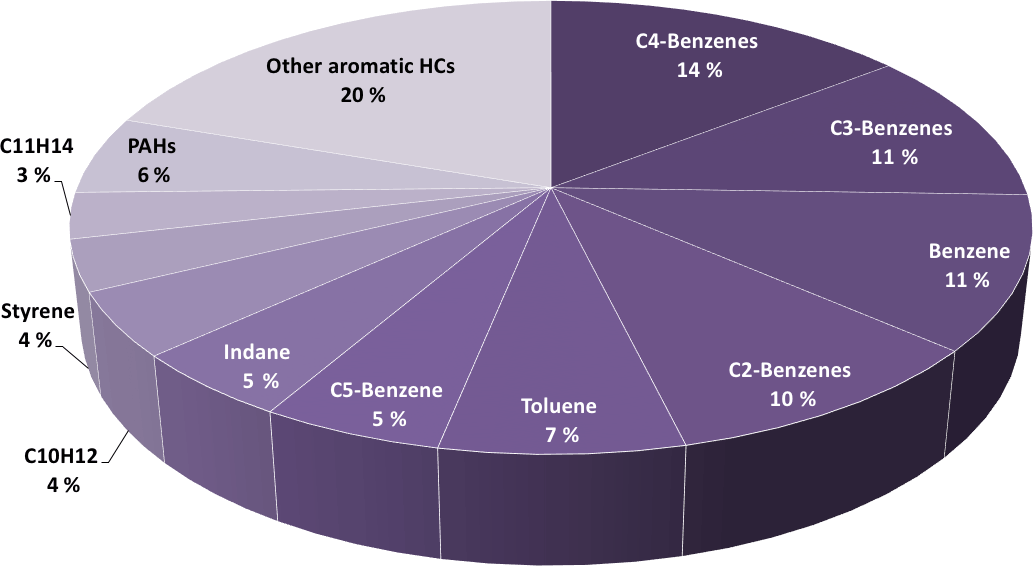
Figure 4Mass fractions of aromatic compounds for primary emissions (directly emitted) at idle (thrust 3–7 %). Benzene derivatives, xylenes, tri-, tetra-, pentamethylbenzene, benzene and toluene account for ∼ 60 % of all aromatics.
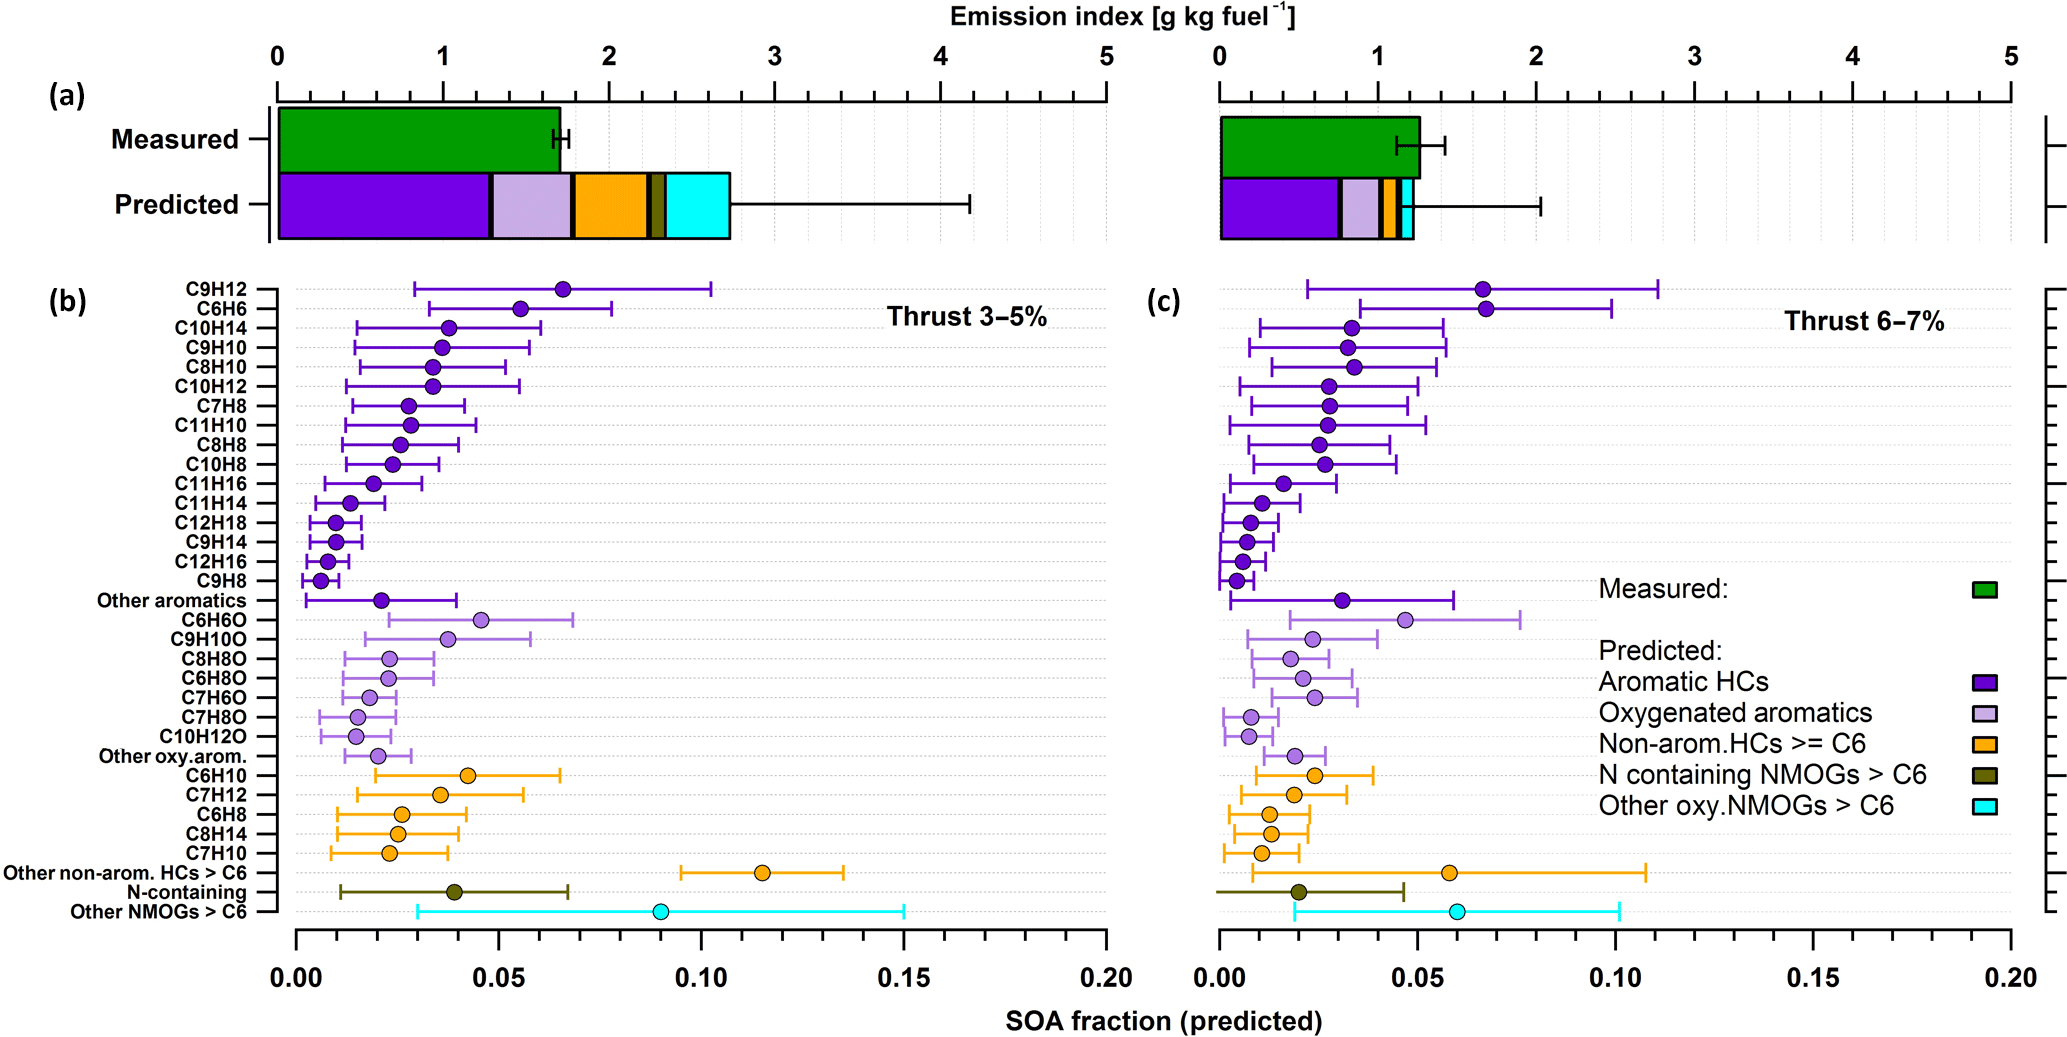
Figure 5Comparison of the SOA measured by the AMS and the SOA predicted by the oxidation of NMOGs (a). The statistics are presented for low load idling (thrust 3–5 %) on the left and for idling 6–7 % on the right. Aromatic hydrocarbons (purple) were the most abundant precursors of SOA at idle (thrust 3–7 %) explaining all SOA formed (green, a) at thrust 3–5 % and most (∼ 90 %) at thrust 6–7 %. Aromatic SOA comprised the largest fraction followed by oxygenated aromatics (light purple – e.g., phenol, benzaldehydes), nonaromatic hydrocarbons (orange) with more than 6 carbon atoms in their molecular structure (nonarom. HCs ≥ C6), nitrogen-containing compounds (brown), other oxygenated-NMOGs > C6 (cyan). Average fractions of individual NMOGs (b, c) were calculated by using SOA yields from literature (see Table 2) and the amount of NMOG reacted. Error bars show standard deviations of the means (CI: 95 %).
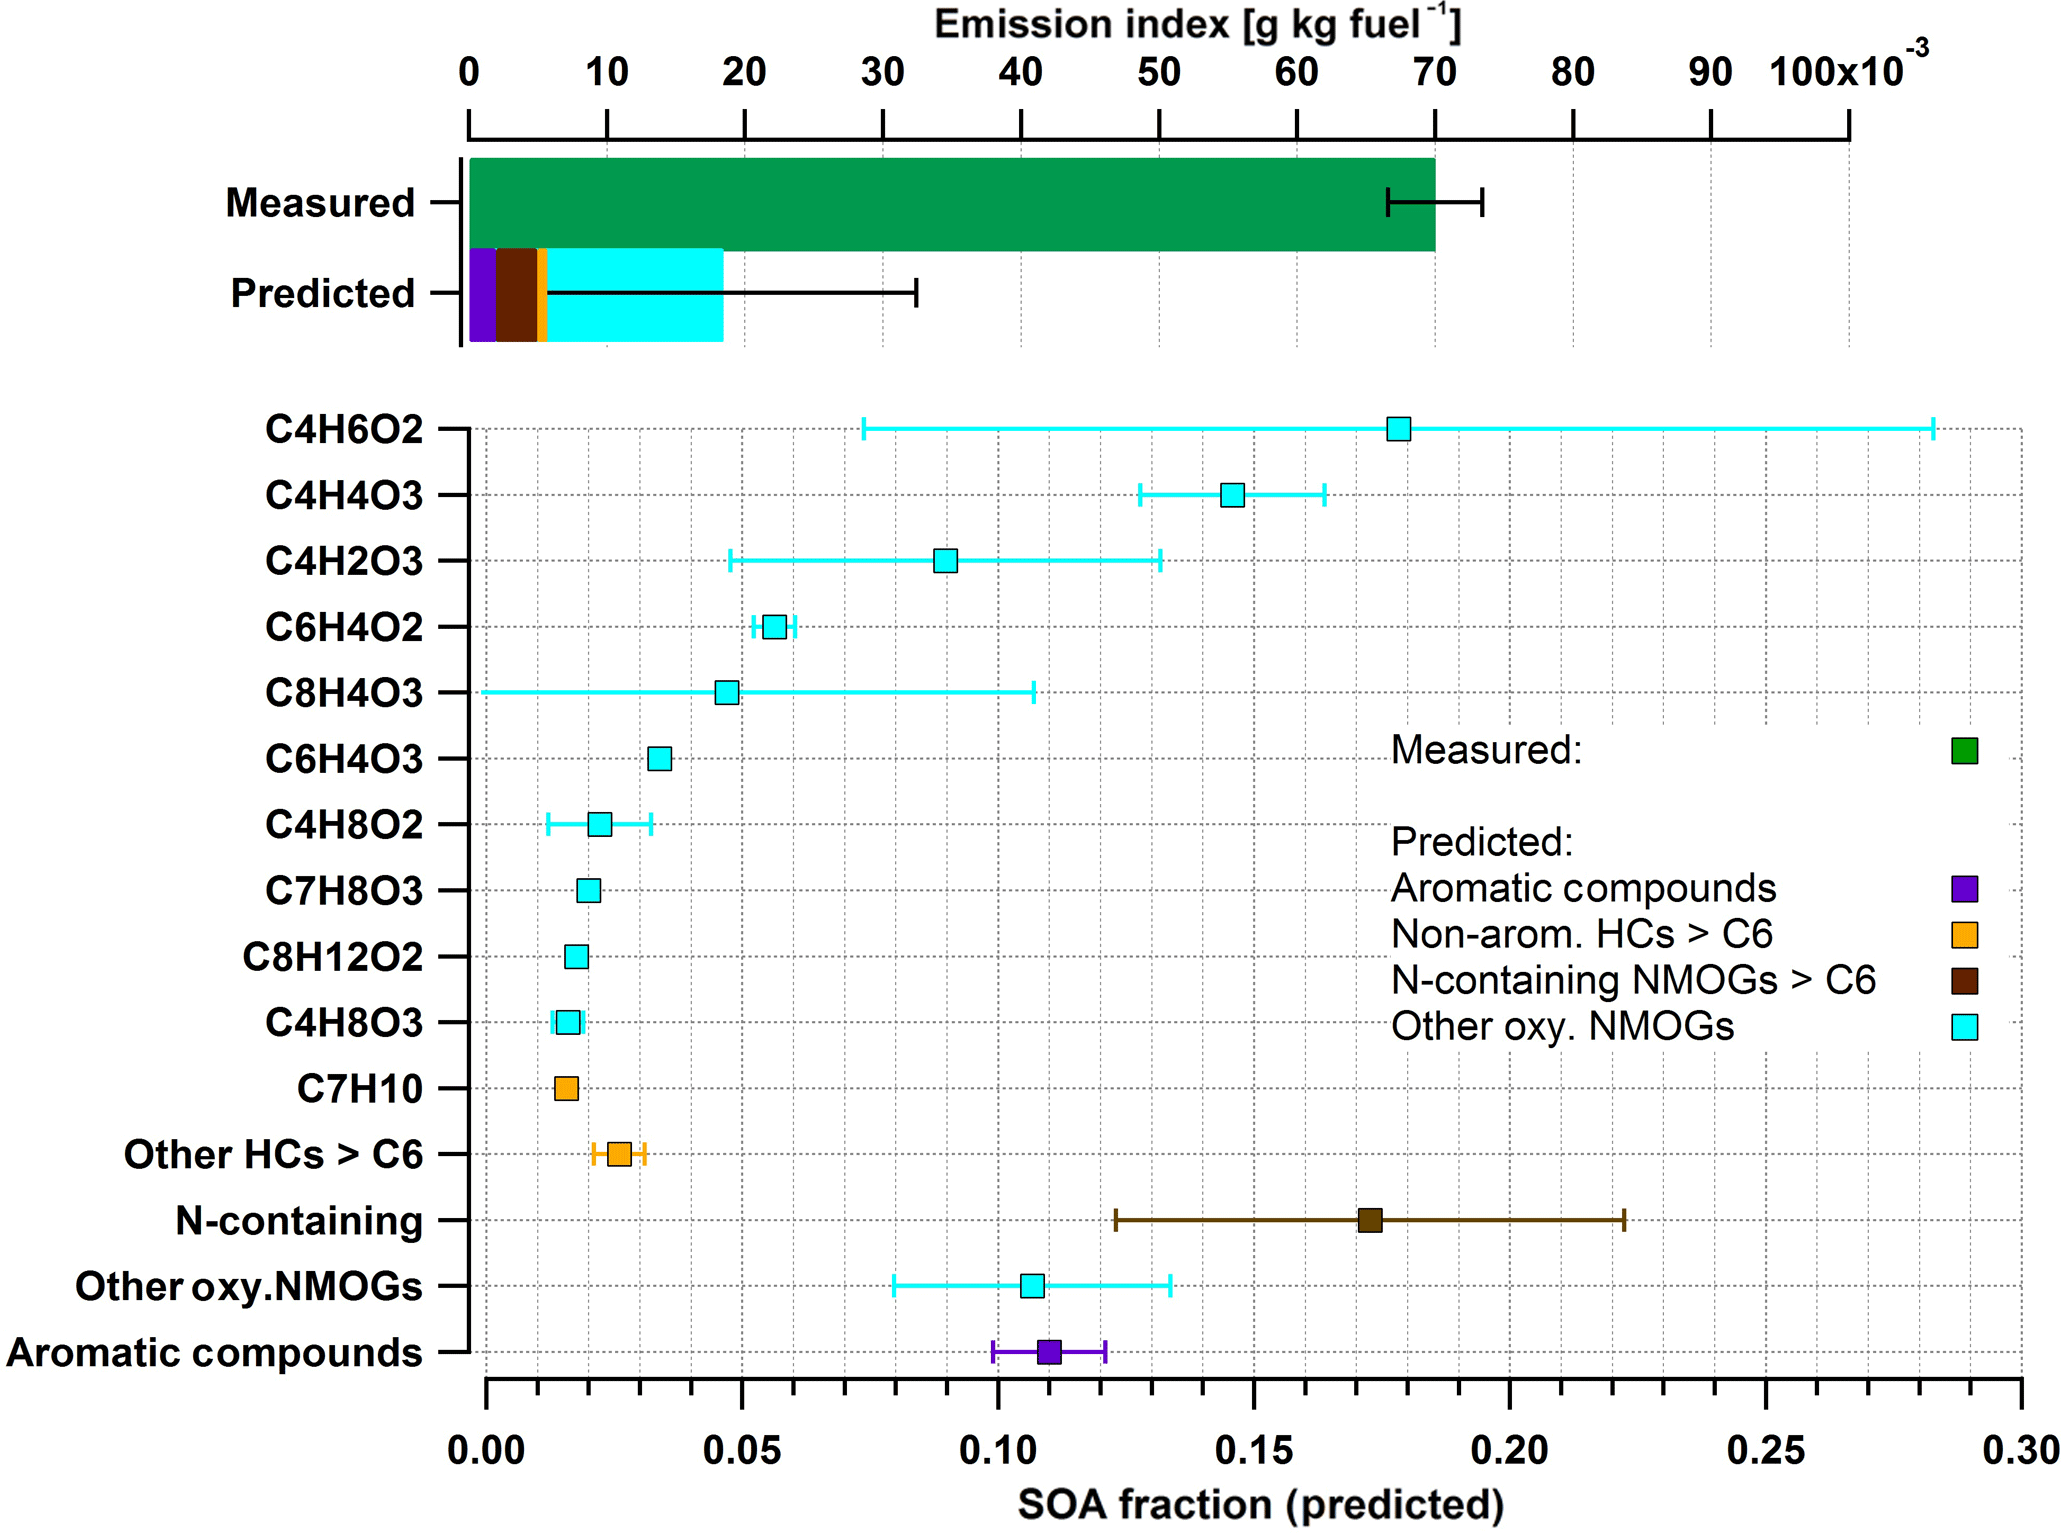
Figure 6Measured and predicted SOA comparison at an approximated cruise load, using the same approach as in Fig. 5. In contrast to idle conditions, total NMOGs detected do not explain SOA formed.
SOA yields are sensitive to the conditions under which the experiments were conducted. Parameters that can have an influence on SOA yield determination include among others the NOx to VOC ratio and the particle condensational sink and mass concentrations. Under our conditions, the PAM is operated under low NOx ∕ VOC conditions and at rather high condensational sinks; both conditions would favor higher yields (Stirnweis et al., 2017). We have attempted to use yields from studies conducted under similar conditions. However, we note that reported yields for similar conditions may vary by up to a factor of 2.
Results in Fig. 5 indicate that the most important SOA precursors emitted by turbine engines at idle are aromatic hydrocarbons such as benzene derivatives but also oxygenated aromatics such as phenol. The predicted SOA formed by aromatics alone, both by aromatic hydrocarbons (60–70 %) and oxygenated aromatics (15–25 %), explained all AMS-determined SOA at low loads (thrust 3–5 %) and most of the SOA formed (by 80 %) at idle (6–7 %; Fig. 5). Predicted aromatic SOA from benzene (C6H6), C2-benzenes (C8H10), C3-benzenes (C9H12), C4-benzenes (C10H14), dimethylstyrenes (C10H12), toluene (C7H8), methylbenzaldehydes (C8H8O), and phenol (C6H6O) accounted for 60 % of the AMS-determined SOA at 3–5 % thrust (Fig. 5). These results are consistent with those previously obtained using a smog chamber, confirming that aromatic compounds are indeed important SOA precursors in jet-engine emissions (Miracolo et al., 2011). Only a small fraction of these compounds was determined in previous experiments using GC–MS measurements and therefore traditionally considered as SOA precursors in models. Here, compared to previous experiments, we show that nontraditional aromatic and oxy-aromatic compounds, including naphthalene and its alkyl derivatives, C > 3 alkyl derivatives of single-ring aromatics, and phenols, can explain the gap between measured SOA and SOA predicted based on traditional precursors.
Exhaust-aging experiments were repeated 6 times at thrust 3–5 % and the oxidation of NMOGs varied during each of these aging experiments. Error bars shown in Fig. 5 denote this variability in NMOG oxidation (in the PAM) during aging experiments of the same thrust level. Indeed, errors related to yield values used may significantly influence the results. These errors may be systematic and are complex to assess. They can be affected by potential differences between the oxidation conditions in chambers and in the PAM (e.g., NOx, RH, particle mass). Yields obtained with the PAM are consistent with those obtained from chambers (Bruns et al., 2015), and therefore we do not expect large systematic errors in the SOA predicted. However, based on the variability of yields in previous chamber experiments we estimate the accuracy of our prediction to be within a factor of 2, indicating that within our uncertainties a significant fraction of the precursors was identified.
NMOGs, including aromatic gases, were reduced with increasing thrust (from thrust 3–5 % to thrust 6–7 %) due to more efficient operation of the turbine engine. This decrease amounted to 40 % for the sum of aromatic HCs and corresponded to a 30 % decrease in SOA EI. Therefore, a more efficient engine operation implies less NMOG emissions and reduced SOA formation potential at idle.
3.4 SOA formation at an approximated cruise load
A comparison of the predicted SOA with the SOA determined by the AMS is presented in Fig. 6 at cruise loads (top panel). Figure 6 also shows the SOA contribution predicted by the oxidation of NMOGs in the PAM (bottom panel) under the same engine conditions. The SOA EI was 0.07 g kg−1 fuel for cruise load. The predicted SOA fraction accounted for only 30 % of the AMS-determined SOA (green bar, Fig. 6) during cruise load experiments. Aromatic SOA (predicted) accounted for only 4 % of the AMS-determined SOA during these experiments. The major fraction of the remaining SOA mass that was assigned to the identified precursors was predicted to be from oxygenated NMOG molecules (Fig. 6). Another 6 % of the determined SOA may originate from nonaromatic HCs (aliphatics and HC fragments > C6).
Predicted SOA was significantly lower compared to the measured SOA. While SOA precursors remain unidentified under these conditions, several hypotheses might explain the observation. First, we could not determine the contribution of alkanes smaller than nine carbon atoms to the formed SOA, because these compounds are not directly detected by the PTR-ToF-MS. Depending on the number of carbon atoms in their molecular structure, the SOA potential of many alkanes may be comparable to that of single-ring aromatic hydrocarbons (Tkacik et al., 2012) and therefore may play a role in the formation of the observed SOA. However, our data do not suggest that a great part of the observed SOA is from nonmeasured alkanes, as we do not observe any increase in the contribution of hydrocarbon fragments in the PTR-MS compared to idling emissions. Second, the oxidation of primary semivolatile compounds may yield significant SOA, because of their elevated yields of near unity (Robinson et al., 2007). However, we note that these semivolatile precursors would play an important role at low aerosol concentrations, when most of these precursors reside in the gas phase where they can be oxidized. Under our conditions, concentrations range between 10 and 50 µg m−3 and a substantial fraction of these products resides already in the particle phase. Therefore the oxidation of these products in the gas phase by OH is unlikely to explain the observed entire tenfold increase in the OA mass upon oxidation, but only part of the mass. Finally, the PTR-MS data suggest that a great part of the precursors measured are highly oxygenated gases, with O : C ratios ranging from 0.2 to 0.7, including, among others, anhydrides (e.g., phthalic, succinic, and maleic) and quinone derivatives. Unlike aromatic compounds and alkanes present in the fuel, these compounds are likely formed at high temperature during combustion. The SOA yields of these compounds remain unknown and it is likely that the yield value of 0.15 used here is a lower estimate, which would result in an underestimation of the contribution of these compounds to the observed SOA. We also note that unlike precursors detected under idle conditions, the ionization efficiency and the fragmentation pattern of these compounds in the PTR-MS are highly uncertain, resulting in large uncertainties in our predicted SOA. Therefore, results in Fig. 6 should be considered with care. Notwithstanding these uncertainties, we note that at cruise conditions the SOA contribution to the total secondary PM is minor compared to sulfate and therefore these uncertainties have little impact on the implications of our results.
Gas phase, primary emissions, and SA formation from an in-service turbofan were investigated in a test cell. The engine loads (thrusts) during the experiments simulated different aircraft operations. These operations are summarized as the landing–take-off cycle under four modes: taxi–idle, approach, climb, and take-off, with corresponding engine loads of 3–7, 30, 85, and 100 %, respectively. In addition, an approximated cruising load (60 %) was selected.
Under idle conditions, SOA formation was mostly attributed to the oxidative processing of aromatic precursors. Benzene derivatives and phenol are the major SOA precursors for an idling aircraft. During cruise load, the emission of aromatic compounds was much lower and only explained a minor fraction of SOA (4 %). During these conditions, however, sulfate-dominated SA, accounting for ∼ 85 % of the total mass of aged aerosols, and therefore its fraction is more relevant aloft.
The oxidation of NMOGs in the PAM reactor yielded a SOA EI 100 times greater than POA under idling conditions and 10 times greater at cruise load. According to our calculated production rates, SOA from airport emissions (idling jet engines) exceeds POA by a factor of 10 already after 3 h of atmospheric aging and therefore considerably impacts areas downwind of airports. Compared to idling aircraft emissions, aging of vehicle exhaust emissions results in much lower enhancements, ranging between factors of 5–10 and 1.5–3, for gasoline and diesel vehicles, respectively (Gordon et al., 2014a, b).
The NMOG emission factors and SOA potential can be used in conjunction with emission inventories and fuel use data to assess the impact of aircraft emissions on air quality in comparison with other mobile sources. Here, we have considered the Zurich international airport as an example (Switzerland, 23 million passengers in 2010). On the one hand, we note that the influence of the engine type and age on the total NMOG emission rates is minor compared to other parameters (e.g., thrust level). In addition, the engine type tested here is the most frequently used and sold model for commercial aviation. Thus, we believe that the emission rates used here are generally representative of idling aircraft emissions. On the other hand, we note that the SOA production potential estimated using the PAM reactor is obtained under low NOx conditions and high SOA concentrations, which favor higher SOA yields. Therefore, the prediction of aircraft contribution to SOA under ambient conditions should be regarded as the highest estimate. For the case of other mobile sources, we have selected yields obtained under similar conditions to minimize biases in these comparisons.
Combining the recorded aircraft fuel use with the standard LTO cycle and the NMOG EIs measured, we estimate aircraft NMOG emissions in Zurich for 2010 to be in the range of 90–190 t year−1 (Kilic et al., 2017). Based on the average SOA bulk yields (SOA ∕ total reacted NMOG) obtained herein (∼ 5–8 %), we estimate a total SOA production potential from airport emissions for the area of Zurich to range from 5.4 to 13.2 t year−1. These SOA production potential values can be directly compared to emissions from on-road vehicles derived from the EDGARv4.2 emission inventory (Kuenen et al., 2014), which provides worldwide temporally and spatially resolved NMOG emissions from road vehicles with a grid size of ∼ 200 km2. For the grid cell containing Zurich (47.25∘ N, 8.75∘ E) the NMOG emissions from on-road vehicles is estimated to be 631 t year−1. While SOA yields from diesel vehicle emissions are expected to be more elevated than those from gasoline car emissions, due to the presence of intermediate volatility species, recent reports suggest these yields to be comparably high, namely ∼ 15 % (Gentner et al., 2017). Using this yield value for emissions from both types of vehicles (Platt et al., 2017), we estimate the total SOA production potential from on road vehicles for the area of Zurich to be ∼ 94 t year−1, tenfold higher than SOA from aircraft emissions. However, the airport is a point source within this region and thus the relative contribution of the airport emissions to a specific location downwind of this source is significantly higher than implied by this calculation. Although this estimate applies to a specific airport, it does indicate that aircraft NMOG emissions may constitute significant SOA precursors downwind of airports, while other fossil fuel combustion sources dominate urban areas in general.
Most of the new data and the results produced for this paper are available in the Supplement.
The supplement related to this article is available online at: https://doi.org/10.5194/acp-18-7379-2018-supplement.
The authors declare that they have no conflict of interest.
Funding was provided by the Swiss Federal Office of Civil Aviation (FOCA).
This project would not have been possible without the support of Rene Richter
(PSI) and SR Technics personnel. Many individuals from SR Technics
contributed to the project but we owe special thanks to those from the
Maintenance and Test Cell Group. JGS acknowledges support from the Swiss
National Science Foundation starting grant BSSGI0_155846.
Edited by: Gordon McFiggans
Reviewed by: two anonymous referees
Alvarez, E. G., Borrás, E., Viidanoja, J., and Hjorth, J.: Unsaturated dicarbonyl products from the OH-initiated photo-oxidation of furan, 2-methylfuran and 3-methylfuran, Atmos. Environ., 43, 1603–1612, 2009.
Anderson, B. E., Chen, G., and Blake, D. R.: Hydrocarbon emissions from a modern commercial airliner, Atmos. Environ., 40, 3601–3612, 2006.
ASTM, D.: 5291 standard test methods for instrumental determination of carbon, hydrogen, and nitrogen in petroleum products and lubricants, ASTM, West Conshohocken, 1996.
Barmet, P., Dommen, J., DeCarlo, P. F., Tritscher, T., Praplan, A. P., Platt, S. M., Prévôt, A. S. H., Donahue, N. M., and Baltensperger, U.: OH clock determination by proton transfer reaction mass spectrometry at an environmental chamber, Atmos. Meas. Tech., 5, 647–656, https://doi.org/10.5194/amt-5-647-2012, 2012.
Brem, B. T., Durdina, L., Siegerist, F., Beyerle, P., Bruderer, K., Rindlisbacher, T., Rocci-Denis, S., Andac, M. G., Zelina, J., Penanhoat, O., and Wang, J.: Effects of fuel aromatic content on nonvolatile particulate emissions of an in-production aircraft gas turbine, Environ. Sci. Technol., 49, 13149–13157, 2015.
Brown, P., Watts, P., Märk, T., and Mayhew, C.: Proton transfer reaction mass spectrometry investigations on the effects of reduced electric field and reagent ion internal energy on product ion branching ratios for a series of saturated alcohols, Int. J. Mass Spectrom., 294, 103–111, 2010.
Bruns, E. A., El Haddad, I., Keller, A., Klein, F., Kumar, N. K., Pieber, S. M., Corbin, J. C., Slowik, J. G., Brune, W. H., Baltensperger, U., and Prévôt, A. S. H.: Inter-comparison of laboratory smog chamber and flow reactor systems on organic aerosol yield and composition, Atmos. Meas. Tech., 8, 2315–2332, https://doi.org/10.5194/amt-8-2315-2015, 2015.
Bruns, E. A., El Haddad, I., Slowik, J. G., Kilic, D., Klein, F., Baltensperger, U., and Prévôt, A. S. H.: Identification of significant precursor gases of secondary organic aerosols from residential wood combustion, Sci. Rep.-UK, 6, 27881, https://doi.org/10.1038/srep27881, 2016.
Buhr, K., van Ruth, S., and Delahunty, C.: Analysis of volatile flavour compounds by proton transfer reaction-mass spectrometry: fragmentation patterns and discrimination between isobaric and isomeric compounds, Int. J. Mass Spectrom., 221, 1–7, 2002.
Cappellin, L., Karl, T., Probst, M., Ismailova, O., Winkler, P. M., Soukoulis, C., Aprea, E., Märk, T. D., Gasperi, F., and Biasioli, F.: On quantitative determination of volatile organic compound concentrations using proton transfer reaction time-of-flight mass spectrometry, Environ. Sci. Technol., 46, 2283–2290, 2012.
Chan, A. W. H., Kautzman, K. E., Chhabra, P. S., Surratt, J. D., Chan, M. N., Crounse, J. D., Kürten, A., Wennberg, P. O., Flagan, R. C., and Seinfeld, J. H.: Secondary organic aerosol formation from photooxidation of naphthalene and alkylnaphthalenes: implications for oxidation of intermediate volatility organic compounds (IVOCs), Atmos. Chem. Phys., 9, 3049–3060, https://doi.org/10.5194/acp-9-3049-2009, 2009.
Chan, A. W. H., Chan, M. N., Surratt, J. D., Chhabra, P. S., Loza, C. L., Crounse, J. D., Yee, L. D., Flagan, R. C., Wennberg, P. O., and Seinfeld, J. H.: Role of aldehyde chemistry and NOx concentrations in secondary organic aerosol formation, Atmos. Chem. Phys., 10, 7169–7188, https://doi.org/10.5194/acp-10-7169-2010, 2010.
Chhabra, P. S., Ng, N. L., Canagaratna, M. R., Corrigan, A. L., Russell, L. M., Worsnop, D. R., Flagan, R. C., and Seinfeld, J. H.: Elemental composition and oxidation of chamber organic aerosol, Atmos. Chem. Phys., 11, 8827–8845, https://doi.org/10.5194/acp-11-8827-2011, 2011.
DeCarlo, P. F., Kimmel, J. R., Trimborn, A., Northway, M. J., Jayne, J. T., Aiken, A. C., Gonin, M., Fuhrer, K., Horvath, T., Docherty, K. S., Worsnop, D. R.,and Jimenez, J. L.: Field-deployable, high-resolution, time-of-flight aerosol mass spectrometer, Anal. Chem., 78, 8281–8289, 2006.
de Gouw, J. and Warneke, C.: Measurements of volatile organic compounds in the Earth's atmosphere using proton-transfer-reaction mass spectrometry, Mass Spectrom. Rev., 26, 223–257, 2007.
Drinovec, L., Mocnik, G., Zotter, P., Prévôt, A. S. H., Ruckstuhl, C., Coz, E., Rupakheti, M., Sciare, J., Müller, T., Wiedensohler, A., and Hansen, A. D. A.: The “dual-spot” Aethalometer: an improved measurement of aerosol black carbon with real-time loading compensation, Atmos. Meas. Tech., 8, 1965–1979, https://doi.org/10.5194/amt-8-1965-2015, 2015.
Durdina, L., Brem, B. T., Setyan, A., Siegerist, F., Rindlisbacher, T., and Wang, J.: Assessment of particle pollution from jetliners: from smoke visibility to nanoparticle counting, Environ. Sci. Technol., 51, 3534–3541, 2017.
Gentner, D. R., Shantanu, H., Jathar, H. S., Gordon, D. T., Bahreini, R., Day, D. A., El Haddad, I., Hayes, P. L., Pieber, S. M., Platt, S. M., de Gouw, J., Goldstein, H. A., Harley, R. A., Jimenez, L. J., Prévôt, A. S. H., and Robinson, L. A.: Review of urban secondary organic aerosol formation from gasoline and diesel motor vehicle emissions, Environ. Sci. Technol., 51, 1074–1093, https://doi.org/10.1021/acs.est.6b04509, 2017.
Gordon, T. D., Presto, A. A., Nguyen, N. T., Robertson, W. H., Na, K., Sahay, K. N., Zhang, M., Maddox, C., Rieger, P., Chattopadhyay, S., Maldonado, H., Maricq, M. M., and Robinson, A. L.: Secondary organic aerosol production from diesel vehicle exhaust: impact of aftertreatment, fuel chemistry and driving cycle, Atmos. Chem. Phys., 14, 4643–4659, https://doi.org/10.5194/acp-14-4643-2014, 2014a.
Gordon, T. D., Presto, A. A., May, A. A., Nguyen, N. T., Lipsky, E. M., Donahue, N. M., Gutierrez, A., Zhang, M., Maddox, C., Rieger, P., Chattopadhyay, S., Maldonado, H., Maricq, M. M., and Robinson, A. L.: Secondary organic aerosol formation exceeds primary particulate matter emissions for light-duty gasoline vehicles, Atmos. Chem. Phys., 14, 4661–4678, https://doi.org/10.5194/acp-14-4661-2014, 2014b.
Gueneron, M., Erickson, M. H., VanderSchelden, G. S., and Jobson, B. T.: PTR-MS fragmentation patterns of gasoline hydrocarbons, Int. J. Mass Spectrom., 379, 97–109, 2015.
Herndon, S. C., Rogers, T., Dunlea, E. J., Jayne, J. T., Miake-Lye, R., and Knighton, B.: Hydrocarbon emissions from in-use commercial aircraft during airport operations, Environ. Sci. Technol., 40, 4406–4413, 2006.
Hildebrandt, L., Donahue, N. M., and Pandis, S. N.: High formation of secondary organic aerosol from the photo-oxidation of toluene, Atmos. Chem. Phys., 9, 2973–2986, https://doi.org/10.5194/acp-9-2973-2009, 2009.
Hudda, N. and Fruin, S.: International airport impacts to air quality: Size and related properties of large increases in ultrafine particle number concentrations, Environ. Sci. Technol., 50, 3362–3370, 2016.
Hudda, N., Gould, T., Hartin, K., Larson, T. V., and Fruin, S. A.: Emissions from an international airport increase particle number concentrations 4-fold at 10 km downwind, Environ. Sci. Technol., 48, 6628–6635, 2014.
Hudda, N., Simon, M., Zamore, W., Brugge, D., and Durant, J.: Aviation emissions impact ambient ultrafine particle concentrations in the Greater Boston area, Environ. Sci. Technol., 50, 8514–8521, 2016.
Jordan, A., Haidacher, S., Hanel, G., Hartungen, E., Märk, L., Seehauser, H., Schottkowsky, R., Sulzer, P., and Märk, T.: A high resolution and high sensitivity proton-transfer-reaction time-of-flight mass spectrometer (PTR-ToF-MS), Int. J. Mass Spectrom., 286, 122–128, 2009.
Kang, E., Root, M. J., Toohey, D. W., and Brune, W. H.: Introducing the concept of Potential Aerosol Mass (PAM), Atmos. Chem. Phys., 7, 5727–5744, https://doi.org/10.5194/acp-7-5727-2007, 2007.
Kilic, D., Brem, B. T., Klein, F., El-Haddad, I., Durdina, L., Rindlisbacher, T., Setyan, A., Huang, R., Wang, J., Slowik, J. G., Baltensperger, U., and Prevot, A. S. H.: Characterization of gas-phase organics using proton transfer reaction time-of-flight mass spectrometry: Aircraft turbine engines, Environ. Sci. Technol., 51, 3621–3629, https://doi.org/10.1021/acs.est.6b04077, 2017.
Kim, B. Y.: Guidebook on Preparing Airport Greenhouse Gas Emissions Inventories, vol. 11, Transportation Research Board, 2009.
Kinsey, J. S., Dong, Y., Williams, D. C., and Logan, R.: Physical characterization of the fine particle emissions from commercial aircraft engines during the aircraft particle emissions experiment (APEX) 1–3, Atmos. Environ., 44, 2147–2156, 2010.
Klein, F., Platt, S. M., Farren, N. J., Detournay, A., Bruns, E. A., Bozzetti, C., Daellenbach, K. R., Kilic, D., Kumar, N. K., Pieber, S. M., and Slowik, J. G.: Characterization of gas-phase organics using proton transfer reaction time-of-flight mass spectrometry: cooking emissions, Environ. Sci. Technol., 50, 1243–1250, 2016.
Kuenen, J. J. P., Visschedijk, A. J. H., Jozwicka, M., and Denier van der Gon, H. A. C.: TNO-MACC_II emission inventory; a multi-year (2003–2009) consistent high-resolution European emission inventory for air quality modelling, Atmos. Chem. Phys., 14, 10963–10976, https://doi.org/10.5194/acp-14-10963-2014, 2014.
Lambe, A. T., Chhabra, P. S., Onasch, T. B., Brune, W. H., Hunter, J. F., Kroll, J. H., Cummings, M. J., Brogan, J. F., Parmar, Y., Worsnop, D. R., Kolb, C. E., and Davidovits, P.: Effect of oxidant concentration, exposure time, and seed particles on secondary organic aerosol chemical composition and yield, Atmos. Chem. Phys., 15, 3063–3075, https://doi.org/10.5194/acp-15-3063-2015, 2015.
Liati, A., Brem, B. T., Durdina, L., Vögtli, M., Dasilva, Y. A. R., Eggenschwiler, P. D., and Wang, J.: Electron microscopic study of soot particulate matter emissions from aircraft turbine engines, Environ. Sci. Technol., 48, 10975–10983, 2014.
Lin, S., Munsie, J., Herdt-Losavio, M., Hwang, S., Civerolo, K., McGarry, K., and Gentile, T.: Residential proximity to large airports and potential health impacts in New York State, Int. Arch. Occup. Environ. Health., 81, 797–804, 2008.
Mao, J., Ren, X., Brune, W. H., Olson, J. R., Crawford, J. H., Fried, A., Huey, L. G., Cohen, R. C., Heikes, B., Singh, H. B., Blake, D. R., Sachse, G. W., Diskin, G. S., Hall, S. R., and Shetter, R. E.: Airborne measurement of OH reactivity during INTEX-B, Atmos. Chem. Phys., 9, 163–173, https://doi.org/10.5194/acp-9-163-2009, 2009.
Miracolo, M. A., Hennigan, C. J., Ranjan, M., Nguyen, N. T., Gordon, T. D., Lipsky, E. M., Presto, A. A., Donahue, N. M., and Robinson, A. L.: Secondary aerosol formation from photochemical aging of aircraft exhaust in a smog chamber, Atmos. Chem. Phys., 11, 4135–4147, https://doi.org/10.5194/acp-11-4135-2011, 2011.
Miracolo, M. A., Drozd, G. T., Jathar, S. H., Presto, A. A., Lipsky, E. M., Corporan, E., and Robinson, A. L.: Fuel composition and secondary organic aerosol formation: Gas-turbine exhaust and alternative aviation fuels, Environ. Sci. Technol., 46, 8493–8501, 2012.
Nakao, S., Clark, C., Tang, P., Sato, K., and Cocker III, D.: Secondary organic aerosol formation from phenolic compounds in the absence of NOx, Atmos. Chem. Phys., 11, 10649–10660, https://doi.org/10.5194/acp-11-10649-2011, 2011.
Ng, N. L., Kroll, J. H., Chan, A. W. H., Chhabra, P. S., Flagan, R. C., and Seinfeld, J. H.: Secondary organic aerosol formation from m-xylene, toluene, and benzene, Atmos. Chem. Phys., 7, 3909–3922, https://doi.org/10.5194/acp-7-3909-2007, 2007.
Odum, J. R., Jungkamp, T. P. W., Griffin, R. J., Forstner, H. J. L., Flagan, R. C., and Seinfeld, J. H.: Aromatics, reformulated gasoline, and atmospheric organic aerosol formation, Environ. Sci. Technol., 31, 1890–1897, 1997.
Palm, B. B., Campuzano-Jost, P., Ortega, A. M., Day, D. A., Kaser, L., Jud, W., Karl, T., Hansel, A., Hunter, J. F., Cross, E. S., Kroll, J. H., Peng, Z., Brune, W. H., and Jimenez, J. L.: In situ secondary organic aerosol formation from ambient pine forest air using an oxidation flow reactor, Atmos. Chem. Phys., 16, 2943–2970, https://doi.org/10.5194/acp-16-2943-2016, 2016.
Peng, Z., Day, D. A., Stark, H., Li, R., Lee-Taylor, J., Palm, B. B., Brune, W. H., and Jimenez, J. L.: HOx radical chemistry in oxidation flow reactors with low-pressure mercury lamps systematically examined by modeling, Atmos. Meas. Tech., 8, 4863–4890, https://doi.org/10.5194/amt-8-4863-2015, 2015.
Peng, Z., Day, D. A., Ortega, A. M., Palm, B. B., Hu, W., Stark, H., Li, R., Tsigaridis, K., Brune, W. H., and Jimenez, J. L.: Non-OH chemistry in oxidation flow reactors for the study of atmospheric chemistry systematically examined by modeling, Atmos. Chem. Phys., 16, 4283–4305, https://doi.org/10.5194/acp-16-4283-2016, 2016.
Pieber, S. M., Kumar, N. K., Klein, F., Comte, P., Bhattu, D., Dommen, J., Bruns, E. A., Kilic, D., El Haddad, I., Keller, A., Czerwinski, J., Heeb, N., Baltensperger, U., Slowik, J. G., and Prévôt, A. S. H.: Gas phase composition and secondary organic aerosol formation from gasoline direct injection vehicles investigated in batch and flow reactors: effects of prototype gasoline particle filters, Atmos. Chem. Phys. Discuss., https://doi.org/10.5194/acp-2017-942, in review, 2017.
Platt, S. M., El Haddad, I., Zardini, A. A., Clairotte, M., Astorga, C., Wolf, R., Slowik, J. G., Temime-Roussel, B., Marchand, N., Ježek, I., Drinovec, L., Mocnik, G., Möhler, O., Richter, R., Barmet, P., Bianchi, F., Baltensperger, U., and Prévôt, A. S. H.: Secondary organic aerosol formation from gasoline vehicle emissions in a new mobile environmental reaction chamber, Atmos. Chem. Phys., 13, 9141–9158, https://doi.org/10.5194/acp-13-9141-2013, 2013.
Platt, S. M., El Haddad, I., Pieber, S. M., Huang, R.-J., Zardini, A., Clairotte, M., Suarez-Bertoa, R., Barmet, P., Pfaffenberger, L., Wolf, R., Slowik, J. G., Fuller, S. J., Kalberer, M., Chirico, R., Dommen, J., Astorga, C., Zimmermann, N., Marchand, N., Hellebust, S., Temime-Roussel, B., Baltensperger, U., and Prévôt, A. S. H.: Two-stroke scooters are a dominant source of air pollution in many cities, Nat. Commun., 5, 3749, https://doi.org/10.1038/ncomms4749, 2014.
Platt, S. M., El Haddad, I., Pieber, S. M., Zardini, A., Clairotte, M., Suarez-Bertoa, R., Daellenbach, K. R., Huang, R.-J., Slowik, J. G., Hellebust, S., Temime-Roussel, B., Marchand, N., de Gouw, J., Jimenez, J. L., Hayes, P. L., Robinson, A. L., Baltensperger, U., Astorga, C., and Prévôt, A. S. H.: Gasoline cars produce more carbonaceous particulate matter than modern filter-equipped diesel cars, Sci. Rep.-UK, 7, 4926, https://doi.org/10.1038/s41598-017-03714-9, 2017.
Presto, A. A., Miracolo, M. A., Donahue, N. M., and Robinson, A. L.: Secondary organic aerosol formation from high-NOx photo-oxidation of low volatility precursors: n-alkanes, Environ. Sci. Technol., 44, 2029–2034, 2010.
Robinson, A. L., Donahue, N. M., Shrivastava, M. K., Weitkamp, E. A., Sage, A. M., Grieshop, A. P., Lane, T. E., Pierce, J. R., and Pandis, S. N.: Rethinking organic aerosols: Semivolatile emissions and photochemical aging, Science, 315, 1259–1262, 2007.
Shakya, K. M. and Griffin, R. J.: Secondary organic aerosol from photooxidation of polycyclic aromatic hydrocarbons, Environ. Sci. Technol., 44, 8134–8139, 2010.
Slemr, F., Giehl, H., Habram, M., Slemr, J., Schlager, H., Schulte, P., Haschberger, P., Lindermeir, E., Döpelheuer, A., and Plohr, M.: In-flight measurement of aircraft CO and nonmethane hydrocarbon emission indices, J. Geophys. Res.-Atmos., 106, 7485–7494, 2001.
Spicer, C., Holdren, M., Riggin, R., and Lyon, T.: Chemical composition and photochemical reactivity of exhaust from aircraft turbine engines, Ann. Geophys., 12, 944–955, 1994.
Stirnweis, L., Marcolli, C., Dommen, J., Barmet, P., Frege, C., Platt, S. M., Bruns, E. A., Krapf, M., Slowik, J. G., Wolf, R., Prévôt, A. S. H., Baltensperger, U., and El-Haddad, I.: Assessing the influence of NOx concentrations and relative humidity on secondary organic aerosol yields from α-pinene photo-oxidation through smog chamber experiments and modelling calculations, Atmos. Chem. Phys., 17, 5035–5061, https://doi.org/10.5194/acp-17-5035-2017, 2017.
Tkacik, D. S., Presto, A. A., Donahue, N. M., and Robinson, A. L.: Secondary organic aerosol formation from intermediate-volatility organic compounds: cyclic, linear, and branched alkanes, Environ. Sci. Technol., 46, 8773–8781, 2012.
Unal, A., Hu, Y., Chang, M. E., Odman, M. T., and Russell, A. G.: Airport related emissions and impacts on air quality: Application to the Atlanta International Airport, Atmos. Environ., 39, 5787–5798, 2005.
Westerdahl, D., Fruin, S. A., Fine, P. L., and Sioutas, C.: The Los Angeles International Airport as a source of ultrafine particles and other pollutants to nearby communities, Atmos. Environ., 42, 3143–3155, 2008.
Yee, L. D., Kautzman, K. E., Loza, C. L., Schilling, K. A., Coggon, M. M., Chhabra, P. S., Chan, M. N., Chan, A. W. H., Hersey, S. P., Crounse, J. D., Wennberg, P. O., Flagan, R. C., and Seinfeld, J. H.: Secondary organic aerosol formation from biomass burning intermediates: phenol and methoxyphenols, Atmos. Chem. Phys., 13, 8019–8043, https://doi.org/10.5194/acp-13-8019-2013, 2013.
Yu, Z., Liscinsky, D. S., Winstead, E. L., True, B. S., Timko, M. T., Bhargava, A., Herndon, S. C., Miake-Lye, R. C., and Anderson, B. E.: Characterization of lubrication oil emissions from aircraft engines, Environ. Sci. Technol., 44, 9530–9534, 2010.
Yu, Z., Herndon, S. C., Ziemba, L. D., Timko, M. T., Liscinsky, D. S., Anderson, B. E., and Miake-Lye, R. C.: Identification of lubrication oil in the particulate matter emissions from engine exhaust of in-service commercial aircraft, Environ. Sci. Technol., 46, 9630–9637, 2012.