the Creative Commons Attribution 4.0 License.
the Creative Commons Attribution 4.0 License.
 | 16 May 2018
Multi-model study of HTAP II on sulfur and nitrogen deposition
Jiani Tan
Frank Dentener
Jian Sun
Louisa Emmons
Simone Tilmes
Kengo Sudo
Johannes Flemming
Jan Eiof Jonson
Sylvie Gravel
Huisheng Bian
Yanko Davila
Daven K. Henze
Marianne T. Lund
Tom Kucsera
Toshihiko Takemura
Terry Keating
This study uses multi-model ensemble results of 11 models from the second phase of Task Force Hemispheric Transport of Air Pollution (HTAP II) to calculate the global sulfur (S) and nitrogen (N) deposition in 2010. Modeled wet deposition is evaluated with observation networks in North America, Europe and East Asia. The modeled results agree well with observations, with 76–83 % of stations being predicted within ±50 % of observations. The models underestimate SO, NO and NH wet depositions in some European and East Asian stations but overestimate NO wet deposition in the eastern United States. Intercomparison with previous projects (PhotoComp, ACCMIP and HTAP I) shows that HTPA II has considerably improved the estimation of deposition at European and East Asian stations. Modeled dry deposition is generally higher than the “inferential” data calculated by observed concentration and modeled velocity in North America, but the inferential data have high uncertainty, too. The global S deposition is 84 Tg(S) in 2010, with 49 % in continental regions and 51 % in the ocean (19 % of which coastal). The global N deposition consists of 59 Tg(N) oxidized nitrogen (NOy) deposition and 64 Tg(N) reduced nitrogen (NHx) deposition in 2010. About 65 % of N is deposited in continental regions, and 35 % in the ocean (15 % of which coastal). The estimated outflow of pollution from land to ocean is about 4 Tg(S) for S deposition and 18 Tg(N) for N deposition. Comparing our results to the results in 2001 from HTAP I, we find that the global distributions of S and N deposition have changed considerably during the last 10 years. The global S deposition decreases 2 Tg(S) (3 %) from 2001 to 2010, with significant decreases in Europe (5 Tg(S) and 55 %), North America (3 Tg(S) and 29 %) and Russia (2 Tg(S) and 26 %), and increases in South Asia (2 Tg(S) and 42 %) and the Middle East (1 Tg(S) and 44 %). The global N deposition increases by 7 Tg(N) (6 %), mainly contributed by South Asia (5 Tg(N) and 39 %), East Asia (4 Tg(N) and 21 %) and Southeast Asia (2 Tg(N) and 21 %). The NHx deposition increases with no control policy on NH3 emission in North America. On the other hand, NOy deposition has started to dominate in East Asia (especially China) due to boosted NOx emission.
- Article
(3731 KB) - Full-text XML
-
Supplement
(5963 KB) - BibTeX
- EndNote


Nitrogen (N) plays an important role in the balance of the global ecosystem. Human activities such as consumption of fossil fuels, production and usage of N fertilizers, and livestock cultivation disturb the N cycle in the ecosystem (Vitousek et al., 1997; Galloway et al., 2008). Estimation under the IPCC Special Report on Emissions Scenarios (SRES) A2 scenario predicts that the N deposition over land will increase by a factor of ∼ 2.5 from 2000 to 2100 (Lamarque et al., 2005). Elevated N deposition can cause exceedance of N critical loads on ecosystems (Sanderson et al., 2006; Sun et al., 2017). About 11 % of the world's natural vegetation has already received N deposition that exceeds the critical load in 2000 (Dentener et al., 2006). The most affected regions are eastern Europe (80 %), South Asia (60 %) and East Asia (40–50 %). This percentage will be 40 % for the world's protected areas in 2030 (Bleeker et al., 2011). Elevated S and N deposition are also associated with a host of environmental issues such as acidification and eutrophication of the terrestrial system (Bouwman et al., 2002), loss of ecosystem biodiversity (Bobbink et al., 2010), harming heterotrophic respiration and disturbing the soil decomposition process (Janssens et al., 2010), although some studies have found that increasing N deposition could benefit the carbon uptake by land processes (Reay et al., 2008; Holland et al., 1997). Similar to the terrestrial system, over-richness of S and N deposition are also threats to the aquatic system by acidification (Doney et al., 2007) and eutrophication of the ocean (Bergstrom and Jansson, 2006; Jickells, 2006; Jickells et al., 2017).
In order to understand S and N deposition, a number of global-scale studies have been conducted in the last decade. Dentener et al. (2006) investigated the current (2000) and future (2030) S and N deposition with multi-model ensemble results of ACCENT IPCC Fourth Assessment Report (AR4) experiment (PhotoComp). Model evaluation showed that 60–70 % of modeled wet deposition is within ±50 % of measurements in Europe and North America. NHx deposition was overestimated in South Asia, and NOy deposition was underestimated in East Asia. Eleven percent of the world's nature vegetation received N deposition that exceed the critical load in 2000, and this percentage would increase to 17 % under current air quality legislation and 25 % under the IPCC SRES A2 scenario in 2030. Sanderson et al. (2008) used the ensemble results of the first phase of the Task Force Hemispheric Transport of Air Pollution (HTAP I) to estimate the long-range transport of oxidized nitrogen between Europe, North America, South Asia and East Asia. Results showed that 8–15 % of NOx from source regions could be transported beyond the distance of 1000 km, which indicated the impact of intercontinental transport of air pollutants on deposition. Lamarque et al. (2013) calculated the S and N deposition in 2000 using a multi-model ensemble of the Atmospheric Chemistry and Climate Model Intercomparison Project (ACCMIP). Model performance on NO wet deposition was comparable with PhotoComp and HTAP I, but NH wet deposition was not well simulated. Simulations with the projected emissions in 2100 under four Representative Concentration Pathways (RCPs) indicated that N deposition is likely to substantially increase in Latin America, Africa and parts of Asia (especially South Asia) in the future. Vet et al. (2014) conducted a comprehensive evaluation on the multi-model performance on deposition of HTAP I. The results underestimated the wet deposition at observation sites with high observed N deposition in North America, southern and northern Europe, and East Asia. Dry deposition in the Unites States was found to deviate with inferential dry deposition data. Kanakidou et al. (2016) used the ACCMIP simulation results under historical, RCP6.0 and RCP8.5 emission scenarios to estimate the changes in N deposition driven by human activity in the past (1850), present (2005) and future (2050). The results showed that organic nitrogen (ON) from primary emission and secondary organic aerosol (SOA) account for 20–30 % of total N deposition. The impact of human activity on N deposition has increased from 15 % in the past to 60 % in present years, and this impact is likely to persist in the future. Bian et al. (2017) examined the possible factors causing the inter-model diversity in simulating NO and NH deposition by comparing the results of nine models participating in the third phase of Aerosol Comparisons between Observations and Models (AeroCom III). The results showed that models have large differences in calculating the pH adjustment for the effective Henry's law constant, which could greatly influence the simulation of NHx wet deposition.
These studies give a clear view of S and N deposition in the early 2000s. However, large changes are seen in the global N emissions in the last decade (van der A et al., 2008), including a large increase in China (Q. Zhang et al., 2009; van der A et al., 2006; Richter et al., 2005; Kurokawa et al., 2013; Zhang et al., 2007; Li et al., 2017) and general decreases in both Europe (Tørseth et al., 2012) and the eastern United States (Kim et al., 2006). In addition, ground observations and satellite measurements show large increases in the dry deposition in the western United States, eastern Europe and east China, together with decreases in the eastern United States, western Europe and Japan (Jia et al., 2016). Thus, a follow-up study is needed to update our knowledge about the S and N deposition with emission changes in the 21st century.
In this study, we use the multi-model mean (MMM) of 11 global models from the second phase of the HTAP (HTAP II) to calculate the S and N deposition in 2010. Section 2 gives a short description of the HTAP II and introduces the method to develop MMM and metrics for model evaluation. Section 3.1 evaluates MMM performance on wet deposition with observations from networks in North America, Europe and East Asia. The modeled dry deposition is compared with the inferential data in North America (see details in Sect. 3.1). We also compare the model performance of this study with previous studies in 2001 of PhotoComp (Dentener et al., 2006), HTAP I (Vet et al., 2014) and ACCMIP (Lamarque et al., 2013). Section 3.2 and 3.3 estimate the S and N deposition in continental, coastal and ocean regions in 2010. By comparing our results with deposition in 2001 of HTAP I, we investigate the changes of deposition in the past 10 years. We conclude with the findings in Sect. 4.
2.1 Model description and experiment setup
The HTAP was developed in 2005 aiming at understanding the long-range transport of air pollution and its impact on regional air quality. HTAP I has involved more than 20 global models with the base simulation year of 2001. A comprehensive assessment has been published to summarize the findings in HTAP I with respect to the long-range transport of (1) ozone and particulate matter, (2) mercury and (3) persistent organic pollutants (HTAP, 2010). The HTAP II was launched in 2012 with the base year of 2010. A prescribed emission inventory called HTAPv2.2 is used by models from different groups to facilitate a fair evaluation of the models' ability and uncertainty (Galmarini et al., 2017). It is a harmonized emission inventory formed by the best estimation of emissions from different organizations, including the Environmental Protection Agency (EPA) of the United States, the EPA and Environment Canada, the European Monitoring and Evaluation Programme (EMEP) and the Netherlands Organisation for Applied Scientific Research (TNO), the Model Intercomparison Study for Asia (MICS-Asia III) and the Emission Database for Global Atmospheric Research (EDGARv4.3). The development of the emission inventory is described in Janssens-Maenhout et al. (2015). The following are some highlights of the findings from HTAP II. Stjern et al. (2016) estimated the impact of domestic and foreign emission change of black carbon, organic carbon and SO4 on regional radiative forcing. Huang et al. (2017) studied the impact of intercontinental outflow from East Asia to North America on O3 pollution by simulating the regional-scale Sulfur Transport and dEposition Model (STEM) with boundary conditions provided by three global transport models. Jonson et al. (2018) conducted a source apportionment for O3 pollution in Europe and calculated the global contributions of emissions. Tan et al. (2018) investigated the intercontinental export of sulfur and nitrogen emission and its impact on local deposition.
Among the 20 models participating in the HTAP II (configurations described in Stjern et al., 2016), 11 models (i.e., CAM-Chem, CHASER_re1, CHASER_t106, EMEP_rv48, GEMMACH, GEOS5, GEOSCHEMAJOINT, OsloCTM3v.2, GOCARTv5, SPRINTARS and C-IFS_v2) submitted the model outputs of S and N deposition. To develop the MMM, all models are interpolated to a uniform 0.1∘ × 0.1∘ horizontal resolution (the same resolution as the emission inventory) by linear interpolation. Then the MMM of the emission/deposition quantities of each of S and N is calculated by averaging (arithmetic mean) all available model outputs. More details are demonstrated in Sect. 2.2. The base year of simulation is 2010, with an additional 6-month run as model spin-up. The administrative boundaries of 17 regions are shown in Fig. S1 in the Supplement. Details about the experiment setup can be found in Galmarini et al. (2017).
2.2 Method for calculating the MMM
To make the discussion clear, we define the terms as follows: the continental regions refer to all land regions including the Antarctic. The coastal regions are defined in Fig. S1. In Sect. 3.2 and 3.3, the S deposition contains gas phase SO2 deposition and aerosol SO deposition. The N deposition includes oxidized nitrogen (NOy) deposition and reduced nitrogen (NHx) deposition. NOy deposition is composed of all oxidized nitrogen species except N2O. Based on the model outputs, NOy deposition mainly includes NO2, HNO3, aerosol NO, peroxyacyl nitrate (PAN) and other organic nitrates than PAN. NHx deposition consists of gas phase NH3 deposition and aerosol NH deposition. Before constructing the MMM, we check the quality of model outputs using two criteria. First, we check the mass balance of each model by comparing its global deposition with its emission. A models is excluded if its deposition value falls outside the range of ±20 % of its emission values. The second criterion is to check if the result of a model is away from the mean value of all models. We adopt the median of models ±1.5 × interquartile by Vet et al. (2014) as upper and lower limits and check the values separately for all species of deposition and emission. The models used to develop the MMM and their values are summarized in Tables S1–S3 in the Supplement. After the quality check, we calculate the mean value of species using Eq. (1) with all available model outputs. Then, we combine all of the related species into total deposition/emission by Eq. (2).
For both Eqs. (1) and (2), i is the individual model and j is the species of deposition/emission from model outputs. Si(j) is the species j from model i, and SMMM(j) is the MMM of species j.
2.3 Model evaluation metrics
To compare the model performance with previous projects consistently, we adopt the following metrics in Lamarque et al. (2013): linear fit slope, mean bias, mean observation, mean model, correlation coefficient (R) and fraction (of model results) within ±50 % (of observations).
In addition, we use four statistical metrics following Eqs. (3)–(6).
For Eqs. (3)–(6), Mi is the model result, Oi is the observation and n is the sample size. NMB, NME, MFB and MFE normalize the model mean bias to avoid data inflation in case of a large data range. NMB and NME normalize the mean bias by the observation data and thus may tend toward model overestimation. MFB and MFE normalize the mean bias by the average of observations and model results, considering both model overestimation and underestimation, and thus are less biased. In Sect. 3.1, we use MFB and MFE as the main metrics to evaluate the model performance.
3.1 Evaluation of model performance
3.1.1 Wet deposition
We evaluate the MMM results of SO, NO and NH wet deposition with site observations in the United States, Europe and East Asia. The MMM result is annual deposition in 2010, and the observation data are 3-year annual average deposition during 2009–2011. The observation data in the United States comes from the National Atmospheric Deposition Program (NADP) (http://nadp.sws.uiuc.edu/, last access: 6 April 2018). The quality and completeness of the observations are checked according to the four criteria established by the NADP technical committee (http://nadp.sws.uiuc.edu/documentation/notes-depo.html, last access: 6 April 2018). As a result, we use the data from 136 stations of the 267 available stations. The observations in Europe are derived from the European Monitoring and Evaluation Programme (EMEP) CCC reports (http://www.nilu.no/projects/ccc/reports.html, last access: 6 April 2018). We use the data from 82 stations of the 102 available stations. The observations in Asia are from the Acid Deposition Monitoring Network in East Asia (EANET) (http://www.eanet.asia/, last access date: 6 April 2018). Data from 43 stations of the 52 available stations are used for evaluation.

Figure 1Evaluation of MMM performance of SO, NO and NH wet deposition (mg(N or S) m−2 yr−1) at (a, d, g) NADP, (b, e, h) EMEP and (c, f, i) EANET stations. The MMM is the annual wet deposition in 2010, and the observation is 3-year average annual data of 2009–2011. Performances of individual models are in Figs. S2–S4.
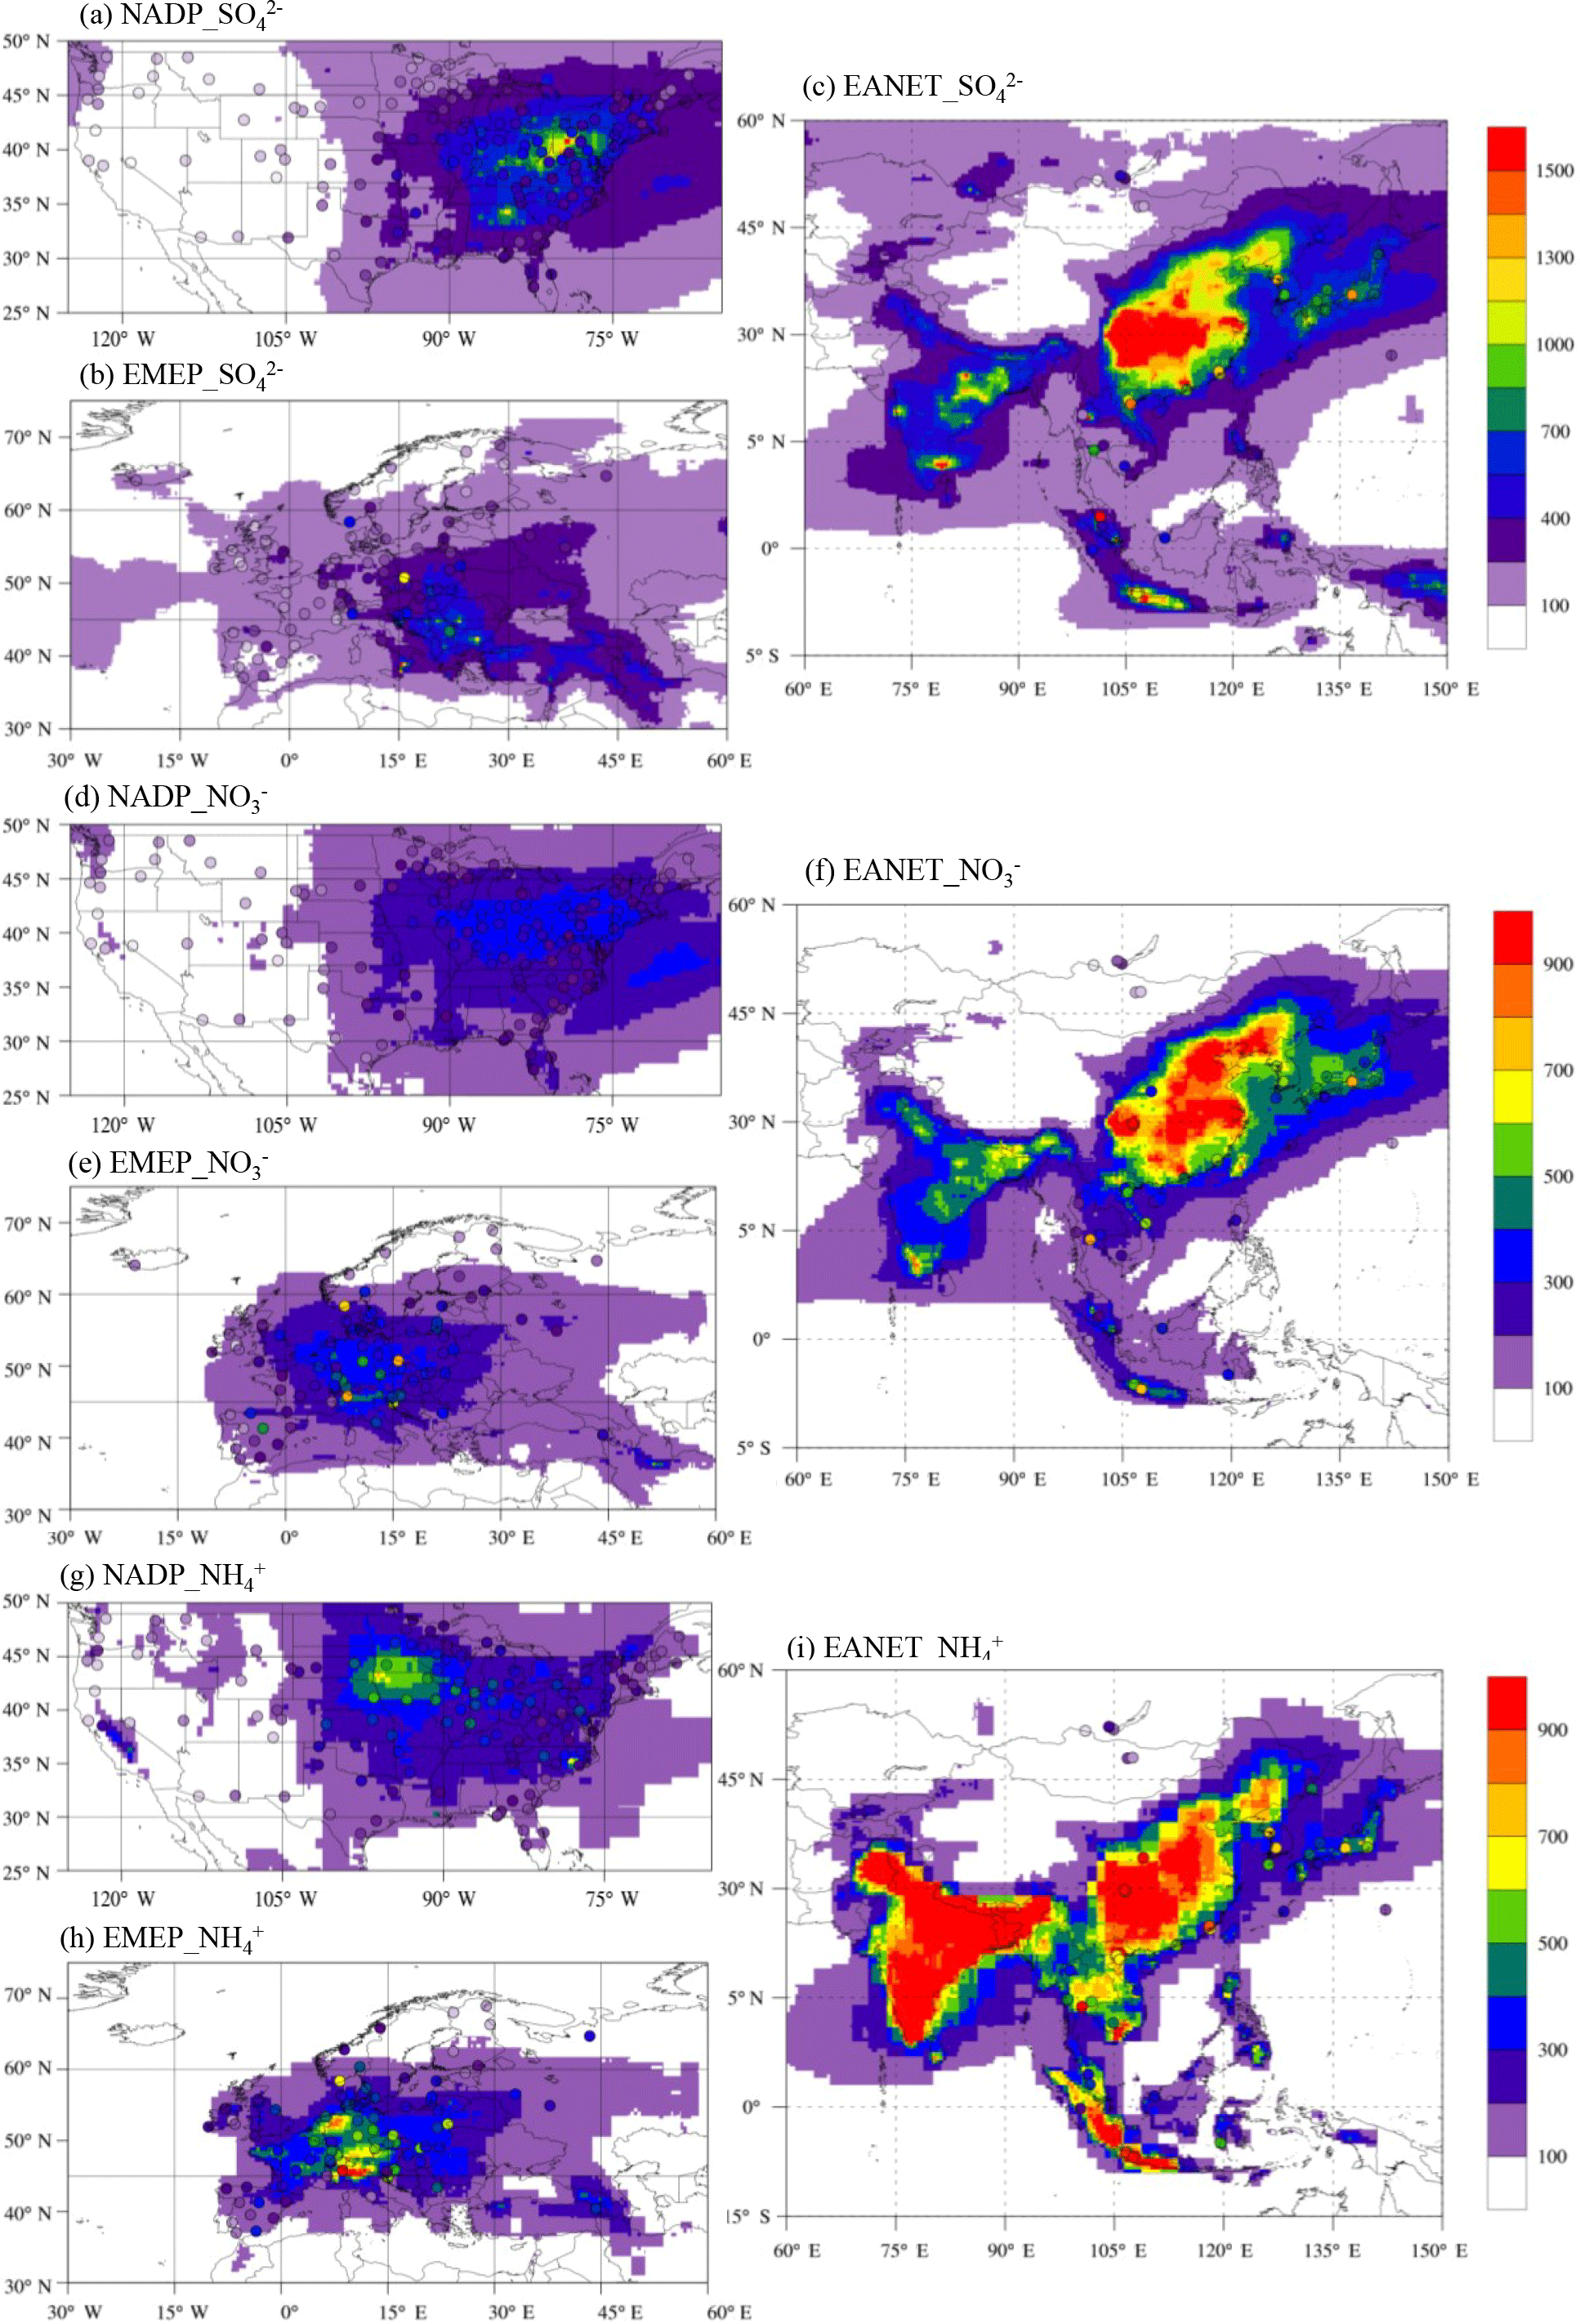
Figure 2Distribution of SO, NO and NH wet deposition (mg(N or S) m−2 yr−1) of MMM and observation. The MMM is the annual wet deposition in 2010, and the observation is 3-year average annual data of 2009–2011. Contours are MMM results, and filled circles are observation.
Figure 1 shows the scatterplots of the MMM SO, NO and NH wet deposition with observations at the NADP, EMEP and EANET stations. Performances of individual models can be found in Figs. S2–S4. The SO wet deposition comprises gas phase SO2 and aerosol SO wet deposition. The NO wet deposition includes gas phase HNO3 and aerosol NO wet deposition. The NH wet deposition contains gas phase NH3 and aerosol NH wet deposition. Figure 2 displays the spatial distributions of MMM SO, NO and NH wet deposition (contours) with observations (filled circles). In terms of SO wet deposition, the MMM results are consistent with observations at the NADP stations with a slope close to 1 (0.9) and a high R value (0.8) (Fig. 1a). The MFB and MFE are 9 and 32 %, respectively, indicating slight overestimation. According to Fig. 2a, the observed SO wet deposition is highest in the northeastern United States, and this spatial distribution is well captured by MMM. The EMEP stations are well simulated with low MFB (−7 %) and MFE (25 %) (Fig. 1b). The MMM predictions are within ±50 % of observations at 87 % of the stations. According to Fig. 2b, one station in Poland and one station in Norway, with observed SO wet deposition of 1000 and 500 mg(S) m−2 yr−1, respectively, are both underestimated by 50 %. We evaluate the model performances on simulating precipitation (Figs. S5 and S6). For the Norwegian site, the observed precipitation is 1566 mm yr−1, and the MMM underestimated the precipitation by 49 %, which fits well for the 50 % underestimation of SO wet deposition at this site. For the Polish site, the observed precipitation is 1137 mm yr−1 and the MMM underestimated the precipitation by 21 %. The underestimation in precipitation could partly explain the negative model bias in simulating SO wet deposition. Another possible reason is the high topography of the sites. The Polish site is 1603 m a.s.l. (above sea level), which is one of the highest sites among the European sites. Similar to the Polish site, one site in Spain, which is at a height of 1360 m, is underestimated by 142 mg(S) m−2 yr−1 (59 %) for SO wet deposition, while its precipitation is well simulated with a slight positive model bias of 5 %. At the EANET stations, very high SO concentrations were measured at some stations, probably correlated with dust emission (Dentener et al., 2006). To make a consistent comparison with previous projects, we ignore the measurements coincident with measured calcium (Ca2+) deposition larger than 20 mole m−2 yr−1. The evaluation (Fig. 1c) shows that the SO wet deposition is generally underestimated at the EANET stations by 23 % (MFB) and 44 % (MFE). The stations in Korea and Vietnam are generally underestimated by more than 200 mg(S) m−2 yr−1 (Fig. 2c). On the other hand, the SO wet deposition is generally well simulated in Indonesia, the Philippines, Thailand and Japan. Overall, 76 % of the stations of all networks predicted quantities within ±50 % of observations. The EANET stations have the highest model bias among the three networks. It should be noted that for the three excluded stations (located in China) with high Ca2+ deposition, the SO wet deposition is largely underestimated by more than 1000 mg(S) m−2 yr−1 (not shown in figures). If we include these stations in the model evaluation, the mean bias for East Asia changes from −160 to −300 mg(S) m−2 yr−1. We also realize that the observation stations in China are mainly located along the eastern and southern coast, while the highest modeled deposition is found in the inland areas. Therefore, it is hard to conduct a comprehensive evaluation over this region due to unavailable measured data in the inland areas.
For NO wet deposition, the MMM results agree well with observations at the NADP stations, as shown by the linear regression line in Fig. 1d with a slope of 1.2 and R value of 0.9. However, the amount of deposition is overestimated by 33 % (MFB) and 36 % (MFE). According to Fig. 2d, there is a general tendency of overestimation throughout the stations in the United States, especially the stations located in the Midwest and southeast. At the EMEP stations, the NO wet deposition is well simulated with low MFB of −5 % and MFE of 24 % (Fig. 1e). The modeled deposition is within ±50 % of observed deposition at more than 90 % of the stations. The MMM results are close to the observations at stations with deposition lower than 400 mg(N) m−2 yr−1 but generally underestimate the deposition at stations with higher observations. According to Fig. 2e, wet deposition at three stations in Poland, Norway and Spain were underestimated by 430 (59 %), 420 (63 %) and 290 (67 %) mg N m−2 yr−1, respectively. Furthermore, the stations in Germany are generally underpredicted by 100–200 mg(N) m−2 yr−1. The NO wet deposition at the EANET stations is well simulated with MFB (−3 %) and MFE (43 %) (Fig. 1f). The model estimations are within ±50 % of observations for 77 % of the stations. According to Fig. 2f, one station in central China is overestimated by 400 (130 %) mg(N) m−2 yr−1. In contrast, three stations in Thailand, Vietnam and Malaysia are underestimated by 570 (78 %), 350 (66 %) and 200 (64 %) mg(N) m−2 yr−1. Overall, 83 % of the stations of all networks are predicted within ±50 % of observations. The NADP stations have the highest MFB due to a generally positive bias in the eastern United States. The EANET stations have the highest MFE value, mainly due to the underestimation in Southeast Asia.
The modeled NH wet deposition agrees well with observations at the NADP stations with MFB of 7 % and MFE of 25 % (Fig. 1g). About 88 % of modeled deposition is within ±50 % of observations. The MMM has captured the high deposition in the United States Midwest well but slightly underestimates the deposition in the southeast (Fig. 2g). At the EMEP stations, the NH wet deposition is well simulated with MFB of −1 % and MFE of 36 % (Fig. 1h). The MMM results are close to the observations at most stations and reproduce the high deposition in Germany and Italy well (Fig. 2h). Some stations in Norway and Poland are slightly underestimated by 100–200 mg(N) m−2 yr−1. These stations all report higher observed deposition than 500 mg(N) m−2 yr−1. The NH wet deposition is underestimated at the EANET stations by 10 % (MFB) and 50 % (MFE) (Fig. 1i). The MMM has captured the high deposition in eastern China and Indonesia well but generally underestimates the NH wet deposition at the Russian stations (Fig. 2i). In addition, the observed deposition at the three Korean stations is relatively high (∼ 500–600 mg(N) m−2 yr−1), but the MMM fails to reproduce any of them. There could be a missing emission source in that region. Overall, 81 % of the MMM predictions are within ±50 % of observations at stations of all networks. The NH wet deposition is somewhat underestimated in all three regions, especially in East Asia.
Table 1Intercomparison of HTAP II MMM performance with previous projects on wet deposition. The unit is mg(N or S) m−2 yr−1.
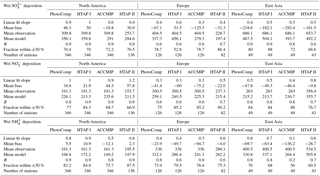
Table 1 compares the model performance of this study (HTAP II) with previous projects of PhotoComp (Dentener et al., 2006), HTAP I (Vet et al., 2014) and ACCMIP (Lamarque et al., 2013). It should be noted that the emission inputs, simulation periods and participating groups of this study (year 2010) are different from those of the previous projects (year 2001). Although the observations are from the same networks, the previous projects used 3-year averaged observations of 2000–2002 and this study used those of 2009–2011. Due to these differences, the model performances may not be totally comparable. In terms of SO wet deposition, the model performance is similar to that for previous projects in North America, with 4–6 % higher percentage of stations within ±50 % of observations. Large improvement is found in Europe. The absolute mean bias decreases from 50–130 to 30 mg(S) m−2 yr−1. There is a 10 % increase in the fraction of stations within ±50 % of observations. At the East Asian stations, the absolute mean bias decreases slightly from 180–290 to 160 mg(S) m−2 yr−1. But the R value and fraction within ±50 % have somewhat declined. For NO wet deposition, HTAP II performs similar to the ensembles used in previous projects in North America but slightly better in Europe, with a lower mean bias and 5 % increase in the fraction within ±50 % of observations. The model mean bias at the East Asian stations has decreased significantly from ∼ 50 to ∼ 1 mg(N) m−2 yr−1. However, the biases for individual models are large (Fig. S3). Large negative model bias is found in Southeast Asia, and improvements are needed in the future. In terms of NH wet deposition, HTAP II shows similar R values to those of ensembles used for the previous projects in North America, with slightly lower model bias. HTAP II shows considerable improvement in Europe. The slope of the regression line increases from 0.3–0.4 to 0.6, and the mean bias decreases from as large as −95 to −4 mg(N) m−2 yr−1. For East Asia, the slope, mean bias and R values for HTAP II are all within the ranges of the previous projects, while the absolute mean bias decreases from 70–140 to 30 mg(N) m−2 yr−1.
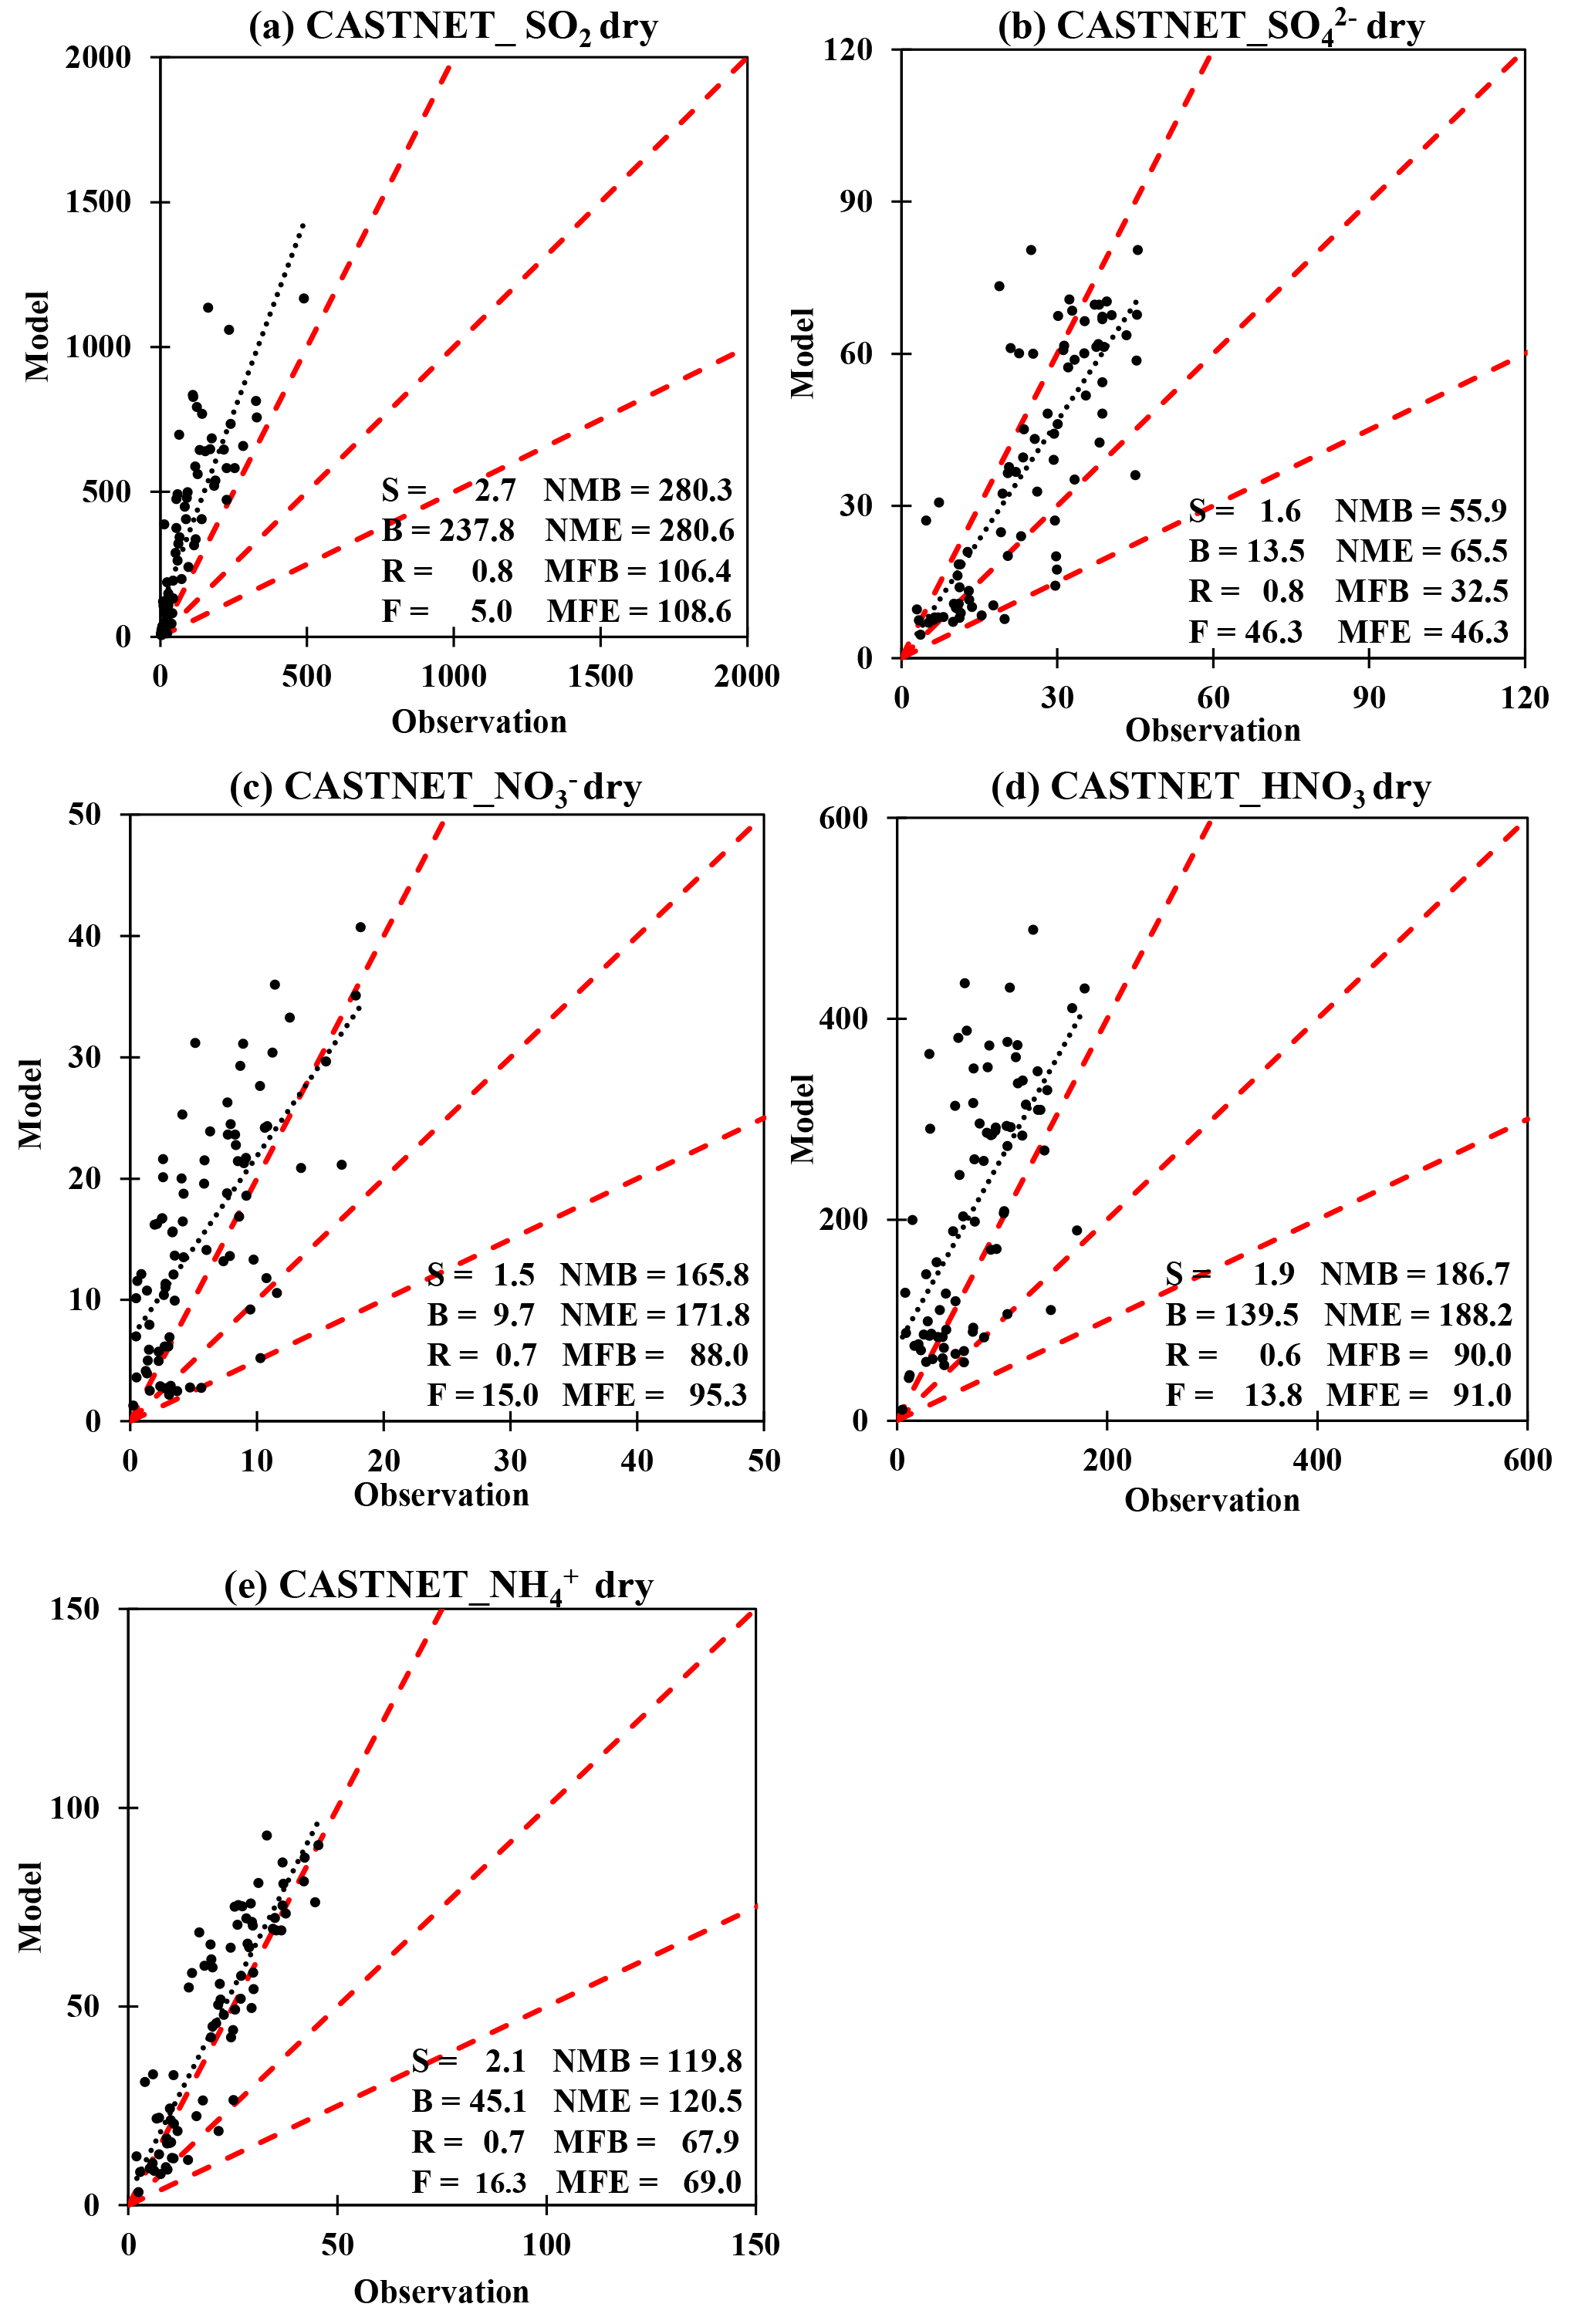
Figure 3Evaluation of MMM performance of SO2, SO, NO, HNO3 and NH dry deposition (mg(N or S) m−2 yr−1) at CASTNET stations. The MMM is the annual dry deposition in 2010, and the observation data are 3-year average annual data during 2009–2011 from the CASTNET network. Performances of individual models are in Figs. S7–S11.
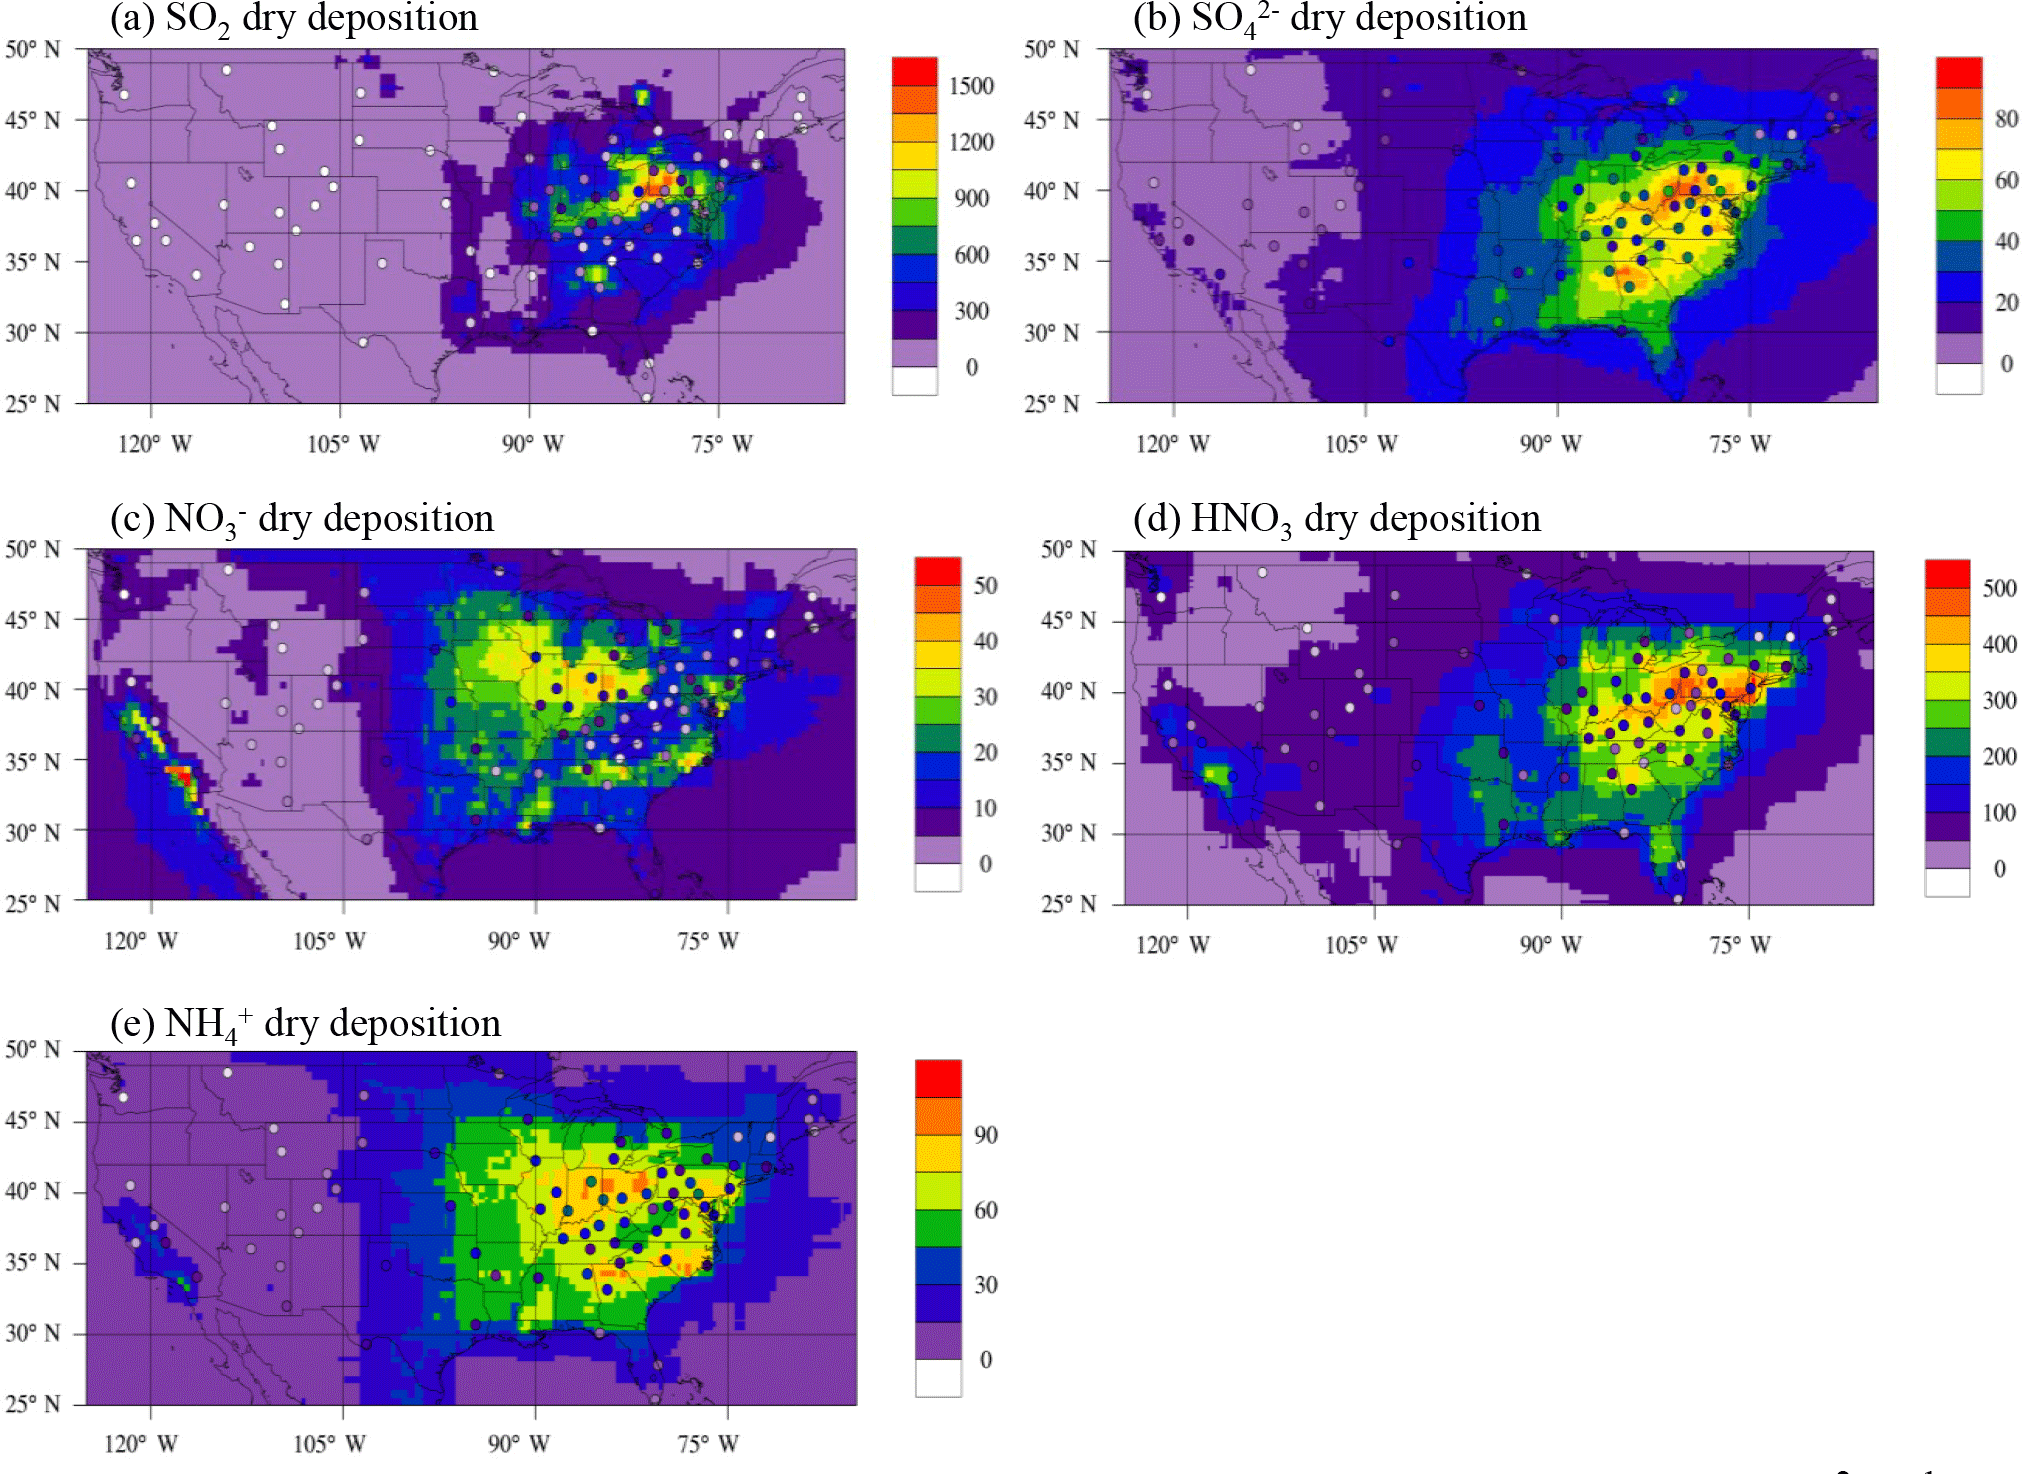
Figure 4Distribution of SO2, SO, NO, HNO3 and NH dry deposition (mg(N or S) m−2 yr−1) of MMM and observation. The MMM is the annual dry deposition in 2010, and the observation is 3-year average annual data of 2009–2011. Contours are MMM results, and filled circles are inferential data from CASTNET.
3.1.2 Dry deposition
The number of dry deposition measurements is limited due to difficulty in measuring the dry deposition directly by instruments. This study evaluates the dry deposition in the United States using information from the Clean Air Status and Trends Network (CASTNET). Instead of direct measurements, the data are produced by an “inferential” method, using calculations of the measured concentration of species and modeled dry deposition velocities. We use the 3-year average data of 2009–2011 from CASTNET and adopt the same selection criteria as we did for the wet-deposition measurements. Data from 81 stations out of 85 available stations are used for comparison. Figure 3 shows the scatterplots of the MMM SO2, SO, NO, HNO3 and NH dry deposition with inferential data at the CASTNET stations. Performances of individual models can be found in Figs. S7–S11. The modeled SO2 dry deposition is 240 (170 %) mg(S) m−2 yr−1 higher than the inferential data, and only 5 % of the stations are within ±50 % of the inferential values. There are smaller discrepancies for SO dry deposition (14 mg(S) m−2 yr−1 and 60 %) between model and inferential results. Modeled NO, HNO3 and NH dry deposition is generally 50–100 % higher than the inferential data, and the fraction within ±50 % is about 15 %. Figure 4 shows the spatial distributions of MMM dry deposition (contours) with the inferential data (filled circles). The MMM results are consistent with the inferential data in the western United States, where the dry deposition is generally low. And both datasets predict high NO dry deposition in western California. Large disagreements are found in the eastern United States. In the Midwest (mainly Indiana and Ohio), although both results estimate higher N (NO, HNO3 and NH dry deposition in this region than the others, the prediction of MMM is 20–30 mg(N) m−2 yr−1 higher than the inferential data at every station. In addition, the MMM estimates much higher deposition in the southern and northeastern United States than in the western United States, but this gradient is much weaker in the inferential data.
Table 2Intercomparison of HTAP II MMM performance with previous projects on dry deposition. The unit is mg(N or S) m−2 yr−1. S dry deposition is the sum of SO2 and SO dry deposition. N dry deposition is the sum of HNO3, NO and NH dry deposition (not including NO2 and NH3 deposition).
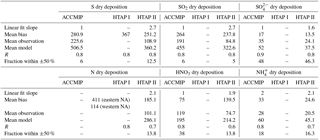
Table 2 compares the model performance of this study (HTAP II) with that of the models used in HTAP I (Vet et al., 2014) and ACCMIP (Sun et al., 2017). HTAP I used the 2001 simulation results and compared them with 3-year average (2000–2002) CASTNET data. ACCMIP used 10-year averages of both MMM and CASTNET data from 2000 to 2009. The N dry deposition values for all projects contain NO, NH and HNO3, and the S dry deposition includes SO2 and SO. Both HTAP I and HTAP II overestimated the S and N dry deposition, but HTAP II has ∼ 100 mg(S) m−2 yr−1 and ∼ 80 mg(N) m−2 yr−1 lower mean bias than HTAP I. The comparison with ACCMIP results may not be solid since there are large differences in simulation periods. Generally, the HTAP II performance is similar to ACCMIP for NH, SO2 and SO dry deposition but has a larger mean bias for HNO3 dry deposition.
Since the CASTNET dry deposition is not actually measured but instead a calculation of measured concentration of species and modeled dry deposition velocities, it is necessary to investigate which factor of these two contributes to the model bias. We compare the modeled air pollutant concentrations with CASTNET measurements as shown in Tables S4–S8. The MMM overestimates the SO2, SO, HNO3, NO and NH concentrations by 394, 40, 217, 135 and 173 %, respectively. It should be noted that the CASTNET sites are generally located in rural regions that are away from emission sources (Sickles and Shadwick, 2008); thus the measured concentrations of air pollutants are relatively low compared with those of urban sites, while the resolutions of the HTAP II models range from 0.5 to 3∘ and are not fine enough to reproduce the characteristic of some rural sites. The models with finer resolutions except CHASER_t106 model (i.e., EMEP_rv48 (0.5∘ × 0.5∘) and SPRINTARS (1.1∘ × 1.1∘)) generally perform better than the others, while models with coarse resolutions (i.e., CHASER_re1 (2.8∘ × 2.8∘) and OsloCTM3.v2 (2.8∘ × 2.8∘)) generally do not perform well for all species. This could explain the overestimation of air pollutant concentrations at the CASTNET sites.
In order to check the differences of modeled dry deposition velocity between CASTNET and HTAP II models, we adopt the general approach for calculating dry deposition velocity from Wesely (1989):
where Vd is the deposition velocity, Fc is the dry deposition flux and Ca is the concentration of species. The negative mark indicates the direction of the dry deposition velocity. This scheme has been widely adopted in global models (Wesely and Hicks, 2000) with modifications. We compare the calculated dry deposition velocity of models and CASTNET (Tables S9–S13). The mean biases of dry deposition velocities for MMM are −8, 0.3, 7, 19 and 2 % for SO2, SO, HNO3, NO and NH, respectively, which are much lower than those of air pollutants. The model bias for dry deposition at the CASTNET sites mainly comes from the model overprediction of air pollutant concentration.
In addition, the CASTNET estimation of dry deposition has been reported with uncertainties. L. Zhang et al. (2009) estimated a 10–20 % uncertainty in the measurement of the mixing ratio of species, 20 % in the calculated velocity and ∼ 20 % when lacking hourly concentration for species with strong diurnal variation. Schwede et al. (2011) compared CASTNET dry deposition estimates with those of the Canadian Air and Precipitation Monitoring Network (CAPMoN). The CASTNET data are 54 % lower for SO2 dry deposition and 47 % lower for HNO3 dry deposition than CAPMoN, mainly due to using different models to calculate the dry velocity.
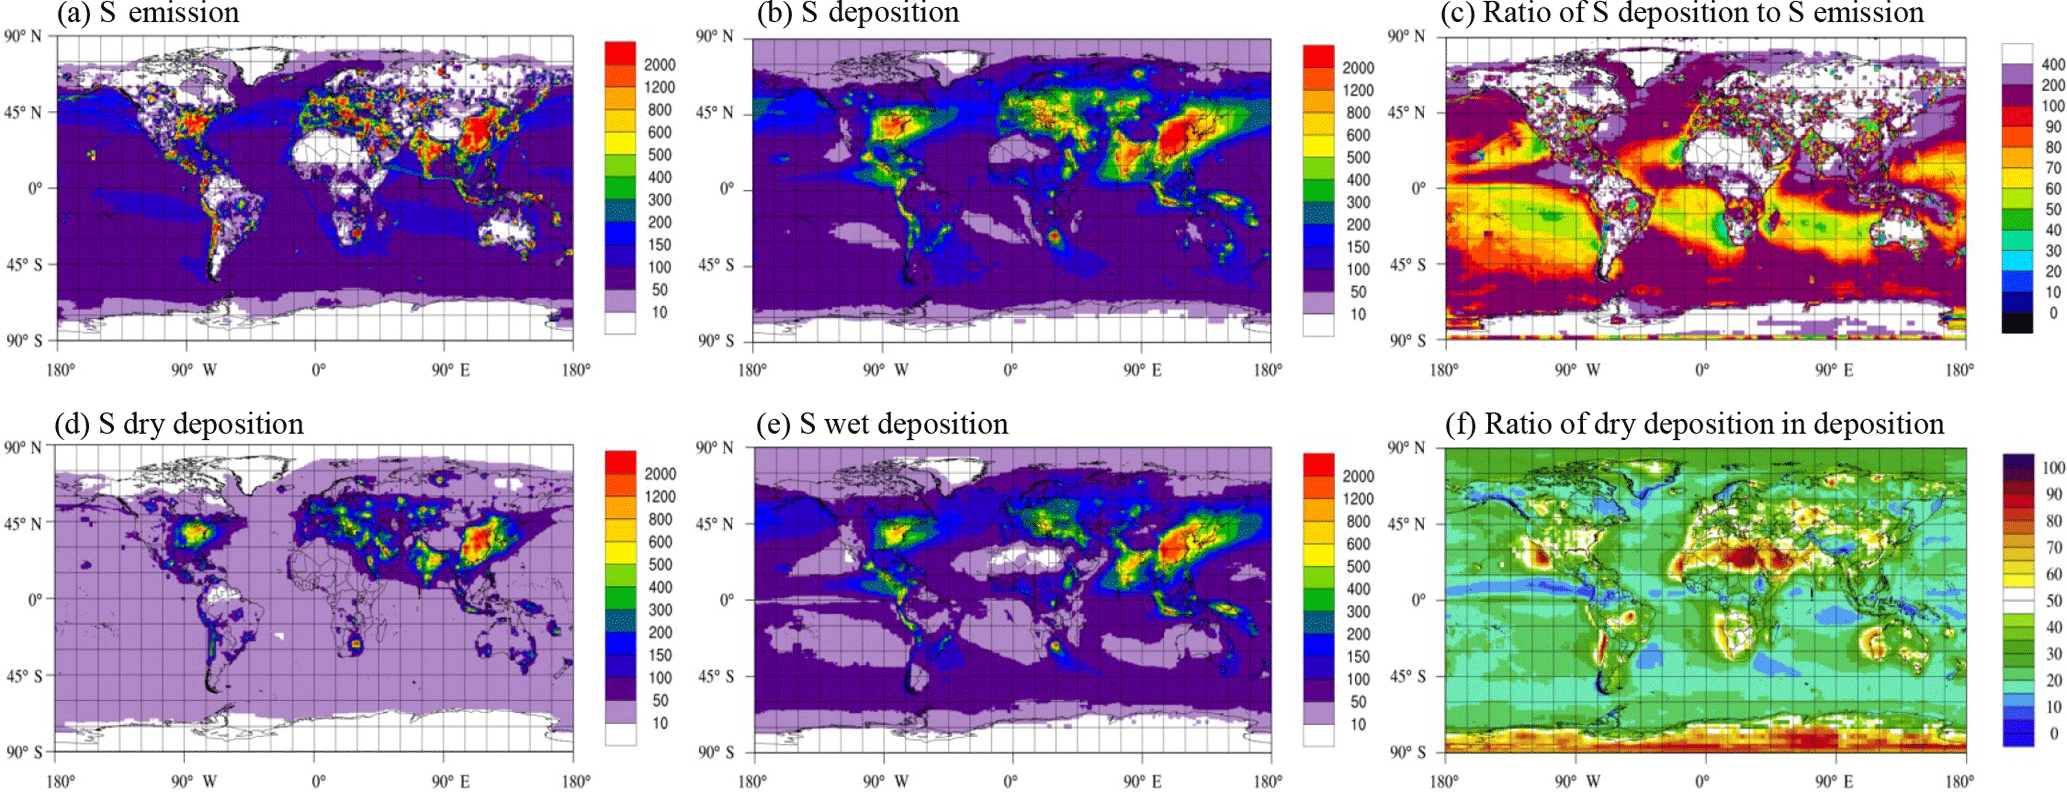
Figure 5(a–c) MMM results of S emission and deposition in 2010 (mg(S) m−2 yr−1) and ratio of S deposition in S emission (%). (d–f) MMM results of S dry and wet deposition in 2010 (mg(S) m−2 yr−1) and ratio of dry deposition in total (wet + dry) deposition (%).
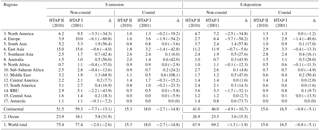
Table 3MMM estimates of S deposition and emission in 2010 (Tg(S) yr−1) and comparison with HTAP I results. Δ is the difference between 2010 and 2001 calculated as (HTAP II − HTAP I). The number in parentheses is the percentage of change, calculated as .
3.2 Total S deposition
Table 3 lists the calculated amount of S emission and deposition in continents, coastal regions and oceans. Figure 5 presents the distribution of S emission and deposition from MMM results. The distributions of components of S deposition are shown in Fig. S12. The global S deposition is 84 Tg(S) in 2010, with 49 % in non-coastal continents, 32 % in non-coastal ocean and 19 % in coastal areas. For continental non-coastal regions, East Asia receives the largest amount of S deposition (17 %). The highest S deposition is found in eastern China (2000 mg(S) m−2 yr−1) (Fig. 5b). Other regions with largely extended areas of high S deposition are the Indian subcontinent (800–1200 mg(S) m−2 yr−1), Malaysia and Indonesia (∼ 1200 mg(S) m−2 yr−1), the United States Midwest (800–2000 mg(S) m−2 yr−1), Mexico and Central America (400–800 mg(S) m−2 yr−1), Peru and Chile (400–600 mg(S) m−2 yr−1), eastern Europe (∼ 800 mg(S) m−2 yr−1) and the northeastern Middle East (500–1200 mg(S) m−2 yr−1). The distribution of high-deposition regions agrees very well with high-S-emission regions (Fig. 5a). For coastal regions, East Asia and Southeast Asia receive the most S deposition (3 and 3 %, respectively). The east coast of East Asia and North America and all of the coast of India have relatively high deposition (400–800 mg(S) m−2 yr−1), followed by the west coast of Mexico (∼ 400 mg(S) m−2 yr−1). This study estimates 43 Tg(S) of S deposition in the ocean and coastal regions in 2010, which accounts for 51 % of global S deposition. The ratio is similar to the 51 % estimated by Dentener et al. (2006) and 46 % estimated by Vet et al. (2014) in 2001.
We calculate the ratio of S deposition to S emission (Fig. 5c). Because it is not clear how dimethyl sulfide (DMS) emission will transfer to S deposition, this ratio does not represent the transformation of S emission to deposition. For continental non-coastal regions, the average ratio is 85 % (86 % if taking coastal regions into consideration). In high-emission regions, this ratio can be viewed as the “scavenging” effect of S pollution by deposition. In major source regions of S emission (i.e., the North China Plain, the Midwest of the United States and India), the ratios are only slightly higher than 50 %, while in low-S-emission regions (< 10 mg(S) m−2 yr−1) the ratios could exceed 400 % (areas with white color in Fig. 5c). This result indicates that the deposition in these regions is largely affected by long-range transport of pollution from other regions. The impact of intercontinental transport of air pollutants on deposition can be quantified by the emission perturbation experiments in HATP II. Results from those experiments will be discussed in another paper (Tan et al., 2018).
We compare the S emission and deposition in 2010 from HTAP II with those in 2001 from HTAP I (Vet et al., 2014) (Table 3). We re-calculate the HTAP I results according to the regions defined in HTAP II (Fig. S1), so the HTAP I results may look different from those in Table 2 of Vet et al. (2014). Because different models were used for each of the two ensembles compared, associated uncertainty is expected. In addition, emissions in HTAP I were not prescribed, so each modeling group used its own best estimation of emissions (Sanderson et al., 2008). Conversely, all models in HTAP II used the same anthropogenic emission (although there were still differences in natural emission). Globally, the S emission decreases by 5 Tg(S) from 2001 to 2010, with a 8 Tg(S) (13 %) decrease in continental non-coastal regions, 6 Tg(S) (32 %) increase in non-coastal ocean regions and 3 Tg(S) (15 %) decrease in coastal regions. For continental non-coastal regions, there are big drops in S emissions from Europe (6 Tg(S) and 61 %), North America (3 Tg(S) and 34 %) and Russia (2 Tg(S) and 44 %). On the other hand, South Asia and the Middle East have 2 Tg(S) (56 %) and 1 Tg(S) (69 %) increases in S emissions. East Asia, one of the main contributors of S emission, seems to show little change between 2001 and 2010. However, it has experienced large changes during these 10 years, with stable annual increases from 2000 to 2005 due to increased energy consumption and decreases after 2006 owing to the successful implementation of the SO2 control policies in China's 11th Five-Year Plan (FYP) (Lu et al., 2010). For coastal regions, Europe has experienced a 2 Tg(S) (54 %) decrease, and East Asia has experienced a 1 Tg(S) (43 %) decrease in S emission. Other regions have relatively small (0–0.6 Tg(S)) changes. The global S deposition decreases by 2 Tg(S), with a 5 Tg(S) (11 %) decrease in continental non-coastal regions, 4 Tg(S) (16 %) increase in non-coastal ocean regions and 1 Tg(S) (5 %) decrease in coastal regions. The regions with the largest change in deposition coincide with those having big changes in emission. For instance, Europe experiences a 5 Tg(S) decrease in S deposition with 8 Tg(S) decrease in emission, and South Asia receives 2 Tg(S) more S deposition with a 2 Tg(S) increase in emission. Figure S13b compares the S deposition in HTAP II with that in HTAP I. Declined S deposition is found in large areas of the eastern United States and Europe (400–1500 mg(S) m−2 yr−1). Regions with increased S deposition are India and Indonesia (100–800 mg(S) m−2 yr−1). In China, there is a mixture of both increases and decreases in S deposition over different areas. The changes in S depositions agree well with changes in S emissions (Fig. S13a). During China's 11th FYP, one of the main technologies to control the SO2 emission was to install flue-gas desulfurization (FGD) in power plants (Cao et al., 2009). The effectiveness of this technology in removing SO2 emission varies considerably regionally, as a result of several factors, such as the coverage of FGD technology in power plants, local reduction targets and stringency of policy implementation by local governments. On the other hand, new sources of SO2 emission, such as newly built power plants, are found to be responsible for the increased S emissions and deposition over some areas in China (Tan et al., 2017).

Figure 6MMM results of (a, d, g) NOx, NH3 and N(NOx+ NH3) emission (mg(N) m−2 yr−1); (b, e, h) NOy, NHx and N (NOy+ NHx) deposition (mg(N) m−2 yr−1) in 2010; and (c, f, i) ratio of NOy, NHx and N deposition to NOx, NH3 and N(NOx+ NH3) emission (%). Purple colors represent regions where deposition is larger than emission.
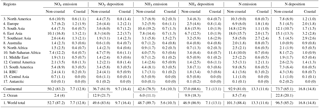
Table 4MMM estimates of N, NOy and NHx deposition and emission in 2010 (Tg(N) yr−1) . The number in parentheses is the percentage in world total emission/deposition.
3.3 Total N deposition
3.3.1 NOy deposition
Table 4 summarizes the NOy emission and deposition in each region, and Fig. 6 presents the distribution from MMM results. Distributions of components of NOy deposition are shown in Fig. S14. The global NOy deposition is 59 Tg(N) in 2010, with 62 % in non-coastal continents, 22 % in non-coastal ocean and 16 % in coastal areas. For continental non-coastal regions, East Asia receives the largest NOy deposition (14 %). The highest NOy deposition is found in northeastern China (2000 mg(N) m−2 yr−1), followed by the Indian subcontinent (800–1200 mg(N) m−2 yr−1); Malaysia and Indonesia (500–800 mg(N) m−2 yr−1); Germany, Switzerland and Poland (500–600 mg(N) m−2 yr−1); northern sub-Saharan Africa (300–500 mg(N) m−2 yr−1); the northeastern Middle East (400–500 mg(N) m−2 yr−1); the United States Midwest (500–600 mg(N) m−2 yr−1); and Brazil (300–600 mg(N) m−2 yr−1).
For coastal regions, the east coast of East Asia receives the largest amount of NOy deposition (600 mg(N) m−2 yr−1 and 4 %). Relatively high deposition is found on the east coast of North America (150–400 mg(N) m−2 yr−1), all coasts of India (300–500 mg(N) m−2 yr−1), the west coast of Europe and all coasts of Southeast Asia (150–200 mg(N) m−2 yr−1). This study estimates 23 Tg(N) of NOy deposition in the ocean in 2010 (including non-coastal and coastal ocean), similar to the estimation by Dentener et al. (2006) of 23 Tg(N), the estimation by Duce et al. (2008) of 14–32 Tg(N) and the estimation by Vet et al. (2014) of 20 Tg(N). About 38 % of global NOy deposits in the ocean, lower than 43 % in PhotoComp (Dentener et al., 2006) and 42 % in HTAP I (Vet et al., 2014), but higher than the 30 % estimated by Lamarque et al. (2005). It should be noted that these values are calculated by the land–ocean mask, which may differ among different studies. For non-coastal ocean regions, the NOy deposition is 13 Tg(N), accounting for 22 % of the global deposition, while the emission from oceans is only 2 Tg(N), about 4 % of global emission. The difference of 11 Tg(N) indicates NOy transport from continents to the open ocean. The Antarctic has near-zero NOx emission but receives 0.1 Tg(N) NOy deposition. Deposition has been a non-negligible pathway through which the human pollution contaminates nearly untouched areas.
We calculate the ratio of NOy deposition to NOx emission (Fig. 6c). In continental non-coastal regions, the average ratio is 74 % (81 % if taking coastal regions into consideration). In high NOx emission regions (i.e., North America, East Asia and South Asia), about 60–80 % of the NOy is removed by deposition, with large regional variations. For low-emission regions (i.e., North Africa and central Asia), the ratio can reach higher than 90 %. In coastal regions and the open ocean, the ratio is generally over 200 %. Instead of the local emission, the transport of air pollutants from elsewhere is the major source of deposition.
3.3.2 NHx deposition
The global NHx deposition is 54 Tg(N) in 2010, with 69 % in continental non-coastal regions, 19 % in non-coastal ocean regions and 13 % in coastal regions (Table 4). For continental non-coastal regions, South Asia receives 16 % of global NHx depositions, followed by East Asia (13 %). The whole Indian subcontinent receives higher NHx depositions than 2000 mg(N) m−2 yr−1 (Fig. 6e). Also, the Asian regions have several high-deposition areas: the North China Plain and Indonesia (1200–2000 mg(N) m−2 yr−1), Japan, Thailand, Vietnam and Myanmar (500–600 mg(N) m−2 yr−1). Other regions with high NHx deposition are the United States Midwest, Germany, France, northern Italy, southern Brazil and Ethiopia (400–800 mg(N) m−2 yr−1). Distributions of components of NHx deposition are shown in Fig. S15.
Coastal regions of Southeast Asia (3 %), East Asia (2 %) and South Asia (2 %) receive the largest NHx deposition (∼ 200–400 mg(N) m−2 yr−1). The east coasts of North America and Mexico also have high NHx deposition (150–200 mg(N) m−2 yr−1). Compared to NOy deposition, the NHx deposition in coastal regions is relatively lower. The ocean receives 17 Tg(N) of NHx deposition in 2010, within the range of 13–29 Tg(N) estimated by Duce et al. (2008) but lower than the 23.5 Tg(N) estimated by Dentener et al. (2006) and 21.4 Tg(N) estimated by Vet et al. (2014). About 31 % of NH3 emission is deposited in ocean areas, similar to the 31 % estimated by Dentener et al. (2006) and 30 % estimated by Lamarque et al. (2005) but slightly lower than 37 % in PhotoComp (Dentener et al., 2006) and 37 % in HTAP I (Vet et al., 2014). The ocean emitted 12 Tg(N) of NH3 in 2010, which means that at least 5 Tg(N) of NHx deposition in oceans in 2010 came from continental regions. This value is considerably lower than the 13 Tg(N) of deposition–emission difference for NOy (including the 2 Tg(N) difference in coastal regions). A possible explanation is that NH3 has a short lifetime in the atmosphere, which makes it more likely to deposit close to where it is emitted (Shen et al., 2016), while NOx can be oxidized to organic nitrate (Moxim et al., 1996), which facilitates the long-range transport from land to open ocean.
We calculate the ratio of NHx deposition to NH3 emission (Fig. 6f). The average ratio is 87 % for continental non-coastal regions (92 % if also considers the coastal regions). The ratios are generally higher than those of NOy deposition (74 and 81 %), since a large proportion of NHx is deposited near the source. The ratios are generally over 400 % for coastal areas but less than 100 % in the open ocean (70–90 %). This is because there is less continental NHx transported to the open ocean than to coastal regions.
3.3.3 N deposition
The global N deposition in 2010 is 113 Tg(N), with 65 % of deposition in the continental non-coastal regions, 20 % in non-coastal oceans and 15 % in coastal regions (Table 4). East Asia (13 %) and South Asia (11 %) receive the largest amount of N deposition, consistent with the fact that they are also the largest N emission sources (16 and 13 %, respectively). The deposition reaches 3000 mg(N) m−2 yr−1 over eastern China (especially the North China Plain) and 2000 mg(N) m−2 yr−1 over India and Southeast Asia (Thailand, Vietnam and Malaysia). Other regions of high N deposition are the northeastern United States and western Europe (800–1200 mg(N) m−2 yr−1), Mexico, Central America, Brazil, northern sub-Saharan Africa and the northeastern Middle East (500–600 mg(N) m−2 yr−1). For coastal regions, the east coast of the United States, all coasts of India and the east coast of East Asia are identified with relatively high deposition (> 600 mg(N) m−2 yr−1).
Table 5Comparison of N deposition and emission between 2010 (HTAP II) and 2001 (HTAP I) (Tg(N) yr−1). Δ is the difference between 2010 and 2001 calculated as (HTAP II − HTAP I). The numbers in parentheses are the percentage of change, calculated as .
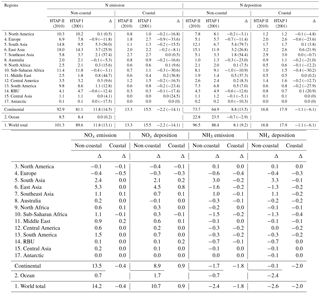
Table 5 compares the N emission and deposition in HTAP II with HTAP I. The global N emission increases from 105 to 115 Tg(N), with a 12 Tg(N) (15 %) increase in continental non-coastal regions and a 2 Tg(N) (14 %) decrease in coastal regions. The change in the ocean is small due to increased NOy deposition but decreased NHx deposition. For continental non-coastal regions, increases in N emission are found in South Asia (5 Tg(N), 56 %), East Asia (4 Tg(N), 26 %) and Southeast Asia (2 Tg(N), 58 %), while the emission in Europe decreases by 1 Tg(N) (12 %). The emission changes in coastal regions are relatively small. The global N deposition increases by 7 Tg(N), with a 9 Tg(N) (14 %) increase in continental non-coastal regions and a 2 Tg(N) decrease in the ocean. Asian regions also have experienced the largest increases in deposition, and the amounts are identical with corresponding emission changes. Figure S16b compares the distribution of N deposition in HTAP II with HTAP I. Elevated N deposition is found in India, Indonesia and the North Chain Plain (1500 mg(N) m−2 yr−1). Regions with small increases are Japan, the northern Middle East, northwestern Brazil and Mexico (∼ 200 mg(N) m−2 yr−1). On the other hand, the N deposition in the eastern United States and Europe has decreased by 200–400 mg(N) m−2 yr−1.
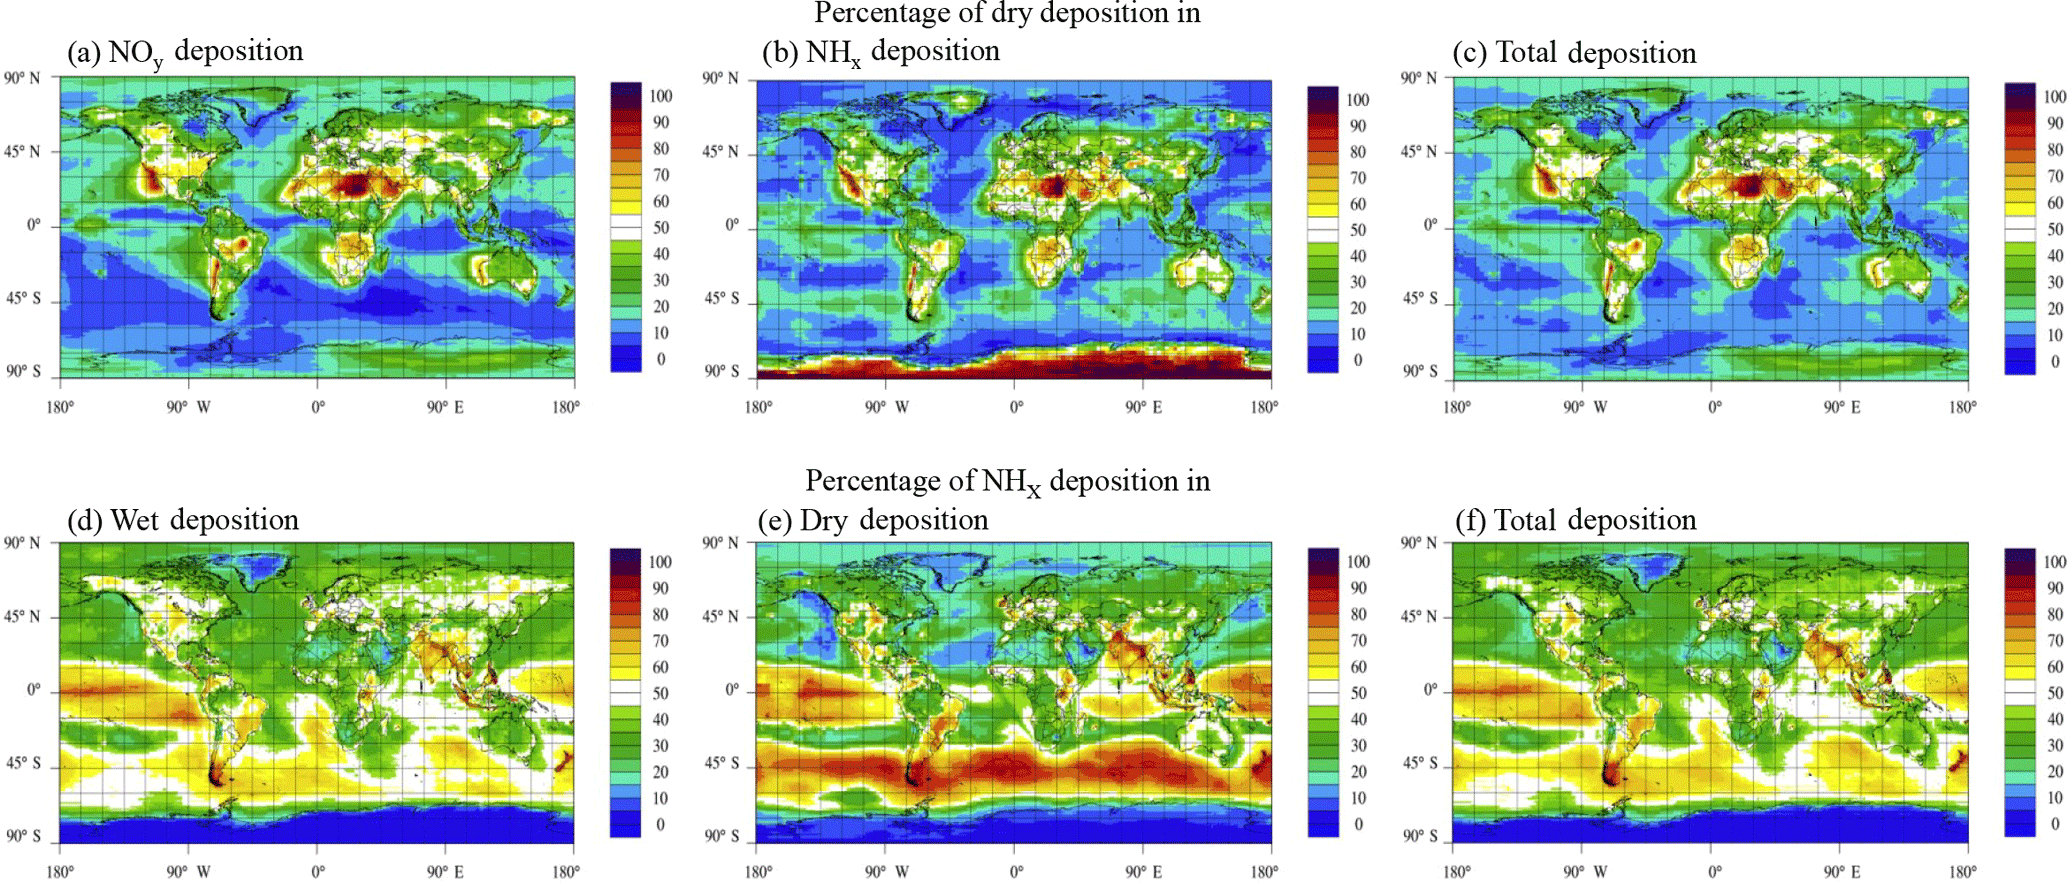
Figure 7(a, b, c) The percentage of dry deposition in wet+dry deposition for NOy, NHx and N (NOy+ NHx) deposition. The ratio is calculated as (dry deposition) ∕ (dry + wet deposition) × 100 %. (d, e, f) The percentage of NHx deposition in N (NOy+ NHx) deposition for wet, dry and wet+dry deposition. The ratio is calculated as (NHx deposition) ∕ (NOy+ NHx deposition).
The global N dry and wet deposition is 40 and 73 Tg(N) yr−1 in 2010, respectively. We calculate the ratio of dry deposition as . For continental non-coastal regions, about 44 % (range from 35 to 61 %) of the N deposition comes from dry deposition (42 % if taking coastal regions into consideration). If the overestimation of N dry deposition in Sect. 3.1.2 is considered, this ratio could be even lower. Desert areas (e.g., the Sonoran, Mojave and Chihuahuan deserts near the west coast of North America; the Sahara in North Africa; the Arabian Desert in the Middle East; and the Great Victoria Desert in Australia) are seen with high ratios of dry deposition (80 %) (red-colored regions in Fig. 7c). This outcome is reasonable since these areas generally lack precipitation. Low fractions of dry deposition (30 %) are found in Russia, western China, Southeast Asia, Australia and Central America. Almost all coastal regions are dominated by wet deposition. A study by Jickells (2006) reported a dry deposition ratio of 21–45 % for the east coast of the United States, and a study by Baker et al. (2010) suggested a ratio of 15–22 % for the Atlantic Ocean. Our study receives similar ratios for these coastal regions. A study by Bey et al. (2001) found an outflow of NOy from Asia over the western Pacific Ocean through deposition. According to this study, about 70 % of this land-to-ocean export of NOy deposition is through wet deposition (Fig. 7a).
The NHx and NOy deposition is 54 and 59 Tg(N) yr−1 in 2010, respectively. The average ratio of NHx deposition (calculated as for continental non-coastal regions is 47 % (45 % if coastal regions are taken into consideration). South Asia (71 %) and Southeast Asia (63 %) are dominated by NHx deposition, owing to high local NH3 emission, while the Middle East (25 %) and North Africa (34 %) are dominated by NOy deposition. Figure 7f shows the global distribution of the ratio of NHx deposition. While a high ratio is found in the Indian subcontinent, Southeast Asia, southeastern Brazil, southern Argentina and New Zealand (70–80 %), and Eastern Asia (∼ 60 %), other continental non-coastal regions are mainly dominated by NOy deposition. This is consistent with finding by ACCMIP (Sun et al., 2016). We compare the ratio of NHx deposition in 2010 (HTAP II) with that in 2001 (HTAP I) (Fig. S17). Generally, we find a 10 % worldwide decrease in the ratio of NHx deposition from 2001 to 2010. In particular, a 30 % decrease is found in southeastern China, mainly due to the large increase in NOx emission during the last decade. On the other hand, the ratio of NHx deposition in California was 15–20 % in 2001 and increased to 40–60 % in 2010. The ratio in Alaska also increased from 30–40 to 50 %. There is a generally 5–10 % increase over the eastern United States. This is consistent with an observed large increase of the NHx depositions and decrease of NOy depositions in the northeastern United States from 1990s to 2010s (Du et al., 2014; Li et al., 2016). A possible explanation is that the implementation of emission control strategies such as the Clean Air Act (CAA) has resulted in a large reduction in NOx emissions, which lowered the NOy deposition in the United States (Lloret and Valiela, 2016). This benefit is compensated for by increasing NHx deposition because no limitation is implemented on NH3 emission (Kanakidou et al., 2016; Li et al., 2016). Some regions have small increases in the ratio of NHx deposition, such as northern Europe (Norway) (5 %), Southeast Asia (10 %) and western Australia (10 %).
We calculate the S and N deposition in 2010 using the multi-model mean (MMM) of an 11-model ensemble from the HTAP II. The model performance on wet deposition is evaluated with the measurement networks NADP over North America, EMEP over Europe and EANET over East Asia. The modeled wet deposition compares favorably with the observations. About 76–83 % of stations are predicted within ±50 % of observations. SO wet deposition is underestimated in East Asia by 20 %, especially at three Chinese stations with high Ca2+ concentration. Because the locations of the Chinese stations do not cover the areas with highest deposition, it is hard to provide a comprehensive evaluation over this region. For NO wet deposition, a 20 % positive model bias is generally found at stations in the eastern United States, while some European (Poland, Norway and Spain) and East Asian (in Southeast Asia) stations with high observed deposition are underestimated by about 60–70 %. NH wet deposition is underestimated in Europe (especially in Norway and Poland) and East Asia (especially in Russia and Korea). An intercomparison is conducted with the previous projects PhotoComp, ACCMIP and HTAP I. HTAP II has significantly improved the estimation of both S and N deposition at European stations compared to that in previous projects. Improved estimates are also found in East Asia. Modeled dry deposition is compared with the inferential data from CASTNET in North America. The MMM results are generally higher than the inferential data by 50–170 %, which is also reported in ACCMIP and HTAP I studies.
We calculate the S and N depositions on lands, in coastal zones and in open oceans. The global S deposition is 84 Tg(S) in 2010, with 49 % deposits in continental non-coastal regions, 32 % deposits in non-coastal oceans and 19 % deposits in coastal regions. The global N deposition is 113 Tg(N) in 2010, of which 59 Tg(N) is NOy deposition and 64 Tg(N) is NHx deposition. About 65 % of N is deposited in continental non-coastal regions, and 35 % in oceans (including 15 % in coastal regions). For continental regions, high S deposition is found in Asia regions (East Asia, South Asia and Southeast Asia), the United States Midwest, Central America and eastern Europe. For N deposition, high deposition is also identified in the above-mentioned regions plus sub-Saharan Africa and Brazil. For coastal regions, the east coast of Asia, all coasts of India and Malaysia, and the east coast of the Unites States are seen with relatively high S and N deposition. According to our estimation, about 4 Tg(S) of S deposition and 18 Tg(N) of N deposition are exported from land to ocean, including 0.3 Tg(S) and 4 Tg(N) in coastal regions.
We compare the HTAP II results in 2010 with HTAP I in 2001 by using the same land–ocean mask. The S deposition decreases 2 Tg(S) from 2001 to 2010 – with significant decreases in Europe (5 Tg(S)), North America (3 Tg(S)) and Russia (2 Tg(S)) – and increases in South Asia (2 Tg(S)) and the Middle East (1 Tg(S)). East Asia does not have large net changes in its S deposition due to increased S emission from 2001 to 2005 and a continuous reduction in S emission starting from 2006 owing to the SO2 control policies in China's 11th FYP. The N deposition increases by 7 Tg(N). The increased N emissions from South Asia (5 Tg(N)), East Asia (4 Tg(N)) and Southeast Asia (2 Tg(N)) lead to identical amounts of elevation in deposition in corresponding regions. We also compare the ratio of NHx deposition in total N deposition between HTAP I and HTAP II. The ratio has increased in some regions of North America, especially in California (∼ 20 %), Alaska (∼ 10 %) and the eastern United States (5–10 %), which agrees well with recent observational and modeling studies in the United States. A small increase in the ratio of NHx deposition is found in northern Europe (Norway) (5 %), Southeast Asia (10 %) and western Australia (10 %). On the other hand, NOy deposition has started to dominate in East Asia (especially China) due to increased NOx emission in recent years.
This study updates our knowledge about the global S and N deposition in 2010. We find that the global distributions of S and N depositions have changed considerably during the last 10 years, with decreases in North America and Europe and increases in Asian regions. Further studies could determine how much these changes could affect the source–receptor relationship on deposition between continents and the impact of this relationship on global agriculture and ecosystems.
The observation data are publicly available. The model data can be downloaded from the AeroCom database (http://iek8wikis.iek.fz-juelich.de/HTAPWiki/FrontPage, last access: 6 April 2018) upon request.
The supplement related to this article is available online at: https://doi.org/10.5194/acp-18-6847-2018-supplement.
The authors declare that they have no conflict of interest.
This article is part of the special issue “Global and regional assessment of intercontinental transport of air pollution: results from HTAP, AQMEII and MICS”. It is not associated with a conference.
We thank all participating modeling groups in HTAP II for providing the
simulation data. We thank Robert Vet for providing the multi-model
ensemble results of HTAP I. The National Center for Atmospheric Research is
sponsored by the National Science Foundation. The CESM project is supported
by the National Science Foundation and the Office of Science (BER) of the
US Department of Energy. Computing resources were provided by the Climate
Simulation Laboratory at NCAR's Computational and Information Systems
Laboratory (CISL), sponsored by the National Science Foundation and other
agencies. We acknowledge the support by NASA HAQAST (grant no. NNX16AQ19G).
We also acknowledge the support by the supercomputer system of the National
Institute for Environmental Studies, Japan, and the Environment Research and
Technology Development Fund (S-12-3) of the Ministry of the Environment,
Japan, JSPS KAKENHI (grant no. 5H01728).
Edited by: Christian Hogrefe
Reviewed by: two anonymous
referees
Baker, A. R., Lesworth, T., Adams, C., Jickells, T. D., and Ganzeveld, L.: Estimation of atmospheric nutrient inputs to the Atlantic Ocean from 50 degrees N to 50 degrees S based on large-scale field sampling: Fixed nitrogen and dry deposition of phosphorus, Global Biogeochem. Cy., 24, GB3006, https://doi.org/10.1029/2009gb003634, 2010.
Bergstrom, A. K. and Jansson, M.: Atmospheric nitrogen deposition has caused nitrogen enrichment and eutrophication of lakes in the northern hemisphere, Global Change Biol., 12, 635–643, https://doi.org/10.1111/j.1365-2486.2006.01129.x, 2006.
Bey, I., Jacob, D. J., Logan, J. A., and Yantosca, R. M.: Asian chemical outflow to the Pacific in spring: Origins, pathways, and budgets, J. Geophys. Res.-Atmos., 106, 23097–23113, https://doi.org/10.1029/2001jd000806, 2001.
Bian, H., Chin, M., Hauglustaine, D. A., Schulz, M., Myhre, G., Bauer, S. E., Lund, M. T., Karydis, V. A., Kucsera, T. L., Pan, X., Pozzer, A., Skeie, R. B., Steenrod, S. D., Sudo, K., Tsigaridis, K., Tsimpidi, A. P., and Tsyro, S. G.: Investigation of global particulate nitrate from the AeroCom phase III experiment, Atmos. Chem. Phys., 17, 12911–12940, https://doi.org/10.5194/acp-17-12911-2017, 2017.
Bleeker, A., Hicks, W. K., Dentener, E., Galloway, J., and Erisman, J. W.: N deposition as a threat to the World's protected areas under the Convention on Biological Diversity, Environ. Pollut., 159, 2280–2288, https://doi.org/10.1016/j.envpol.2010.10.036, 2011.
Bobbink, R., Hicks, K., Galloway, J., Spranger, T., Alkemade, R., Ashmore, M., Bustamante, M., Cinderby, S., Davidson, E., Dentener, F., Emmett, B., Erisman, J. W., Fenn, M., Gilliam, F., Nordin, A., Pardo, L., and De Vries, W.: Global assessment of nitrogen deposition effects on terrestrial plant diversity: a synthesis, Ecol. Appl., 20, 30–59, https://doi.org/10.1890/08-1140.1, 2010.
Bouwman, A. F., Van Vuuren, D. P., Derwent, R. G., and Posch, M.: A global analysis of acidification and eutrophication of terrestrial ecosystems, Water Air Soil Poll., 141, 349–382, https://doi.org/10.1023/a:1021398008726, 2002.
Cao, J., Garbaccio, R., and Ho, M. S.: China's 11th Five-Year Plan and the Environment: Reducing SO2 Emissions, Rev. Env. Econ. Policy, 3, 231–250, https://doi.org/10.1093/reep/rep006, 2009.
Dentener, F., Drevet, J., Lamarque, J. F., Bey, I., Eickhout, B., Fiore, A. M., Hauglustaine, D., Horowitz, L. W., Krol, M., Kulshrestha, U. C., Lawrence, M., Galy-Lacaux, C., Rast, S., Shindell, D., Stevenson, D., Van Noije, T., Atherton, C., Bell, N., Bergman, D., Butler, T., Cofala, J., Collins, B., Doherty, R., Ellingsen, K., Galloway, J., Gauss, M., Montanaro, V., Muller, J. F., Pitari, G., Rodriguez, J., Sanderson, M., Solmon, F., Strahan, S., Schultz, M., Sudo, K., Szopa, S., and Wild, O.: Nitrogen and sulfur deposition on regional and global scales: A multimodel evaluation, Global Biogeochem. Cy., 20, 21, https://doi.org/10.1029/2005gb002672, 2006.
Doney, S. C., Mahowald, N., Lima, I., Feely, R. A., Mackenzie, F. T., Lamarque, J. F., and Rasch, P. J.: Impact of anthropogenic atmospheric nitrogen and sulfur deposition on ocean acidification and the inorganic carbon system, P. Natl. Acad. Sci. USA, 104, 14580–14585, https://doi.org/10.1073/pnas.0702218104, 2007.
Du, E. Z., de Vries, W., Galloway, J. N., Hu, X. Y., and Fang, J. Y.: Changes in wet nitrogen deposition in the United States between 1985 and 2012, Environ. Res. Lett., 9, 095004 https://doi.org/10.1088/1748-9326/9/9/095004, 2014.
Duce, R. A., LaRoche, J., Altieri, K., Arrigo, K. R., Baker, A. R., Capone, D. G., Cornell, S., Dentener, F., Galloway, J., Ganeshram, R. S., Geider, R. J., Jickells, T., Kuypers, M. M., Langlois, R., Liss, P. S., Liu, S. M., Middelburg, J. J., Moore, C. M., Nickovic, S., Oschlies, A., Pedersen, T., Prospero, J., Schlitzer, R., Seitzinger, S., Sorensen, L. L., Uematsu, M., Ulloa, O., Voss, M., Ward, B., and Zamora, L.: Impacts of atmospheric anthropogenic nitrogen on the open ocean, Science, 320, 893–897, https://doi.org/10.1126/science.1150369, 2008.
Galloway, J. N., Townsend, A. R., Erisman, J. W., Bekunda, M., Cai, Z. C., Freney, J. R., Martinelli, L. A., Seitzinger, S. P., and Sutton, M. A.: Transformation of the nitrogen cycle: Recent trends, questions, and potential solutions, Science, 320, 889–892, https://doi.org/10.1126/science.1136674, 2008.
Galmarini, S., Koffi, B., Solazzo, E., Keating, T., Hogrefe, C., Schulz, M., Benedictow, A., Griesfeller, J. J., Janssens-Maenhout, G., Carmichael, G., Fu, J., and Dentener, F.: Technical note: Coordination and harmonization of the multi-scale, multi-model activities HTAP2, AQMEII3, and MICS-Asia3: simulations, emission inventories, boundary conditions, and model output formats, Atmos. Chem. Phys., 17, 1543–1555, https://doi.org/10.5194/acp-17-1543-2017, 2017.
Holland, E. A., Braswell, B. H., Lamarque, J. F., Townsend, A., Sulzman, J., Muller, J. F., Dentener, F., Brasseur, G., Levy, H., Penner, J. E., and Roelofs, G. J.: Variations in the predicted spatial distribution of atmospheric nitrogen deposition and their impact on carbon uptake by terrestrial ecosystems, J. Geophys. Res.-Atmos., 102, 15849–15866, https://doi.org/10.1029/96jd03164, 1997.
HTAP (Hemispheric Transport of Air Pollution): Hemispheric Transport of Air Pollution 2010. Part A: Ozone and Particulate Matter, Air Pollution Studies No. 17, edited by: Dentener, F., Keating, T., and Akimoto, H., United Nations, New York, USA, 2010.
Huang, M., Carmichael, G. R., Pierce, R. B., Jo, D. S., Park, R. J., Flemming, J., Emmons, L. K., Bowman, K. W., Henze, D. K., Davila, Y., Sudo, K., Jonson, J. E., Tronstad Lund, M., Janssens-Maenhout, G., Dentener, F. J., Keating, T. J., Oetjen, H., and Payne, V. H.: Impact of intercontinental pollution transport on North American ozone air pollution: an HTAP phase 2 multi-model study, Atmos. Chem. Phys., 17, 5721–5750, https://doi.org/10.5194/acp-17-5721-2017, 2017.
Janssens, I. A., Dieleman, W., Luyssaert, S., Subke, J. A., Reichstein, M., Ceulemans, R., Ciais, P., Dolman, A. J., Grace, J., Matteucci, G., Papale, D., Piao, S. L., Schulze, E. D., Tang, J., and Law, B. E.: Reduction of forest soil respiration in response to nitrogen deposition, Nat. Geosci., 3, 315–322, https://doi.org/10.1038/ngeo844, 2010.
Janssens-Maenhout, G., Crippa, M., Guizzardi, D., Dentener, F., Muntean, M., Pouliot, G., Keating, T., Zhang, Q., Kurokawa, J., Wankmüller, R., Denier van der Gon, H., Kuenen, J. J. P., Klimont, Z., Frost, G., Darras, S., Koffi, B., and Li, M.: HTAP_v2.2: a mosaic of regional and global emission grid maps for 2008 and 2010 to study hemispheric transport of air pollution, Atmos. Chem. Phys., 15, 11411–11432, https://doi.org/10.5194/acp-15-11411-2015, 2015.
Jia, Y., Yu, G., Gao, Y., He, N., Wang, Q., Jiao, C., and Zuo, Y.: Global inorganic nitrogen dry deposition inferred from ground- and space-based measurements, Sci. Rep.-UK, 6, 19810, https://doi.org/10.1038/srep19810, 2016.
Jickells, T.: The role of air-sea exchange in the marine nitrogen cycle, Biogeosciences, 3, 271–280, https://doi.org/10.5194/bg-3-271-2006, 2006.
Jickells, T. D., Buitenhuis, E., Altieri, K., Baker, A. R., Capone, D., Duce, R. A., Dentener, F., Fennel, K., Kanakidou, M., LaRoche, J., Lee, K., Liss, P., Middelburg, J. J., Moore, J. K., Okin, G., Oschlies, A., Sarin, M., Seitzinger, S., Sharples, J., Singh, A., Suntharalingam, P., Uematsu, M., and Zamora, L. M.: A reevaluation of the magnitude and impacts of anthropogenic atmospheric nitrogen inputs on the ocean, Global Biogeochem. Cy., 31, 289–305, https://doi.org/10.1002/2016GB005586, 2017.
Jonson, J. E., Schulz, M., Emmons, L., Flemming, J., Henze, D., Sudo, K., Tronstad Lund, M., Lin, M., Benedictow, A., Koffi, B., Dentener, F., Keating, T., and Kivi, R.: The effects of intercontinental emission sources on European air pollution levels, Atmos. Chem. Phys. Discuss., https://doi.org/10.5194/acp-2018-79, in review, 2018.
Kanakidou, M., Myriokefalitakis, S., Daskalakis, N., Fanourgakis, G., Nenes, A., Baker, A. R., Tsigaridis, K., and Mihalopoulos, N.: Past, Present, and Future Atmospheric Nitrogen Deposition, J. Atmos. Sci., 73, 2039–2047, https://doi.org/10.1175/jas-d-15-0278.1, 2016.
Kim, S. W., Heckel, A., McKeen, S. A., Frost, G. J., Hsie, E. Y., Trainer, M. K., Richter, A., Burrows, J. P., Peckham, S. E., and Grell, G. A.: Satellite-observed U.S. power plant NOx emission reductions and their impact on air quality, Geophys. Res. Lett., 33, L22812, https://doi.org/10.1029/2006gl027749, 2006.
Kurokawa, J., Ohara, T., Morikawa, T., Hanayama, S., Janssens-Maenhout, G., Fukui, T., Kawashima, K., and Akimoto, H.: Emissions of air pollutants and greenhouse gases over Asian regions during 2000–2008: Regional Emission inventory in ASia (REAS) version 2, Atmos. Chem. Phys., 13, 11019–11058, https://doi.org/10.5194/acp-13-11019-2013, 2013.
Lamarque, J. F., Kiehl, J. T., Brasseur, G. P., Butler, T., Cameron-Smith, P., Collins, W. D., Collins, W. J., Granier, C., Hauglustaine, D., Hess, P. G., Holland, E. A., Horowitz, L., Lawrence, M. G., McKenna, D., Merilees, P., Prather, M. J., Rasch, P. J., Rotman, D., Shindell, D., and Thornton, P.: Assessing future nitrogen deposition and carbon cycle feedback using a multimodel approach: Analysis of nitrogen deposition, J. Geophys. Res.-Atmos., 110, D19303, https://doi.org/10.1029/2005jd005825, 2005.
Lamarque, J.-F., Dentener, F., McConnell, J., Ro, C.-U., Shaw, M., Vet, R., Bergmann, D., Cameron-Smith, P., Dalsoren, S., Doherty, R., Faluvegi, G., Ghan, S. J., Josse, B., Lee, Y. H., MacKenzie, I. A., Plummer, D., Shindell, D. T., Skeie, R. B., Stevenson, D. S., Strode, S., Zeng, G., Curran, M., Dahl-Jensen, D., Das, S., Fritzsche, D., and Nolan, M.: Multi-model mean nitrogen and sulfur deposition from the Atmospheric Chemistry and Climate Model Intercomparison Project (ACCMIP): evaluation of historical and projected future changes, Atmos. Chem. Phys., 13, 7997–8018, https://doi.org/10.5194/acp-13-7997-2013, 2013.
Li, M., Zhang, Q., Kurokawa, J.-I., Woo, J.-H., He, K., Lu, Z., Ohara, T., Song, Y., Streets, D. G., Carmichael, G. R., Cheng, Y., Hong, C., Huo, H., Jiang, X., Kang, S., Liu, F., Su, H., and Zheng, B.: MIX: a mosaic Asian anthropogenic emission inventory under the international collaboration framework of the MICS-Asia and HTAP, Atmos. Chem. Phys., 17, 935–963, https://doi.org/10.5194/acp-17-935-2017, 2017.
Li, Y., Schichtel, B. A., Walker, J. T., Schwede, D. B., Chen, X., Lehmann, C. M. B., Puchalski, M. A., Gay, D. A., and Collett, J. L.: Increasing importance of deposition of reduced nitrogen in the United States, P. Natl. Acad. Sci. USA, 113, 5874–5879, https://doi.org/10.1073/pnas.1525736113, 2016.
Lloret, J. and Valiela, I.: Unprecedented decrease in deposition of nitrogen oxides over North America: the relative effects of emission controls and prevailing air-mass trajectories, Biogeochemistry, 129, 165–180, https://doi.org/10.1007/s10533-016-0225-5, 2016.
Lu, Z., Streets, D. G., Zhang, Q., Wang, S., Carmichael, G. R., Cheng, Y. F., Wei, C., Chin, M., Diehl, T., and Tan, Q.: Sulfur dioxide emissions in China and sulfur trends in East Asia since 2000, Atmos. Chem. Phys., 10, 6311–6331, https://doi.org/10.5194/acp-10-6311-2010, 2010.
Moxim, W. J., Levy, H., and Kasibhatla, P. S.: Simulated global tropospheric PAN: Its transport and impact on NOx, J. Geophys. Res.-Atmos., 101, 12621–12638, https://doi.org/10.1029/96jd00338, 1996.
Reay, D. S., Dentener, F., Smith, P., Grace, J., and Feely, R. A.: Global nitrogen deposition and carbon sinks, Nat. Geosci., 1, 430–437, https://doi.org/10.1038/ngeo230, 2008.
Richter, A., Burrows, J. P., Nuss, H., Granier, C., and Niemeier, U.: Increase in tropospheric nitrogen dioxide over China observed from space, Nature, 437, 129–132, https://doi.org/10.1038/nature04092, 2005.
Sanderson, M. G., Collins, W. J., Johnson, C. E., and Derwent, R. G.: Present and future acid deposition to ecosystems: The effect of climate change, Atmos. Environ., 40, 1275–1283, https://doi.org/10.1016/j.atmosenv.2005.10.031, 2006.
Sanderson, M. G., Dentener, F. J., Fiore, A. M., Cuvelier, C., Keating, T. J., Zuber, A., Atherton, C. S., Bergmann, D. J., Diehl, T., Doherty, R. M., Duncan, B. N., Hess, P., Horowitz, L. W., Jacob, D. J., Jonson, J. E., Kaminski, J. W., Lupu, A., MacKenzie, I. A., Mancini, E., Marmer, E., Park, R., Pitari, G., Prather, M. J., Pringle, K. J., Schroeder, S., Schultz, M. G., Shindell, D. T., Szopa, S., Wild, O., and Wind, P.: A multi-model study of the hemispheric transport and deposition of oxidised nitrogen, Geophys. Res. Lett., 35, L17815, https://doi.org/10.1029/2008gl035389, 2008.
Schwede, D., Zhang, L. M., Vet, R., and Lear, G.: An intercomparison of the deposition models used in the CASTNET and CAPMoN networks, Atmos. Environ., 45, 1337–1346, https://doi.org/10.1016/j.atmosenv.2010.11.050, 2011.
Shen, J., Chen, D., Bai, M., Sun, J., Coates, T., Lam, S. K., and Li, Y.: Ammonia deposition in the neighbourhood of an intensive cattle feedlot in Victoria, Australia, Sci. Rep.-UK, 6, 32793, https://doi.org/10.1038/srep32793, 2016.
Sickles, J. E. and Shadwick, D. S.: Comparison of particulate sulfate and nitrate at collocated CASTNET and IMPROVE sites in the eastern US, Atmos. Environ., 42, 2062–2073, https://doi.org/10.1016/j.atmosenv.2007.11.051, 2008.
Stjern, C. W., Samset, B. H., Myhre, G., Bian, H., Chin, M., Davila, Y., Dentener, F., Emmons, L., Flemming, J., Haslerud, A. S., Henze, D., Jonson, J. E., Kucsera, T., Lund, M. T., Schulz, M., Sudo, K., Takemura, T., and Tilmes, S.: Global and regional radiative forcing from 20 % reductions in BC, OC and SO4 – an HTAP2 multi-model study, Atmos. Chem. Phys., 16, 13579–13599, https://doi.org/10.5194/acp-16-13579-2016, 2016.
Sun, J., Fu, J. S., and Huang, K.: Organic nitrates and other oxidized nitrogen compounds contribute significantly to the total nitrogen depositions in the United States, P. Natl. Acad. Sci. USA, 113, E4433–E4434, https://doi.org/10.1073/pnas.1608717113, 2016.
Sun, J., Fu, J. S., Lynch, J. A., Huang, K., and Gao, Y.: Climate-driven exceedance of total (wet plus dry) nitrogen (N) plus sulfur (S) deposition to forest soil over the conterminous US, Earths Future, 5, 560–576, https://doi.org/10.1002/2017EF000588, 2017.
Tan, J. N., Fu, J. S., Huang, K., Yang, C. E., Zhuang, G. S., and Sun, J.: Effectiveness of SO2 emission control policy on power plants in the Yangtze River Delta, China-post-assessment of the 11th Five-Year Plan, Environ. Sci. Pollut. R., 24, 8243–8255, https://doi.org/10.1007/s11356-017-8412-z, 2017.
Tan, J., Fu, J. S., Dentener, F., Sun, J., Emmons, L., Tilmes, S., Flemming, J., Takemura, T., Bian, H., Zhu, Q., Yang, C.-E., and Keating, T.: Source contributions of sulfur and nitrogen deposition – an HTAP II multi model study on hemispheric transport, Atmos. Chem. Phys. Discuss., https://doi.org/10.5194/acp-2018-109, in review, 2018.
Tørseth, K., Aas, W., Breivik, K., Fjæraa, A. M., Fiebig, M., Hjellbrekke, A. G., Lund Myhre, C., Solberg, S., and Yttri, K. E.: Introduction to the European Monitoring and Evaluation Programme (EMEP) and observed atmospheric composition change during 1972–2009, Atmos. Chem. Phys., 12, 5447–5481, https://doi.org/10.5194/acp-12-5447-2012, 2012.
van der A, R. J., Peters, D. H. M. U., Eskes, H., Boersma, K. F., Van Roozendael, M., De Smedt, I., and Kelder, H. M.: Detection of the trend and seasonal variation in tropospheric NO2 over China, J. Geophys. Res., 111, D12317, https://doi.org/10.1029/2005jd006594, 2006.
van der A, R. J., Eskes, H. J., Boersma, K. F., van Noije, T. P. C., Van Roozendael, M., De Smedt, I., Peters, D. H. M. U., and Meijer, E. W.: Trends, seasonal variability and dominant NOx source derived from a ten year record of NO2 measured from space, J. Geophys. Res., 113, D04302, https://doi.org/10.1029/2007jd009021, 2008.
Vet, R., Artz, R. S., Carou, S., Shaw, M., Ro, C. U., Aas, W., Baker, A., Bowersox, V. C., Dentener, F., Galy-Lacaux, C., Hou, A., Pienaar, J. J., Gillett, R., Forti, M. C., Gromov, S., Hara, H., Khodzher, T., Mahowald, N. M., Nickovic, S., Rao, P. S. P., and Reid, N. W.: A global assessment of precipitation chemistry and deposition of sulfur, nitrogen, sea salt, base cations, organic acids, acidity and pH, and phosphorus, Atmos. Environ., 93, 3–100, https://doi.org/10.1016/j.atmosenv.2013.10.060, 2014.
Vitousek, P. M., Aber, J. D., Howarth, R. W., Likens, G. E., Matson, P. A., Schindler, D. W., Schlesinger, W. H., and Tilman, D.: Human alteration of the global nitrogen cycle: Sources and consequences, Ecol. Appl., 7, 737–750, https://doi.org/10.2307/2269431, 1997.
Wesely, M. L.: Parameterization of Surface Resistances to Gaseous Dry Deposition in Regional-Scale Numerical-Models, Atmos. Environ., 23, 1293–1304, https://doi.org/10.1016/0004-6981(89)90153-4, 1989.
Wesely, M. L. and Hicks, B. B.: A review of the current status of knowledge on dry deposition, Atmos. Environ., 34, 2261–2282, https://doi.org/10.1016/S1352-2310(99)00467-7, 2000.
Zhang, L., Vet, R., O'Brien, J. M., Mihele, C., Liang, Z., and Wiebe, A.: Dry deposition of individual nitrogen species at eight Canadian rural sites, J. Geophys. Res., 114, D02301, https://doi.org/10.1029/2008jd010640, 2009.
Zhang, Q., Streets, D. G., He, K., Wang, Y., Richter, A., Burrows, J. P., Uno, I., Jang, C. J., Chen, D., Yao, Z., and Lei, Y.: NOx emission trends for China, 1995–2004: The view from the ground and the view from space, J. Geophys. Res.-Atmos., 112, D22306, https://doi.org/10.1029/2007jd008684, 2007.
Zhang, Q., Streets, D. G., Carmichael, G. R., He, K. B., Huo, H., Kannari, A., Klimont, Z., Park, I. S., Reddy, S., Fu, J. S., Chen, D., Duan, L., Lei, Y., Wang, L. T., and Yao, Z. L.: Asian emissions in 2006 for the NASA INTEX-B mission, Atmos. Chem. Phys., 9, 5131–5153, https://doi.org/10.5194/acp-9-5131-2009, 2009.