the Creative Commons Attribution 4.0 License.
the Creative Commons Attribution 4.0 License.
 | 04 May 2018
Effect of ecological restoration programs on dust concentrations in the North China Plain: a case study
Xin Long
Xuexi Tie
Guohui Li
Junji Cao
Tian Feng
Shuyu Zhao
Li Xing
Zhisheng An
In recent decades, the Chinese government has made a great effort in initiating large-scale ecological restoration programs (ERPs) to reduce the dust concentrations in China, especially for dust storm episodes. Using the Moderate Resolution Imaging Spectroradiometer (MODIS) land cover product, the ERP-induced land cover changes are quantitatively evaluated in this study. Two obvious vegetation protective barriers arise throughout China from the southwest to the northeast, which are well known as the “Green Great Wall” (GGW). Both the grass GGW and forest GGW are located between the dust source region (DSR) and the densely populated North China Plain (NCP). To assess the effect of ERPs on dust concentrations, a regional transport/dust model (WRF-DUST, Weather Research and Forecast model with dust) is applied to investigate the evolution of dust plumes during a strong dust storm episode from 2 to 8 March 2016. The WRF-DUST model generally performs reasonably well in reproducing the temporal variations and spatial distributions of near-surface [PMC] (mass concentration of particulate matter with aerodynamic diameter between 2.5 and 10 µm) during the dust storm event. Sensitivity experiments have indicated that the ERP-induced GGWs help to reduce the dust concentration in the NCP, especially in BTH (Beijing, Tianjin, and Hebei). When the dust storm is transported from the upwind DSR to the downwind NCP, the [PMC] reduction ranges from −5 to −15 % in the NCP, with a maximum reduction of −12.4 % (−19.2 µg m−3) in BTH and −7.6 % (−10.1 µg m−3) in the NCP. We find the dust plumes move up to the upper atmosphere and are transported from the upwind DSR to the downwind NCP, accompanied by dust decrease. During the episode, the forest GGW is nonsignificant in dust concentration control because it is of benefit for dry deposition and not for emission. Conversely, the grass GGW is beneficial in controlling dust erosion and is the dominant reason for [PMC] decrease in the NCP. Because the air pollution is severe in eastern China, especially in the NCP, and the contribution of dust episodes is significant, the reduction of dust concentrations will have important effects on severe air pollution. This study illustrates the considerable contribution of ERPs to the control of air pollution in China, especially in springtime.
- Article
(10073 KB) - Full-text XML
-
Supplement
(10666 KB) - BibTeX
- EndNote


Dust particles influence the Earth's radiative budget (Miller and Tegen, 1998; Haywood et al., 2005), cloud formation (Rosenfeld et al., 2001), atmospheric dynamics (Evan et al., 2008), air quality (Zhao et al., 2013; Giannadaki et al., 2014), and ocean biogeochemistry (Jickells et al., 2005) on various spatial and temporal scales. The mineral dust particles can also serve as carriers and reaction platforms, and the heterogeneous dust chemistry may change the photochemistry, acid deposition, and production of secondary aerosols in the atmosphere (Lou et al., 2014; Dong et al., 2016; Zhou et al., 2016). From 1980 to 2009, there was a decreasing dust trend in the tropical North Atlantic, being most closely associated with the decrease of Sahel dust emission and increase of precipitation over the tropical North Atlantic, and likely driven by the sea surface temperature increase (Chin et al., 2014). East Asian dust storms have shown decreasing trends since the 1950s except for a peak in dust activity (Lee and Sohn, 2011; Wang et al., 2017). East Asian dust storms could be transported to southern/eastern China (Qian et al., 2002), the Korean Peninsula (Park and In, 2003), Japan (Watanabe et al., 2014), even the west coast of North America (Cottle et al., 2013; Yoon et al., 2017), and beyond North America to Europe (Grousset et al., 2003). There are two major sources of dust in China, including the Taklamakan Desert in northwest China and the Gobi Desert in Mongolia and northern China (Sun et al., 2005; Wang et al., 2011). Dust particles come from many different sources, such as desertification, agricultural practices (Ginoux et al., 2012), construction (N. Li et al., 2016), and regional transport from exposed lands (Bian et al., 2011; Su et al., 2017).
To improve the environmental conditions, and to reduce ecological problems, such as desertification, sand storms, soil erosion, and wildlife habitat loss, the Chinese government has made a great effort in initiating large-scale ecological restoration programs (ERPs) (Yin and Yin, 2010; Cao et al., 2011). Chinese ERPs are among the biggest programs in the world because of their ambitious goals, massive scales, huge payments, and potentially enormous impacts. As a result, the “Green Great Wall” of China has been established in northern China (Fang et al., 2001; Duan et al., 2011). There is strong evidence that a remarkable vegetation increase trend has occurred in the dominant dust source areas, northwestern China, especially after 2000 (Piao et al., 2003; Peng et al., 2011). And the dust storm frequency in northern China generally shows a decreasing trend (Li et al., 2014; Wang et al., 2007). However, there is an ongoing debate about the effectiveness of national ERPs. Numerous experts and government officials have attributed the decrease trend to the success of ERPs in controlling dust storms and combated desertification (Wang et al., 2007; Liu et al., 2008; Tan and Li, 2015). Conversely, several experts have doubted the program's effectiveness (Jiang, 2005; Wang et al., 2010; Cao et al., 2011), generally asserting climate factors to be the main cause for the observed decrease of dust storms in northern China (Li et al., 2014; Fan et al., 2017). Some experts further highlighted the potential deterioration of the ecosystem with severe depletion of soil moisture, especially in semiarid and arid regions (Deng et al., 2016; Lu et al., 2016). Hence, there is an increasing need to evaluate the Chinese ERPs' effectiveness in controlling dust concentrations, particularly for the downwind densely populated areas, to improve decision support for ecological planning and implementation.
Few studies have so far been dedicated to estimating the effectiveness of ERPs in controlling dust erosion on a regional scale. Vegetation indices (e.g., NDVI, Normalized Difference Vegetation Index) are the most utilized parameters to quantify the ERPs' effectiveness (Duan et al., 2011; Lü et al., 2015). However, vegetation indices are not direct indicators for dust emission, which are mainly related to erodibility of bare land surface directly (Bian et al., 2011). On the other hand, it is difficult to separate vegetation change by ERPs from other factors, including climate change or CO2 fertilization (Silva et al., 2013). Climate factors are asserted to be one of the main causes for the observed decrease of dust storms in northern China (Cao et al., 2011). To exclude the influences of climate factors, Tan and Li (2015) have compared the correlation of dust storm indices (intensity and frequency), vegetation, and some climate factors (such as wind speed, precipitation) within and outside the Green Great Wall regions, inferring the effectiveness of ERPs in controlling dust storms. Previous studies did not quantify the effect of ERPs on dust concentrations, such as the detailed land cover change induced by ERPs or the effect of regional dust transportation toward downwind regions, especially in the North China Plain (NCP) region.
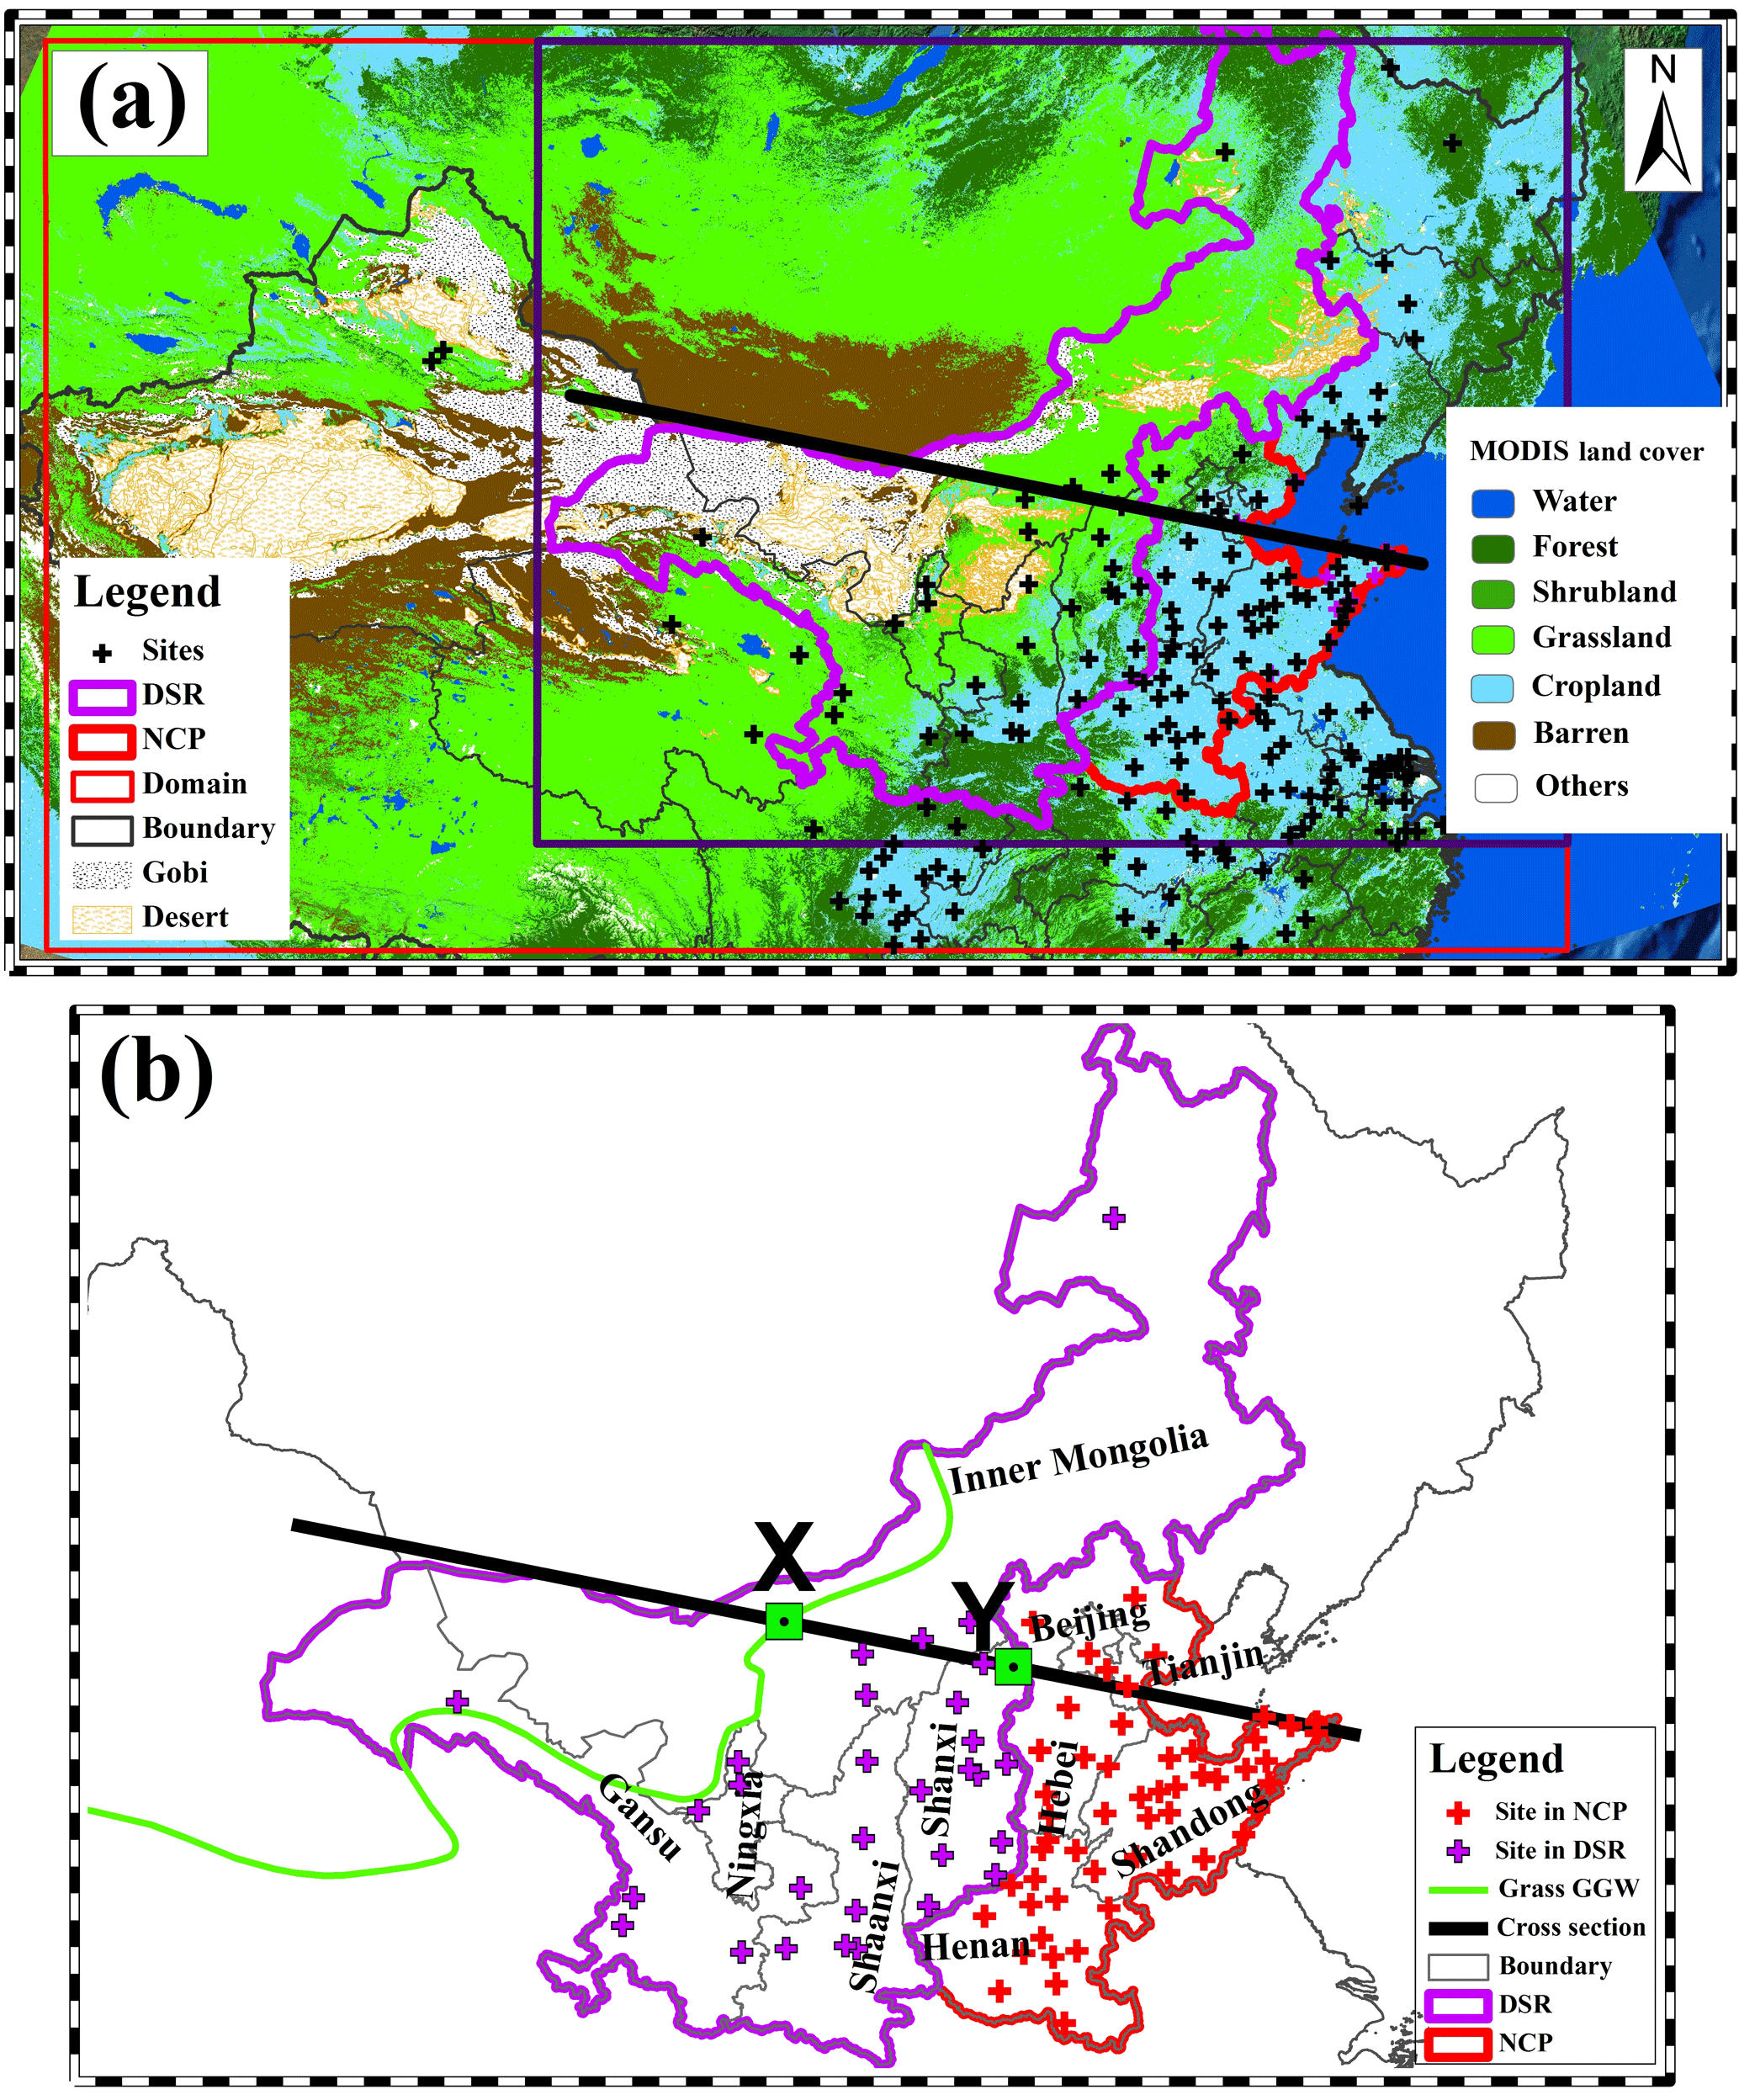
Figure 1(a) WRF-DUST simulation domain with surface land properties and major natural dust sources in China. (b) The details of ROIs for the dust source region and surrounding areas (DSR) and the downwind North China Plain (NCP) region. The crosses represent centers with ambient monitoring sites. The dark solid line is for the cross section focused on in this study. X and Y are the crossing points of the cross section with the grass Green Great Wall and the boundary of the DSR and the NCP, respectively. The land cover properties are derived from the MCD12Q1 product in the year 2013. The distributions of the Gobi and other deserts are adapted from a 1 : 200 000 desert distribution dataset provided by the Environmental and Ecological Science Data Center for West China, National Natural Science Foundation of China (http://westdc.westgis.ac.cn). The DSR contains five provinces in the northwest of the NCP, including Ningxia, Gansu, Shanxi, Inner Mongolia, and Shanxi. The NCP includes the five provinces of Beijing, Tianjin, Hebei, Henan, and Shandong.
Here our narrative is independently based on satellite measurements and WRF-DUST (Weather Research and Forecast model with dust) simulation. Because the MODIS land cover dataset is well representative of the situation across China (Wu et al., 2008), we investigated the ERP-induced land cover changes in China using the long-term MODIS land cover products. The impacts of the ERPs on land cover changes and the resultant dust concentration changes in the NCP were further quantitatively evaluated using the regional WRF-DUST model. We selected two regions of interest (ROIs) (Fig. 1): (1) the polluted and densely populated downwind areas of dust storms, the North China Plain (NCP), including the five provinces of Beijing, Tianjin, Hebei, Henan, and Shandong; (2) the dust source region and surrounding areas (DSR), including the five provinces in the northwest of the NCP (Ningxia, Gansu, Shanxi, Inner Mongolia, and Shanxi). The details of ROIs are shown in Fig. 1b. The methodology and WRF-DUST model description are described in Sect. 2. Results and discussions are presented in Sect. 3, together with the summaries and conclusions in Sect. 4.
2.1 Dust pollutants' measurements
China's Ministry of Environmental Protection (China MEP) has released real-time hourly observations of pollutants since 2013, including O3, NO2, CO, SO2, PM2.5, and PM10 (particulate matter with aerodynamic diameter less than 2.5 and 10 µm, respectively). We collected the hourly near-surface PM2.5 and PM10 mass concentrations from China's MEP (http://www.aqistudy.cn/). Because there is no speciation of aerosol compositions' measurements, the PM2.5−10 (particulate matter with aerodynamic diameter between 2.5 and 10 µm) mass concentrations (hereafter referred to as “[PMC]”) were used to analyze the dust storm events. According to several previous studies, the use of [PMC] also has two advantages: (1) the size distribution of dust mass is centered in the coarse mode, and (2) the difference between PM10 and PM2.5 is an efficient way to avoid contribution from anthropogenic fine particles, such as sulfate, nitrate, and organic aerosols (Ho et al., 2003; Shen et al., 2011). A total of 184 cities (489 measurement sites) had [PMC] observations in the research domain (see black cross in Fig. 1a), including 30 cities within the DSR (see magenta cross in Fig. 1b) and 53 cities within the NCP region (see red cross in Fig. 1b). Because the prevailing winds were dominated by west winds, most measurement sites (as shown in Fig. 1a) are located in the downwind area of the dust source regions (such as bare lands and deserts). As a result, China's MEP measurement network provides sufficient spatial coverage to follow the evolution of dust concentrations.
2.2 MCD12Q1 data adaption and land cover change assessment
We quantitatively evaluated the characteristics of annual land cover using the MODIS land cover products (MCD12Q1), derived from the Terra and Aqua Moderate Resolution Imaging Spectroradiometer (MODIS) observations (Friedl et al., 2002). The MCD12Q1 products have been widely used in studies of atmospheric science, hydrology, ecology, and land change science (Gerten et al., 2004; Guenther et al., 2006; Reichstein et al., 2007; Turner et al., 2007). Wu et al. (2008) compared four global land cover datasets across China, concluding that the MODIS land cover product is the most representative over China, with a minimal bias from China's National Land Cover Dataset. The MCD12Q1 (Version 5.1) IGBP (International Geosphere Biosphere Programme) scheme was used to explore the variability of the land use fraction (LUF) from 2001 to 2013. The IGBP layer is generated using a supervised classification algorithm in conjunction with a revised database of high quality land cover training sites (Friedl et al., 2010). Its accuracy is estimated to be 72.3–77.4 % globally, with a 95 % confidence interval (Friedl et al., 2002, 2010).
The IGBP layer in MCD12Q1 is well consistent with the MODIS land use scheme in the WRF-DUST model, including 11 natural vegetation classes, 3 developed and mosaic land classes, and 3 non-vegetated land classes. Table S1 in the Supplement shows the land use categories for the WRF-DUST MODIS scheme and MCD12Q1 product. We processed MCD12Q1 data to fit the WRF-DUST resolution. The gridded LUF was calculated by Eq. (1).
where i and j are grid indices, Area stands for the total area of land use category k within grid cell (i,j), and Areai,j is the area of grid cell (i,j). The LUF ranges from 0 to 1, representing the emission potential of the specified dust source (k) in each grid cell (i,j). A larger LUF denotes a higher dust emission potential.
2.3 Model description
In the present study, we utilized a specific WRF-DUST model developed based on a regional chemical model WRF-CHEM (version 3.2) (Grell et al., 2005). The GOCART (Georgia Tech/Goddard Global Ozone Chemistry Aerosol Radiation and Transport model) dust scheme (Ginoux et al., 2001; Chin et al., 2002) was utilized to calculate the physical processes of dust, such as dust emissions, transport, dry depositions, and gravitational settling. The dust particle sizes are divided into five size bins with effective radii of 0.7, 1.4, 2.4, 4.5, and 8.0 µm. The dust emission in each dust size bins is size-resolved. Dust emission flux Gp is dependent on the surface wind velocity and surface land cover properties (Ginoux et al., 2001; Grini et al., 2005), which can be calculated by
where G is the dust emission flux (kg s−1); p is the dust size bin; C is a dimensional factor (0.8 µg s2 m−5 for current study); γ is the dust particle fraction; E is the soil erosion factor with a value between 0 and 1, denoting the probability of dust uplifting; V is the near-surface wind velocity at 10 m (m s−1); and Vt is the threshold velocity of wind erosion as a function of dust density, particle diameter, and surface wetness (Ginoux et al., 2001, 2014).
The WRF-DUST model has been applied to simulate dust storm events in several previous studies (Kang et al., 2009; Bian et al., 2011; Wang et al., 2012; N. Li et al., 2016). These studies reported that the WRF-DUST model is generally capable of simulating dust storm events in the Asian region.
The standard version of WRF-CHEM calculates dust emission (Eq. 2) only considering the dominant land cover. The water land cover category can be treated as a dominant category only with a high LUF greater than 0.5. For other categories (Table S1), the dominant land cover category denotes the specific one with a maximum LUF (Eq. 1) among all the land cover categories excluding the water category. Theoretically, one land cover category (excluding water), with a LUF greater than the average value (0.05), could be the dominant land cover category. This caused the dust emission calculation in the standard version being insensitive to land cover change, especially for incomplete changes within one grid cell. To better investigate the impacts of ERPs on dust emission, we modified the GOCART dust emission scheme, using the LUF to represent the real dust emission potential. The dust emission flux (G) in each grid is given by the sum of dust emitted from each dust source (Eq. 3).
LUFsource denotes the gridded area fractions of bare soil and cropland, which are derived from the satellite data (MCD12Q1). The other parameters are the same as those in Eq. (2). Besides bare soil, we also calculated the largest anthropogenic dust source emitted from agricultural soil (Tegen et al., 2004; Ginoux et al., 2012). We empirically set the erosion factor E=0.12 for cropland and E=0.5 for bare soil in western China (N. Li et al., 2016).
A dust storms episode from 2 to 8 March 2016 in northern China was simulated using the WRF-DUST model. The domain, centered at the point of (112∘ E, 41∘ N), is composed horizontally of 500 by 300 grid points spaced with a resolution of 9 km (Fig. 1a) and vertically with 35 sigma levels. The physical parameterizations include the Lin microphysics scheme (Lin et al., 1983), the Mellor–Yamada–Janjic (MYJ) turbulent kinetic energy (TKE) planetary boundary layer scheme (Janić, 2002), the unified Noah land surface model (Chen and Dudhia, 2001), the Goddard long wave radiation parameterization (Chou and Suarez, 1999), and the shortwave radiation parameterization (Chou et al., 2001). The cloud effects on the optical depth in radiation are possible but have not been analyzed in the present study. Meteorological initial and boundary conditions were taken from the 1∘ × 1∘ reanalysis data of the National Centers for Environmental Prediction (NCEP) (Kalnay et al., 1996). For the episode simulations, the case studies were simulated with 3 days for spin-up. Considering the contribution of the anthropogenic emission to near surface [PMC], we also calculated the physical processes (such as emissions, transport, dry deposition, and gravitational settling) of anthropogenic PMC (coarse-mode particle matter) emission in the WRF-DUST simulation. The detailed emission inventory of anthropogenic PMC was obtained from the Multi-resolution Emission Inventory for China (MEIC) (Zhang et al., 2009), which is then updated and improved for the year 2010 (http://www.meicmodel.org).
We use the normalized mean bias (NMB), the index of agreement (IOA), and the correlation coefficient (r) to assess the WRF-DUST model performance in simulating [PMC] against measurements.
where Pi and Oi are the calculated and observed PMC concentrations ([PMC]), respectively. N is the total number of predictions used for comparisons, and represents the average of the prediction and observation. The IOA ranges from 0 to 1, with 1 showing perfect agreement of the prediction with the observation. The R ranges from −1 to 1, with 1 implicating perfect spatial consistency of observation and prediction.

Figure 2The horizontal distributions of land cover changes from 2001 to 2013 for the categories of (a) bare soil, (b) grasslands/savannas, (c) forest, and (d) others.
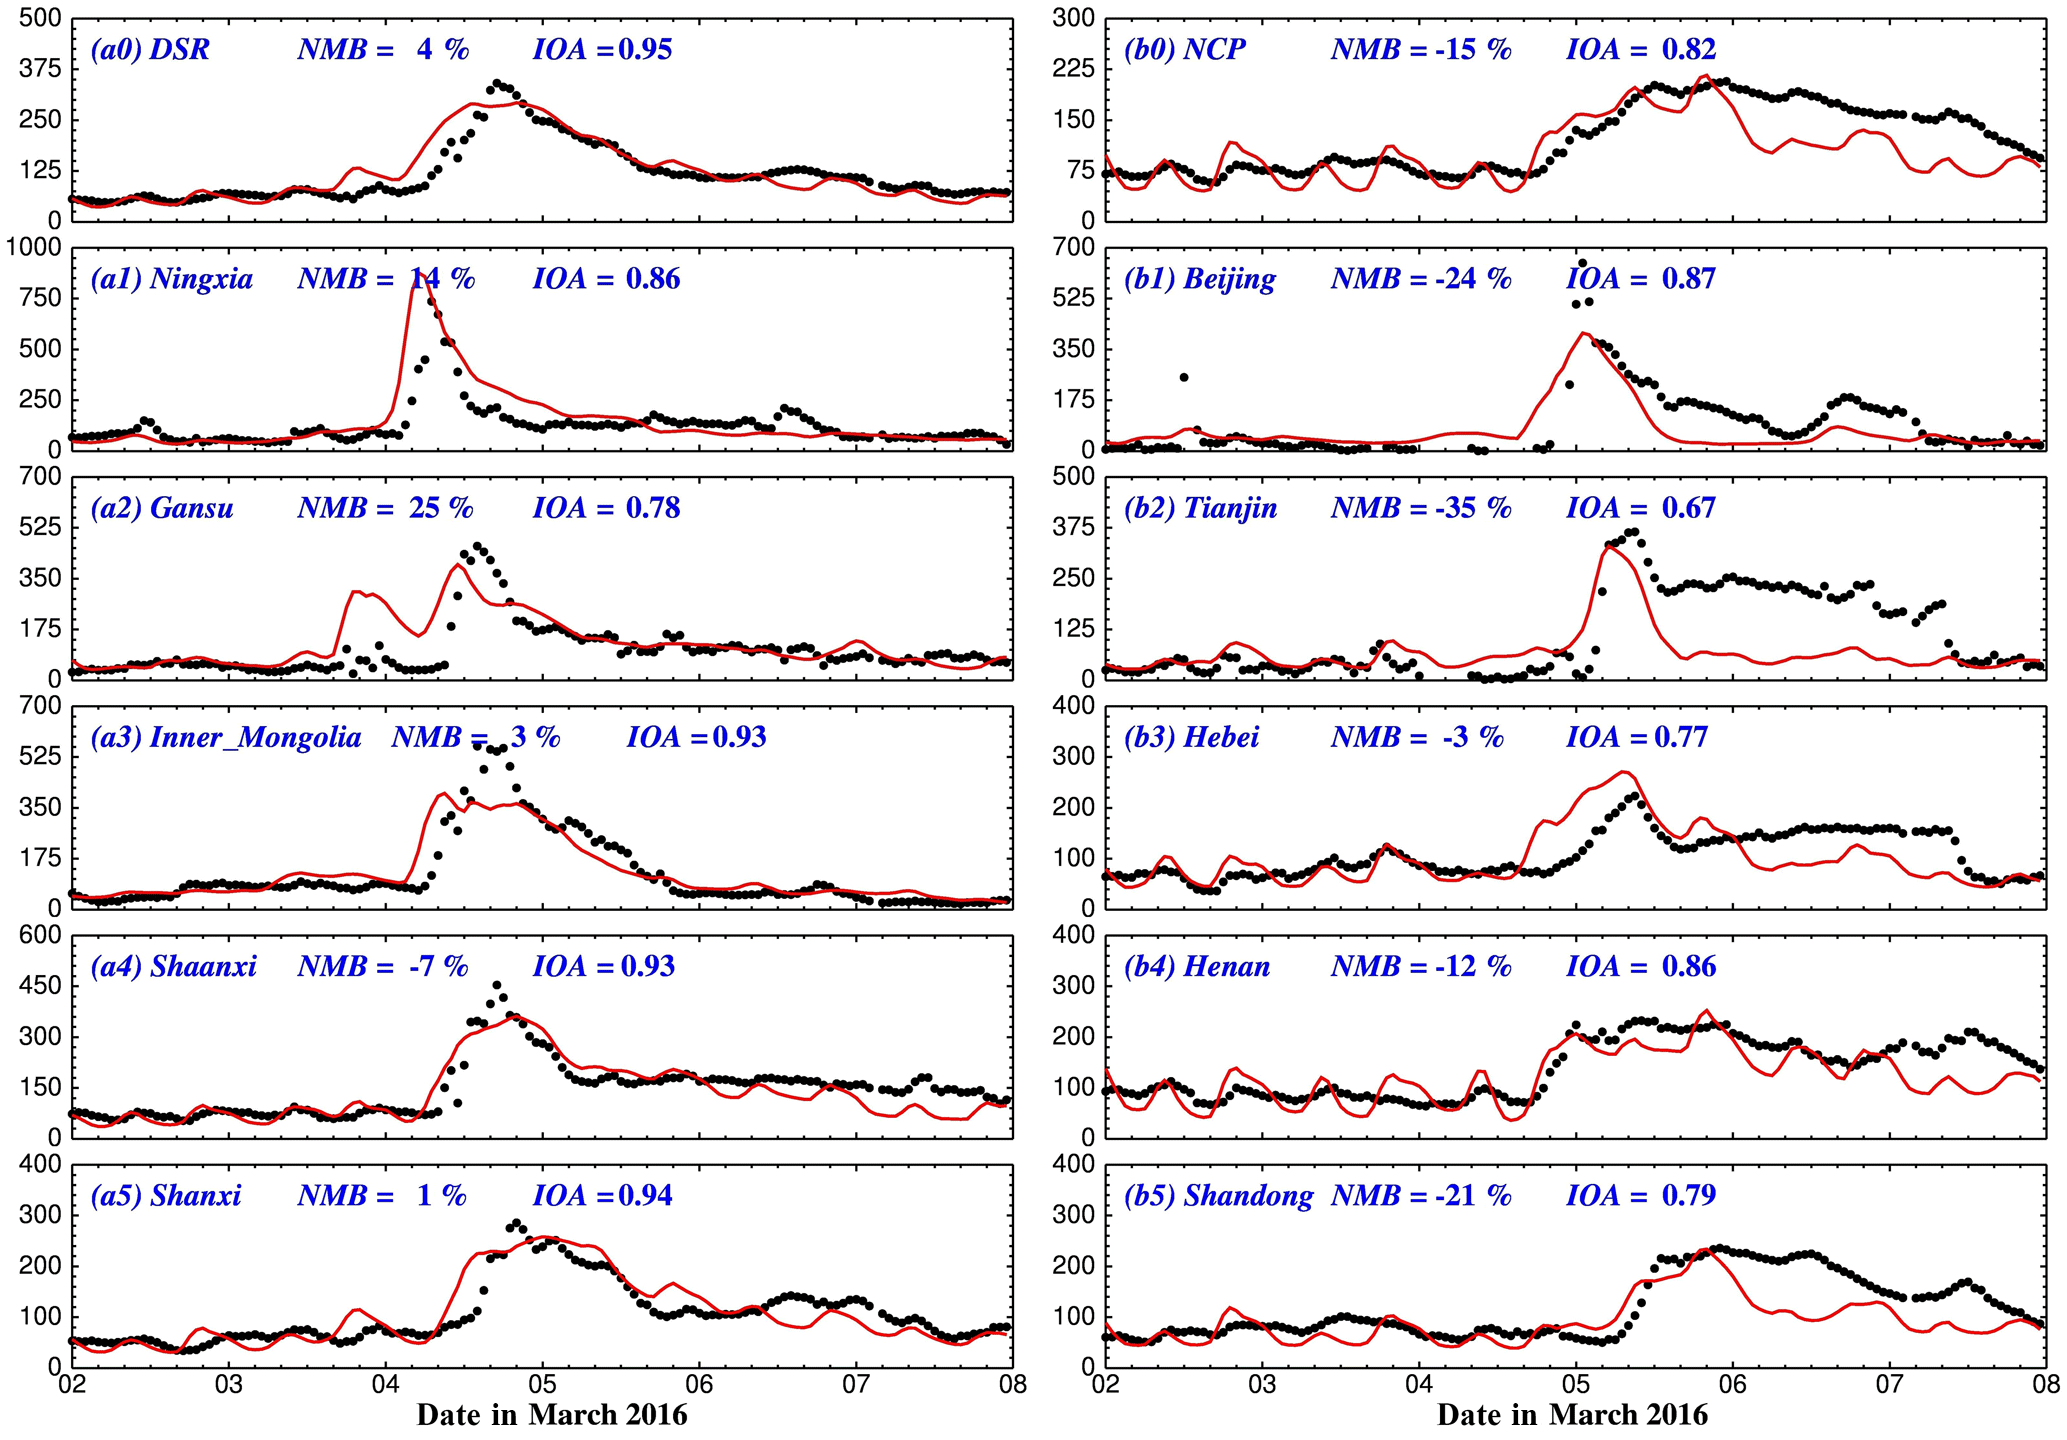
Figure 3The temporal variations of predicted (red lines) and observed (black dots) diurnal profiles of near-surface [PMC] (µg m−3) over all ambient monitoring stations in provinces within the DSR and the NCP. The locations of measurement sites and provinces can be seen in Fig. 1b. The model performance statistics of the normalized mean bias (NMB) and the index of agreement (IOA) are also shown. The x axis shows the date in March 2016 in Beijing Time.
3.1 Land cover change induced by ERPs
The land surface changes were assessed using the MCD12Q1 product. From 2001 to 2013, the land cover exhibits two obvious vegetation increase trends between the dust source region in northwestern China and densely populated areas in eastern China (Fig. S1c). Firstly, there is a regional grass/savanna increase trend with obvious LUF increase of grass/savanna categories (Fig. 2b), corresponding with a regional LUF decrease in bare soil in northwestern China (Fig. 2a). The result is consistent with previous research based on long-term official and synthesized data, which also found a decreasing trend of soil erosion areas in four provinces (e.g., Inner Mongolia, Gansu, Qinghai, and Xinjiang), especially after 2000 (Zhang et al., 2016). Secondly, a regional forest LUF increase trend occurs in the northwestern NCP (Fig. 2c), which agrees with the previous study of X. Li et al. (2016), who reported a remarkable forest growth in the northwest of the NCP from 2000 to 2010. As a result, two obvious vegetation protective barriers have arisen throughout China in a southwest to northeast direction, which are well known as the Green Great Wall (GGW), with the expectation that eastern China will be protected from high dust concentrations (Liu et al., 2008; Cao et al., 2011; Parungo et al., 2013).
The land cover changes, especially the obvious vegetation growth, are mainly caused by China's national ERPs. The government has claimed a significant contribution of GGWs in controlling desertification and dust storms, and it has been widely reported in the news media in China (Fig. S2). The grass GGW acts as a barrier to stop the desert moving toward densely populated areas (see Figs. S1c, S2a b). The forest GGW acts as another barrier to protect the densely populated regions from the dust source region (Fig. S1c). The GGWs separate the dust source regions from densely populated and economically developed regions in southeastern China (Fig. S1c), illustrating that human activities, especially the national ERPs, are the dominant factor for land cover changes, rather than other natural factors, e.g., the natural hydrological cycle. (1) Many ERPs help to protect grassland and reduce desertification, such as the “Desertification Combating Program around Beijing and Tianjin (DCBT)” and the “Shelterbelt Network Development Program (SNDP)”. (2) The forest GGW can be attributed to many ERPs of national afforestation programs, such as the “Natural Forest Protection Program (NEPP)”, “Grain for Green Project”, or the “Three-North Shelter Forest System Project”. The China's State Forestry Administration showed enthusiasm in planting trees for ecological restoration (Yin and Yin, 2010; Cao et al., 2011).
3.2 Model performance
We first adapted the MCD12Q1 product of 2013 into the WRF-DUST model and performed the numerical simulation of dust storm episodes from 2 to 8 March 2016. For the convenience of discussion, we have defined the simulation with the 2013 land cover as the reference case (hereafter referred to as REF case), and results from the reference simulation are compared to observations in the DSR and the NCP.
The hourly measurements of [PMC] in both the dust source region (DSR) and the downward populated region (NCP) were used to validate the WRF-DUST model simulations. Figure 3 presents the diurnal variations of calculated and observed near-surface [PMC] averaged over the ambient monitoring site in provinces within the DSR and the NCP. The model reproduces the temporal variations of surface [PMC] compared to the observations reasonably well; e.g., the dust storm outbreak with peak [PMC] in the DSR occurs much earlier than that in the downwind NCP areas. The peak [PMC] occurred on 4 March within the DSR (Fig. 3a), whereas it occurred on 5 March within the NCP (Fig. 3b). In the DSR, the calculated results show the same phase of the peak value compared with the measured peak on 4 March. However, the calculated peak values show some underestimates of the measured value. In the NCP, the calculated results show the same phase of the peak value compared with the measured peak on 5 March. The calculated peak value is similar to the measured peak. However, after the peak value (after 6 March), the calculated results underestimate the measured value.
In the different provinces of the dust source region, the hourly provincial average [PMC] can exceed 500 µg m−3 in Ningxia, Gansu, and Inner Mongolia (the locations of these provincial average are shown in Fig. 1b) before 20:00 on 4 March, implicating a dust storm outbreak in the DSR. In the different provinces of the downward region, the peak values have time lags (hours to half a day) compared to the peak values in the DSR. For example, the peak [PMC] arose first in Beijing with a time lag of 7 h. In the other four provinces of the NCP (the locations of these provincial average are shown in Fig. 1b), the time lags are about 12 h (Fig. 3b).

Figure 4(a) The distribution of calculated (color contour) and observed (colored circles) episode-averaged [PMC], along with the simulated wind fields (black arrows). (b) Statistical comparison of simulated and observed episode-averaged [PMC], with the regression line (black solid) and correlation coefficient (r). The red dashed line indicates the 1 : 1 line.
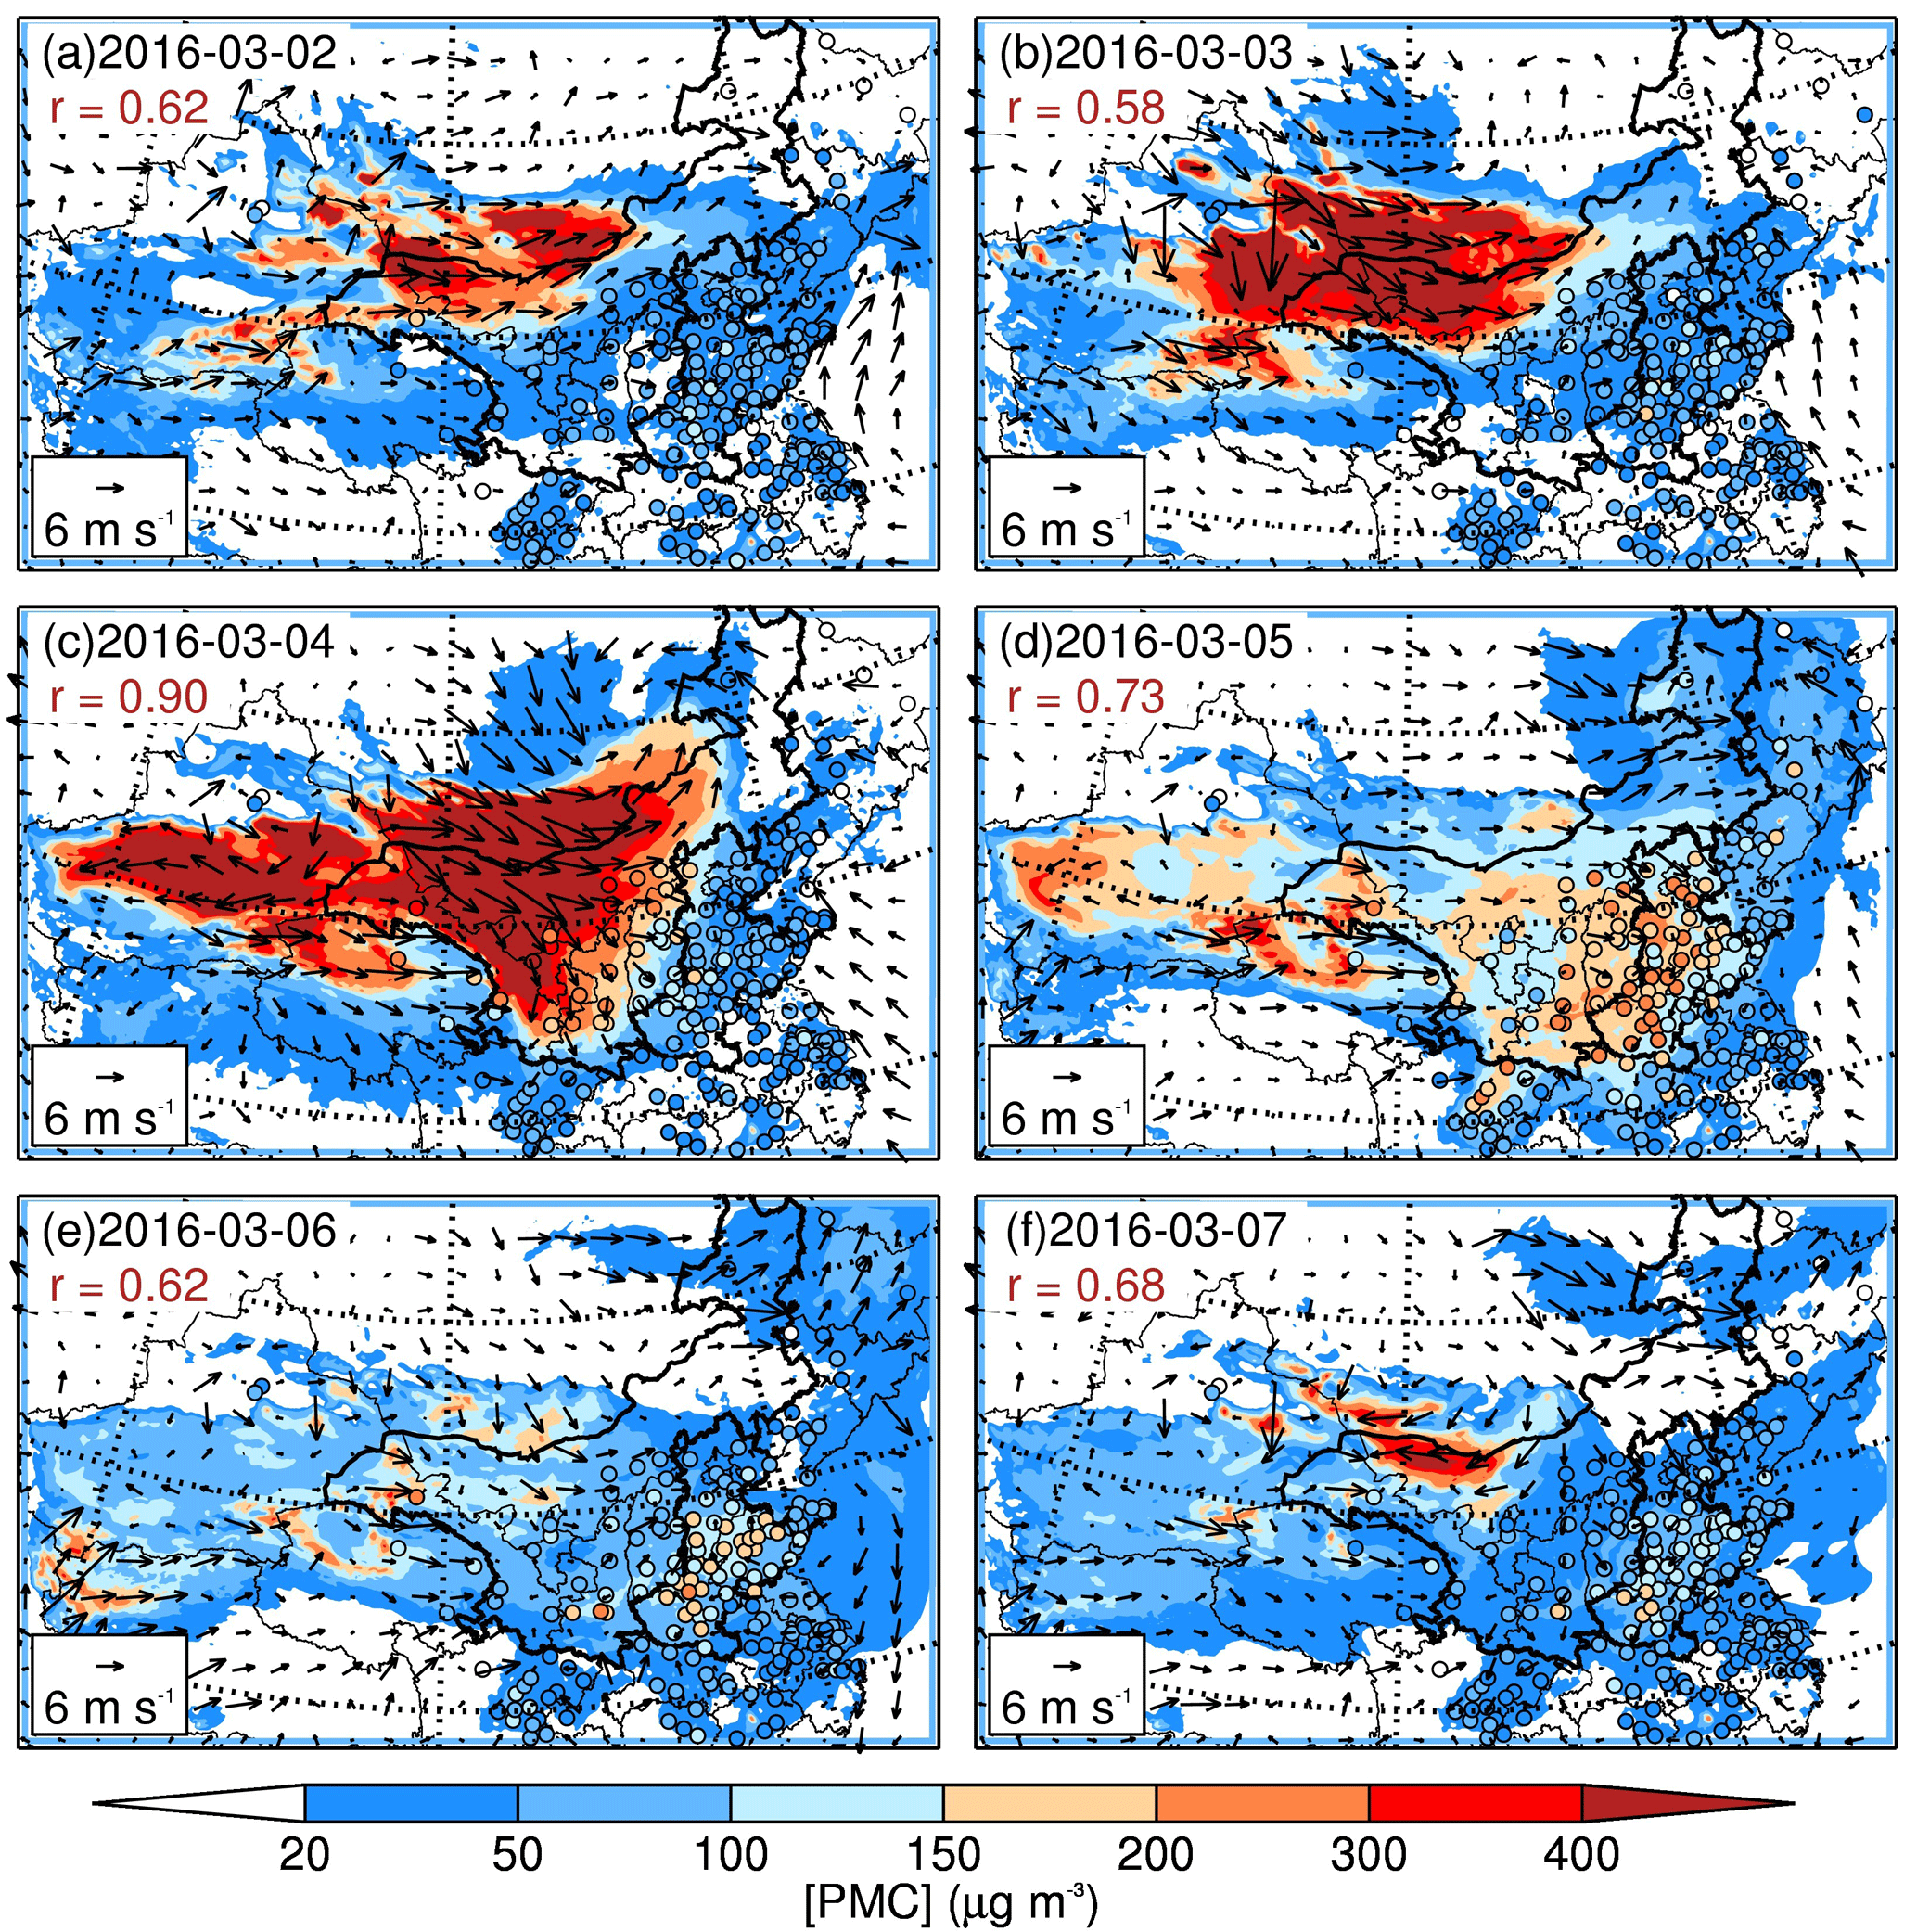
Figure 5The distribution of calculated (color contour) and observed (colored circles) daily average [PMC], along with the simulated wind fields (black arrows). The correlation coefficient (r) of linear regression between measured and simulated surface [PMC] is indicated in red.
The statistical results show that the model generally exhibits good performance in simulating [PMC] in the DSR, including an IOA of 0.95 and NMB of 4 % for the DSR. For the related provinces, all the IOAs exceed 0.78 and absolute NMBs are lower than 25 % (Fig. 3a1–a5). The model also generally reproduces the observed [PMC] in the NCP, with an IOA of 0.82 for the NCP and IOAs exceeding 0.67 for related provinces. However, the model biases still exist, and considerable underestimation biases occurred on 6–7 March in the NCP. The model underestimates the observed [PMC] considerably, with an average NMB of −15 % in the NCP (Fig. 3b0). And the model cannot predict the observed [PMC] in Tianjin well (Fig. 3b2), which is affected by the sea breeze when the large-scale wind fields are weak (Fig. 5e, h). In general, however, current numerical weather prediction models, even in research mode, still have difficulties in producing the location, timing, depth, and intensity of the sea-breeze front (Banta et al., 2005; Wang et al., 2013). The model predicts the [PMC] variations in the other four provinces in the NCP reasonably well, with IOAs more than 0.77, but with an underestimation of NMBs varying from −24 to −3 % (Fig. 3b1, b3–b5).
The episode-averaged model results were compared with the measurements in Fig. 4. Figure 4a provides the horizontal distributions of the simulated and the observed near-surface [PMC], along with the simulated wind fields. The WRF-DUST model reproduces the spatial variation of [PMC] during the dust episode reasonably. The model simulation is also able to provide a more detailed horizontal distribution, while there is generally a lack of measured data in remote desert areas (see Fig. 4a). The correlation coefficient (r) between the simulations and observations is 0.77 (see Fig. 4b), indicative of good model skill in simulating the evolution of the dust plumes.
In order to evaluate the detailed temporal evolution of the dust plumes, the daily average calculated and measured dust distributions are shown in Fig. 5. The 2 March was in the starting stage of a dust storm, and both the observed and simulated [PMC] reached as high as 200–300 µg m−3 in the upwind DSR, while in the downwind NCP region, the concentrations of [PMC] were low, being only 20–50 µg m−3 (Fig. 5a). On 3 March, the dust storm was strengthened in the upwind DSR (Fig. 5b). On 4 March, the dust storm was further strengthened in the upwind DSR. The area of the dust storm in the DSR was enlarged, and the concentrations of [PMC] were the highest values of the episode, reaching 300–500 µg m−3. In addition, there were strong northwest winds (> 10 m s−1). Due to the strong northwest prevailing winds, the dust storm started to be transported from the upwind DSR to the downwind NCP in a northwest to southeast direction (Fig. 5c). On 5 March, due to the strong northwest prevailing winds on the previous day, the dust storm reached the NCP and caused a remarkable [PMC] increase, with concentrations rising to 100–200 µg m−3. At the same time, the dust plumes were dispersed in the DSR, showing a significant decrease in [PMC]. The model results represented these important plumes well (Fig. 5d). On 6–7 March, the dust storm passed through and the wind speed slowed down, and the [PMC] significantly decreased in both the DSR and the NCP (Fig. 5e–f). The correlation coefficients between measured and simulated [PMC] are 0.58–0.90 in the starting stage of the dust storm (Fig. 5a–c) and 0.62–0.73 in the later stage of the dust storm (Fig. 5d–f).
Some model biases exist. For example, the model underestimates the observed [PMC] in the NCP, especially during the later stage of the episode on 6–7 March (Fig. 5e–f), suggesting several biases in the model (such as the bias in the meteorological simulation or a faster deposition) (Bian et al., 2011; Duan et al., 2011; Bei et al., 2012). However, the WRF-DUST model captures the spatial variations and temporal evolutions of [PMC] generally well in both the upwind DSR and the downwind NCP during the episode, showing that the dust emission scheme used in the present study and simulated wind fields are generally reasonable and providing a reliable base for the further assessment.
3.3 Effect of ecological restoration on dust plumes
As human activities, especially the national ERPs, are the dominant factor for land cover changes (see Sect. 3.1), in the present study we treated the land cover changes related to GGWs as the result of ERPs' implementation. In order to evaluate the impact of the ERP-induced land cover change and resultant [PMC] change, a sensitivity experiment is designed, in which the land cover change related to GGWs (both the grass GGW and forest GGW) derived from the MCD12Q1 product of 2001 (see Fig. S3) is adapted into the WRF-DUST model, representing the land cover situations without ERPs (hereafter referred to as the SEN-ERPs case).
Figure 6 shows the episode-averaged near-surface [PMC] change resulted from land cover changes induced by ERPs from 2001 to 2013, including the spatial variations in concentration (Fig. 6a) and percentage (Fig. 6b) during the episode. Regions with increased vegetation (see Figs. 2b, S2c) and their downwind areas denote the most remarkable change, with [PMC] reduction exceeding 20 %, especially for the areas where bare surfaces were converted to grassland. The ERPs generally reduce the dust plumes in the NCP during the dust storm episode, except in Henan Province. The episode-averaged [PMC] reduction is −10 to −2 % in BTH (see Fig. 1b, including the provinces of Beijing, Tianjin, and Hebei, the heart of the NCP) and Shandong. In northern Hebei, the episode-reduced [PMC] can reach as high as −20 to −10 %. The changes of [PMC] are generally negative, implicating the effectiveness of ERPs in controlling dust particles and thus preventing the dust plumes in the NCP, especially for BTH.
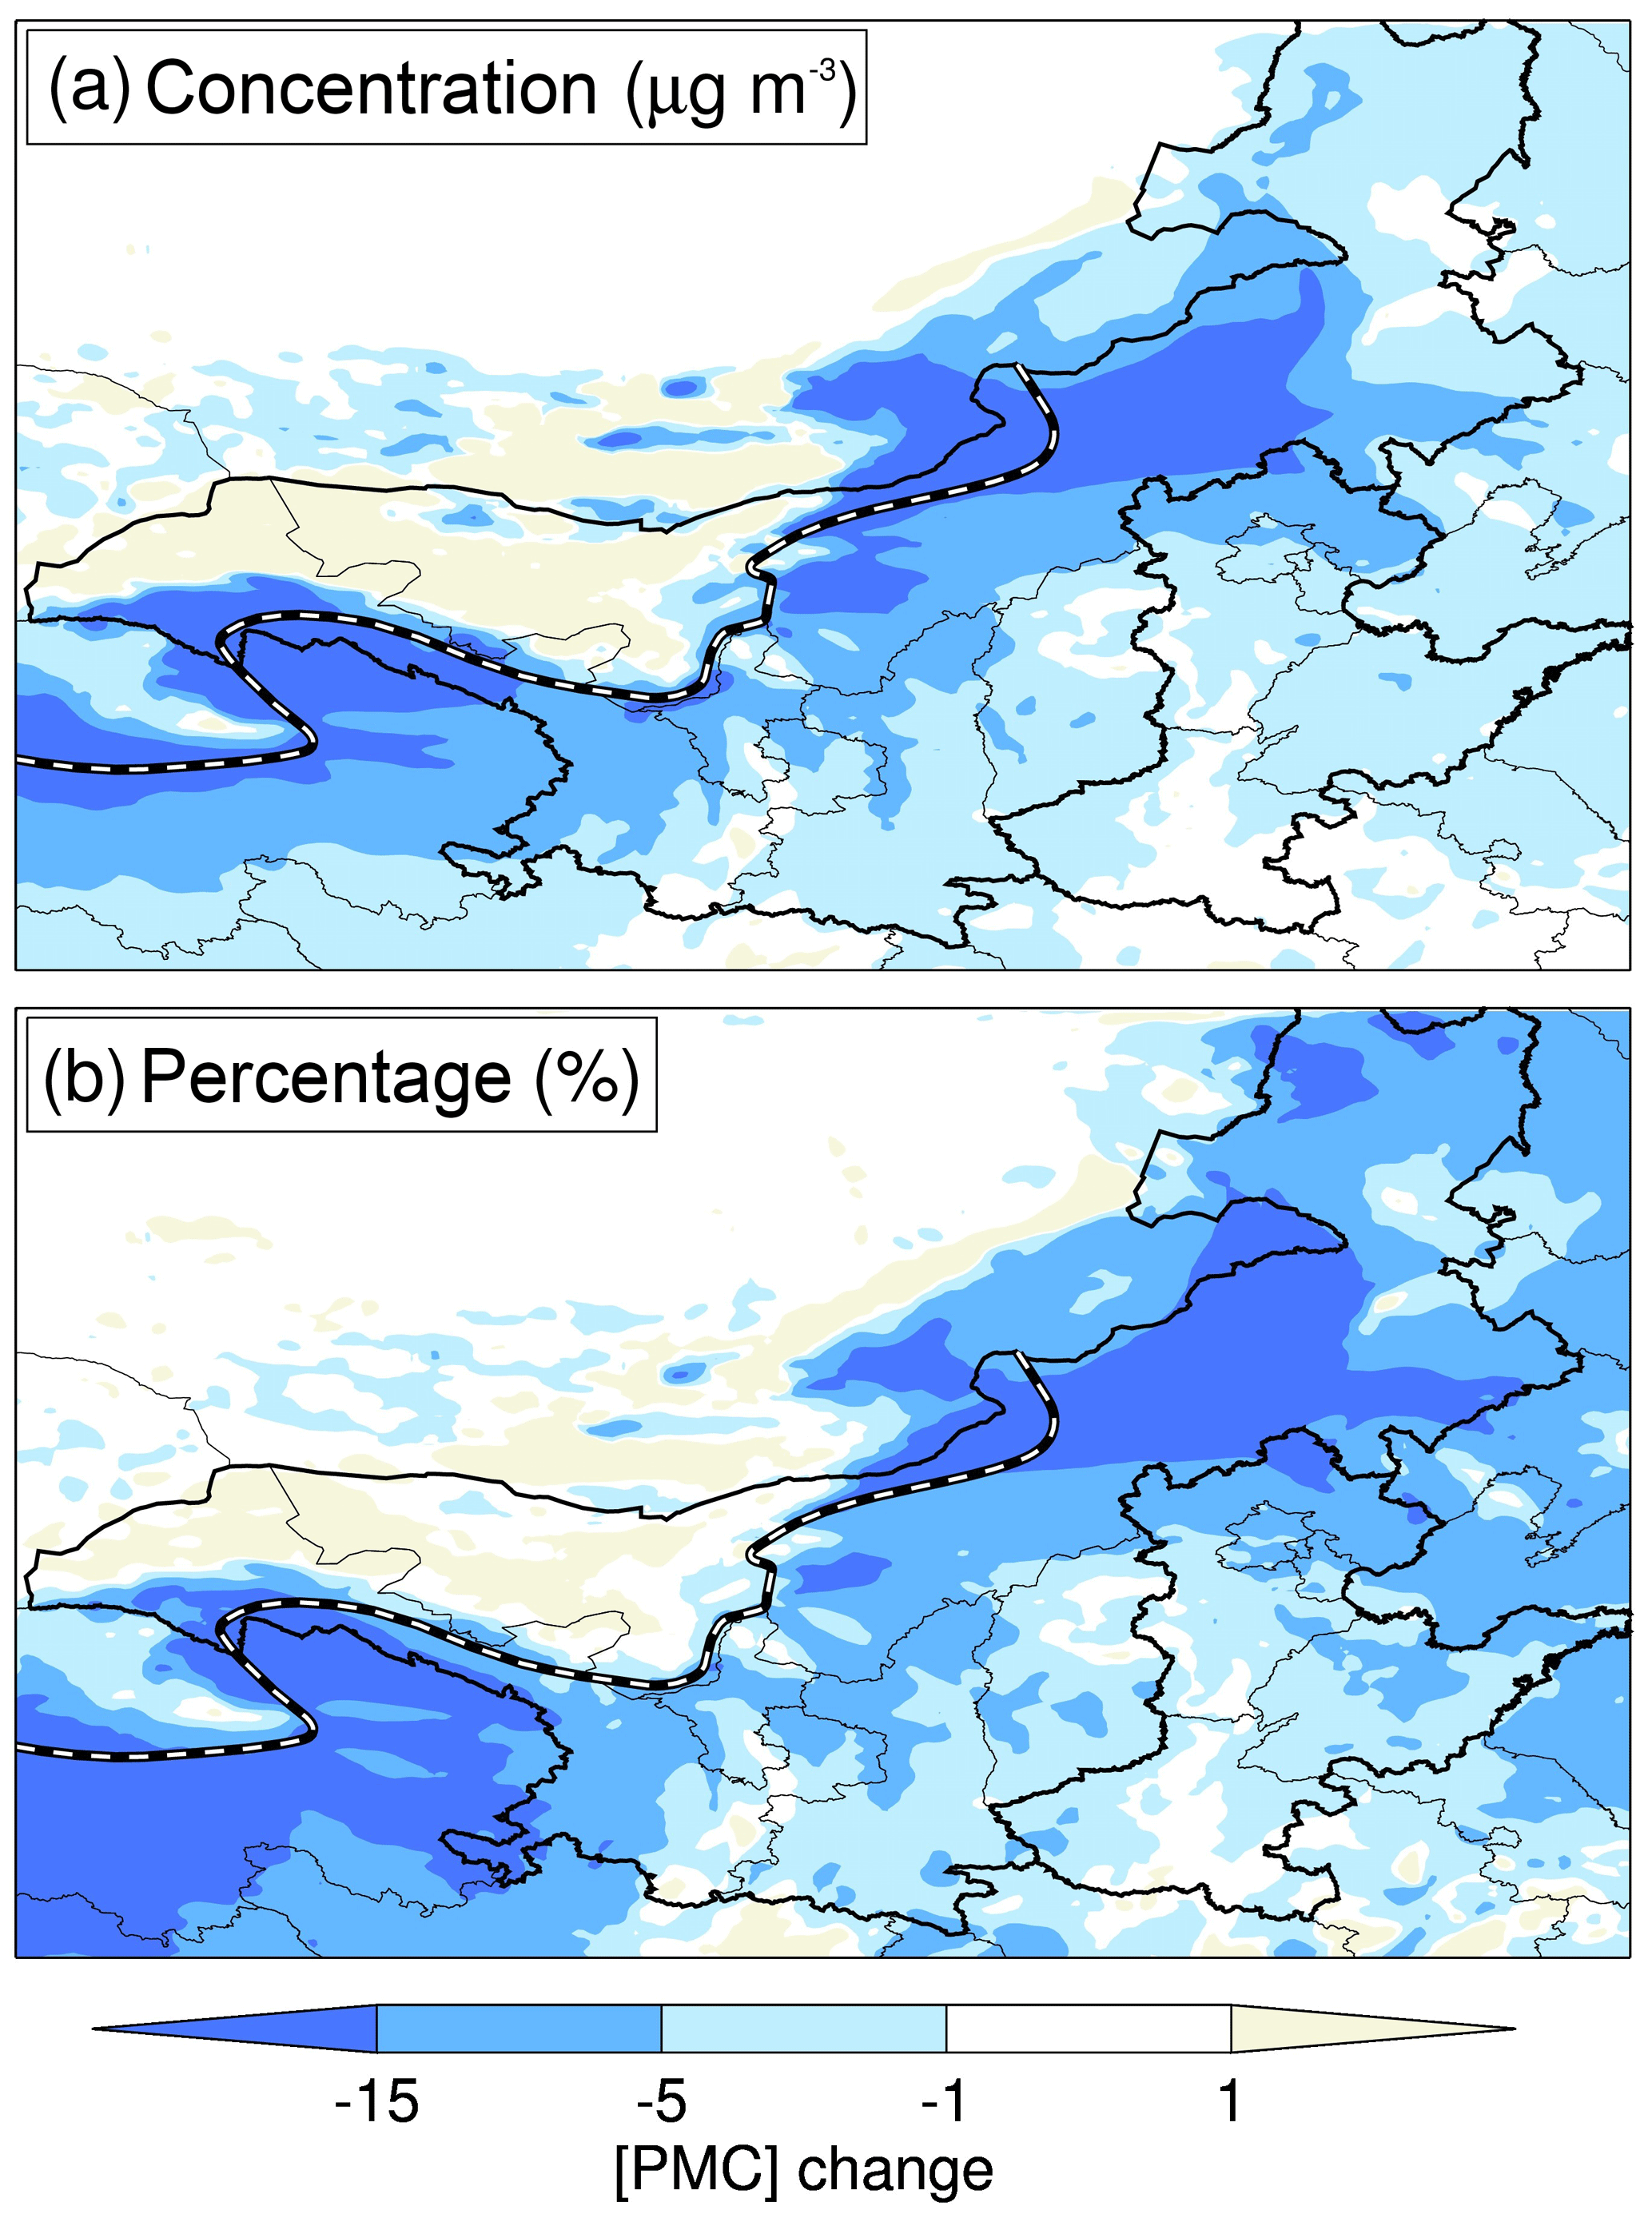
Figure 6The episode-averaged near-surface [PMC] change resulted from land cover changes induced by ERPs from 2001 to 2013, including the spatial variations in (a) concentration and (b) percentage. The results refer to spatial variations between the REF case and the SEN-ERPs case (REF – SEN-ERPs). The black and white line denotes the grass GGW (see Fig. 2b).
Figure 7 presents the hourly near-surface [PMC] change resulted from the land cover changes induced by ERPs from 2001 to 2013, including the temporal variations in concentration (Fig. 7a) and percentage (Fig. 7b) averaged at monitoring sites in the DSR, the NCP, and BTH. The changes of [PMC] are also generally negative. During the episode when the dust storm was transported from the DSR to the NCP, the benefits of ERP-induced dust concentration reduction are remarkable, with the maximum reduction of [PMC] ranging from −5 to −15 % in the NCP. The highest reductions of [PMC] induced by ERPs are −12.4 % (−19.2 µg m−3) for BTH and −7.6 % (−10.1 µg m−3) for NCP.
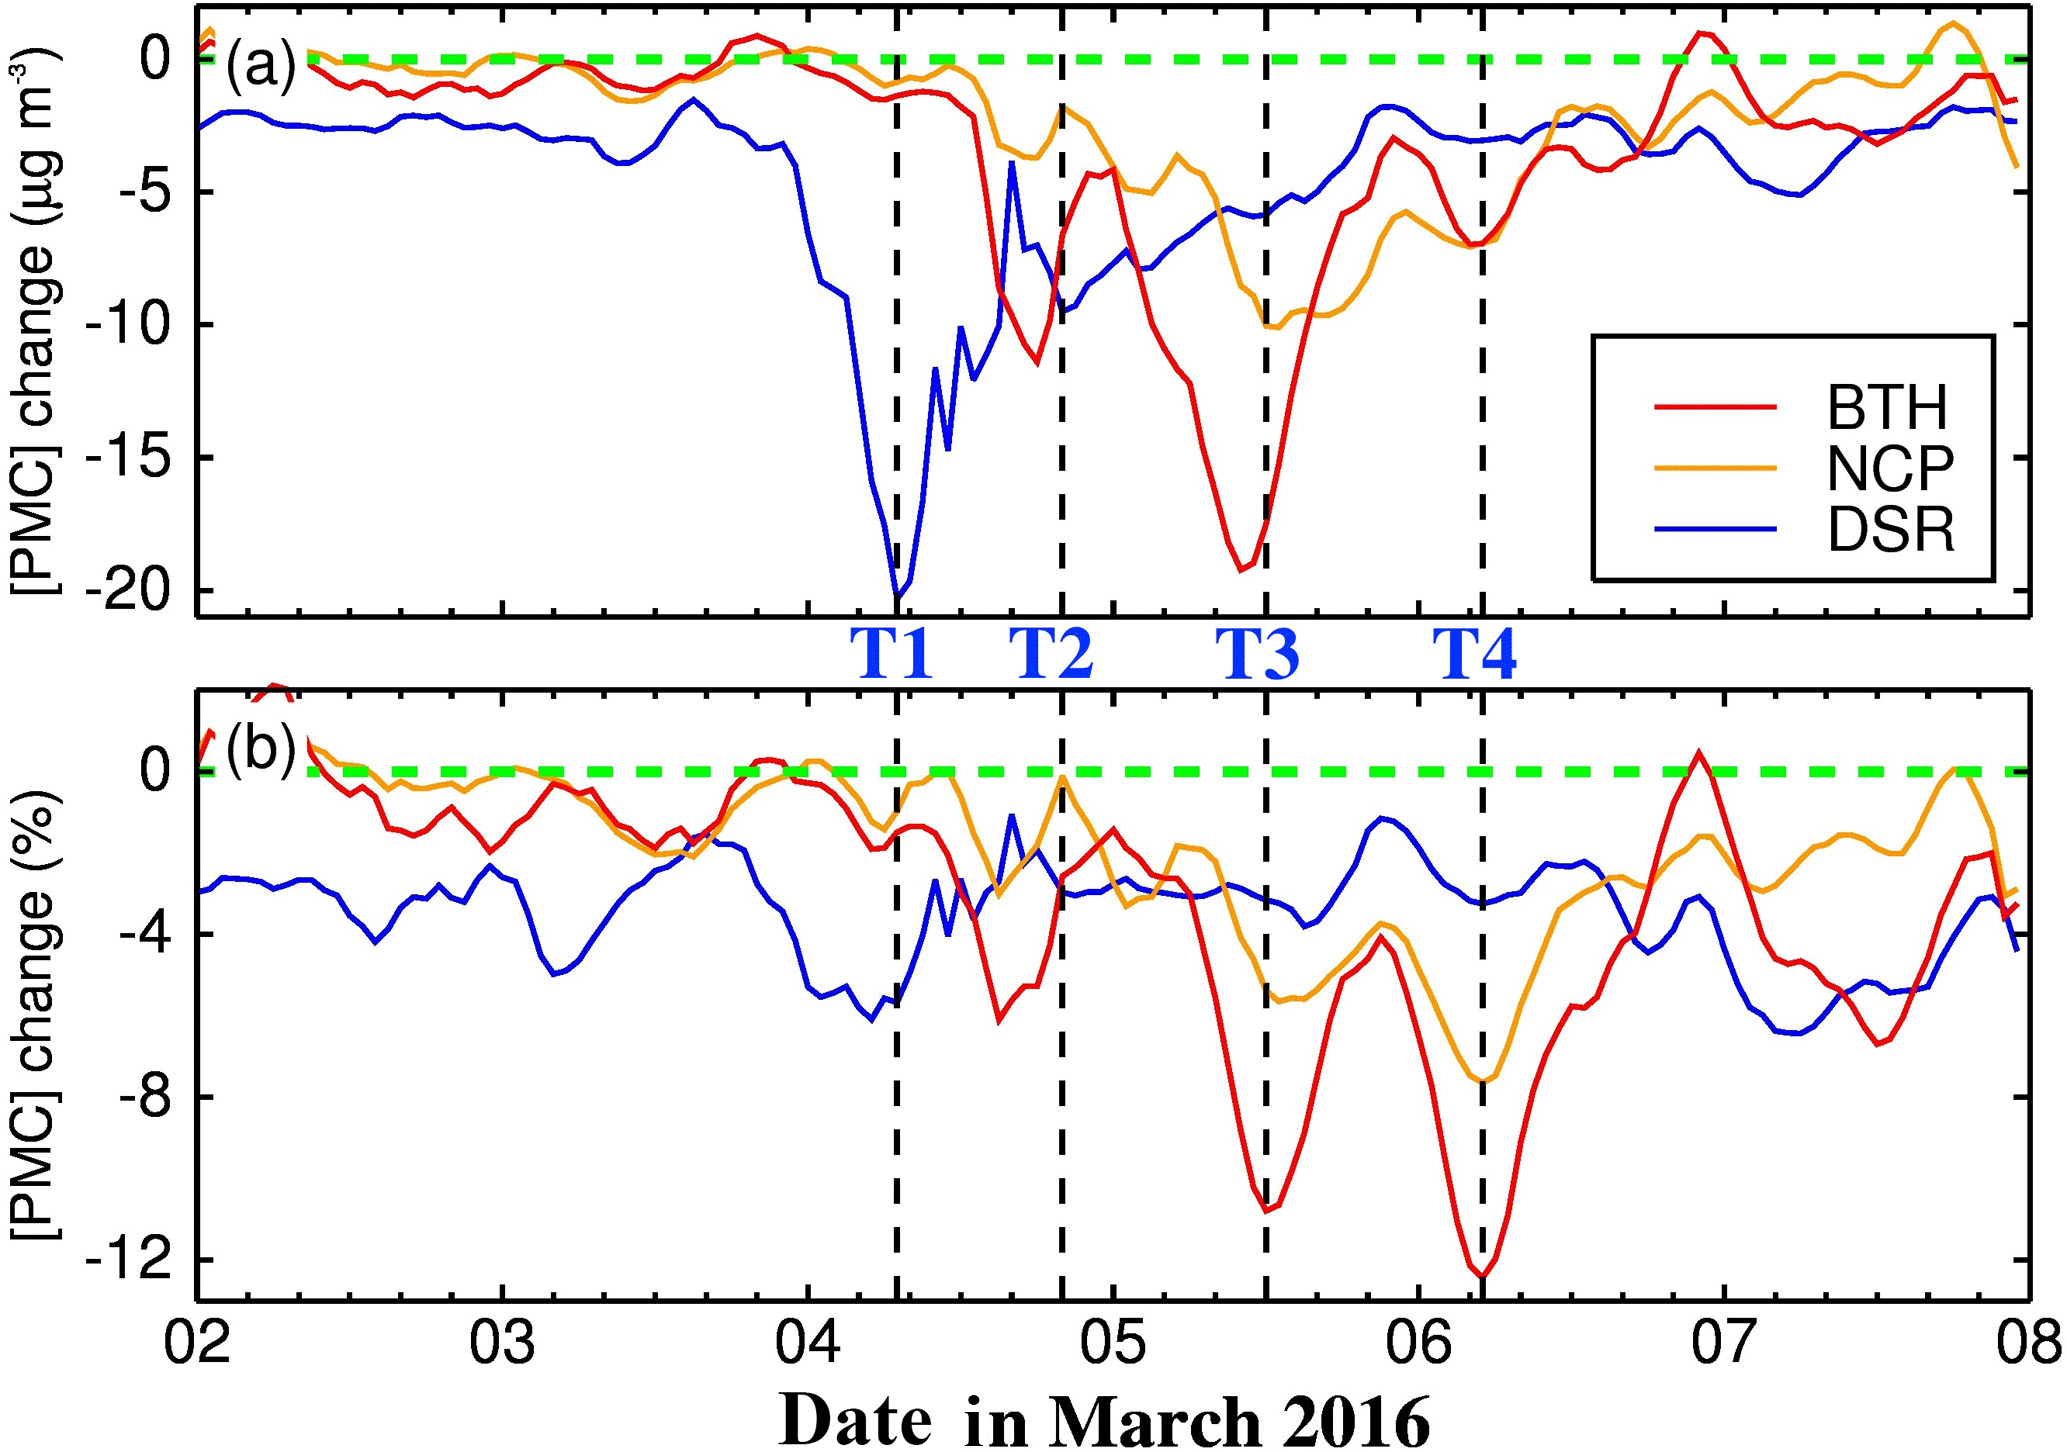
Figure 7The hourly near-surface [PMC] change resulted from the land cover changes induced by ERPs from 2001 to 2013, including the temporal variations in (a) concentration and (b) percentage averaged at monitoring sites in the DSR, the NCP, and BTH (see Fig. 1b, including the provinces of Beijing, Tianjin, and Hebei, the heart of the NCP). The results refer to temporal variations between the REF case and the SEN-ERPs case (REF – SEN-ERPs).
Figure 8 shows the detailed horizontal distributions in the different stages of the episode, such as T1 (07:00, 4 March), T2 (20:00, 4 March), T3 (12:00, 5 March), and T4 (05:00, 6 March). T1 and T2 are at the time points of dust outbreak in the DSR, while the T3 and T4 are at time points of dust particles being transported to NCP. All of the four key time points correspond to peak [PMC] changes (Fig. 7). To capture different dust plume phases, we analyzed the [PMC] change distributions for these time points. At T1, the dust storm started and was limited in the DSR (Fig. 8a). Hence, ERPs caused a prominent [PMC] decrease in the DSR (−20.0 µg m−3), whereas they had a small influence in the NCP (lower than 2.0 µg m−3 both in the NCP and BTH) (Fig. 8a, b). At T2, the dust storm was transported from the DSR to the NCP. As a result, the dust plumes were diluted in the DSR, while they were enhanced in the NCP (Fig. 8c). The [PMC] decrease was considerable in the DSR (−9.5 µg m−3), and there was a significant [PMC] decrease in northern NCP by about −10.0 to −20.0 µg m−3 (Fig. 8d). At T3, the dust storm was transported from the source region to the downwind NCP region (Fig. 8e). The ERPs significantly reduced the dust concentrations in the NCP region (Fig. 8f), causing remarkable [PMC] reduction in BTH (−17.5 µg m−3) and NCP (−10.4 µg m−3) (Fig. 7a). T4 was the time point of the end of the dust episode, and the [PMC] values started to decrease (Fig. 8g).
3.4 Reasons for dust decrease
In order to find the presumed reasons for dust decrease that resulted from ERP-induced land cover changes from 2001 to 2013, three additional sensitivity experiments are conducted and compared to the REF case. One with the entire land cover changes from 2001 to 2013 (see Fig. 2) was adapted into the WRF-DUST model (SEN-2001). Another two experiments are one with the land cover change related to the grass GGW (SEN-GRASS case) and the other related to the forest GGW (SEN-TREE case). In the SEN-GRASS case, the land cover changes only related to the grass GGW are adapted into the WRF-DUST model (Fig. S4). It is the same in the SEN-TREE experiment but for land cover changes only related to the forest GGW (Fig. S5).
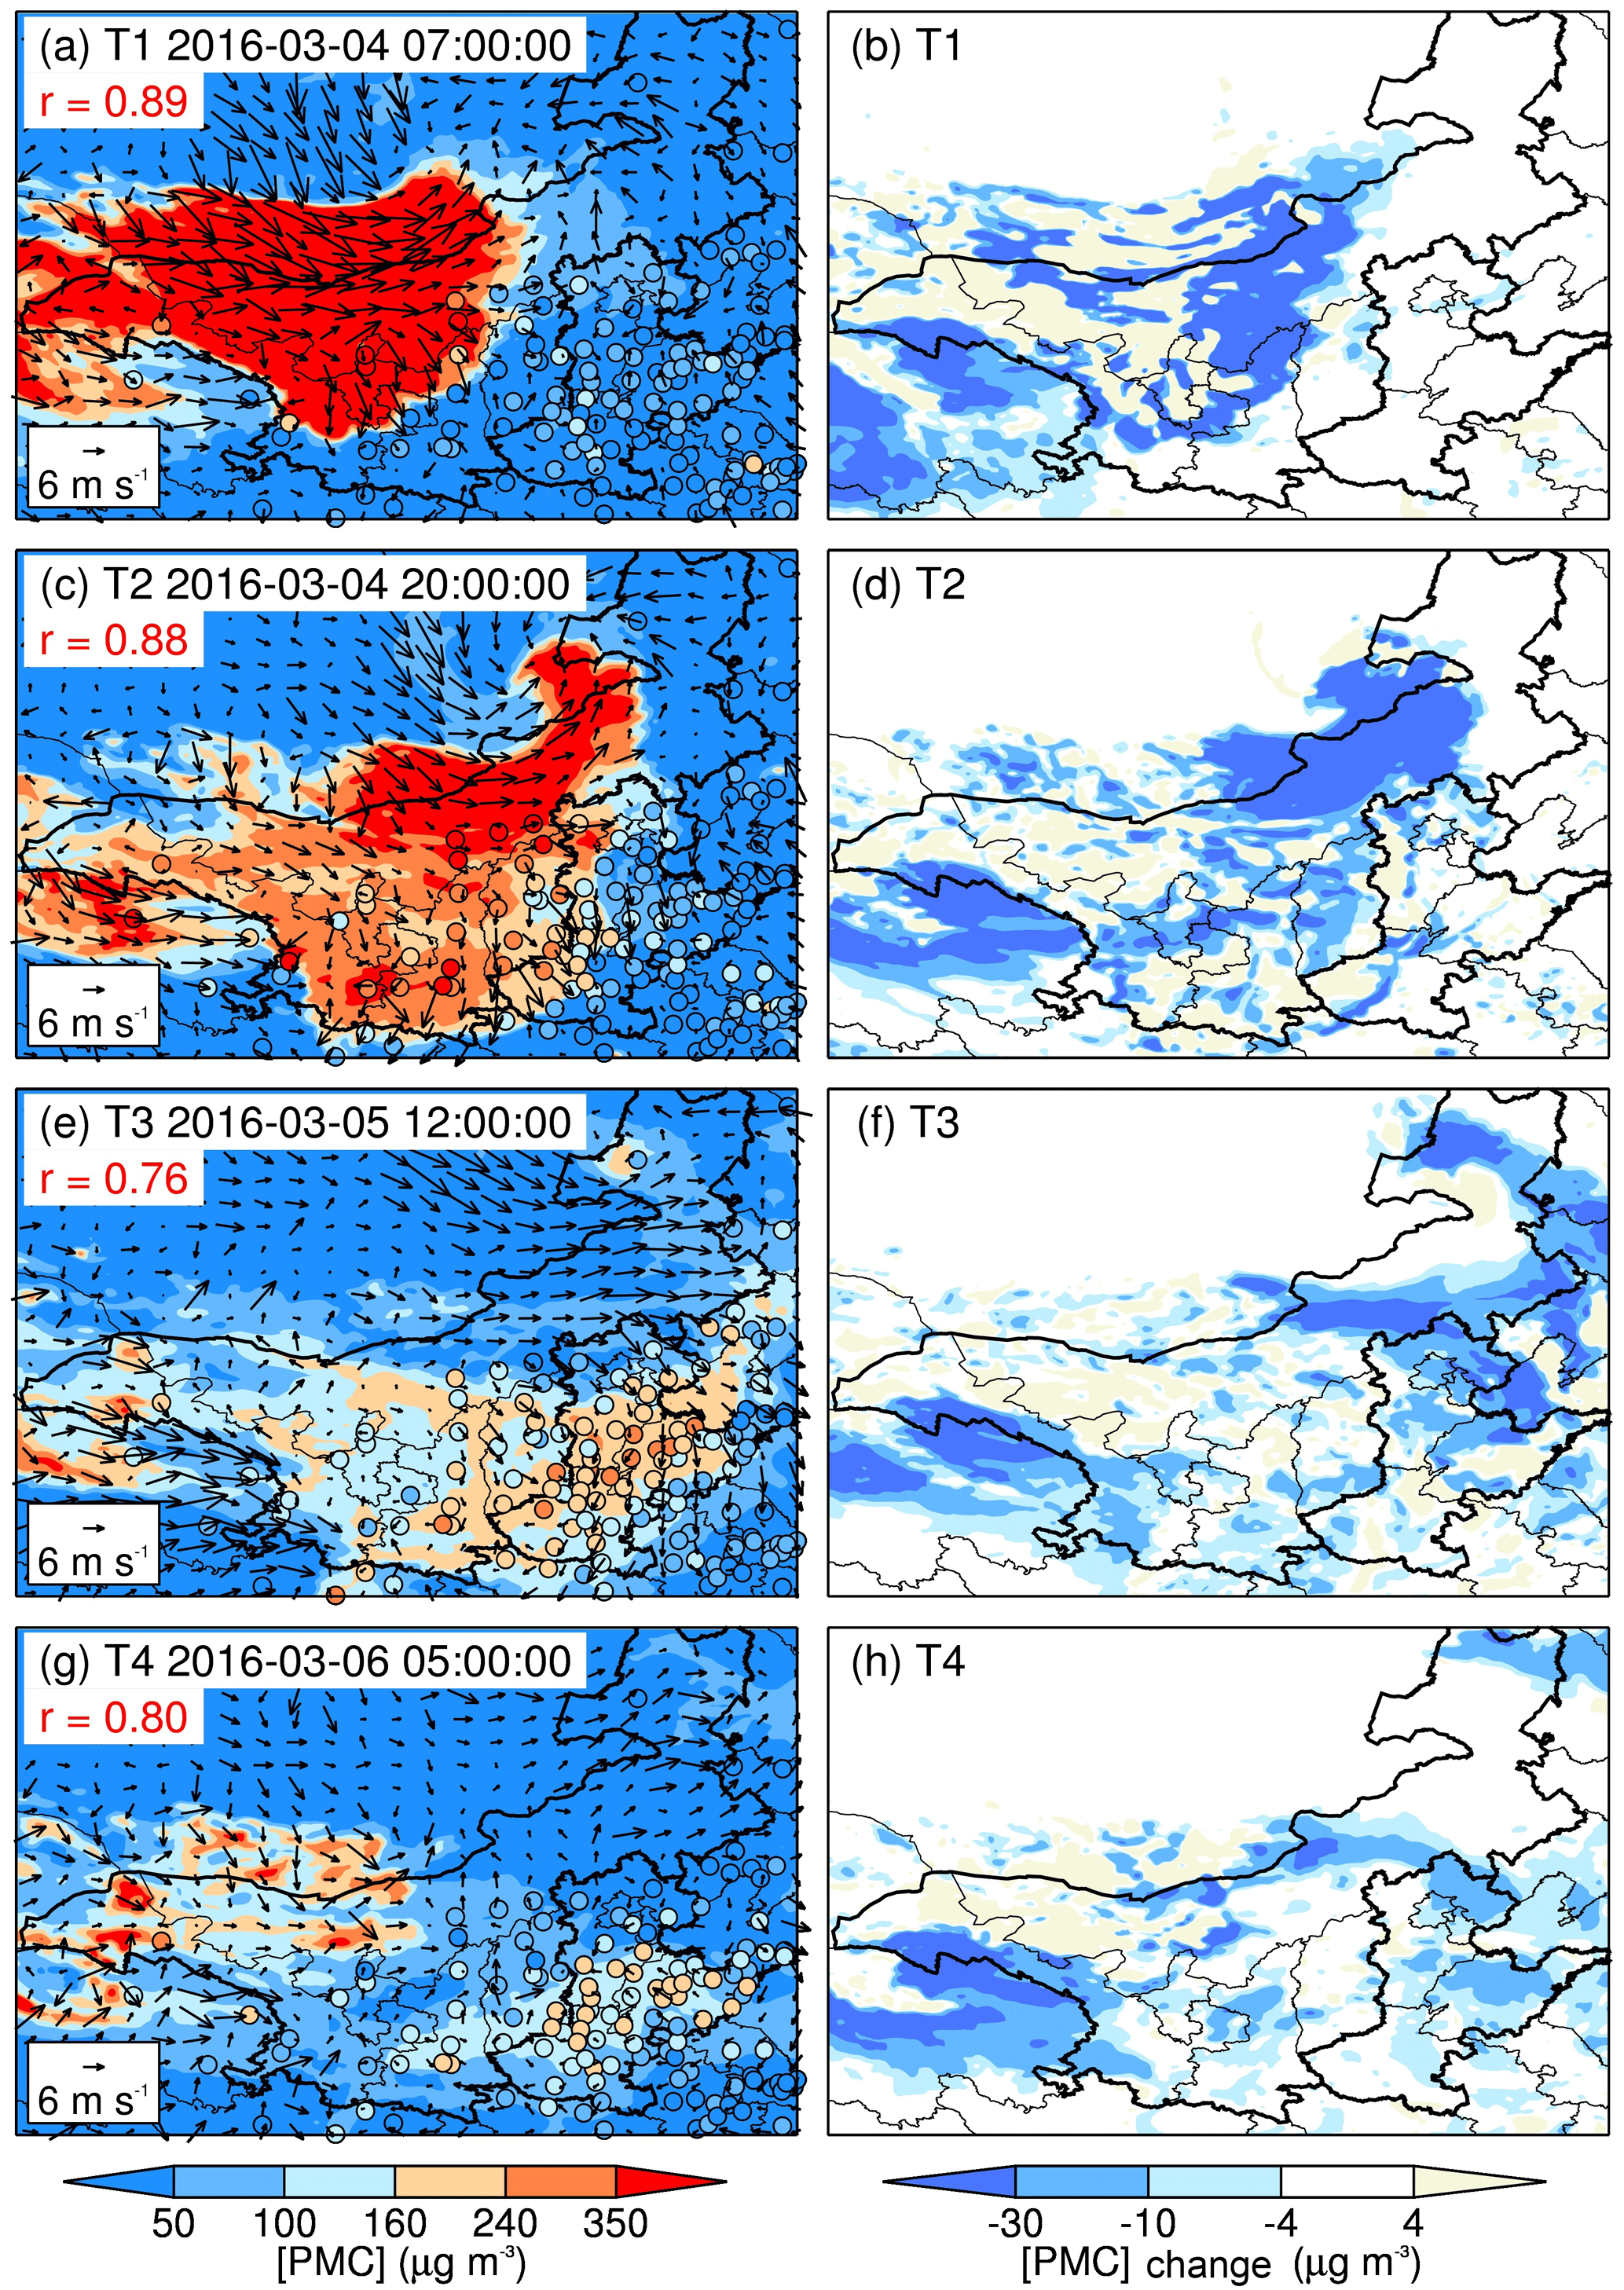
Figure 8The horizontal distributions of surface [PMC] and [PMC] change at key time points of T1, T2, T3, and T4 (see Fig. 7). Panels (a, c, e, g) denote pattern comparisons of simulations vs. observations for the REF case, as well as the correlation coefficient (r), along with the simulated wind field. Panels (b, d, f, h) refer to [PMC] change between the REF case and the SEN-ERPs case (REF – SEN-ERPs).
Table 1The [PMC] change comparison of sensitivity experiments to the REF case. All the [PMC] changes are averaged at monitoring sites in the DSR, the NCP, and BTH.
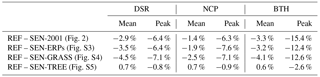
All the sensitivity experiments are compared to the REF case. Table 1 shows the near-surface [PMC] change averaged at monitoring sites in the DSR, the NCP, and BTH. We found that the forest GGW seems nonsignificant in dust concentration control with the [PMC] change within 1 % in the SEN-TREE case. Conversely, the [PMC] changes are remarkable and close to other sensitivity experiments of SEN-ERPs, SEN-2001, and SEN-GRASS, which showed higher [PMC] decrease in the DSR (average −2.9 to −4.5 %), the NCP (average −1.4 to −2.5 %), and BTH (average −3.2 to −4.1 %). Excluding the SEN-TREE case, all the other sensitivity experiments include the grass GGW-related land cover changes.
Figure 9 presents the vertical profiles of daily [PMC] and [PMC] change along the cross section (see dark solid line in Fig. 1) from 2 to 5 March. On 2 March, the dust plumes began to move up to the atmosphere within 4 km height (Fig. 9a), and there were few [PMC] changes both in the DSR and the NCP (Fig. 9b). On 3 March, the dust plumes were strengthened and moved to the upper atmosphere about 4 km height in the DSR (Fig. 9c). Some [PMC] changes occurred in the DSR, but not in the NCP. On 4 March, the dust plumes were further strengthened and moved up to extreme heights in the DSR. The [PMC] was 15–60 µg m−3 in the highest part of the upper atmosphere of 4–6 km. There were strong northwest winds. Due to the strong northwest prevailing winds, the dust plumes started to be transported from the upwind DSR to the downwind NCP. Some dust plumes fall over the NCP, causing the [PMC] increase in the NCP (see Figs. 9e and 5c). Simultaneously, some [PMC] changes occurred in the upper atmosphere of the DSR. As the dust plumes fall down in the NCP, some [PMC] changes occurred in the upper atmosphere of the NCP (Fig. 9f). On 5 March, due to the strong northwest prevailing winds in the previous day, the dust plumes were blown to the upper atmosphere of the NCP, with [PMC] of 15–60 µg m−3 at 4–6 km height. Meanwhile, many dust plumes dropped to the lower atmosphere of the NCP, resulting in a remarkable [PMC] increase in the NCP to 100–250 µg m−3 (see Figs. 9g and 5d). As the dust plumes were transported to the upper atmosphere of the NCP, few [PMC] changes occurred in the upper atmosphere of the DSR, but there was a remarkable [PMC] change in the upper atmosphere of the NCP (Fig. 9h).
There are several important issues shown in the results which should be addressed. (1) There are heavy dust plumes during the episode, and the daily [PMC] can reach a high level in the DSR and the NCP. (2) The dust plumes move up to the upper atmosphere and are transported from the upwind DSR to the downwind NCP in a northwest to southeast direction. (3) The vertical distribution of [PMC] decrease is accompanied by the dust plumes' transport.
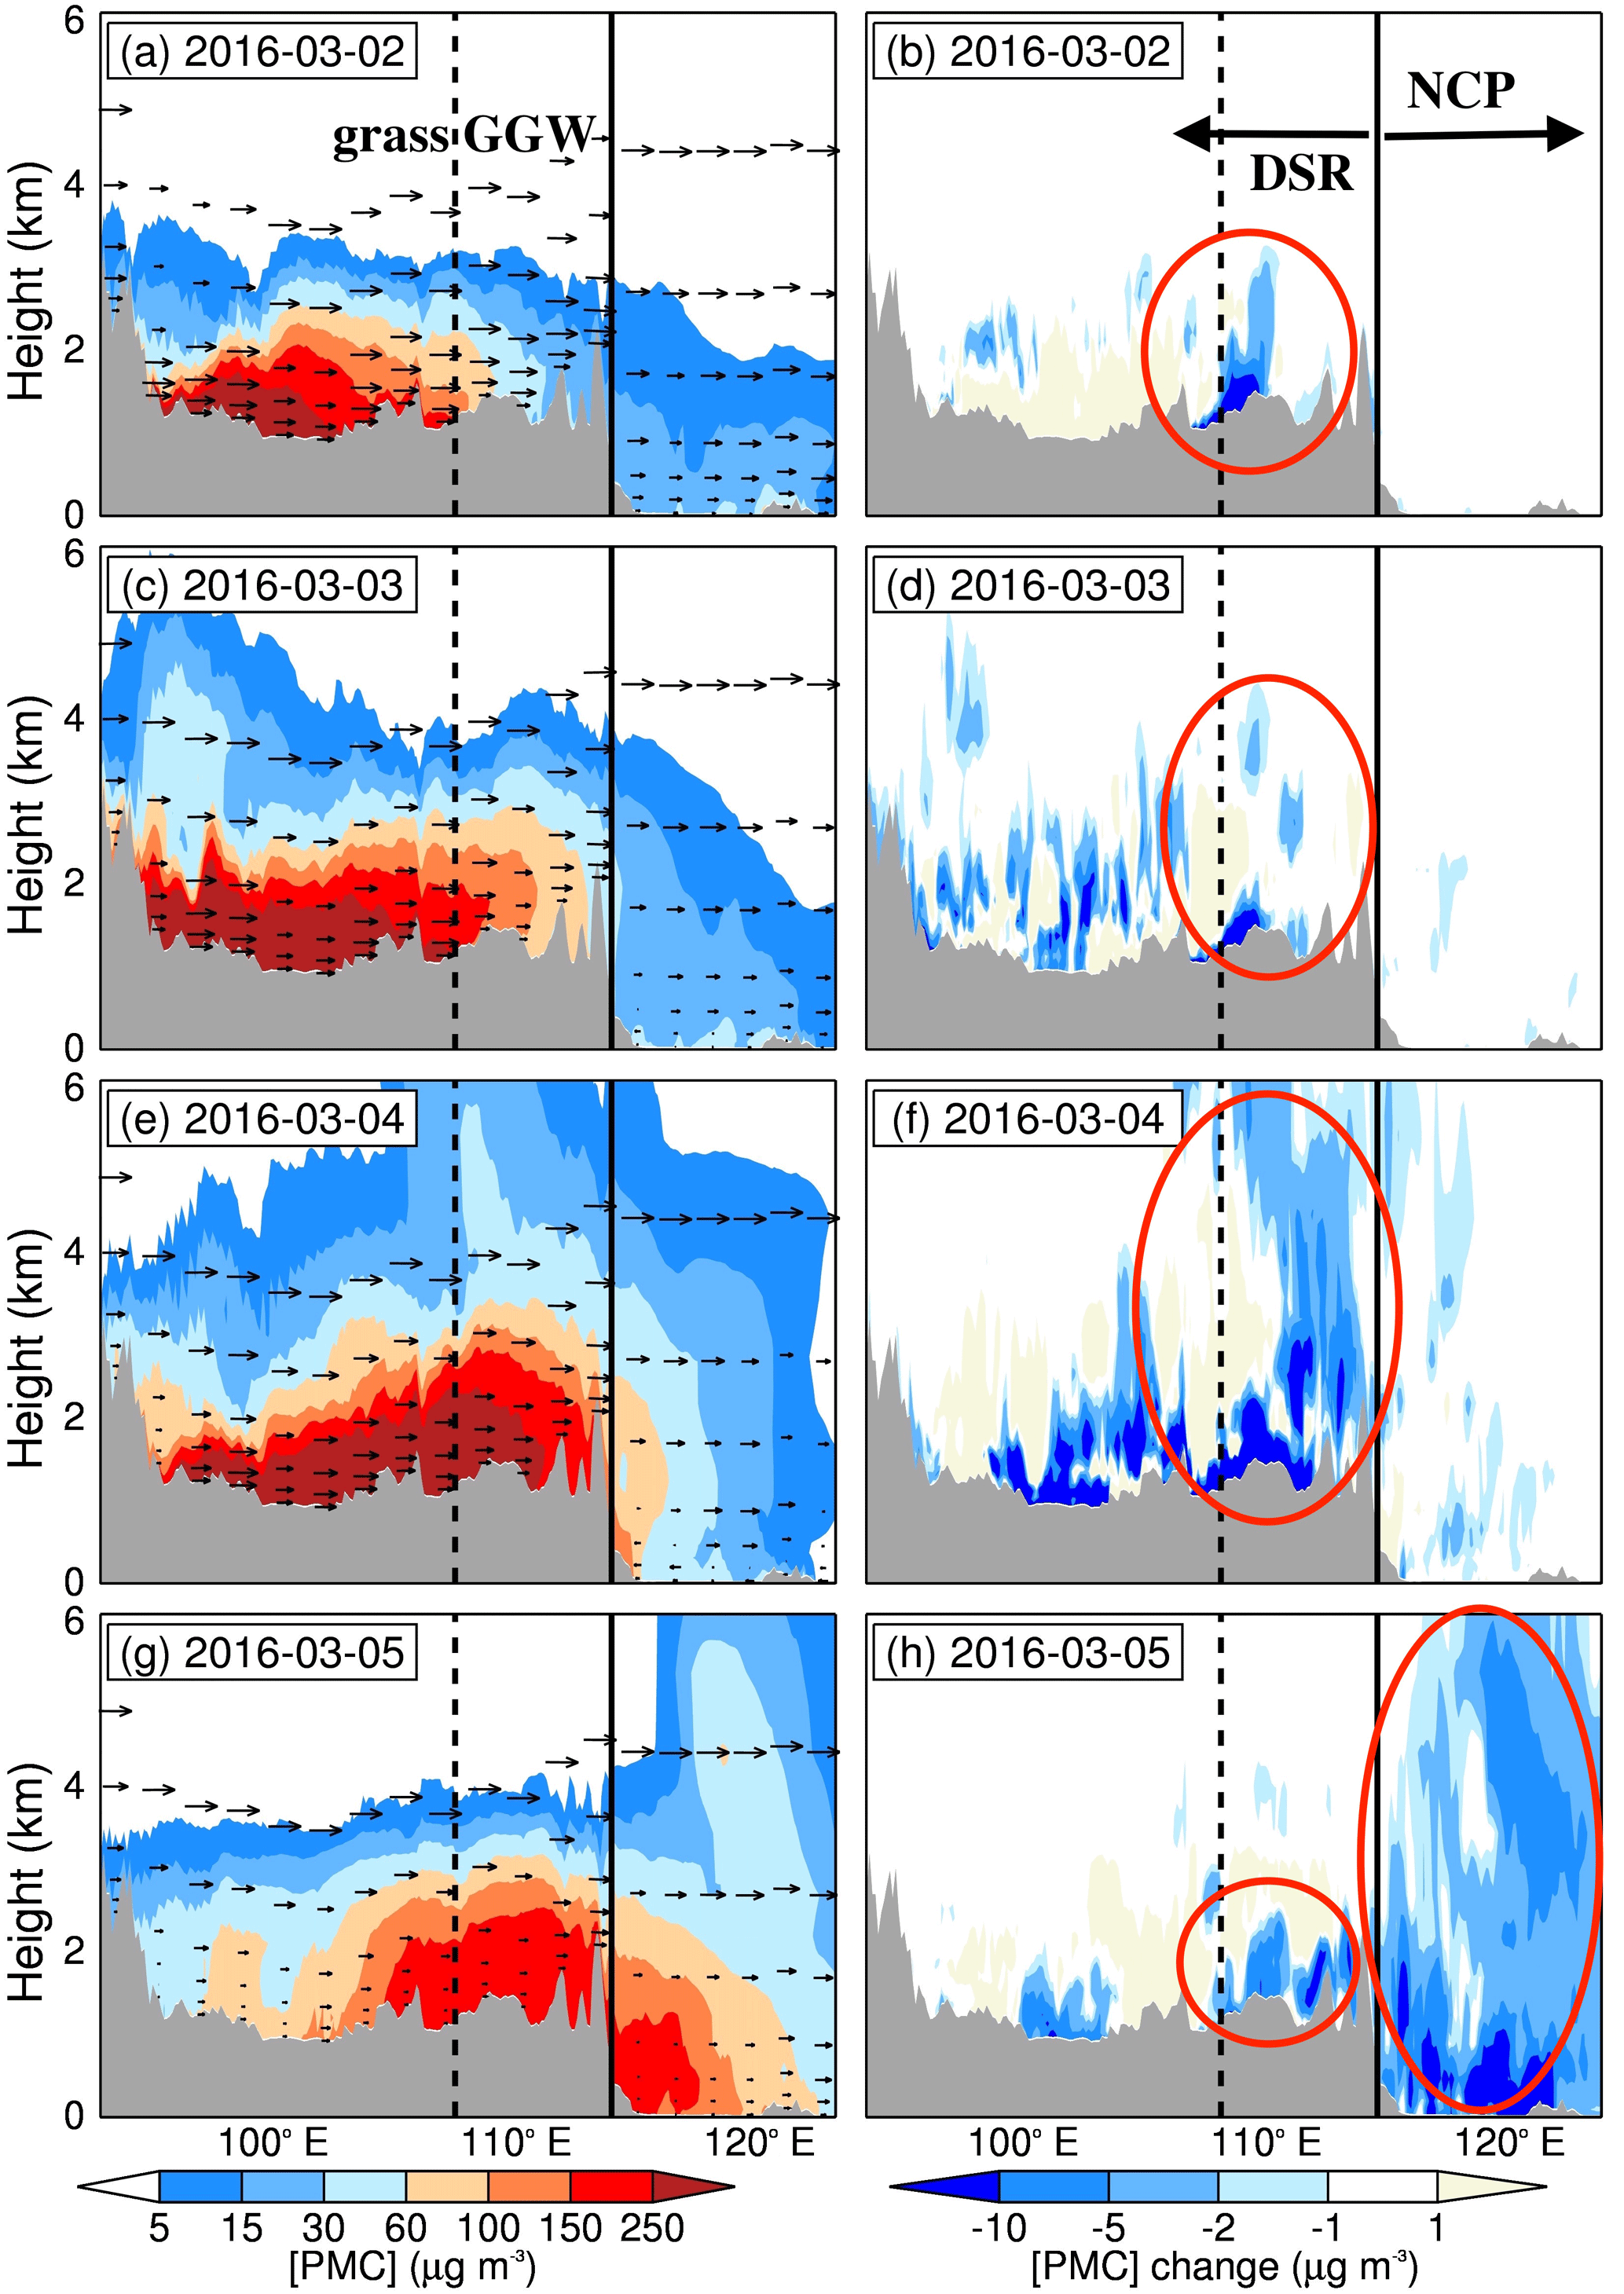
Figure 9Panels (a, c, e, g) show the vertical profiles of daily [PMC] and winds along the cross section (see Fig. 1) for the REF case. Panels (b, d, f, h) show the vertical profiles of daily [PMC] change between the REF case and the SEN-ERPs case (REF – SEN-ERPs). The dark dashed and solid lines denote the X and Y points in Fig. 1b, respectively.
The vertical investigations show that the dust plumes move up and evolve in the upper atmosphere. However, the forest GGW will impact dust load only if dust plumes evolve in the boundary layer because the forest acts as a barrier for dry deposition and not for emission. It is worth noting that the increased forest cover is not related to a decrease of the bare surface (see Figs. 2a and S5), which means that dust was not emitted initially. This is why the forest GGW is nonsignificant in dust concentration control, causing little of the [PMC] decrease (Table 1).
We could also find an obvious hot spot of [PMC] decrease at the crossing points between the cross section and the grass GGW (see X point in Fig. 1b). As the dust plumes move up, transport, and fall, [PMC] decrease also occurred in the downwind upper atmosphere and on the surface (see red circles in Fig. 9b, d, f, h). We find that the ERPs decrease dust erosion, concentrating on the grass GGW (Fig. S6). It is worth noting that the grass GGW is established on the edge of the dust source regions (Fig. S2c), decreasing the bare surface (Fig. 2a) with dust emitting potential and therefore being beneficial to control dust erosion. During the episode, the total PMC emission reduction is 5.9 Gg in the research domain (Fig. 10), illustrating that the grass-GGW-resultant dust erosion control is the dominant reason for [PMC] decrease.
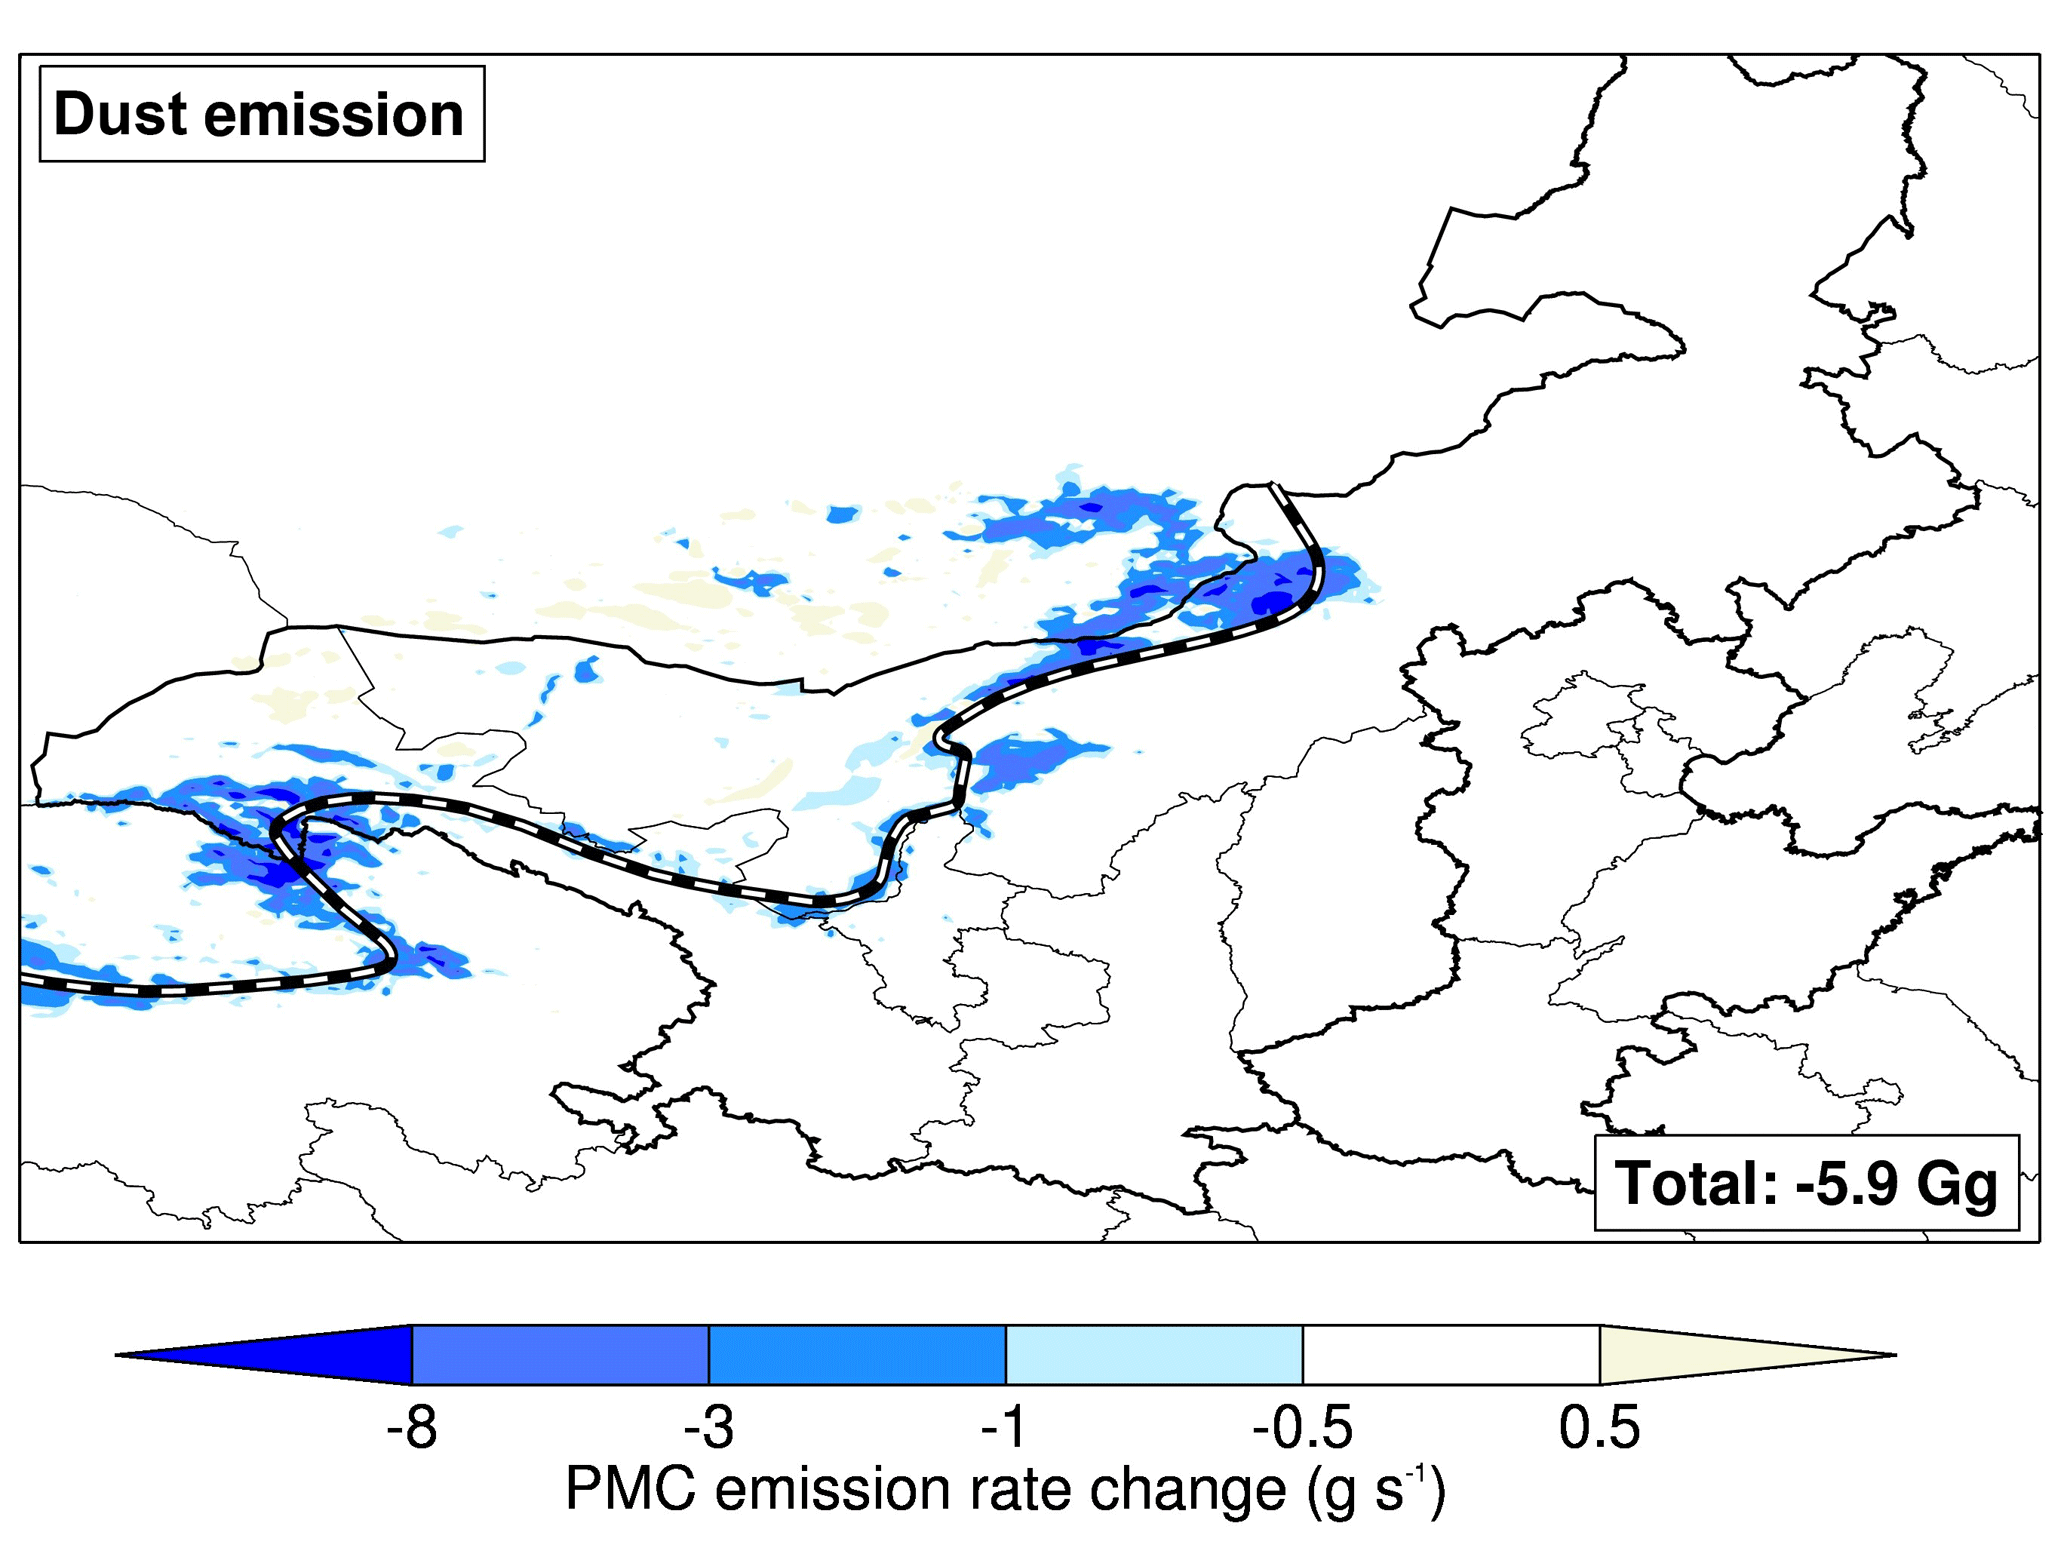
Figure 10The average PMC emission change between REF case and SEN-GRASS case during the episode estimated by WRF-DUST model. The total PMC emission change (Gg) is also shown in the right-down rectangle. The black and white line denotes the location of grass GGW (see Fig. 2b).
Dust particles have significant impacts on human lives in China, especially in springtime. To reduce dust concentrations, such as controlling desertification, sand storms, and soil erosion, the Chinese government has made a great effort in initiating national ecological restoration programs (ERPs) since 1978. Despite the great vegetation increase, the effectiveness of ERPs in controlling dust concentration is not well understood. In the present study, we try to assess the impact of ERPs on the dust concentrations, especially in the downwind populated region (NCP). First, the ERP-induced land cover changes are investigated, using long-term satellite measurements. The MODIS land cover products are adapted into the WRF-DUST model, providing more surface properties, especially for the dust erosion calculation. Second, the WRF-DUST model is applied to evaluate the effects of the ERPs on the dust concentration control in the NCP. The model results have been evaluated by a comparison with surface measurements. And four sensitivity experiments are conducted to explore the role of ERPs in dust decrease. Some important results are summarized as follows.
-
More detailed land surface properties are quantified by calculating a gridded LUF based on long-term satellite measurements. The ERPs resulted in an obvious vegetation increase, seen in the grass GGW and forest GGW which arose in northwestern China. The GGWs are located between the dust source region (DSR) and the densely populated North China Plain (NCP) region. As a result, China has shown impressive progress in implementing some of the world's largest ERPs, which could have important impacts on the control of dust particles during dust storms in eastern China.
-
Despite some model biases, the WRF-DUST model reproduced the temporal and spatial variations of [PMC] reasonably well during the dust storm episode in both the upwind DSR and the downwind NCP, especially for the dust storm outbreak and the transportation toward downwind regions. The correlation coefficient (r) values between simulated and observed [PMC] are 0.95 for the DSR and 0.82 for the NCP, and the NMBs are 4 and −15 %, respectively.
-
The impacts of ERP-induced GGWs on the [PMC] decrease are assessed during a dust storm episode (from 2 to 8 March 2016). The results suggest that ERPs remarkably decrease the dust concentration in the NCP, especially in BTH (the heart of the NCP). During the episode when the dust storm was transported from the upwind DSR to the downwind NCP, the reduction of [PMC] ranges from −5 to −15 % in the NCP, with a maximum reduction of −12.4 % (−19.2 µg m−3) in BTH and −7.6 % (−10.1 µg m−3) in the NCP. It is worth noting here that the statement “ERPs help to reduce some dust concentrations” only denotes the states with or without GGWs, bearing no consistency with the study of Chin et al. (2014), who found that dust stays quite constant over East Asia.
-
During the episode, dust plumes move up and are transported to the upper atmosphere of the NCP. The forest GGW is nonsignificant in dust concentration control because it is benefit for dry deposition and not for emission. The grass GGW is beneficial in controlling dust erosion and is the dominant reason for [PMC] decrease in the NCP.
This study shows that ERPs induced remarkable vegetation increase, especially the grass GGW, which is beneficial in controlling dust erosion and reducing dust concentrations in the NCP, especially in springtime. The air pollution is severe in eastern China, especially in the NCP, and the contribution of the dust episodes is significant, illustrating the considerable benefits of ERPs in controlling air pollution in China. It should be reiterated that, considering the limitations of the case study, the main focus of this study is not intended to give a general conclusion but rather to provide some insights of the effect of ERPs on the land cover change and resultant decrease of dust concentration over downwind areas, where heavy haze often occurs due to anthropogenic air pollutants.
- 1.
The real-time PM2.5 and PM10 are accessible for the public on the website http://106.37.208.233:20035/ (last access: 7 April 2018). One can also access the historic profile of observed ambient pollutants through visiting http://www.aqistudy.cn/ (last access: 7 April 2018).
- 2.
The MODIS Land Cover products (MOD12Q1) are accessible to the public on the website https://lpdaac.usgs.gov/dataset_discovery/modis/modis_products_table.
- 3.
The distributions of the Gobi and other deserts are accessible to the public on the website http://westdc.westgis.ac.cn.
The supplement related to this article is available online at: https://doi.org/10.5194/acp-18-6353-2018-supplement.
The authors declare that they have no conflict of interest.
This article is part of the special issue “Regional transport and transformation of air pollution in eastern China”. It is not associated with a conference.
This work is supported by the National Natural Science Foundation of China
(NSFC) under grant no. 41430424 and 41730108 and the China Postdoctoral
Science Foundation under grant no. 2016M602886. This work is also supported
by the Fundamental Research Funds for the Central Universities. The National
Center for Atmospheric Research is sponsored by the National Science
Foundation.
Edited by: Renyi
Zhang
Reviewed by: two anonymous referees
Banta, R., Senff, C., Nielsen-Gammon, J., Darby, L., Ryerson, T., Alvarez, R., Sandberg, S., Williams, E., and Trainer, M.: A bad air day in Houston, B. Am. Meteorol. Soc., 86, 657–669, 2005.
Bei, N., Li, G., and Molina, L. T.: Uncertainties in SOA simulations due to meteorological uncertainties in Mexico City during MILAGRO-2006 field campaign, Atmos. Chem. Phys., 12, 11295–11308, https://doi.org/10.5194/acp-12-11295-2012, 2012.
Bian, H., Tie, X.-X., Cao, J.-J., Ying, Z. M., Han, S.-Q., and Xue, Y.: Analysis of a severe dust storm event over China: Application of WRF-dust model, Aerosol Air Qual. Res., 11, 419–428, 2011.
Cao, S., Chen, L., Shankman, D., Wang, C., Wang, X., and Zhang, H.: Excessive reliance on afforestation in China's arid and semi-arid regions: Lessons in ecological restoration, Earth-Sci. Rev., 104, 240–245, 2011.
Chen, F. and Dudhia, J.: Coupling an advanced land surface–hydrology model with the Penn State–NCAR MM5 modeling system – Part II: Preliminary model validation, Mon. Weather Rev., 129, 587–604, 2001.
Chin, M., Ginoux, P., Kinne, S., Torres, O., Holben, B. N., Duncan, B. N., Martin, R. V., Logan, J. A., Higurashi, A., and Nakajima, T.: Tropospheric Aerosol Optical Thickness from the GOCART Model and Comparisons with Satellite and Sun Photometer Measurements, J. Atmos. Sci., 59, 461–483, 2002.
Chin, M., Diehl, T., Tan, Q., Prospero, J. M., Kahn, R. A., Remer, L. A., Yu, H., Sayer, A. M., Bian, H., Geogdzhayev, I. V., Holben, B. N., Howell, S. G., Huebert, B. J., Hsu, N. C., Kim, D., Kucsera, T. L., Levy, R. C., Mishchenko, M. I., Pan, X., Quinn, P. K., Schuster, G. L., Streets, D. G., Strode, S. A., Torres, O., and Zhao, X.-P.: Multi-decadal aerosol variations from 1980 to 2009: a perspective from observations and a global model, Atmos. Chem. Phys., 14, 3657–3690, https://doi.org/10.5194/acp-14-3657-2014, 2014.
Chou, M. D. and Suarez, M. J.: A solar radiation parameterization for atmospheric studies, Nasa Tech. Rep., NASA/TM-1999-104606, 15, 38 pp., 1999.
Chou, M. D., Suarez, M. J., Liang, X. Z., Yan, M. H., and Cote, C.: A Thermal Infrared Radiation Parameterization for Atmospheric Studies, NASA/TM-2001-104606, 19, 55 pp., 2001.
Cottle, P., Strawbridge, K., McKendry, I., O'Neill, N., and Saha, A.: A pervasive and persistent Asian dust event over North America during spring 2010: lidar and sunphotometer observations, Atmos. Chem. Phys., 13, 4515–4527, https://doi.org/10.5194/acp-13-4515-2013, 2013.
Deng, L., Yan, W., Zhang, Y., and Shangguan, Z.: Severe depletion of soil moisture following land-use changes for ecological restoration: Evidence from northern China, Forest Ecol. Manage., 366, 1–10, 2016.
Dong, X., Fu, J. S., Huang, K., Tong, D., and Zhuang, G.: Model development of dust emission and heterogeneous chemistry within the Community Multiscale Air Quality modeling system and its application over East Asia, Atmos. Chem. Phys., 16, 8157–8180, https://doi.org/10.5194/acp-16-8157-2016, 2016.
Duan, H., Yan, C., Tsunekawa, A., Song, X., Li, S., and Xie, J.: Assessing vegetation dynamics in the Three-North Shelter Forest region of China using AVHRR NDVI data, Environ. Earth Sci., 64, 1011–1020, 2011.
Evan, A. T., Heidinger, A. K., Bennartz, R., Bennington, V., Mahowald, N. M., Corrada-Bravo, H., Velden, C. S., Myhre, G., and Kossin, J. P.: Ocean temperature forcing by aerosols across the Atlantic tropical cyclone development region, Geochem. Geophy. Geosy., 9, Q05V04, https://doi.org/10.1029/2007GC001774, 2008.
Fan, K., Xie, Z., Wang, H., Xu, Z., and Liu, J.: Frequency of spring dust weather in North China linked to sea ice variability in the Barents Sea, Clim. Dynam., 1–12, https://doi.org/10.1007/s00382-016-3515-7, online first, 2017.
Fang, J., Chen, A., Peng, C., Zhao, S., and Ci, L.: Changes in forest biomass carbon storage in China between 1949 and 1998, Science, 292, 2320–2322, https://doi.org/10.1126/science.1058629, 2001.
Friedl, M. A., McIver, D. K., Hodges, J. C., Zhang, X., Muchoney, D., Strahler, A. H., Woodcock, C. E., Gopal, S., Schneider, A., and Cooper, A.: Global land cover mapping from MODIS: algorithms and early results, Remote Sens. Environ., 83, 287–302, 2002.
Friedl, M. A., Sulla-Menashe, D., Tan, B., Schneider, A., Ramankutty, N., Sibley, A., and Huang, X.: MODIS Collection 5 global land cover: Algorithm refinements and characterization of new datasets, Remote Sens. Environ., 114, 168–182, 2010.
Gerten, D., Schaphoff, S., Haberlandt, U., Lucht, W., and Sitch, S.: Terrestrial vegetation and water balance – hydrological evaluation of a dynamic global vegetation model, J. Hydrol., 286, 249–270, 2004.
Giannadaki, D., Pozzer, A., and Lelieveld, J.: Modeled global effects of airborne desert dust on air quality and premature mortality, Atmos. Chem. Phys., 14, 957–968, https://doi.org/10.5194/acp-14-957-2014, 2014.
Ginoux, P., Chin, M., Tegen, I., Prospero, J. M., Holben, B., Dubovik, O., and Lin, S. J.: Sources and distributions of dust aerosols simulated with the GOCART model, J. Geophy. Res.-Atmos., 106, 20255–20273, 2001.
Ginoux, P., Joseph, P. M., Thomas, G. E., Hsu, C. N., and Zhao, M.: Global scale attribution of anthropogenic and natural dust sources and their emission rates based on MODIS Deep Blue aerosol products, Rev. Geophy., 50, RG3005, https://doi.org/10.1029/2012RG000388, 2012.
Grell, G. A., Peckham, S. E., Schmitz, R., McKeen, S. A., Frost, G., Skamarock, W. C., and Eder, B.: Fully coupled “online” chemistry within the WRF model, Atmos. Environ., 39, 6957–6975, 2005.
Grini, A., Myhre, G., Zender, C. S., and Isaksen, I. S.: Model simulations of dust sources and transport in the global atmosphere: Effects of soil erodibility and wind speed variability, J. Geophys. Res.-Atmos., 110, D02205, https://doi.org/10.1029/2004JD005037, 2005.
Grousset, F. E., Ginoux, P., Bory, A., and Biscaye, P. E.: Case study of a Chinese dust plume reaching the French Alps, Geophys. Res. Lett., 30, 10–11, 2003.
Guenther, A., Karl, T., Harley, P., Wiedinmyer, C., Palmer, P. I., and Geron, C.: Estimates of global terrestrial isoprene emissions using MEGAN (Model of Emissions of Gases and Aerosols from Nature), Atmos. Chem. Phys., 6, 3181–3210, https://doi.org/10.5194/acp-6-3181-2006, 2006.
Haywood, J. M., Allan, R. P., Culverwell, I., Slingo, T., Milton, S., Edwards, J., and Clerbaux, N.: Can desert dust explain the outgoing longwave radiation anomaly over the Sahara during July 2003, J. Geophys. Res.-Atmos., 110, D05105, https://doi.org/10.1029/2004JD005232, 2005.
Ho, K., Lee, S., Chan, C. K., Jimmy, C. Y., Chow, J. C., and Yao, X.: Characterization of chemical species in PM2.5 and PM10 aerosols in Hong Kong, Atmos. Environ., 37, 31–39, 2003.
Janić, Z. I.: Nonsingular Implementation of the Mellor–Yamada Level 2.5 Scheme in the NCEP Meso Model, Ncep Office Note, 436 pp., 2002.
Jiang, G.: It is inappropriate for afforestation in the “Three North” regions, Sci. Decis. Making, 11, 40–42, 2005.
Jickells, T., An, Z., Andersen, K. K., Baker, A., Bergametti, G., Brooks, N., Cao, J., Boyd, P., Duce, R., and Hunter, K.: Global iron connections between desert dust, ocean biogeochemistry, and climate, Science, 308, 67–71, 2005.
Kalnay, E., Kanamitsu, M., Kistler, R., Collins, W., Deaven, D., Gandin, L., Iredell, M., Saha, S., White, G., and Woollen, J.: The NCEP/NCAR 40-Year Reanalysis Project, B. Am. Meteorol Soc., 77, 437–472, 1996.
Kang, C.-H., Kim, W.-H., Ko, H.-J., and Hong, S.-B.: Asian dust effects on total suspended particulate (TSP) compositions at Gosan in Jeju Island, Korea, Atmos. Res., 94, 345–355, 2009.
Lee, E.-H. and Sohn, B.-J.: Recent increasing trend in dust frequency over Mongolia and Inner Mongolia regions and its association with climate and surface condition change, Atmos. Environ., 45, 4611–4616, 2011.
Li, H., Yang, X., Zhao, Y., Wang, M., and Huo, W.: The atmospheric circulation patterns influencing the frequency of spring sand-dust storms in the Tarim Basin, Sci. Cold Arid Reg., 6, 168–173, 2014.
Li, N., Long, X., Tie, X., Cao, J., Huang, R., Zhang, R., Feng, T., Liu, S., and Li, G.: Urban dust in the Guanzhong basin of China, part II: A case study of urban dust pollution using the WRF-Dust model, Sci. Total Environ., 541, 1614–1624, 2016.
Li, X., Wang, H., Zhou, S., Sun, B., and Gao, Z.: Did ecological engineering projects have a significant effect on large-scale vegetation restoration in Beijing-Tianjin Sand Source Region, China? A remote sensing approach, Chinese Geog. Sci., 26, 216–228, 2016.
Lin, Y. L., Farley, R. D., and Orville, H. D.: Bulk Parameterization of the Snow Field in a Cloud Model, J. Appl. Meteorol., 22, 1065–1092, https://doi.org/10.1175/1520-0450(1983)022<1065:BPOTSF>2.0.CO;2, 1983.
Liu, J., Li, S., Ouyang, Z., Tam, C., and Chen, X.: Ecological and socioeconomic effects of China's policies for ecosystem services, P. Natl. Acad. Sci. USA, 105, 9477–9482, 2008.
Lou, S., Liao, H., and Zhu, B.: Impacts of aerosols on surface-layer ozone concentrations in China through heterogeneous reactions and changes in photolysis rates, Atmos. Environ., 85, 123–138, 2014.
Lu, C., Zhao, T., Shi, X., and Cao, S.: Ecological restoration by afforestation may increase groundwater depth and create potentially large ecological and water opportunity costs in arid and semiarid China, J. Clean. Prod., 2016.
Lü, Y., Zhang, L., Feng, X., Zeng, Y., Fu, B., Yao, X., Li, J., and Wu, B.: Recent ecological transitions in China: greening, browning, and influential factors, Sci. Rep., 5, 8732, https://doi.org/10.1038/srep08732, 2015.
Miller, R. L. and Tegen, I.: Climate Response to Soil Dust Aerosols, J. Climate, 11, 3247–3267, 1998.
Park, S. U. and In, H. J.: Parameterization of dust emission for the simulation of the yellow sand (Asian dust) event observed in March 2002 in Korea, J. Geophys. Res.-Atmos., 108, 4618, https://doi.org/10.1029/2003JD003484, 2003.
Parungo, F., Li, Z., Li, X., Yang, D., and Harris, J.: Gobi dust storms and the Great Green Wall, Geophys. Res. Lett., 21, 999–1002, 2013.
Peng, S., Chen, A., Xu, L., Cao, C., Fang, J., Myneni, R. B., Pinzon, J. E., Tucker, C. J., and Piao, S.: Recent change of vegetation growth trend in China, Environ. Res. Lett., 6, 044027, https://doi.org/10.1088/1748-9326/6/4/044027, 2011.
Piao, S., Fang, J., Zhou, L., Guo, Q., Henderson, M., Ji, W., Li, Y., and Tao, S.: Interannual variations of monthly and seasonal normalized difference vegetation index (NDVI) in China from 1982 to 1999, J. Geophys. Res.-Atmos., 108, 4401, https://doi.org/10.1029/2002JD002848, 2003.
Qian, W., Quan, L., and Shi, S.: Variations of the dust storm in China and its climatic control, J. Climate, 15, 1216–1229, 2002.
Reichstein, M., Ciais, P., Papale, D., Valentini, R., Running, S., Viovy, N., Cramer, W., Granier, A., Ogee, J., and Allard, V.: Reduction of ecosystem productivity and respiration during the European summer 2003 climate anomaly: a joint flux tower, remote sensing and modelling analysis, Glob. Change Biol., 13, 634–651, 2007.
Rosenfeld, D., Rudich, Y., and Lahav, R.: Desert dust suppressing precipitation: A possible desertification feedback loop, P. Natl. Acad. Sci. USA, 98, 5975–5980, 2001.
Shen, Z., Cao, J., Liu, S., Zhu, C., Wang, X., Zhang, T., Xu, H., and Hu, T.: Chemical composition of PM10 and PM2.5 collected at ground level and 100 meters during a strong winter-time pollution episode in Xi'an, China, J. Air Waste Manage., 61, 1150–1159, 2011.
Silva, L. C. R. and Anand, M.: Probing for the influence of atmospheric CO2 and climate change on forest ecosystems across biomes, Global Ecol. Biogeogr., 22, 83–92, 2013.
Sun, Y., Zhuang, G., Wang, Y., Zhao, X., Li, J., Wang, Z., and An, Z.: Chemical composition of dust storms in Beijing and implications for the mixing of mineral aerosol with pollution aerosol on the pathway, J. Geophys. Res.-Atmos., 110, D24209, https://doi.org/10.1029/2005JD006054, 2005.
Su, X. L., Wang, Q., Li, Z. Q., Calvello, M., Esposito, F., Pavese, G., Lin, M. J., Cao, J. J., Zhou, C. Y., Li, D. H., and Xu, H.: Regional transport of anthropogenic pollution and dust aerosols in spring to Tianjin – A coastal megacity in China, Sci. Total Environ., 584, 381–392, https://doi.org/10.1016/j.scitotenv.2017.01.016, 2017.
Tan, M. and Li, X.: Does the Green Great Wall effectively decrease dust storm intensity in China? A study based on NOAA NDVI and weather station data, Land Use Policy, 43, 42–47, 2015.
Tegen, I., Werner, M., Harrison, S. P., and Kohfeld, K. E.: Relative importance of climate and land use in determining present and future global soil dust emission, Geophys. Res. Lett., 31, 325–341, 2004.
Turner, B. L., Lambin, E. F., and Reenberg, A.: The emergence of land change science for global environmental change and sustainability, P. Natl. Acad. Sci. USA, 104, 20666–20671, 2007.
Wang, G., Innes, J. L., Lei, J., Dai, S., and Wu, S. W.: China's forestry reforms, Science, 318, 1556–1557, 2007.
Wang, J., Ge, C., Yang, Z., Hyer, E. J., Reid, J. S., Chew, B.-N., Mahmud, M., Zhang, Y., and Zhang, M.: Mesoscale modeling of smoke transport over the Southeast Asian Maritime Continent: Interplay of sea breeze, trade wind, typhoon, and topography, Atmos. Res., 122, 486–503, 2013.
Wang, Q., Zhuang, G., Li, J., Huang, K., Zhang, R., Jiang, Y., Lin, Y., and Fu, J. S.: Mixing of dust with pollution on the transport path of Asian dust – Revealed from the aerosol over Yulin, the north edge of Loess Plateau, Sci. Total Environ., 409, 573–581, 2011.
Wang, R., Liu, B., Li, H., Zou, X., Wang, J., Liu, W., Cheng, H., Kang, L., and Zhang, C.: Variation of strong dust storm events in Northern China during 1978–2007, Atmos. Res., 183, 166–172, 2017.
Wang, X., Zhang, C., Hasi, E., and Dong, Z.: Has the Three Norths Forest Shelterbelt Program solved the desertification and dust storm problems in arid and semiarid China?, J. Arid Environ., 74, 13–22, 2010.
Wang, X., Hua, T., Zhang, C., Lang, L., and Wang, H.: Aeolian salts in Gobi deserts of the western region of Inner Mongolia: Gone with the dust aerosols, Atmos. Res., 118, 1–9, 2012.
Watanabe, M., Kurai, J., Tomita, K., Sano, H., Abe, S., Saito, R., Minato, S., Igishi, T., Burioka, N., and Sako, T.: Effects on asthma and induction of interleukin-8 caused by Asian dust particles collected in western Japan, J. Asthma, 51, 595–602, 2014.
Wu, W., Shibasaki, R., Ongaro, L., Ongaro, L., Zhou, Q., and Tang, H.: Validation and comparison of 1 km global land cover products in China, Int. J. Remote Sens., 29, 3769–3785, 2008.
Yin, R. and Yin, G.: China's primary programs of terrestrial ecosystem restoration: initiation, implementation, and challenges, Environ. Manage., 45, 429–441, 2010.
Yoon, J. E., Kim, K., Macdonald, A. M., Park, K. T., Kim, H. C., Yoo, K. C., Yoon, H. I., Yang, E. J., Jung, J., and Lim, J. H.: Spatial and temporal variabilities of spring Asian dust events and their impacts on chlorophylla concentrations in the western North Pacific Ocean, Geophys. Res. Lett., 44, 1474–1482, 2017.
Zhang, Q., Streets, D. G., Carmichael, G. R., He, K. B., Huo, H., Kannari, A., Klimont, Z., Park, I. S., Reddy, S., Fu, J. S., Chen, D., Duan, L., Lei, Y., Wang, L. T., and Yao, Z. L.: Asian emissions in 2006 for the NASA INTEX-B mission, Atmos. Chem. Phys., 9, 5131–5153, https://doi.org/10.5194/acp-9-5131-2009, 2009.
Zhang, W., Hu, G., Dang, Y., Weindorf, D. C., and Sheng, J.: Afforestation and the impacts on soil and water conservation at decadal and regional scales in Northwest China, J. Arid Environ., 130, 98–104, 2016.
Zhao, B., Wang, S., Dong, X., Wang, J., Duan, L., Fu, X., Hao, J., and Fu, J.: Environmental effects of the recent emission changes in China: implications for particulate matter pollution and soil acidification, Environ. Res. Lett., 8, 024031, https://doi.org/10.1088/1748-9326/8/2/024031, 2013.
Zhou, L., Wang, W., Ge, M., and Tong, S.: Heterogeneous uptake of gaseous hydrogen peroxide on mineral dust, J. Environ. Sci., 40, 44–50, 2016.