the Creative Commons Attribution 4.0 License.
the Creative Commons Attribution 4.0 License.
 | 17 Jan 2018
Secondary organic aerosol formation from ambient air in an oxidation flow reactor in central Amazonia
Brett B. Palm
Suzane S. de Sá
Douglas A. Day
Pedro Campuzano-Jost
Weiwei Hu
Roger Seco
Steven J. Sjostedt
Jeong-Hoo Park
Alex B. Guenther
Saewung Kim
Joel Brito
Florian Wurm
Paulo Artaxo
Ryan Thalman
Jian Wang
Lindsay D. Yee
Rebecca Wernis
Gabriel Isaacman-VanWertz
Allen H. Goldstein
Yingjun Liu
Stephen R. Springston
Rodrigo Souza
Matt K. Newburn
M. Lizabeth Alexander
Scot T. Martin
Jose L. Jimenez
Secondary organic aerosol (SOA) formation from ambient air was studied using an oxidation flow reactor (OFR) coupled to an aerosol mass spectrometer (AMS) during both the wet and dry seasons at the Observations and Modeling of the Green Ocean Amazon (GoAmazon2014/5) field campaign. Measurements were made at two sites downwind of the city of Manaus, Brazil. Ambient air was oxidized in the OFR using variable concentrations of either OH or O3, over ranges from hours to days (O3) or weeks (OH) of equivalent atmospheric aging. The amount of SOA formed in the OFR ranged from 0 to as much as 10 µg m−3, depending on the amount of SOA precursor gases in ambient air. Typically, more SOA was formed during nighttime than daytime, and more from OH than from O3 oxidation. SOA yields of individual organic precursors under OFR conditions were measured by standard addition into ambient air and were confirmed to be consistent with published environmental chamber-derived SOA yields. Positive matrix factorization of organic aerosol (OA) after OH oxidation showed formation of typical oxidized OA factors and a loss of primary OA factors as OH aging increased. After OH oxidation in the OFR, the hygroscopicity of the OA increased with increasing elemental O:C up to O:C∼1.0, and then decreased as O:C increased further. Possible reasons for this decrease are discussed. The measured SOA formation was compared to the amount predicted from the concentrations of measured ambient SOA precursors and their SOA yields. While measured ambient precursors were sufficient to explain the amount of SOA formed from O3, they could only explain 10–50 % of the SOA formed from OH. This is consistent with previous OFR studies, which showed that typically unmeasured semivolatile and intermediate volatility gases (that tend to lack C=C bonds) are present in ambient air and can explain such additional SOA formation. To investigate the sources of the unmeasured SOA-forming gases during this campaign, multilinear regression analysis was performed between measured SOA formation and the concentration of gas-phase tracers representing different precursor sources. The majority of SOA-forming gases present during both seasons were of biogenic origin. Urban sources also contributed substantially in both seasons, while biomass burning sources were more important during the dry season. This study enables a better understanding of SOA formation in environments with diverse emission sources.
- Article
(9523 KB) - Full-text XML
-
Supplement
(3024 KB) - BibTeX
- EndNote


Atmospheric submicron aerosols have impacts on radiative climate forcing, air quality, and human health (Pope and Dockery, 2006; IPCC, 2013). Organic aerosol (OA), in particular secondary OA (SOA) formed through various gas-to-particle processes, comprises the majority of ambient submicron particulate mass (Zhang et al., 2007; Jimenez et al., 2009). SOA can be produced from gases emitted from biogenic, urban, and biomass burning sources, upon oxidation by OH, O3, and NO3 (Ziemann and Atkinson, 2012). In order to mitigate aerosol impacts, the sources, formation, properties, and loss processes of SOA need to be understood, and their uncertainties addressed.
These uncertainties are due in part to limitations in our ability to speciate and quantify the majority of organic compounds in the atmosphere (Goldstein and Galbally, 2007). These organic compounds range over greater than 10 orders of magnitude in volatility, a property which is vital in determining a compound's phase state, lifetime, and fate in the atmosphere (e.g., Donahue et al., 2013). The most volatile organics are called volatile organic compounds (VOCs) and are found almost exclusively in the gas phase, while the lowest volatility compounds (e.g., extremely low-volatility compounds (ELVOCs), Ehn et al., 2014) are found almost entirely in the particle phase as OA. Under most conditions, VOCs and OA are generally easier to quantify and speciate. The compounds with volatilities between VOCs and OA (i.e., with saturation vapor concentrations from approximately 1 to 106µg m−3) include semivolatile and intermediate volatility organic compounds (SVOCs and IVOCs, or S/IVOCs; Robinson et al., 2007), which are more difficult to quantify and speciate. There have been recent attempts to quantify bulk S/IVOCs (Cross et al., 2013; Hunter et al., 2017), to speciate subsets of S/IVOCs (e.g., Zhao et al., 2014; Chan et al., 2016), and to model SOA formation from anthropogenic S/IVOCs from urban or aircraft emissions (Robinson et al., 2007; Dzepina et al., 2009; Hodzic et al., 2010; Jathar et al., 2011; Miracolo et al., 2011; Woody et al., 2015). The importance of biogenic S/IVOCs for SOA formation in ambient air was also recently demonstrated for the first time (Palm et al., 2016, 2017). However, much remains to be learned about these compounds in order to adequately understand SOA formation on local, regional, and global scales.
Modeling of OA remains extremely uncertain due to uncertainties in these underlying processes (Tsigaridis et al., 2014). SOA parameterizations in atmospheric models have been developed by measuring SOA yields after the oxidation of VOC precursors in large environmental chambers. However, the interpretation and quantification of chamber experiments can be impaired as the result of substantial losses of S/IVOC gases (Matsunaga and Ziemann, 2010; Zhang et al., 2014; Krechmer et al., 2015; La et al., 2016; Nah et al., 2016) and particles (Crump and Seinfeld, 1981; McMurry and Rader, 1985; Pierce et al., 2008) to the chamber walls. Due to the frequently poor performance of SOA models for field studies (e.g., Tsigaridis et al., 2014), it is of high interest to study SOA formation from ambient air.
Recently, a method of studying SOA formation, namely using oxidation flow reactors (OFRs), has been developed. OFRs are relatively small (on the order of 10 L volume) vessels that employ high oxidant concentrations (OH, O3, or NO3) with a short residence time of several minutes (Kang et al., 2007; Lambe et al., 2011a). This technique can achieve anywhere between hours and months of equivalent atmospheric oxidation in an experimental setup that is small and portable. This is in contrast to large Teflon™ chambers, which are challenging to use for aging ambient air due to their size and complexity as well as low time resolution (∼ 1 experiment per day). Consequently, such large chambers have been restricted mainly to the aging of exhaust from various emission sources (Presto et al., 2011; Platt et al., 2013). To the best of our knowledge, only one study has used a large chamber to process ambient air for aerosol aging research (Peng et al., 2016a), with no published results on SOA formation from ambient air. In OFRs, ambient air is directly sampled and oxidized in near-real time, allowing rapid tracking of changes in ambient SOA precursor gases.
OFRs have recently been used to study SOA formation from ambient air in several locations. Oxidation of ambient forest air dominated by biogenic emissions (Palm et al., 2016) and urban air dominated by urban emissions (Ortega et al., 2016) has shown that ambient S/IVOCs are likely important precursors for ambient SOA formation from OH oxidation, but not for O3 or NO3 oxidation (Palm et al., 2017). In contrast to those locations, the atmosphere in the Central Amazon forest (downwind of Manaus) is influenced by mixed biogenic, urban, and biomass burning sources of SOA precursor gases (Martin et al., 2010; Kourtchev et al., 2016), providing a unique opportunity to study the influence of anthropogenic activities on the atmosphere.
In this work, we use an OFR to investigate SOA formation from the oxidation of ambient air at a tropical rainforest site with varying degrees of urban and biomass burning influence during the Observations and Modeling of the Green Ocean Amazon (GoAmazon2014/5) field campaign. Ambient air was oxidized by either OH or O3, and the subsequent SOA formation was used to investigate the types, amounts, and diurnal/seasonal changes in the relative contributions of precursor gases to the SOA formation potential of ambient air. SOA yields in the OFR under standard OFR experimental conditions were investigated by injecting and oxidizing known amounts of individual precursor gases in ambient air in the OFR. These results are discussed in the context of improving our understanding of atmospheric SOA formation and sources.
2.1 GoAmazon2014/5 field campaign
The GoAmazon2014/5 field campaign took place near the city of Manaus in the state of Amazonas, Brazil, during 2014 and 2015 (Martin et al., 2016, 2017). The majority of the measurements presented in this work were conducted at the “T3” supersite, located approximately 70 km west (downwind) of Manaus, a city of 2 million people. The site was located in a large clearing (2.5 km by 2 km) and surrounded by rainforest, 10 km northeast of the town of Manacapuru. These measurements were taken during the two intensive operating periods, referred to as IOP1 (1 February–31 March 2014) and IOP2 (15 August–15 October 2014). IOP1 took place during the wet season, while IOP2 was during the dry season. Measurements were also conducted at the “T2” site, located approximately 10 km west (downwind) of Manaus on the opposite bank of the Rio Negro, between 30 March and 9 May 2014 (wet season) and between 3 August and 2 September 2014 (dry season). Prevailing wind direction is illustrated by back trajectories shown in Fig. 3 of Martin et al. (2016). At the T3 site, the wet season was characterized by a total of 705 mm of rainfall, a daily average temperature of 26 ∘C, and daily average relative humidity (RH) of 92 %. The dry season at the T3 site was characterized by a total of 243 mm of rainfall and averages of 27 ∘C and 87 % RH. Further details about the GoAmazon2014/5 field campaign can be found in Martin et al. (2016, 2017). Separate studies focusing on ambient aerosol measurements, which are also relevant to this work, are presented in de Sá et al. (2017a, b).
2.2 Oxidation flow reactor
The specific OFR used in this work was a Potential Aerosol Mass (PAM) reactor (Kang et al., 2007; Lambe et al., 2011a). The PAM reactor is a cylindrical aluminum tube with a volume of approximately 13 L. Ambient air was sampled through an approximately 2 cm diameter hole in the inlet plate on one end of the OFR, followed immediately by passing it through a coarse mesh grid (1.2 mm spacing) that was coated by an inert silicon coating (Sulfinert by SilcoTek, Bellefonte, PA) in order to minimize gas and particle losses. The avoidance of any inlet ahead of the OFR in this work was due to previous observations that showed a substantial decrease of SOA formation when using any inlets (Ortega et al., 2013). The model of Pagonis et al. (2017) allows a direct estimation of this effect for the first time. A case study using this model estimated that of the SOA potential would have been lost should a typical inlet have been used at the forested site of Palm et al. (2016) (Fig. S17 in the Supplement). It is highly recommended that future studies also avoid the use of inlets ahead of an OFR, except when only very volatile precursors are used. Two identical OFRs were located at a height of approximately 4 m above the ground on the roof of a trailer where the instrumentation was located (see Fig. S1). The OFRs were operated at ambient RH and temperature, with a residence time between 2.5 and 3.9 min. To investigate OH oxidation in the OFR, OH radicals were produced in situ using mercury lamps with the “OFR185” method described elsewhere (Li et al., 2015; Peng et al., 2015). As in past field measurements with this OFR (Ortega et al., 2016; Palm et al., 2016, 2017), approximately 50 sccm of dry N2 was constantly passed through each lamp sheath in order to prevent corrosion of the lamps and to reduce lamp-induced heating of the OFR. OH exposure (OHexp) was estimated using a kinetic model-derived estimation equation, which was discussed in Peng et al. (2015) and can be downloaded from the PAM Wiki (Lambe and Jimenez, 2017). The equation uses inputs of ambient water vapor concentration, temperature, O3 produced in the OFR (measured in the output flow), and external OH reactivity (OHRext) as input parameters (Li et al., 2015; Peng et al., 2015). OHRext is the OHR from ambient gases such as VOCs. Since there were no direct OHRext measurements at the T3 site during this campaign, OHRext was assumed to be equal to the average diurnal profile of measurements from the nearby “T0a” site in Williams et al. (2016), which ranged from 27 to 74 s−1(shown in Fig. S2). These measurements were made several meters above the Amazon forest canopy and were similar to measurements of OHR in other tropical forest locations (Sinha et al., 2008; Edwards et al., 2013). While the true OHR at any given time at the site was likely different from the average in Williams et al. (2016) due to natural variability or other reasons, empirical estimates suggest that the model-estimated OHexp could be different by no more than a factor of 2 over the range of reasonable ambient OHR values. The model-estimated OHexp was evaluated by comparing it with measured decay of ambient VOCs and CO (which was injected into the OFR), as shown in Sect. 3.1. For comparison with previous work (e.g., Palm et al., 2016), OHexp was converted to equivalent (eq.) days of atmospheric aging by dividing it by a typical 24 h average atmospheric concentration of 1.5 × 10⁶ molec cm−3 OH (Mao et al., 2009). This eq. age can be scaled accordingly to use other average atmospheric OH concentrations.
To study O3 oxidation, O3 was injected into the OFR using a technique previously described in Palm et al. (2017). Elevated O3 concentrations from hundreds of ppb up to 150 ppm were achieved in the OFR by flowing 0.5 Lpm of ultra-high purity O2 (g) over UV lamps (externally to the reactor). The O2 was photolyzed by 185 nm light, which produced O(3P) that further reacted with O2 to produce an O2+O3 mixture. The oxidant flow was then injected through four ports located around the inlet plate inside the OFR. O3 concentrations in the OFR were cycled by adjusting the UV lamp intensity used for O3 production. O3 exposure was calculated by multiplying the O3 concentration by the average residence time in the OFR. This O3 exposure was converted to eq. atmospheric days of oxidation by dividing it by a typical 24 h average ambient O3 concentration of 30 ppb. As with OH, the value used for the typical O3 mixing ratio (30 ppb) is meant to derive well-defined equivalent ages for a given exposure, as a guide for relative comparisons with other studies and sites. The eq. age of O3 oxidation can be scaled accordingly to apply a different average ambient O3 concentration. Average O3 mixing ratios at the T3 site were 8 (19) ppb in the wet (dry) season, which would correspond to longer site-specific and season-specific ages needed to reach a given O3 exposure, according to the ratio of the O3 mixing ratios. Measurements of O3 in the outflow of each OFR were made using a 2B Technologies Model 205 Ozone Monitor and a Thermo Scientific Model 49i Ozone Analyzer at a time resolution of 10 s.
In laboratory studies after the campaign, the possible effect of electrical charging by the UV lights on new particle formation dynamics in the OFR was investigated and ruled out (see Sect. S1 and Fig. S3).
2.3 Gas and particle measurements
For the measurements at the T3 site, particles in ambient air and after OFR oxidation were sampled using the Aerodyne High-Resolution Time-of-Flight Aerosol Mass Spectrometer (HR-ToF-AMS, hereafter referred to as AMS; DeCarlo et al., 2006; Canagaratna et al., 2007; de Sá et al., 2017b) and a TSI 3936 Scanning Mobility Particle Sizer (SMPS). Ambient and OFR-oxidized VOC concentrations were sampled during the entire campaign using the IONICON Proton Transfer Reaction Time-of-Flight Mass Spectrometer (PTR-TOF-MS; Jordan et al., 2009a, b; Müller et al., 2013). For scientific reasons external to the scope of this paper, this instrument sampled using H3O+ as the reagent ion during IOP1 and NO+ as the reagent ion during IOP2. Sensitivities were calibrated independently for each reagent ion in order to maintain quantification across seasons. At the T2 site, the gases and particles in ambient air and after the OFR were sampled using an Aerodyne Aerosol Chemical Speciation Monitor (ACSM; Ng et al., 2011) and a unit-resolution quadrupole PTR-MS (IONICON; Lindinger et al., 1998). Additionally, the analysis herein uses concentrations of sesquiterpenes (SQTs) and several biomass burning tracers, which were measured in ambient air using the semivolatile thermal desorption aerosol gas chromatograph (SV-TAG; Williams et al., 2006; Zhao et al., 2013; Isaacman et al., 2014). Measurement details for the SV-TAG during GoAmazon2014/5 can be found in Yee et al. (2017).
At both sites, a system of automated valves (Aerodyne AutoValve) cycled by custom LabVIEW (National Instruments, Inc.) software was used to alternate sampling between ambient and oxidized air. The flow rate through all sampling lines and the OFRs was kept constant at all times by pulling a bypass flow when not actively sampling with a given instrument. Ambient temperature and humidity were recorded using Vaisala HM70 probes. All aerosol samples were dried to below approximately 30 % RH prior to or at the same time as being sampled into the measurement trailer, to prevent condensation in the sampling lines when sampling into air conditioned trailers. The decay of injected CO (∼ 2 ppm in reactor) was used to help estimate OHexp in the OFR. CO was measured in ambient air and after oxidation using a Picarro G2401 Cavity Ring-Down Spectrometer.
OH and O3 oxidation was typically performed in one of two ways. The majority of the time, the oxidant concentration was cycled through ∼ 20 min steps (16–24 min in practice), covering a range of concentrations from no added oxidant to maximum added oxidant over the course of a 2–3 h full cycle. The OFR aerosol was sampled for the last 4 min of every step, allowing time for the OFR conditions to stabilize before measurement. An alternative method was also used, where the oxidant concentrations were held constant. In this manner, the OA enhancement from a constant amount of oxidation could be sampled every 16–24 min or faster rather than once every 2–3 h. For example, the concentration that typically produces the maximum amount of SOA formation could be sampled, or the UV lights could be set to achieve the highest oxidant concentrations in order to investigate heterogeneous oxidation.
The aerosol data at the T3 site were corrected for diffusive particle losses in the sampling line (an average correction of 3 %) estimated using the Max Planck Particle Loss Calculator (von der Weiden et al., 2009). To account for particle losses to the internal surfaces of the OFR, the OFR data were corrected by the ratio of ambient OA to the OA measured through the OFR in the absence of added oxidant (an average correction of +6 %). A key data product in this work is OA enhancement, which is defined as the OA concentration measured after oxidation minus the ambient OA concentration (linearly interpolated from measurements immediately before and after OFR sampling). The maximum OA enhancement (or maximum SOA formation) observed in this study was typically between 0.5 and 2 eq. days of OH aging, or above 1 eq. day of O3 aging. Unless otherwise specified, the OA enhancements were corrected for low-volatility organic compound (LVOC) fate to account for losses of condensable gases on OFR surfaces, excessive gas-phase oxidation, leading to fragmentation prior to condensation, and limited timescales for condensation in the OFR that are not expected in the atmosphere, as explained in Palm et al. (2016). For completeness, the parameterization for the coefficient of eddy diffusion (ke) as a function of chamber volume (originally used in the LVOC fate correction in Palm et al., 2016) is shown in Fig. S4. The AMS data at T3 were calculated using a collection efficiency (CE) of 1 for IOP1, as reported in de Sá et al. (2017b) and a composition-dependent CE (mostly 0.5; Middlebrook et al., 2012) for IOP2. These values were verified based on comparison with the SMPS data, which are shown in Fig. S5. The CE of 1 during the wet season, while unusual, corresponds to the value determined during a previous campaign in the wet season in central Amazonia, which is dominated by liquid biogenic SOA under high humidity conditions (Chen et al., 2009; Pöschl et al., 2010; Bateman et al., 2015).
2.4 SOA yields in the OFR measured using VOC standard addition
As presented in Sect. 3.4, SOA yields from the OH or O3 oxidation of several VOCs (and IVOCs in the case of the SQTs) were measured in the OFR during GoAmazon2014/5. Yields were measured for β-caryophyllene (Sigma-Aldrich, ≥ 98.5 %), (+)-longifolene (Sigma-Aldrich, ≥ 98 %), D-limonene (Sigma-Aldrich, 97 %), β-pinene (Sigma-Aldrich, 99 %), α-pinene (Sigma-Aldrich, 98 %), toluene (Fisher Scientific, 99.8 %), and isoprene (Sigma-Aldrich, 99 %). The VOCs were injected one at a time in a 20–40 sccm flow of zero air. The liquid VOC standards were contained in a Teflon™ reservoir, which was connected through a tee to the zero air flow, such that the VOC diffused into the air just prior to entering the OFR. This air flowed into the front of the OFR through the same four ports through which O3 was injected for O3 oxidation of ambient air. When O3 oxidation of injected VOCs was performed, O3 was injected through two ports and the VOC was injected through the other two.
The SOA yields were calculated as the mass concentration of SOA formed divided by the mass concentration of the injected VOC that reacted in the OFR. This assumes that the only gas that formed SOA was the injected VOC, i.e., that there were no SOA precursor gases present in the ambient air (or that they formed an insignificant amount of SOA). The standard addition experiments were performed during daytime hours, when this assumption was valid, with few exceptions. The toluene injection experiment was performed during evening hours. Concurrently and immediately adjacent to the OFR with toluene injection, a second OFR was operated using OH oxidation of ambient air. In this OFR, approximately 3 µg m−3 of SOA was formed from ambient precursors during the time of the toluene injection and at a similar OHexp, so this amount was subtracted from the amount formed in the toluene-injected reactor to determine the SOA yield from toluene. The OH oxidation of limonene was performed overnight. However, the adjacent OFR was not sampling in a manner that could be used to determine the SOA-forming potential of ambient air. Instead, an average value of 5 µg m−3 of SOA (a typical value during the dry season) was assumed to form from ambient precursors and was subtracted when calculating the SOA yield. Therefore, the measured SOA yield for limonene+OH (presented in Sect. 3.4) is more uncertain than the other measured yields. If the ambient air was assumed to have no SOA precursor gases (very unlikely), then the SOA yield for limonene+OH would be 59 % as an upper limit, a value still too low to change the conclusions of these measured vs. predicted SOA analyses.
The isoprene+OH experiment has the caveat that in order to achieve a measurable amount of SOA formation from isoprene oxidation, approximately 85 ppb of isoprene was injected. This amounted to an added external OH reactivity of approximately 212 s−1, which could have resulted in lower OHexp (due to OH suppression, illustrated in Fig. S6) and thus non-OH reactions becoming more important. Regardless, the isoprene injection experiments (including at lower isoprene concentrations) showed that the SOA yield from isoprene+OH presented in Sect. 3.4 could not be larger than several percent (but was larger than zero). The SOA yields of the SQT species were also more uncertain because the sensitivity of SQTs in the PTR-TOF-MS was not calibrated during the campaign. Instead, the PTR-TOF-MS signal for SQTs (at m∕z 204 when sampling with NO+ reagent ion) was calibrated by comparing the SQTs measured in ambient air by the PTR-TOF-MS, with the sum of SQTs measured in ambient air by the SV-TAG (shown in Fig. S7), and then using this calibration for the standard addition experiments. The 25 % uncertainty of the slope in this calibration directly contributes 25 % uncertainty in the calculated SQT yield. While the resulting SQT measurements have significant uncertainty, these measurements nevertheless provide two useful constraints, indicating that SOA yields from SQTs in the OFR are not drastically different from chamber-derived yields, and that primary SQTs are a minor contributor to SOA formation from ambient air in the OFR. Furthermore, variance in the sensitivities of different species of monoterpenes (MT) and SQTs was not accounted for and will add a small amount of uncertainty.
2.5 Predicting SOA formation in the OFR
In Sect. 3.5 below, the measured SOA formation in the OFR is compared with the amount predicted to form in order to investigate which ambient gases contribute to SOA formation. In order to predict the amount of SOA that will form, SOA yields are applied to the mass concentrations of all known SOA precursor gases (VOCs and some IVOCs) measured in ambient air.
For OH oxidation, these gases include isoprene, MT, SQT, benzene, toluene, C8-aromatics (hereafter called xylenes), C9-aromatics (hereafter called trimethylbenzenes), and the sum of four biomass burning tracers (syringol, measured dominantly in the gas phase; and vanillin, vanillic acid, and guaiacol, measured in both gas and particle phases). The SQT and biomass burning tracers were measured using the SV-TAG, and the rest were measured by one of two PTR-TOF-MS instruments sampling at the T3 site (Liu et al., 2016; Martin et al., 2016). First, the fraction of the ambient gas predicted to react in the OFR for a given oxidant exposure was calculated. Then, the OA concentration-dependent SOA yield parameterizations from Tsimpidi et al. (2010) were used to calculate the amount of SOA predicted to form (except for isoprene, where the yield parameterization from Henze and Seinfeld (2006) was used). The average yields used in these calculations for the wet(dry) season were 3 %(5 %) for isoprene, 10 %(18 %) for MT (also used for the biomass burning tracers), 10 %(23 %) for SQT, 11(22 %) for benzene and toluene, and 12 %(26 %) for xylenes and trimethylbenzenes. These yields were calculated at the average ambient OA concentrations of 1.3 and 9.5 µg m−3 at T3 in the wet and dry seasons, respectively. The SOA yields include absorptive partitioning, where the SOA yields increase with increasing OA concentrations. To test whether absorptive partitioning was occurring in the OFR, the dependence of the maximum SOA formation measured from OH oxidation during the dry season on the ambient OA concentrations was investigated. As shown in Fig. S8, absorptive partitioning is likely playing some role, but may not have as strong of an effect as suggested in the published SOA yields used above.
For O3 oxidation, ambient MT and SQT were used to predict SOA formation. Other VOCs, e.g., the aromatic compounds mentioned above that were used in the OH oxidation analysis, were not included in the O3 oxidation analysis because such compounds lack non-aromatic C=C bonds and tend to be non-reactive towards O3 for the concentrations used in this study (Atkinson and Arey, 2003). As for previous O3 oxidation experiments in an OFR, representative SOA yields of 15 % for MT and 30 % for SQT were used (Palm et al., 2017). Due to the uncertainty in these yields, the lack of speciation of MT at the T3 site, and the lack of published yields for the variety of SQT that were speciated by the SV-TAG, these yield values were chosen to be generally representative of published values (e.g., Jaoui et al., 2003, 2013; Ng et al., 2006; Pathak et al., 2007, 2008; Shilling et al., 2008; Winterhalter et al., 2009; Chen et al., 2012; Tasoglou and Pandis, 2015; Zhao et al., 2015).
3.1 Using VOC decay to determine OH and O3 exposure
One of the benefits of the OFR system over environmental chambers is the ability to rapidly change the amount of oxidant in the OFR over a wide range of concentrations. As described above, OHexp in the OFR was estimated using a model-derived equation, while O3 exposure was estimated as the measured O3 concentration after the OFR multiplied by the average residence time. Because there are uncertainties related to these estimates (e.g., uncertain OH reactivity, residence time distribution, and intrinsic uncertainties of the model and estimation equations), it is important to use in situ measurements to verify the exposures achieved in the OFR. This can be done by measuring the decay of various gases, including gases present in ambient air or gases that are injected into the OFR. Previous experiments have injected deuterated compounds, which prevent contamination of the signal with ambient gases and allow the reaction rate constant of the injected compound to be known precisely (Bruns et al., 2015). In this work, decay of ambient toluene and MT and injected CO was used to verify the OH and O3 exposures. Any changes in the ambient concentrations of these gases between the times of the surrounding ambient measurements and the time of the decay in the OFR (approximately 5 min apart) translate into noise in the measurement of the fraction reacted. The speciation of MT in ambient air was also unknown. In this analysis, the fraction remaining was predicted using α-pinene (an important MT in the Amazon; e.g., Rinne et al., 2002; Jardine et al., 2015) with rate constants and cm3 molec−1 s−1 (Atkinson and Arey, 2003).

Figure 1Fraction of ambient toluene, ambient MT, and injected CO remaining after OH oxidation in the OFR, as a function of equation-estimated photochemical age (Peng et al., 2015). Binned averages of the fraction remaining are also shown, compared to the amount predicted to remain assuming either plug flow or using the residence time distribution (RTD) of particles from Lambe et al. (2011a). Factor-of-3 error bars are shown for the prediction using RTD, representing the uncertainty in the model-derived OHexp estimation equation (Li et al., 2015; Peng et al., 2015).
The decay of ambient MT, ambient toluene, and injected CO in the OH-OFR is shown in Fig. 1, along with the theoretical decay curves predicted assuming either plug flow (i.e., a single residence time) or using the residence time distribution (RTD) for particles from Lambe et al. (2011a), which is likely to be more skewed away from laminar flow than the RTD in this work (due to our use of a larger inlet). In general, the OHexp predicted from the model-derived equation matches the OHexp estimated from the decay of gases within a factor of approximately 2–3, consistent with expectations (Li et al., 2015). The model equation appears to overpredict OHexp at the lowest achieved exposures for MT (but not for toluene or CO), while underpredicting at the highest exposures for CO while overpredicting for toluene. There could be several reasons for these differences. The speciation of MT in ambient air is likely to change with time and the combined MT signal is likely to decay at a different rate than the assumed α-pinene rate. Interferences in the PTR-MS signal for MT due to oxidation products may mask the decay of these species at low remaining fraction. Also, it is likely that the true RTD has some differences from the one used in the calculation and perhaps some variability in time. If even small plumes of ambient air transit through the OFR without being exposed to as much oxidant due to variability in the internal air flow fields, this can lead to increases in the measured fraction remaining, particularly for lower exposures. At high exposures, the model assumes that the OH reactivity of the ambient air decays during OFR transit at the same rate as the reaction of SO2 (Peng et al., 2015). If this estimated decay is too slow (e.g., due to faster decay of isoprene-related reactivity), it could lead to an underprediction of OHexp at high exposures.
The decay of MT in the O3-OFR is shown in Fig. 2, along with predictions for the plug flow and Lambe et al. (2011a) residence times. Again, the O3 exposures estimated from the model and from MT decay match within a factor of approximately 2–3. All MT were reacted after an exposure of 1 eq. day.

Figure 2Fraction of ambient MT remaining after O3 oxidation in the OFR, as a function of photochemical age. Binned averages of the fraction remaining are also shown, compared to the amount predicted to remain assuming either plug flow or using the RTD of particles from Lambe et al. (2011a).
3.2 Examples of SOA formation from ambient biogenic and urban gases in OFR
A basic premise of the OFR technique (as used in this work) is that SOA precursor gases entering the OFR can be oxidized to form SOA. A simple way to investigate and illustrate this concept for ambient experiments is to compare SOA formation with ambient VOCs over a period of time. Figure 3 shows a 2-night example of OA measured in ambient air compared to OA measured after OH oxidation at the T3 site, along with ambient total MT and copaene (a SQT). In this example, the OHexp was kept nearly constant for the entire time at approximately 3 eq. days, near the range where maximum SOA formation was usually observed. Using this method, maximum SOA formation was sampled every 24 min rather than every 2–3 h as with the standard cycling of OHexp. Note that in theory, ambient and OFR measurements could be alternated at much faster frequencies (as fast as ∼ 10 s). In practice during this time period, the instrumentation was alternating between measurements of ambient air, two OFRs, and a thermodenuder, and longer averages of the data (1–2 min) were preferred to reduce noise and data volume, limiting the frequency at which the OFR measurements were taken. In Fig. 3, the times when SOA was formed in the OFR clearly coincide with the spikes in ambient MT and SQT concentrations, illustrating an example of likely biogenic-dominated SOA formation. This is evidence that the SOA being formed in the OFR was derived from gases that were entering the OFR. Importantly, this example illustrates that the ambient precursor concentrations at the T3 site can change rapidly, even faster than the typical 2–3 h cycles.

Figure 3An example of the time series of OA concentrations measured in ambient air and after OH oxidation of ambient air in the OFR at the T3 site, shown together with ambient copaene (a sesquiterpene, measured by SV-TAG) and monoterpenes (measured by PTR-TOF-MS before and after the OFR). Daytime (nighttime) hours are indicated with the yellow (grey) background. OHexp in the OFR was held constant throughout this time at approximately 3 eq. days. The SOA formed in the OFR is shown as measured, without the LVOC fate correction. In this example, the SOA formation from OH oxidation closely follows the availability of ambient biogenic gases, though the amount of SOA formed was substantially larger than could be formed from the measured ambient gases (see Sect. 3.5).
Another example of SOA formation from ambient precursors, this time from the T2 site (close to Manaus), is shown in Fig. 4. In this example, the OHexp was cycled through the whole range of eq. ages, including one step each cycle with no OH. In the OFR, SOA was formed at three distinct times, labeled Periods 1, 2, and 3 in Fig. 4. During Period 1, ambient MT concentrations were near zero, and elevated concentrations of xylenes and trimethylbenzene (TMB) strongly suggest the presence of an urban plume affecting the T2 site. The SOA formed during this cycle was likely formed from predominantly urban precursors. In contrast, the SOA formed during Period 3 was produced in the presence of MT but not the urban tracers, suggesting the SOA was predominantly biogenic. The SOA formed during Period 2 in Fig. 4 was produced in the presence of both urban and biogenic gases, and likely was formed from a mix of both types of gases. These two examples clearly illustrate the usefulness of the OFR technique for measuring potential SOA formation from ambient air.
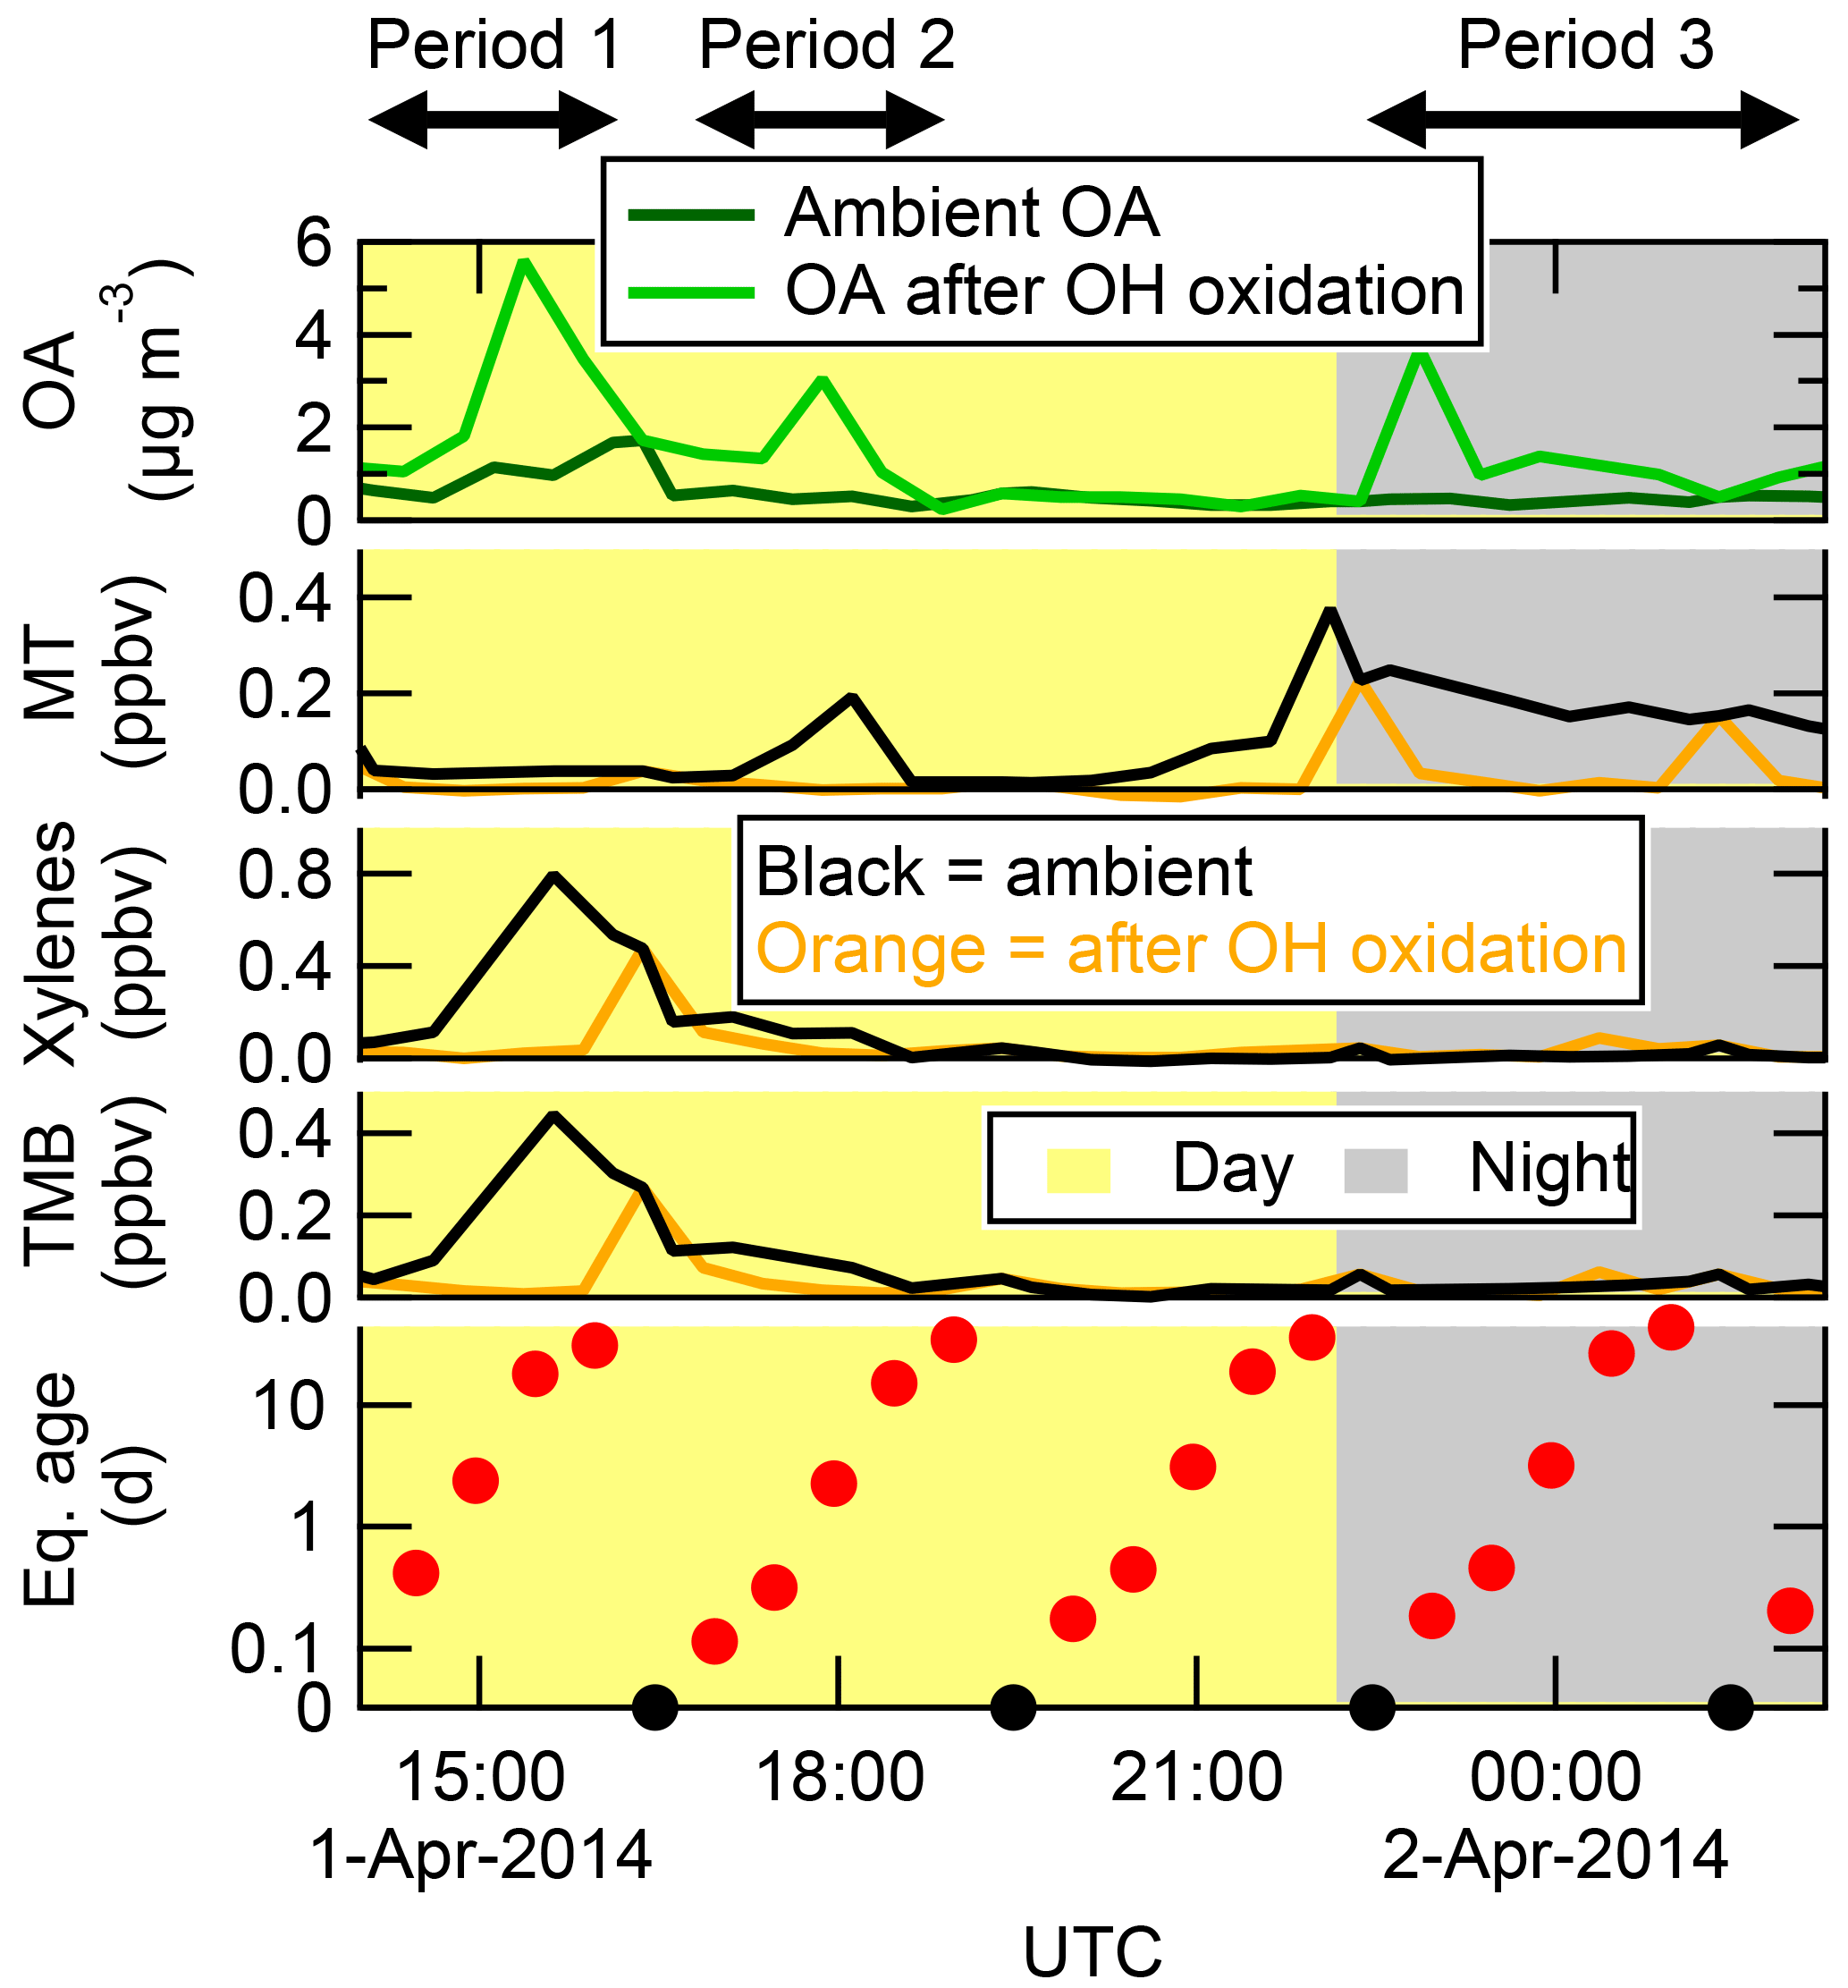
Figure 4An example of OA concentrations in ambient air and after OH oxidation of ambient air in the OFR at the T2 site, shown together with MT, xylenes, and trimethylbenzene (TMB) measured in ambient air and after OH oxidation. The OHexp is also shown (in eq. days). Daytime (nighttime) hours are indicated with the yellow (grey) background. OH age was cycled through a range of exposures, including no added exposure (black circles) where none of the VOCs were reacted in the OFR. This example illustrates how SOA formation in the OFR can come from urban (Period 1), biogenic (Period 3), or mixed (Period 2) precursors, depending on ambient conditions.
3.3 OA enhancement vs. photochemical age
As part of the GoAmazon2014/5 campaign, the formation of aerosol from the oxidation of ambient air was sampled over a wide range of conditions. These conditions include the changes of ambient air composition between the wet and dry seasons, and the diurnal, synoptic, and other changes during each season. OH oxidation of ambient air was performed at both the T2 and T3 sites, and O3 oxidation was performed at the T3 site only. A basic way to view the differences across these conditions is by comparing the absolute OA enhancement from each subset as a function of photochemical age. This is shown for OH oxidation in Fig. 5 and O3 oxidation in Fig. 6, split into daytime (06:00–18:00 local time (LT)) and nighttime (18:00–06:00 LT) for each season and location. The T3 site data are shown both without the LVOC fate correction and with the correction. For OH oxidation, the LVOC fate correction was applied at ages below 10 eq. days only. At higher ages, heterogeneous oxidation leads to substantial fragmentation/evaporation of preexisting particles. This effect competes in uncertain ways with the condensation of LVOCs, so the LVOC fate correction cannot be applied with confidence. Therefore, the data are shown without the LVOC fate correction in order to illustrate the measurements over the entire age range. Also, the LVOC fate correction was not applied for data from the T2 site because the requisite measurements of size distribution after oxidation in the OFR were not available. However, it is likely that the correction would be approximately of the same magnitude as for the T3 data. The LVOC fate correction was not applied for daytime O3 oxidation data because the signal-to-noise ratio of SOA formation was too low.

Figure 5Absolute OA enhancement after OH oxidation in the OFR as a function of photochemical age, shown as binned averages for the wet (c, d) and dry (a, b) seasons at both the T2 and T3 measurement sites, and split into daytime (06:00–18:00 LT) and nighttime (18:00–06:00 LT) data. These data are shown both not corrected (left) and corrected (right) for LVOC fate. Note that the scale of the y axis is different between the wet and dry season panels. The average ambient OA concentrations during the measurement times used here were 1.2 and 6.9 µg m−3 at T2 in the wet and dry seasons, and 1.3 and 9.5 µg m−3 at T3 in the wet and dry seasons, respectively.
For OH oxidation at each site and season, an increasing amount of SOA formation was observed for increasing ages, up to a maximum amount of SOA formed in the range of approximately 1–4 eq. days of OH oxidation. At higher ages, the net amount of SOA formed became less or even negative (net loss of OA compared to ambient air). This result is due to a combination of two effects (which have also been observed previously): the rapid oxidation of condensable gases prior to those gases having time to condense on particles, leading to fragmentation in the gas phase that produces volatile oxidation products, and heterogeneous oxidation of preexisting (and newly formed) particle mass, leading to fragmentation and evaporation of the particles (George and Abbatt, 2010; Lambe et al., 2012; Ortega et al., 2016; Palm et al., 2016).
At both sites, a maximum of approximately 4–5 times more SOA was formed from ambient air during the dry season compared to the wet season. During the dry season, the maximum amount of SOA formed at the T2 site during nighttime was about 50 % larger than at the T3 site during nighttime (assuming the LVOC fate correction was the same at each site). It may be the case that this increased SOA formation was due to a larger urban source strength in the closer proximity to the city of Manaus. The maximum amounts of SOA formed at all other times were approximately equivalent at each site. These measurements suggest that the seasonal changes in SOA precursor gases are more important to potential SOA formation than the proximity to Manaus. One possibility is that a substantial fraction of the urban SOA had already formed by the time the air passed over the T2 site, so formation in the OFR of the remaining potential SOA did not lead to a very large difference between the sites sources.
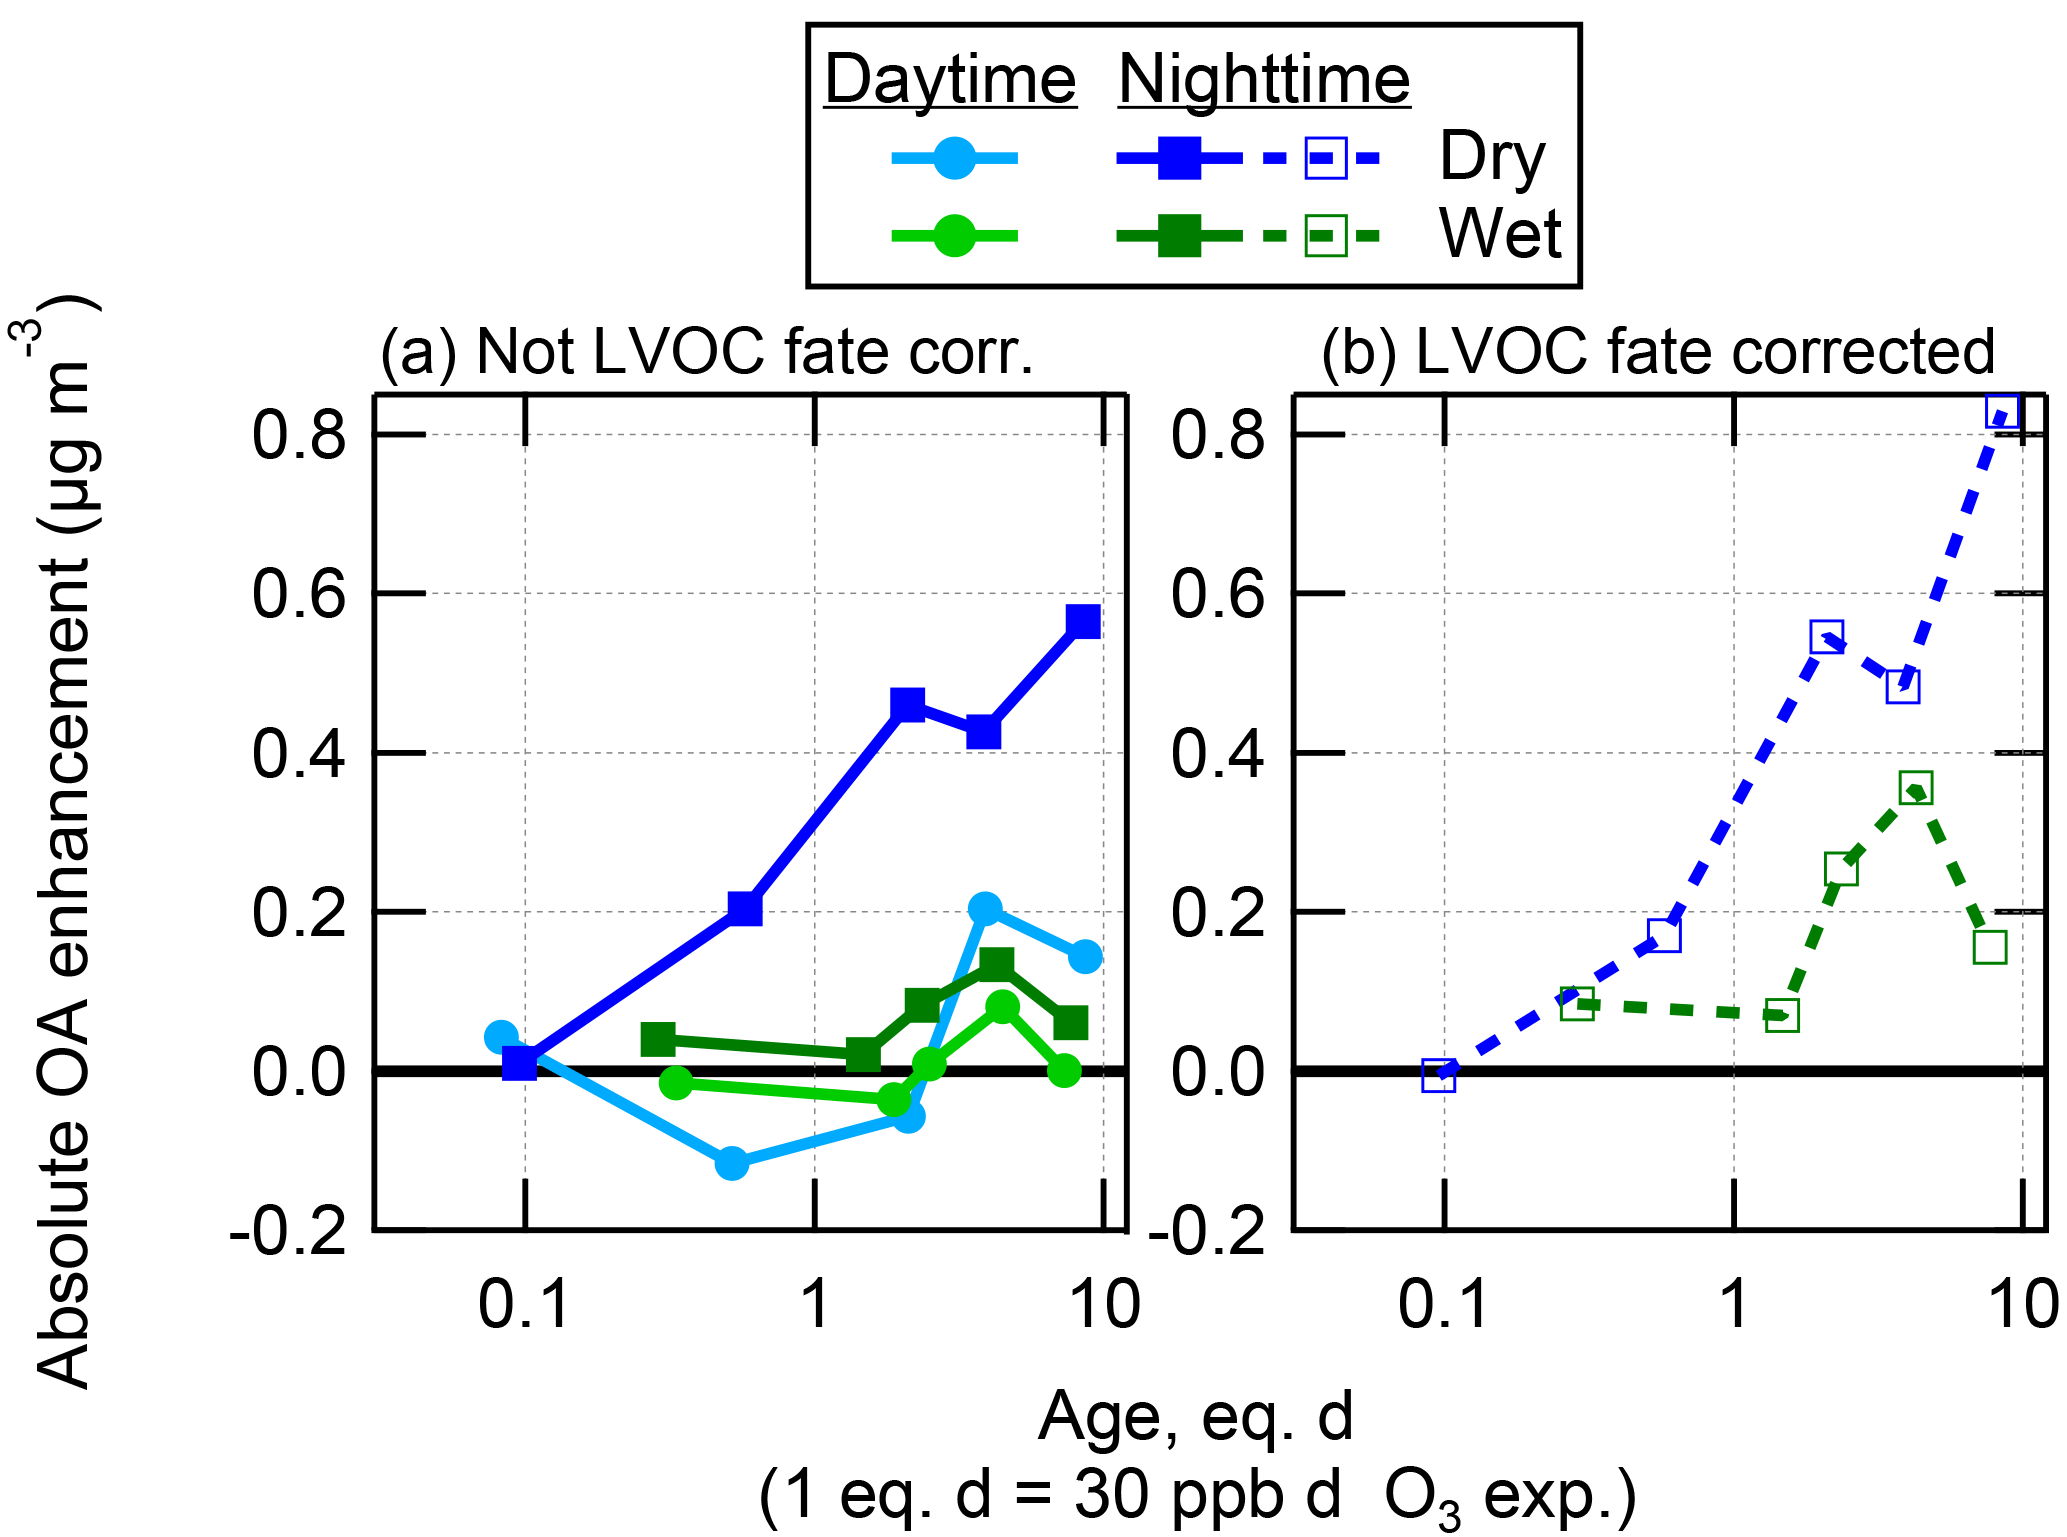
Figure 6Absolute OA enhancement after O3 oxidation in the OFR as a function of photochemical age, shown as binned averages for the wet and dry seasons at the T3 measurement site, and split into daytime (06:00–18:00 LT) and nighttime (18:00–06:00 LT) data. These data are shown both not corrected (a) and corrected (b) for LVOC fate.
As shown in Fig. 6, approximately 2–3 times more SOA was formed from O3 oxidation during the dry season than the wet season, again with typically higher formation during nighttime than daytime hours. The amount of SOA formation increased with O3 eq. age, with maximum values above 1 eq. day of O3 oxidation. This is consistent with the age at which the ambient MT (and likely other compounds) were all reacted, as shown in Fig. 2. As observed previously at another biogenic site, O3 oxidation of ambient air produced at most approximately one-sixth of the SOA that was formed from OH (Palm et al., 2017).
3.4 Investigating SOA yields in an OFR using standard addition
One of the original design intents of the PAM OFR was to oxidize air containing aerosol precursors and measure the potential amount of aerosol that can be formed. Since the initial development of the PAM reactor (Kang et al., 2007), subsequent research has shown that there are many factors related to exactly how the PAM reactor is operated that can affect the amount of aerosol that is formed (Peng et al., 2015, 2016b; Hu et al., 2016; Palm et al., 2016). For OH oxidation, the amount of SOA formed increases as OHexp increases, up to a maximum amount of SOA formed in the range of OHexp between the exposure where most of the reactive precursor gases have reacted and approximately 5 eq. days of exposure. At higher exposures, the high amounts of OH radicals start reacting many times with gases faster than condensation can occur, which fragments them to form volatile oxidation products that can no longer condense. Also, these high OH exposures start heterogeneously oxidizing any preexisting (or newly formed) aerosol, leading to fragmentation and evaporation (Lambe et al., 2012; Ortega et al., 2016; Palm et al., 2016). So, in order to measure the maximum potential aerosol formation, the experiment needs to be operated over the range of exposures below approximately 5 eq. days.
Achieving the proper range of OHexp, however, is also nontrivial. OHexp in the OFR has been shown to be sensitive to many factors, including UV photon fluxes, sample air composition, water vapor content, external OH reactivity, and OFR residence time and distribution (Li et al., 2015; Peng et al., 2015). All of these factors need to be considered when estimating OHexp. Special care must be taken to avoid operating the OFR at conditions that lead to significant influence on the chemistry from non-OH reactions (e.g., photolysis; Peng et al., 2016b). Also, Palm et al. (2016) showed that some fraction of the condensable gases will condense on OFR walls and sampling lines or react further with OH and fragment instead of condensing to form SOA. This behavior is sensitive to the condensational sink (i.e., surface area of seed aerosol) available in the OFR. These alternate fates are artifacts of the OFR experiment and must be corrected using the measured condensational sink in order to determine the true potential aerosol mass that would form in the atmosphere.
All of these effects can matter for OFR experiments that attempt to compare measured vs. predicted SOA formation, and they have been considered in, e.g., the SOA formation from oxidation of ambient air in Palm et al. (2016, 2017) and in the subsequent analysis in this work. In these analyses, this carefully quantified maximum amount of SOA formation was compared to the amount predicted to form from the oxidation of the speciated precursor gases measured in ambient air. The amount of predicted SOA was estimated by applying typical chamber-derived SOA yields to the measured amount of ambient gas. One important aspect of this analysis that has not been as carefully examined in the literature is whether (or how well) these typical chamber SOA yields apply to the SOA formation in the OFR, particularly under ambient operating conditions. Several previous results have suggested that SOA yields in the OFR were similar to published chamber yields (Kang et al., 2007; Bruns et al., 2015; Lambe et al., 2015). However, these conclusions were often drawn from experiments that likely suffered from one or more of the following issues: (1) not considering factors such as high VOC concentrations (high external OH reactivity, leading to OH suppression) when determining OHexp (Peng et al., 2015); (2) not considering the alternate fates of condensable gases, particularly for short OFR residence times or when using no-seed aerosol (Palm et al., 2016); (3) not considering possible non-OH reactions, particularly under “high risk conditions”, such as high external OH reactivity (Peng et al., 2016b); (4) not considering possible effects of the water vapor concentration of the sample air on both OHexp and aerosol liquid water content (Peng et al., 2015; Palm et al., 2016); and (5) not performing the SOA yield experiments at atmospherically relevant OA concentrations.
Due to these possible limitations of prior OFR SOA yield studies, during the GoAmazon2014/5 field campaign we endeavored to investigate whether SOA yields in the OFR are indeed consistent with published chamber yields, while avoiding or at least considering all of the abovementioned potential pitfalls (see Sect. 2.4 for more details). SOA yields were quantified by injecting several pure VOCs (individually) into the ambient air at the entrance to the OFR, exposing them to varying concentrations of either OH or O3 and measuring the resultant SOA formation as well as VOC decay. By injecting the VOCs into ambient air, we were able to measure the yields at ambient temperature, humidity (and aerosol liquid water content), and seed OA concentrations. The injected VOC concentrations were also kept low in order to minimize the undesired effects of added external OH reactivity (with the exception of isoprene, as discussed in Sect. 2.4 and Fig. S6). Both constant and stepped oxidant concentrations were used in these experiments. The amounts of OH aging used for these yield calculations were all below approximately 5 eq. days of aging, in order to minimize the influence of heterogeneous oxidation and excessive oxidation reactions in the gas phase. Conversely, O3 ages above 1 eq. day were used.

Figure 7SOA yields measured for individual VOCs in the OFR by standard addition into ambient air, as a function of OA concentration. Typical SOA yield parameterizations (derived from a chemical transport model, which was informed using environmental chamber experiments; Lane et al., 2008a, b; Tsimpidi et al., 2010) are also shown. The VOCs were injected into ambient air at the entrance to the OFR, and aged between 0 and 5 eq. days. Data are corrected for LVOC fate.
The measured SOA yields are shown in Fig. 7, along with relevant yield parameterizations used in box and chemical transport models (Tsimpidi et al., 2010) using low-NOx yields (Lane et al., 2008a) corresponding to the expected conditions in the OFR (Li et al., 2015). The SOA yields (listed in Table S1 in the Supplement along with the OA mass concentrations at which they were measured) were measured to be 52 % for β-caryophyllene+OH, 51 % for longifolene+OH, 27 % for β-caryophyllene+O3, 30 % for limonene+OH, 18 % for β-pinene+OH, 11 % for α-pinene+OH, 17 % for limonene+O3, 21 % for α-pinene +O3, 11 % for toluene+OH, and 6 % for isoprene+OH. These yield values are generally consistent (within a factor of 2 for comparable OA mass concentrations) with the Tsimpidi et al. (2010) and Henze and Seinfeld (2006) values that were determined using the results from large chambers, with the averages being 0.9, 1.3, 0.5, and 0.9 times the respective chamber-derived yields for MT, SQT, toluene, and isoprene. Importantly, there is no indication that the OFR is more efficient at forming SOA than the chamber yields would indicate. This confirms that the OFR can be used to quantitatively determine the amount of SOA that would form upon oxidation of an ambient mix of precursor gases. Furthermore, it supports the analyses presented in Palm et al. (2016, 2017) that ambient VOCs alone could explain the amount of SOA formed from O3 oxidation but not OH oxidation, where unspeciated S/IVOCs contributed a majority of the SOA formation in the OFR.
3.5 Measured vs. predicted SOA formation
When SOA precursor gases enter the OFR, either in ambient or injected air as illustrated above, SOA can be produced by oxidizing the gases in the sampled air. As shown in Sect. 3.4, when a known concentration of VOCs is added to the OFR, the amount of SOA formed upon oxidation by either OH or O3 is consistent with what would be expected from published chamber experiments. Therefore, when comparing the measured SOA formation from the oxidation of ambient air to the amount predicted to form from measured ambient gases, we can determine if all of the SOA formation is accounted for, or if there are other SOA-forming gases present in ambient air that are not being measured and quantified. Previous studies of OFR oxidation of urban or pine forest ambient air have shown that poorly characterized S/IVOCs are likely an important source of SOA from OH oxidation (Ortega et al., 2016; Palm et al., 2016). In contrast, SOA formed from O3 and NO3 oxidation in a biogenic environment can be accounted for from ambient VOCs alone, indicating that S/IVOC precursors tend not to have C=C bonds (Palm et al., 2017).
The measured SOA formation (at the eq. ages of maximum SOA production, as discussed above) from ambient air in the OFR during GoAmazon2014/5 is shown in Fig. 8, for both wet (IOP1) and dry (IOP2) seasons and both OH and O3 oxidation and with linear regressions shown for reference. The measured SOA formation is corrected for LVOC fate. The predicted SOA formation was estimated by applying typical chamber SOA yield values to measured ambient VOC concentrations, as described in Sect. 2.5.
OH oxidation of ambient air produced on average 6.5–8 times more SOA than could be accounted for from ambient VOCs, which is consistently observed in either the averaged data or the linear regressions. This is consistent with previous OFR measurements, suggesting that typically unmeasured ambient S/IVOC gases play a substantial role in ambient SOA formation from OH oxidation (see Sect. 3.8 for more analysis to explore this concept). Also, the correlation coefficients for the data in Fig. 8 are relatively low, indicating that ambient concentrations of these S/IVOCs are more complex than can be explained by correlations with measured VOC concentrations (see Sect. 3.8 for more analysis to explore this concept). The amount of SOA formed from O3 oxidation was on average similar or slightly larger than the amount that could be explained from measured ambient VOCs. This measurement is noisy (particularly in the dry season, when using a difference measurement to quantify several tenths of µg m−3 of SOA formation on top of ∼ 10–20 µg m−3 is difficult). Given the uncertainties in e.g., VOC speciation and yield, it is consistent with the previous OFR measurements in a pine forest where ambient VOCs could explain all SOA formation from O3 oxidation (Palm et al., 2017). These non-VOC ambient gases are likely to be the typically unmeasured/unspeciated class of lower volatility S/IVOCs. However, there were no instruments dedicated to quantifying the total concentration of these gases during GoAmazon2014/5. The measurement of such gases remains a critical gap in our understanding of the life cycle of carbon in the atmosphere. However, the SOA formed in the OFR that cannot be accounted for by VOCs is effectively an integrated measure of these S/IVOC gases (multiplied by their SOA yield). They are measured by first converting them into SOA, which is much more readily measurable and quantifiable than S/IVOCs with current instrumentation.

Figure 8Measured SOA formation vs. the concentration of SOA predicted to form from the oxidation of ambient VOCs, shown for OH and O3 oxidation during both wet and dry seasons. Regression lines, correlation coefficients, and average measured and predicted SOA are shown for each OFR type and season. Standard errors of the mean of all average measured and predicted SOA values were smaller than the size of the marker and are thus not shown. Data are colored by local time of day. Measured SOA formation is corrected for LVOC fate.
Whereas the slope of the measured vs. predicted SOA formation from pine forest air in Palm et al. (2016) was roughly constant at approximately 4, the slope of the measured vs. predicted SOA formation from OH oxidation in the Amazon varied as a function of time of day. The diurnal cycles of measured and predicted SOA formation are shown for both seasons in Fig. 9. The predicted SOA was on average slightly lower during nighttime than during daytime. The cycle of measured SOA formation was the opposite, leading to slopes (in Fig. 8) that were lowest during daytime and highest in the hours before sunrise. The reasons for the observed trends are unclear, but likely result from the confluence of several processes, e.g., diurnal changes in emission and concentration profiles (of VOCs and/or S/IVOCs), boundary layer dynamics, and varying ambient oxidant concentrations.
In addition to showing the diurnal average SOA formation, Fig. 9 also illustrates that a wide range of potential SOA formation is possible at any given time of day. There were some nights when as little as 1 µg m−3 of SOA was formed, and other nights when nearly 10 µg m−3 was formed. During the nights when little SOA was formed, Fig. 8 shows that these nights also had the lowest predicted amounts of SOA formation. This shows that, while the amount of SOA formation correlated with measured ambient SOA precursor VOCs, they could not quantitatively explain the total amount of SOA formed. Other SOA-forming gases were apparently present at the same time as VOCs, though in varying ratios to these VOCs.

Figure 9Measured SOA formation vs. local time of day and mean diurnal cycles of measured and predicted SOA formation, shown for OH oxidation during both wet and dry seasons. For clarity, the predicted SOA from ambient VOCs is also shown multiplied by 5 for easier comparison of the trend relative to measured SOA formation.
3.6 Positive matrix factorization (PMF) of SOA after OH oxidation
PMF is a common technique for source apportionment of ambient aerosol (e.g., Ulbrich et al., 2009; Zhang et al., 2011). It can be used to split the full mass spectrum into the sum of several statistical factors, where each factor is the mass spectrum that is produced from a group of related molecules in the ambient aerosol that vary together in time. Here, we present results of PMF analysis of OA after OH oxidation as an investigation into what types of SOA were formed in the OFR and how heterogeneous oxidation affected the types of preexisting OA that entered the reactor in ambient air. In related analyses, the results of PMF analysis for ambient OA (i.e., not oxidized in an OFR) are presented in de Sá et al. (2017a, b). To the best of our knowledge, the results presented in this study are the first report of PMF analysis of the complete OA after oxidation in an OFR.
First, PMF was applied to only the unoxidized measurements through the OFR. The resulting PMF factors were similar to the factors identified in ambient air (de Sá et al., 2017a), and they were also similar to those observed previously at a nearby site in the Amazon during the AMAZE-2008 campaign (Chen et al., 2015). The mass concentrations of these unoxidized OFR factors represent the ambient air baseline against which OA enhancements can be calculated. These factor profiles for the wet and dry seasons are shown in Figs. S9–S10. The analysis herein describes how characteristic factors changed as a function of OH aging in the OFR. The results should be interpreted in the context of how OFR oxidation affects the concentration of these types of factors, which are commonly found in PMF analyses of ambient OA. The interpretation of the factors in ambient OA is outside of the scope of this analysis and is the subject of separate studies (de Sá et al., 2017a, b).
Several factors that were identified during both wet and dry seasons are common in PMF literature, including hydrocarbon-like OA (HOA), biomass burning OA (BBOA), isoprene epoxydiols-derived SOA (IEPOX-SOA), and several oxidized OA (OOA) factors that represent SOA (e.g., Aiken et al., 2009; Ulbrich et al., 2009; Zhang et al., 2011; Hu et al., 2015). A factor with a characteristic signal at m∕z 91 (Robinson et al., 2011; Budisulistiorini et al., 2015), referred to here as the “Fac91” factor, was also identified during the wet season. The HOA and BBOA factors are typically dominated by primary OA (POA, i.e., direct particle emissions) and are not expected to be produced from the chemistry in the OFR. IEPOX-SOA, while representing a type of SOA, was also not expected to be produced in the OFR. In the atmosphere, IEPOX-SOA is formed via reactive uptake of gas-phase IEPOX onto acidic aerosols (Eddingsaas et al., 2010; Froyd et al., 2010; Surratt et al., 2010; Lin et al., 2012; Liao et al., 2015). As detailed in Hu et al. (2016), IEPOX can be formed in the gas phase in the OFR at accelerated rates, but the rate of reactive uptake in the OFR does not increase with the increased OH concentrations, resulting in negligible formation of IEPOX-SOA in the OFR.
For the wet season, PMF of the OH-aged aerosol was performed with a total of six factors, using the Source Finder analysis software (SoFi, version 6.2; Canonaco et al., 2013) to constrain the HOA, BBOA, Fac91, and IEPOX-SOA factors to be exactly the same (i.e., using a-value of 0 in SoFi) as the factor profiles found in unoxidized ambient air. These four factors were not expected to be formed in the OFR and were not observed to increase with OFR age in unconstrained runs. These factors were constrained so that we could calculate age-dependent changes in their mass concentrations using constant factor profiles (i.e., mass spectra), rather than allowing possible variations in factor profiles (with age) to confuse the interpretation of mass changes. The other two SOA-related factors were left unconstrained, in order to allow the analysis to determine the mass spectra of any SOA that was formed. These two factors are referred to as less-oxidized OOA (LO-OOA) and more-oxidized OOA (MO-OOA) based on their relative O:C. For the dry season, the HOA, BBOA, and IEPOX-SOA factors were constrained and the two OOA factors were allowed, for a total of five factors.
The changes in the mass concentrations associated with each factor after OH oxidation compared to before oxidation are shown for the dry season in Fig. 10. The results during the wet season were generally similar, so they are shown in Fig. S11. The factors associated with POA or with SOA from reactive uptake processes were not enhanced by the OFR oxidation, as expected, and were depleted as the eq. age of OH oxidation increased. The Fac91 factor also fell into this category. Notably, the factor concentrations decayed at different rates, with HOA (and Fac91) decaying at faster relative rates than IEPOX-SOA and BBOA. This is particularly clear in the dry season. The decay of these factors at higher eq. ages is likely due to heterogeneous oxidation leading to fragmentation and evaporation of the preexisting aerosol, or conversion of the POA factors into MO-OOA that remains in the particle phase.
In contrast, the OOA factors were produced in the OFR at concentrations that varied as a function of eq. age. At lower ages, SOA associated with the LO-OOA factor was produced in increasing amounts with increasing age, peaking around approximately 2 eq. days of aging. At higher ages up to 6–9 eq. days, less mass formation associated with LO-OOA was observed. Eventually at ages larger than 6–9 equivalent days a decrease of LO-OOA below the preexisting amount in ambient air was observed, indicating that the preexisting ambient LO-OOA was being heterogeneously oxidized, and that no new LO-OOA was surviving the OFR (either it was not formed, or it was formed but then converted into MO-OOA or heterogeneously oxidized to gas-phase species). The MO-OOA factor concentration increased as a function of age, peaking and then plateauing around 10 eq. days of aging, where heterogeneous oxidation was a dominant process affecting the OA sampled out of the OFR.
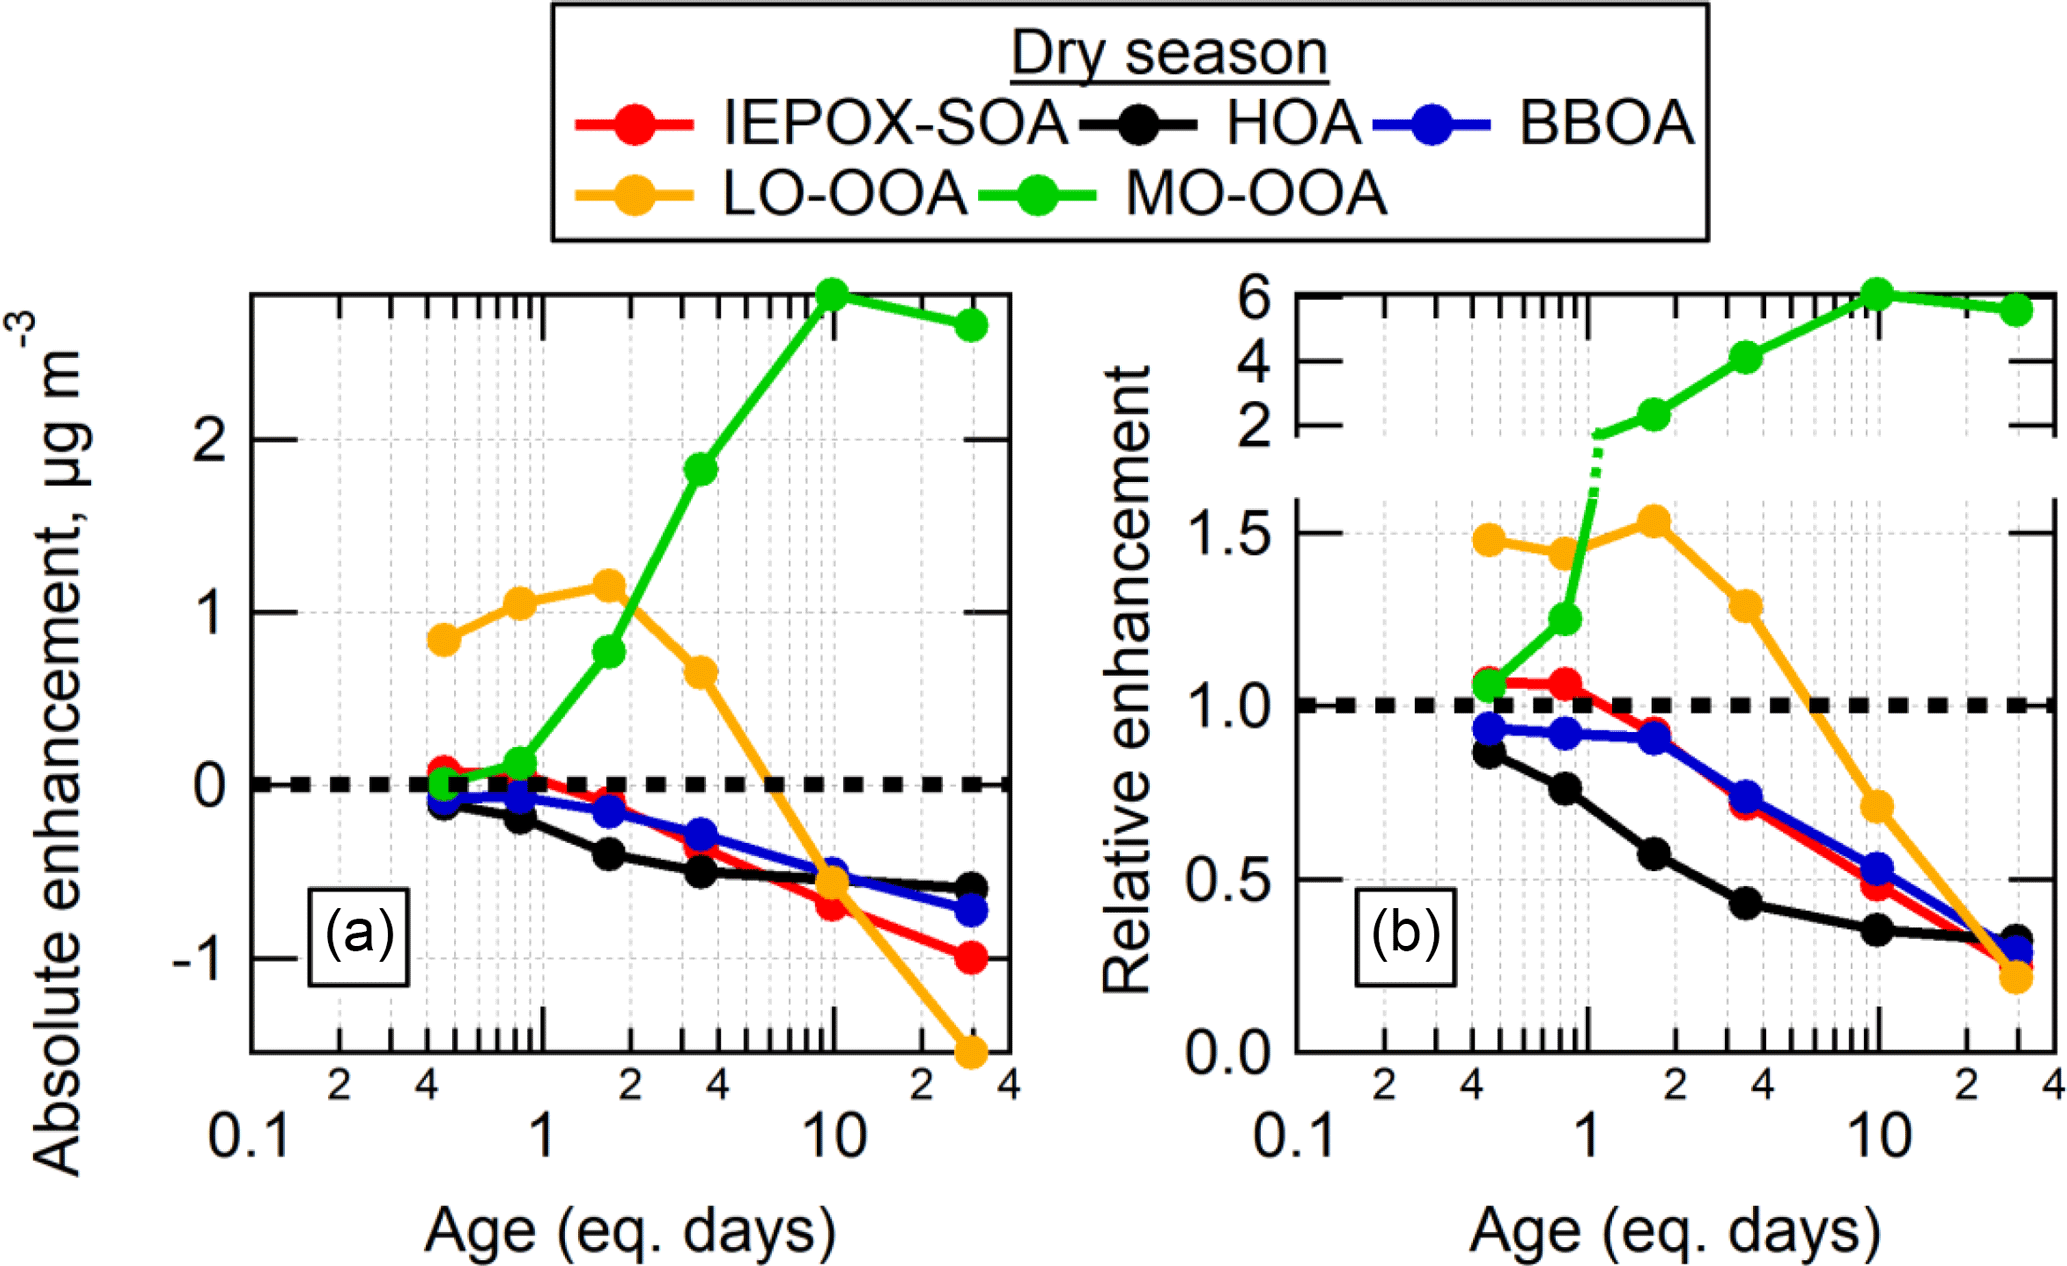
Figure 10Absolute (a) and relative (b) changes in PMF factors as a function of eq. days of OH aging in the OH-OFR for the dry season. Note that the y axis in (b) is split in order to more clearly show the region below a value of 1.
This PMF analysis shows that the SOA formed in the OFR from hours up to several days of eq. OH aging produces a mass spectrum in the AMS that resembles the spectra of ambient OOA (i.e., LO-OOA and MO-OOA). The mass spectrum of the SOA formed from OH oxidation was correlated (R2=0.72–0.93; shown in Fig. S12) with spectra of the SOA formed from the injected VOCs from the standard injection experiments in Sect. 3.4. These correlations show that the SOA formed from OH oxidation of ambient air appeared similar to SOA from known precursors, but the spectra from the different precursors appear too similar to be able to differentiate the SOA sources in ambient air from the spectrum alone. The decay of HOA, BBOA, and IEPOX-SOA factors suggests that heterogeneous oxidation is indeed minor at the low eq. ages, though it may have a stronger impact on HOA. For OH oxidation of urban air in an OFR, this should be considered. At the highest ages, this analysis suggests that all of the factors (except MO-OOA) decay by 70–80 % relative to their initial concentration, and that the remaining aerosol is mostly associated with the MO-OOA factor. This suggests that heterogeneous oxidation could be a source of MO-OOA in the atmosphere, particularly in more highly aged particles. Since the oxidation inside the OFR occurs at the same RH as ambient air, this also indicates that diffusion in the ambient OA in the studied region is fast enough, so that most ambient OA is not shielded from oxidation by slow diffusion. This is consistent with previous measurements showing that regional SOA at this site was in liquid form most of the time under ambient RH (Bateman et al., 2015).
3.7 Hygroscopicity of the organic component of cloud condensation nuclei (CCN) after OH oxidation
In addition to characterizing the OA mass as a function of eq. age of oxidation in an OFR, we can also investigate the properties of the OA as a function of aging in the OFR. During 7–15 October in the dry season, the OFR output was size-selected by a differential mobility analyzer (DMA) and the size-selected particles were then measured by a CCN counter and a condensation particle counter (CPC) to derive the activated fraction as a function of supersaturation. The hygroscopicity (κ) of the CCN was determined from the spectrum of the activated fraction (Mei et al., 2013; Thalman et al., 2017). When coupled with the chemical speciation measurements provided by the AMS and using the relatively well known values of κ for the inorganic aerosol components, the κ of the organic component of CCN (κOA) can be determined (Petters and Kreidenweis, 2007). This analysis for ambient OA during GoAmazon2014/5 has been presented elsewhere (Thalman et al., 2017). Here, we present an analysis of how κOA changed upon oxidation in the OFR.
Due to sampling time and experimental requirements, the size-selected CCN counter sampled only a single particle mobility diameter during these measurements (160 nm), within the size range for which Thalman et al. had previously shown κOA to be constant. Also, these experiments were performed while keeping the UV light intensity (and thus the approximate amount of oxidation) in the OFR constant. As previous research of OH oxidation in an OFR has illustrated (Lambe et al., 2012; Ortega et al., 2016; Palm et al., 2016, 2017), the OFR can be operated under conditions dominated by SOA formation with limited heterogeneous oxidation (at ages below approximately one to a few eq. days), conditions dominated by heterogeneous oxidation with minimal new SOA formation (the highest ages above approximately 10 eq. days), or conditions where both processes are occurring (the intermediate age range). When sampling the OFR with the CCN counter during GoAmazon2014/5, the OFR was operated to investigate both the SOA formation and heterogeneous oxidation regimes, at separate times. During nighttime hours, when SOA-forming gases were shown to be present in ambient air in their highest amounts (as discussed in Sect. 3.2, 3.3, and 3.5 above), the OFR was operated at a near-constant age in the range of 1–3 eq. days. During daytime hours, when SOA-forming gases were present in lower concentrations (as discussed in Sect. 3.2, 3.3, and 3.5 above), the OFR was operated at a near constant age in the range of 12–44 eq. days of OH aging. To increase confidence that the measurements at the very high eq. ages were a result of heterogeneous oxidation of preexisting aerosol and not influenced by new SOA formation of highly oxidized gases, a parallel-plate carbon filter denuder (Sunset Laboratory Inc.) was mounted on the inlet of the OFR during some of these high-age measurements in order to remove SOA-forming gases from ambient air. For reference, the evolution of bulk O:C vs. eq. days of OH aging for all data during the dry season is shown in Fig. S13.
Figure 11 shows κorg of 160 nm mobility diameter particles as a function of bulk O:C in both ambient and oxidized air. The κOA of ambient OA was in the range of 0.05–0.2 and increased monotonically with increasing O:C. When operating the OFR in the 1–3 eq. day range (corresponding to OFR data with O:C less than ∼ 1.0), the OH-aged OA maintained the same slope of monotonically increasing κOA with increasing O:C, but the data were shifted to the right (to higher O:C values for a given κOA). In other words, the OH oxidation led to an increase in O:C, but the value of κOA increased a smaller amount per unit increase in O:C compared to the rate measured in the slope in the ambient OA, so the trend in the oxidized OA kept the same slope but with a different intercept. This indicates that the process(es) in ambient air that modulates κOA and O:C is likely not dominated by condensation of new SOA from hours to several days of aging, which was the process specifically studied here. For example, processes such as aqueous chemistry or the formation of IEPOX-SOA through particle-phase reactions could contribute substantially to the composition and properties of ambient OA.
The measurements made at high eq. OH ages (corresponding to O:C greater than ∼1.2) showed unexpected results. Instead of continuing to increase at very high O:C values, κOA decreased to below 0.1 with increasing O:C above 1.2, even as O:C increased to higher than 1.4. This trend appears regardless of whether the denuder was used to remove any VOCs. While this decrease in κOA with increasing O:C was unexpected, it is not necessarily inconsistent with previous measurements that have generally shown only increasing κOA with increasing O:C (or f44, the fraction of signal found at m∕z 44). Those previous measurements involved the heterogeneous oxidation of POA surrogate particles (Petters et al., 2006a; George et al., 2009; Cappa et al., 2011; Lambe et al., 2011a) and measurements of SOA formed in an OFR in laboratory experiments (Massoli et al., 2010; Lambe et al., 2011a, b). The experiments of heterogeneous oxidation of POA did not achieve O:C values or eq. ages as high as the maximum values achieved in this study (O:C of ∼ 0.25). At their highest amounts of oxidation, a plateau in κOA of approximately 0.1 or lower was observed, which is indeed consistent with the endpoint κOA values achieved at the highest ages in this study. OFR measurements of CCN activity of SOA formed in the OFR in Massoli et al. (2010) and Lambe et al. (2011a, b) did achieve O:C levels and eq. ages closer to the levels in this study, and continued monotonic increases in κOA with increasing O:C were reported. However, in those experiments, SOA was formed in the reactor by homogeneous nucleation of gas-phase oxidation products of injected precursors, and no organic seed aerosol was used. Therefore, the OA measured from the OFR was likely dominated by SOA formed via condensation of highly oxidized gases (with limited time for heterogeneous oxidation to occur after condensation). The gases that condense to form SOA after being oxidized in the gas phase at such high ages (up to 13–20 eq. days in those studies) are likely not representative of the molecules in typical atmospheric particles because of the excessive number of reactions with OH prior to condensation (Palm et al., 2016). The production of OA in those studies stands in contrast to the processing of the OA sampled from the OFR during GoAmazon2014/5. The OA in this study started as real ambient OA and was dominantly affected either by condensation of oxidation products of atmospherically relevant reactions with OH, or by heterogeneous (or condensed-phase) reactions with OH with minimal influence from condensation of gases (especially when using the denuder on the OFR inlet). These results suggest that heterogeneous or particle-phase reactions of OA with OH can lead to a decrease in κOA.
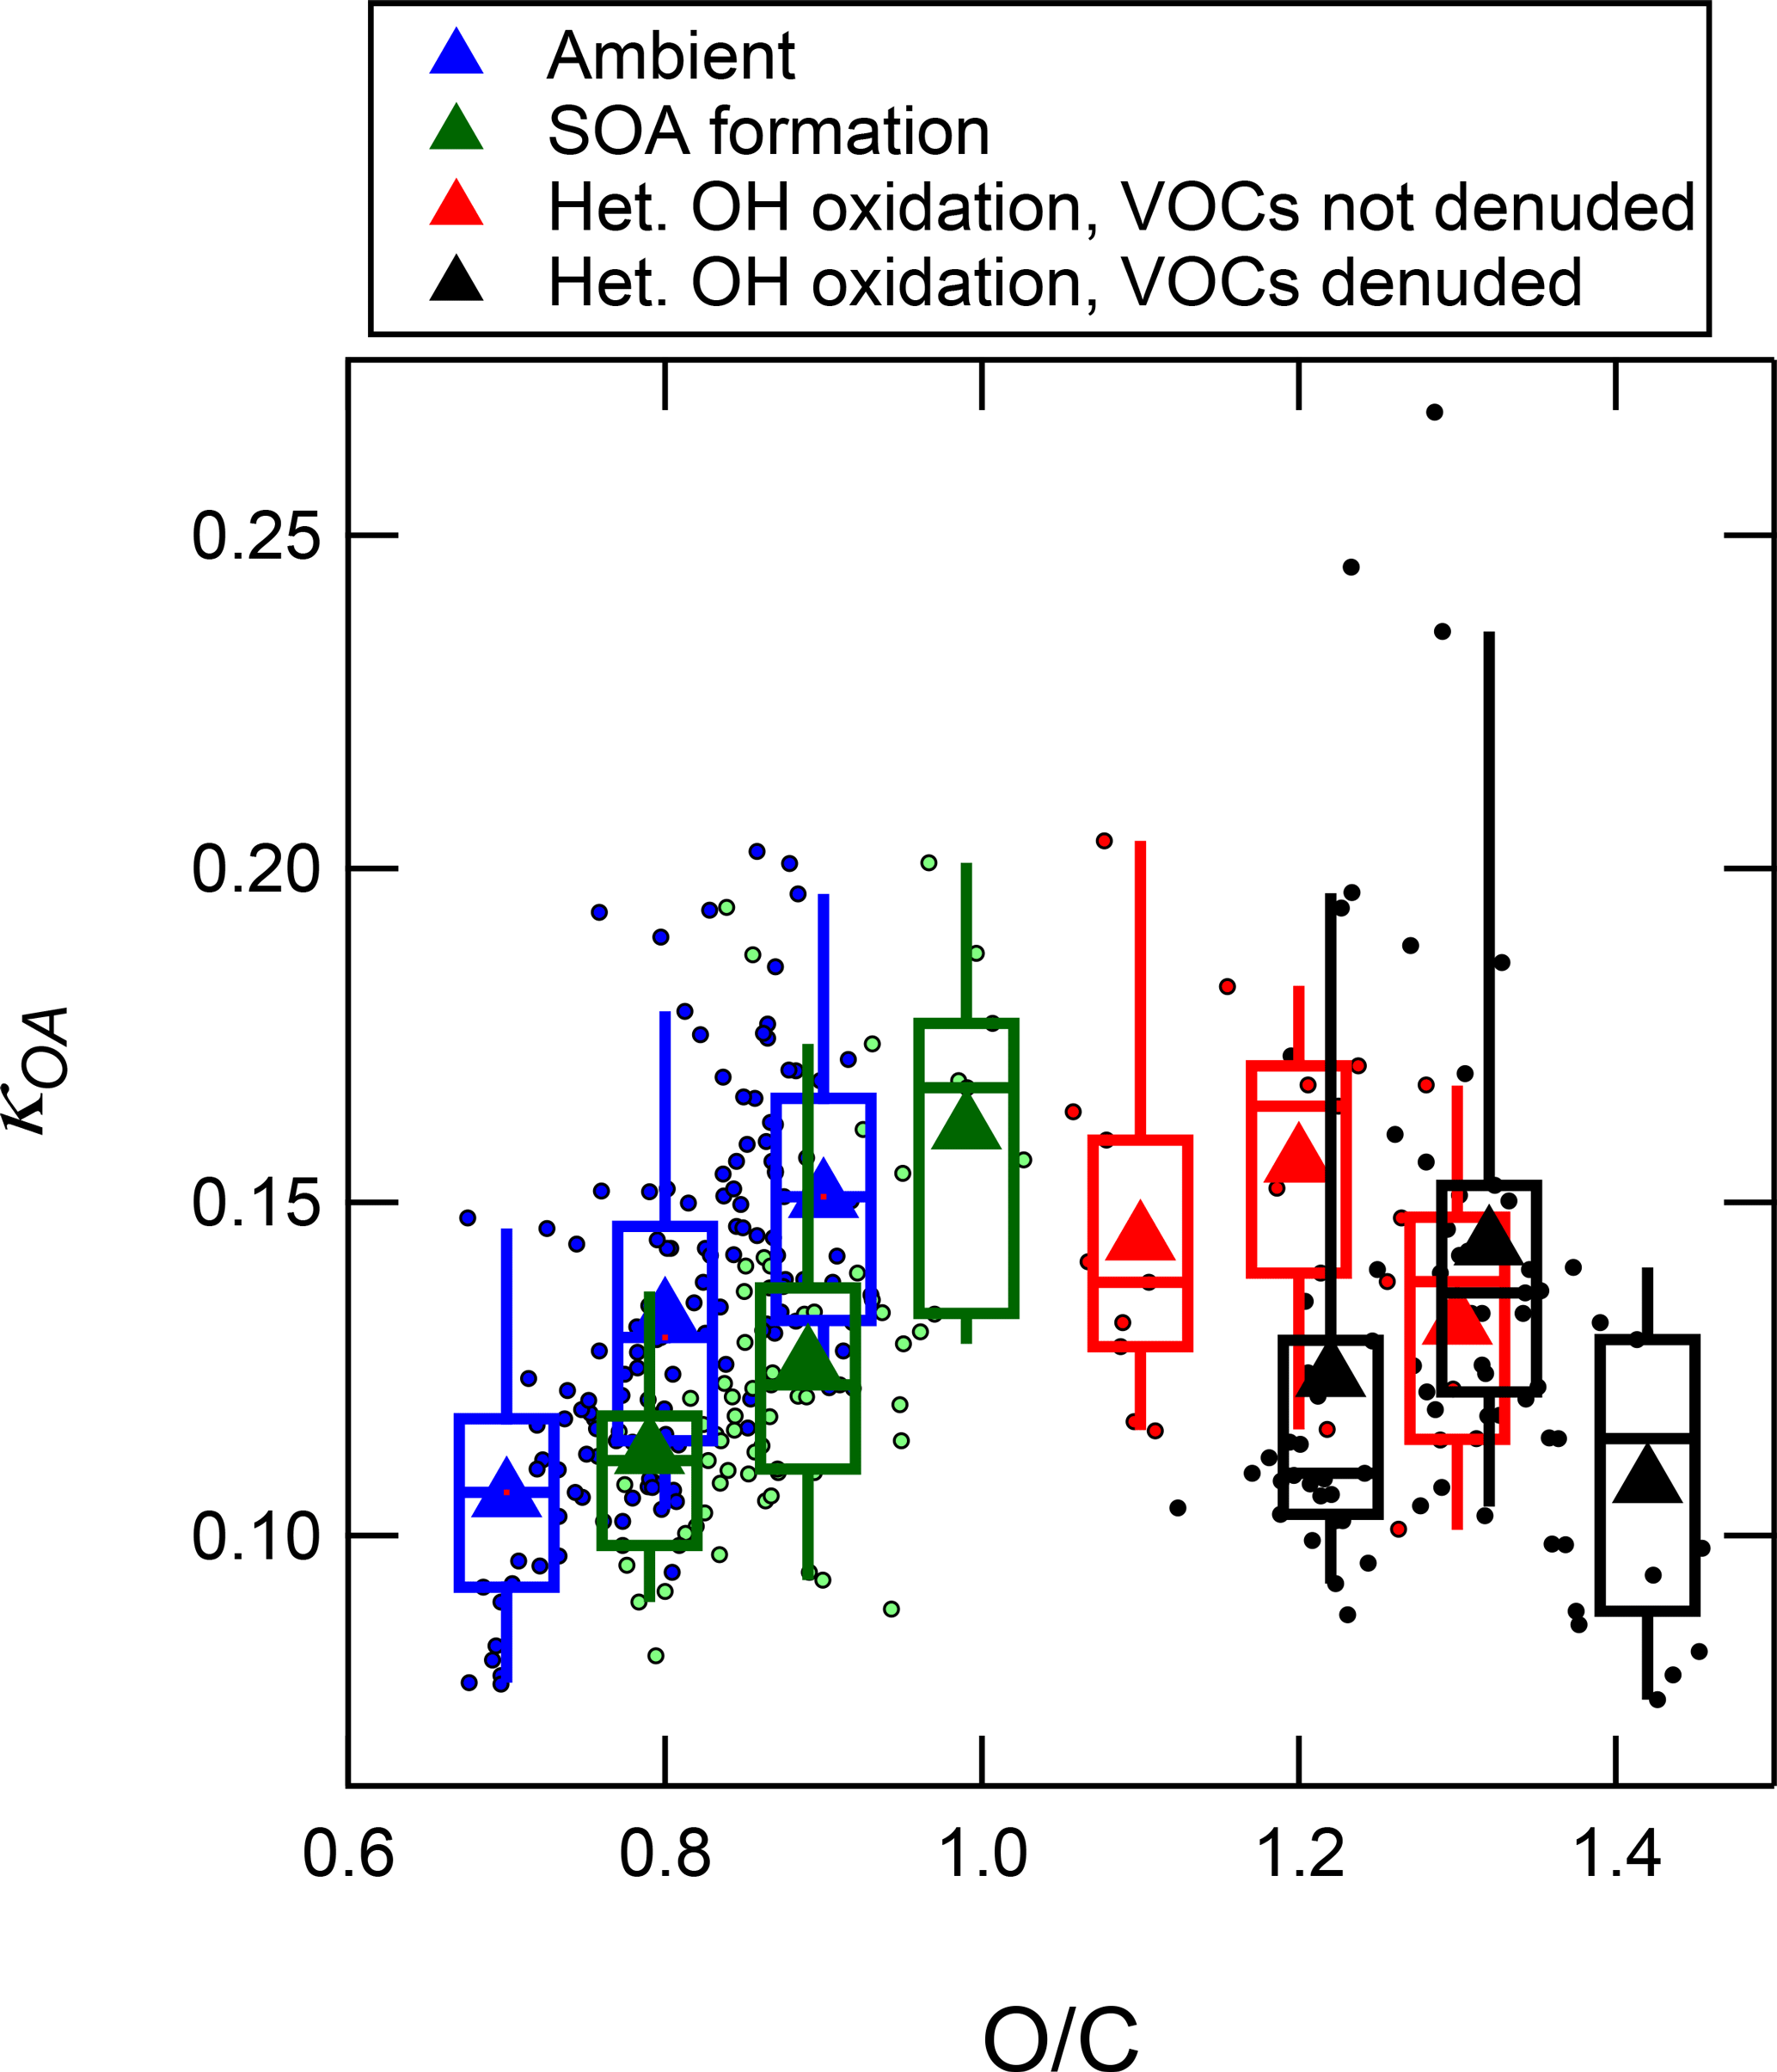
Figure 11Binned averages of hygroscopicity of OA (κOA) measured at 160 nm as a function of bulk O:C of the OA. The data include ambient data, measurements after 1–3 eq. days OH aging to sample maximum SOA formation, and measurements after 12–44 eq. days aging sampled through (or not through) a gas denuder in order to sample the result of heterogeneous oxidation of preexisting OA.
The specific processes that lead to the observed decrease in κOA due to heterogeneous oxidation are uncertain. One possible process that can lead to a decrease in CCN activity is oligomerization, causing an increase in the molecular weight and decrease in polarity of the particulate organic molecules (VanReken et al., 2005; Petters et al., 2006b; Xu et al., 2014). Oligomerization was suspected in a previous study where heating of OA in a thermodenuder led to a decrease in κOA (Kuwata et al., 2011). Other studies have shown that OH oxidation in the condensed phase can lead to oligomerization (e.g., Altieri et al., 2008; Lim et al., 2010; Sun et al., 2010; Tan et al., 2010, 2012). Similar processes may have occurred in this study.
Another possible reason for the observed decrease in κOA at high O:C could be that heterogeneous oxidation might lead to different results depending on the specific properties of the particulate organic molecules that are being oxidized. For instance, consider particles that consist of an internal mixture of molecules with relatively high κOA (i.e., highly oxidized with higher O:C, and/or smaller molecules with lower molecular weight (MW)) and molecules with relatively low κOA (i.e., less oxidized with lower O:C, and/or larger molecules with higher MW), giving some average measured κOA. Upon heterogeneous oxidation, these two general classes of organic molecules may react differently. Several scenarios could lead to the oxidized particles being enriched in the lower κOA molecules, which would decrease the average κOA of the particles. First, due to their lower MW and expected high volatilities, the molecules with relatively high κOA could preferentially evaporate from the particles after fragmentation compared with the lower κOA molecules, leaving a larger fraction of low κOA molecules in the particle. The lower κOA molecules could react to give less evaporation by either preferentially functionalizing instead of fragmenting or by starting with such low volatility that even the fragmentation products tend to have low enough volatility to remain in the particle phase. For these measurements during GoAmazon2014/5, this class of lower κOA molecules could be represented by fresh or oxidized POA (see references above) or by BBOA (e.g., Pósfai, 2004; Zhou et al., 2017). It is difficult to discern the exact reason for the decrease in κOA at high O:C in this study due to the uncertain molecular composition of ambient OA, but these measurements warrant future OFR studies to investigate the effects of heterogeneous oxidation on the CCN properties of real ambient particles.
3.8 Estimating source contributions to potential SOA using multilinear regression analysis
The results in Sect. 3.4–3.5 led to the conclusion that a dominant fraction of the SOA formation potential from oxidation of ambient air by OH, particularly during nighttime hours, was derived from gases that were not speciated or quantified during this campaign. Also, these gases could form SOA upon OH oxidation, but little or no SOA after O3 oxidation, suggesting they tended not to contain C=C bonds. These conclusions are consistent with previous measurements of the oxidation of ambient air in an OFR in pine forest air in the US Rocky Mountains (Palm et al., 2016, 2017) and in urban outflow downwind of Los Angeles (Ortega et al., 2016). In the analyses of the pine forest measurements, it was found that the unmeasured SOA-forming gases were likely to be S/IVOCs. Because the measured SOA formation correlated well with ambient MT, it was likely that the S/IVOCs were biogenic oxidation products (or were at least co-emitted with MT). With respect to ambient SOA-forming gases, the rural pine forest air system was relatively simple and was generally dominated by biogenic, terpene-related gases.
A measurement of the total concentration of S/IVOCs during GoAmazon2014/5 was not available (as is typical of most field campaigns at present). However, information can still be extracted about the main sources contributing to the SOA formation potential from S/IVOCs present in ambient air by a comparison with available VOC and/or tracer measurements. In this analysis, we make the assumption that the conclusion from the pine forest measurements, specifically that VOCs and S/IVOCs from a given emission type correlate well with tracers from that same source, will also apply to all of the emission types at the T3 site.
The T3 site of GoAmazon2014/5 was chosen because it was expected (and was shown in Kourtchev et al., 2016) to be impacted by multiple distinct types of emissions. These include regional biogenic emissions (isoprene, MT, SQT, etc.), urban emissions from the city of Manaus, and local and regional biomass burning emissions. Unlike the previously mentioned results at the pine forest or the Los Angeles area, the maximum amount of SOA formation in the OFR at T3 did not correlate well with any single SOA precursor gas, indicating the variable impacts of multiple sources. This conclusion can be drawn from the low correlations observed in the scatterplots of maximum SOA formation vs. precursors or tracers from each of the three emission types (MT, SQT (measured by SV-TAG), the sum of available biomass burning tracers, NOy, NO, isoprene, acetonitrile, benzene, toluene, xylenes, and trimethylbenzenes) shown in Figs. S14 and S15 for wet and dry seasons, respectively.
If the assumption holds that VOCs and S/IVOCs from a given emission type correlate with each other, then a multivariate relationship should exist where the measured SOA formation should correlate with the sum of measured concentration of VOCs/tracers of each source multiplied by coefficients:
where ci is the concentration of the tracer for a given SOA source type, and ai is the coefficient for tracer i that leads to the best overall agreement with measured SOA formation. The coefficients would quantify the relative contributions to potential SOA from VOCs+S/IVOCs from each source, relative to the tracer. For this analysis, we used tracer gases that were likely to be dominated by a single type of source, including MT, SQT, and isoprene for biogenic emissions, NOy for urban emissions, and the sum of several measured BB tracers (vanillin, vanillic acid, syringol, and guaiacol) for biomass burning emissions. The background concentrations of the biogenic and BB tracers in air that did not contain emissions from those sources were near zero, and those tracers were all expected to react on roughly the same timescale on which SOA formation occurred (on the order of a day or less). This makes these chosen tracers better suited for this type of analysis, since they were likely found only in the relatively fresh emissions that contain SOA-forming gases and were not measured in air after long-range transport when the potential SOA would have already been formed. NOy is not itself an SOA-forming gas, but enhancements above the background were indicative of the total exposure of the air to urban sources, and it also accounted for dilution of the air in transport to the T3 site. For this analysis, a background of 0.7 ppb NOy was subtracted before performing the multilinear regression (MLR). Longer lived tracers, such as acetonitrile and benzene, were not suitable for this analysis because their concentrations depended more on the long-term history of the air. Also, gases such as benzene, toluene, and xylene can be emitted from urban, biomass burning, and even biogenic sources, which makes them less distinct tracers of a given source type (e.g., Misztal et al., 2015).
Figure 12 illustrates the scatterplots of measured SOA formation vs. the amounts predicted by the MLR approach. The R2 values increased substantially compared to the correlations with any individual precursors, up to 0.49 (0.30) for the wet (dry) season. Also shown are the diurnal profiles of estimated contributions to potential SOA from each of the three source types. This illustrates that the MLR approach can roughly match the diurnal profile of maximum SOA formation measured in the OFR by fitting coefficients to the diurnal profiles of measured tracers.
This analysis was carried out by allowing a single, fixed coefficient value for each tracer, i.e., implicitly assuming that the ratio of total SOA-forming gases to the tracer was constant at all times of day and throughout each season. Given the natural variability of the atmosphere, this ratio is unlikely to be constant at all times (e.g., due to changing emission type compositions or degree of ambient photochemical aging). Ideally, the multilinear regression analysis could be performed as a function of time of day, which would allow the coefficient fits to vary with time of day. However, when performing the analysis this way, the correlation between independent variables rises to values sufficiently high that the multilinear fit can no longer distinguish between independent sources, and the analysis is no longer conclusive.
The average amounts and fractions of total SOA formation estimated from each of the biogenic, urban, and BB sources during each season are shown in Fig. 13a. Averages of 1.50 and 2.53 µg m−3 were formed from ambient air during the wet and dry seasons for the times where data were available for SOA formation and all tracers. Of these amounts of potential SOA, 0.73 (48 %), 0.67 (45 %), and 0.10 (7 %) µg m−3 during the wet season and 1.76 (69 %), 0.30 (12 %), and 0.47 (18 %) µg m−3 during the dry season were attributed to biogenic, urban, and BB sources, respectively. These results indicate that biogenic SOA-forming gases were the most important contributors to measured potential SOA during both seasons. Urban sources contributed more than double the mass and nearly quadruple the fraction to potential SOA during the wet season compared to the dry season. BB sources of SOA-forming gases contributed almost 5 times more potential SOA mass during the dry season compared to the wet season. For reference, Fig. S16 shows these estimated contributions compared with the amount predicted from measured VOCs as in Sect. 3.5.
Figure 12(a, b) Maximum measured SOA enhancement from OH oxidation in the OFR at the T3 site during the wet and dry seasons vs. the total amount predicted from multilinear regression analysis. (c, d) Diurnal average values of the maximum measured SOA formation from OH oxidation during each season, the amount attributed to each emission source, and the total amount predicted from all sources.
Figure 13(a) The amounts and fraction of the total SOA formation from OH oxidation in the OFR at the T3 site that were attributed to biogenic, urban, and biomass burning emission types using multilinear regression analysis. (b) Comparison of the average tracer concentrations and potential SOA formation during wet and dry seasons.
One way to help interpret these results is by comparing the average concentrations of the tracers in each season, along with the average potential SOA formation in the OFR, as shown in Fig. 13b. As expected (Martin et al., 2010), the BB tracers used in this analysis were found in much larger concentrations (∼ 20×) during the dry season, which gives confidence in the larger mass contribution (×5) of BB-related gases to potential SOA. The biogenic and NOy tracers were found in roughly equal concentrations in each season. This contrasts with the twice larger total contribution of urban SOA-forming gases during the wet season vs. twice larger for biogenic sources during the dry season. Aromatic compounds were found in somewhat higher concentrations during the dry season, but those compounds also have a major biomass burning source, and in the dry season a larger proportion of these measured compounds was represented by benzene and toluene (representing less SOA formation potential) compared to xylenes and trimethylbenzenes (representing more SOA formation potential). This suggests key differences between the average wet and dry season atmospheres. One hypothesis is that these differences could be related to changing ambient photochemistry between seasons. The 12 h average daytime solar irradiation during the wet season was 307 W m−2, which was 23 % less than the 398 W m−2 during the dry season and suggests that photochemistry in ambient air was slower during the wet season. The toluene : benzene ratio in ambient air at the T3 site was higher in the wet season (1.45) than the dry season (1.0). Since toluene reacts faster with OH radicals than benzene, a higher ratio in the wet season indicates “fresher” or less processed emissions arriving at T3 from the city of Manaus (de Gouw et al., 2005; Parrish et al., 2007). With slower ambient photochemistry, more urban SOA precursor gases could have survived the transport from Manaus, leading to higher amounts of potential urban SOA formation in the OFR. In the dry season, these gases may have already been oxidized in the atmosphere to form SOA en route to the T3 site, entering the OFR as OA and not contributing to potential SOA formation.
Stronger photochemistry could also explain the 2.4 times larger biogenic potential SOA mass during the dry season. Measurements and models in Gu et al. (2017) showed that isoprene emissions were approximately 2 times higher in the dry season than the wet season during this field campaign. We can make the assumption that other biogenic gases (including MT and SQT) also exhibited higher emissions in the dry season. The stronger photochemistry could mean that there was a shift towards a higher relative ratio of biogenic S/IVOC concentrations to primary VOC/IVOC concentrations. Since the primary biogenic gas concentrations were very similar in both seasons (shown in Fig. 13b), the possibly higher biogenic S/IVOC concentrations in the dry season could explain the larger potential SOA from that source. The very different spatial footprints of urban and biogenic emissions would then result in these different effects on potential SOA from each source at the T3 sites. Also, higher ambient OA concentrations during the dry season were expected to lead to increased SOA yields (up to 2 times larger) due to increased partitioning. This could explain a large fraction of the increased biogenic potential SOA and would affect the potential from other sources as well. These hypotheses should be tested with future modeling studies.
This analysis estimates the contributions from each of these three emission types to the concentrations of SOA-forming gases (measured and unmeasured) at the T3 site. This provides information about what types of SOA could form upon further oxidation of this air at or downwind of the T3 site. Importantly, this analysis does not provide information about what amounts or fractions of the preexisting (i.e., ambient) OA measured at the T3 site came from each of these sources. To investigate the sources of OA that impact the site and others in Amazonia, PMF analysis or other tracer analysis will be implemented in future work. However, it would seem plausible that the biogenic and biomass burning potential SOA sources observed here would also be important in formation of the OA on a regional scale, whereas the urban potential SOA source type may be more intense in the Manaus plume (within approximately the first day of transport) and less important on a regional scale.
The measurements at the T2 site were limited to a shorter period of time, and the available tracer measurements were less extensive, so multilinear analysis was not performed for the T2 site. Multilinear analysis was also not performed or needed for the SOA formation from O3 oxidation at the T3 site, since Sect. 3.5 showed that all of the potential SOA formation can be roughly accounted for using the measured VOCs. In addition, the signal-to-noise ratio of SOA formation from O3 was low, which would limit this type of analysis.
During GoAmazon2014/5, ambient air was oxidized by OH or O3 in an OFR in order to quantify (with high time resolution) the amount of potential SOA that could form from any precursors in ambient air. A range from 0 to as much as 10 µg m−3 of potential SOA was formed in the OFR. This potential SOA formation was roughly a measure of the relative concentrations of SOA-forming gases (multiplied by their SOA yields) in the atmosphere, where the gases were measured by first converting them into more easily measurable particles. The potential to form SOA from ambient air changed with time of day, from one day to the next, and between the wet and dry seasons. As has been reported for previous field campaigns in a variety of locations, there were typically more SOA precursor gases found in ambient air during nighttime than during daytime. The amount of SOA from O3 oxidation was consistent with the amount expected from the measured ambient precursors, but the amount formed from OH oxidation was up to several times larger than could be accounted for with available measured gases. This provided further evidence that the unmeasured SOA-forming gases tended to not contain C=C bonds. These results suggest that during the day the high ambient OH is already converting most SOA precursors to SOA rapidly, while at night the lack of OH allows precursors to accumulate, especially those that do not have C=C bonds and do not react with O3 or NO3. A multilinear regression analysis indicated that approximately two-thirds of the potential SOA was biogenic in origin, while the remainder was mostly urban during the wet season and an equal mix of urban and biomass burning emissions during the dry season.
For the first time, SOA yields in the OFR were measured under ambient RH and temperature conditions, ambient external OHR levels, and using ambient aerosol as seeds for condensation. With consideration to many factors that can affect the quantification of SOA yields in OFR experiments, the measurements presented herein increase the confidence of the conclusion that SOA yields in the OFR (particularly when performing measurements of the oxidation of ambient air) are similar to yields measured in large environmental chambers.
This work adds to the growing body of literature that employs an OFR to investigate SOA formation from ambient air. Such experiments are consistently suggesting that gases other than the commonly measured VOCs are ubiquitous in the atmosphere, possibly having low volatilities and/or concentrations that make them difficult to measure, but with relatively high total potential to form SOA. In order to fully understand gas-to-particle SOA formation, we need to know more about these gases, including their identity, lifetime, reaction rates, SOA yields, deposition rates, etc., in order to be able to sufficiently model aerosol concentrations on regional and global scales.
The data sets used in this publication are available at the ARM Climate Research Facility database for the GoAmazon2014/5 campaign (https://www.arm.gov/research/campaigns/amf2014goamazon). All data shown in the figures in this paper (including Supplement) can be downloaded from http://cires1.colorado.edu/jimenez/group_pubs.html.
The supplement related to this article is available online at: https://doi.org/10.5194/acp-18-467-2018-supplement.
The authors declare that they have no conflict of interest.
This article is part of the special issue “Observations and Modeling of the Green Ocean Amazon (GoAmazon2014/5) (ACP/AMT/GI/GMD inter-journal SI)”. It is not associated with a conference.
Institutional support was provided by the Central Office of the Large Scale
Biosphere Atmosphere Experiment in Amazonia (LBA), the National Institute of
Amazonian Research (INPA), and Amazonas State University (UEA). We
acknowledge support from the Atmospheric Radiation Measurement (ARM) Climate
Research Facility, a user facility of the United States Department of Energy
(DOE), Office of Science, sponsored by the Office of Biological and
Environmental Research, and support from the Atmospheric System Research
(ASR) program of that office. Additional funding was provided by the
Amazonas State Research Foundation (FAPEAM), the São Paulo State
Research Foundation (FAPESP), the USA National Science Foundation (NSF), and
the Brazilian Scientific Mobility Program (CsF/CAPES). The research was
conducted under scientific license 001030/2012-4 of the Brazilian National
Council for Scientific and Technological Development (CNPq). This research
was supported by the U.S. Department of Energy's (DOE) Atmospheric Science
Program (Office of Science, BER, grant nos. DE-SC0016559 and DE-SC0011105),
and the DOE SBIR program (DE-SC0011218), as well as NSF AGS-1360834 and EPA
STAR 83587701-0. Brett B. Palm is grateful for an EPA STAR graduate fellowship
(FP-91761701-0). This manuscript has not been reviewed by EPA and no
endorsement should be inferred. A portion of this research was performed
using EMSL, a DOE Office of Science User Facility sponsored by the office of
Biological and Environmental Research and located at Pacific Northwest
National Laboratory. We thank Francesco Canonaco for providing the SoFi
software. Gabriel Isaacman-VanWertz was supported by the NSF Graduate Research Fellowship
(no. DGE 1106400). SV-TAG data collection was made possible by NSF
Atmospheric Chemistry Program 1332998, with instrument development supported
by U.S. Department of Energy (DOE) SBIR grant DE-SC0004698. We thank
Demetrios Pagonis for assistance in the use of his tubing delay model.
Edited by: Thomas Karl
Reviewed by: two anonymous referees
Aiken, A. C., Salcedo, D., Cubison, M. J., Huffman, J. A., DeCarlo, P. F., Ulbrich, I. M., Docherty, K. S., Sueper, D., Kimmel, J. R., Worsnop, D. R., Trimborn, A., Northway, M., Stone, E. A., Schauer, J. J., Volkamer, R. M., Fortner, E., de Foy, B., Wang, J., Laskin, A., Shutthanandan, V., Zheng, J., Zhang, R., Gaffney, J., Marley, N. A., Paredes-Miranda, G., Arnott, W. P., Molina, L. T., Sosa, G., and Jimenez, J. L.: Mexico City aerosol analysis during MILAGRO using high resolution aerosol mass spectrometry at the urban supersite (T0) – Part 1: Fine particle composition and organic source apportionment, Atmos. Chem. Phys., 9, 6633–6653, https://doi.org/10.5194/acp-9-6633-2009, 2009.
Altieri, K. E., Seitzinger, S. P., Carlton, A. G., Turpin, B. J., Klein, G. C., and Marshall, A. G.: Oligomers formed through in-cloud methylglyoxal reactions: Chemical composition, properties, and mechanisms investigated by ultra-high resolution FT-ICR mass spectrometry, Atmos. Environ., 42, 1476–1490, https://doi.org/10.1016/j.atmosenv.2007.11.015, 2008.
Atkinson, R. and Arey, J.: Gas-phase tropospheric chemistry of biogenic volatile organic compounds: a review, Atmos. Environ., 37, 197–219, https://doi.org/10.1016/S1352-2310(03)00391-1, 2003.
Bateman, A. P., Gong, Z., Liu, P., Sato, B., Cirino, G., Zhang, Y., Artaxo, P., Bertram, A. K., Manzi, A. O., Rizzo, L. V., Souza, R. A. F., Zaveri, R. A., and Martin, S. T.: Sub-micrometre particulate matter is primarily in liquid form over Amazon rainforest, Nat. Geosci., 9, 34–37, https://doi.org/10.1038/ngeo2599, 2015.
Bruns, E. A., El Haddad, I., Keller, A., Klein, F., Kumar, N. K., Pieber, S. M., Corbin, J. C., Slowik, J. G., Brune, W. H., Baltensperger, U., and Prévôt, A. S. H.: Inter-comparison of laboratory smog chamber and flow reactor systems on organic aerosol yield and composition, Atmos. Meas. Tech., 8, 2315–2332, https://doi.org/10.5194/amt-8-2315-2015, 2015.
Budisulistiorini, S. H., Li, X., Bairai, S. T., Renfro, J., Liu, Y., Liu, Y. J., McKinney, K. A., Martin, S. T., McNeill, V. F., Pye, H. O. T., Nenes, A., Neff, M. E., Stone, E. A., Mueller, S., Knote, C., Shaw, S. L., Zhang, Z., Gold, A., and Surratt, J. D.: Examining the effects of anthropogenic emissions on isoprene-derived secondary organic aerosol formation during the 2013 Southern Oxidant and Aerosol Study (SOAS) at the Look Rock, Tennessee ground site, Atmos. Chem. Phys., 15, 8871–8888, https://doi.org/10.5194/acp-15-8871-2015, 2015.
Canagaratna, M. R., Jayne, J. T., Jimenez, J. L., Allan, J. D., Alfarra, M. R., Zhang, Q., Onasch, T. B., Drewnick, F., Coe, H., Middlebrook, A., Delia, A., Williams, L. R., Trimborn, A. M., Northway, M. J., DeCarlo, P. F., Kolb, C. E., Davidovits, P., and Worsnop, D. R.: Chemical and microphysical characterization of ambient aerosols with the aerodyne aerosol mass spectrometer, Mass Spectrom. Rev., 26, 185–222, https://doi.org/10.1002/mas.20115, 2007.
Canonaco, F., Crippa, M., Slowik, J. G., Baltensperger, U., and Prévôt, A. S. H.: SoFi, an IGOR-based interface for the efficient use of the generalized multilinear engine (ME-2) for the source apportionment: ME-2 application to aerosol mass spectrometer data, Atmos. Meas. Tech., 6, 3649–3661, https://doi.org/10.5194/amt-6-3649-2013, 2013.
Cappa, C. D., Che, D. L., Kessler, S. H., Kroll, J. H., and Wilson, K. R.: Variations in organic aerosol optical and hygroscopic properties upon heterogeneous OH oxidation, J. Geophys. Res., 116, D15204, https://doi.org/10.1029/2011JD015918, 2011.
Chan, A. W. H., Kreisberg, N. M., Hohaus, T., Campuzano-Jost, P., Zhao, Y., Day, D. A., Kaser, L., Karl, T., Hansel, A., Teng, A. P., Ruehl, C. R., Sueper, D. T., Jayne, J. T., Worsnop, D. R., Jimenez, J. L., Hering, S. V., and Goldstein, A. H.: Speciated measurements of semivolatile and intermediate volatility organic compounds (S/IVOCs) in a pine forest during BEACHON-RoMBAS 2011, Atmos. Chem. Phys., 16, 1187–1205, https://doi.org/10.5194/acp-16-1187-2016, 2016.
Chen, Q., Farmer, D. K., Schneider, J., Zorn, S. R., Heald, C. L., Karl, T. G., Guenther, A., Allan, J. D., Robinson, N., Coe, H., Kimmel, J. R., Pauliquevis, T., Borrmann, S., Pöschl, U., Andreae, M. O., Artaxo, P., Jimenez, J. L., and Martin, S. T.: Mass spectral characterization of submicron biogenic organic particles in the Amazon Basin, Geophys. Res. Lett., 36, L20806, https://doi.org/10.1029/2009GL039880, 2009.
Chen, Q., Li, Y. L., McKinney, K. A., Kuwata, M., and Martin, S. T.: Particle mass yield from β-caryophyllene ozonolysis, Atmos. Chem. Phys., 12, 3165–3179, https://doi.org/10.5194/acp-12-3165-2012, 2012.
Chen, Q., Farmer, D. K., Rizzo, L. V., Pauliquevis, T., Kuwata, M., Karl, T. G., Guenther, A., Allan, J. D., Coe, H., Andreae, M. O., Pöschl, U., Jimenez, J. L., Artaxo, P., and Martin, S. T.: Submicron particle mass concentrations and sources in the Amazonian wet season (AMAZE-08), Atmos. Chem. Phys., 15, 3687–3701, https://doi.org/10.5194/acp-15-3687-2015, 2015.
Cross, E. S., Hunter, J. F., Carrasquillo, A. J., Franklin, J. P., Herndon, S. C., Jayne, J. T., Worsnop, D. R., Miake-Lye, R. C., and Kroll, J. H.: Online measurements of the emissions of intermediate-volatility and semi-volatile organic compounds from aircraft, Atmos. Chem. Phys., 13, 7845–7858, https://doi.org/10.5194/acp-13-7845-2013, 2013.
Crump, J. G. and Seinfeld, J. H.: Turbulent deposition and gravitational sedimentation of an aerosol in a vessel of arbitrary shape, J. Aerosol Sci., 12, 405–415, https://doi.org/10.1016/0021-8502(81)90036-7, 1981.
de Gouw, J. A., Middlebrook, A. M., Warneke, C., Goldan, P. D., Kuster, W. C., Roberts, J. M., Fehsenfeld, F. C., Worsnop, D. R., Canagaratna, M. R., Pszenny, A. A. P., Keene, W. C., Marchewka, M. L., Bertman, S. B., and Bates, T. S.: Budget of organic carbon in a polluted atmosphere: Results from the New England Air Quality Study in 2002, J. Geophys. Res., 110, D16305, https://doi.org/10.1029/2004JD005623, 2005.
de Sá, S. S., Palm, B. B., Campuzano-Jost, P., Day, D. A., Hu, W. W., Isaacman-VanWertz, G., Yee, L. D., Brito, J., Carbone, S., Cirino, G. G., Liu, Y., Thalman, R., Funk, A., Schumacher, C., Shilling, J. E., Artaxo, P., Goldstein, A. H., Souza, R. A. F., Wang, J., McKinney, K., Barbosa, H., Alexander, M. L., Jimenez, J. L., and Martin, S. T.: Urban influence on the concentration and composition of submicron particulate matter in central Amazonia, in preparation, 2017a.
de Sá, S. S., Palm, B. B., Campuzano-Jost, P., Day, D. A., Newburn, M. K., Hu, W., Isaacman-VanWertz, G., Yee, L. D., Thalman, R., Brito, J., Carbone, S., Artaxo, P., Goldstein, A. H., Manzi, A. O., Souza, R. A. F., Mei, F., Shilling, J. E., Springston, S. R., Wang, J., Surratt, J. D., Alexander, M. L., Jimenez, J. L., and Martin, S. T.: Influence of urban pollution on the production of organic particulate matter from isoprene epoxydiols in central Amazonia, Atmos. Chem. Phys., 17, 6611–6629, https://doi.org/10.5194/acp-17-6611-2017, 2017b.
DeCarlo, P. F., Kimmel, J. R., Trimborn, A., Northway, M. J., Jayne, J. T., Aiken, A. C., Gonin, M., Fuhrer, K., Horvath, T., Docherty, K. S., Worsnop, D. R., and Jimenez, J. L.: Field-Deployable, High-Resolution, Time-of-Flight Aerosol Mass Spectrometer, Anal. Chem., 78, 8281–8289, https://doi.org/10.1021/ac061249n, 2006.
Donahue, N. M., Chuang, W., Epstein, S. A., Kroll, J. H., Worsnop, D. R., Robinson, A. L., Adams, P. J., and Pandis, S. N.: Why do organic aerosols exist? Understanding aerosol lifetimes using the two-dimensional volatility basis set, Environ. Chem., 10, 151, https://doi.org/10.1071/EN13022, 2013.
Dzepina, K., Volkamer, R. M., Madronich, S., Tulet, P., Ulbrich, I. M., Zhang, Q., Cappa, C. D., Ziemann, P. J., and Jimenez, J. L.: Evaluation of recently-proposed secondary organic aerosol models for a case study in Mexico City, Atmos. Chem. Phys., 9, 5681–5709, https://doi.org/10.5194/acp-9-5681-2009, 2009.
Eddingsaas, N. C., VanderVelde, D. G., and Wennberg, P. O.: Kinetics and Products of the Acid-Catalyzed Ring-Opening of Atmospherically Relevant Butyl Epoxy Alcohols, J. Phys. Chem. A, 114, 8106–8113, https://doi.org/10.1021/jp103907c, 2010.
Edwards, P. M., Evans, M. J., Furneaux, K. L., Hopkins, J., Ingham, T., Jones, C., Lee, J. D., Lewis, A. C., Moller, S. J., Stone, D., Whalley, L. K., and Heard, D. E.: OH reactivity in a South East Asian tropical rainforest during the Oxidant and Particle Photochemical Processes (OP3) project, Atmos. Chem. Phys., 13, 9497–9514, https://doi.org/10.5194/acp-13-9497-2013, 2013.
Ehn, M., Thornton, J. A., Kleist, E., Sipilä, M., Junninen, H., Pullinen, I., Springer, M., Rubach, F., Tillmann, R., Lee, B., Lopez-Hilfiker, F., Andres, S., Acir, I.-H., Rissanen, M., Jokinen, T., Schobesberger, S., Kangasluoma, J., Kontkanen, J., Nieminen, T., Kurtén, T., Nielsen, L. B., Jørgensen, S., Kjaergaard, H. G., Canagaratna, M., Maso, M. D., Berndt, T., Petäjä, T., Wahner, A., Kerminen, V.-M., Kulmala, M., Worsnop, D. R., Wildt, J., and Mentel, T. F.: A large source of low-volatility secondary organic aerosol, Nature, 506, 476–479, https://doi.org/10.1038/nature13032, 2014.
Froyd, K. D., Murphy, S. M., Murphy, D. M., de Gouw, J. A., Eddingsaas, N. C., and Wennberg, P. O.: Contribution of isoprene-derived organosulfates to free tropospheric aerosol mass, P. Natl. Acad. Sci., 107, 21360–21365, https://doi.org/10.1073/pnas.1012561107, 2010.
George, I. J. and Abbatt, J. P. D.: Heterogeneous oxidation of atmospheric aerosol particles by gas-phase radicals., Nat. Chem., 2, 713–722, https://doi.org/10.1038/nchem.806, 2010.
George, I. J., Chang, R. Y.-W., Danov, V., Vlasenko, A., and Abbatt, J. P. D.: Modification of cloud condensation nucleus activity of organic aerosols by hydroxyl radical heterogeneous oxidation, Atmos. Environ., 43, 5038–5045, https://doi.org/10.1016/j.atmosenv.2009.06.043, 2009.
Goldstein, A. H. and Galbally, I. E.: Known and Unexplored Organic Constituents in the Earth's Atmosphere, Environ. Sci. Technol., 41, 1514–1521, https://doi.org/10.1021/es072476p, 2007.
Gu, D., Guenther, A. B., Shilling, J. E., Yu, H., Huang, M., Zhao, C., Yang, Q., Martin, S. T., Artaxo, P., Kim, S., Seco, R., Stavrakou, T., Longo, K. M., Tóta, J., de Souza, R. A. F., Vega, O., Liu, Y., Shrivastava, M., Alves, E. G., Santos, F. C., Leng, G., and Hu, Z.: Airborne observations reveal elevational gradient in tropical forest isoprene emissions, Nat. Commun., 8, 15541, https://doi.org/10.1038/ncomms15541, 2017.
Henze, D. K. and Seinfeld, J. H.: Global secondary organic aerosol from isoprene oxidation, Geophys. Res. Lett., 33, L09812, https://doi.org/10.1029/2006GL025976, 2006.
Hodzic, A., Jimenez, J. L., Madronich, S., Canagaratna, M. R., DeCarlo, P. F., Kleinman, L., and Fast, J.: Modeling organic aerosols in a megacity: potential contribution of semi-volatile and intermediate volatility primary organic compounds to secondary organic aerosol formation, Atmos. Chem. Phys., 10, 5491–5514, https://doi.org/10.5194/acp-10-5491-2010, 2010.
Hu, W., Palm, B. B., Day, D. A., Campuzano-Jost, P., Krechmer, J. E., Peng, Z., de Sá, S. S., Martin, S. T., Alexander, M. L., Baumann, K., Hacker, L., Kiendler-Scharr, A., Koss, A. R., de Gouw, J. A., Goldstein, A. H., Seco, R., Sjostedt, S. J., Park, J.-H., Guenther, A. B., Kim, S., Canonaco, F., Prévôt, A. S. H., Brune, W. H., and Jimenez, J. L.: Volatility and lifetime against OH heterogeneous reaction of ambient isoprene-epoxydiols-derived secondary organic aerosol (IEPOX-SOA), Atmos. Chem. Phys., 16, 11563–11580, https://doi.org/10.5194/acp-16-11563-2016, 2016.
Hu, W. W., Campuzano-Jost, P., Palm, B. B., Day, D. A., Ortega, A. M., Hayes, P. L., Krechmer, J. E., Chen, Q., Kuwata, M., Liu, Y. J., de Sá, S. S., McKinney, K., Martin, S. T., Hu, M., Budisulistiorini, S. H., Riva, M., Surratt, J. D., St. Clair, J. M., Isaacman-Van Wertz, G., Yee, L. D., Goldstein, A. H., Carbone, S., Brito, J., Artaxo, P., de Gouw, J. A., Koss, A., Wisthaler, A., Mikoviny, T., Karl, T., Kaser, L., Jud, W., Hansel, A., Docherty, K. S., Alexander, M. L., Robinson, N. H., Coe, H., Allan, J. D., Canagaratna, M. R., Paulot, F., and Jimenez, J. L.: Characterization of a real-time tracer for isoprene epoxydiols-derived secondary organic aerosol (IEPOX-SOA) from aerosol mass spectrometer measurements, Atmos. Chem. Phys., 15, 11807–11833, https://doi.org/10.5194/acp-15-11807-2015, 2015.
Hunter, J. F., Day, D. A., Palm, B. B., Yatavelli, R. L. N., Chan, A. W. H., Kaser, L., Cappellin, L., Hayes, P. L., Cross, E. S., Carrasquillo, A. J., Campuzano-Jost, P., Stark, H., Zhao, Y., Hohaus, T., Smith, J. N., Hansel, A., Karl, T., Goldstein, A. H., Guenther, A., Worsnop, D. R., Thornton, J. A., Heald, C. L., Jimenez, J. L., and Kroll, J. H.: Comprehensive characterization of atmospheric organic carbon at a forested site, Nat. Geosci., 10, 748–753, https://doi.org/10.1038/ngeo3018, 2017.
IPCC: IPCC 2013: Climate Change 2013: The Physical Science Basis. Contribution of Working Group I to the Fifth Assessment Report of the Intergovernmental Panel on Climate Change, edited by: Stocker, T. F., Qin, D., Plattner, G., Tignor, M., Allen, S. K., Bex, V., and Midgley, P. M., Cambridge University Press, Cambridge, United Kingdom and New York, NY, USA, 2013.
Isaacman, G., Kreisberg, N. M., Yee, L. D., Worton, D. R., Chan, A. W. H., Moss, J. A., Hering, S. V., and Goldstein, A. H.: Online derivatization for hourly measurements of gas- and particle-phase semi-volatile oxygenated organic compounds by thermal desorption aerosol gas chromatography (SV-TAG), Atmos. Meas. Tech., 7, 4417–4429, https://doi.org/10.5194/amt-7-4417-2014, 2014.
Jaoui, M., Leungsakul, S., and Kamens, R. M.: Gas and Particle Products Distribution from the Reaction of β-Caryophyllene with Ozone, J. Atmos. Chem., 45, 261–287, https://doi.org/10.1023/A:1024263430285, 2003.
Jaoui, M., Kleindienst, T. E., Docherty, K. S., Lewandowski, M., and Offenberg, J. H.: Secondary organic aerosol formation from the oxidation of a series of sesquiterpenes: α-cedrene, β-caryophyllene, α-humulene and α-farnesene with O3, OH and NO3 radicals, Environ. Chem., 10, 178, https://doi.org/10.1071/EN13025, 2013.
Jardine, A. B., Jardine, K. J., Fuentes, J. D., Martin, S. T., Martins, G., Durgante, F., Carneiro, V., Higuchi, N., Manzi, A. O., and Chambers, J. Q.: Highly reactive light-dependent monoterpenes in the Amazon, Geophys. Res. Lett., 42, 1576–1583, https://doi.org/10.1002/2014GL062573, 2015.
Jathar, S. H., Farina, S. C., Robinson, A. L., and Adams, P. J.: The influence of semi-volatile and reactive primary emissions on the abundance and properties of global organic aerosol, Atmos. Chem. Phys., 11, 7727–7746, https://doi.org/10.5194/acp-11-7727-2011, 2011.
Jimenez, J. L., Canagaratna, M. R., Donahue, N. M., Prevot, A. S. H., Zhang, Q., Kroll, J. H., DeCarlo, P. F., Allan, J. D., Coe, H., Ng, N. L., Aiken, A. C., Docherty, K. S., Ulbrich, I. M., Grieshop, A. P., Robinson, A. L., Duplissy, J., Smith, J. D., Wilson, K. R., Lanz, V. A., Hueglin, C., Sun, Y. L., Tian, J., Laaksonen, A., Raatikainen, T., Rautiainen, J., Vaattovaara, P., Ehn, M., Kulmala, M., Tomlinson, J. M., Collins, D. R., Cubison, M. J., Dunlea, J., Huffman, J. A., Onasch, T. B., Alfarra, M. R., Williams, P. I., Bower, K., Kondo, Y., Schneider, J., Drewnick, F., Borrmann, S., Weimer, S., Demerjian, K., Salcedo, D., Cottrell, L., Griffin, R., Takami, A., Miyoshi, T., Hatakeyama, S., Shimono, A., Sun, J. Y., Zhang, Y. M., Dzepina, K., Kimmel, J. R., Sueper, D., Jayne, J. T., Herndon, S. C., Trimborn, A. M., Williams, L. R., Wood, E. C., Middlebrook, A. M., Kolb, C. E., Baltensperger, U., and Worsnop, D. R.: Evolution of Organic Aerosols in the Atmosphere, Science, 326, 1525–1529, https://doi.org/10.1126/science.1180353, 2009.
Jordan, A., Haidacher, S., Hanel, G., Hartungen, E., Märk, L., Seehauser, H., Schottkowsky, R., Sulzer, P., and Märk, T. D.: A high resolution and high sensitivity proton-transfer-reaction time-of-flight mass spectrometer (PTR-TOF-MS), Int. J. Mass Spectrom., 286, 122–128, https://doi.org/10.1016/j.ijms.2009.07.005, 2009a.
Jordan, A., Haidacher, S., Hanel, G., Hartungen, E., Herbig, J., Märk, L., Schottkowsky, R., Seehauser, H., Sulzer, P., and Märk, T. D.: An online ultra-high sensitivity Proton-transfer-reaction mass-spectrometer combined with switchable reagent ion capability (PTR+SRI-MS), Int. J. Mass Spectrom., 286, 32–38, https://doi.org/10.1016/j.ijms.2009.06.006, 2009b.
Kang, E., Root, M. J., Toohey, D. W., and Brune, W. H.: Introducing the concept of Potential Aerosol Mass (PAM), Atmos. Chem. Phys., 7, 5727–5744, https://doi.org/10.5194/acp-7-5727-2007, 2007.
Kourtchev, I., Godoi, R. H. M., Connors, S., Levine, J. G., Archibald, A. T., Godoi, A. F. L., Paralovo, S. L., Barbosa, C. G. G., Souza, R. A. F., Manzi, A. O., Seco, R., Sjostedt, S., Park, J.-H., Guenther, A., Kim, S., Smith, J., Martin, S. T., and Kalberer, M.: Molecular composition of organic aerosols in central Amazonia: an ultra-high-resolution mass spectrometry study, Atmos. Chem. Phys., 16, 11899–11913, https://doi.org/10.5194/acp-16-11899-2016, 2016.
Krechmer, J. E., Coggon, M. M., Massoli, P., Nguyen, T. B., Crounse, J. D., Hu, W., Day, D. A., Tyndall, G. S., Henze, D. K., Rivera-Rios, J. C., Nowak, J. B., Kimmel, J. R., Mauldin, R. L., Stark, H., Jayne, J. T., Sipilä, M., Junninen, H., Clair, J. M. St., Zhang, X., Feiner, P. A., Zhang, L., Miller, D. O., Brune, W. H., Keutsch, F. N., Wennberg, P. O., Seinfeld, J. H., Worsnop, D. R., Jimenez, J. L., and Canagaratna, M. R.: Formation of Low Volatility Organic Compounds and Secondary Organic Aerosol from Isoprene Hydroxyhydroperoxide Low-NO Oxidation, Environ. Sci. Technol., 49, 10330–10339, https://doi.org/10.1021/acs.est.5b02031, 2015.
Kuwata, M., Chen, Q., and Martin, S. T.: Cloud condensation nuclei (CCN) activity and oxygen-to-carbon elemental ratios following thermodenuder treatment of organic particles grown by α-pinene ozonolysis, Phys. Chem. Chem. Phys., 13, 14571, https://doi.org/10.1039/c1cp20253g, 2011.
La, Y. S., Camredon, M., Ziemann, P. J., Valorso, R., Matsunaga, A., Lannuque, V., Lee-Taylor, J., Hodzic, A., Madronich, S., and Aumont, B.: Impact of chamber wall loss of gaseous organic compounds on secondary organic aerosol formation: explicit modeling of SOA formation from alkane and alkene oxidation, Atmos. Chem. Phys., 16, 1417–1431, https://doi.org/10.5194/acp-16-1417-2016, 2016.
Lambe, A. T. and Jimenez, J. L.: PAM Wiki, available at: https://sites.google.com/site/pamwiki/ (last access: August 2017), 2017.
Lambe, A. T., Ahern, A. T., Williams, L. R., Slowik, J. G., Wong, J. P. S., Abbatt, J. P. D., Brune, W. H., Ng, N. L., Wright, J. P., Croasdale, D. R., Worsnop, D. R., Davidovits, P., and Onasch, T. B.: Characterization of aerosol photooxidation flow reactors: heterogeneous oxidation, secondary organic aerosol formation and cloud condensation nuclei activity measurements, Atmos. Meas. Tech., 4, 445–461, https://doi.org/10.5194/amt-4-445-2011, 2011a.
Lambe, A. T., Onasch, T. B., Massoli, P., Croasdale, D. R., Wright, J. P., Ahern, A. T., Williams, L. R., Worsnop, D. R., Brune, W. H., and Davidovits, P.: Laboratory studies of the chemical composition and cloud condensation nuclei (CCN) activity of secondary organic aerosol (SOA) and oxidized primary organic aerosol (OPOA), Atmos. Chem. Phys., 11, 8913–8928, https://doi.org/10.5194/acp-11-8913-2011, 2011b.
Lambe, A. T., Onasch, T. B., Croasdale, D. R., Wright, J. P., Martin, A. T., Franklin, J. P., Massoli, P., Kroll, J. H., Canagaratna, M. R., Brune, W. H., Worsnop, D. R., and Davidovits, P.: Transitions from Functionalization to Fragmentation Reactions of Laboratory Secondary Organic Aerosol (SOA) Generated from the OH Oxidation of Alkane Precursors, Environ. Sci. Technol., 46, 5430–5437, https://doi.org/10.1021/es300274t, 2012.
Lambe, A. T., Chhabra, P. S., Onasch, T. B., Brune, W. H., Hunter, J. F., Kroll, J. H., Cummings, M. J., Brogan, J. F., Parmar, Y., Worsnop, D. R., Kolb, C. E., and Davidovits, P.: Effect of oxidant concentration, exposure time, and seed particles on secondary organic aerosol chemical composition and yield, Atmos. Chem. Phys., 15, 3063–3075, https://doi.org/10.5194/acp-15-3063-2015, 2015.
Lane, T. E., Donahue, N. M., and Pandis, S. N.: Effect of NOx on secondary organic aerosol concentrations, Environ. Sci. Technol., 42, 6022–6027, https://doi.org/10.1021/Es703225a, 2008a.
Lane, T. E., Donahue, N. M., and Pandis, S. N.: Simulating secondary organic aerosol formation using the volatility basis-set approach in a chemical transport model, Atmos. Environ., 42, 7439–7451, https://doi.org/10.1016/j.atmosenv.2008.06.026, 2008b.
Li, R., Palm, B. B., Ortega, A. M., Hlywiak, J., Hu, W., Peng, Z., Day, D. A., Knote, C., Brune, W. H., de Gouw, J. A., and Jimenez, J. L.: Modeling the Radical Chemistry in an Oxidation Flow Reactor: Radical Formation and Recycling, Sensitivities, and the OH Exposure Estimation Equation, J. Phys. Chem. A, 119, 4418–4432, https://doi.org/10.1021/jp509534k, 2015.
Liao, J., Froyd, K. D., Murphy, D. M., Keutsch, F. N., Yu, G., Wennberg, P. O., St. Clair, J. M., Crounse, J. D., Wisthaler, A., Mikoviny, T., Jimenez, J. L., Campuzano-Jost, P., Day, D. A., Hu, W., Ryerson, T. B., Pollack, I. B., Peischl, J., Anderson, B. E., Ziemba, L. D., Blake, D. R., Meinardi, S., and Diskin, G.: Airborne measurements of organosulfates over the continental U.S., J. Geophys. Res.-Atmos., 120, 2990–3005, https://doi.org/10.1002/2014JD022378, 2015.
Lim, Y. B., Tan, Y., Perri, M. J., Seitzinger, S. P., and Turpin, B. J.: Aqueous chemistry and its role in secondary organic aerosol (SOA) formation, Atmos. Chem. Phys., 10, 10521–10539, https://doi.org/10.5194/acp-10-10521-2010, 2010.
Lin, Y.-H., Zhang, Z., Docherty, K. S., Zhang, H., Budisulistiorini, S. H., Rubitschun, C. L., Shaw, S. L., Knipping, E. M., Edgerton, E. S., Kleindienst, T. E., Gold, A., and Surratt, J. D.: Isoprene Epoxydiols as Precursors to Secondary Organic Aerosol Formation: Acid-Catalyzed Reactive Uptake Studies with Authentic Compounds, Environ. Sci. Technol., 46, 250–258, https://doi.org/10.1021/es202554c, 2012.
Lindinger, W., Hansel, A., and Jordan, A.: On-line monitoring of volatile organic compounds at pptv levels by means of proton-transfer-reaction mass spectrometry (PTR-MS) medical applications, food control and environmental research, Int. J. Mass Spectrom. Ion Process., 173, 191–241, https://doi.org/10.1016/S0168-1176(97)00281-4, 1998.
Liu, Y., Brito, J., Dorris, M. R., Rivera-Rios, J. C., Seco, R., Bates, K. H., Artaxo, P., Duvoisin, S., Keutsch, F. N., Kim, S., Goldstein, A. H., Guenther, A. B., Manzi, A. O., Souza, R. A. F., Springston, S. R., Watson, T. B., McKinney, K. A., and Martin, S. T.: Isoprene photochemistry over the Amazon rainforest, P. Natl. Acad. Sci., 113, 6125–6130, https://doi.org/10.1073/pnas.1524136113, 2016.
Mao, J., Ren, X., Brune, W. H., Olson, J. R., Crawford, J. H., Fried, A., Huey, L. G., Cohen, R. C., Heikes, B., Singh, H. B., Blake, D. R., Sachse, G. W., Diskin, G. S., Hall, S. R., and Shetter, R. E.: Airborne measurement of OH reactivity during INTEX-B, Atmos. Chem. Phys., 9, 163–173, https://doi.org/10.5194/acp-9-163-2009, 2009.
Martin, S. T., Andreae, M. O., Artaxo, P., Baumgardner, D., Chen, Q., Goldstein, A. H., Guenther, A., Heald, C. L., Mayol-Bracero, O. L., McMurry, P. H., Pauliquevis, T., Pöschl, U., Prather, K. A., Roberts, G. C., Saleska, S. R., Silva Dias, M. A., Spracklen, D. V., Swietlicki, E., and Trebs, I.: Sources and properties of Amazonian aerosol particles, Rev. Geophys., 48, RG2002, https://doi.org/10.1029/2008RG000280, 2010.
Martin, S. T., Artaxo, P., Machado, L. A. T., Manzi, A. O., Souza, R. A. F., Schumacher, C., Wang, J., Andreae, M. O., Barbosa, H. M. J., Fan, J., Fisch, G., Goldstein, A. H., Guenther, A., Jimenez, J. L., Pöschl, U., Silva Dias, M. A., Smith, J. N., and Wendisch, M.: Introduction: Observations and Modeling of the Green Ocean Amazon (GoAmazon2014/5), Atmos. Chem. Phys., 16, 4785–4797, https://doi.org/10.5194/acp-16-4785-2016, 2016.
Martin, S. T., Artaxo, P., Machado, L., Manzi, A. O., Souza, R. A. F., Schumacher, C., Wang, J., Biscaro, T., Brito, J., Calheiros, A., Jardine, K., Medeiros, A., Portela, B., de Sá, S. S., Adachi, K., Aiken, A. C., Albrecht, R., Alexander, L., Andreae, M. O., Barbosa, H. M. J., Buseck, P., Chand, D., Comstock, J. M., Day, D. A., Dubey, M., Fan, J., Fast, J., Fisch, G., Fortner, E., Giangrande, S., Gilles, M., Goldstein, A. H., Guenther, A., Hubbe, J., Jensen, M., Jimenez, J. L., Keutsch, F. N., Kim, S., Kuang, C., Laskin, A., McKinney, K., Mei, F., Miller, M., Nascimento, R., Pauliquevis, T., Pekour, M., Peres, J., Petäjä, T., Pöhlker, C., Pöschl, U., Rizzo, L., Schmid, B., Shilling, J. E., Dias, M. A. S., Smith, J. N., Tomlinson, J. M., Tóta, J., and Wendisch, M.: The Green Ocean Amazon Experiment (GoAmazon2014/5) Observes Pollution Affecting Gases, Aerosols, Clouds, and Rainfall over the Rain Forest, B. Am. Meteorol. Soc., 98, 981–997, https://doi.org/10.1175/BAMS-D-15-00221.1, 2017.
Massoli, P., Lambe, A. T., Ahern, A. T., Williams, L. R., Ehn, M., Mikkilä, J., Canagaratna, M. R., Brune, W. H., Onasch, T. B., Jayne, J. T., Petäjä, T., Kulmala, M., Laaksonen, A., Kolb, C. E., Davidovits, P., and Worsnop, D. R.: Relationship between aerosol oxidation level and hygroscopic properties of laboratory generated secondary organic aerosol (SOA) particles, Geophys. Res. Lett., 37, L24801, https://doi.org/10.1029/2010GL045258, 2010.
Matsunaga, A. and Ziemann, P. J.: Gas-Wall Partitioning of Organic Compounds in a Teflon Film Chamber and Potential Effects on Reaction Product and Aerosol Yield Measurements, Aerosol Sci. Technol., 44, 881–892, https://doi.org/10.1080/02786826.2010.501044, 2010.
McMurry, P. H. and Rader, D. J.: Aerosol Wall Losses in Electrically Charged Chambers, Aerosol Sci. Technol., 4, 249–268, https://doi.org/10.1080/02786828508959054, 1985.
Mei, F., Setyan, A., Zhang, Q., and Wang, J.: CCN activity of organic aerosols observed downwind of urban emissions during CARES, Atmos. Chem. Phys., 13, 12155–12169, https://doi.org/10.5194/acp-13-12155-2013, 2013.
Middlebrook, A. M., Bahreini, R., Jimenez, J. L., and Canagaratna, M. R.: Evaluation of Composition-Dependent Collection Efficiencies for the Aerodyne Aerosol Mass Spectrometer using Field Data, Aerosol Sci. Technol., 46, 258–271, https://doi.org/10.1080/02786826.2011.620041, 2012.
Miracolo, M. A., Hennigan, C. J., Ranjan, M., Nguyen, N. T., Gordon, T. D., Lipsky, E. M., Presto, A. A., Donahue, N. M., and Robinson, A. L.: Secondary aerosol formation from photochemical aging of aircraft exhaust in a smog chamber, Atmos. Chem. Phys., 11, 4135–4147, https://doi.org/10.5194/acp-11-4135-2011, 2011.
Misztal, P. K., Hewitt, C. N., Wildt, J., Blande, J. D., Eller, A. S. D., Fares, S., Gentner, D. R., Gilman, J. B., Graus, M., Greenberg, J., Guenther, A. B., Hansel, A., Harley, P., Huang, M., Jardine, K., Karl, T., Kaser, L., Keutsch, F. N., Kiendler-Scharr, A., Kleist, E., Lerner, B. M., Li, T., Mak, J., Nölscher, A. C., Schnitzhofer, R., Sinha, V., Thornton, B., Warneke, C., Wegener, F., Werner, C., Williams, J., Worton, D. R., Yassaa, N., and Goldstein, A. H.: Atmospheric benzenoid emissions from plants rival those from fossil fuels, Sci. Rep., 5, 12064, https://doi.org/10.1038/srep12064, 2015.
Müller, M., Mikoviny, T., Jud, W., D'Anna, B., and Wisthaler, A.: A new software tool for the analysis of high resolution PTR-TOF mass spectra, Chemom. Intell. Lab. Syst., 127, 158–165, https://doi.org/10.1016/j.chemolab.2013.06.011, 2013.
Nah, T., McVay, R. C., Zhang, X., Boyd, C. M., Seinfeld, J. H., and Ng, N. L.: Influence of seed aerosol surface area and oxidation rate on vapor wall deposition and SOA mass yields: a case study with a-pinene ozonolysis, Atmos. Chem. Phys., 16, 9361–9379, https://doi.org/10.5194/acp-16-9361-2016, 2016.
Ng, N. L., Kroll, J. H., Keywood, M. D., Bahreini, R., Varutbangkul, V., Flagan, R. C., Seinfeld, J. H., Lee, A., and Goldstein, A. H.: Contribution of first- versus second-generation products to secondary organic aerosols formed in the oxidation of biogenic hydrocarbons, Environ. Sci. Technol., 40, 2283–2297, https://doi.org/10.1021/es052269u, 2006.
Ng, N. L., Herndon, S. C., Trimborn, A., Canagaratna, M. R., Croteau, P. L., Onasch, T. B., Sueper, D., Worsnop, D. R., Zhang, Q., Sun, Y. L., and Jayne, J. T.: An Aerosol Chemical Speciation Monitor (ACSM) for Routine Monitoring of the Composition and Mass Concentrations of Ambient Aerosol, Aerosol Sci. Technol., 45, 780–794, https://doi.org/10.1080/02786826.2011.560211, 2011.
Ortega, A. M., Day, D. A., Cubison, M. J., Brune, W. H., Bon, D., de Gouw, J. A., and Jimenez, J. L.: Secondary organic aerosol formation and primary organic aerosol oxidation from biomass-burning smoke in a flow reactor during FLAME-3, Atmos. Chem. Phys., 13, 11551–11571, https://doi.org/10.5194/acp-13-11551-2013, 2013.
Ortega, A. M., Hayes, P. L., Peng, Z., Palm, B. B., Hu, W., Day, D. A., Li, R., Cubison, M. J., Brune, W. H., Graus, M., Warneke, C., Gilman, J. B., Kuster, W. C., de Gouw, J., Gutiérrez-Montes, C., and Jimenez, J. L.: Real-time measurements of secondary organic aerosol formation and aging from ambient air in an oxidation flow reactor in the Los Angeles area, Atmos. Chem. Phys., 16, 7411–7433, https://doi.org/10.5194/acp-16-7411-2016, 2016.
Pagonis, D., Krechmer, J. E., de Gouw, J., Jimenez, J. L., and Ziemann, P. J.: Effects of gas–wall partitioning in Teflon tubing and instrumentation on time-resolved measurements of gas-phase organic compounds, Atmos. Meas. Tech., 10, 4687–4696, https://doi.org/10.5194/amt-10-4687-2017, 2017.
Palm, B. B., Campuzano-Jost, P., Ortega, A. M., Day, D. A., Kaser, L., Jud, W., Karl, T., Hansel, A., Hunter, J. F., Cross, E. S., Kroll, J. H., Peng, Z., Brune, W. H., and Jimenez, J. L.: In situ secondary organic aerosol formation from ambient pine forest air using an oxidation flow reactor, Atmos. Chem. Phys., 16, 2943–2970, https://doi.org/10.5194/acp-16-2943-2016, 2016.
Palm, B. B., Campuzano-Jost, P., Day, D. A., Ortega, A. M., Fry, J. L., Brown, S. S., Zarzana, K. J., Dube, W., Wagner, N. L., Draper, D. C., Kaser, L., Jud, W., Karl, T., Hansel, A., Gutiérrez-Montes, C., and Jimenez, J. L.: Secondary organic aerosol formation from in situ OH, O3, and NO3 oxidation of ambient forest air in an oxidation flow reactor, Atmos. Chem. Phys., 17, 5331–5354, https://doi.org/10.5194/acp-17-5331-2017, 2017.
Parrish, D. D., Stohl, A., Forster, C., Atlas, E. L., Blake, D. R., Goldan, P. D., Kuster, W. C., and de Gouw, J. A.: Effects of mixing on evolution of hydrocarbon ratios in the troposphere, J. Geophys. Res.-Atmos., 112, 1–17, https://doi.org/10.1029/2006JD007583, 2007.
Pathak, R., Donahue, N. M., and Pandis, S. N.: Ozonolysis of β-Pinene: Temperature Dependence of Secondary Organic Aerosol Mass Fraction, Environ. Sci. Technol., 42, 5081–5086, https://doi.org/10.1021/es070721z, 2008.
Pathak, R. K., Presto, A. A., Lane, T. E., Stanier, C. O., Donahue, N. M., and Pandis, S. N.: Ozonolysis of α-pinene: parameterization of secondary organic aerosol mass fraction, Atmos. Chem. Phys., 7, 3811–3821, https://doi.org/10.5194/acp-7-3811-2007, 2007.
Peng, J., Hu, M., Guo, S., Du, Z., Zheng, J., Shang, D., Levy Zamora, M., Zeng, L., Shao, M., Wu, Y.-S., Zheng, J., Wang, Y., Glen, C. R., Collins, D. R., Molina, M. J., and Zhang, R.: Markedly enhanced absorption and direct radiative forcing of black carbon under polluted urban environments, P. Natl. Acad. Sci., 113, 4266–4271, https://doi.org/10.1073/pnas.1602310113, 2016a.
Peng, Z., Day, D. A., Stark, H., Li, R., Lee-Taylor, J., Palm, B. B., Brune, W. H., and Jimenez, J. L.: HOx radical chemistry in oxidation flow reactors with low-pressure mercury lamps systematically examined by modeling, Atmos. Meas. Tech., 8, 4863–4890, https://doi.org/10.5194/amt-8-4863-2015, 2015.
Peng, Z., Day, D. A., Ortega, A. M., Palm, B. B., Hu, W., Stark, H., Li, R., Tsigaridis, K., Brune, W. H., and Jimenez, J. L.: Non-OH chemistry in oxidation flow reactors for the study of atmospheric chemistry systematically examined by modeling, Atmos. Chem. Phys., 16, 4283–4305, https://doi.org/10.5194/acp-16-4283-2016, 2016b.
Petters, M. D. and Kreidenweis, S. M.: A single parameter representation of hygroscopic growth and cloud condensation nucleus activity, Atmos. Chem. Phys., 7, 1961–1971, https://doi.org/10.5194/acp-7-1961-2007, 2007.
Petters, M. D., Prenni, A. J., Kreidenweis, S. M., DeMott, P. J., Matsunaga, A., Lim, Y. B., and Ziemann, P. J.: Chemical aging and the hydrophobic-to-hydrophilic conversion of carbonaceous aerosol, Geophys. Res. Lett., 33, L24806, https://doi.org/10.1029/2006gl027249, 2006a.
Petters, M. D., Kreidenweis, S. M., Snider, J. R., Koehler, K. A., Wang, Q., Prenni, A. J., and Demott, P. J.: Cloud droplet activation of polymerized organic aerosol, Tellus B, 58, 196–205, https://doi.org/10.1111/j.1600-0889.2006.00181.x, 2006b.
Pierce, J. R., Engelhart, G. J., Hildebrandt, L., Weitkamp, E. A., Pathak, R. K., Donahue, N. M., Robinson, A. L., Adams, P. J., and Pandis, S. N.: Constraining Particle Evolution from Wall Losses, Coagulation, and Condensation-Evaporation in Smog-Chamber Experiments: Optimal Estimation Based on Size Distribution Measurements, Aerosol Sci. Technol., 42, 1001–1015, https://doi.org/10.1080/02786820802389251, 2008.
Platt, S. M., El Haddad, I., Zardini, A. A., Clairotte, M., Astorga, C., Wolf, R., Slowik, J. G., Temime-Roussel, B., Marchand, N., Ježek, I., Drinovec, L., Mocnik, G., Möhler, O., Richter, R., Barmet, P., Bianchi, F., Baltensperger, U., and Prévôt, A. S. H.: Secondary organic aerosol formation from gasoline vehicle emissions in a new mobile environmental reaction chamber, Atmos. Chem. Phys., 13, 9141–9158, https://doi.org/10.5194/acp-13-9141-2013, 2013.
Pope, C. A. and Dockery, D. W.: Health Effects of Fine Particulate Air Pollution: Lines that Connect, J. Air Waste Manage. Assoc., 56, 709–742, https://doi.org/10.1080/10473289.2006.10464485, 2006.
Pöschl, U., Martin, S. T., Sinha, B., Chen, Q., Gunthe, S. S., Huffman, J. A., Borrmann, S., Farmer, D. K., Garland, R. M., Helas, G., Jimenez, J. L., King, S. M., Manzi, A., Mikhailov, E., Pauliquevis, T., Petters, M. D., Prenni, A. J., Roldin, P., Rose, D., Schneider, J., Su, H., Zorn, S. R., Artaxo, P., and Andreae, M. O.: Rainforest aerosols as biogenic nuclei of clouds and precipitation in the Amazon., Science, 329, 1513–1516, https://doi.org/10.1126/science.1191056, 2010.
Pósfai, M.: Atmospheric tar balls: Particles from biomass and biofuel burning, J. Geophys. Res., 109, D06213, https://doi.org/10.1029/2003JD004169, 2004.
Presto, A. A., Nguyen, N. T., Ranjan, M., Reeder, A. J., Lipsky, E. M., Hennigan, C. J., Miracolo, M. A., Riemer, D. D., and Robinson, A. L.: Fine particle and organic vapor emissions from staged tests of an in-use aircraft engine, Atmos. Environ., 45, 3603–3612, https://doi.org/10.1016/j.atmosenv.2011.03.061, 2011.
Rinne, H. J. I., Guenther, A. B., Greenberg, J. P., and Harley, P. C.: Isoprene and monoterpene fluxes measured above Amazonian rainforest and their dependence on light and temperature, Atmos. Environ., 36, 2421–2426, https://doi.org/10.1016/S1352-2310(01)00523-4, 2002.
Robinson, A. L., Donahue, N. M., Shrivastava, M. K., Weitkamp, E. A., Sage, A. M., Grieshop, A. P., Lane, T. E., Pierce, J. R., and Pandis, S. N.: Rethinking Organic Aerosols: Semivolatile Emissions and Photochemical Aging, Science, 315, 1259–1262, https://doi.org/10.1126/science.1133061, 2007.
Robinson, N. H., Newton, H. M., Allan, J. D., Irwin, M., Hamilton, J. F., Flynn, M., Bower, K. N., Williams, P. I., Mills, G., Reeves, C. E., McFiggans, G., and Coe, H.: Source attribution of Bornean air masses by back trajectory analysis during the OP3 project, Atmos. Chem. Phys., 11, 9605–9630, https://doi.org/10.5194/acp-11-9605-2011, 2011.
Shilling, J. E., Chen, Q., King, S. M., Rosenoern, T., Kroll, J. H., Worsnop, D. R., McKinney, K. A., and Martin, S. T.: Particle mass yield in secondary organic aerosol formed by the dark ozonolysis of a-pinene, Atmos. Chem. Phys., 8, 2073–2088, https://doi.org/10.5194/acp-8-2073-2008, 2008.
Sinha, V., Williams, J., Crowley, J. N., and Lelieveld, J.: The Comparative Reactivity Method – a new tool to measure total OH Reactivity in ambient air, Atmos. Chem. Phys., 8, 2213–2227, https://doi.org/10.5194/acp-8-2213-2008, 2008.
Sun, Y. L., Zhang, Q., Anastasio, C., and Sun, J.: Insights into secondary organic aerosol formed via aqueous-phase reactions of phenolic compounds based on high resolution mass spectrometry, Atmos. Chem. Phys., 10, 4809–4822, https://doi.org/10.5194/acp-10-4809-2010, 2010.
Surratt, J. D., Chan, A. W. H., Eddingsaas, N. C., Chan, M., Loza, C. L., Kwan, A. J., Hersey, S. P., Flagan, R. C., Wennberg, P. O., and Seinfeld, J. H.: Reactive intermediates revealed in secondary organic aerosol formation from isoprene, P. Natl. Acad. Sci. USA, 107, 6640–6645, https://doi.org/10.1073/pnas.0911114107, 2010.
Tan, Y., Carlton, A. G., Seitzinger, S. P., and Turpin, B. J.: SOA from methylglyoxal in clouds and wet aerosols: Measurement and prediction of key products, Atmos. Environ., 44, 5218–5226, https://doi.org/10.1016/j.atmosenv.2010.08.045, 2010.
Tan, Y., Lim, Y. B., Altieri, K. E., Seitzinger, S. P., and Turpin, B. J.: Mechanisms leading to oligomers and SOA through aqueous photooxidation: insights from OH radical oxidation of acetic acid and methylglyoxal, Atmos. Chem. Phys., 12, 801–813, https://doi.org/10.5194/acp-12-801-2012, 2012.
Tasoglou, A. and Pandis, S. N.: Formation and chemical aging of secondary organic aerosol during the β-caryophyllene oxidation, Atmos. Chem. Phys., 15, 6035–6046, https://doi.org/10.5194/acp-15-6035-2015, 2015.
Thalman, R., de Sá, S. S., Palm, B. B., Barbosa, H. M. J., Pöhlker, M. L., Alexander, M. L., Brito, J., Carbone, S., Castillo, P., Day, D. A., Kuang, C., Manzi, A., Ng, N. L., Sedlacek III, A. J., Souza, R., Springston, S., Watson, T., Pöhlker, C., Pöschl, U., Andreae, M. O., Artaxo, P., Jimenez, J. L., Martin, S. T., and Wang, J.: CCN activity and organic hygroscopicity of aerosols downwind of an urban region in central Amazonia: seasonal and diel variations and impact of anthropogenic emissions, Atmos. Chem. Phys., 17, 11779–11801, https://doi.org/10.5194/acp-17-11779-2017, 2017.
Tsigaridis, K., Daskalakis, N., Kanakidou, M., Adams, P. J., Artaxo, P., Bahadur, R., Balkanski, Y., Bauer, S. E., Bellouin, N., Benedetti, A., Bergman, T., Berntsen, T. K., Beukes, J. P., Bian, H., Carslaw, K. S., Chin, M., Curci, G., Diehl, T., Easter, R. C., Ghan, S. J., Gong, S. L., Hodzic, A., Hoyle, C. R., Iversen, T., Jathar, S., Jimenez, J. L., Kaiser, J. W., Kirkevåg, A., Koch, D., Kokkola, H., Lee, Y. H., Lin, G., Liu, X., Luo, G., Ma, X., Mann, G. W., Mihalopoulos, N., Morcrette, J.-J., Müller, J.-F., Myhre, G., Myriokefalitakis, S., Ng, N. L., O'Donnell, D., Penner, J. E., Pozzoli, L., Pringle, K. J., Russell, L. M., Schulz, M., Sciare, J., Seland, Ø., Shindell, D. T., Sillman, S., Skeie, R. B., Spracklen, D., Stavrakou, T., Steenrod, S. D., Takemura, T., Tiitta, P., Tilmes, S., Tost, H., van Noije, T., van Zyl, P. G., von Salzen, K., Yu, F., Wang, Z., Wang, Z., Zaveri, R. A., Zhang, H., Zhang, K., Zhang, Q., and Zhang, X.: The AeroCom evaluation and intercomparison of organic aerosol in global models, Atmos. Chem. Phys., 14, 10845–10895, https://doi.org/10.5194/acp-14-10845-2014, 2014.
Tsimpidi, A. P., Karydis, V. A., Zavala, M., Lei, W., Molina, L., Ulbrich, I. M., Jimenez, J. L., and Pandis, S. N.: Evaluation of the volatility basis-set approach for the simulation of organic aerosol formation in the Mexico City metropolitan area, Atmos. Chem. Phys., 10, 525–546, https://doi.org/10.5194/acp-10-525-2010, 2010.
Ulbrich, I. M., Canagaratna, M. R., Zhang, Q., Worsnop, D. R., and Jimenez, J. L.: Interpretation of organic components from Positive Matrix Factorization of aerosol mass spectrometric data, Atmos. Chem. Phys., 9, 2891–2918, https://doi.org/10.5194/acp-9-2891-2009, 2009.
VanReken, T. M., Ng, N. L., Flagan, R. C., and Seinfeld, J. H.: Cloud condensation nucleus activation properties of biogenic secondary organic aerosol, J. Geophys. Res., 110, D07206, https://doi.org/10.1029/2004JD005465, 2005.
von der Weiden, S.-L., Drewnick, F., and Borrmann, S.: Particle Loss Calculator – a new software tool for the assessment of the performance of aerosol inlet systems, Atmos. Meas. Tech., 2, 479–494, https://doi.org/10.5194/amt-2-479-2009, 2009.
Williams, B. J., Goldstein, A. H., Kreisberg, N. M., and Hering, S. V.: An In-Situ Instrument for Speciated Organic Composition of Atmospheric Aerosols: T hermal Desorption A erosol G C/MS-FID (TAG), Aerosol Sci. Technol., 40, 627–638, https://doi.org/10.1080/02786820600754631, 2006.
Williams, J., Keßel, S. U., Nölscher, A. C., Yang, Y., Lee, Y., Yáñez-Serrano, A. M., Wolff, S., Kesselmeier, J., Klüpfel, T., Lelieveld, J., and Shao, M.: Opposite OH reactivity and ozone cycles in the Amazon rainforest and megacity Beijing: Subversion of biospheric oxidant control by anthropogenic emissions, Atmos. Environ., 125, 112–118, https://doi.org/10.1016/j.atmosenv.2015.11.007, 2016.
Winterhalter, R., Herrmann, F., Kanawati, B., Nguyen, T. L., Peeters, J., Vereecken, L., and Moortgat, G. K.: The gas-phase ozonolysis of β-caryophyllene (C15H24). Part I: an experimental study, Phys. Chem. Chem. Phys., 11, 4152, https://doi.org/10.1039/b817824k, 2009.
Woody, M. C., West, J. J., Jathar, S. H., Robinson, A. L., and Arunachalam, S.: Estimates of non-traditional secondary organic aerosols from aircraft SVOC and IVOC emissions using CMAQ, Atmos. Chem. Phys., 15, 6929–6942, https://doi.org/10.5194/acp-15-6929-2015, 2015.
Xu, W., Guo, S., Gomez-Hernandez, M., Zamora, M. L., Secrest, J., Marrero-Ortiz, W., Zhang, A. L., Collins, D. R., and Zhang, R.: Cloud forming potential of oligomers relevant to secondary organic aerosols, Geophys. Res. Lett., 41, 6538–6545, https://doi.org/10.1002/2014GL061040, 2014.
Yee, L. D., Isaacman-VanWertz, G., Wernis, R. A., Meng, M., Rivera, V., Kreisberg, N. M., Hering, S. V., Bering, M. S., Glasius, M., Upshur, M.-A., Thomson, R. J., Geiger, F. M., Offenberg, J. H., Lewandowski, M., Kourtchev, I., Kalberer, M., de Sá, S. S., Martin, S. T., Alexander, M. L., Palm, B. B., Hu, W., Campuzano-Jost, P., Day, D. A., Jimenez, J. L., Liu, Y., McKinney, K. A., Brito, J. F., Artaxo, P., Viegas, J., Manzi, A., Oliveira, M. B., de Souza, R. A. F., Machado, L. A. T., Longo, K., and Goldstein, A. H.: Observations of Sesquiterpenes and their Oxidation Products During GoAmazon2014/5, in preparation, 2017.
Zhang, Q., Jimenez, J. L., Canagaratna, M. R., Allan, J. D., Coe, H., Ulbrich, I., Alfarra, M. R., Takami, A., Middlebrook, A. M., Sun, Y. L., Dzepina, K., Dunlea, E., Docherty, K., DeCarlo, P. F., Salcedo, D., Onasch, T., Jayne, J. T., Miyoshi, T., Shimono, A., Hatakeyama, S., Takegawa, N., Kondo, Y., Schneider, J., Drewnick, F., Borrmann, S., Weimer, S., Demerjian, K., Williams, P., Bower, K., Bahreini, R., Cottrell, L., Griffin, R. J., Rautiainen, J., Sun, J. Y., Zhang, Y. M., and Worsnop, D. R.: Ubiquity and dominance of oxygenated species in organic aerosols in anthropogenically-influenced Northern Hemisphere midlatitudes, Geophys. Res. Lett., 34, L13801, https://doi.org/10.1029/2007GL029979, 2007.
Zhang, Q., Jimenez, J. L., Canagaratna, M. R., Ulbrich, I. M., Ng, N. L., Worsnop, D. R., and Sun, Y.: Understanding Atmospheric Organic Aerosols via Factor Analysis of Aerosol Mass Spectrometry: a Review, Anal. Bioanal. Chem., 401, 3045–67, https://doi.org/10.1007/s00216-011-5355-y, 2011.
Zhang, X., Cappa, C. D., Jathar, S. H., McVay, R. C., Ensberg, J. J., Kleeman, M. J., and Seinfeld, J. H.: Influence of vapor wall loss in laboratory chambers on yields of secondary organic aerosol, P. Natl. Acad. Sci. USA, 111, 5802–5807, https://doi.org/10.1073/pnas.1404727111, 2014.
Zhao, D. F., Kaminski, M., Schlag, P., Fuchs, H., Acir, I.-H., Bohn, B., Häseler, R., Kiendler-Scharr, A., Rohrer, F., Tillmann, R., Wang, M. J., Wegener, R., Wildt, J., Wahner, A., and Mentel, Th. F.: Secondary organic aerosol formation from hydroxyl radical oxidation and ozonolysis of monoterpenes, Atmos. Chem. Phys., 15, 991–1012, https://doi.org/10.5194/acp-15-991-2015, 2015.
Zhao, Y., Kreisberg, N. M., Worton, D. R., Teng, A. P., Hering, S. V., and Goldstein, A. H.: Development of an In Situ Thermal Desorption Gas Chromatography Instrument for Quantifying Atmospheric Semi-Volatile Organic Compounds, Aerosol Sci. Technol., 47, 258–266, https://doi.org/10.1080/02786826.2012.747673, 2013.
Zhao, Y., Hennigan, C. J., May, A. A., Tkacik, D. S., de Gouw, J. A., Gilman, J. B., Kuster, W. C., Borbon, A., and Robinson, A. L.: Intermediate-Volatility Organic Compounds: A Large Source of Secondary Organic Aerosol, Environ. Sci. Technol., 48, 13743–13750, https://doi.org/10.1021/es5035188, 2014.
Zhou, S., Collier, S., Jaffe, D. A., Briggs, N. L., Hee, J., Sedlacek III, A. J., Kleinman, L., Onasch, T. B., and Zhang, Q.: Regional influence of wildfires on aerosol chemistry in the western US and insights into atmospheric aging of biomass burning organic aerosol, Atmos. Chem. Phys., 17, 2477–2493, https://doi.org/10.5194/acp-17-2477-2017, 2017.
Ziemann, P. J. and Atkinson, R.: Kinetics, products, and mechanisms of secondary organic aerosol formation, Chem. Soc. Rev., 41, 6582, https://doi.org/10.1039/c2cs35122f, 2012.