the Creative Commons Attribution 4.0 License.
the Creative Commons Attribution 4.0 License.
 | 20 Mar 2018
Characterization and source apportionment of organic aerosol at 260 m on a meteorological tower in Beijing, China
Wei Zhou
Qingqing Wang
Xiujuan Zhao
Weiqi Xu
Chen Chen
Jian Zhao
Francesco Canonaco
André S. H. Prévôt
Pingqing Fu
Zifa Wang
Douglas R. Worsnop
Despite extensive efforts toward the characterization of submicron aerosols at ground level in the megacity of Beijing, our understanding of aerosol sources and processes at high altitudes remains low. Here we conducted a 3-month real-time measurement of non-refractory submicron aerosol (NR-PM1) species at a height of 260 m from 10 October 2014 to 18 January 2015 using an aerosol chemical speciation monitor. Our results showed a significant change in aerosol composition from the non-heating period (NHP) to the heating period (HP). Organics and chloride showed clear increases during HP due to coal combustion emissions, while nitrate showed substantial decreases from 28 to 15–18 %. We also found that NR-PM1 species in the heating season can have average mass differences of 30–44 % under similar emission sources yet different meteorological conditions. Multi-linear engine 2 (ME-2) using three primary organic aerosol (OA) factors as constraints, i.e., fossil-fuel-related OA (FFOA) dominantly from coal combustion emissions, cooking OA (COA), and biomass burning OA (BBOA) resolved from ground high-resolution aerosol mass spectrometer measurements, was applied to OA mass spectra of ACSM. Two types of secondary OA (SOA) that were well correlated with nitrate and chloride–CO, respectively, were identified. SOA played a dominant role in OA during all periods at 260 m although the contributions were decreased from 72 % during NHP to 58–64 % during HP. The SOA composition also changed significantly from NHP to HP. While the contribution of oxygenated OA (OOA) was decreased from 56–63 to 32–40 %, less oxidized OOA (LO-OOA) showed a large increase from 9–16 to 24–26 %. COA contributed a considerable fraction of OA at high altitude, and the contribution was relatively similar across different periods (10–13 %). In contrast, FFOA showed a large increase during HP due to the influences of coal combustion emissions. We also observed very different OA composition between ground level and 260 m. Particularly, the contributions of COA and BBOA at the ground site were nearly twice those at 260 m, while SOA at 260 m was ∼ 15–34 % higher than that at ground level. Bivariate polar plots and back-trajectory analysis further illustrated the different source regions of OA factors in different seasons.
- Article
(13636 KB) - Full-text XML
-
Supplement
(967 KB) - BibTeX
- EndNote


Atmospheric aerosol particles reduce visibility by scattering and absorbing solar radiation and also exert detrimental effects on human health (Dockery et al., 1993; IPCC, 2013). Beijing, the capital of China, has been suffering under severe haze pollution since the last decade, especially in autumn and winter (Huang et al., 2014; Guo et al., 2014). For example, Beijing released the first air pollution red alert due to a severe haze episode in December 2015 when the daily PM2.5 concentration exceeded 300 µg m−3 for more than 3 days. Therefore, the sources and formation mechanisms of haze episodes have been extensively investigated for mitigating air pollution in Beijing in recent years (X. J. Zhao et al., 2013; Huang et al., 2014; Yang et al., 2015; Sun et al., 2016a; Wu et al., 2017). The results highlight the fact that stagnant meteorological conditions with shallow planetary boundary layer (PBL) and low surface wind, traffic, and coal combustion emissions, regional transport, and secondary production of SNA (sulfate, nitrate, and ammonium) are the major factors leading to the formation of severe haze episodes. However, our knowledge of the characteristics of aerosol particles is far from complete, mainly due to the fact that most previous studies were conducted at ground sites and were subject to strong influences from local emissions. The measurements and analysis at high heights at urban sites are still very limited, particularly long-term analysis covering different seasons.
Organic aerosol (OA) accounts for a major mass fraction (20–90 %) of submicron aerosol (Zhang et al., 2007) and is comprised of primary OA (POA) from direct emissions and secondary OA (SOA) from the oxidation of volatile organic compounds (VOCs; Jimenez et al., 2009). Deployments of the Aerodyne Aerosol Mass Spectrometer (AMS) combined with the Aerosol Chemical Speciation Monitor (ACSM) for real-time measurements of aerosol particle composition followed by subsequent positive matrix factorization (PMF) analysis (Paatero and Tapper, 1994; Ulbrich et al., 2009) have greatly improved our understanding of the sources of OA in China and also highlighted the important role of OA in the rapid formation of severe haze (Huang et al., 2014; Sun et al., 2014; Zhang et al., 2014). The sources and formation of OA are seasonally different. For example, SOA is more significant than POA in summer due to stronger photochemical processing, while POA often plays a more important role than SOA in winter due to more primary emissions, e.g., coal combustion and weaker photochemistry (Y. L. Sun et al., 2015; Li et al., 2017; Ma et al., 2017). A recent study by Xu et al. (2017) further found that photochemical processing tends to form less oxidized SOA (LO-OOA), while aqueous-phase processing can form more oxidized SOA (MO-OOA).
Despite extensive OA studies in recent years, our understanding of the sources and processes of OA at high heights in megacities is still limited. Y. Sun et al. (2015) conducted the first real-time measurements of aerosol particle composition at 260 m on the Beijing 325 m meteorological tower (BMT) using an ACSM. A high-resolution time-of-flight AMS (HR-AMS hereafter) was deployed in parallel at ground level during the same period. The results showed substantially different aerosol composition between 260 m and ground level; particularly, OA showed a higher contribution to non-refractory PM1 (NR-PM1) at ground level (65 %) than 260 m (54 %). Source apportionment of OA further illustrated the similar temporal variations in SOA at the two heights, while those of POA were dramatically different. Also, the contribution of SOA to OA at higher altitude was higher than that at the ground site (49 vs. 38 %). Chen et al. (2015) further analyzed OA at 260 m before and during the Asia-Pacific Economic Cooperation (APEC) summit when strict emission controls were implemented in Beijing and the surrounding regions. The results showed similar reductions in POA and SOA at 260 m during the APEC initiatives as responses to emission controls. However, POA remained with small changes at ground level although SOA showed similar reductions as at 260 m (Xu et al., 2015). Such differences highlight the different impacts of local source emissions and regional transport on POA and SOA at different heights in the city. Note that PMF analyses of OA at 260 m in previous studies were all limited to a two-factor solution, i.e., POA and SOA. Although the mass spectrum of POA shows a mix of different primary emissions, e.g., traffic, cooking, and biomass burning, the solutions with more factors showed an unrealistic split of OA factors (Y. Sun et al., 2015; Chen et al., 2015). As a consequence, the variations and evolution of different POA and SOA factors are poorly understood at a high altitude in Beijing. For example, Zhao et al. (2017) found that the two different SOA factors, i.e., LO-OOA and MO-OOA, showed different responses to emission controls during the 2015 China Victory Day parade at a ground site. While MO-OOA showed a large decrease during the control period, LO-OOA was comparable during and after the control period. However, the composition and variations of different SOA factors at 260 m were never characterized. This also greatly limits our understanding of the sources and processes of OA at high heights in the low atmospheric boundary layer in Beijing.
In this study, an ACSM was deployed at 260 m on the BMT for 3 months to measure NR-PM1 aerosol species in real time. This study encompasses three periods with different emission scenarios, i.e., the non-heating period (NHP), APEC with strict emission controls in Beijing and the surrounding regions, and the heating period (HP) with significant influences from coal combustion emissions. The characteristics and sources of NR-PM1 and OA before and during APEC were reported in our previous study (Chen et al., 2015); here we mainly focus on the characterization of submicron aerosols during the heating season and also the comparisons with those during NHP and APEC. Most importantly, we present the first source apportionment analysis of OA at 260 m by using the multi-linear engine (ME-2) with the constrained POA factors identified at the ground site. The mass concentrations, composition, and diurnal cycles of POA and SOA factors are characterized, and the changes in POA and SOA composition from NHP to APEC and HP are elucidated. Also, comparisons of sources and the composition of POA and SOA between ground level and 260 m are presented.
2.1 Sampling site and measurements
The NR-PM1 species, including organics (Org), sulfate (SO4), nitrate (NO3), ammonium (NH4), chloride (Chl), and gaseous species of SO2 and CO, were measured at a height of 260 m on the BMT (39∘58′28 N, 116∘22′16 E; ASL: 49 m) using an ACSM and gas analyzers (Thermo Scientific). A more detailed description of the sampling site and the operations of the ACSM can be found in Y. Sun et al. (2015) and Chen et al. (2015). Simultaneously, a HR-AMS was deployed at the ground level to measure the size-resolved NR-PM1 composition (Xu et al., 2015). In addition, the meteorological variables including wind direction (WD), wind speed (WS), relative humidity (RH), and temperature (T) were measured at 8 and 280 m on the BMT.
2.2 ACSM data analysis
The mass concentrations and chemical compositions of NR-PM1 were analyzed with the ACSM standard data software (V1.5.3.0). Consistent with our previous study in Beijing in 2014 (Chen et al., 2015), we used the same parameters for the entire campaign. For example, a constant collection efficiency (CE) of 0.5 was applied to compensate for the incomplete detection of aerosol particles, which is primarily caused by particle bounce effects at the vaporizer (Matthew et al., 2008). The reason is that the mass fractions of ammonium nitrate, RH, and particle acidity were found to have minor influences on CE in this study (Middlebrook et al., 2012). A 2-week intercomparison between HR-AMS and ACSM measurements was performed before this study (Y. Sun et al., 2015). Using the same CE of 0.5, all NR-PM1 species are well correlated between the measurements from the two instruments (R2 = 0.97–1) and the slopes range from 0.61–1.24. To reduce the uncertainties in vertical comparisons, the ACSM measurements were further corrected using the regression slopes against HR-AMS measurements. The different scaling factors for different species were likely due to the fact that the ACSM measurements can have uncertainties of 9–36 % for different NR-PM1 species (Crenn et al., 2015).
2.3 Positive matrix factorization
Positive matrix factorization (PMF) was first performed on the unit mass resolution spectra of OA (m∕z 12–350) at the ground site that were measured with HR-AMS during the same period as those of ACSM. Five factors, i.e., a fossil-fuel-related OA (FFOA) from traffic and coal combustion emissions, a cooking-related OA (COA), a biomass burning OA (BBOA), an oxygenated OA (OOA), and a less oxidized OOA (LO-OOA), were determined. Extending the PMF solution to six and seven factors still cannot separate the traffic-related hydrocarbon-like OA (HOA) from coal combustion OA (CCOA). The mass spectra of the five OA factors are presented in Fig. S1 in the Supplement. Each factor was characterized by the typical prominent peaks indicative of different sources and properties (Sun et al., 2016b), for example, high m∕z 60 and 73 peaks in BBOA, prominent PAH fragments in FFOA, high m∕z 55∕57 in COA, and pronounced m∕z 44 in SOA (LO-OOA and OOA). The mass spectral profiles of the three POA factors, i.e., FFOA, COA, and BBOA, were then used as the constraints in the multi-linear engine 2 (ME-2) analysis at 260 m. Compared with the PMF2 algorithm, ME-2 reduces rotational ambiguity by adding the known source information (e.g., factor profiles or factor time series) into the model (Paatero and Tapper, 1994; Canonaco et al., 2013). Considering that the POA factors at 260 m might not be completely the same as those at the ground site, the so-called a-value approach with the a value ranging from 0 to 0.5 for all three POA factors was used in this study. Following the guidelines of the a-value sensitivity test presented by Crippa et al. (2014), we evaluated the mass spectral profiles, diurnal patterns, and time series of OA factors and also compared them with external tracers. As shown in Fig. S2 in the Supplement, the time series of FFOA and COA were fairly robust across different a values, and the differences were generally less than 10 %. Although the COA spectrum was also robust, the FFOA spectrum showed a clear decrease in the ratios of m∕z 41∕43 and m∕z 55∕57 as the a value increases and became more different from that of burning smoky coal (Lin et al., 2017). Compared with FFOA and COA, BBOA showed more variability in both spectrum and time series. As the a value increased from 0 to 0.5, the average BBOA concentration was increased by nearly a factor of 2, and the mass spectrum showed a significant decrease in m∕z 60. To better compare with the PMF results at the ground site and also allow for some degrees of freedom for model runs, the five-factor solution with an a value of 0 for FFOA and BBOA and 0.2 for COA was selected in this study. We also performed PMF analysis on ACSM OA spectra and found that the BBOA factor cannot be resolved although biomass burning is a common source in winter. Figure S4 in the Supplement shows diurnal comparisons of the solutions between PMF and ME-2. It is clear that the unconstrained PMF reports twice higher FFOA and COA than ME-2, while OOA is 30 % lower (Fig. S2). While the rotational ambiguity is one of the reasons, another explanation is that FFOA and COA are mixed with BBOA, which cannot be separated by PMF. More detailed ME-2 diagnostics are presented in Figs. S2–S4.
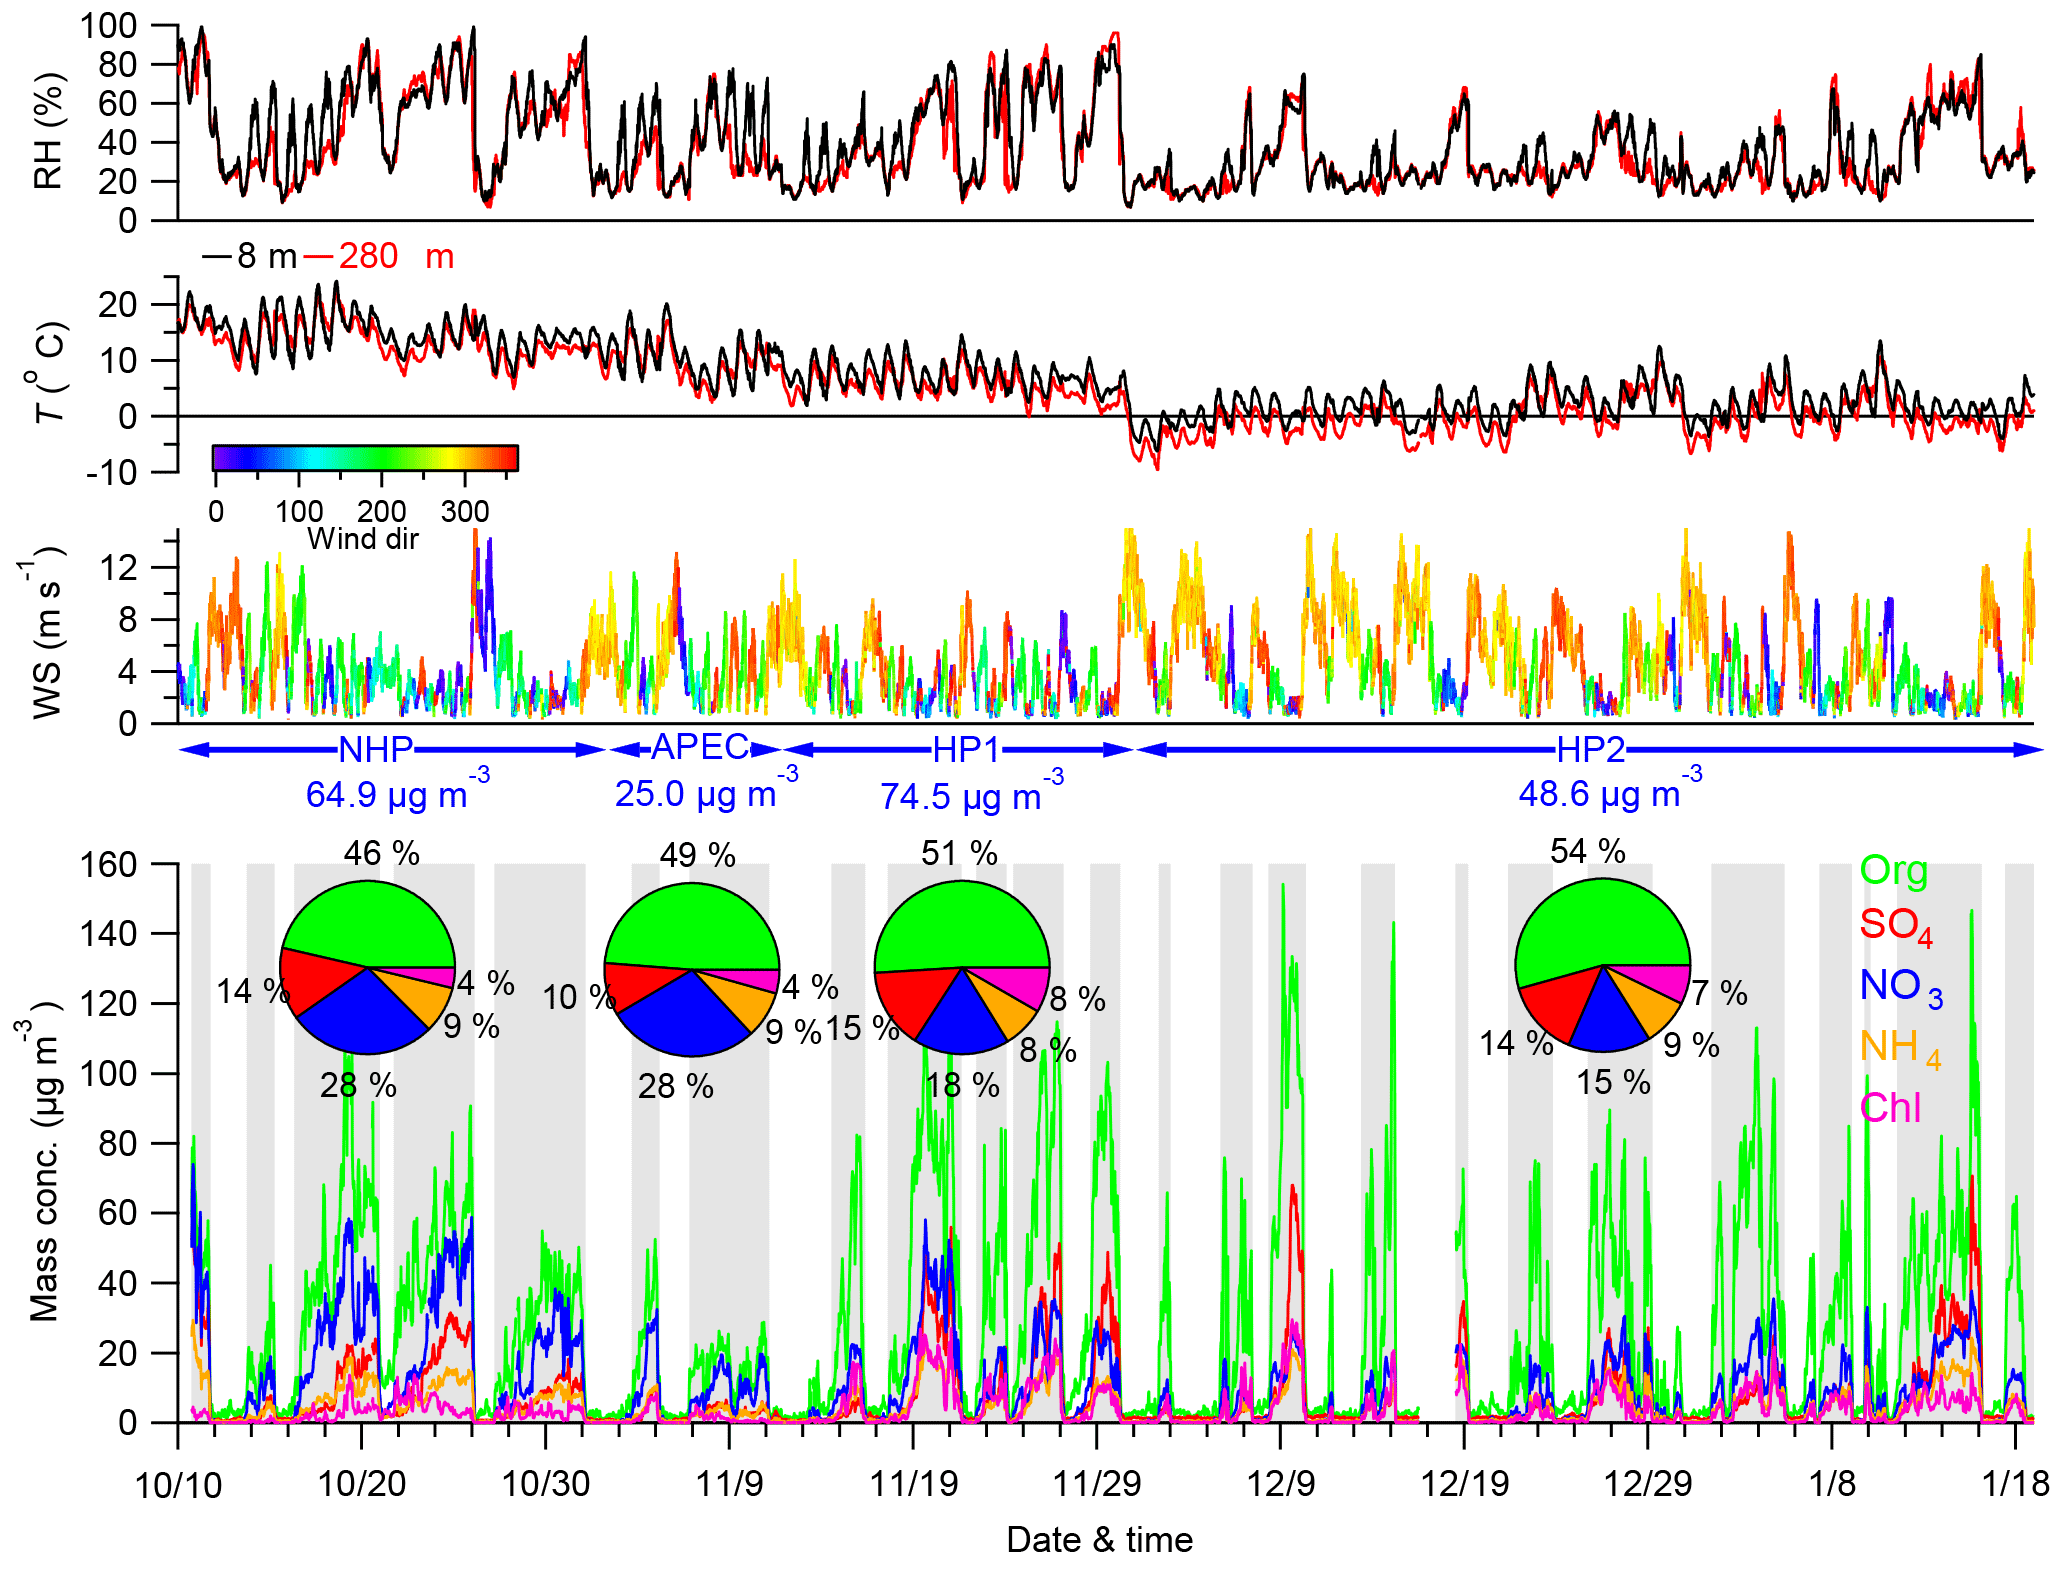
Figure 1Time series of meteorological parameters (RH, T, WS, and WD) and mass concentrations of NR-PM1 species (Org, SO4, NO3, NH4, Chl). The four pie charts show the average chemical composition during the four different periods, i.e., NHP, APEC, HP1, and HP2. The polluted episodes are marked in gray for further discussion, and the rest of the time is defined as clean periods.
3.1 Characteristics of NR-PM1 species at 260 m
3.1.1 Mass concentrations and chemical composition
Figure 1 shows the time series of meteorological parameters and NR-PM1 species for the entire study, which can be classified into three different periods, i.e., NHP, APEC, and HP, according to the changes in source emissions. The HP was further separated into two different periods according to the variations in T and RH. As shown in Fig. 1, the first HP period (HP1) from 13 to 31 November showed clearly higher RH and T compared with the second period (HP2) from 1 December to 18 January. The NR-PM1 mass concentration varied significantly throughout the entire study with hourly average concentrations ranging from 0.7 to 284.8 µg m−3. Such dramatic variations primarily driven by meteorological changes at ground sites have also been observed many times in autumn and winter in Beijing (Y. L. Sun et al., 2013; Guo et al., 2014; Zhang et al., 2016b). For example, the changes in NR-PM1 were characterized by routine cycles of polluted episodes (marked in gray in Fig. 1) and clean periods (the rest of the time) during HP2. Comparatively, polluted episodes that lasted approximately 4 days and were then followed by short periods of clean days were more frequent during NHP, mainly due to the fewer occurrences of northwesterly winds (Fig. S5 in the Supplement). Consistently, periods with high NR-PM1 loading (> 80 µg m−3) accounted for more time during NHP (37 %) than HP2 (25 %). Indeed, the average NR-PM1 concentration during HP2 (48.6 µg m−3) was even lower than that during NHP (64.9 µg m−3), illustrating that the PM pollution in autumn 2014 was more severe than that in winter. The large reduction of NR-PM1 by 61 % during APEC compared with that during NHP due to regional emission controls and favorable meteorological conditions has been reported in Chen et al. (2015) and Sun et al. (2016c). This is also consistent with the fact that the periods with NR-PM1 less than 60 µg m−3 accounted for 93 % of the time during APEC, which is much higher than before APEC (51 %).
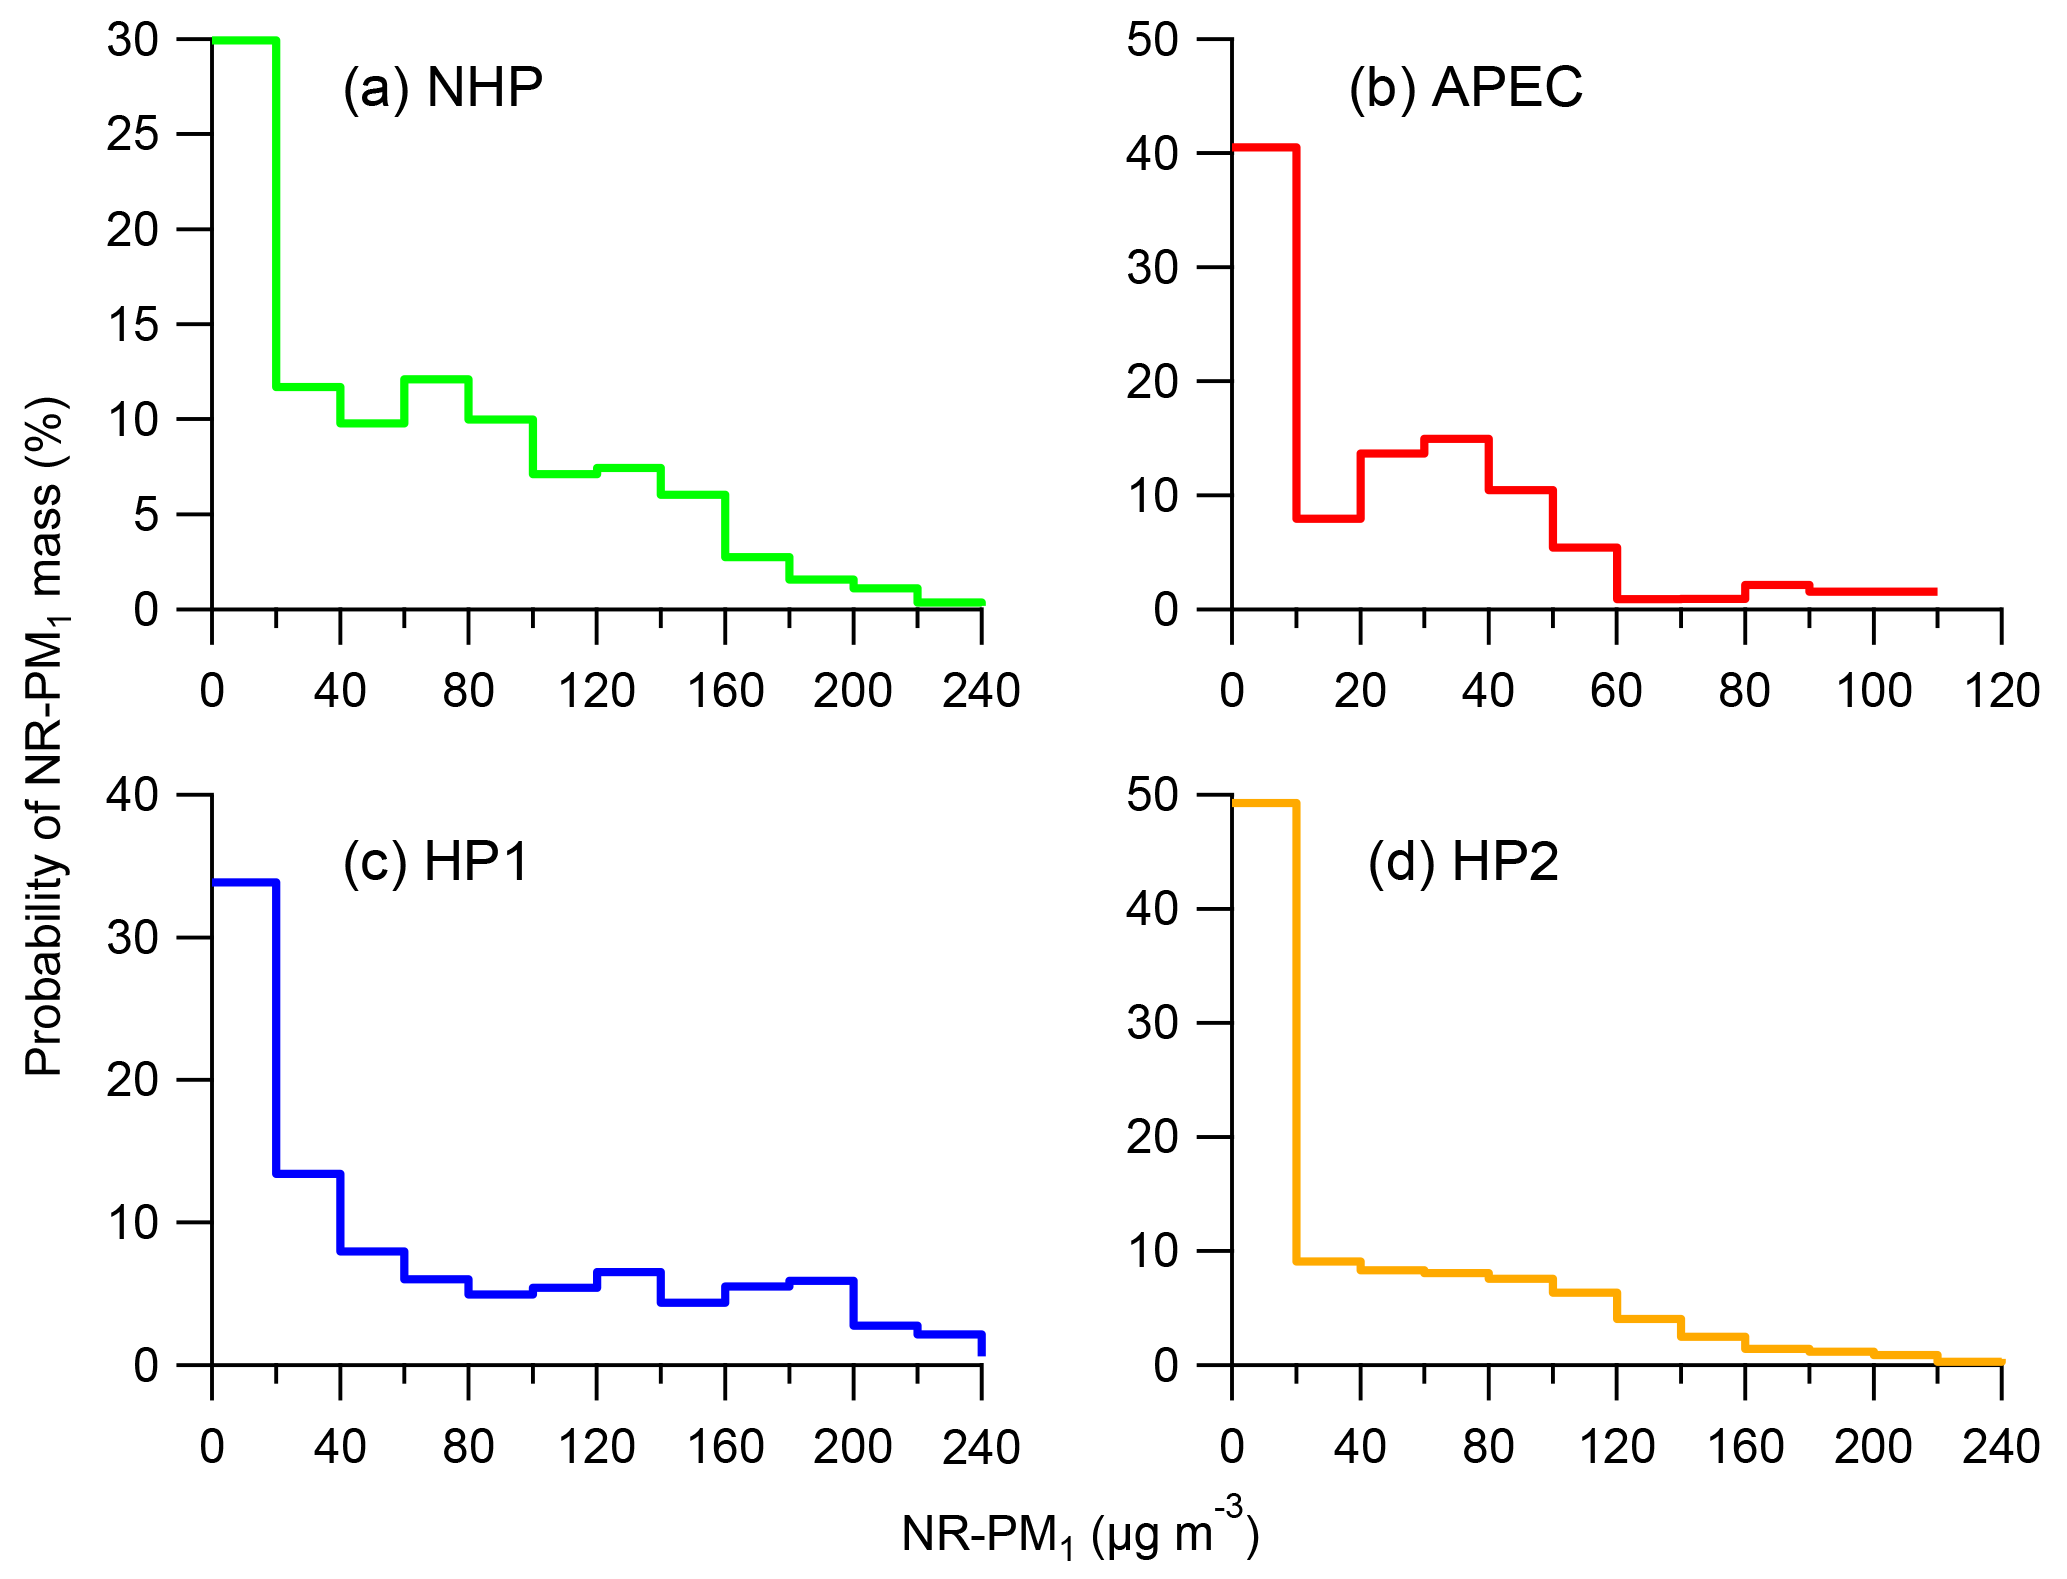
Figure 2Probability of NR-PM1 mass during four different periods (a–d), i.e., NHP, APEC, HP1, and HP2.
The two heating periods showed very different PM levels with the average NR-PM1 concentrations being 74.5 and 48.6 µg m−3, respectively. As shown in Fig. 2, the frequency of NR-PM1 mass during HP1 was significantly different from that during HP2. Clean periods with NR-PM1 < 20 µg m−3 accounted for nearly half of the total time during HP2, while it was much less during HP1 (34 %). Considering that emission sources could not have significant changes during the heating season, such differences were mainly caused by different meteorological conditions, for example more frequent northwesterly winds during HP2 than HP1 (Fig. S5). In addition, the different RH and T also indicate the different chemical processing, e.g., photochemical and aqueous-phase processing between HP1 and HP2. Note that the average NR-PM1 during HP1 was only 15 % higher than that during NHP, and that of HP2 was even 25 % lower, which appears to contradict our previous conclusion that HP showed approximately 50 % higher PM loading than NHP (Wang et al., 2015). One major reason is the more frequent clean periods during HP in 2014 than 2012 (Wang et al., 2015).
Organics comprised the major fraction of NR-PM1 during all periods, on average accounting for 46–54 %. The dominance of organics in NR-PM1 was consistent with previous studies at ground sites in Beijing (Y. Sun et al., 2013; Huang et al., 2014; J. K. Zhang et al., 2016). Note that the contribution of organics showed an increase during HP as a result of enhanced emissions from coal combustion (Wang et al., 2015; Elser et al., 2016; Zhang et al., 2016b). Consistently, the combustion-related chloride was increased by a factor of ∼ 2 from 4 % during NHP to 7–8 % during HP, and the mixing ratio of SO2 was increased from 8.0 to 12.6–13.9 ppb. Our results highlight the great impact of coal combustion on aerosol chemistry at a high height in the city. The two secondary inorganic species of sulfate and nitrate showed different variations between NHP and HP. The sulfate contribution during HP (14–15 %) remained at similar levels as that during NHP (14 %), and the concentrations were also relatively close (6.9–11.2 vs. 8.8 µg m−3), while the nitrate contributions and mass concentrations decreased substantially from NHP (28 % and 17.9 µg m−3) to HP (15–18 % and 7.4–13.3 µg m−3).
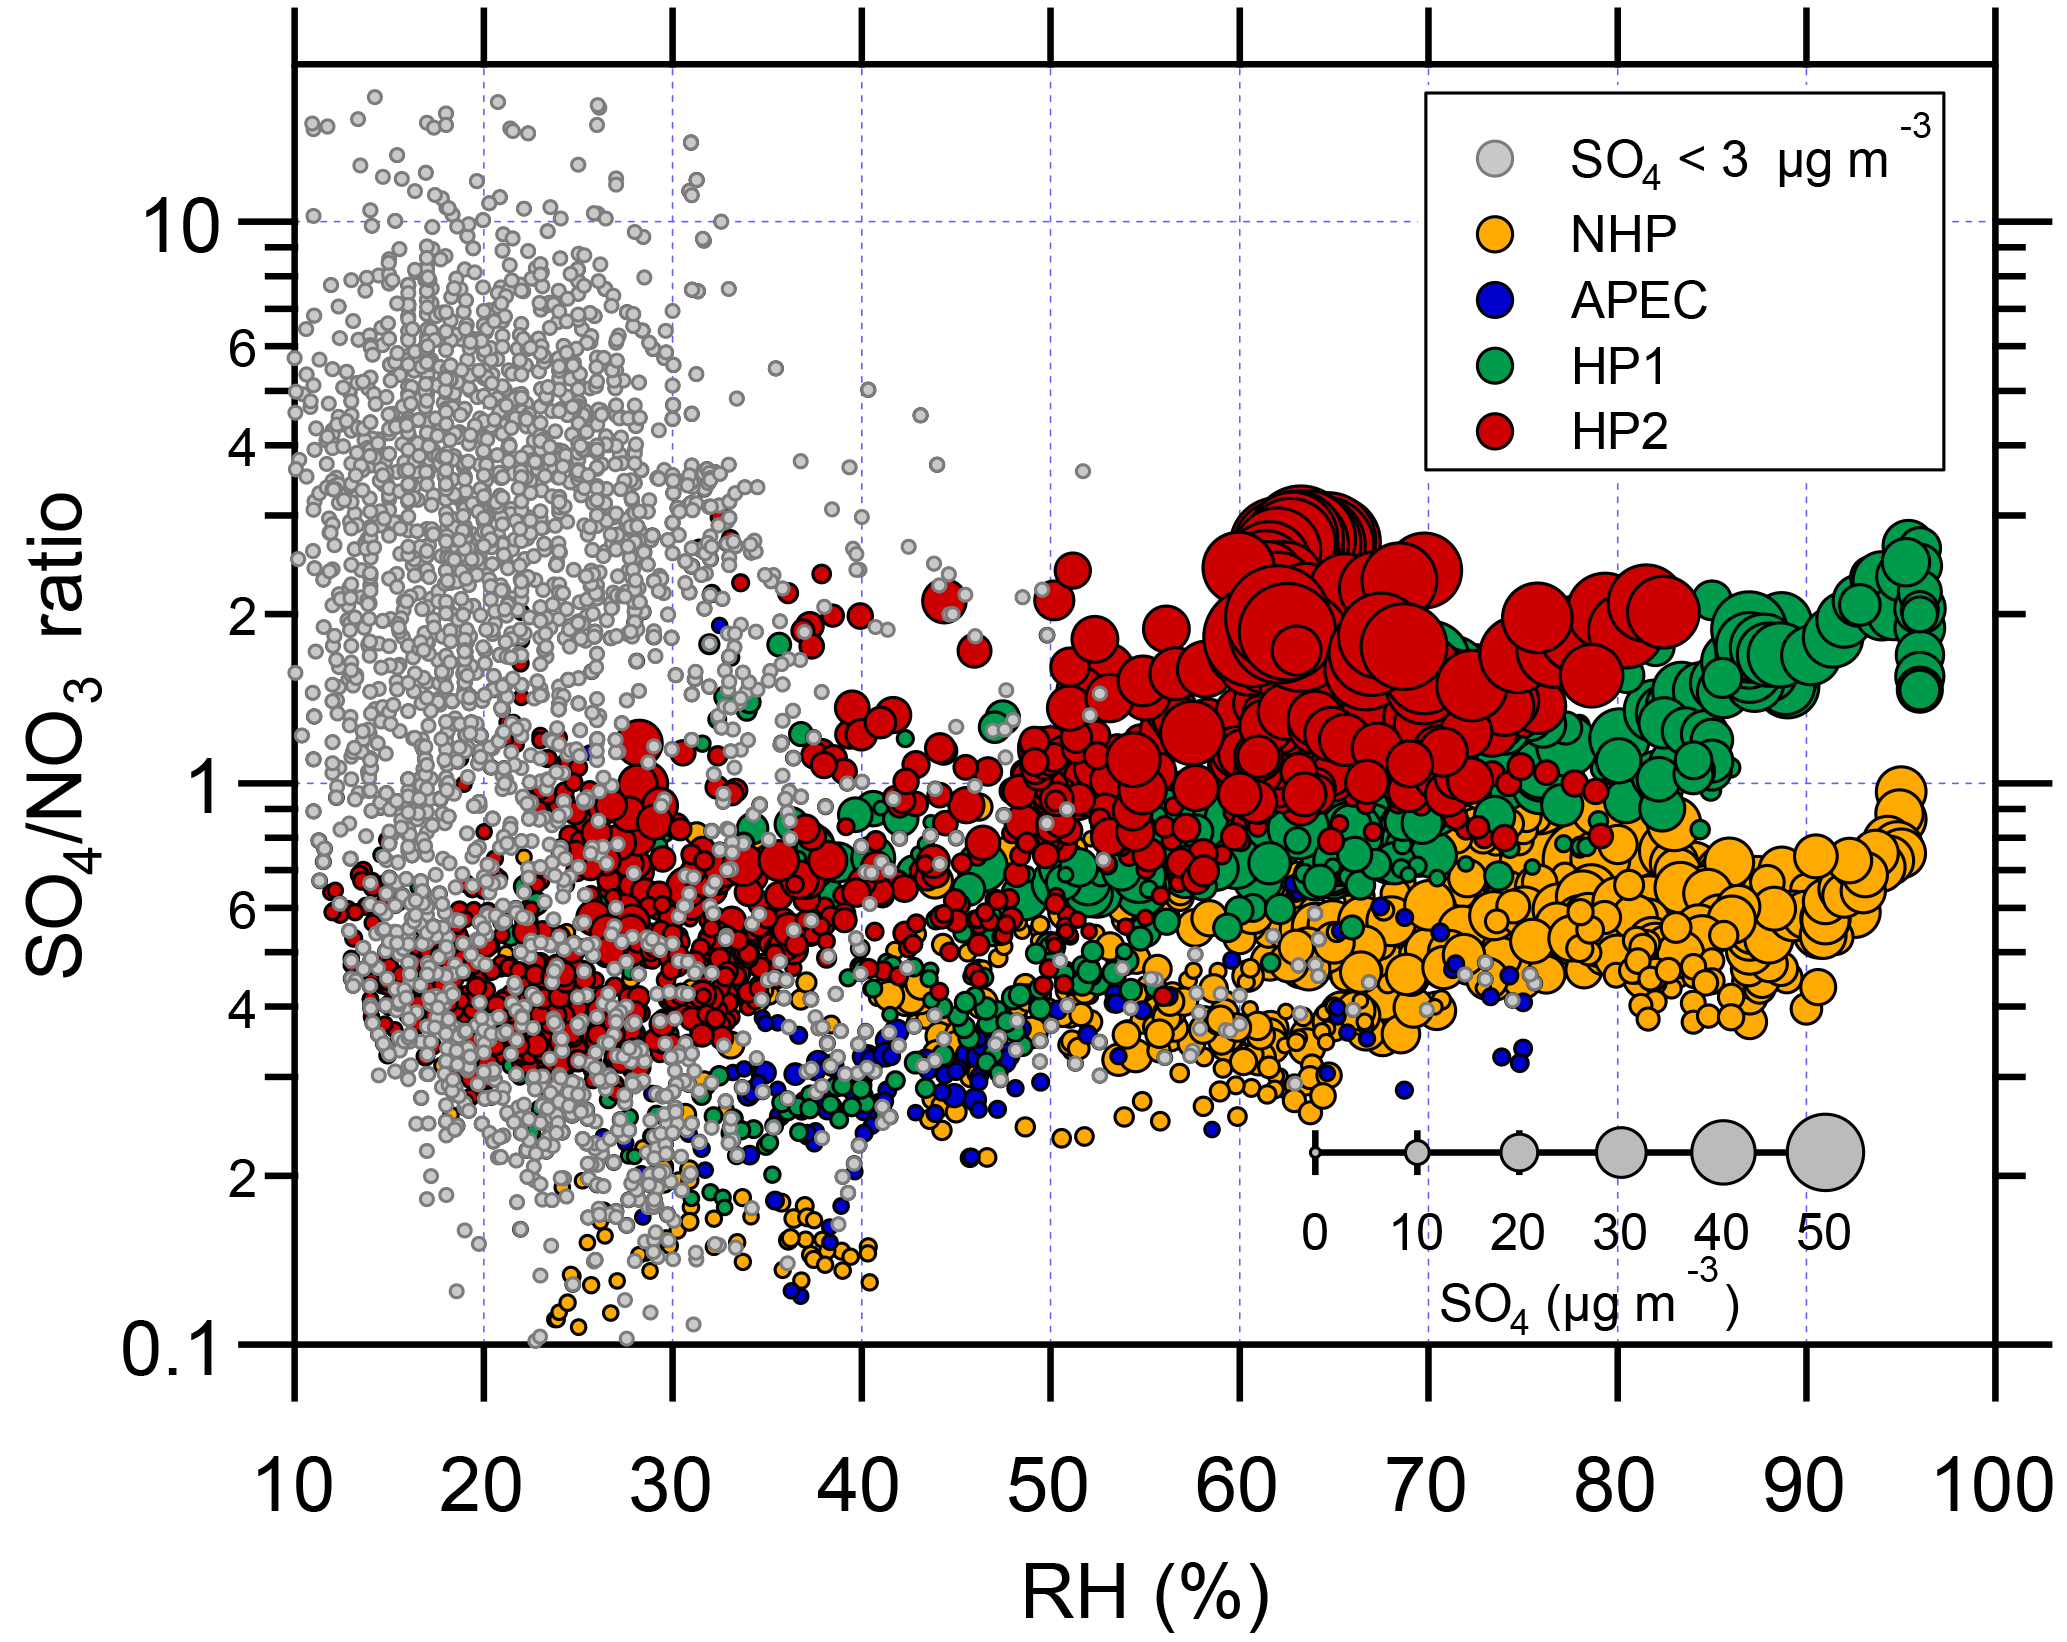
Figure 3The variations in SO4∕NO3 ratios as a function of RH during four different periods, i.e., NHP, APEC, HP1, and HP2. The marker sizes indicate the SO4 concentrations, and the data points with SO4 concentrations less than 3 µg m−3 are marked in gray.
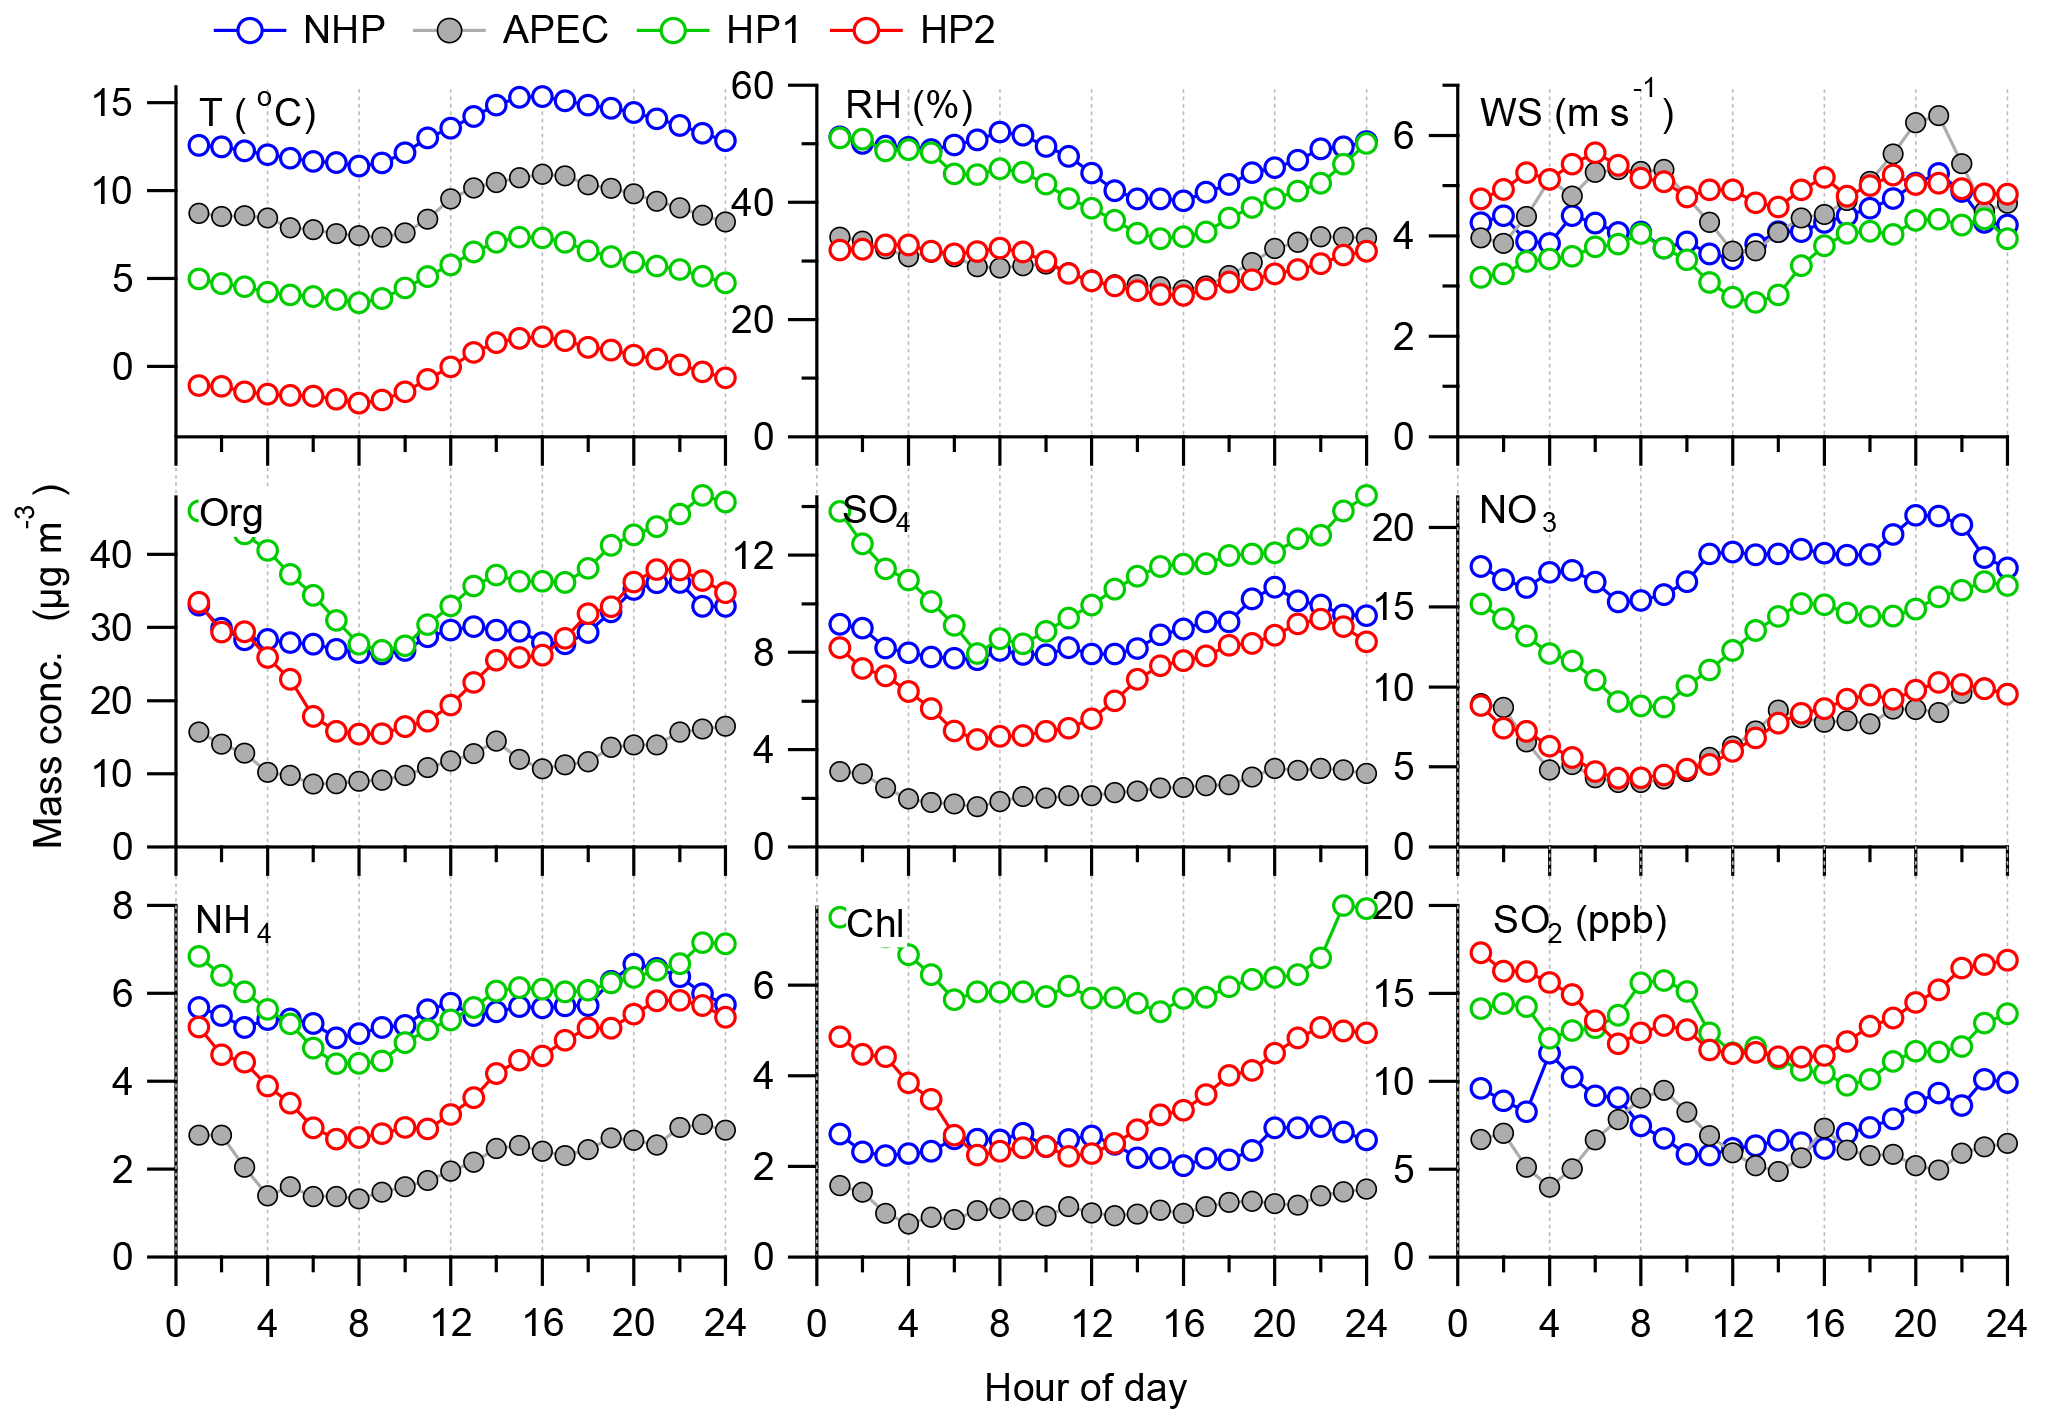
Figure 4Diurnal variations in meteorological parameters (RH, T, WS), NR-PM1 species, and SO2 during the four different periods, i.e., NHP, APEC, HP1, and HP2.
Such differences demonstrate the different formation mechanisms of nitrate and sulfate in different seasons. Nitrate appears to be mainly driven by the photochemical production in wintertime, while sulfate is mainly from aqueous-phase and/or heterogeneous reactions (Y. Sun et al., 2013). A recent study further highlights the fact that the oxidation of SO2 by NO2 in aerosol water is the major mechanism (Cheng et al., 2016). As shown in Fig. 3, the SO4∕NO3 ratios increased similarly along with RH during all periods, indicating that aerosol liquid water exerted a larger impact on the formation of sulfate than nitrate. The large increases in sulfate and SOR (sulfur oxidation ratio) during periods with high RH, for example SOR was increased from 0.09 (RH = ∼ 45 %) to 0.48 (RH = ∼ 85 %) during HP1, further support the aqueous-phase production of sulfate (Ohta and Okita, 1990). The SO4∕NO3 ratios were ubiquitously lower than 1 during NHP and APEC, suggesting a more important role of nitrate in PM pollution in autumn. Comparatively, sulfate gradually exceeded nitrate as RH increased to > 60 % during HP and became the dominant secondary inorganic species. Also note that the SO4∕NO3 ratios showed large variations (∼ 0.2–10) during periods with low sulfate mass loading (< 3 µg m−3), indicating more source variability during clean periods.
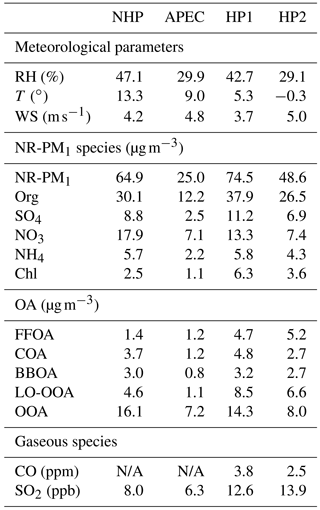
Table 1Summary of the average meteorological parameters, NR-PM1 species, OA factors, and gaseous species during four different periods (i.e., NHP, APEC, HP1, and HP2).
3.1.2 Diurnal variations of NR-PM1 species
The diurnal variations in meteorological variables, NR-PM1 species, and SO2 are presented in Fig. 4. A detailed comparison of the diurnal patterns between NHP and APEC was presented in Chen et al. (2015). As shown in Fig. 4, the diurnal patterns of meteorological parameters (RH and WS) were relatively similar between NHP and HP1 except lower T during HP1. However, the diurnal patterns of organics, sulfate, and chloride showed ubiquitously higher concentrations during HP1 than NHP throughout the day, supporting the significant influences of coal combustion emissions on these three species (Wang et al., 2015). Two clear organic peaks occurring at lunchtime and dinnertime were observed during both periods, highlighting the influences of cooking emissions at high heights in urban Beijing. Note that the differences in organics at nighttime (∼ 30–50 %) were larger than those (< 30 %) during daytime, consistent with the enhanced coal combustion emissions at nighttime. We also noticed that all NR-PM1 species during HP1 showed similar diurnal behaviors that were first characterized by gradual decreases from midnight to early morning (∼ 08:00) and then increases during the rest of the day. We found that such diurnal patterns were strongly associated with the daily changes in wind direction. For example, the winds were dominantly from the north at nighttime, while they switched to the south–southwest after 12:00 (Fig. S6 in the Supplement). The increases between 08:00 and 12:00 can be explained by the corresponding decreases in wind speed (Fig. 4).
The diurnal patterns of NR-PM1 species during HP2 were similar to those during HP1, yet the mass concentrations were much lower. For example, nitrate showed the largest decrease by 34–55 % followed by sulfate (27–48 %) and organics (13–50 %) during HP2. Considering the similar emission sources between HP1 and HP2, such decreases can be explained by more frequent northwesterly winds that were associated with higher wind speed and lower RH during HP2 (Fig. 4). This is further supported by the fact that the polluted episodes showed much smaller differences between HP1 and HP2 (e.g., ∼ 20 % for NR-PM1; discussed in Sec. 3.3). In addition, the reduced photochemical processing as indicated by the decrease in nitrate during HP2 also played a role. We also note that SO2 at nighttime during HP2 was even higher than that during HP1, suggesting less transformation of SO2 into sulfate due to drier conditions (RH = ∼ 30 %). Our results demonstrate that meteorological conditions are a critical factor affecting the PM levels during the heating season in addition to coal combustion emissions. For example, favorable meteorological conditions can cause an average decrease in NR-PM1 by 35 %, varying from 26 to 44 % for different aerosol species (Table 1). Therefore, it is critically important to exclude meteorological effects for an accurate evaluation of the impacts of source emission changes on air quality.
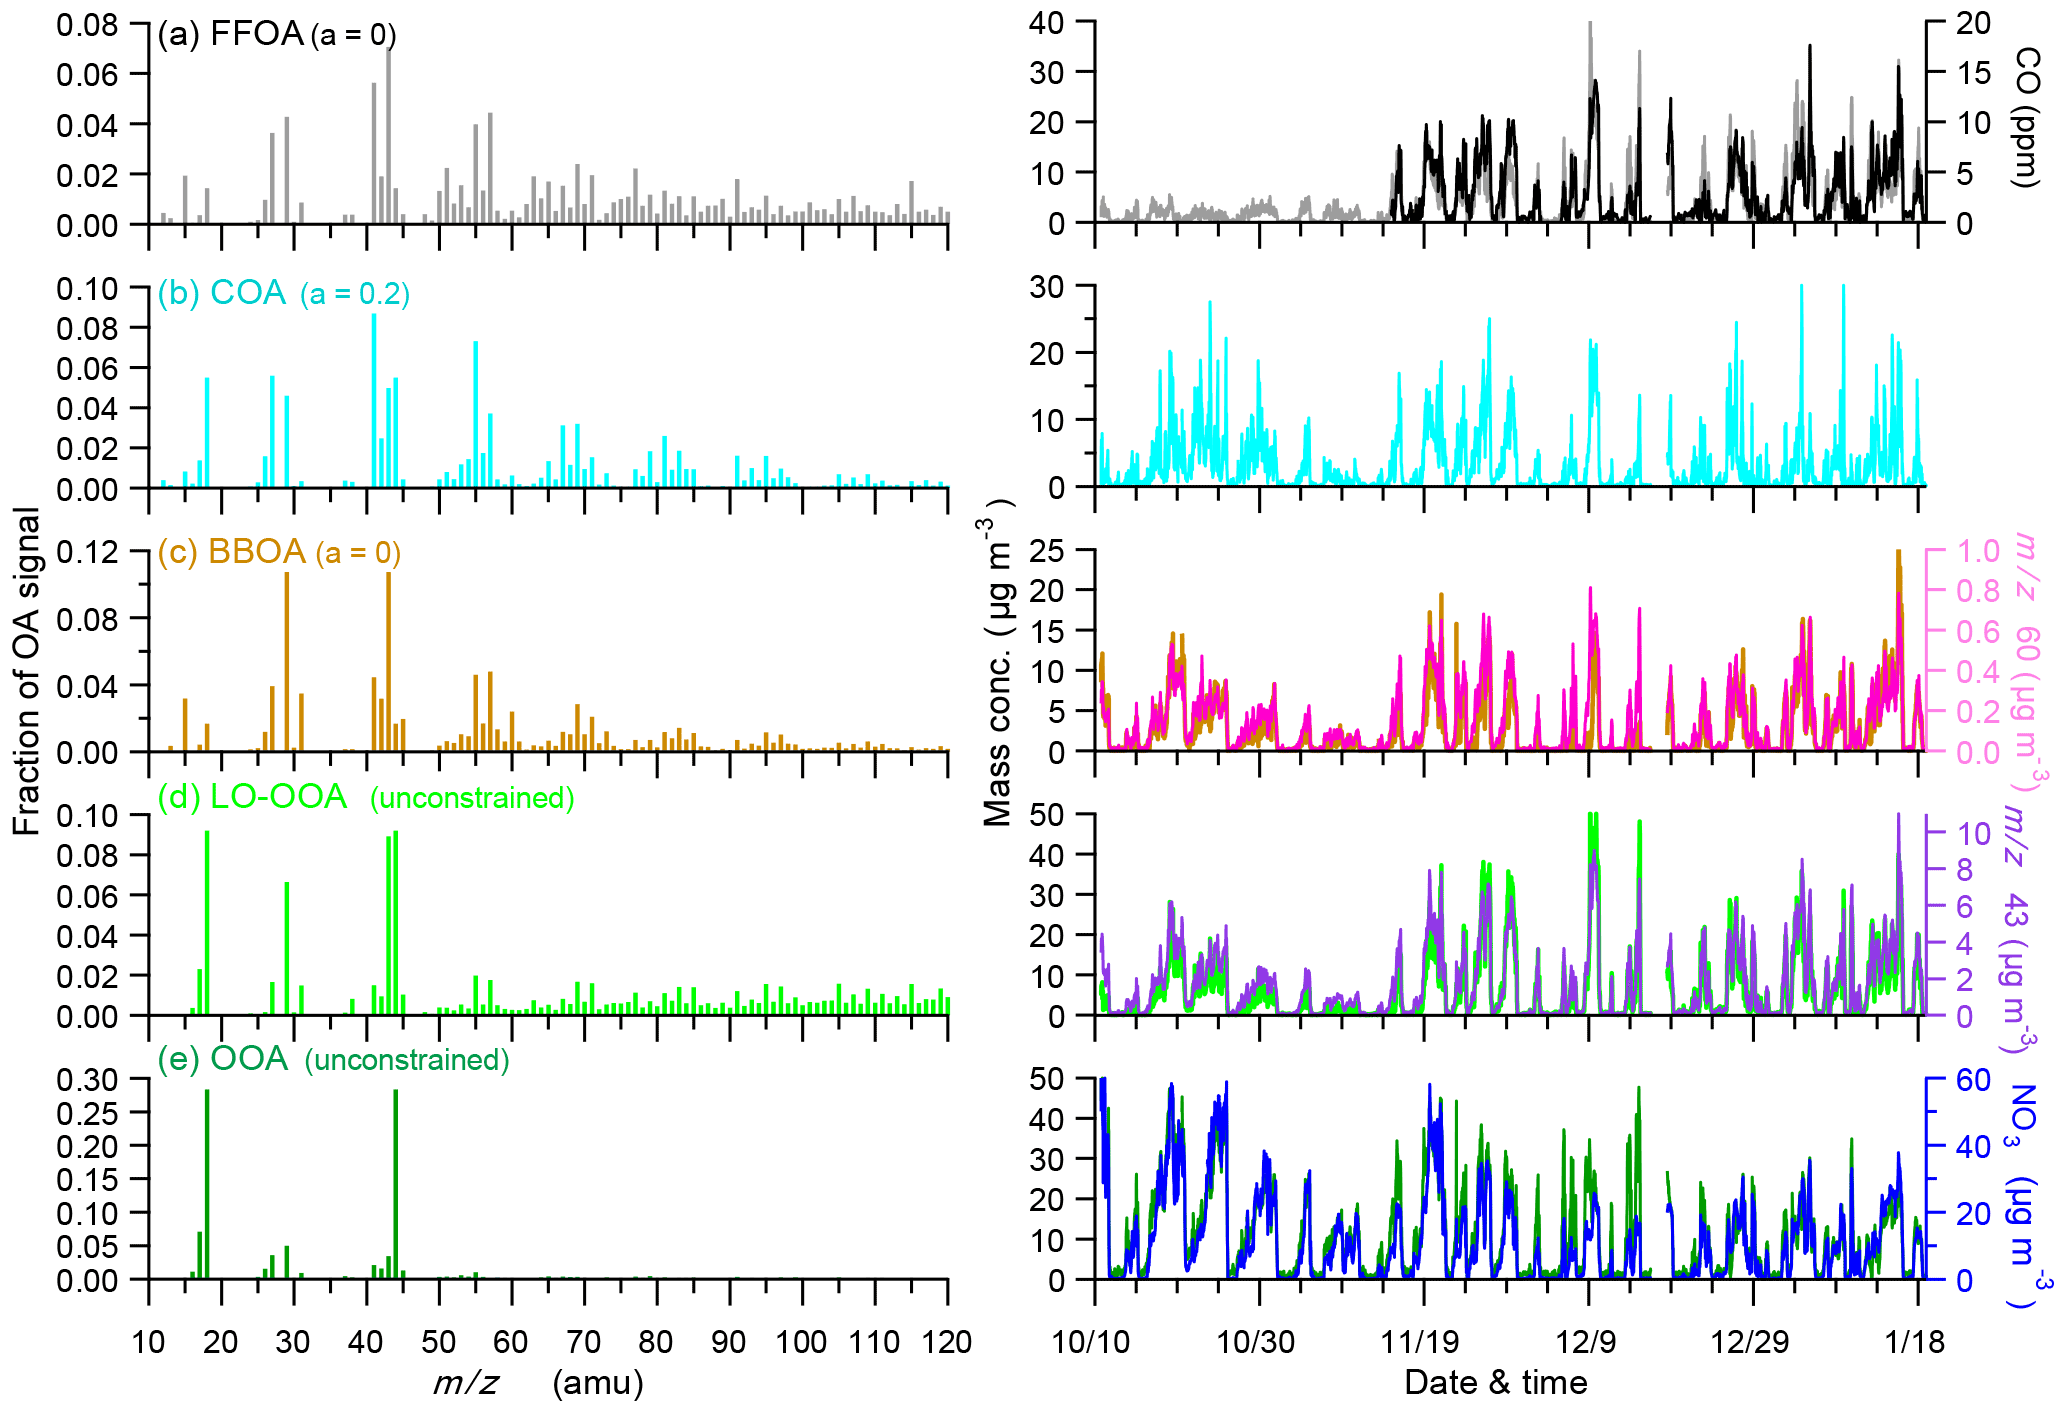
Figure 5Mass spectra (left panel) and time series (right panel) of five organic aerosol (OA) factors including (a) fossil-fuel-related OA (FFOA), (b) cooking OA (COA), (c) biomass burning OA (BBOA), (d) less oxidized oxygenated OA (LO-OOA), and (e) oxygenated OA (OOA). Also shown in the right panels are the time series of other tracers including CO, nitrate, m∕z 60, and m∕z 43.
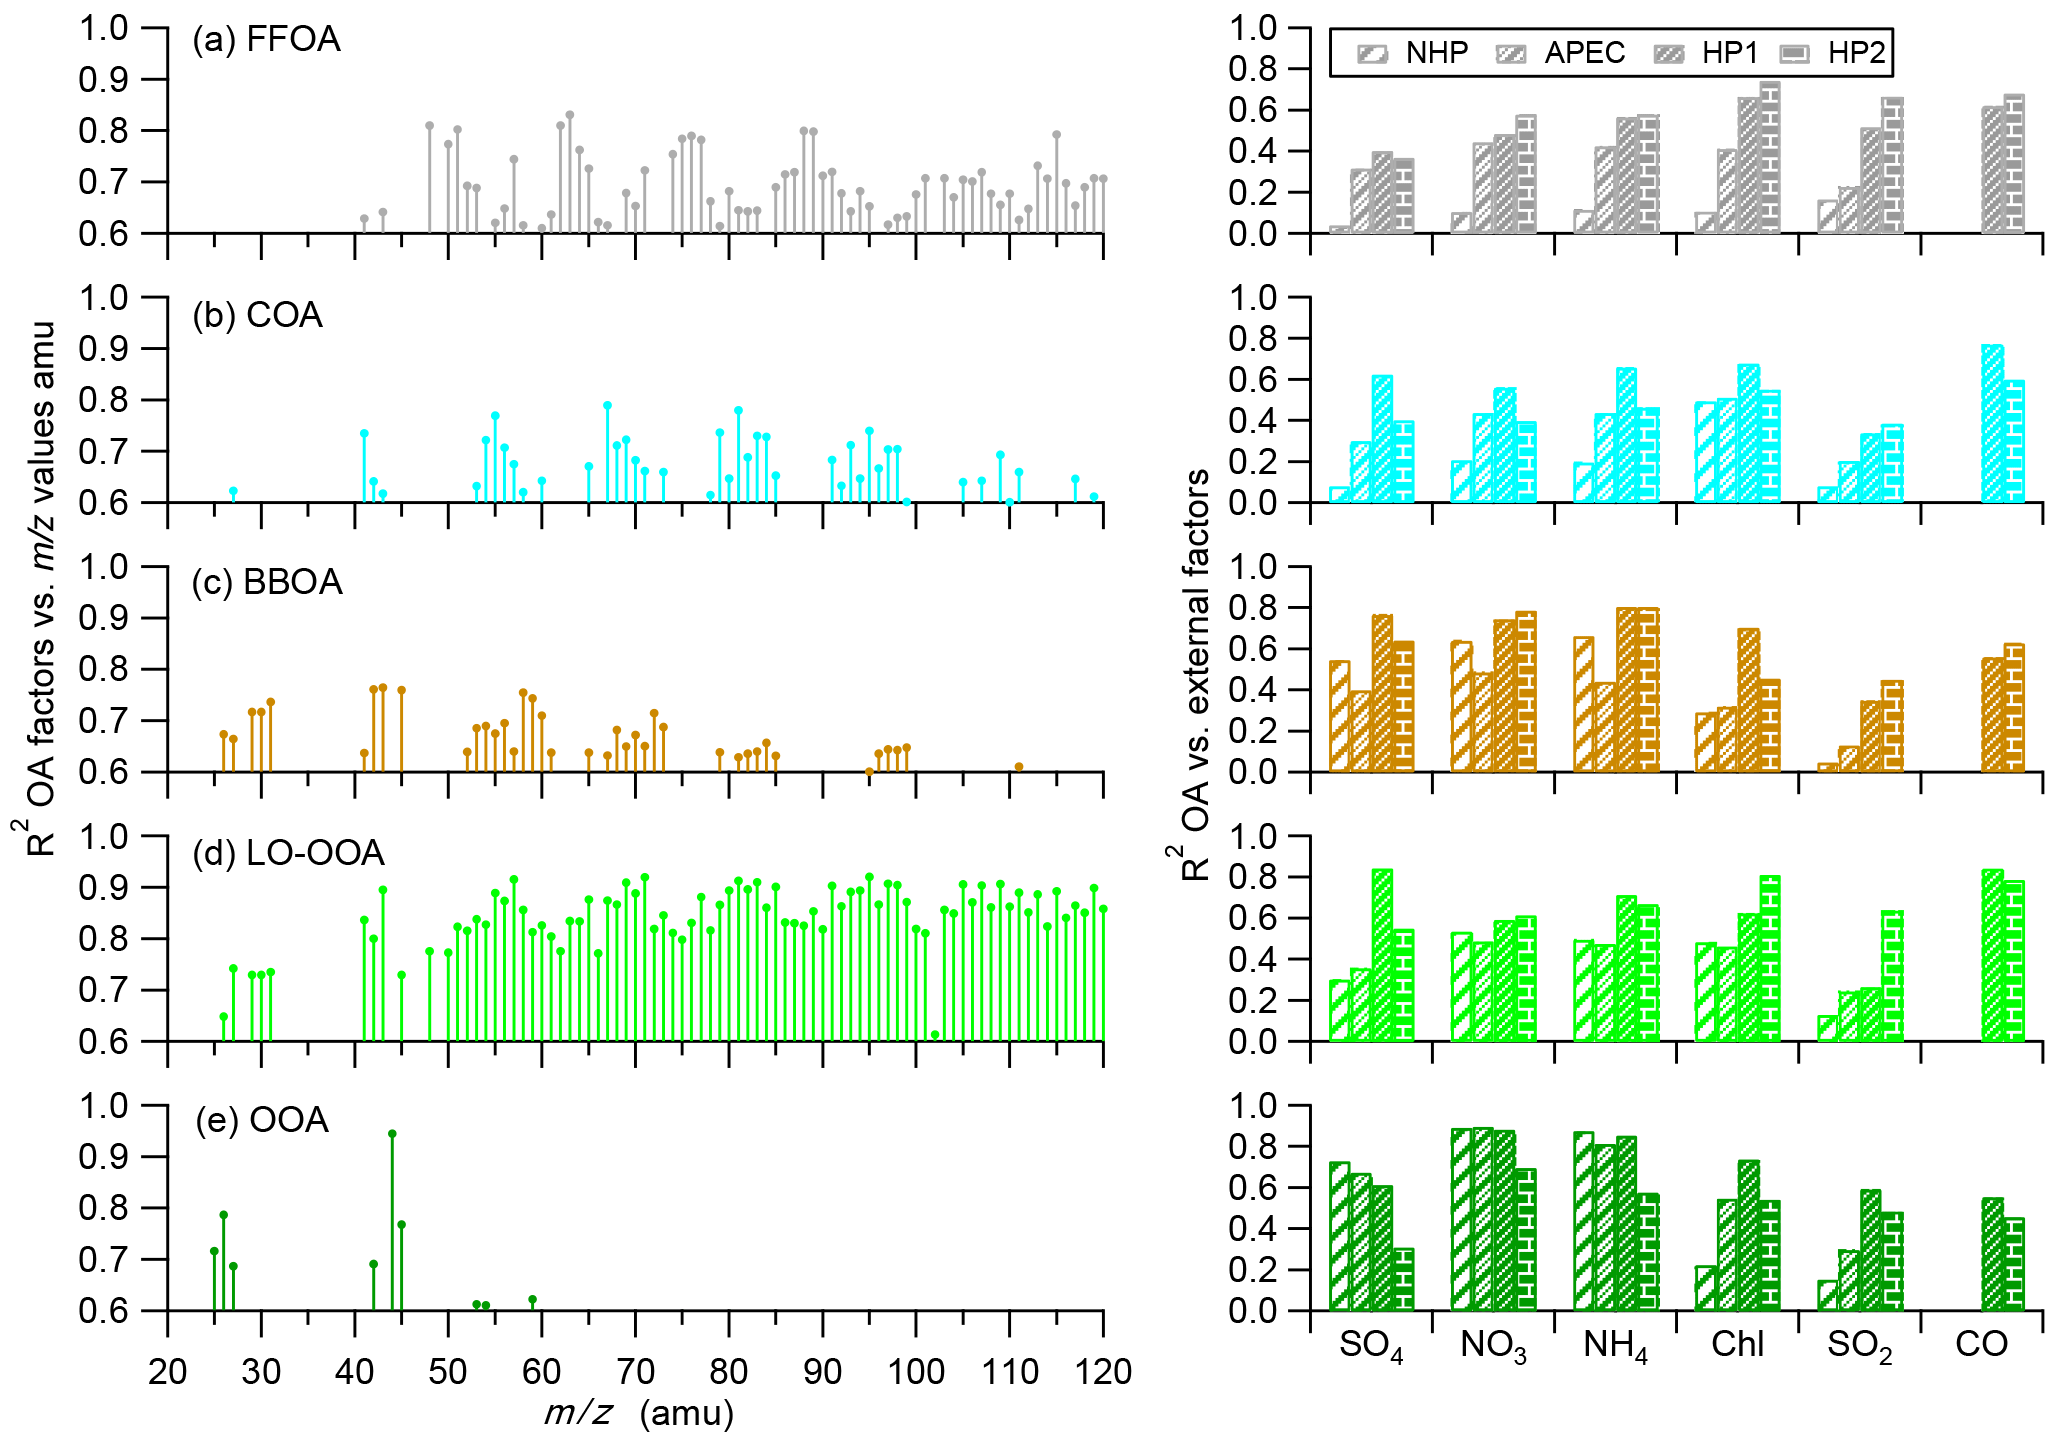
Figure 6Correlations among the five OA factors, m∕z values (left panel), and external tracer species (right panel) during the four different periods, i.e., NHP, APEC, HP1, and HP2.
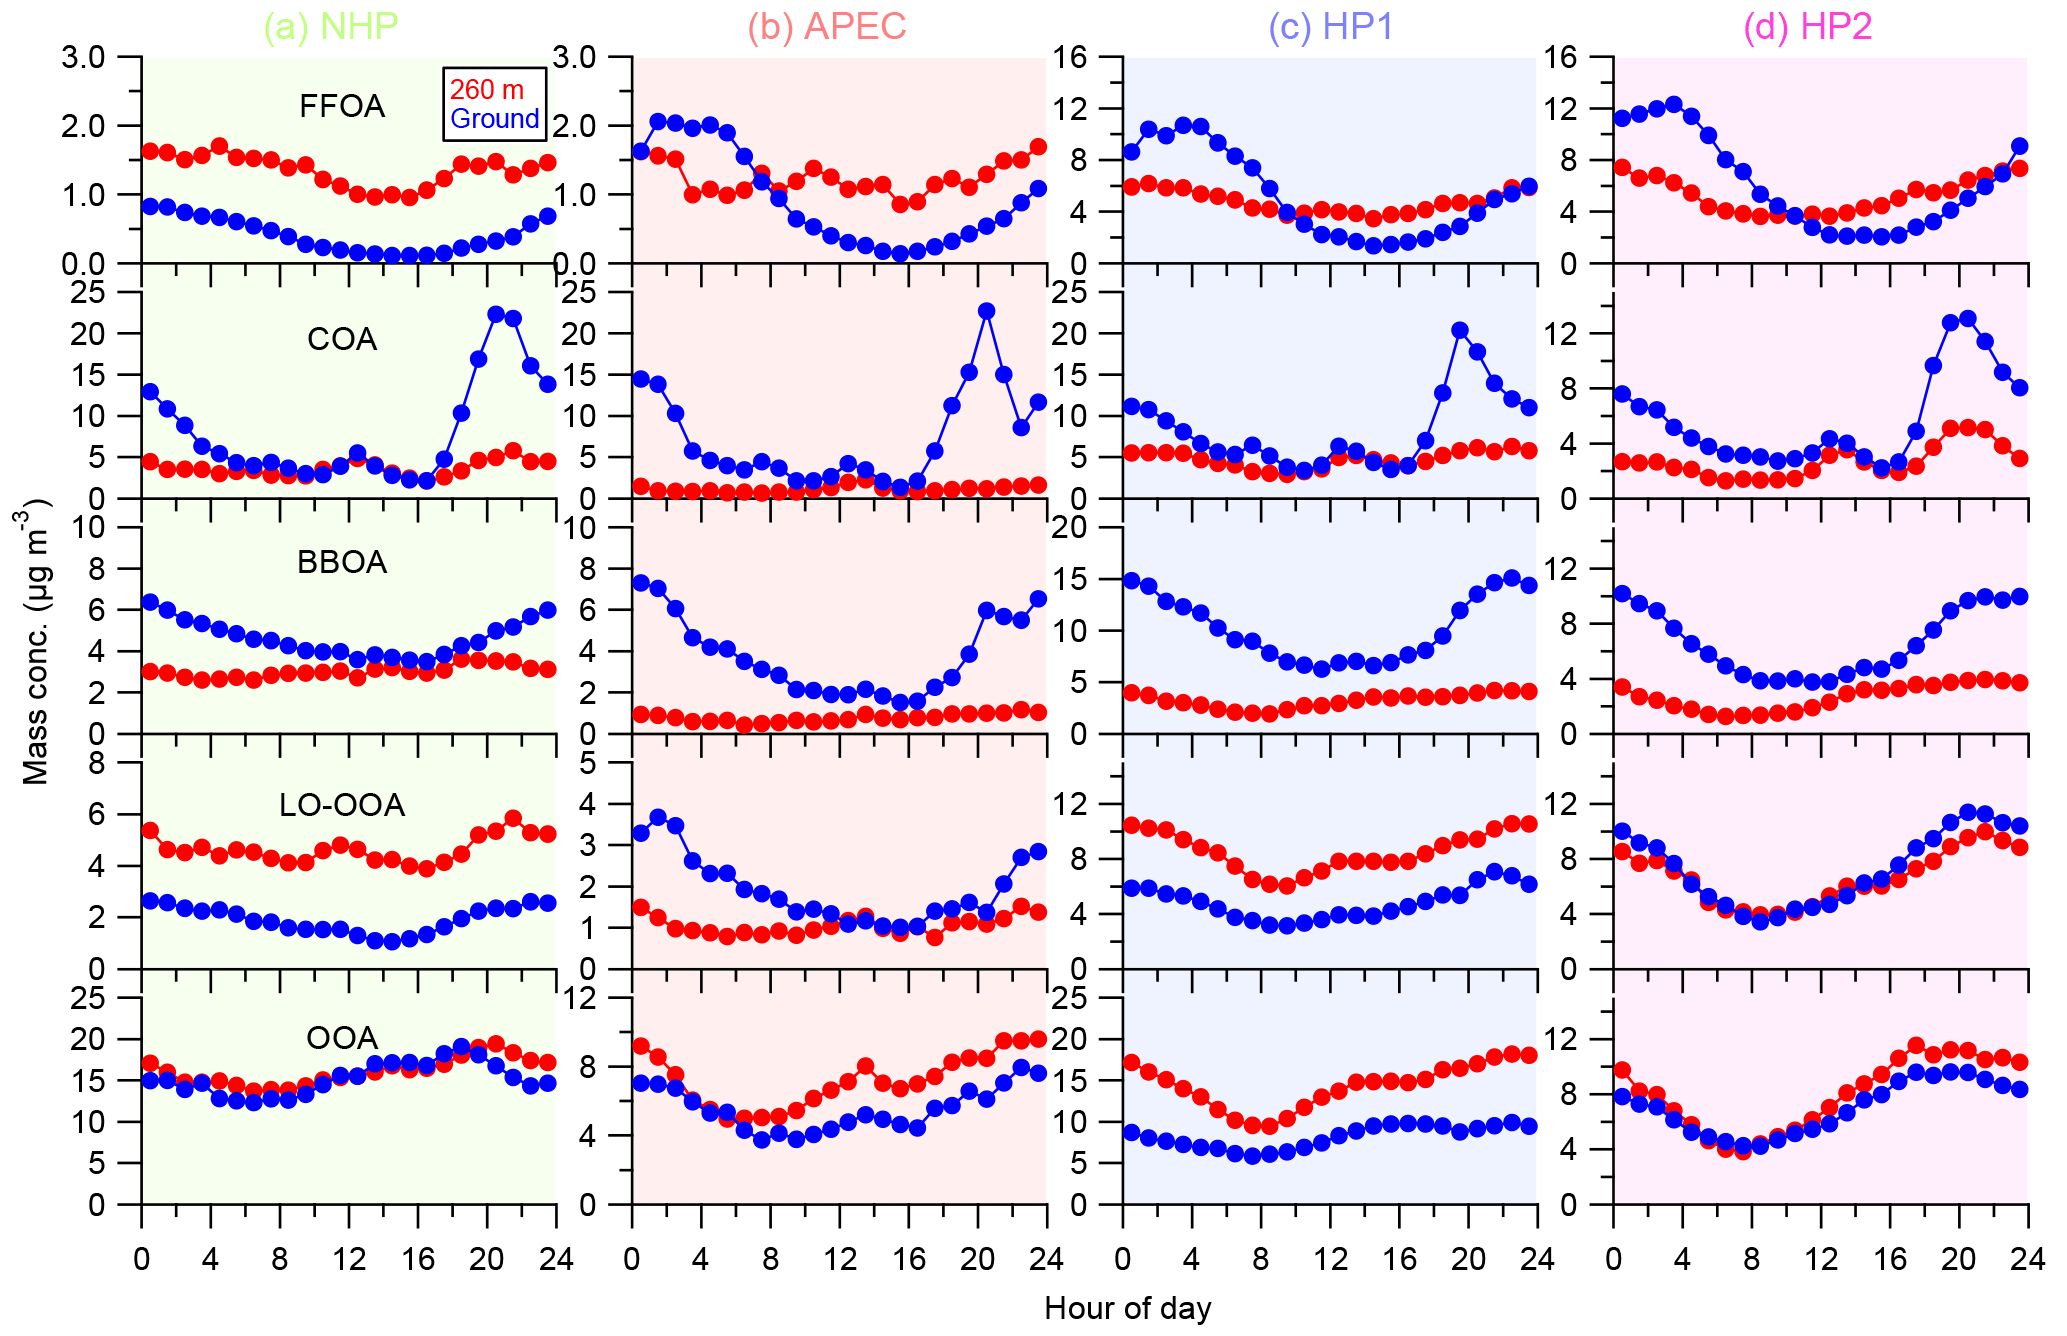
Figure 7Diurnal cycles of OA factors during the four different periods (a–d), i.e., NHP, APEC, HP1, and HP2. The OA factors resolved at the ground site are also shown for comparison.
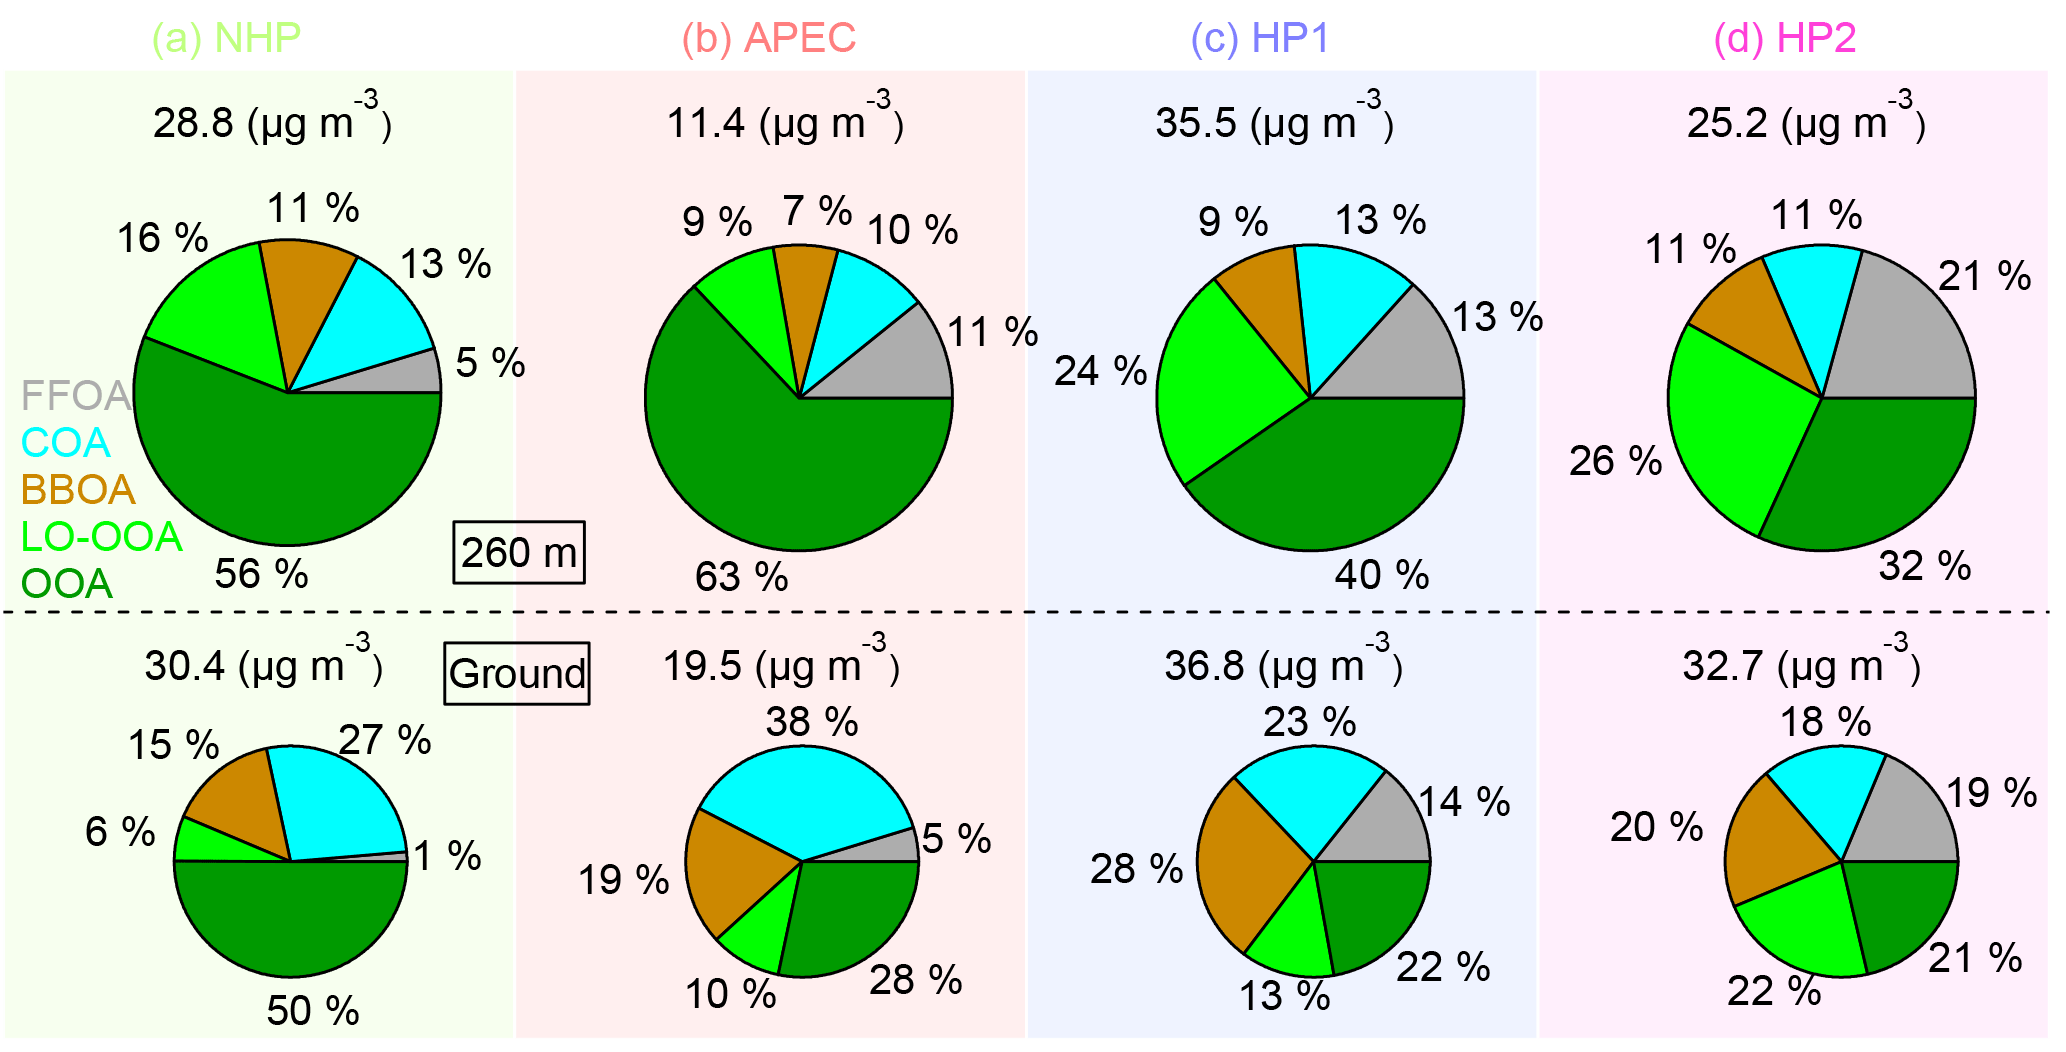
Figure 8Average composition of OA during four different periods (a–d), i.e., NHP, APEC, HP1, and HP2. The OA factors resolved at the ground site are also shown for comparison (bottom panel).
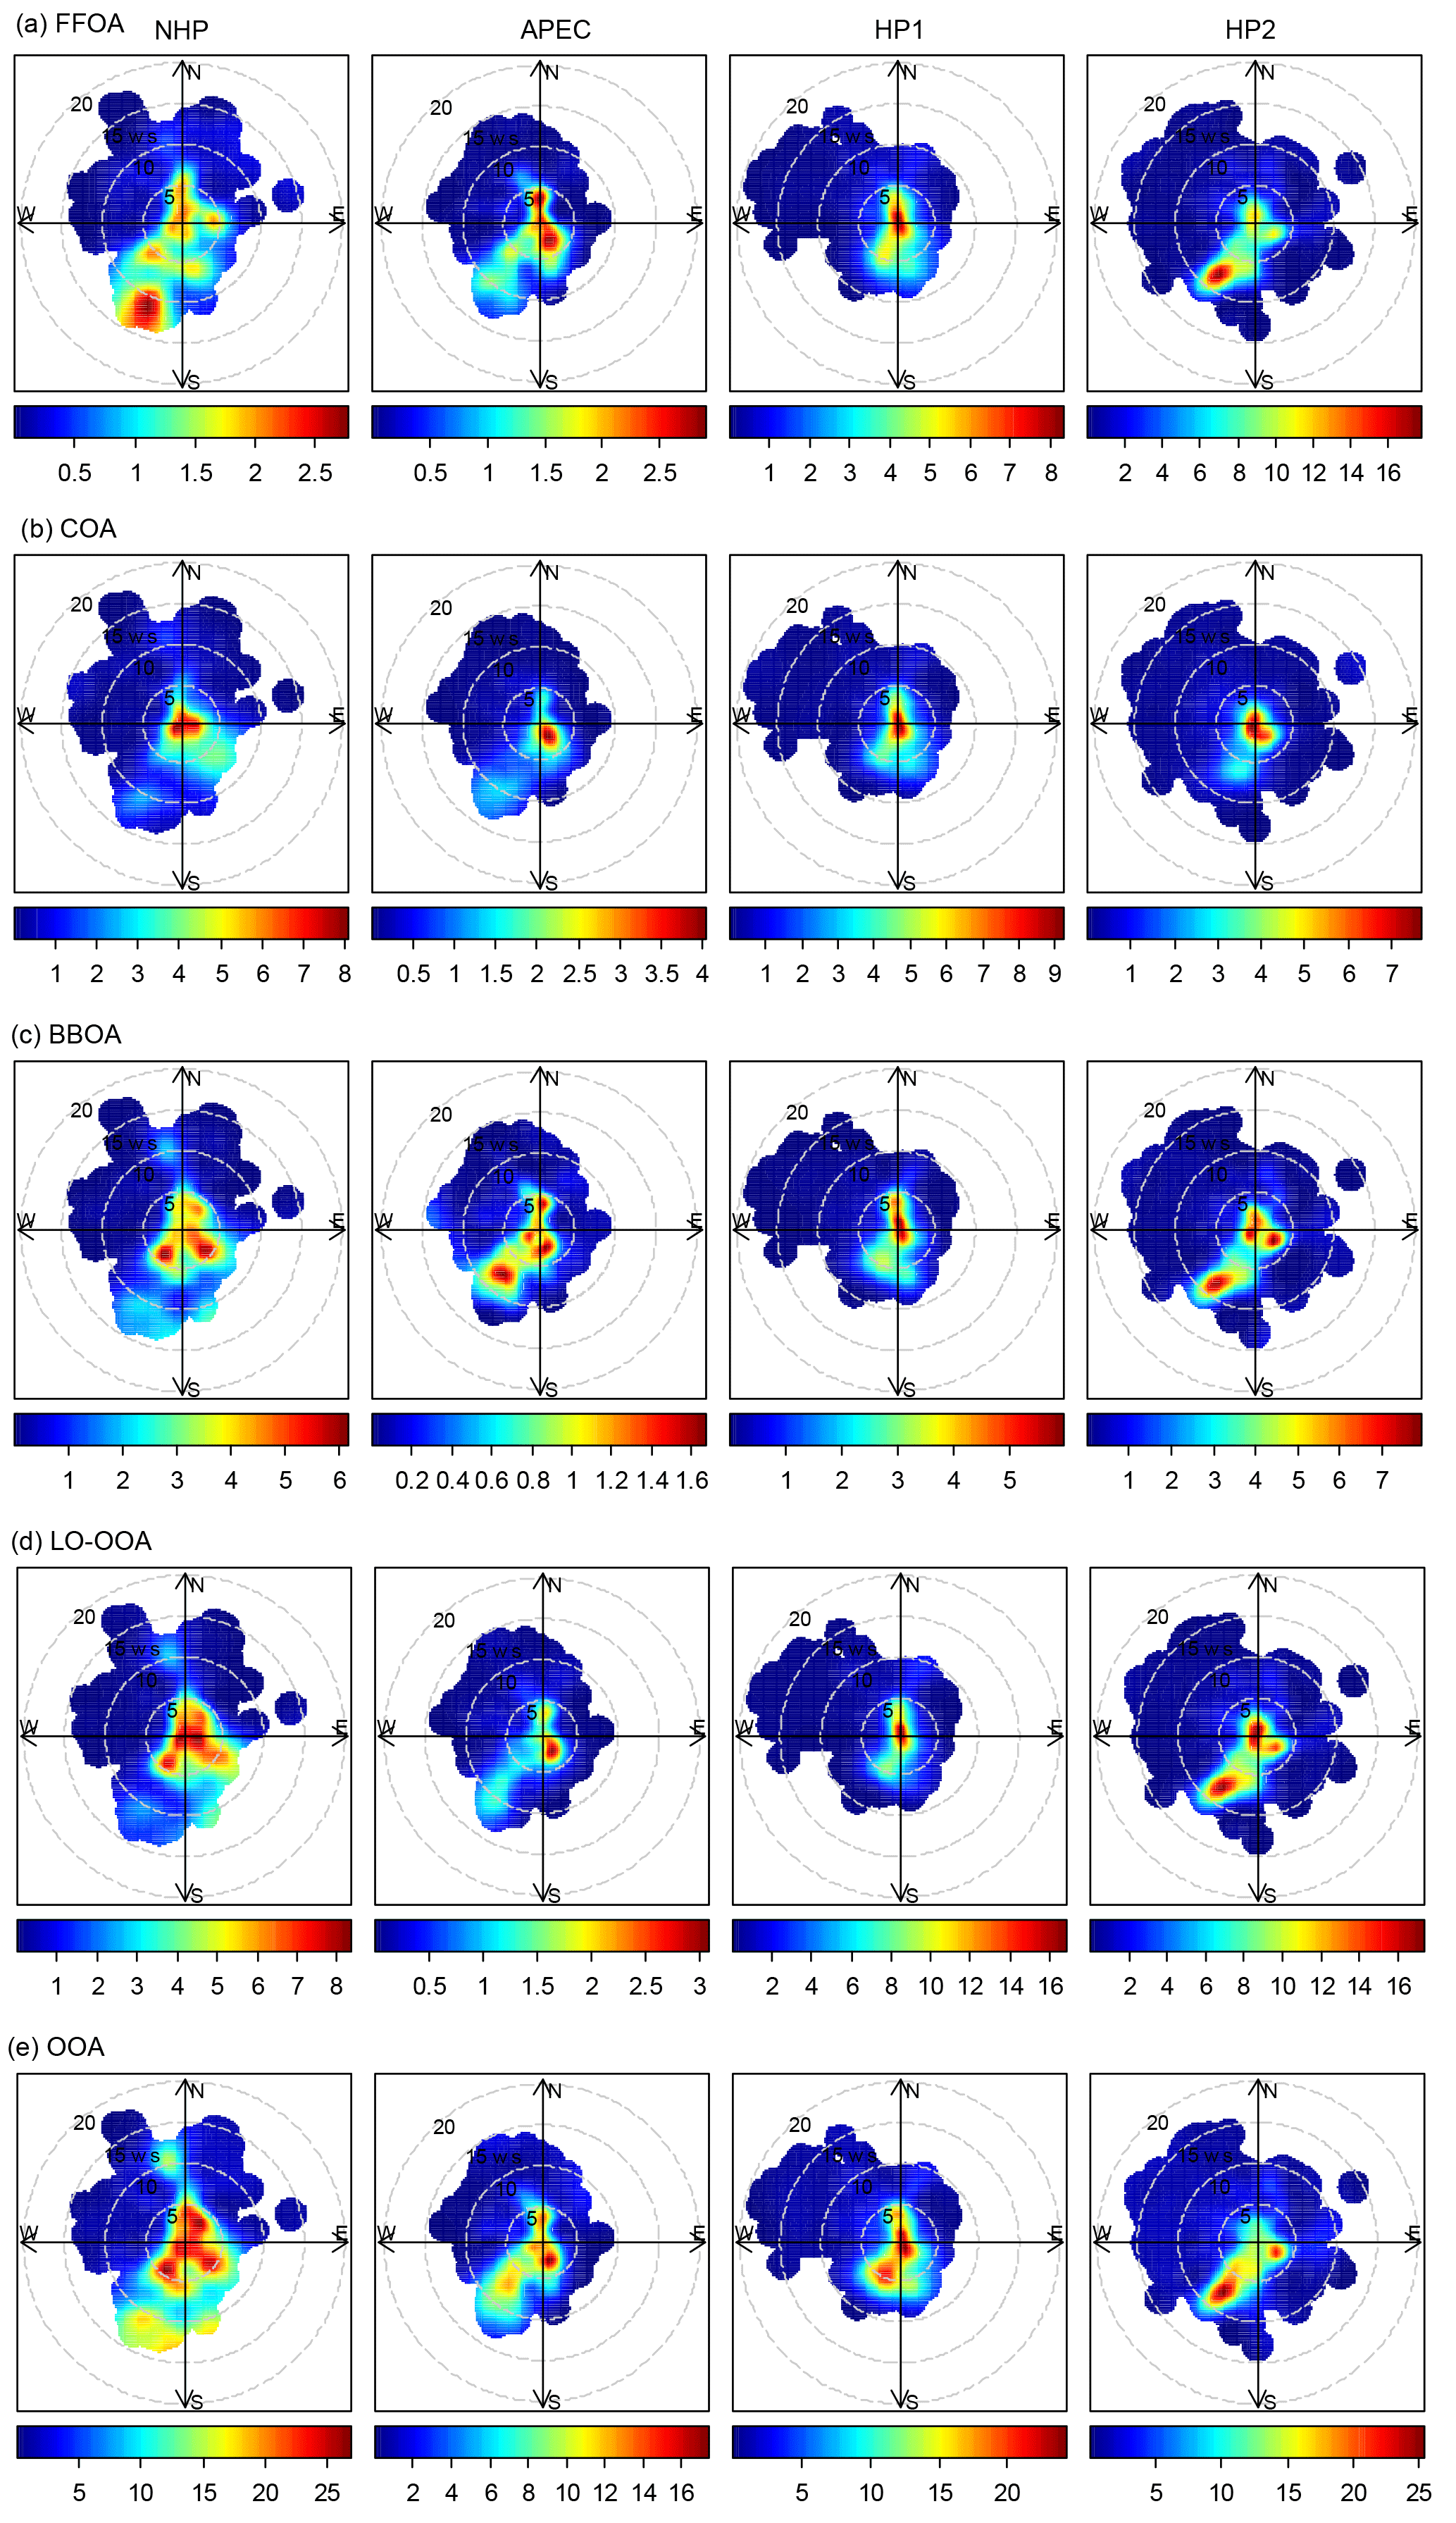
Figure 9Bivariate polar plots of the mass concentrations of five OA factors (a–e) at 260 m as functions of wind direction and wind speed (m s−1) during the four different periods.
3.2 OA composition, sources, and variations
3.2.1 Fossil-fuel-related organic aerosol (FFOA)
The FFOA spectrum shows prominent hydrocarbon ion series (m∕z 27, 41, 55) and (m∕z 29, 43, 57), yet the spectral pattern resembles that of burning of smoky coal (Lin et al., 2017) more than the standard traffic-related HOA (R2 = 0.79; Ng et al., 2011). These results suggest that FFOA at 260 m is likely dominantly from coal combustion emissions rather than traffic emissions, consistent with the better correlations between FFOA and chloride and SO2 during HP than NHP (Fig. 6). FFOA was also tightly correlated with CO, a tracer for combustion emissions, during HP (R2 = 0.62–0.68). As shown in Fig. 5a, the temporal variation in FFOA showed a dramatic increase after the heating season starts on 15 November. The average concentrations of FFOA during HP1 and HP2 were 4.7 and 5.2 µg m−3, respectively, which is nearly 3 times higher than those during NHP and APEC (1.2–1.4 µg m−3), indicating largely enhanced coal combustion emissions during the heating season. Correspondingly, the FFOA contributions to OA also showed large increases from 5 % during NHP to 13–21 % during HP. FFOA showed a pronounced diurnal cycle during HP1 and HP2 with a nearly twice higher concentration at nighttime than daytime. However, the diurnal pattern was less significant during NHP, indicating the dominant source of regional transport for FFOA at 260 m. The bivariate polar plot of FFOA (Fig. 9a) further indicates that the high concentration of FFOA during NHP was dominantly from regional transport in the southwest. Consistently, the FFOA concentration at 260 m was much higher than that at ground level throughout the day (average: 0.4 µg m−3) during NHP when coal combustion emissions were not important inside the fifth ring road of the city. The diurnal patterns of FFOA were substantially different between ground level and 260 m during HP. Particularly, the diurnal cycles at ground level showed much larger day and night differences. As shown in Fig. 7c and d, the FFOA concentrations at ground level started to drop rapidly at ∼ 03:00–04:00 and reached the minimum at ∼ 14:00. One explanation is the largely enhanced coal combustion emissions at nighttime for residential heating in local areas. In comparison, the diurnal cycles of FFOA at 260 m were mainly much smoother, and the concentrations in the daytime were even higher than those at ground level. One explanation is the frequent temperature inversions at nighttime that suppressed the vertical convection of local FFOA to high heights. We also noticed slightly higher FFOA concentrations during HP2 (5.2 µg m−3) than HP1 (4.7 µg m−3). The bivariate polar plots in Fig. 9a show a high FFOA concentration (> 12 µg m−3) region in the southwest during HP2, while it was negligible during HP1 but primarily from the local area. Such a difference in source regions explained the higher FFOA concentration during HP2 than HP1.
3.2.2 Cooking organic aerosol (COA)
COA that contributes a large fraction of OA at ground level in megacities has been widely characterized (Allan et al., 2010; Sun et al., 2011; Mohr et al., 2012; Crippa et al., 2013). However, the characteristics of COA at high heights in megacities were poorly characterized. Our results showed similar diurnal cycles of COA at 260 m to those observed in Beijing and other urban sites (Huang et al., 2010; Sun et al., 2012; Xu et al., 2014), which were characterized by two pronounced peaks at meal times. The noon COA peak at 260 m was relatively comparable to that at ground level, mainly due to the vertical mixing associated with the rising boundary layer during daytime. In fact, the COA concentrations were almost the same between ground level and 260 m in the late afternoon (∼ 16:00). In contrast, the night COA peak at 260 m was significantly lower than that at ground level. One explanation is the shallow boundary layer and frequent temperature inversions at night suppressed the vertical mixing of COA to a high altitude. Figure 9b shows that the high concentration of COA was mainly located in a small region near the sampling site during all periods, highlighting the dominant local sources of COA. Indeed, the COA mass concentrations were relatively comparable (2.7–4.8 µg m−3) across different periods except APEC (1.2 µg m−3) with strict emission controls (Fig. 5). This is consistent with the fact that cooking emissions are relatively stable during all seasons. The average contributions of COA were also close during four periods, ranging from 10–13 %, yet ubiquitously lower than those (18–38 %) observed at the ground site (Xu et al., 2015). Previous studies have shown that the impact of COA is spatially limited as the concentration decreases rapidly outside of the city (Ots et al., 2016). Our results illustrated the influences of cooking emissions on OA at high heights in megacities, and the impacts are expected to be vertically limited as the concentration decreases with the increasing height.
3.2.3 Biomass burning OA (BBOA)
The average concentrations of BBOA were comparable between NHP (3.0 µg m−3) and HP (2.7–3.2 µg m−3), suggesting that biomass burning was an important source of OA at 260 m in both autumn and winter. Indeed, BBOA accounted for a considerable fraction, 11 and 9–11 % during NHP and HP, respectively, of total OA. The BBOA concentration at 260 m was decreased by ∼ 70 % during APEC, which is much higher than that (16 %) at the ground site (Xu et al., 2015). One explanation is that BBOA during APEC was more from regional transport at 260 m (Fig. 9c), while there were still considerable local biomass burning emissions near the sampling site. Note that BBOA was better correlated with secondary inorganic species during NHP and HP (R2 = 0.54–0.80) than chloride (Fig. 6), suggesting that BBOA at 260 m was likely relatively well mixed with secondary species over a regional scale. This is also consistent with their similar diurnal patterns (Fig. 4). Although the contributions of BBOA to OA were comparable (7–11 %) during the four periods, the sources can be very different. For example, BBOA was mainly from the southwest and southeast of Beijing during NHP, while the concentrations were low in the nearby regions (Fig. 9c). These results suggest that regional transport was the major source of BBOA at 260 m during NHP. Comparatively, BBOA during APEC and HP2 was from both local emissions and transport from the southwest, while it was primarily from local source emissions during HP1. The diurnal variations in BBOA at ground level also showed much higher concentrations at nighttime than daytime during all periods, supporting strong local biomass burning sources. Indeed, BBOA at ground level accounted for 20–28 % of OA during HP, which is more than twice that at 260 m (9–11 %).
3.2.4 Secondary organic aerosol (OOA and LO-OOA)
The mass spectra of two SOA (LO-OOA and OOA) factors were both characterized by the prominent peak of m∕z 44 (mainly ; Aiken et al., 2009). OOA showed much higher f44 than LO-OOA (0.28 and 0.09, respectively), indicating that OOA was more oxidized than LO-OOA (Aiken et al., 2008). Note that LO-OOA was highly correlated with large m∕z values (Fig. 6), which appears different from previous findings that POA typically correlates better with high m∕z values (Sun et al., 2016b). We noticed that LO-OOA showed much better correlations with external trace species during HP than NHP and APEC. Particularly, LO-OOA was well correlated with chloride (R2 = 0.71–0.81) and CO (R2 = 0.79–0.84) that were dominantly from coal combustion emissions in the heating season. In addition, the mass spectrum of LO-OOA presented a much higher f43∕f44 (f43, fraction of m∕z 43) ratio than previous studies (Wang et al., 2016). All these facts suggest that LO-OOA here was very likely a combustion-related SOA. Consistently, the LO-OOA mass concentrations showed large enhancements from 4.6 and 1.1 µg m−3 during NHP and APEC to 8.5 and 6.6 µg m−3 during HP1 and HP2, respectively, supporting more fresh SOA production due to enhanced combustion emissions. We also note that the LO-OOA at 260 m was nearly twice that of the ground site during NHP and HP1, while it was comparable during HP2. These results might indicate that polluted conditions with high RH are subject to form more LO-OOA at high altitudes.
OOA dominated OA during both NHP and APEC, accounting for 56 and 63 %, respectively. In contrast, the contribution of OOA was largely reduced during HP, accounting for 32–40 % of OA. This result indicates a large reduction in the production of more oxidized SOA in the heating season. As shown in Fig. 6, OOA was highly correlated with nitrate during all four different periods (R2 = 0.70–0.90), indicating that OOA is likely dominantly from photochemical production of nitrate (Y. L. Sun et al., 2013). Figure 7 shows that OOA increased significantly in the afternoon due to photochemical processing, while LO-OOA was less significant. We noticed that OOA was correlated with sulfate during NHP and APEC (R2 = 0.73 and 0.67) and also periods with high RH during HP1 and HP2 (Fig. S7 in the Supplement). These results together indicate that OOA likely contains two different types of SOA associated with photochemical and aqueous-phase processing, yet it is difficult to separate an aqueous-phase SOA factor of HR-AMS due to the limited sensitivity of the ACSM and limited specificity of the mass spectra (Sun et al., 2016b).
Overall, OA composition at 260 m varied substantially during the four periods. SOA dominated OA during all periods although the contributions were decreased from 72 % during NHP to 58–64 % during HP. The SOA composition also changed significantly, and particularly LO-OOA showed large increases from 9–16 % during NHP to 24–26 % during HP. Correspondingly, the OOA contribution was decreased from 56–63 to 32–40 %. Compared to the ground site, OA showed a 15–34 % higher SOA contribution at 260 m, highlighting the importance of SOA at high altitudes in urban areas. In contrast, POA (FFOA + COA + BBOA) played a more important role in PM pollution at ground during HP by accounting for 57–65 %. Particularly, the contributions of COA and BBOA at the ground site were nearly twice those at 260 m. The large differences in OA composition between ground level and 260 m have significant implications, and measurements at high heights are of great importance for validating and improving the model simulations of POA and SOA in future studies.

Figure 10Comparisons of the chemical composition of (a) NR-PM1 and (b) OA between the clean periods and polluted episodes that are marked in Fig. 1 during the four different periods, i.e., NHP, APEC, HP1, and HP2. The numbers on the top of the bar graphs are the average mass concentrations of NR-PM1 and OA.
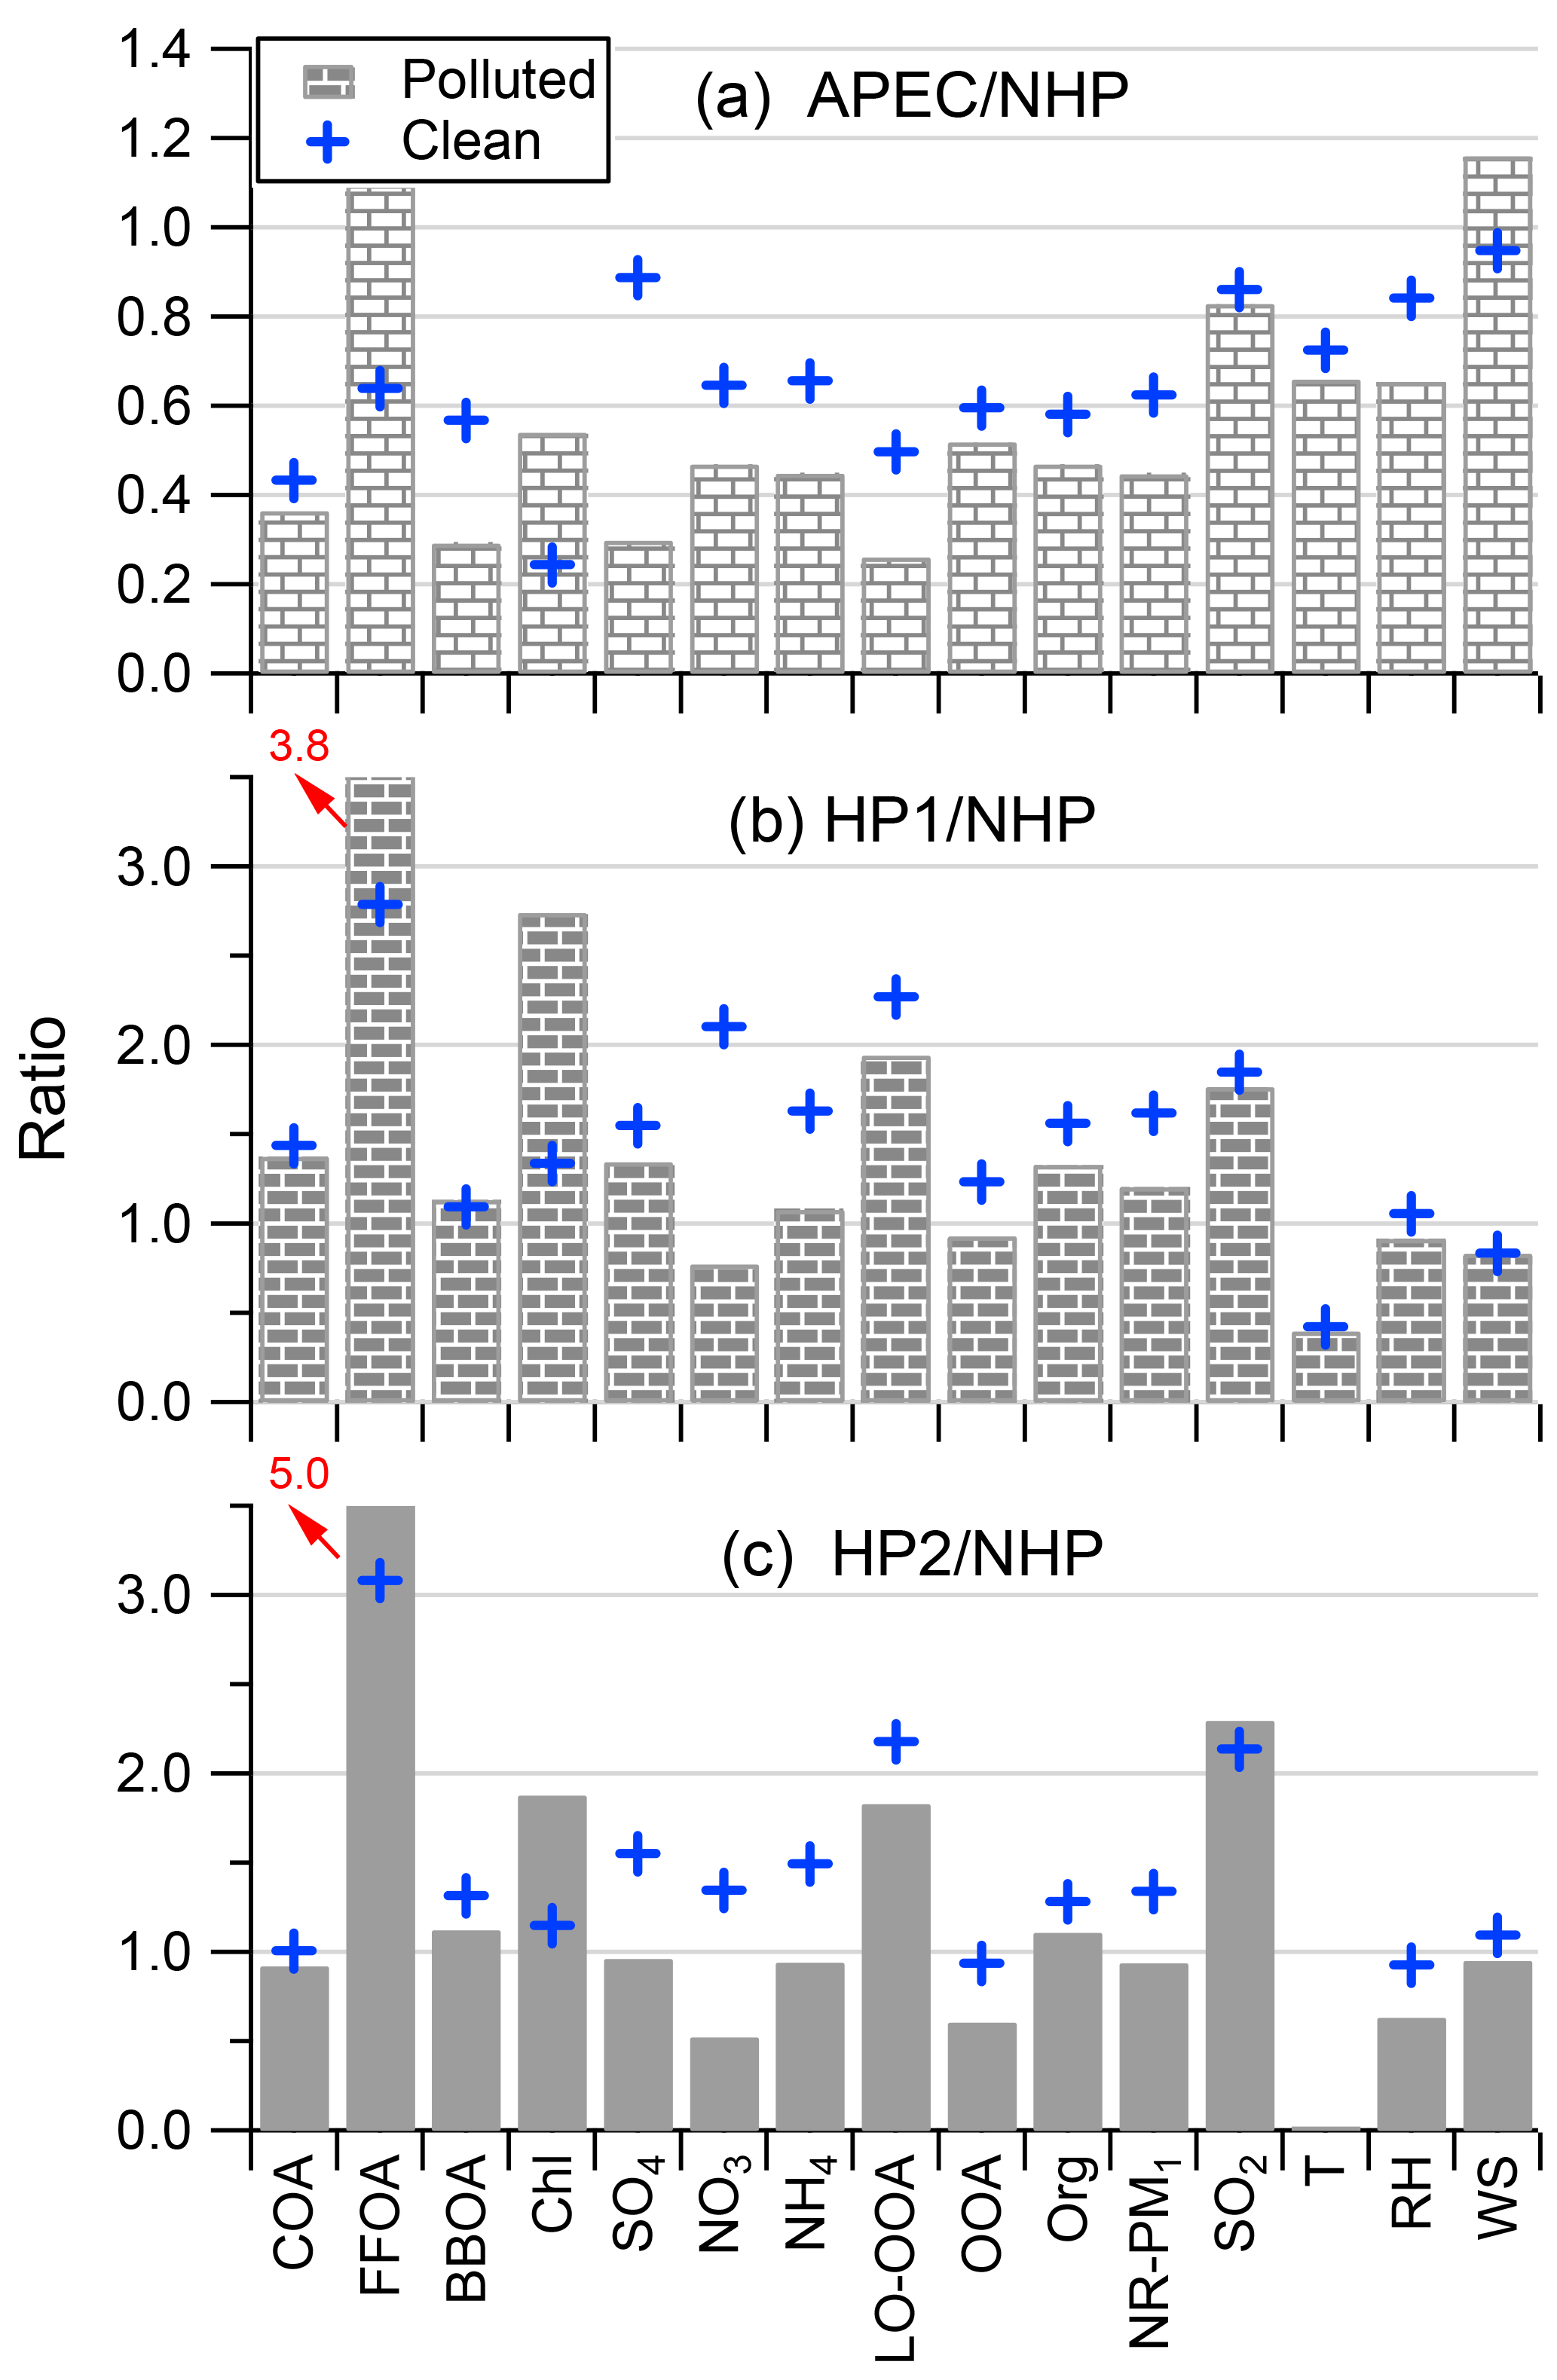
Figure 11Comparisons of aerosol compositions, gaseous precursors, OA factors, and meteorological variables between (a) APEC and NHP, (b) HP1 and NHP, and (c) HP2 and NHP. All the data were separated into the clean events and pollution episodes that are marked in Fig. 1.
3.3 Comparisons between clean and polluted episodes
To evaluate the different roles of aerosol species in PM pollution, we further compared aerosol compositions between clean periods and polluted episodes (Fig. 10). The average NR-PM1 mass concentrations varied from 4.0 to 10.4 µg m−3 during clean periods with much higher concentrations during HP than NHP. Analysis of the compositional differences showed that FFOA and LO-OOA are the two species with the largest enhancements during HP, supporting the influence of coal combustion emissions (Fig. 8). Although aerosol bulk composition was relatively similar among different clean periods, OA composition showed significant changes from NHP to HP, which are characterized by large increases in FFOA from 7–8 to 14–18 % and LO-OOA from 10–11 to 17–19 %. OOA showed corresponding decreases from 60–64 to 44–50 %. Aerosol composition was quite different between clean periods and polluted episodes. For example, organics accounted for a higher fraction (55–60 %) in NR-PM1 during clean periods than (46–54 %) in polluted episodes. The higher contribution of organics during clean periods was also previously observed at the same ground site (Y. L. Sun et al., 2013). In contrast, the nitrate contribution showed a large increase in polluted days during NHP and APEC, e.g., 29 vs. 12 %, further indicating the predominant role of nitrate in severe haze pollution, particularly during periods free of intense coal combustion. Also note that the difference in nitrate contributions during HP was small between polluted and clean episodes; for example, 16–18 % in polluted episodes and 12–15 % during clean periods. These results suggest that the polluted conditions during HP do not substantially facilitate nitrate formation. Compared with nitrate, the sulfate mass fractions did not change much during NHP and HP with slightly higher contributions during clean periods, indicating that sulfate was similarly important during both clean periods and polluted episodes. We also noticed nearly twice higher chloride contributions in polluted days compared with clean periods during HP, confirming the increasing role of coal combustion emissions in severe winter haze pollution.
OA composition was relatively similar between clean periods and polluted episodes during NHP and APEC, and the contributions of POA and SOA were also close between NHP and APEC. This is consistent with our previous conclusion that POA and SOA showed similar reductions at high altitudes during APEC (Chen et al., 2015). The improved ME-2 analysis, however, showed some changes in POA and SOA composition. For example, the contributions of FFOA and OOA showed increases, while COA decreased during APEC, indicating the impacts of regional emission controls on different types of POA. OA composition during HP showed more differences between clean periods and polluted episodes. As shown in Fig. 10b, LO-OOA and BBOA showed large increases in polluted episodes; for example, from 17–19 to 24–27 % for LO-OOA and from 5–8 to 9–11 % for BBOA. However, such changes were not observed during NHP. Therefore, the results here might indicate that the polluted meteorological conditions (high RH and low O3) during HP facilitate the transformation of combustion-related semi-volatile species into the particle phase. In comparison, OOA showed higher contributions to OA in clean periods than polluted episodes during HP. It is interesting that the FFOA and COA contributions at 260 m were comparable between clean periods and polluted episodes, which is largely different from previous observations at the ground site according to which OA comprised much higher COA associated with a large decrease in coal combustion OA during clean periods (Y. L. Sun et al., 2013; Y. Sun et al., 2014).
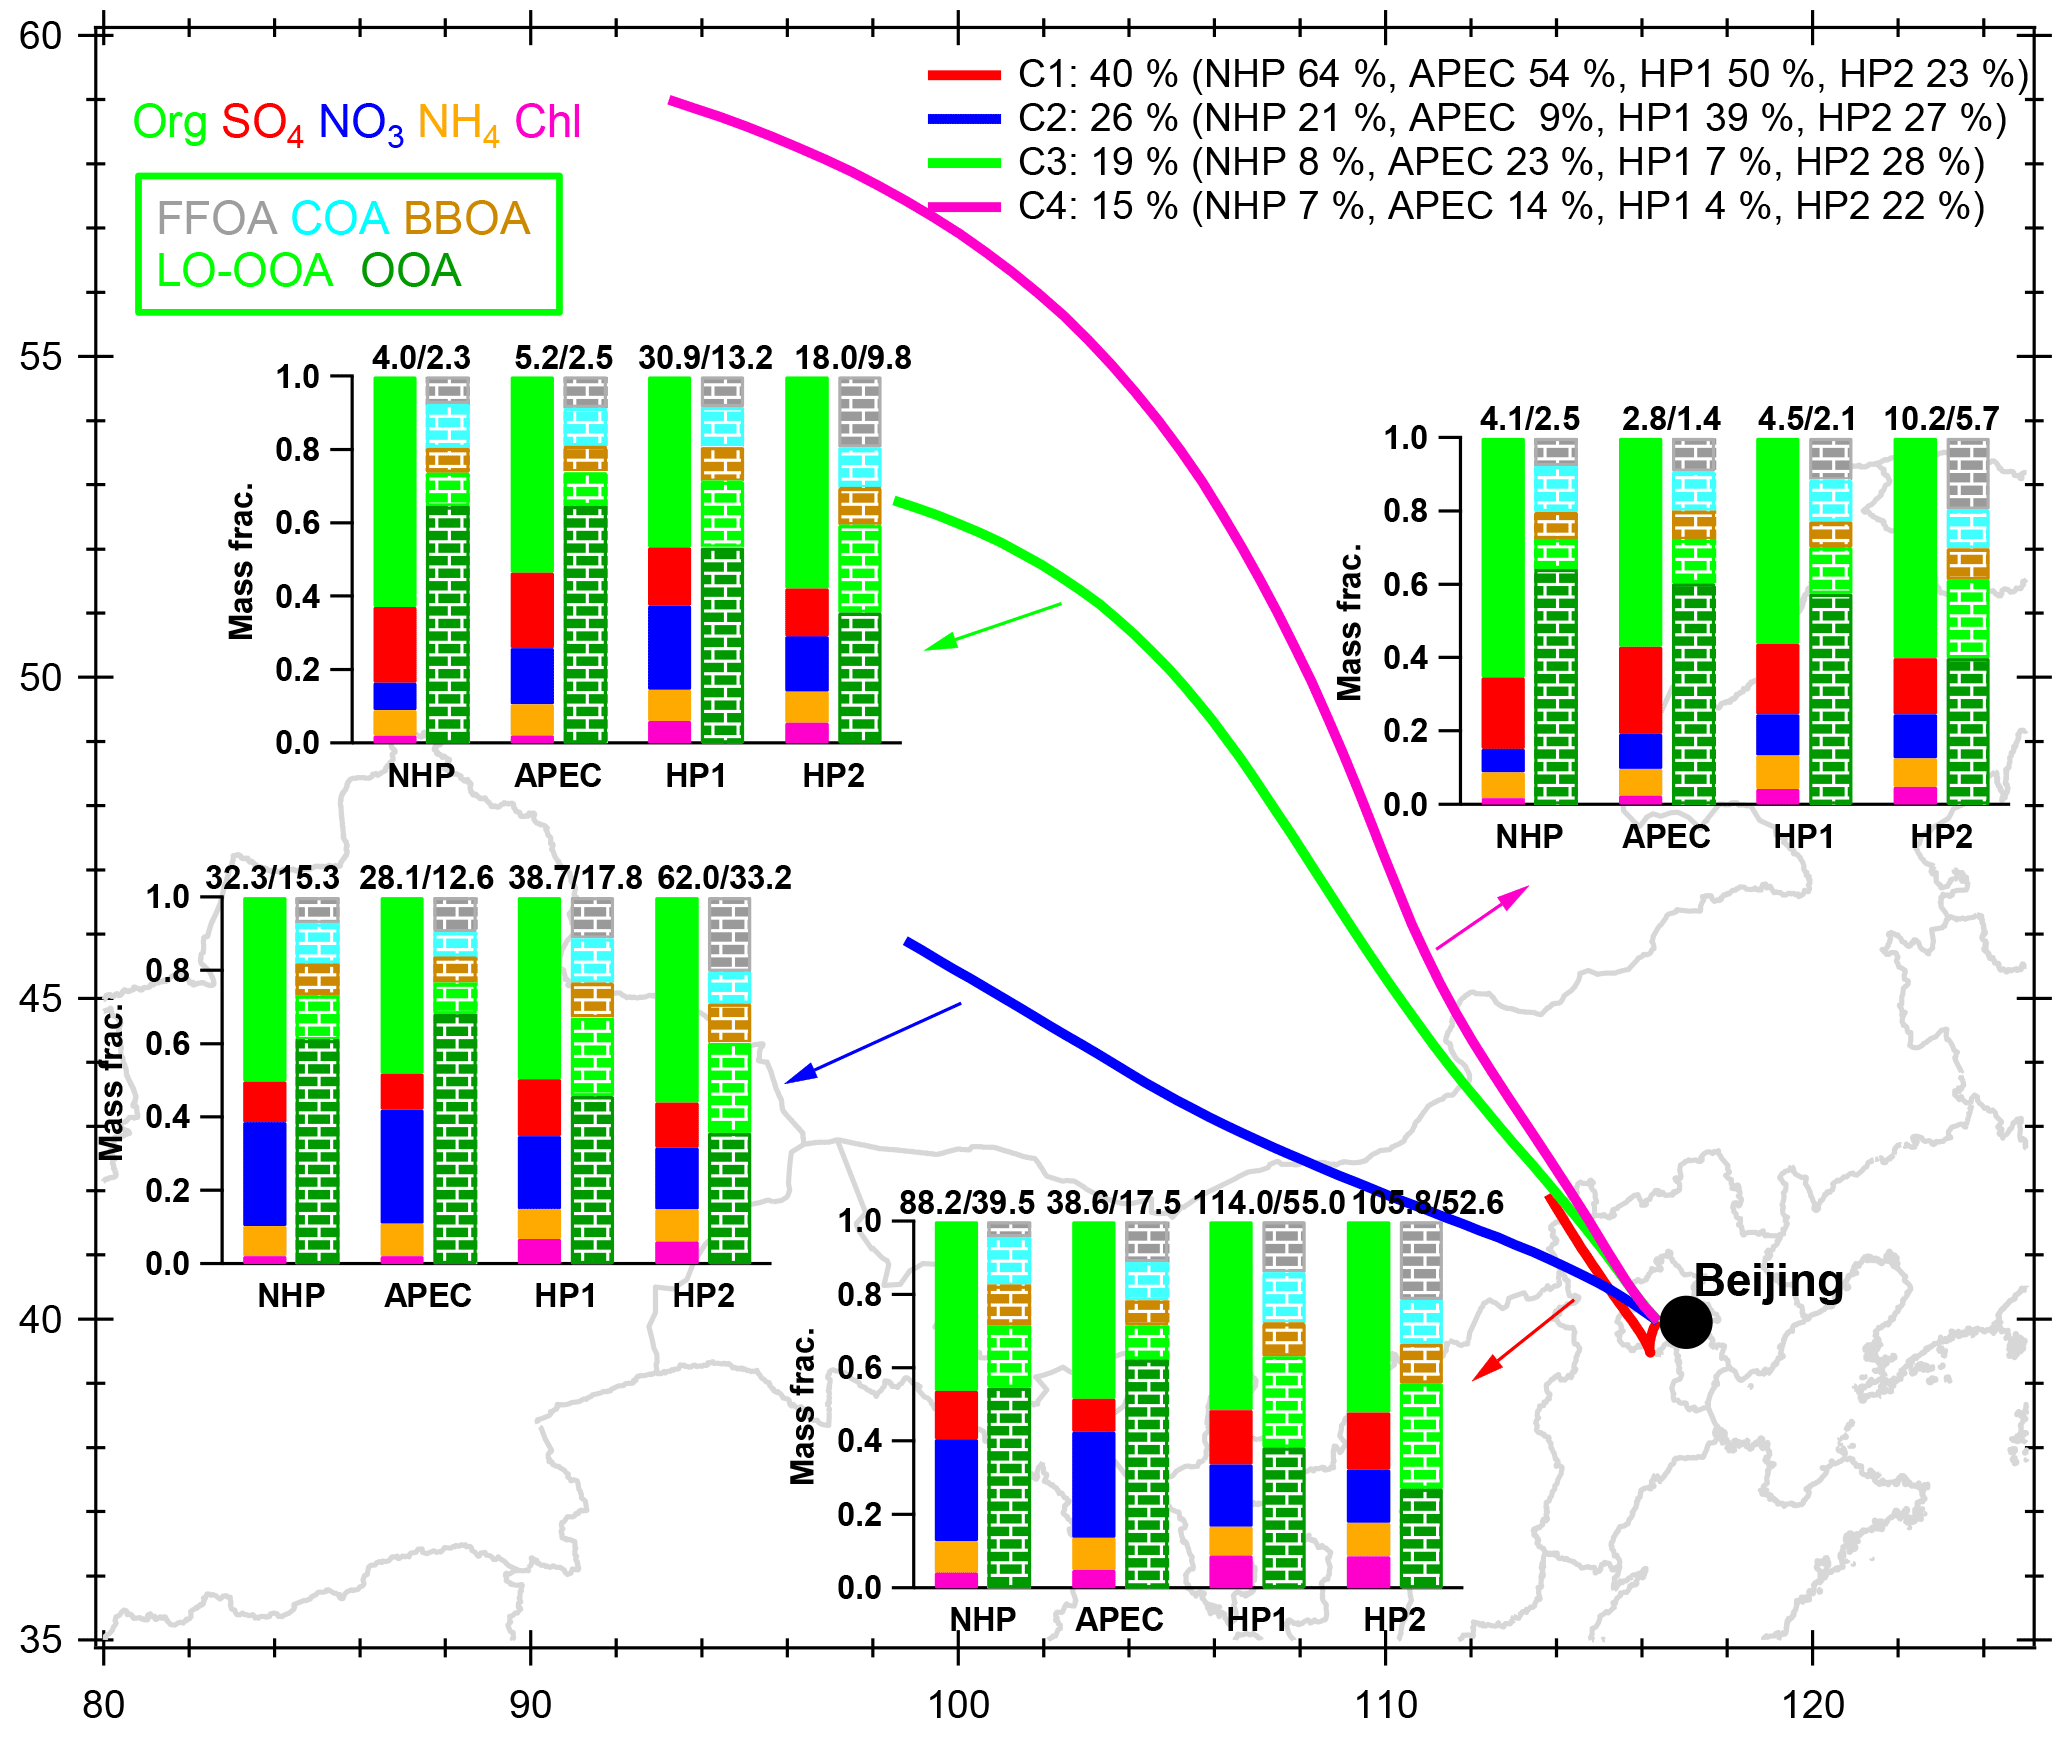
Figure 12The average NR-PM1 and OA composition for each cluster during the four different periods, i.e., NHP, APEC, HP1, and HP2. The numbers on the top of the bar graphs are the average mass concentrations of NR-PM1 and OA. In addition, the number of trajectories and the corresponding percentages of the total trajectories are shown in the legend.
We further calculated the changes in aerosol species during APEC and HP compared with those during NHP. As shown in Fig. 11, almost all species decreased substantially by 40–70 % in polluted days during APEC, while the reductions were less significant in clean days when air mass originated mainly from the north–northwest. This is consistent with the fact that strict emission controls were mainly implemented to the south of Beijing during APEC. However, we found an increase in FFOA and much less reduction of SO2 (∼ 20 %) and chloride during APEC compared to other species. One of the major reasons is likely the residential coal combustion emissions in Beijing and the surrounding regions (the average temperature was ∼ 9 ∘C) that were transported to high altitudes in urban Beijing during APEC. Consistently, the primary species related to coal combustion emissions, e.g., FFOA, SO2, Chl, and LO-OOA, were elevated significantly from NHP to HP although the enhancements were more dramatic in polluted episodes. For example, FFOA was increased by a factor of ∼ 4–5 and the other three species (Chl, LO-OOA, and SO2) by a factor of ∼ 2 in polluted episodes during HP. Our results suggest that coal combustion emissions are the major source affecting aerosol composition at high altitudes in the heating season. The remarkable enhancement of LO-OOA further supports our conclusion that LO-OOA was likely a combustion-related SOA. Comparatively, nitrate and OOA were the two species showing the largest decrease during HP, mainly due to the reduced photochemical production associated with lower RH and T.
3.4 Back-trajectory analysis
The response of aerosol chemistry to different source regions was further demonstrated by comparing the aerosol compositions from similar air masses during the four periods. Figure 12 presents the average chemical compositions of NR-PM1 species and OA factors corresponding to the four clusters that were determined from the 48 h back trajectories using the Hybrid Single Particle Lagrangian Integrated Trajectory (HYSPLIT, NOAA) model (Draxler and Hess, 1997). The air mass originated from the north–northwest (C1, 40 % of the time) but circulated around the south of Beijing and showed the highest aerosol loadings among the four clusters with an average mass concentration of NR-PM1 ranging from 38.6 to 114.0 µg m−3. Comparatively, the westerly cluster (C2) presented significantly lower aerosol loadings (28.1–62 µg m−3), and the two northwesterly clusters (C3 and C4) showed the lowest mass loadings (< 10 µg m−3 most of the time). Such large differences in aerosol loadings associated with different air masses have also been previously reported in Beijing (Han et al., 2017), which is consistent with the spatial distributions of emission sources in northern China (Zhao et al., 2012). Compared with NHP, C1 from the south showed the largest reduction in NR-PM1 (56 %) during APEC, while the reduction was much less for the other three clusters. This is consistent with the fact that strict emission controls were mainly implemented in the regions to the south of Beijing (Chen et al., 2015). These results also highlight the fact that emission control in the south of Beijing is one of the most effective measures to improve air quality in Beijing. It is interesting to note that the NR-PM1 showed ubiquitously higher mass concentrations during HP1 and HP2 than NHP once the source regions were synchronized, further supporting the impacts of coal combustion emissions on PM levels. Also, the NR-PM1 from the most polluted cluster (C1) showed similar levels between HP1 (114 µg m−3) and HP2 (106 µg m−3), while it had more differences (up to a factor of 2) for the other three clusters, indicating more source variability from relatively clean regions. The air-mass-dependent OA mass concentrations were similar to those of NR-PM1.
NR-PM1 and OA compositions vary differently among different clusters. For example, nitrate dominated SIA (28–31 %) during NHP and APEC in C1 and C2, while sulfate was more prevalent in C3 and C4 (20–24 %), indicating the very different source emissions between southerly and northerly air masses. In fact, the regions of C1 and C2 show significantly higher NOx emissions than C3 and C4 (B. Zhao et al., 2013). Another possible explanation is more evaporative loss of nitrate during long-distance transport in C3 and C4, while sulfate can be transported for a longer distance because it is nonvolatile. In addition, less available NH3 can also be an explanation. However, such nitrate–sulfate differences among different clusters were much reduced during HP1 and HP2, which was likely due to the weaker photochemical production and less evaporative loss under lower T in the heating season. OA dominated NR-PM1 for all clusters, on average accounting for 46–65 %. Note that the OA contributions were overall higher in C3 and C4 than C1, indicating an enhanced role of OA in PM during relatively clean periods. Despite the large differences in NR-PM1 composition, we found that OA compositions among different clusters were rather similar. Moreover, all clusters showed similar changes in SOA and POA compositions from NHP to HP. For example, OOA showed large decreases from 55–65 % during NHP to 38–57 % during HP1 and 27–40 % in HP2, while the combustion-related FFOA, BBOA, and LO-OOA all showed corresponding increases during HP. Our results suggest that coal combustion emissions from different source regions can all have great impacts on OA composition in the heating season in Beijing.
We presented an analysis of submicron aerosols at a high height (260 m) in urban Beijing from 10 October 2014 to 18 January 2015. This study contains three periods with different emission scenarios, i.e., NHP, APEC, and HP, providing an experimental opportunity to investigate the response of aerosol chemistry to emission changes at a high height. The average mass concentration of NR-PM1 was 64.9 µg m−3 during NHP and 74.5 and 48.6 µg m−3, respectively, during the two different heating periods, i.e., HP1 and HP2. Our results indicate that the average PM level in the heating season is not always higher than that in the non-heating season. With similar emission sources, e.g., HP1 vs. HP2, meteorological conditions can cause an average difference in NR-PM1 of 35 %, varying from 26 to 44 % for different aerosol species. The NR-PM1 composition was dominated by organics (46 %), followed by nitrate (28 %) and sulfate (14 %) during NHP. However, the nitrate contribution in the heating season was decreased substantially from 28 to ∼ 15–18 % due to reduced photochemical processing in winter, while that of organics was increased to ∼ 51–54 %, and chloride was enhanced by a factor of 2 as a result of enhanced coal combustion emissions.
The sources of OA at 260 m were investigated with ME-2 using FFOA, COA, and BBOA resolved at the ground site as constraints. We observed significant changes in both POA and SOA composition from NHP to HP. Not surprisingly, FFOA showed the largest enhancement from 5 to 13–21 % as a result of enhanced coal combustion emissions. Comparatively, OOA decreased substantially from 56 to 32–40 % during HP. The less oxidized OOA, however, showed a remarkable increase from 9–16 to 24–26 %. Our results illustrated the different properties of the two types of SOA at 260 m. While OOA was dominantly from photochemical production, LO-OOA was more likely a combustion-related SOA, consistent with the tight correlations with chloride and CO during HP. We also found a considerable contribution of COA at high heights (10–13 %) although it was nearly twice lower than that at the ground site. Overall, SOA dominated OA at 260 m, on average accounting for 72 % in the non-heating season and 58–64 % in the heating season. Compared with ground measurements, SOA showed much higher contributions at 260 m by 15–34 %, demonstrating the importance of SOA in PM pollution at high altitudes in the city. Our results illustrated the large differences in POA and SOA between ground level and 260 m, which have significant implications, and measurements at high altitudes are critical to better validate the simulations of POA and SOA in chemical transport models.
The data in this study are available from the authors upon request (sunyele@mail.iap.ac.cn).
The supplement related to this article is available online at: https://doi.org/10.5194/acp-18-3951-2018-supplement.
The authors declare that they have no conflict of interest.
This work was supported by the National Key Project of Basic Research
(2014CB447900), the Beijing Natural Science Foundation (8161004), and the
National Natural Science Foundation of China (91744207, 41571130034,
41575120).
Edited by: Fangqun
Yu
Reviewed by: three anonymous referees
Aiken, A. C., DeCarlo, P. F., Kroll, J. H., Worsnop, D. R., Huffman, J. A., Docherty, K. S., Ulbrich, I. M., Mohr, C., Kimmel, J. R., Sueper, D., Sun, Y., Zhang, Q., Trimborn, A., Northway, M., Ziemann, P. J., Canagaratna, M. R., Onasch, T. B., Alfarra, M. R., Prevot, A. S. H., Dommen, J., Duplissy, J., Metzger, A., Baltensperger, U., and Jimenez, J. L.: O∕C and OM∕OC ratios of primary, secondary, and ambient organic aerosols with high-resolution time-of-flight aerosol mass spectrometry, Environ. Sci. Technol., 42, 4478–4485, https://doi.org/10.1021/es703009q, 2008.
Aiken, A. C., Salcedo, D., Cubison, M. J., Huffman, J. A., DeCarlo, P. F., Ulbrich, I. M., Docherty, K. S., Sueper, D., Kimmel, J. R., Worsnop, D. R., Trimborn, A., Northway, M., Stone, E. A., Schauer, J. J., Volkamer, R. M., Fortner, E., de Foy, B., Wang, J., Laskin, A., Shutthanandan, V., Zheng, J., Zhang, R., Gaffney, J., Marley, N. A., Paredes-Miranda, G., Arnott, W. P., Molina, L. T., Sosa, G., and Jimenez, J. L.: Mexico City aerosol analysis during MILAGRO using high resolution aerosol mass spectrometry at the urban supersite (T0) – Part 1: Fine particle composition and organic source apportionment, Atmos. Chem. Phys., 9, 6633–6653, https://doi.org/10.5194/acp-9-6633-2009, 2009.
Allan, J. D., Williams, P. I., Morgan, W. T., Martin, C. L., Flynn, M. J., Lee, J., Nemitz, E., Phillips, G. J., Gallagher, M. W., and Coe, H.: Contributions from transport, solid fuel burning and cooking to primary organic aerosols in two UK cities, Atmos. Chem. Phys., 10, 647–668, https://doi.org/10.5194/acp-10-647-2010, 2010.
Canonaco, F., Crippa, M., Slowik, J. G., Baltensperger, U., and Prévôt, A. S. H.: SoFi, an IGOR-based interface for the efficient use of the generalized multilinear engine (ME-2) for the source apportionment: ME-2 application to aerosol mass spectrometer data, Atmos. Meas. Tech., 6, 3649–3661, https://doi.org/10.5194/amt-6-3649-2013, 2013.
Chen, C., Sun, Y. L., Xu, W. Q., Du, W., Zhou, L. B., Han, T. T., Wang, Q. Q., Fu, P. Q., Wang, Z. F., Gao, Z. Q., Zhang, Q., and Worsnop, D. R.: Characteristics and sources of submicron aerosols above the urban canopy (260 m) in Beijing, China, during the 2014 APEC summit, Atmos. Chem. Phys., 15, 12879–12895, https://doi.org/10.5194/acp-15-12879-2015, 2015.
Cheng, Y., Zheng, G., Wei, C., Mu, Q., Zheng, B., Wang, Z., Gao, M., Zhang, Q., He, K., Carmichael, G., Pöschl, U., and Su, H.: Reactive nitrogen chemistry in aerosol water as a source of sulfate during haze events in China, Sci. Adv., 2, e1601530, https://doi.org/10.1126/sciadv.1601530, 2016.
Crenn, V., Sciare, J., Croteau, P. L., Verlhac, S., Fröhlich, R., Belis, C. A., Aas, W., Äijälä, M., Alastuey, A., Artiñano, B., Baisnée, D., Bonnaire, N., Bressi, M., Canagaratna, M., Canonaco, F., Carbone, C., Cavalli, F., Coz, E., Cubison, M. J., Esser-Gietl, J. K., Green, D. C., Gros, V., Heikkinen, L., Herrmann, H., Lunder, C., Minguillón, M. C., Močnik, G., O'Dowd, C. D., Ovadnevaite, J., Petit, J.-E., Petralia, E., Poulain, L., Priestman, M., Riffault, V., Ripoll, A., Sarda-Estève, R., Slowik, J. G., Setyan, A., Wiedensohler, A., Baltensperger, U., Prévôt, A. S. H., Jayne, J. T., and Favez, O.: ACTRIS ACSM intercomparison – Part 1: Reproducibility of concentration and fragment results from 13 individual Quadrupole Aerosol Chemical Speciation Monitors (Q-ACSM) and consistency with co-located instruments, Atmos. Meas. Tech., 8, 5063–5087, https://doi.org/10.5194/amt-8-5063-2015, 2015.
Crippa, M., DeCarlo, P. F., Slowik, J. G., Mohr, C., Heringa, M. F., Chirico, R., Poulain, L., Freutel, F., Sciare, J., Cozic, J., Di Marco, C. F., Elsasser, M., Nicolas, J. B., Marchand, N., Abidi, E., Wiedensohler, A., Drewnick, F., Schneider, J., Borrmann, S., Nemitz, E., Zimmermann, R., Jaffrezo, J.-L., Prévôt, A. S. H., and Baltensperger, U.: Wintertime aerosol chemical composition and source apportionment of the organic fraction in the metropolitan area of Paris, Atmos. Chem. Phys., 13, 961–981, https://doi.org/10.5194/acp-13-961-2013, 2013.
Crippa, M., Canonaco, F., Lanz, V. A., Äijälä, M., Allan, J. D., Carbone, S., Capes, G., Ceburnis, D., Dall'Osto, M., Day, D. A., DeCarlo, P. F., Ehn, M., Eriksson, A., Freney, E., Hildebrandt Ruiz, L., Hillamo, R., Jimenez, J. L., Junninen, H., Kiendler-Scharr, A., Kortelainen, A.-M., Kulmala, M., Laaksonen, A., Mensah, A. A., Mohr, C., Nemitz, E., O'Dowd, C., Ovadnevaite, J., Pandis, S. N., Petäjä, T., Poulain, L., Saarikoski, S., Sellegri, K., Swietlicki, E., Tiitta, P., Worsnop, D. R., Baltensperger, U., and Prévôt, A. S. H.: Organic aerosol components derived from 25 AMS data sets across Europe using a consistent ME-2 based source apportionment approach, Atmos. Chem. Phys., 14, 6159–6176, https://doi.org/10.5194/acp-14-6159-2014, 2014.
Dockery, D. W., Pope, C. A., Xu, X., Spengler, J. D., Ware, J. H., Fay, M. E., Ferris, B. G. J., and Speizer, F. E.: An association between air pollution and mortality in six U.S. cities, New Engl. J. Med., 329, 1753–1759, https://doi.org/10.1056/nejm199312093292401, 1993.
Draxler, R. R. and Hess, G.: Description of the HYSPLIT4 modeling system, Air Resources Laboratory, Silver Spring, Maryland, 1997.
Elser, M., Huang, R.-J., Wolf, R., Slowik, J. G., Wang, Q., Canonaco, F., Li, G., Bozzetti, C., Daellenbach, K. R., Huang, Y., Zhang, R., Li, Z., Cao, J., Baltensperger, U., El-Haddad, I., and Prévôt, A. S. H.: New insights into PM2.5 chemical composition and sources in two major cities in China during extreme haze events using aerosol mass spectrometry, Atmos. Chem. Phys., 16, 3207–3225, https://doi.org/10.5194/acp-16-3207-2016, 2016.
Guo, S., Hu, M., Zamora, M. L., Peng, J., Shang, D., Zheng, J., Du, Z., Wu, Z., Shao, M., Zeng, L., Molina, M. J., and Zhang, R.: Elucidating severe urban haze formation in China, P. Natl. Acad. Sci. USA, 111, 17373–17378, https://doi.org/10.1073/pnas.1419604111, 2014.
Han, T., Xu, W., Li, J., Freedman, A., Zhao, J., Wang, Q., Chen, C., Zhang, Y., Wang, Z., Fu, P., Liu, X., and Sun, Y.: Aerosol optical properties measurements by a CAPS single scattering albedo monitor: comparisons between summer and winter in Beijing, China, J. Geophys. Res.-Atmos., 122, 2513–2526, https://doi.org/10.1002/2016JD025762, 2017.
Huang, R.-J., Zhang, Y., Bozzetti, C., Ho, K.-F., Cao, J.-J., Han, Y., Daellenbach, K. R., Slowik, J. G., Platt, S. M., Canonaco, F., Zotter, P., Wolf, R., Pieber, S. M., Bruns, E. A., Crippa, M., Ciarelli, G., Piazzalunga, A., Schwikowski, M., Abbaszade, G., Schnelle-Kreis, J., Zimmermann, R., An, Z., Szidat, S., Baltensperger, U., Haddad, I. E., and Prevot, A. S. H.: High secondary aerosol contribution to particulate pollution during haze events in China, Nature, 514, 218–222, https://doi.org/10.1038/nature13774, 2014.
Huang, X.-F., He, L.-Y., Hu, M., Canagaratna, M. R., Sun, Y., Zhang, Q., Zhu, T., Xue, L., Zeng, L.-W., Liu, X.-G., Zhang, Y.-H., Jayne, J. T., Ng, N. L., and Worsnop, D. R.: Highly time-resolved chemical characterization of atmospheric submicron particles during 2008 Beijing Olympic Games using an Aerodyne High-Resolution Aerosol Mass Spectrometer, Atmos. Chem. Phys., 10, 8933–8945, https://doi.org/10.5194/acp-10-8933-2010, 2010.
IPCC: Climate Change 2013: The Physical Science Basis. Contribution of Working Group I to the Fifth Assessment Report of the Intergovernmental Panel on Climate Change, Intergovernmental Panel on Climate Change, 2013.
Jimenez, J., Canagaratna, M., Donahue, N., Prevot, A., Zhang, Q., Kroll, J., DeCarlo, P., Allan, J., Coe, H., and Ng, N.: Evolution of organic aerosols in the atmosphere, Science, 326, 1525–1529, https://doi.org/10.1126/science.1180353, 2009.
Li, H., Zhang, Q., Zhang, Q., Chen, C., Wang, L., Wei, Z., Zhou, S., Parworth, C., Zheng, B., Canonaco, F., Prévôt, A. S. H., Chen, P., Zhang, H., Wallington, T. J., and He, K.: Wintertime aerosol chemistry and haze evolution in an extremely polluted city of the North China Plain: significant contribution from coal and biomass combustion, Atmos. Chem. Phys., 17, 4751–4768, https://doi.org/10.5194/acp-17-4751-2017, 2017.
Lin, C., Ceburnis, D., Hellebust, S., Buckley, P., Wenger, J., Canonaco, F., Prevot, A. S. H., Huang, R. J., O'Dowd, C., and Ovadnevaite, J.: Characterization of primary organic aerosol from domestic wood, peat, and coal burning in Ireland, Environ. Sci. Technol., 51, 10624–10632, https://doi.org/10.1021/acs.est.7b01926, 2017.
Ma, Q., Cai, S., Wang, S., Zhao, B., Martin, R. V., Brauer, M., Cohen, A., Jiang, J., Zhou, W., Hao, J., Frostad, J., Forouzanfar, M. H., and Burnett, R. T.: Impacts of coal burning on ambient PM2.5 pollution in China, Atmos. Chem. Phys., 17, 4477–4491, https://doi.org/10.5194/acp-17-4477-2017, 2017.
Matthew, B. M., Middlebrook, A. M., and Onasch, T. B.: Collection efficiencies in an Aerodyne Aerosol Mass Spectrometer as a function of particle phase for laboratory generated aerosols, Aerosol Sci. Tech., 42, 884–98, https://doi.org/10.1080/02786820802356797, 2008.
Middlebrook, A. M., Bahreini, R., Jimenez, J. L., and Canagaratna, M. R.: Evaluation of composition-dependent collection efficiencies for the Aerodyne Aerosol Mass Spectrometer using field data, Aerosol Sci. Tech., 46, 258–271, https://doi.org/10.1080/02786826.2011.620041, 2012.
Mohr, C., DeCarlo, P. F., Heringa, M. F., Chirico, R., Slowik, J. G., Richter, R., Reche, C., Alastuey, A., Querol, X., Seco, R., Peñuelas, J., Jiménez, J. L., Crippa, M., Zimmermann, R., Baltensperger, U., and Prévôt, A. S. H.: Identification and quantification of organic aerosol from cooking and other sources in Barcelona using aerosol mass spectrometer data, Atmos. Chem. Phys., 12, 1649–1665, https://doi.org/10.5194/acp-12-1649-2012, 2012.
Ng, N. L., Canagaratna, M. R., Jimenez, J. L., Zhang, Q., Ulbrich, I. M., and Worsnop, D. R.: Real-time methods for estimating organic component mass concentrations from Aerosol Mass Spectrometer data, Environ. Sci. Technol., 45, 910–916, https://doi.org/10.1021/es102951k, 2011.
Ohta, S. and Okita, T.: A chemical characterization of atmospheric aerosol in Sapporo, Atmos. Environ., 24, 815–822, https://doi.org/10.1016/0960-1686(90)90282-R, 1990.
Ots, R., Vieno, M., Allan, J. D., Reis, S., Nemitz, E., Young, D. E., Coe, H., Di Marco, C., Detournay, A., Mackenzie, I. A., Green, D. C., and Heal, M. R.: Model simulations of cooking organic aerosol (COA) over the UK using estimates of emissions based on measurements at two sites in London, Atmos. Chem. Phys., 16, 13773–13789, https://doi.org/10.5194/acp-16-13773-2016, 2016.
Paatero, P. and Tapper, U.: Positive and matrix factorization: a non-negative factor model with optimal utilization of error estimates of data values, Environmetrics, 5, 111–126, 1994.
Sun, Y., Wang, Z., Fu, P., Jiang, Q., Yang, T., Li, J., and Ge, X.: The impact of relative humidity on aerosol composition and evolution processes during wintertime in Beijing, China, Atmos. Environ., 77, 927–934, https://doi.org/10.1016/j.atmosenv.2013.06.019, 2013.
Sun, Y., Jiang, Q., Wang, Z., Fu, P., Li, J., Yang, T., and Yin, Y.: Investigation of the sources and evolution processes of severe haze pollution in Beijing in January 2013, J. Geophys. Res.-Atmos., 119, 4380–4398, https://doi.org/10.1002/2014jd021641, 2014.
Sun, Y., Du, W., Wang, Q., Zhang, Q., Chen, C., Chen, Y., Chen, Z., Fu, P., Wang, Z., Gao, Z., and Worsnop, D. R.: Real-time characterization of aerosol particle composition above the urban canopy in Beijing: insights into the interactions between the atmospheric boundary layer and aerosol chemistry, Environ. Sci. Technol., 49, 11340–11347, https://doi.org/10.1021/acs.est.5b02373, 2015.
Sun, Y., Chen, C., Zhang, Y., Xu, W., Zhou, L., Cheng, X., Zheng, H., Ji, D., Li, J., Tang, X., Fu, P., and Wang, Z.: Rapid formation and evolution of an extreme haze episode in Northern China during winter 2015, Sci. Rep.-UK, 6, 27151, https://doi.org/10.1038/srep27151, 2016a.
Sun, Y., Du, W., Fu, P., Wang, Q., Li, J., Ge, X., Zhang, Q., Zhu, C., Ren, L., Xu, W., Zhao, J., Han, T., Worsnop, D. R., and Wang, Z.: Primary and secondary aerosols in Beijing in winter: sources, variations and processes, Atmos. Chem. Phys., 16, 8309–8329, https://doi.org/10.5194/acp-16-8309-2016, 2016b.
Sun, Y., Wang, Z., Wild, O., Xu, W., Chen, C., Fu, P., Du, W., Zhou, L., Zhang, Q., Han, T., Wang, Q., Pan, X., Zheng, H., Li, J., Guo, X., Liu, J., and Worsnop, D. R.: “APEC Blue”: secondary aerosol reductions from emission controls in Beijing, Sci. Rep.-UK, 6, 20668, https://doi.org/10.1038/srep20668, 2016c.
Sun, Y. L., Wang, Z., Dong, H., Yang, T., Li, J., Pan, X., Chen, P., and Jayne, J. T.: Characterization of summer organic and inorganic aerosols in Beijing, China with an aerosol chemical speciation monitor, Atmos. Environ., 51, 250–259, https://doi.org/10.1016/j.atmosenv.2012.01.013, 2012.
Sun, Y. L., Wang, Z. F., Fu, P. Q., Yang, T., Jiang, Q., Dong, H. B., Li, J., and Jia, J. J.: Aerosol composition, sources and processes during wintertime in Beijing, China, Atmos. Chem. Phys., 13, 4577–4592, https://doi.org/10.5194/acp-13-4577-2013, 2013.
Sun, Y. L., Wang, Z. F., Du, W., Zhang, Q., Wang, Q. Q., Fu, P. Q., Pan, X. L., Li, J., Jayne, J., and Worsnop, D. R.: Long-term real-time measurements of aerosol particle composition in Beijing, China: seasonal variations, meteorological effects, and source analysis, Atmos. Chem. Phys., 15, 10149–10165, https://doi.org/10.5194/acp-15-10149-2015, 2015.
Sun, Y.-L., Zhang, Q., Schwab, J. J., Demerjian, K. L., Chen, W.-N., Bae, M.-S., Hung, H.-M., Hogrefe, O., Frank, B., Rattigan, O. V., and Lin, Y.-C.: Characterization of the sources and processes of organic and inorganic aerosols in New York city with a high-resolution time-of-flight aerosol mass apectrometer, Atmos. Chem. Phys., 11, 1581–1602, https://doi.org/10.5194/acp-11-1581-2011, 2011.
Ulbrich, I. M., Canagaratna, M. R., Zhang, Q., Worsnop, D. R., and Jimenez, J. L.: Interpretation of organic components from Positive Matrix Factorization of aerosol mass spectrometric data, Atmos. Chem. Phys., 9, 2891–2918, https://doi.org/10.5194/acp-9-2891-2009, 2009.
Wang, Q., Sun, Y., Jiang, Q., Du, W., Sun, C., Fu, P., and Wang, Z.: Chemical composition of aerosol particles and light extinction apportionment before and during the heating season in Beijing, China, J. Geophys. Res.-Atmos., 120, 12708–12722, https://doi.org/10.1002/2015JD023871, 2015.
Wang, Q., Zhao, J., Du, W., Ana, G., Wang, Z., Sun, L., Wang, Y., Zhang, F., Li, Z., Ye, X., and Sun, Y.: Characterization of submicron aerosols at a suburban site in central China, Atmos. Environ., 131, 115–123, https://doi.org/10.1016/j.atmosenv.2016.01.054, 2016.
Wu, P., Ding, Y., and Liu, Y.: Atmospheric circulation and dynamic mechanism for persistent haze events in the Beijing–Tianjin–Hebei region, Adv. Atmos. Sci., 34, 429–440, https://doi.org/10.1007/s00376-016-6158-z, 2017.
Xu, J., Zhang, Q., Chen, M., Ge, X., Ren, J., and Qin, D.: Chemical composition, sources, and processes of urban aerosols during summertime in northwest China: insights from high-resolution aerosol mass spectrometry, Atmos. Chem. Phys., 14, 12593–12611, https://doi.org/10.5194/acp-14-12593-2014, 2014.
Xu, W., Han, T., Du, W., Wang, Q., Chen, C., Zhao, J., Zhang, Y., Li, J., Fu, P., Wang, Z., Worsnop, D. R., and Sun, Y.: Effects of aqueous-phase and photochemical processing on secondary organic aerosol formation and evolution in Beijing, China, Environ. Sci. Technol., 51, 762–770, https://doi.org/10.1021/acs.est.6b04498, 2017.
Xu, W. Q., Sun, Y. L., Chen, C., Du, W., Han, T. T., Wang, Q. Q., Fu, P. Q., Wang, Z. F., Zhao, X. J., Zhou, L. B., Ji, D. S., Wang, P. C., and Worsnop, D. R.: Aerosol composition, oxidation properties, and sources in Beijing: results from the 2014 Asia–Pacific Economic Cooperation summit study, Atmos. Chem. Phys., 15, 13681–13698, https://doi.org/10.5194/acp-15-13681-2015, 2015.
Yang, Y. R., Liu, X. G., Qu, Y., An, J. L., Jiang, R., Zhang, Y. H., Sun, Y. L., Wu, Z. J., Zhang, F., Xu, W. Q., and Ma, Q. X.: Characteristics and formation mechanism of continuous hazes in China: a case study during the autumn of 2014 in the North China Plain, Atmos. Chem. Phys., 15, 8165–8178, https://doi.org/10.5194/acp-15-8165-2015, 2015.
Zhang, J. K., Sun, Y., Liu, Z. R., Ji, D. S., Hu, B., Liu, Q., and Wang, Y. S.: Characterization of submicron aerosols during a month of serious pollution in Beijing, 2013, Atmos. Chem. Phys., 14, 2887–2903, https://doi.org/10.5194/acp-14-2887-2014, 2014.
Zhang, J. K., Cheng, M. T., Ji, D. S., Liu, Z. R., Hu, B., Sun, Y., and Wang, Y. S.: Characterization of submicron particles during biomass burning and coal combustion periods in Beijing, China, Sci. Total Environ., 562, 812–821, https://doi.org/10.1016/j.scitotenv.2016.04.015, 2016.
Zhang, Q., Jimenez, J. L., Canagaratna, M. R., Allan, J. D., Coe, H., Ulbrich, I., Alfarra, M. R., Takami, A., Middlebrook, A. M., Sun, Y. L., Dzepina, K., Dunlea, E., Docherty, K., DeCarlo, P. F., Salcedo, D., Onasch, T., Jayne, J. T., Miyoshi, T., Shimono, A., Hatakeyama, S., Takegawa, N., Kondo, Y., Schneider, J., Drewnick, F., Borrmann, S., Weimer, S., Demerjian, K., Williams, P., Bower, K., Bahreini, R., Cottrell, L., Griffin, R. J., Rautiainen, J., Sun, J. Y., Zhang, Y. M., and Worsnop, D. R.: Ubiquity and dominance of oxygenated species in organic aerosols in anthropogenically-influenced Northern Hemisphere midlatitudes, Geophys. Res. Lett., 34, L13801, https://doi.org/10.1029/2007gl029979, 2007.
Zhang, Y., Sun, Y., Du, W., Wang, Q., Chen, C., Han, T., Lin, J., Zhao, J., Xu, W., Gao, J., Li, J., Fu, P., Wang, Z., and Han, Y.: Response of aerosol composition to different emission scenarios in Beijing, China, Sci. Total Environ., 571, 902–908, https://doi.org/10.1016/j.scitotenv.2016.07.073, 2016.
Zhao, B., Wang, P., Ma, J. Z., Zhu, S., Pozzer, A., and Li, W.: A high-resolution emission inventory of primary pollutants for the Huabei region, China, Atmos. Chem. Phys., 12, 481–501, https://doi.org/10.5194/acp-12-481-2012, 2012.
Zhao, B., Wang, S. X., Liu, H., Xu, J. Y., Fu, K., Klimont, Z., Hao, J. M., He, K. B., Cofala, J., and Amann, M.: NOx emissions in China: historical trends and future perspectives, Atmos. Chem. Phys., 13, 9869–9897, https://doi.org/10.5194/acp-13-9869-2013, 2013.
Zhao, J., Du, W., Zhang, Y., Wang, Q., Chen, C., Xu, W., Han, T., Wang, Y., Fu, P., Wang, Z., Li, Z., and Sun, Y.: Insights into aerosol chemistry during the 2015 China Victory Day parade: results from simultaneous measurements at ground level and 260 m in Beijing, Atmos. Chem. Phys., 17, 3215–3232, https://doi.org/10.5194/acp-17-3215-2017, 2017.
Zhao, X. J., Zhao, P. S., Xu, J., Meng,, W., Pu, W. W., Dong, F., He, D., and Shi, Q. F.: Analysis of a winter regional haze event and its formation mechanism in the North China Plain, Atmos. Chem. Phys., 13, 5685–5696, https://doi.org/10.5194/acp-13-5685-2013, 2013.