the Creative Commons Attribution 4.0 License.
the Creative Commons Attribution 4.0 License.
In situ measurements of desert dust particles above the western Mediterranean Sea with the balloon-borne Light Optical Aerosol Counter/sizer (LOAC) during the ChArMEx campaign of summer 2013
Jean-Baptiste Renard
François Dulac
Pierre Durand
Quentin Bourgeois
Cyrielle Denjean
Damien Vignelles
Benoit Couté
Matthieu Jeannot
Nicolas Verdier
Marc Mallet
Mineral dust from arid areas is a major component of global aerosol and has strong interactions with climate and biogeochemistry. As part of the Chemistry-Aerosol Mediterranean Experiment (ChArMEx) to investigate atmospheric chemistry and its impacts in the Mediterranean region, an intensive field campaign was performed from mid-June to early August 2013 in the western basin including in situ balloon-borne aerosol measurements with the light optical aerosol counter (LOAC). LOAC is a counter/sizer that provides the aerosol concentrations in 19 size classes between 0.2 and 100 µm, and an indication of the nature of the particles based on dual-angle scattering measurements. A total of 27 LOAC flights were conducted mainly from Minorca Island (Balearic Islands, Spain) but also from Ile du Levant off Hyères city (SE France) under 17 light dilatable balloons (meteorological sounding balloons) and 10 boundary layer pressurised balloons (quasi-Lagrangian balloons). The purpose was to document the vertical extent of the plume and the time evolution of the concentrations at constant altitude (air density) by in situ observations. LOAC measurements are in agreement with ground-based measurements (lidar, photometer), aircraft measurements (counters), and satellite measurements (CALIOP) in the case of fair spatial and temporal coincidences. LOAC has often detected three modes in the dust particle volume size distributions fitted by lognormal laws at roughly 0.2, 4 and 30 µm in modal diameter. Thanks to the high sensitivity of LOAC, particles larger than 40 µm were observed, with concentrations up to about 10−4 cm−3. Such large particles were lifted several days before and their persistence after transport over long distances is in conflict with calculations of dust sedimentation. We did not observe any significant evolution of the size distribution during the transport from quasi-Lagrangian flights, even for the longest ones (∼ 1 day). Finally, the presence of charged particles is inferred from the LOAC measurements and we speculate that electrical forces might counteract gravitational settling of the coarse particles.
Please read the corrigendum first before continuing.
-
Notice on corrigendum
The requested paper has a corresponding corrigendum published. Please read the corrigendum first before downloading the article.
-
Article
(29908 KB)
-
The requested paper has a corresponding corrigendum published. Please read the corrigendum first before downloading the article.
- Article
(29908 KB) - Full-text XML
- Corrigendum
- BibTeX
- EndNote
Mineral dust from arid and semi-arid areas is a major component of the global aerosol and has long been recognised to have strong interactions with climate and biogeochemistry (e.g. Buat-Ménard and Chesselet, 1979; Martin et al., 1991; Swap et al., 1992; Duce, 1995; Alpert et al., 1998; Mahowald et al., 2009, 2011; Maher et al., 2010; Liu et al., 2011; Choobari et al., 2014; Li et al., 2016). Desert dust aerosol is of particular interest in the Mediterranean region where it is (i) frequently observed in high concentrations in the troposphere; (ii) is a major component of surface PM10 (Pey et al., 2013; Rea et al., 2015), aerosol optical depth (Moulin et al., 1998; Gkikkas et al., 2013; Nabat et al., 2013), atmospheric deposition (Pye, 1992; Vincent et al., 2016); and (iii) affecting the regional air quality (Querol et al., 2009); atmospheric thermodynamics (e.g. Alpert et al., 1998; Chaboureau et al., 2011); radiative budget and climate (e.g. Nabat et al., 2012, 2015a, b); precipitation chemistry (Chester et al., 1996; Loÿe-Pilot et al., 1986; Avila and Rodà, 2002); soil formation (Nihlén et al., 1995); and biogeochemistry of forest ecosystems (Avila and Peñuelas, 1999), oligotrophic lakes (Morales-Baquero et al., 2006; Reche et al., 2009), and marine surface waters (Guerzoni et al., 1999; Herut et al., 1999; Guieu et al., 2014).
Most studies to characterise airborne dust particles transported over long-ranges were performed with satellite remote sensing and/or surface in situ and remote-sensing instruments (counters, particle samplers, lidars, photometers, etc.). Some aircraft observations were also conducted in situ inside dust plumes, but they are expensive and scarce (e.g. Schmid et al., 2000; Dulac and Chazette, 2003; Haywood et al., 2003; Reid et al., 2003a; Formenti et al., 2008; Weinzierl et al., 2009, 2011; Chen et al., 2011; Denjean et al., 2016), and were often limited to several micrometres in terms of the particle size range covered and did not explore the same dust plume along its transport. One of the incompletely resolved issues is the evolution of the dust particle size distribution during long-range transport (Ansmann et al., 2011). It has been reported that an upward velocity counteracts gravitational sedimentation across the western Mediterranean (Dulac et al., 1992a) and north tropical Atlantic (Maring et al., 2003). Suggested causes include solar heating of dust layers (Prospero and Carlson, 1981), upward synoptic air mass movements (Dulac et al., 1992a), and turbulence (Ryder et al., 2013).
There is some debate in the literature on the very-long-distance transport of coarse soil dust particles (> 10 µm in diameter). It has been shown that a coarse mode at about 14 µm in diameter is produced by sandblasting of arid soils by saltating sand grains (Alfaro et al., 1998; Alfaro and Gomes, 2001). Furthermore, d'Almeida and Schütz (1983) report that African dust storm conditions produce a dust particle volume size distribution extending up to several tens of micrometres with a highly variable “giant” mode around 60 µm in diameter. The modified Stokes–Einstein law indicates that steady state gravitational settling velocities (Vg) of particles in air are proportional to the squared particle diameter (Stokes, 1851). For a particle density of 2.5 g cm−3, typical of soil dust, Vg reaches 1 cm s−1 between 11 and 12 µm and 10 cm s−1 between 36 and 37 µm, i.e. 860 and 8600 m d−1, respectively (Foret et al., 2006). Those giant particles are therefore expected to fall and control the dust deposition flux within the first 1000 km of transport from their source (Schütz et al., 1981). Maring et al. (2003) indicate that all Saharan dust particles larger than 12 µm in diameter are scavenged between the Canary Islands and Puerto Rico. However, there is evidence of Aeolian dust transport and sedimentation of giant dust particles in the ocean up to 10 000 km away from source regions in the tropical Atlantic (Prospero et al., 1970; Carder et al., 1986) and Pacific (e.g. Betzer et al., 1988; Middleton et al., 2001; Jeong et al., 2014). Airborne observations also confirmed that the coarsest particles (> 20 µm in diameter) are far from completely depleted over the North Atlantic (McConnell et al., 2008; Weinzierl et al., 2011; Ryder et al., 2013). Therefore, we still need observations of dust particle property evolution over an extensive particle size range during their long-range transport; thus, there was a need for a new strategy for multiplying in situ measurements of the dust particle size distributions. This was done for the first time in this study during African dust transport events above the western Mediterranean, deploying optical particle counters both below sounding balloons that vertically crossed the dust plume and aboard drifting balloons that remained at constant altitude for quasi-Lagrangian measurements within the atmospheric dust layer.
The Chemistry-Aerosol Mediterranean Experiment (ChArMEx; http://charmex.lsce.ipsl.fr) is an international research initiative to investigate atmospheric chemistry in the Mediterranean region and its impacts on air quality, marine biogeochemistry, and the regional climate. Within the project, a large regional field campaign was performed from mid-June to early August 2013 with intensive airborne measurements including in situ balloon-borne aerosol (Mallet et al., 2016) and ozone (Gheusi et al., 2016) measurements. The observations were conducted during the dry season over the western and central Mediterranean basins. During the first special observation period (SOP) entitled Aerosol Direct Radiative Forcing on the Mediterranean Climate (ChArMEx/ADRIMED SOP-1A) from mid-June to early July, the focus was on aerosol-radiation measurements and their modelling (Mallet et al., 2016). During the second SOP entitled Secondary Aerosol Formation in the Mediterranean (ChArMEx/SAFMED SOP-1B) from mid-July to early August, the focus was on atmospheric chemistry (Zannoni et al., 2017).
The present paper focuses on balloon-borne measurements conducted over the western Mediterranean during desert dust episodes encountered during this summer campaign with the new light optical aerosol counter (LOAC), an optical particle counter/sizer. Renard et al. (2016a, b) present the LOAC instrument and preliminary results from some flights analysed here with more details. In the following, we first briefly summarise the instrument principle and performances and we describe the different sounding and drifting balloon flights performed in summer 2013 (Sect. 2). Results on the particle size-segregated dust concentration are then presented, first in terms of vertical distribution (Sect. 3) and secondly in terms of temporal evolution at constant altitudes (Sect. 4). We then discuss dust particle sedimentation aspects (Sect. 5) and speculations about electrically charged dust particles (Sect. 6), and finally conclude (Sect. 7).
2.1 Balloons-borne instruments
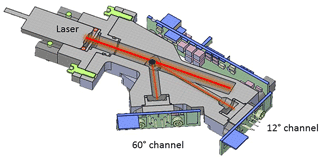
This study is based on the LOAC instrument (Fig. 1), a light optical particle counter described and characterized by Renard et al. (2016a). Briefly, the instrument provides aerosol particle concentration measurements within 19 size classes in the 0.2–100 µm diameter size range, and an estimate of the typology of aerosols based on dual-angle measurements. LOAC can be carried by all kinds of balloons (Renard et al., 2016b). The gondola weight, including the instrument, batteries (alkaline or lithium), and telemetry system, is about 1.0 kg, for an electric consumption of 3 W. Aerosols are sucked in by a small pump in order to pass through a red laser diode beam. In general, the light scattered by the particles depends on both the size and refractive index of the particles. To separate these two parameters, LOAC uses an original concept described in Renard et al. (2016a). Measurements are performed at two scattering angles: the first one is close to forward scattering at around 12∘, where the light scattered (diffracted) by non-spherical particles is controlled by the size of the particles (Lurton et al., 2014); the second one is around 60∘, where the scattered light is strongly dependent on the refractive index of the particles (e.g. Weiss-Wrana, 1983; Renard et al., 2010; Francis et al., 2011). The 12∘ channel is used to retrieve the size distribution independently of the nature of the particles, and the combination of the 12 and 60∘ channels is used to derive the “LOAC speciation index” that informs on the typology or dominant nature of aerosol particles in each size range, based on a laboratory calibration conducted with particles of well-known nature. Figure 2 presents the reference “speciation zones” obtained in laboratory and an example of a LOAC speciation index obtained during ambient air measurements inside a Saharan dust plume on 18 June above Minorca (Spain) at an altitude of 3.1 km.
As described by Renard et al. (2016a), the measurement uncertainty in the total aerosol concentration is ±20 % for concentration values greater than 1 particle per cm3 (for a 10 min integration time). In contrast, the uncertainty is up to about 60 % for concentration values smaller than 10−2 particles cm−3 for a 10 s integration time. In addition, the uncertainty in size calibration is ±0.025 µm for particles smaller than 0.6 µm, 5 % for particles in the 0.7–2 µm range, and 10 % for particles larger than 2 µm. Following coincidences, the measurement accuracy for submicron particles could be reduced in a strongly turbid case when the concentration of particles larger than 3 µm exceeds a few particles cm−3.
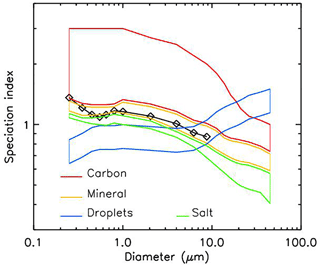
Figure 2“Speciation zones” obtained in laboratory for several types of particles (colour lines) and an example of LOAC speciation index obtained during ambient air measurements inside a Saharan dust plume at an altitude of 3.1 km (18 June 2013, 18:15 UT) above Minorca, Spain (diamonds).
During the ChArMEx summer 2013 campaign, the LOAC gondolas were carried by two types of balloons: the light dilatable balloon (LDB), a meteorological sounding balloon of about 1 kg, and the boundary layer pressurised balloon (BLPB), a drifting balloon of about 2.5 m in diameter. Pictures of the respective gondolas can be found in Renard et al. (2016b).
The LDB allows many flights from various places, and the gondola may generally be retrieved after landing (if not at sea). Measurements were conducted during the ascending phase of the balloon at a speed of 3–6 m s−1. The inlet that collects aerosols was oriented towards the sky. The low flow rate (∼ 1.7 L min−1) of the sampling pump yields sub-isokinetic sampling conditions that could tend to over-sample large particles (Renard et al., 2016a). The highest altitude reached by LOAC was 37 km, although in this study we will only consider the tropospheric part below 8 km in altitude (see Chane Ming et al, 2016, for an analysis of upper troposphere and stratosphere observations). The LOAC measurements, integrated every 10 s, are sent to ground in real time by the on-board telemetry. To increase the measurement accuracy during the LDB ascent, the 10 s concentration values are averaged over a 1 min period, which provides a vertical resolution of about 300 m.
The BLPB, after its ascending phase, follows a near-Lagrangian trajectory, remaining in the same air mass during its trajectory in the lower atmosphere (Ethé et al., 2002; Gheusi et al., 2016; Doerenbecher et al., 2016). Its float altitude was prescribed before the flight (in the 400–3500 m range) by adjusting the balloon density with the appropriate mixture of air and helium. The altitude was chosen to fly within dust layers, based on a LDB flight and/or aerosol lidar measurements performed just before the launch. The horizontal speed of a drifting balloon relative to ambient air is supposedly close to zero and the LOAC sampling inlet was oriented horizontally, so that the particle sampling efficiency should be close to 100 %. The integration time was chosen between 1 and 20 min, due to the low telemetry rate for the downlink through the Iridium satellite communication system. The duration of the flights varied from several hours to more than one day. Also, LOAC was sometimes temporarily shut down after a session of measurements to save on-board energy. For safety reasons, the authorised flight area was restricted to the sea (including islands).
The concentration uncertainties are depending on the integration time. The higher the integration time, the more accurate the measured concentrations; this is a strong constraint for the detection of the largest particles in low concentration. Typically, for a concentration lower than 10−4 particles cm−3, the uncertainties can be as high as 200 % during a LDB flight, but down to 25 % for the BLPB flights with an integration time of 20 min.
2.2 Other measurements
The dust events were identified by near-real-time (NRT) model and remote-sensing products collected operationally by the ChArMEx operation centre web server (http://choc.sedoo.fr) where different quick-looks were made available. The main NRT remote-sensing aerosol products were provided by 4-hourly observations from MSG/SEVIRI. The aerosol optical depth (AOD) at 550 nm (AOD550) product is based on Thieuleux et al. (2005).
In addition, we operated a calibrated ground-based CIMEL AERONET sun photometer that provided AOD at seven wavelengths from 340 to 1020 nm during daytime at the nearby station of Cap d'en Font on Minorca Island (39.826∘ N, 4.208∘ E; http://aeronet.gsfc.nasa.gov), where a Water vapour and Aerosol Lidar (WALI) with polarisation measurements was also in continuous operation (Chazette et al., 2016). The WALI provides the vertical extent, the time evolution, and an estimate of the nature of the particles. The balloon launch site and the lidar and photometer station were distant by about 10 km.
The LOAC aerosol number concentration in the 0.2–100 µm range was converted to aerosol extinction using the Mie scattering theory, assuming spherical dust particles, to be compared to the lidar extinction data at 350 nm. The refractive index was set to 1.53−i0.0025, which corresponds to the mean value determined by Denjean et al. (2016) for the Saharan dust plume events documented during the summer 2013 ChArMEx campaign. This approach suffers from four approximations: (i) all counted particles are assumed to be mineral dust; (ii) the contribution of the smallest particles is unknown, leading to some underestimation of the calculated aerosol extinctions; (iii) the grains are considered as spherical while they are not; and (iv) the refractive index of the grains is not always well-known. In fact, the grains are irregular in shape and their refractive index can vary, depending on their composition and their origin, which potentially increases the uncertainty in our calculation of the aerosol extinction. Also, extinction calculations are highly sensitive to the size of the particles: the uncertainty in the LOAC particle size determination can produce a 50 % uncertainty in the derived extinctions. The error bars on the LOAC-derived extinctions are calculated considering both concentration and size uncertainties. Weinzierl et al. (2009) report that accounting for the non-sphericity of dust particles might yield a small reduction of up to 5 % in extinction computations based on the dust particle size distribution.
We also used the 532 nm aerosol extinction data in the troposphere obtained by the Cloud-Aerosol Lidar with Orthogonal Polarisation (CALIOP on board the CALIPSO satellite) instrument, version 4.10 level-2, (e.g. Winker et al., 2009). The data have a horizontal resolution of 5 km and a vertical resolution of 60 m. Aerosol extinction values have a detection threshold of about 0.01 km−1. The nature of aerosol particles and cloud droplets retrieved in CALIOP observations is given by the CALIOP vertical feature mask algorithm (Omar et al., 2009). To perform the comparison with CALIOP aerosol extinction data, the LOAC aerosol extinctions are calculated at 532 nm from the measured size distribution using the mineral dust refractive index as presented above
Finally, we use the aerosol measurements obtained during an ATR-42 aircraft flight close to Minorca. The instrumentation installed on board the aircraft is described in detail in Denjean et al. (2016). The aerosol size distribution was determined from an optical particle counter GRIMM 1.129 (nominal size range 0.25–32 µm), an ultra-high sensitivity aerosol spectrometer (UHSAS; 0.04–1 µm), and a forward-scattering spectrometer probe FSSP-300 (0.28–20 µm). The UHSAS and FSSP are wing-mounted instruments, whereas the GRIMM installed inside the cabin received ambient air collected through the AVIRAD isokinetic inlet and tubing with a cut-off diameter of 12 µm (Denjean et al., 2016).
2.3 Conditions of measurements
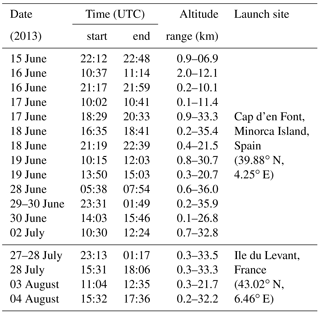
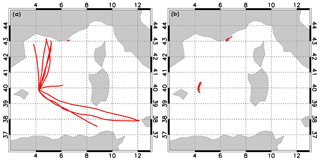
Table 1 and 2 provide the conditions of measurements for LDB and BLPB flights performed during the ChArMEx campaign, respectively. Seventeen LDB flights and 10 BLPB flights were successfully performed during desert dust transport events, most of them launched from Minorca, the easternmost Balearic Island, Spain (latitude 39.88∘ N, longitude 4.25∘ E) from 15 June to 2 July, and a few from Ile du Levant, off Hyères city near the coast of south-eastern France (latitude 43.02∘ N, longitude 6.46∘ E) from 27 July to 4 August (Fig. 3). The confirmation of the occurrence of mineral dust plumes was possible from the LOAC-derived dominant typology of aerosol particles with the LOAC speciation index falling inside the “mineral zone” (Renard et al., 2016a, b).
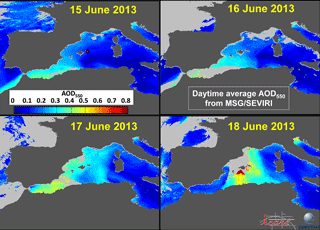
Figure 4Daytime averaged MSG/SEVIRI-derived AOD at 550 nm over seawater from 15 to 18 June 2013, showing the synoptic development of the dust event. The product is computed by the ICARE Data and Services Center (http://www.icare.univ-lille1.fr) based on the algorithm of Thieuleux et al. (2005). Land is masked in dark grey and clouds over ocean in light grey. The red dot on the 15 June image indicates the balloon launching site and remote-sensing station on Minorca Island.
Table 2List of the 10 LOAC flights aboard drifting boundary layer pressurised balloons (BLPBs) flown during African dust plume events of the ChArMEx summer 2013 campaign. All balloons were launched from Minorca Island (Spain; 39.865∘ N, 4.254∘ E) except B82 that was launched from the Ile du Levant (France; 43.022∘ N, 6.460∘ E).
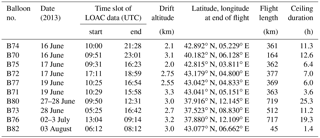
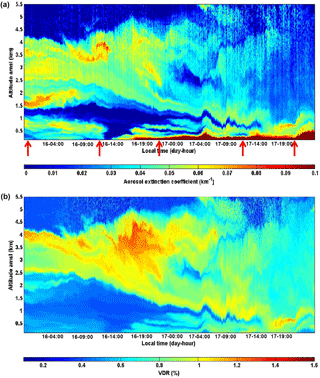
Figure 5Lidar-derived time-height cross sections of the aerosol extinction (a) and volume depolarisation ratio (VDR) (b) at Minorca from 15 June, 22:00 to 17 June, 24:00 UT. The red arrows indicate the time of the 5 LDB launches. A high depolarisation ratio indicates desert dust. Courtesy of Patrick Chazette and Julien Totems, after Chazette et al. (2016).
In the case of a Saharan dust event, the measurement strategy was to perform two LDB flights per day, and two simultaneous BLPB flights drifting at different altitudes within the dust plume (twin flights). The flight altitudes were chosen following real-time indications from the nearby lidar. This strategy was conducted during a relatively long dust event from 15 to 19 June, with nine LDB flights and three twin BLPB flights on 15, 16, and 19 June. In terms of altitude, the twin flights were performed on 16 June at the lower edge and in the middle of the dust layer, on 17 June well inside the maximum concentration of the plume, and on 19 June at levels of minimum and maximum concentrations in the plume. The MODIS satellite observations indicate that the mean AOD was about 0.25 during this period. The dust started to appear over the Alboran Sea on 12 June. The daily average AOD derived from MSG/SEVIRI over the western Mediterranean basin from 15 June to 18 is mapped in Fig. 4. It shows the arrival of the plume from the south-west with a low AOD over Minorca on 15 June, its extension to the north and north-east on 16 and 17 June with a maximum extent of the plume over the basin on 17 June, its reinforcement along a north–south axis on 18 June with the largest AOD values around the Balearic Islands. On 19 June (not shown) Minorca was on the western edge of the plume that had shifted eastward.
Figure 5 shows time series of products from the WALI from late 15 June to the end of 17 June. The high extinction areas below 2.5 km until 13:00 16 June, are not or are weekly depolarising. Chazette et al. (2016; see their Fig. 7) could infer from those data that the dominant aerosol was of marine nature around 500 m in altitude within the atmospheric boundary layer, dust above 2.5 km, and pollution-related in between during the night of 15 to 16 June.
Five LDB flights were also conducted from Minorca Island during the 28 June–2 July period. Figure 6 shows maps of the daytime mean AOD over the western Mediterranean on 29 June and 2 July. On 27–29 June, the Minorca region was impacted by turbid air masses arriving from the north-west (Chazette et al., 2016). Ancellet et al. (2016) identified long-range transport of forest fire smoke from different areas in North America (Canada and Colorado) and of African dust back from the western tropical Atlantic. Their FLEXPART model simulations (Stohl et al., 2002) indicate that over Minorca, Canadian smoke aerosols dominated below 3 km on 28 June late afternoon, when dust dominated above 4 km and Colorado smoke aerosols were abundant above 5 km. Satellite-derived AOD shows that starting on 29 June, a new dust plume from north-western Africa with high AOD emerged from the Atlantic and Mediterranean coasts of Morocco. The plume extended a bit to the north and further east over the sea during the following days but remained confined to the southernmost part of the basin, with moderate AODs and some dust over Minorca on 2 July (AOD at 550 nm up to 0.22; Chazette et al., 2016). A BLPB flight was conducted on 2 July; the mean MODIS AOD was of 0.15 during this period. Lidar data indicate that dust dominated between about 2 and 4.8 km in altitude (Chazette et al., 2016). The aerosol in lower layers could not be typified.
Two other LDB flights were conducted from the Ile du Levant during a dust event on 27–28 July. Twin BLPB flights were also performed in the upper edge of the plume. Finally, two LDB flights and one BLPB flight were conducted during a last dust event on 3–4 August. For those two events, daytime mean MSG-SEVIRI-derived AOD at 550 nm are up to about 0.30–0.35 off Ile du Levant (Fig. 6).
From all those drifting balloon flights, it is possible to study the vertical extent of dust plumes and the temporal evolution of the dust particle size-segregated concentration at a given altitude during transport. In particular, LOAC data can be used to determine the concentration of large particles dominating the mass of desert dust transported and their deposition flux (e.g. Arimoto et al., 1985; Dulac et al., 1987, 1992a, b; Foret et al., 2006).
The main desert dust event observed during the ChArMEx/ADRIMED campaign lasted five days from 15 to 19 June as presented above (Fig. 4). Figure 7 presents the vertical distribution of the 19 size class number concentrations, from the nine LDB flights performed during that period. It shows that the dust plume was heterogeneously distributed in the free troposphere allowing for several local concentration maxima along the vertical and extended up to 7 km on the evening of 18 June. For comparison, Fig. 8 presents measurements during a dust-free flight from Aire-sur-l'Adour, France (43.706∘ N, −0.251∘ E) on 14 August 2014, with no significant local concentration enhancement and the absence of large particles.
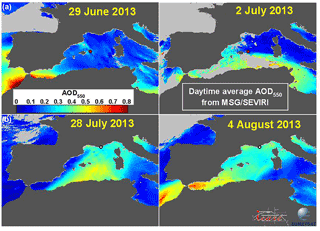
Figure 6Daytime averaged MSG/SEVIRI-derived AOD at 550 nm over seawater on 29 June, 2 and 28 July, and 2 August 2013. The product is computed by the ICARE Data and Services Center (http://www.icare.univ-lille1.fr) based on the algorithm of Thieuleux et al. (2005). Land is masked in dark grey and clouds over ocean in light grey. The red dot on the 29 June and 2 July images (a) indicates the balloon launching site and remote-sensing station on Minorca Island, and the white dot on the 28 July and 2 August images (b) indicates the balloon launching site on the Ile du Levant.
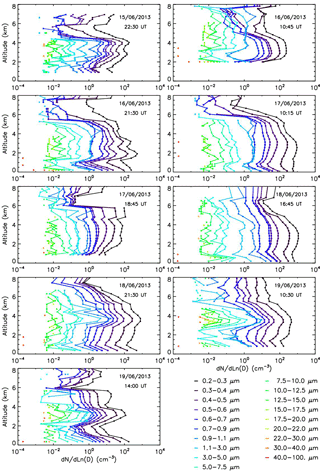
Figure 7Evolution of the dust plume from LOAC balloon measurements over Minorca, Spain, from 15 to 19 June. The ascent from 0 to 8 km takes about 30 min and the reported times of measurement are taken at the middle of the profile.

Figure 8Typical vertical profile when no dust is present; flight from Aire sur l'Adour (south-west of France) on 14 August 2014.
All these flights, including a BLPB flight on the morning of the 19 June morning when LOAC performed measurements during the balloon ascent, were conducted concurrently to the nearby aerosol lidar measurements (Chazette et al., 2016). The time of the first five LDB flights are presented on the WALI time-height cross sections on 16–17 June with arrows marking (Fig. 5). Figure 9 presents the tropospheric vertical profiles of the LOAC and WALI aerosol extinction observed during the 15–19 June dust event over Minorca. Taking into account the uncertainties associated with the different instruments, the overall aerosol extinction values can be regarded as in the same order of magnitude, and even often in good agreement. LOAC and WALI have captured similar vertical structures around half the time. The remaining discrepancies could be due to inaccurate size determination by LOAC, and to the distance between different observations of inhomogeneous dust plumes.
Three other dust events were documented with the LOAC instrument as illustrated by vertical profiles in Fig. 10. The 28 June to 2 July event was not intense in terms of aerosol concentration increase, while the 27–28 July and 3–4 August events were stronger. Similarly to the mid-June event, the dust plumes extended up to an altitude of 6 km and were inhomogeneous in the vertical.
Good spatial and temporal coincidences occurred between LOAC measurements and CALIOP remote-sensing measurements for two events: on 29–30 June above Minorca (Spain) and on 3 August above Ile du Levant (France). The LOAC measurements on 29–30 June were between 23:45 and 01:50 UTC, while the CALIOP measurements were at 01:56 UTC on 30 June. The LOAC measurements on 3 August were between 11:15 and 12:15 UTC, while the CALIOP measurements were at 12:49 UTC. WALI extinctions are also available for the 29 June at around 22:30 UTC.
Figure 11 presents the comparison between LOAC, CALIOP, and WALI aerosol extinctions. During the 29–30 June night, the three instruments show that the plume extended from the ground to an altitude of 2.5 km. Although the general trend is in good agreement for the three instruments, local discrepancies are present in the vertical extinction profiles, possibly due to the temporal and spatial variability in the plume. LOAC seems to indicate a mixture of mineral dust and carbonaceous particles, whereas CALIOP reports polluted continental or smoke particles (but the identification by CALIOP is difficult due to the weakness of the signal). On 30 June at mid-day, the plume had almost disappeared and the LOAC aerosol extinction values are below the detection threshold of CALIOP.
During the 3 August dust event, LOAC observations reveal that the plume extended from 2 to 6.5 km. CALIOP captured all the dust plume in very good agreement with LOAC, and the two instruments identified the same nature of mineral dust particles. Another LOAC profile was obtained in the morning of 3 August at about 06:30 UTC, during a BLPB ascent up to its float altitude at 3 km (in blue in Fig. 11b). The two LOAC measurements are in very good agreement in the 2–3 km altitude range. Below 2 km, the two flight measurements show that the detected typologies are dominated by carbonaceous particles (likely anthropogenic aerosols). The strong temporal variability in particle concentrations below 2.2 km is therefore not related to the dust plume.
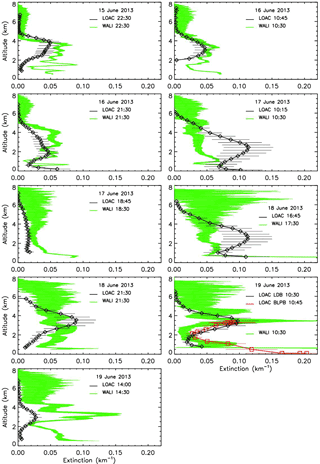
Figure 9Comparison between LOAC and WALI extinctions at 350 nm. All the WALI profiles obtained between −30 and +30 min of the given times are plotted. The LOAC error bars consider the uncertainty in the LOAC measurements and on the counting-extinction conversion; the WALI error bars are calculated from the individual measurement scatter.
The ATR-42 aircraft flight was conducted close to Minorca (50 km apart) during dusty conditions in the morning of 16 June, at the same time of two LOAC balloon flights (LDB and BLPB). The aircraft probed the dust layer in the 2.5–4 km altitude range. Figure 12 presents the comparison of the size distributions measured by the two LOACs and the three aircraft counters at the maximum concentration level of the dust plume (2.5–4 km; see Figs. 5 and 7). The integration from 2.5 to 4 km of the LDB LOAC signal provides a better signal to noise ratio and a better sensitivity to the less numerous large particles (> 15 µm) that are hardly detected with short integration times. Globally, all the instruments are in good agreement for the submicron particles and for the coarse mode at 2–3 µm; the small discrepancies can be due to the difference in the respective measurement locations and to the different measurement methods of the various instruments, although they were all calibrated. The FSSP shows larger concentrations for particles larger than 2 µm in diameter than other instruments (Fig. 12). Reid et al. (2003b) discuss that the FSSP measurement principle tends to produce some oversizing of coarse particles and also shows particle concentrations as high as twice those measured by a passive cavity aerosol spectrometer probe (PCASP) in their overlapping particle diameter range (1.5–3 µm). This could explain such a shift in our data set. It is worth noting that the two LOACs, the FSSP, and the GRIMM (despite the 12 µm cut-off of its sampling inlet) all report particle concentrations larger than 10−3 cm−3 around 20 µm in diameter. Both LOAC flights have detected similar concentrations of particles in the channels larger than 22 µm in diameter. Although the GRIMM counter on board the ATR42 aircraft could sense particles up to 32 µm, it did not report such larger grains, most probably because of the difficulty to collect and carry them up to the instrument inside the aircraft cabin.
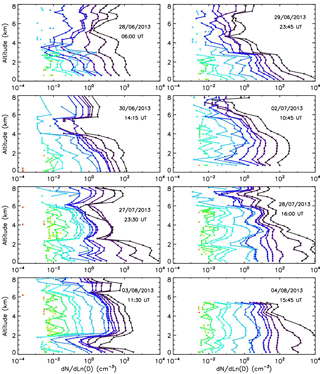
Figure 10Same as Fig. 7 but for other sand plume events observed over Minorca (27 June–2 July) and Ile du Levant (27 July–4 August).
In Fig. 13, the LOAC-derived size distributions were converted to volume concentrations assuming spherical particles, using the mean volume diameter of each size class (Renard et al., 2016a), and integrated over the whole vertical. The LOAC volume size distribution is compared to that derived from the AERONET remote-sensing photometer during the 15–30 June 2013 dust events. On average, the AERONET and LOAC data are in good agreement regarding both the overall amplitude of the concentrations and the position and concentration of the coarse mode at about 3 µm in radius. The better agreement is on the morning of the 16 June; the discrepancies for the other dates could be due to the local variability in the plume content since the LOAC and AERONET measurements are not conducted at the same time. Nevertheless, strong discrepancies sometimes occur for the smallest sizes (below 0.4 µm in radius) and for the largest sizes (above 10 µm in radius). The small-radius discrepancies could be due to local variability in the dust content, like on the 27 June when AERONET retrieves a concentration increase centred on 0.25 µm in radius, and to respective uncertainties of both methods. On the other end of the particle size range, AERONET retrieval is not very sensitive to the particles larger than 7 µm in radius and the largest size class considered in the algorithm (15 µm in radius) is limited to particles smaller than about 19.7 µm in radius (Dubovik and King, 2000; Hashimoto et al., 2012). Thus, LOAC could have detected large particles that were not retrievable from AERONET observations.
Since the concentration of these large particles is low and subject to large uncertainties, the analysis of this mode from measurements during LDB flights is limited. Long duration measurements performed at constant altitude using the LOAC instrument on BLPB gondola with much longer integration time are better adapted to evaluate the concentration of these large particles (with an accuracy as good as 25 %) and to discuss this third giant-size mode.
Figure 14 presents results from the BLPB flights performed inside dust plumes. In particular, the 27–28 June and the 2–3 July BLPB flights were the longest ones, with durations of about 1 day. Day–night transitions were thus encountered, leading to a decrease in float altitude during the night of more than 100 m due to the cooling of the balloon gas and associated loss in buoyancy, so that the night-time and daytime measurements were not conducted in exactly the same air mass.
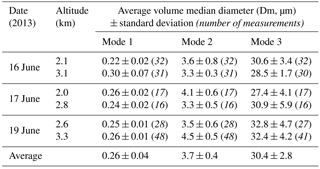
Table 3Average volume median diameter (Dm) of the three fitted aerosol particle modes and respective standard deviation along BLPB flights at float altitude within dust layers, for the six BLPBs launched from Minorca during the 16–19 June 2013 dust event. The time evolution for the three pairs of BLPB flights during this period is shown in Fig. 16. The average and standard deviation in the bottom line are obtained by averaging the 6 above values.
The slow speed ascent of the 19 June and 3 August BLPBs allowed us to obtain two additional fine-resolution vertical profiles in the lower troposphere. The LOAC aerosol concentration values obtained during the BLPB ascent on 19 June are in good agreement with the LDB ascent measurements conducted at the same time (Fig. 9, lower right panel). In particular, LOAC has well captured the vertical variation in the dust plume concentrations, with a local minimum at an altitude of 2 km.
During most of the flights, particles larger than 40 µm in diameter (last LOAC channel) were detected. The concentration of these particles depends mainly on the intensity of the event, but the highest concentration was detected in the free troposphere on 19 June, with about 10−4 particles cm−3 at an altitude of 3.3 km. It can be noticed that concentrations of 10−3 particles cm−3 were detected at ground at the same date, as shown in Fig. 7.
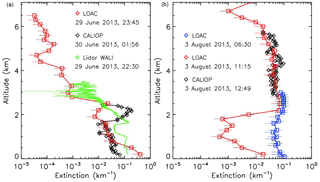
Figure 11(a) Vertical profiles of aerosol extinction from LOAC, CALIOP, and WALI for the 29–30 June event above Minorca; (b) vertical profiles of aerosol extinction from LOAC (LDB and BLPB flights) and CALIOP for the 3 August event above Ile du Levant.
The dust particle volume size distributions were computed by integrating data over more than a minute at a constant altitude. The mean diameter of the last channel was assumed to be 50 µm, although the size range is 40–100 µm, because the concentrations strongly decrease with size and most of the particles thus have a diameter close to the lower limit of the size class. Those volume distributions were then fitted with a 3-mode lognormal model using a least-square procedure. The three fitted volume modal diameters (Dm) have been found at about 0.2, 4, and 30 µm as illustrated in Fig. 15. Note, however, that only the decreasing part of the first (small) mode is captured by LOAC and the corresponding modal diameter could therefore be misestimated. There is also some uncertainty in the third (large) mode related to the assumed upper limit of the measurement size range and to the possible under-sampling of the upper tail of the size distribution; thus this mode value may be a lower limit.
Figure 16 shows the evolution of Dm for the three modes fitted from the three pairs of BLPB LOAC data obtained during the 15–19 June dust event. BLPB flights lasted between 6 and 11 h. No significant temporal trend can be pointed out for Dm, meaning that the size distribution remains almost constant over hours. Thus, it seems that no significant sedimentation has been detected during the flights at quasi-constant altitude even for the very coarse mode at about 30 µm in diameter.
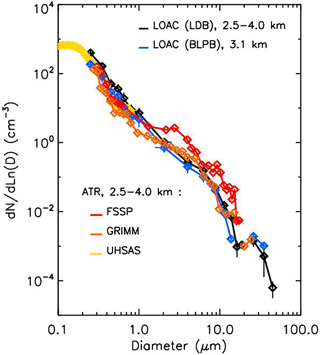
Figure 12Comparison of the particle size distributions during the 16 June dust plume event over Minorca, obtained with LOAC instruments under balloons and particle counters on board the ATR-42 aircraft; measurement altitudes are given.
Table 3 gives the values of Dm for the three modes at float altitude for the six BLPB flights in dust layers during the 16–19 June event; the average values are 0.26, 3.7, and 30.4 µm, respectively. Values for the three modes are very comparable from one balloon to the other with a small variability of about 15 %, likely not significant given the uncertainties of the fitting. The flights inside the other dust events confirm the presence of large particles in a giant mode at about 30 µm in diameter. Nevertheless, some variations in aerosol concentrations often occurred. They are due to changes in the balloon altitude during the day–night transition for the 27–28 June and the 2–3 July flights, to a non-constant altitude for the 28 June flight, and to a slow ascent during the 3 July flight. These variations in concentration are thus probably related to vertical variations in the dust plume layer. Indeed, lidar profiles from Minorca show a strong vertical structuration of aerosol layers (Chazette et al., 2016) that could be associated with significant differences in aerosol composition, concentration, and size distribution. Hamonou et al. (1999) first documented the multi-layered African dust transport over the Mediterranean basin with variable source regions of mineral dust particles found in different layers of the plume.
The presence of the third very coarse mode with Dm of the order of 30 µm may be related to the existence of such a course a mode in desert dust aerosols: a value of the same order (Dm = 42.3 µm) is assumed in the model of background desert dust aerosol of Jaenicke (1987). Observations of a very coarse mode are also reported by Weinzierl et al. (2009): particles larger than 20 µm were detected in 9 out of 10 cases of 49 pure dust layers observed in altitude over southern Morocco with wing-mounted airborne optical particle counters. In 20 % of the cases, particle sizes equal to or larger than 40 and up to 80 µm were detected (with a detection limit of 10−2 cm−3). They report an average volume median diameter of the coarse mode of 15.5 ± 10.9 µm near dust source region and a maximum value larger than 60 µm in a case of strong convection. Weinzierl et al. (2011) also report that particles more than 20 µm in diameter (but < 30 µm) are still found at concentrations > 10−2 cm−3 in 1∕3 of 24 dust transport cases documented over the eastern tropical North Atlantic. The better sensitivity of LOAC may explain why we report more systematically a coarse mode of dust particles above 20 µm in diameter. However, the persistence of such large particles, lifted several days ago, and their transport above the Mediterranean basin is not well understood given their large theoretical settling velocity.
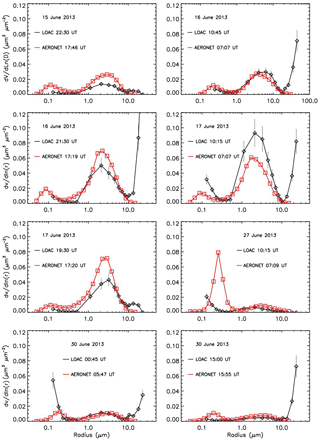
Figure 13Volume size distribution retrieved from AERONET (https://aeronet.gsfc.nasa.gov/) and LOAC data on Minorca during the June 2013 plume events.
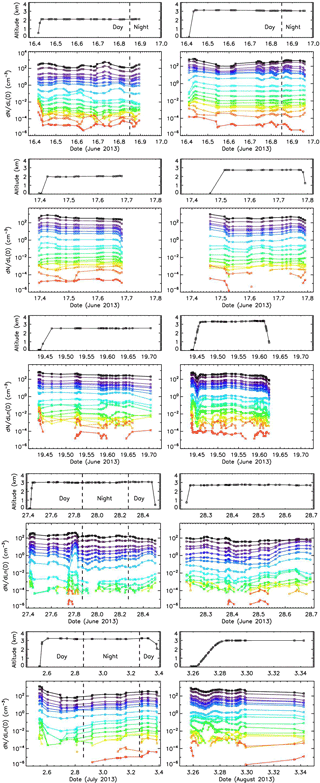
Figure 14Each pair of graphs represents the time series of flight altitude (top) and LOAC-derived aerosol concentration for the 19 size classes (bottom), for BLPB flights from Minorca towards the French coast. Colour coding is as in Fig. 7. Day–night transitions are indicated by dashed lines when appropriate.
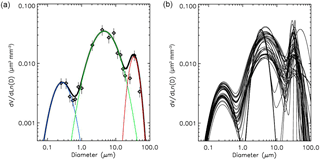
Figure 15(a) Example of particle volume size distribution within the desert dust plume from the BLPB flight of 19 June 2013 at an altitude of 3.3 km, from one measurement at 12:30 UT. The black diamonds are the LOAC measurements (with 1σ error bars), the coloured curves represent the lognormal functions for each of the observed modes, and the black curve represents the overall fit (sum of the 3 modes). The geometric mean diameters (Dm) of the 3 modes are of 0.27, 4.6, and 34 µm, with respective geometric standard deviations (σ) of 1.79, 2.14, and 1.35. (b) The 41 fitted size distributions when the third mode was detected, retrieved from all measurements during the 19 June BLPB flight at float altitude.
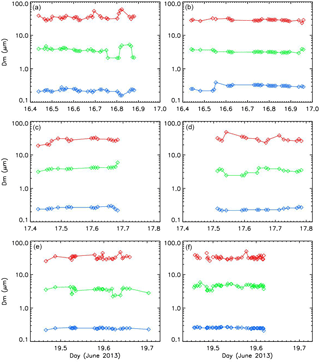
Figure 16Time evolution of the particle size at the maximum concentration for each mode (Dm) of the volume size distribution, at float altitude of BLPB flights from Minorca towards the French coast. The altitudes are 2.1 and 3.1 km for the 16 June flights (a and b, respectively), 2.0 and 2.7 km for the 17 June flights (c and d, respectively), and 2.5 and 3.3 km for the 19 June flights (e and f, respectively). Average Dm values of the three modes during each flight are given in Table 3.
According to the Stoke's approximation that equates the effective weight of spherical particles and the viscous resistance of the fluid through which it moves (Stokes, 1851), the gravitational settling velocity Vg of dust particles is proportional to the square of their diameter. Assuming a classical density value of 2.5 g cm−3 for spherical dust particles (Dulac et al., 1989; Zender et al., 2003; Linke et al., 2006), Vg is thus about 0.0076, 0.19, 0.76, 3.0, 6.8, and 19 cm s−1 for particles of 1, 5, 10, 20, 30, and 50 µm in diameter, respectively, implying a downward transport ranging from about 6.6 to 16 400 m d−1. Particles larger than 12.3 µm have a sedimentation velocity larger than 1000 m d−1. This is supposed to yield a quick segregation and a rapid evolution of the dust particle size distribution in the first days (and even hours) of transport after lifting from the dust source region (e.g. Schütz et al., 1981; see also Fig. 1 in Foret et al., 2006). Dust-loaded air masses transported northward from Africa above the marine atmospheric boundary layer in the western Mediterranean are known to be associated with warm fronts and to experience a significant upward synoptic movement (Prodi and Fea, 1979; Reiff et al., 1986). Dulac et al. (1992a, b) report that during a typical summer dust episode the turbid air mass ascending velocity was on average of the order of 1.5 to 1.8 cm s−1 for 4 days, i.e. was more than compensating the average deposition velocity of the bimodal dust particle size distribution observed in Corsica during this event, with two modes at 2 and 13 µm. This is not enough, however, to explain the relatively constant dust particle size distribution observed during BLPB flights: accounting for an average upward air mass vertical velocity of 1.5 cm s−1 that would counteract gravitation, a 4 km thick dust layer should anyway lose by sedimentation all particles larger than 30 µm in about 1 day.
According to Slinn (1983; Eq. 160), the flux-mean deposition velocity (〈Vd〉) of a lognormal distribution of particles of modal diameter Dm and geometric standard deviation σg can be derived from . Using this formula, we can derive that the three fitted dust particle size modes shown in Fig. 15 have a respective gravitational settling velocity of about 0.0011, 0.50, and 8.1 cm s−1, corresponding to a negligible downward transport by sedimentation of about 1 m d−1 for the finest mode, but to 430 m d−1 for the intermediate mode, and as much as 7000 m d−1 for the largest mode. Figure 14 does not show any significant systematic evolution of the concentration in the different modes. New particles sedimenting from turbid layers above the balloon might compensate for the sedimentation of particles from the intermediate coarse mode with Dm of about 4 µm during our 1 day or less balloon flight times. However, we should definitely observe a significant decrease in the concentration and median size of the very coarse mode with Dm ≈ 30 µm. Figure 16 does not show any evidence of a decrease in the very coarse mode median diameter.
Laboratory tests have shown that the LOAC photodiode and electronics are sensitive to electromagnetic fields, as those generated by radio telemetry, by strong atmospheric electric activity (e.g. during thunderstorms), and even by an electrical bay. In these cases, the electronic noise and the electronic offset both increase. The offset also increases with increasing ambient temperature.
LOAC performs measurements of the electronic noise and offset every 15 min when the light source is switched off (Renard et al., 2016a). During a typical LDB flight, the LOAC electronic offset slightly decreased with altitude due to the decreasing temperature encountered during the balloon ascent. In contrast, an offset increase coincident with the increase in dust particle concentration was detected for five flights when crossing a dust plume, as shown in Fig. 17. Such an offset increase was never observed outside the plumes.
Laboratory tests have shown that indeed the LOAC electronics is very sensitive to electromagnetic fields, with an increase in the offset. These offset increases may be related to the presence of local strong electromagnetic fields inside the plume, although it is not possible to retrieve their strength with such kinds of measurements. It is known that the aerosol generation from both mineral dust powders (e.g. Johnston et al., 1987; Forsyth et al., 1998) and arid soils (e.g. Ette, 1971; Farrell et al., 2004; Sow et al., 2011) produces charged particles, and that electrical charges in sandstorms perturb telecommunication transmissions (e.g. Li et al., 2010 and references therein). The presence of an electric field in dust aerosol layers was indeed proposed by Ulanowski et al. (2007) to explain the alignment of non-spherical particles and polarisation effects in a dust plume over the Canary Islands. Nicoll et al. (2011) also report charged particles within Saharan dust layers with two balloon soundings performed above the Cape Verde islands.
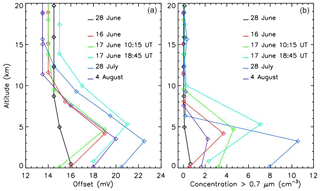
Figure 17(a) Profiles of the LOAC electronic offset in the case of crossing a strong dust plume (16 June, 17 June mid-day and evening, 28 July, and 4 August) and in the case of a weak dust plume just close to ground on 28 June. (b) Profiles of number concentrations of dust particles larger than 0.7 µm for the same flights.
We suggest that electric forces within the dust layers could contribute to maintaining coarse particles in levitation that would otherwise be expected to sediment down. Future balloon campaigns with LOAC measurement in parallel with an adequate instrument accurately retrieving the atmospheric electric field could consolidate these previous studies. This appears to be an important perspective to consider since the local electric field in a dust plume might be at least partly responsible for the non-sedimentation of large particles resulting in much longer transport than expected.
The in situ LOAC balloon-borne measurements above the Mediterranean basin in summer 2013 have allowed us to document both the vertical extent of the dust plumes and, for the first time to our knowledge, the time evolution of dust concentrations from several hours to one day in a quasi-Lagrangian way at constant altitude. Whenever possible, LOAC observations were compared to the measurements done by other platforms, like the ATR-42 aircraft which embarked upon various aerosol counters, and a backscattering lidar located close to the balloon launching area. Given the limits and uncertainties associated with each measurement system, the agreement was satisfactory, which gave us confidence in the LOAC aerosol distributions. LOAC has often detected the presence of particles larger than 40 µm, with concentrations up to 10−4 particles cm−3, and the fitting of volume size distribution ended up in a coarse mode at 3–4 µm in diameter and a giant mode at about 30 µm. Such large particles should have been lifted several days before, and at least 1000 km far from our measurements. Their transport over such long distances, not expected from calculations of dust particle sedimentation, is not yet well understood. Indeed, the gravitational settling velocity of dust particles between 12 and 40 µm in diameter spans from almost 1 to more than 10 km day−1. An indirect evidence of the presence of charged particles has been derived from the LOAC measurements and we therefore hypothesise that electric forces within the dust plume might limit the sedimentation of the coarse dust fraction.
ChArMEx was a unique experiment involving a large set of ground-based and airborne instruments. Since 2014, regular LDBs with LOAC are launched twice a month from Aire-sur-l'Adour (south-west of France; 43.71∘ N, 0.25∘ W) to monitor the aerosol content from the troposphere to the stratosphere. Dust events were already occasionally detected; they will be used to document other dust events than those of summer 2013 with the same instrument, and to confirm the presence of both the large particles and the charged particles thanks to new developments of the instrumental payload.
ChArMEx LOAC balloon and other measurement data are available on the ChArMEx database (http://mistrals.sedoo.fr/ChArMEx/). Finally, CALIOP data have been retrieved through the ICARE Data and Services Center (http://www.icare.univ-lille1.fr). The doi reference for the data is https://doi.org/10.6096/MISTRALS-ChArMEx.1017 (Renard, 2013).
The authors declare that they have no conflict of interest.
This article is part of the special issue“CHemistry and AeRosols Mediterranean EXperiments (ChArMEx) (ACP/AMT inter-journal SI)”. It is not associated with a conference.
The LOAC development project was funded by the French National Research
Agency's ANR ECOTECH. The balloon flights of the MISTRALS/ChArMEx campaign
were funded and performed by the French Space Agency CNES. The LOAC
instruments are built by Environnement-SA company; the balloon-borne gondolas
are provided by MeteoModem company. The numerous LOAC instruments used during the campaign and the
scientific and technical staff missions were funded with the support of CNES,
INSU-CNRS, and ADEME. Airborne data were obtained using the ATR-42
Atmospheric Research Aircraft managed by SAFIRE, which is a joint facility of
CNRS, Météo-France, and CNES. The SAFIRE team is acknowledged for the aircraft operation.
The French VOLTAIRE Labex (Laboratoire d'Excellence ANR-10-LABX-100-01)
also provided a couple of LOAC instruments. The PHOTONS
(http://loaphotons.univ-lille1.fr/) and AERONET
(https://aeronet.gsfc.nasa.gov/) teams are acknowledged for our sun
photometer calibration and data processing, respectively. Patrick Chazette and Julien
Totems are acknowledged for lidar data from Minorca, and Paola Formenti for her
contribution to airborne data acquisition and reference suggestions. We also
thank Oleg Dubovik for his comments on the AERONET inversion limitation for
large particles.
Edited by: Evangelos Gerasopoulos
Reviewed by: two anonymous
referees
Alfaro, S. C. and Gomes, L.: Modeling mineral aerosol production by wind erosion: Emission intensities and aerosol size distributions in source areas, J. Geophys. Res., 106, 18075–18084, https://doi.org/10.1029/2000JD900339, 2001.
Alfaro, S. C., Gaudichet, A., Gomes, L., and Maillé, M.: Mineral aerosol production by wind erosion: Aerosol particle sizes and binding energies, Geophys. Res. Lett., 25, 991–994, https://doi.org/10.1029/98GL00502, 1998.
Alpert, P., Kaufman, Y. J., Shay-El, Y., Tanré, D., da Silva, A., Schubert, S., and Joseph, J. H.: Quantification of dust-forced heating of the lower troposphere, Nature, 395, 367–370, https://doi.org/10.1038/26456, 1998.
Ancellet, G., Pelon, J., Totems, J., Chazette, P., Bazureau, A., Sicard, M., Di Iorio, T., Dulac, F., and Mallet, M.: Long-range transport and mixing of aerosol sources during the 2013 North American biomass burning episode: analysis of multiple lidar observations in the western Mediterranean basin, Atmos. Chem. Phys., 16, 4725–4742, https://doi.org/10.5194/acp-16-4725-2016, 2016.
Ansmann, A., Petzold, A., Kandler, K., Tegen, I., Wendisch, M., Müller, D., Weinzierl, B., Müller, T., and Heintzenberg, J.: Saharan Mineral Dust Experiments SAMUM–1 and SAMUM–2: what have we learned?, Tellus B, 63, 403–429, https://doi.org/10.1111/j.1600-0889.2011.00555.x, 2011.
Arimoto, R., Duce, R. A., Ray, B. J., and Unni, C. K.: Atmospheric trace elements at Enewetak Atoll: 2. Transport to the ocean by wet and dry deposition, J. Geophys. Res., 90, 2391–2408, https://doi.org/10.1029/JD090iD01p02391, 1985.
Avila, A. and Peñuelas, J.: Increasing frequency of Saharan rains over northeastern Spain and its ecological consequences, Sci. Total Environ., 228, 153–156, https://doi.org/10.1016/S0048-9697(99)00041-8, 1999.
Avila, A. and Rodà, F.: Assessing decadal changes in rainwater alkalinity at a rural Mediterranean site in the Montseny Mountains (NE Spain), Atmos. Environ., 36, 2881–2890, https://doi.org/10.1016/S1352-2310(02)00098-5, 2002.
Betzer, P. R., Carder, K. L., Duce, R. A., Merrill, J. T., Tindale, N. W., Uematsu, M., Costello, D. K., Young, R. W., Feely, R. A., Breland, J. A., Bernstein, R. E., and Greco, A. M.: Long-range transport of giant mineral aerosol particles, Nature, 336, 568–571, https://doi.org/10.1038/336568a0, 1988.
Buat-Ménard, P. and Chesselet, R.: Variable influence of the atmospheric flux on the trace metal chemistry of oceanic suspended matter, Earth Planet. Sc. Lett., 42, 399–411, https://doi.org/10.1016/0012-821X(79)90049-9, 1979.
Carder, K. L., Stewards, R. G., Betzer, P. R., Johnson, D. L., and Prospero, J. M.: Dynamics and composition of particles from an Aeolian input event to the Sargasso Sea, J. Geophys. Res., 91, 1055–1066, https://doi.org/10.1029/JD091iD01p01055, 1986.
Chaboureau, J.-P., Richard, E., Pinty, J.-P., Flamant, C., Di Girolamo, P., Kiemle, C., Behrendt, A., Chepfer, H., Chiriaco, M., and Wulfmeyer, V.: Long-range transport of Saharan dust and its radiative impact on precipitation forecast: a case study during the Convective and Orographically-induced Precipitation Study (COPS), Q. J. Roy. Meteor. Soc., 137, 236–251, https://doi.org/10.1002/qj.719, 2011.
Chane Ming, F., Vignelles, D., Jegou, F., Berthet, G., Renard, J.-B., Gheusi, F., and Kuleshov, Y.: Gravity-wave effects on tracer gases and stratospheric aerosol concentrations during the 2013 ChArMEx campaign, Atmos. Chem. Phys., 16, 8023–8042, https://doi.org/10.5194/acp-16-8023-2016, 2016.
Chazette, P., Totems, J., Ancellet, G., Pelon, J., and Sicard, M.: Temporal consistency of lidar observations during aerosol transport events in the framework of the ChArMEx/ADRIMED campaign at Minorca in June 2013, Atmos. Chem. Phys., 16, 2863–2875, https://doi.org/10.5194/acp-16-2863-2016, 2016.
Chen, G., Ziemba, L. D., Chu, D. A., Thornhill, K. L., Schuster, G. L., Winstead, E. L., Diskin, G. S., Ferrare, R. A., Burton, S. P., Ismail, S., Kooi, S. A., Omar, A. H., Slusher, D. L., Kleb, M. M., Reid, J. S., Twohy, C. H., Zhang, H., and Anderson, B. E.: Observations of Saharan dust microphysical and optical properties from the Eastern Atlantic during NAMMA airborne field campaign, Atmos. Chem. Phys., 11, 723–740, https://doi.org/10.5194/acp-11-723-2011, 2011.
Chester, R., Nimmo, M., and Keyse, S.: The influence of Saharan and Middle Eastern desert-derived dust on the trace metal composition of Mediterranean aerosols and rainwater, in: The Impact of Desert Dust Across the Mediterranean, edited by: Guerzoni, S. and Chester, R., Kluwer, 253–273, 1996.
Choobari O. A., Zawar-Reza, P., and Sturman, A.: The global distribution of mineral dust and its impacts on the climate system: A review, Atmos. Res., 138, 152–165, https://doi.org/10.1016/j.atmosres.2013.11.007, 2014.
D'Almeida, G. A. and Schütz, L.: Number, mass and volume distribution of mineral aerosol and soils of the Sahara, J. Clim. Appl. Meteor., 22, 233–243, https://doi.org/10.1175/1520-0450(1983)022<0233:NMAVDO>2.0.CO;2, 1983.
Denjean, C., Cassola, F., Mazzino, A., Triquet, S., Chevaillier, S., Grand, N., Bourrianne, T., Momboisse, G., Sellegri, K., Schwarzenbock, A., Freney, E., Mallet, M., and Formenti, P.: Size distribution and optical properties of mineral dust aerosols transported in the western Mediterranean, Atmos. Chem. Phys., 16, 1081–1104, https://doi.org/10.5194/acp-16-1081-2016, 2016.
Doerenbecher, A., Basdevant, C. ,Drobinski, P., Durand, P., Fesquet, C., Bernard, F., Cocquerez, P., Verdier, N., and Vargas, A. : Low atmosphere drifting balloons: platforms for environment monitoring and forecast improvement, B. Am. Meteorol. Soc., 97, 1583–1599, https://doi.org/10.1175/BAMS-D-14-00182.1, 2016.
Dubovik, O. and King, M. D.: A flexible inversion algorithm for retrieval of aerosol optical properties from Sun and sky radiance measurements, J. Geophys. Res., 105, 20673–20696, https://doi.org/10.1029/2000JD900282, 2000.
Duce, R. A.: Sources, distributions, and fluxes of mineral aerosols and their relationship to climate, in: Aerosol Forcing of Climate, edited by: Charlson, R. J. and Heintzenberg, Wiley, 43–72, 1995.
Dulac, F. and Chazette, P.: Airborne study of a multi-layer aerosol structure in the eastern Mediterranean observed with the airborne polarized lidar ALEX during a STAAARTE campaign (7 June 1997), Atmos. Chem. Phys., 3, 1817–1831, https://doi.org/10.5194/acp-3-1817-2003, 2003.
Dulac, F., Buat-Ménard, P., Arnold, M., Ezat, U., and Martin, D: Atmospheric input of trace metals to the western Mediterranean Sea: 1. Factors controlling the variability of atmospheric concentrations, J. Geophys. Res., 92, 8437–8453, https://doi.org/10.1029/JD092iD07p08437, 1987.
Dulac, F., Buat-Ménard, P., Ezat, U., Melki, S., and Bergametti, G.: Atmospheric input of trace metals to the western Mediterranean: uncertainties in modelling dry deposition from cascade impactor data, Tellus B, 41, 362–378, https://doi.org/10.1111/j.1600-0889.1989.tb00315.x, 1989.
Dulac, F., Bergametti, G., Losno, R., Remoudaki, E., Gomes, L., Ezat, U., and Buat-Ménard, P.: Dry deposition of mineral aerosol particles: significance of the large size fraction, in: Precipitation Scavenging and Atmosphere-Surface Exchange, edited by: Schwartz, S. E. and Slinn, W. G. N., 2, 841–854, Hemisphere, Richland, WA, 1992a.
Dulac, F., Tanré, D., Bergametti, G., Buat-Ménard, P., Desbois, M., and Sutton, D.: Assessment of the African airborne dust mass over the western Mediterranean Sea using Meteosat data, J. Geophys. Res., 97, 2489–2506, https://doi.org/10.1029/91JD02427, 1992b.
Ethé, C., Basdevant, C., Sadourny, R., Appu, K. S., Harenduprakash, L., Sarode, P. R., and Viswanathan, G.: Air mass motion, temperature and humidity over the Arabian Sea and western Indian Ocean during the INDOEX intensive phase, as obtained from a set of superpressure drifting balloons, J. Geophy. Res., 107, 8023, https://doi.org/10.1029/2001JD001120, 2002.
Ette, A. I. I.: The effect of the Harmattan dust on atmospheric electric parameters, J. Atmos. Terr. Phys., 33, 295–300, https://doi.org/10.1016/0021-9169(71)90208-X, 1971.
Farrell, W. M., Smith, P. H., Delory, G. T., Hillard, G. B., Marshall, J. R., Catling, D., Hecht, M., Tratt, D. M., Renno, N., Desch, M. D., Cummer, S. A., Houser, J. G., and Johnson, B.: Electric and magnetic signatures of dust devils from the 2000–2001 MATADOR desert tests, J. Geophys. Res., 109, E03004, https://doi.org/10.1029/2003JE002088, 2004.
Foret, G., Bergametti, G., Dulac, F., and Menut, L.: An optimized particle size bin scheme for modeling mineral dust aerosol, J. Geophys. Res., 111, D17310, https://doi.org/10.1029/2005JD006797, 2006.
Formenti, P., Rajot, J. L., Desboeufs, K., Caquineau, S., Chevaillier, S., Nava, S., Gaudichet, A., Journet, E., Triquet, S., Alfaro, S., Chiari, M., Haywood, J., Coe, H., and Highwood, E.: Regional variability of the composition of mineral dust from western Africa: Results from the AMMA SOP0/DABEX and DODO field campaigns, J. Geophys. Res., 113, D00C13, https://doi.org/10.1029/2008JD009903, 2008.
Forsyth, B., Liu, B. Y. H., and Romay, F. J.: Particle charge distribution measurements for commonly generated laboratory aerosol, Aerosol Sci. Tech., 28, 489–501, https://doi.org/10.1080/02786829808965540, 1998.
Francis, M., Renard, J.-B., Hadamcik, E., Couté, B., Gaubicher, B., and Jeannot, M.: New studies on scattering properties of different kinds of soot, J. Quant. Spectrosc. Ra., 112, 1766–1775, https://doi.org/10.1016/j.jqsrt.2011.01.009, 2011.
Gheusi, F., Durand, P., Verdier, N., Dulac, F., Attié, J.-L., Commun, P., Barret, B., Basdevant, C., Clenet, A., Derrien, S., Doerenbecher, A., El Amraoui, L., Fontaine, A., Hache, E., Jambert, C., Jaumouillé, E., Meyerfeld, Y., Roblou, L., and Tocquer, F.: Adapted ECC ozonesonde for long-duration flights aboard boundary-layer pressurised balloons, Atmos. Meas. Tech., 9, 5811–5832, https://doi.org/10.5194/amt-9-5811-2016, 2016.
Gkikas, A., Hatzianastassiou, N., Mihalopoulos, N., Katsoulis, V., Kazadzis, S., Pey, J., Querol, X., and Torres, O.: The regime of intense desert dust episodes in the Mediterranean based on contemporary satellite observations and ground measurements, Atmos. Chem. Phys., 13, 12135–12154, https://doi.org/10.5194/acp-13-12135-2013, 2013.
Guerzoni, S., Chester, R., Dulac, F., Herut, B., Loÿe-Pilot, M.-D., Measures, C., Migon, C., Molinaroli, E., Moulin, C., Rossini, P., Saydam, C., Soudine, A., and Ziveri, P.: The role of atmospheric deposition in the biogeochemistry of the Mediterranean Sea, Prog. Oceanogr., 44, 147–190, https://doi.org/10.1016/S0079-6611(99)00024-5, 1999.
Guieu, C., Ridame, C., Pulido-Villena, E., Bressac, M., Desboeufs, K., and Dulac, F.: Impact of dust deposition on carbon budget: a tentative assessment from a mesocosm approach, Biogeosciences, 11, 5621–5635, https://doi.org/10.5194/bg-11-5621-2014, 2014.
Hamonou, E., Chazette, P., Balis, D., Dulac, F., Schneider, X., Galani, E., Ancellet, G., and Papayannis, A.: Characterization of the vertical structure of Saharan dust export to the Mediterranean basin, J. Geophys. Res., 104, 22257–22270, https://doi.org/10.1029/1999JD900257, 1999.
Hashimoto, M., Nakajima, T., Dubovik, O., Campanelli, M., Che, H., Khatri, P., Takamura, T., and Pandithurai, G.: Development of a new data-processing method for SKYNET sky radiometer observations, Atmos. Meas. Tech., 5, 2723–2737, https://doi.org/10.5194/amt-5-2723-2012, 2012.
Haywood, J., Francis, P., Osborne, S., Glew, M., Loeb, N., Highwood, E., Tanré, D., Myhre, G., Formenti, P., and Hirst, E.: Radiative properties and direct radiative effect of Saharan dust measured by the C-130 aircraft during SHADE: 1. Solar spectrum, J. Geophys. Res., 108, 8577, https://doi.org/10.1029/2002JD002687, 2003.
Herut, B., Krom, M. D., Pan, G., and Mortimer, R.: Atmospheric input of nitrogen and phosphorus to the Southeast Mediterranean: Sources, fluxes and possible impact, Limnol. Oceanogr., 44, 1683–1692, https://doi.org/10.4319/lo.1999.44.7.1683, 1999.
Jaenicke, R.: Aerosol physics and chemistry, in: Landolt-Börnstein Numerical Data and Functional Relationships in Science and Technology V, 4b, edited by: Fischer, G., 391–457, Springer-Verlag, Berlin, https://doi.org/10.1007/b31154, 1987.
Jeong, G. Y., Kim, J. Y., Seo, J., Kim, G. M., Jin, H. C., and Chun, Y.: Long-range transport of giant particles in Asian dust identified by physical, mineralogical, and meteorological analysis, Atmos. Chem. Phys., 14, 505–521, https://doi.org/10.5194/acp-14-505-2014, 2014.
Johnston, A. M., Vincent, J. H., and Jones, A. D.: Electrical charge characteristics of dry aerosols produced by a number of laboratory mechanical dispersers, Aerosol Sci. Tech., 6, 115–127, https://doi.org/10.1080/02786828708959125, 1987.
Li, X., Xingcai, L., and Xiaojing, Z.: Attenuation of an electromagnetic wave by charged dust particles in a sandstorm, Appl. Optics, 49, 6756–6761, https://doi.org/10.1364/AO.49.006756, 2010.
Li, Z., Lau, W. K.-M., Ramanathan, V., Wu, G., Ding, Y., Manoj, M. G., Liu, J., Qian, Y., Li, J., Zhou, T., Fan, J., Rosenfeld, D., Ming, Y., Wang, Y., Huang, J., Wang, B., Xu, X., Lee, S.-S., Cribb, M., Zhang, F., Yang, X., Zhao, C., Takemura, T., Wand, K., Xia, X., Yin, Y., Zhang, H., Guo, J., Zhai, P. M., Sugimoto, N., Babu, S. S., and Brasseur, G. P.: Aerosol and monsoon climate interactions over Asia, Rev. Geophys., 54, 866–929, https://doi.org/10.1002/2015RG000500, 2016.
Linke, C., Möhler, O., Veres, A., Mohácsi, Á., Bozóki, Z., Szabó, G., and Schnaiter, M.: Optical properties and mineralogical composition of different Saharan mineral dust samples: a laboratory study, Atmos. Chem. Phys., 6, 3315–3323, https://doi.org/10.5194/acp-6-3315-2006, 2006.
Liu, J., Zheng, Y., Li, Z., Flynn, C., Welton, E. J., and Cribb, M.: Transport, vertical structure and radiative properties of dust events in southeast China determined from ground and space sensors, Atmos. Environ., 45, 6469–6480, https://doi.org/10.1016/j.atmosenv.2011.04.031, 2011.
Loÿe-Pilot, M. D., Martin, J. M., and Morelli, J.: Influence of Saharan dust on the rain acidity and atmospheric input to the Mediterranean, Nature, 321, 427–428, https://doi.org/10.1038/321427a0, 1986.
Lurton, T., Renard, J.-B., Vignelles, D., Jeannot, M., Akiki, R., Mineau, J.-L., and Tonnelier, T.: Light scattering at small angles by atmospheric irregular particles: modelling and laboratory measurements, Atmos. Meas. Tech., 7, 931–939, https://doi.org/10.5194/amt-7-931-2014, 2014.
Maher, B. A., Prospero, J. M., Mackie, D., Gaiero, D., Hesse, P. P., and Balkanski, Y.: Global connections between aeolian dust, climate and ocean biogeochemistry at the present day and at the last glacial maximum, Earth Sci. Rev., 99, 61–97, https://doi.org/10.1016/j.earscirev.2009.12.001, 2010.
Mahowald, N., Engelstaedter, S., Luo, C., Sealy, A., Artaxo, P., Benitez-Nelson, C., Bonnet, S., Chen, Y., Chuang P. Y., Cohen, D. D., Dulac, F., Herut, B., Johansen, A. M., Kubilay, N., Losno, R., Maenhaut, W., Paytan, A., Prospero, J. M., Shank, L. M., and Siefert, R. L.: Atmospheric Iron deposition: global distribution, variability and human perturbations, Annu. Rev. Mar. Sci., 1, 245–278, https://doi.org/10.1146/annurev.marine.010908.163727, 2009.
Mahowald, N., Ward, D. S., Kloster, S., Flanner, M. G., Heald, C. L., Heavens, N. G., Hess, P. G., Lamarque, J.-F., and Chuang P. Y.: Aerosol impacts on climate and biogeochemistry, Annu. Rev. Env. Resour., 36, 45–74, https://doi.org/10.1146/annurev-environ-042009-094507, 2011.
Mallet, M., Dulac, F., Formenti, P., Nabat, P., Sciare, J., Roberts, G., Pelon, J., Ancellet, G., Tanré, D., Parol, F., Denjean, C., Brogniez, G., di Sarra, A., Alados-Arboledas, L., Arndt, J., Auriol, F., Blarel, L., Bourrianne, T., Chazette, P., Chevaillier, S., Claeys, M., D'Anna, B., Derimian, Y., Desboeufs, K., Di Iorio, T., Doussin, J.-F., Durand, P., Féron, A., Freney, E., Gaimoz, C., Goloub, P., Gómez-Amo, J. L., Granados-Muñoz, M. J., Grand, N., Hamonou, E., Jankowiak, I., Jeannot, M., Léon, J.-F., Maillé, M., Mailler, S., Meloni, D., Menut, L., Momboisse, G., Nicolas, J., Podvin, T., Pont, V., Rea, G., Renard, J.-B., Roblou, L., Schepanski, K., Schwarzenboeck, A., Sellegri, K., Sicard, M., Solmon, F., Somot, S., Torres, B., Totems, J., Triquet, S., Verdier, N., Verwaerde, C., Waquet, F., Wenger, J., and Zapf, P.: Overview of the Chemistry-Aerosol Mediterranean Experiment/Aerosol Direct Radiative Forcing on the Mediterranean Climate (ChArMEx/ADRIMED) summer 2013 campaign, Atmos. Chem. Phys., 16, 455–504, https://doi.org/10.5194/acp-16-455-2016, 2016.
Maring, H., Savoie, D. L., Izaguirre, M. A., Custals, L., and Reid, J. S.: Mineral dust aerosol size distribution change during atmospheric transport, J. Geophys. Res., 108, 8592, https://doi.org/10.1029/2002JD002536, 2003.
Martin, J., Gordon, R. M., and Fitzwater, S. E.: The case for iron, Limnol. Oceanogr., 36, 1793–1802, https://doi.org/10.4319/lo.1991.36.8.1793, 1991.
McConnell, C. L., Highwood, E. J., Coe, H., Formenti, P., Anderson, B., Osborne, S., Nava, S., Desboeufs, K., Chen, G., and Harrison, M. A. J.: Seasonal variations of the physical and optical characteristics of Saharan dust: Results from the Dust Outflow and Deposition to the Ocean (DODO) experiment, J. Geophys. Res., 113, D14S05, https://doi.org/10.1029/2007JD009606, 2008.
Middleton, N. J., Betzer, P. R., and Bull, P. A.: Long-range transport of “giant” aeolian quartz grains: linkage with discrete sedimentary sources and implications for protective particle transfer, Mar. Geol., 177, 411–417, https://doi.org/10.1016/S0025-3227(01)00171-2, 2001.
Morales-Baquero, R., Pulido-Villena, E., and Reche, I.: Atmospheric inputs of phosphorus and nitrogen to the southwest Mediterranean region: Biogeochemical responses of high mountain lakes, Limnol. Oceanogr., 51, 830–837, https://doi.org/10.4319/lo.2006.51.2.0830, 2006.
Moulin, C., Lambert, C. E., Dayan, U., Masson, V., Ramonet, M., Bousquet, P., Legrand, M., Balkanski, Y. J., Guelle, W., Marticorena, B., Bergametti, G., and Dulac, F.: Satellite climatology of African dust transport in the Mediterranean atmosphere, J. Geophys. Res., 103, 13137–13144, https://doi.org/10.1029/98JD00171, 1998.
Nabat, P., Solmon, F., Mallet, M., Kok, J. F., and Somot, S.: Dust emission size distribution impact on aerosol budget and radiative forcing over the Mediterranean region: a regional climate model approach, Atmos. Chem. Phys., 12, 10545–10567, https://doi.org/10.5194/acp-12-10545-2012, 2012.
Nabat, P., Somot, S., Mallet, M., Chiapello, I., Morcrette, J. J., Solmon, F., Szopa, S., Dulac, F., Collins, W., Ghan, S., Horowitz, L. W., Lamarque, J. F., Lee, Y. H., Naik, V., Nagashima, T., Shindell, D., and Skeie, R.: A 4-D climatology (1979–2009) of the monthly tropospheric aerosol optical depth distribution over the Mediterranean region from a comparative evaluation and blending of remote sensing and model products, Atmos. Meas. Tech., 6, 1287–1314, https://doi.org/10.5194/amt-6-1287-2013, 2013.
Nabat, P., Somot, S., Mallet, M., Michou, M., Sevault, F., Driouech, F., Meloni, D., di Sarra, A., Di Biagio, C., Formenti, P., Sicard, M., Léon, J.-F., and Bouin, M.-N.: Dust aerosol radiative effects during summer 2012 simulated with a coupled regional aerosol-atmosphere-ocean model over the Mediterranean, Atmos. Chem. Phys., 15, 3303–3326, https://doi.org/10.5194/acp-15-3303-2015, 2015a.
Nabat, P., Somot, S., Mallet, M., Sevault, F., Chiacchio, M., and Wild, M.: Direct and semi-direct aerosol radiative effect on the Mediterranean climate variability using a coupled regional climate system model, Clim. Dynam., 44, 1127–1155, https://doi.org/10.1007/s00382-014-2205-6, 2015b.
Nicoll, K. A., Harrison, R. G., and Ulanowski, Z.: Observations of Saharan dust layer electrification, Environ. Res. Lett., 6, 014001, https://doi.org/10.1088/1748-9326/6/1/014001, 2011.
Nihlén, T., Mattsson, J. O., Rapp, A., Gagaoudaki, C., Kornaros, G., and Papageorgiou, J.: Monitoring of Saharan dust fallout on Crete and its contribution to soil formation, Tellus B, 47, 365–374, https://doi.org/10.1034/j.1600-0889.47.issue3.7.x, 1995.
Omar, A. H., Winker, D. M., Kittaka, C., Vaughan, M. A., Liu, Z., Hu, Y., Trepte, C. R., Rogers, R. R., Ferrare, R. A., Lee, K.-P., Khuen, R. E., and Hostetler, C. A.: The CALIPSO automated aerosol classification and lidar ratio selection algorithm, J. Atmos. Ocean. Tech., 26, 1994–2014, https://doi.org/10.1175/2009JTECHA1231.1, 2009.
Pey, J., Querol, X., Alastuey, A., Forastiere, F., and Stafoggia, M.: African dust outbreaks over the Mediterranean Basin during 2001–2011: PM10 concentrations, phenomenology and trends, and its relation with synoptic and mesoscale meteorology, Atmos. Chem. Phys., 13, 1395–1410, https://doi.org/10.5194/acp-13-1395-2013, 2013.
Prodi, F. and Fea, G.: A case of transport and deposition of Saharan dust over the Italian Peninsula and southern Europe, J. Geophys. Res., 84, 6951–6960, https://doi.org/10.1029/JC084iC11p06951, 1979.
Prospero, J. M. and Carlson, T. N.: Saharan dust outbreaks over the tropical North Atlantic, Pure Appl. Geophys., 119, 677–691, https://doi.org/10.1007/BF00878167, 1981.
Prospero, J. M., Bonatti, E., Schubert, C., and Carlson, T. N.: Dust in the Caribbean atmosphere traced to an African dust storm, Earth Planet. Sc. Lett., 9, 287–293, https://doi.org/10.1016/0012-821X(70)90039-7, 1970.
Pye, K.: Aeolian dust transport and deposition over Crete and adjacent parts of the Mediterranean Sea, Earth Surf. Proc. Land., 17, 271–288, https://doi.org/10.1002/esp.3290170306, 1992.
Querol, X., Pey, J., Pandolfi, M., Alastuey, A., Cusack, M., Pérez, N., Moreno, T., Viana, M., Mihalopoulos, N., Kallos, G., and Kleanthous, S.: African dust contributions to mean ambient PM10 mass-levels across the Mediterranean Basin, Atmos. Environ., 43, 4266–4277, https://doi.org/10.1016/j.atmosenv.2009.06.013, 2009.
Rea, G., Turquety, S., Menut, L., Briant, R., Mailler, S., and Siour, G.: Source contributions to 2012 summertime aerosols in the Euro-Mediterranean region, Atmos. Chem. Phys., 15, 8013–8036, https://doi.org/10.5194/acp-15-8013-2015, 2015.
Reche, I., Ortega-Retuerta, E., Romera O., Pulido Villena, E., Morales Baquero, R., and Casamayor, E. O.: Effect of Saharan dust inputs on bacterial activity and community composition in Mediterranean lakes and reservoirs, Limnol. Oceanogr., 54, 869–879, https://doi.org/10.4319/lo.2009.54.3.0869, 2009.
Reid, J. S., Kinney, J. E., Westphal, D. L., Holben, B. N., Welton, E. J., Tsay, S.-C., Eleuterio, D. P., Campbell, J. R., Christopher, S. A., Colarco, P. R., Jonsson, H. H., Livingston, J. M., Maring, H. B., Meier, M. L., Pilewski, P., Prospero, J. M., Reid, E. A., Remer, L. A., Russel, P. B., Savoie, D. L., Smirnov, A., and Tanré, D.: Analysis of measurements of Saharan dust by airborne and ground-based remote sensing methods during the Puerto Rico Dust Experiment (PRIDE), J. Geophys. Res., 108, 8586, https://doi.org/10.1029/2002JD002493, 2003a.
Reid, J. S., Jonsson, H. H., Maring, H. B., Smirnov, A., Savoie, D. L., Cliff, S. S., Reid, E. A., Livingston, J. M., Meier, M. M., Dubovik, O., and Tsay, S.-C.: Comparison of size and morphological measurements of coarse mode dust particles from Africa, J. Geophys. Res., 108, 8593, https://doi.org/10.1029/2002JD002485, 2003b.
Reiff, J., Forbes, G. S., Spieksma, F. Th. M., and Reynders, J. J.: African dust reaching northwestern Europe: A case study to verify trajectory Calculations, J. Clim. Appl. Meteor., 25, 1543–1567, https://doi.org/10.1175/1520-0450(1986)025<1543:ADRNEA>2.0.CO;2, 1986.
Renard, J.-B.: LOAC – LPC2E – SOP1 – Menorca, Ile du levant, SEDOO OMP, https://doi.org/10.6096/mistrals-charmex.1017, 2013.
Renard, J.-B., Francis, M., Hadamcik, E., Daugeron, D., Couté, B., Gaubicher, B., and Jeannot, M.: Scattering properties of sand. 2. Results for sands from different origins, Appl. Optics, 49, 3552–3559, https://doi.org/10.1364/AO.49.003552, 2010.
Renard, J.-B., Dulac, F., Berthet, G., Lurton, T., Vignelles, D., Jégou, F., Tonnelier, T., Jeannot, M., Couté, B., Akiki, R., Verdier, N., Mallet, M., Gensdarmes, F., Charpentier, P., Mesmin, S., Duverger, V., Dupont, J.-C., Elias, T., Crenn, V., Sciare, J., Zieger, P., Salter, M., Roberts, T., Giacomoni, J., Gobbi, M., Hamonou, E., Olafsson, H., Dagsson-Waldhauserova, P., Camy-Peyret, C., Mazel, C., Décamps, T., Piringer, M., Surcin, J., and Daugeron, D.: LOAC: a small aerosol optical counter/sizer for ground-based and balloon measurements of the size distribution and nature of atmospheric particles – Part 1: Principle of measurements and instrument evaluation, Atmos. Meas. Tech., 9, 1721–1742, https://doi.org/10.5194/amt-9-1721-2016, 2016a.
Renard, J.-B., Dulac, F., Berthet, G., Lurton, T., Vignelles, D., Jégou, F., Tonnelier, T., Jeannot, M., Couté, B., Akiki, R., Verdier, N., Mallet, M., Gensdarmes, F., Charpentier, P., Mesmin, S., Duverger, V., Dupont, J.-C., Elias, T., Crenn, V., Sciare, J., Zieger, P., Salter, M., Roberts, T., Giacomoni, J., Gobbi, M., Hamonou, E., Olafsson, H., Dagsson-Waldhauserova, P., Camy-Peyret, C., Mazel, C., Décamps, T., Piringer, M., Surcin, J., and Daugeron, D.: LOAC: a small aerosol optical counter/sizer for ground-based and balloon measurements of the size distribution and nature of atmospheric particles – Part 2: First results from balloon and unmanned aerial vehicle flights, Atmos. Meas. Tech., 9, 3673–3686, https://doi.org/10.5194/amt-9-3673-2016, 2016b.
Ryder, C. L., Highwood, E. J., Lai, T. M., Sodemann, H., and Marsham, J. H.: Impact of atmospheric transport on the evolution of microphysical and optical properties of Saharan dust, Geophys. Res. Lett., 40, 2433–2438, https://doi.org/10.1002/grl.50482, 2013.
Schmid, B., Livingston, J. M., Russell, P. B., Durkee, P. A., Jonsson, H. H., Collins, D. R., Flagan, R. C., Seinfeld, J. H., Gassó, S., Hegg, D. A., Öström, E., Noone, K. J., Welton, E. J., Voss, K. J., Gordon, H. R., Formenti, P., and Andreae, M. O.: Clear-sky closure studies of lower tropospheric aerosol and water vapor during ACE-2 using airborne sunphotometer, airborne in-situ, space-borne, and ground-based measurements, Tellus B, 52, 568–593, https://doi.org/10.1034/j.1600-0889.2000.00009.x, 2000.
Schütz, L., Jaenicke, R., and Pietrek, H.: Saharan dust transport over the North Atlantic Ocean, Geol. Soc. Am. Spec. Pap., 186, 87–100, https://doi.org/10.1130/SPE186-p87, 1981.
Slinn, W. G. N.: Air to sea transfer of particles, in: Air-sea exchange of gases and parficles, edited by: Liss, P. S. and Slinn, W. G. N., N.A.T.O. AS1 Series, Reidel, Dordrecht, the Netherlands, 299–396, 1983.
Sow, M., Crase, E., Rajot, J. L., Sankaran, R. M., and Lacks, D. J.: Electrification of particles in dust storms: Field measurmeents during the monsoon period in Niger, Atmos. Res., 102, 343–350, https://doi.org/10.1016/j.atmosres.2011.08.010, 2011.
Stohl, A., Eckhardt, S., Forster, C., James, P., Spichtinger, N., and Seibert, P.: A replacement for simple back trajectory calculations in the interpretation of atmospheric trace substance measurements, Atmos. Environ., 36, 4635–4648, https://doi.org/10.1016/S1352-2310(02)00416-8, 2002.
Stokes, G. G.: On the effect of the internal friction of fluids on the motion of pendulums, Trans. Cambridge Philos. Soc., 9, 51–52, 1851.
Swap, R., Garstang, M., Greco, S., Talbot, R., and Kållberg, P.: Saharan dust in the Amazon Basin, Tellus B, 44, 133–149, https://doi.org/10.1034/j.1600-0889.1992.t01-1-00005.x, 1992.
Thieuleux, F., Moulin, C., Bréon, F. M., Maignan, F., Poitou, J., and Tanré, D.: Remote sensing of aerosols over the oceans using MSG/SEVIRI imagery, Ann. Geophys., 23, 3561–3568, https://doi.org/10.5194/angeo-23-3561-2005, 2005.
Ulanowski, Z., Bailey, J., Lucas, P. W., Hough, J. H., and Hirst, E.: Alignment of atmospheric mineral dust due to electric field, Atmos. Chem. Phys., 7, 6161–6173, https://doi.org/10.5194/acp-7-6161-2007, 2007.
Vincent, J., Laurent, B., Losno, R., Bon Nguyen, E., Roullet, P., Sauvage, S., Chevaillier, S., Coddeville, P., Ouboulmane, N., di Sarra, A. G., Tovar-S anchez, A., Sferlazzo, D., Massanet, A., Triquet, S., Morales Baquero, R., Fornier, M., Coursier, C., Desboeufs, K., Dulac, F., and Bergametti, G.: Variability of mineral dust deposition in the western Mediterranean basin and south-east of France, Atmos. Chem. Phys., 16, 8749–8766, https://doi.org/10.5194/acp-16-8749-2016, 2016.
Weinzierl, B., Petzold, A., Esselborn, M., Wirth, M., Rasp, K., Kandler, K., Schütz, L., Koepke, P., and Fiebig, M.: Airborne measurements of dust layer properties, particle size distribution and mixing state of Saharan dust during SAMUM 2006, Tellus B, 61, 96–117, 2009.
Weinzierl, B., Sauer, D., Esselborn, M., Petzold, A., Veira, A., Rose, M., Mund, S., Wirth, M., Ansmann, A., Tesche, M., Gross, S., and Freudenthaler, V.: Microphysical and optical properties of dust and tropical biomass burning aerosol layers in the Cape Verde region – an overview of the airborne in situ and lidar measurements during SAMUM-2, Tellus B, 63, 589–618, https://doi.org/10.1111/j.1600-0889.2011.00566.x, 2011.
Weiss-Wrana, K.: Optical properties of interplanetary dust – Comparison with light scattering by larger meteoritic and terrestrial grains, Astron. Astrophys., 126, 240–250, 1983.
Winker, D. M., Vaughan, M. A., Omar, A., Hu, Y., Powell, K. A., Liu, Z., Hunt, W. H., and Young. S. A.: Overview of the CALIPSO mission and CALIOP data processing algorithms, J. Atmos. Ocean. Tech., 26, 2310–2323, https://doi.org/10.1175/2009JTECHA1281.1, 2009.
Zannoni, N., Gros, V., Sarda Esteve, R., Kalogridis, C., Michoud, V., Dusanter, S., Sauvage, S., Locoge, N., Colomb, A., and Bonsang, B.: Summertime OH reactivity from a receptor coastal site in the Mediterranean Basin, Atmos. Chem. Phys., 17, 12645–12658, https://doi.org/10.5194/acp-17-12645-2017, 2017.
Zender, C. S., Bian, H., and Newman, D.: Mineral Dust Entrainment and Deposition (DEAD) model: Description and 1990s dust climatology, J. Geophys. Res., 108, 4416, https://doi.org/10.1029/2002JD002775, 2003.
- Abstract
- Introduction
- Experimental strategy
- Vertical profiles and particle size distributions of the observed dust plumes
- Temporal evolution of the dust aerosol concentration and particle size distribution at constant altitudes
- Discussion related to dust sedimentation
- Indirect detection of possible charged particles
- Conclusions
- Data availability
- Competing interests
- Special issue statement
- Acknowledgements
- References
The requested paper has a corresponding corrigendum published. Please read the corrigendum first before downloading the article.
- Article
(29908 KB) - Full-text XML
- Abstract
- Introduction
- Experimental strategy
- Vertical profiles and particle size distributions of the observed dust plumes
- Temporal evolution of the dust aerosol concentration and particle size distribution at constant altitudes
- Discussion related to dust sedimentation
- Indirect detection of possible charged particles
- Conclusions
- Data availability
- Competing interests
- Special issue statement
- Acknowledgements
- References


