the Creative Commons Attribution 3.0 License.
the Creative Commons Attribution 3.0 License.
Environmentally dependent dust chemistry of a super Asian dust storm in March 2010: observation and simulation
Qiongzhen Wang
Xinyi Dong
Joshua S. Fu
Congrui Deng
Yilun Jiang
Qingyan Fu
Yanfen Lin
Kan Huang
Guoshun Zhuang
Near-surface and vertical in situ measurements of atmospheric particles were conducted in Shanghai during 19–23 March 2010 to explore the transport and chemical evolution of dust particles in a super dust storm. An air quality model with optimized physical dust emission scheme and newly implemented dust chemistry was utilized to study the impact of dust chemistry on regional air quality. Two discontinuous dust periods were observed with one traveling over northern China (DS1) and the other passing over the coastal regions of eastern China (DS2). Stronger mixing extents between dust and anthropogenic emissions were found in DS2, reflected by the higher SO2 ∕ PM10 and NO2 ∕ PM10 ratios as well as typical pollution elemental species such as As, Cd, Pb, and Zn. As a result, the concentrations of SO and NO and the ratio of Ca2+ ∕ Ca were more elevated in DS2 than in DS1 but opposite for the [NH] ∕ [SONO] ratio, suggesting the heterogeneous reactions between calcites and acid gases were significantly promoted in DS2 due to the higher level of relative humidity and gaseous pollution precursors. Lidar observation showed a columnar effect on the vertical structure of particle optical properties in DS1 that dust dominantly accounted for ∼ 80–90 % of the total particle extinction from near the ground to ∼ 700 m. In contrast, the dust plumes in DS2 were restrained within lower altitudes while the extinction from spherical particles exhibited a maximum at a high altitude of ∼ 800 m. The model simulation reproduced relatively consistent results with observations that strong impacts of dust heterogeneous reactions on secondary aerosol formation occurred in areas where the anthropogenic emissions were intensive. Compared to the sulfate simulation, the nitrate formation on dust is suggested to be improved in the future modeling efforts.
- Article
(6867 KB) - Full-text XML
-
Supplement
(222 KB) - BibTeX
- EndNote


Asian dust originating from the arid and semiarid areas in Mongolia and China can be transported for long distances, reaching Beijing (Sun et al., 2010), Shanghai (Fu et al., 2010), Xiamen (Zhao et al., 2011), Taiwan (Tsai et al., 2012, 2014), and even as far as North America (Uno et al., 2009; Wu et al., 2015), exerting significant impacts on the air quality of both densely populated habitations and remote regions. Huang et al. (2014) showed that Asian dust could be transported from the Qilian Shan or from the Tsaidam Basin through Qinghai and Gansu provinces to reach the Pacific Ocean, and that dust originating from the Taklimakan Desert could travel across the Hexi Corridor and Loess Plateau to reach southeastern China. Zhao et al. (2006) demonstrated that the deserts in Mongolia and in western and northern China were the major sources of Asian dust particles in East Asia and estimated that 26 % of the dust particles emitted from Asian dust sources were transported to the Pacific Ocean. Eguchi et al. (2009) reported that the dust plume from the Gobi Desert in East Asia was transported at low altitudes of 4–6 km to North America and mixed with Asian anthropogenic air pollutants during its transport. Fu et al. (2014) simulated that during a dust event from 1 to 6 May 2011, the transported dust particles accounted for 78.9 % of the surface layer PM10 over the Yangtze River Delta.
Dust particles can significantly influence the regional and global climate directly by absorbing and scattering solar radiation (Bi et al., 2016) and also indirectly by influencing the formation of ice nuclei, cloud, and precipitation (Creamean et al., 2013; Li and Min, 2010; Wang et al., 2010). In addition, deposition of transported dust particles into the ocean can enhance phytoplankton blooms due to the existence of bioavailable iron (Wang et al., 2012; Zhuang et al., 1992), which indirectly impacts global climate change. The effects of dust particles on climate change depend critically on their physical and chemical properties. Natural dust particles with limited contamination have low light absorption, with a single-scattering albedo of 0.91–0.97 at 500 and 550 nm (Bi et al., 2014; Uchiyama et al., 2005). During the long-range transport, dust particles are often modified by their mixing with anthropogenic emissions over the downwind areas (Fischer et al., 2011; Formenti et al., 2011; Huang et al., 2010b; Tobo et al., 2010), resulting in high uncertainties in evaluating the climatic effects of dust particles. It was estimated that mineral dust had a radiative forcing of −0.1 ± 0.2 W m−2 (IPCC, 2013), of which the uncertainty was as high as 200 %. Obviously, the characteristics of dust particles and their evolution during the transport are not well understood.
In March 2010, a super dust storm swept China, invading extensive areas from northern China to southern China including Fujian and Guangdong provinces and lasting for ∼ 4 days from 19 to 23 March (Li et al., 2011). The dust plumes further extended to the South China Sea (Wang et al., 2011), Taiwan (Tsai et al., 2013), South Korea (Tatarov et al., 2012), Japan (Zaizen et al., 2014), and even to North America (Wu et al., 2015). This dust storm was as strong as the one in 20–21 March 2002 and attracted considerable attention. Chen et al. (2017) used WRF-Chem to simulate the emission and transport of dust particles over the Taklimakan Desert and Gobi Desert. The results indicated that the Gobi Desert dust particles were easily lifted to 4 km and subject to the long-range transport, which contributed much more to the dust plumes over East Asia than the Taklimakan Desert dust. Lidar observations revealed that this super dust storm was transported within a low altitude (Tatarov et al., 2012; Wang et al., 2011), which could benefit the mixing and interaction between dust particles and anthropogenic pollutants. Indeed, modifications of dust particles during the transport of this dust storm were suggested based on in situ measurements. Zhao et al. (2011) displayed substantial increases in particulate sulfate and nitrate when the dust plumes arrived at Xiamen City of Fujian Province, implying the mixing and interaction between dust particles and anthropogenic pollutants. Wang et al. (2011) indicated that the dust particles detected at the Pratas Islands over the South China Sea were mixed with anthropogenic and marine particles. Observations of this dust storm at Tsukuba and Mt. Haruna, Japan, showed that most of the transported dust particles in lower altitudes were internally mixed with sulfate or sea salt (Zaizen et al., 2014).
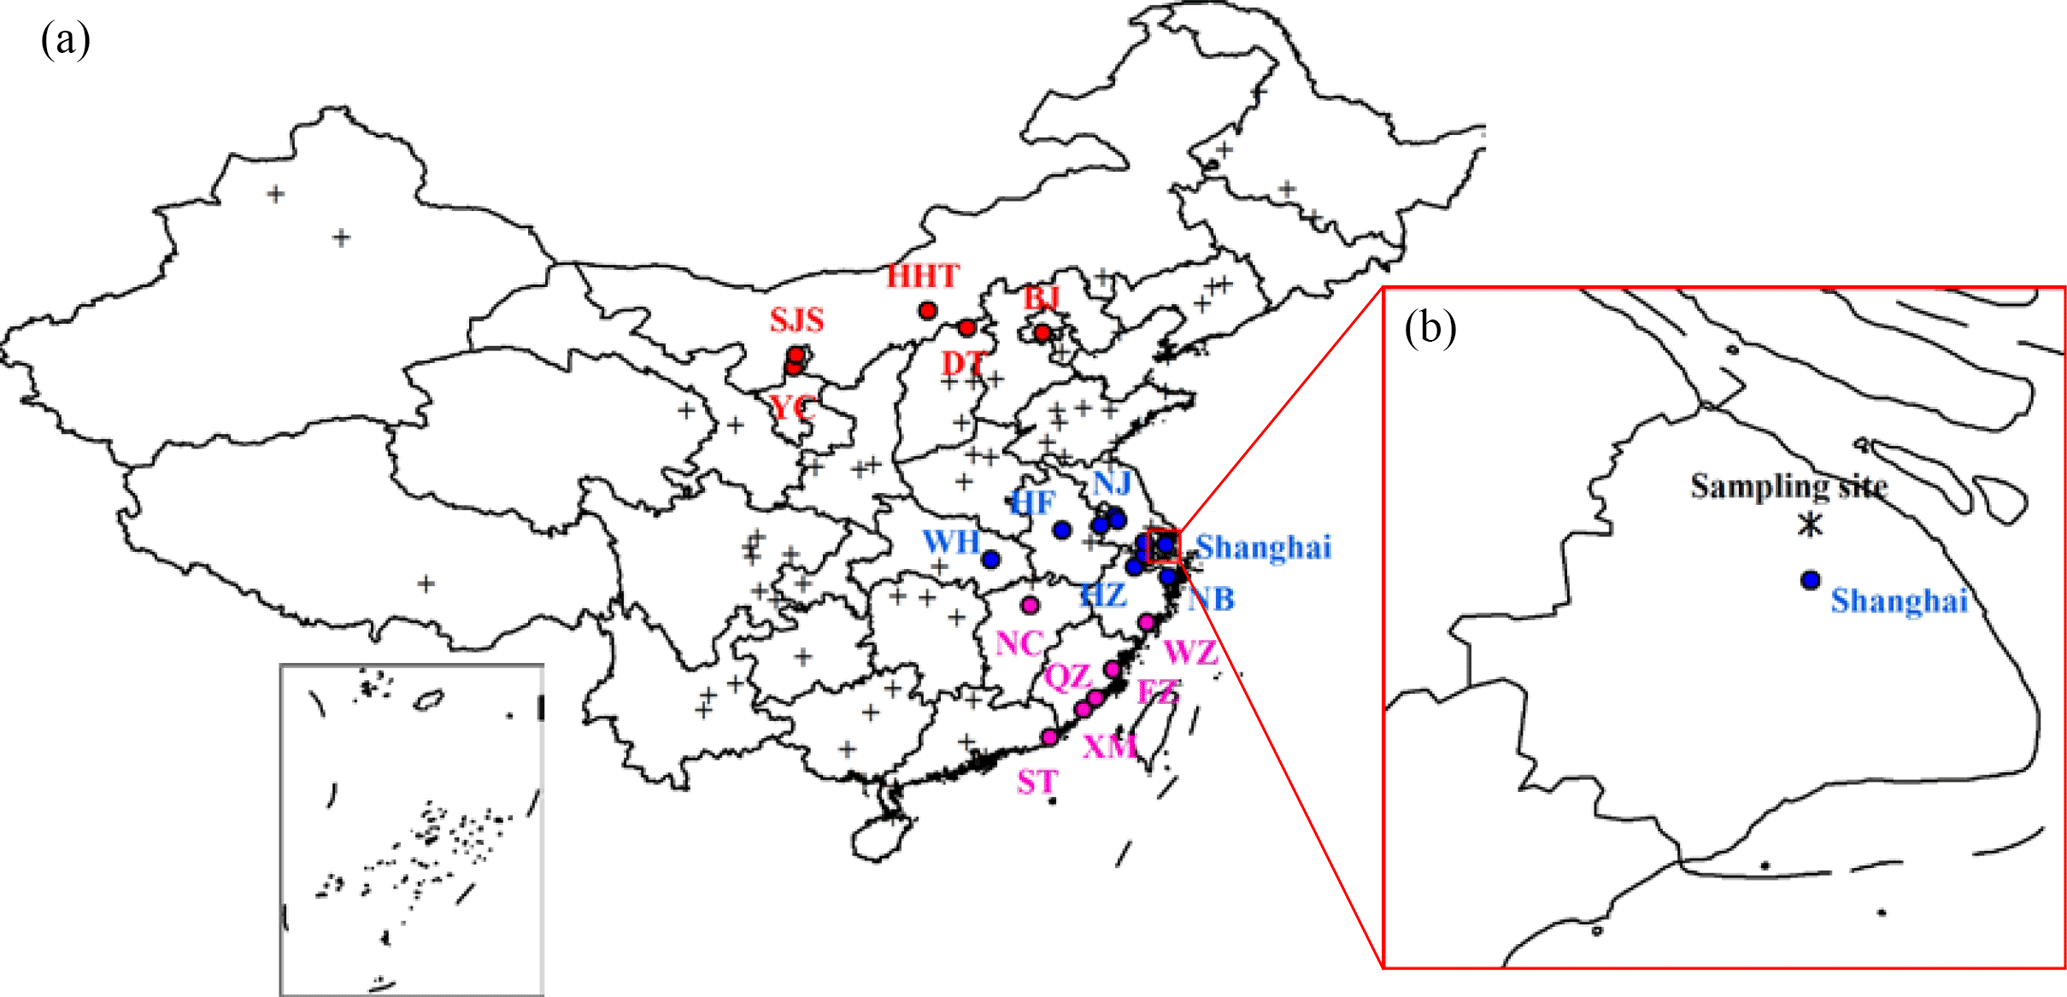
Figure 1(a) Locations of the 86 major cities in China. The cities with PM10 concentrations up to 600 µg m−3 on 20, 21, and 22 March are marked by red, blue, and pink circles, respectively. (b) The site location of the ground-based measurement in Shanghai.
Most of the studies on this super dust storm focused on investigating the dust particles reaching southeastern China and the South China Sea and relied on a single method, e.g., aerosol chemistry measurement, optical property inversion, or model simulation. In this study, we investigated this super dust storm in Shanghai, a coastal city in eastern China. A synergy of measurement techniques was applied, including in situ measurements of pollutant gaseous precursors, particle with its major chemical components, and lidar observation of particle optical properties. To corroborate the observational evidence, a regional numerical model was used to simulate the impact of dust chemistry on the perturbation of regional air quality. What interested us is that there were two discontinuous dust periods observed in Shanghai with distinctly different transport pathways, providing a great opportunity to study the chemical evolution of transported dust particles under different environmental conditions.
2.1 Field measurement
2.1.1 Lidar observation
A dual-wavelength depolarization lidar (model L2S-SMII) developed by the National Institute for Environmental Studies (NIES) of Japan was installed on the roof (∼ 20 m above ground level) of a teaching building on the campus of Fudan University in the Yangpu District of Shanghai (Fig. 1b). The lidar measurement was performed every 15 min (at 00, 15, 30, and 45 min every hour) with a height resolution of 6 m. Attenuated backscattering coefficient (β), volume depolarization ratio (δv), particle depolarization ratio (δp), and particle extinction coefficient (σ) at the wavelength of 532 nm were obtained by the measurement. More details about the lidar system have been described in Huang et al. (2012). δv is calculated using the parallel (Ip) and perpendicular (Is) components of backscatter intensity, and Ip and Is were calibrated before the calculation. Briefly, a sheet polarizer with the polarizing direction set at 45∘ (then −45∘) to the polarizing plane of the emitted light was installed in front of the beam splitter cube, and two sets of backscatter signal profiles from the sky were obtained for the calibration. The detailed calibration procedure has been described in Shimizu et al. (2004, 2017). σ was derived using the Fernald inversion method (Fernald, 1984) with the lidar ratio (extinction-to-backscatter ratio) set as 50 sr (Liu et al., 2002) in the inversion process. The total particle extinction coefficient can be split into nonspherical particle (dust particle, σd) and spherical particle (mostly pollution particle, σs) fractions based on the value of δp. The splitting method was described in detail by Sugimoto et al. (2002) and Shimizu et al. (2004).
To solve the problem that overlap of the laser beam and the view field of telescope is insufficient for near-surface observation, a compensation function Y(z) was applied. Function Y(z) was derived from the signal profiles that were observed on a day when the planetary boundary layer was well developed. With the compensation, the optical properties of the particles above 120 m altitude were provided. Detailed correction procedure has been described in Shimizu et al. (2017).
2.1.2 Online particle and gas monitoring
Continuous PM10 concentrations were measured with a TEOM (tapered element oscillating microbalance) 1405D monitor (Thermo Scientific, USA). Trace gases SO2 and NO2 were measured with a 43i SO2 analyzer (Thermo Scientific, USA) and a 42i NO-NO2-NOx analyzer (Thermo Scientific, USA), respectively. All the measured PM10 and gas concentrations were averaged and used at intervals of 1 h in this study.
2.1.3 Aerosol sampling
TSP (total suspended particle) samples were collected during 19–27 March 2010 at the Fudan observational site co-located with all the other instruments. The aerosol samples were collected for 12 h (normally from 08:00 to 20:00 LST, local standard time, in daytime and from 20:00 to 08:00 LST of the next day at nighttime) or 24 h (normally from 08:00 to 08:00 LST of the next day) on Whatman 41 filters (Whatman Inc., Maidstone, UK) by a medium-volume sampler (Beijing Geological Instrument-Dickel Co., Ltd.; model TSP ∕ PM10 ∕ PM2.5−2; flow rate: 77.59 L min−1). All the samples were put in polyethylene plastic bags immediately after sampling and then reserved in a refrigerator. The filters were weighed before and after sampling using an analytical balance (model Sartorius 2004MP; reading precision of 10 µg) after stabilizing in constant temperature (20 ± 1 ∘C) and humidity (40 ± 2 %) for 48 h. All the procedures were strictly quality controlled to avoid the possible contamination of the samples.
2.2 Chemical analysis
2.2.1 Ion analysis
One-fourth of each aerosol sample and blank filters were extracted ultrasonically using 10 mL deionized water (18 MΩ cm−1). Inorganic ions of SO, NO, Cl−, Na+, NH, K+, Mg2+, and Ca2+ were analyzed using ion chromatography (Dionex ICS 3000, USA) with a separation column of Dionex IonPac AS 11, a guard column of Dionex IonPac AG 11, a self-regenerating suppressed conductivity detector of Dionex IonPac ED50, and a gradient pump of Dionex IonPac GP50. The detailed analytical procedures can be found in Yuan et al. (2003).
2.2.2 Element analysis
Half of each aerosol sample and blank filters were digested at 170 ∘C for 4 h in a high-pressure Teflon digestion vessel with 3 mL of concentrated HNO3, 1 mL of concentrated HClO4, and 1 mL of concentrated HF. The solutions were dried and then diluted to 10 mL with deionized water (18 MΩ cm−1). Using inductively coupled plasma optical emission spectroscopy (SPECTRO, Germany), 15 elements (Al, As, Ca, Cd, Cu, Fe, Mg, Mn, Na, Ni, Pb, Sr, Ti, V, and Zn) were measured. The detailed analytical procedures were described in Sun et al. (2004) and Zhuang et al. (2001).
2.3 Nationwide daily PM10 data
Air pollution index (API) data for 86 major cities (locations shown in Fig. 1a) in China were obtained from the data center of Ministry of Environmental Protection of China (http://datacenter.mep.gov.cn/). In China, six grades of air pollution of excellent, good, slightly polluted, lightly polluted, moderately polluted, and heavily polluted were set corresponding to the API scales of 0–50, 51–100, 101–150, 151–200, 201–300, and > 300, respectively. All API values of 50, 100, 200, 300, 400, and 500 and their corresponding concentrations of air pollutants were defined in the API grading limited-value table as shown in Table S1 in the Supplement. According to the definition of API in China, the API value of air pollutants was calculated as
where Cx and Ix are the concentration and the API value of air pollutant X in Table S1, respectively. Ix,high and Ix,low stand for the two values in the API grading limited-value table (Table S1) that mostly approach to value Ix, respectively. Cx,high and Cx,low represent the concentration of X corresponding to Ix,high and Ix,low, respectively. And the daily API value is defined as
According to API data records from 20 to 23 March 2010, PM10 was the premier air pollutant in most of the 86 cities in China, i.e., API = . Thus, the API value can be converted to PM10 concentration as
It should be noted that API was recorded with a maximum value of 500, which corresponded to the PM10 concentration of 600 µg m−3.
2.4 Backward trajectory analysis
The 48 h back trajectories of the air masses at both 250 and 1000 m a.g.l. (above ground level) during dust days starting at Shanghai were computed by the HYSPLIT model (http://ready.arl.noaa.gov/hypub-bin/trajtype.pl?runtype=archive), using the meteorological data of GDAS (1∘, global, 2006–present). Four trajectories ending at 00:00, 06:00, 12:00, and 18:00 LST were calculated for each day.
2.5 Model simulation
The WRF-CMAQ modeling system was applied to simulate the dust chemistry in this study. The Weather Research and Forecasting model (WRFv3.4) was used to produce the meteorology fields by digesting the reanalysis data from National Centers for Environmental Prediction (NCEP). The Community Multiscale Air Quality Modeling System (CMAQv5.0.1) was configured with the 2005 carbon bond gas-phase mechanism (CB05) and aerosol module AE6. The default CMAQ model does not include dust chemistry reactions but only the dust emission module. We have implemented dust chemistry in the CMAQ model and corrected the dust emission module in our earlier work (Dong et al., 2016), which was used to simulate the heterogeneous reactions on dust during the long-range transport in this study. Briefly, the major developments included the following: (1) the default dust emission module in CMAQ was found to strongly underestimate the dust emissions. By removing the double counting of soil moisture in the default dust emission module and conducting a reanalysis of field data, the threshold friction velocities over various land covers were readjusted. (2) The source-dependent speciation profiles of dust particles from the Taklimakan and Gobi deserts were implemented based on field measurement data. (3) There were 13 dust heterogeneous reactions implemented, including dust reactions with O3, OH, H2O2, CH3COOH, CH3OH, CH2O, HNO3, N2O5, NO2, NO3, HO2, and SO2. The uptake coefficients of gases onto the surface of dust particles were taken from previously published studies in deserts of China. More details of the technical development of this dust emission and chemistry module in CMAQ and the evaluation of model performance can be found in Dong et al. (2016).
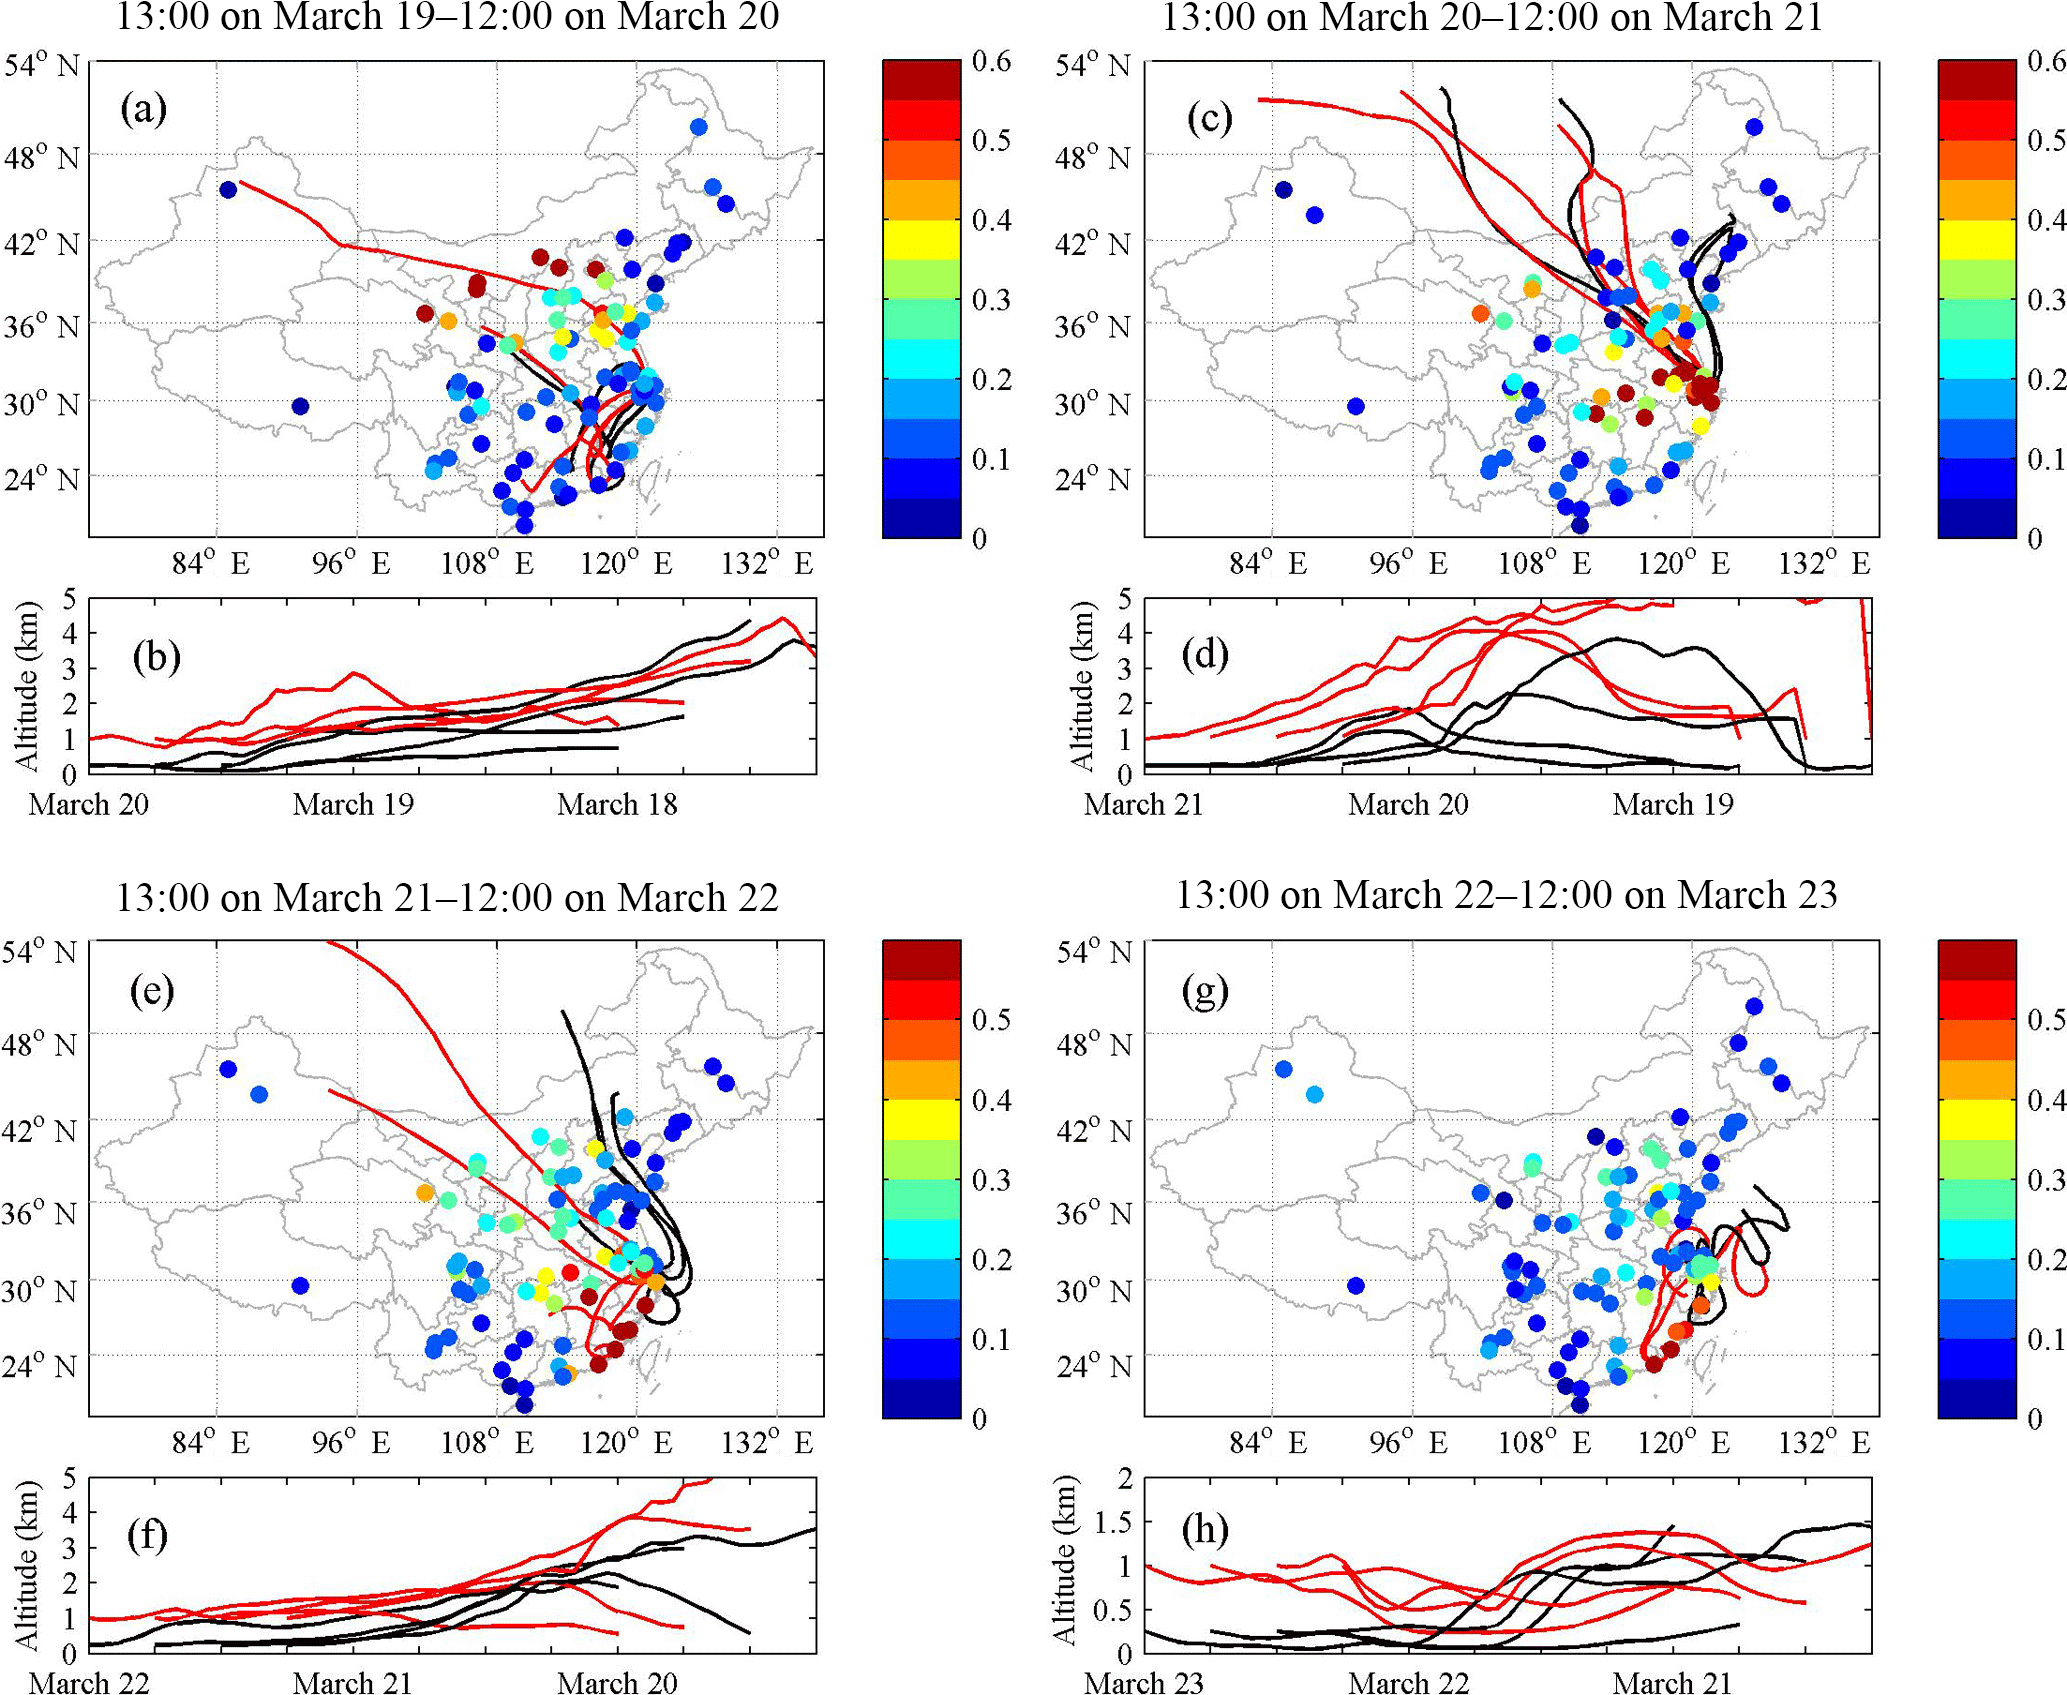
Figure 2Daily PM10 concentrations (mg m−3) in 86 major cities over China and 48 h backward trajectories of the air masses at both 250 m (black lines) and 1000 m (red lines) above ground level over Shanghai during 19–23 March 2010. Four trajectories ending at 00:00, 06:00, 12:00, and 18:00 LST are computed for each day.
The modeling domain includes all of China with a horizontal grid resolution of 36 km × 36 km and 34 vertical layers with a model top at 50 hPa. The chemical initial and boundary conditions for CMAQ were downscaled from the GEOS-Chem global model. Emissions inputs included anthropogenic emissions from Zhao et al. (2013) over China, biogenic emissions from MEGAN2.1 (Guenther et al., 2006), and biomass burning emissions from FLAMBE (Reid et al., 2009).
3.1 Spatiotemporal evolution of the 2010 spring dust storm over China
On 19 March 2010, a super dust storm broke out over the Gobi Desert of Inner Mongolia, China, and southern Mongolia. It was driven by a strong cold front and revealed by the OMI (Ozone Monitoring Instrument) aerosol index (AI) from space detection (Tatarov et al., 2012). Along with the cold front, the dust plumes moved southeastward, invading extensive areas from northern China to southern China. Figure 2 shows the daily PM10 concentrations over 86 cities of China from 19 to 23 March 2010, displaying the spatiotemporal evolution of this dust storm event. On 20 March, daily PM10 concentrations of higher than 200 µg m−3 were observed over widespread areas of northern China, close to the dust source regions. The PM10 concentrations of those heavily polluted cities, including Yinchuan (YC), Datong (DT), Hohhot (HHT), and Beijing (BJ) (red circles in Fig. 1a), reached the threshold of 600 µg m−3, the maximum value recorded by API (Fig. 2a). As the dust plumes were transported, high levels of PM10 started to emerge over central and eastern China on March 21, when heavy pollution with daily PM10 concentrations higher than 420 µg m−3 were observed over the Yangtze River Delta region as well as in Jiangxi, Hunan, and Hubei provinces. Specifically, the PM10 concentrations in Shanghai, Nanjing (NJ), Hefei (HF), Wuhan (WH), Hangzhou (HZ), and so on (blue circles in Fig. 1a) all reached the threshold of 600 µg m−3 (Fig. 2c). On 22 and 23 March, the dust plumes drifted towards Fujian and Guangdong provinces in southern China, where PM10 concentrations of over 600 µg m−3 were even observed in coastal cities such as Fuzhou (FZ), Xiamen (XM), and Shantou (ST) (pink circles in Fig. 1a). The severe air pollution over China caused by this super dust storm lasted for ∼ 4 days until 23 March, resulting in significant impacts on the regional air quality and possible perturbation on regional meteorology.
3.2 Identification of two dust plumes with distinct transport pathways
Figure 3a shows the time–height cross section of δv (volume depolarization ratio) measured at the wavelength of 532 nm from 19 to 23 March in Shanghai. δv is frequently used to identify dust events and a threshold value of 10 % is used to distinguish dust from other types of particles (Shimizu et al., 2004). As shown in Fig. 3a, there were evidently two discontinuous periods with δv higher than 10 %, consistent with the two peaks of PM10 concentrations measured near the ground (Fig. 4c). The first dust episode (DS1) lasted from ∼ 16:00 LST on 20 March to ∼ 10:00 LST on 21 March and the second dust episode (DS2) lasted from ∼ 06:00 LST on 22 March to ∼ 00:00 LST on 23 March.
The 48 h backward trajectories of the air masses during 20–23 March in Shanghai are shown in Fig. 2. It is interesting to note that the transport pathways of the dust plumes in DS1 and DS2 were distinctly different. In DS1, the dust plumes at both low altitudes (i.e., 250 m denoted by the black lines in Fig. 2c–d) and high altitudes (i.e., 1000 m denoted by the red lines in Fig. 2c–d) were mostly transported from the dust source regions in the Gobi Desert. This is one of the typical inland transport pathways of Asian dust, which passed over northern China, that is characterized by intense anthropogenic emission rates, e.g., from Shanxi, Hebei, and Shandong provinces.

Figure 3Time–height cross section of (a) volume depolarization ratios and (b) attenuated aerosol backscattering coefficients measured with lidar at the wavelength of 532 nm during 19–22 March 2010 (local standard time).
In DS2, the air masses reaching Shanghai are shown in Fig. 2e–h. From the start of DS2 to midday of 22 March (Fig. 2e–f), the backward trajectories were still mainly from the north but we noticed that the low-altitude trajectories that originated from the Gobi Desert traveled over the Yellow Sea and East China Sea and then circled back to Shanghai. After midday of 22 March (Fig. 2g–h), the trajectories became much shorter and restricted within the coastal and offshore areas. The low-altitude trajectories were mainly from the ocean and the high-altitude trajectories shifted from the south. As indicated by the surface observation (Fig. 4a), the southeasterly winds prevailed until ∼ 18:00 LST on 22 March when PM10 climbed to reach its peak value in DS2, quite different from DS1 when the northerly winds dominated. The CALIPSO (Cloud-Aerosol Lidar and Infrared Pathfinder Satellite Observations) transect at around 13:00–13:30 LST on 21 March specified that the major aerosol type was dust over the East China Sea and South China Sea (Fig. S1). Therefore, it was evident that DS2 passed over the coastal regions of eastern China and the ocean and it should be a humid dust plume.
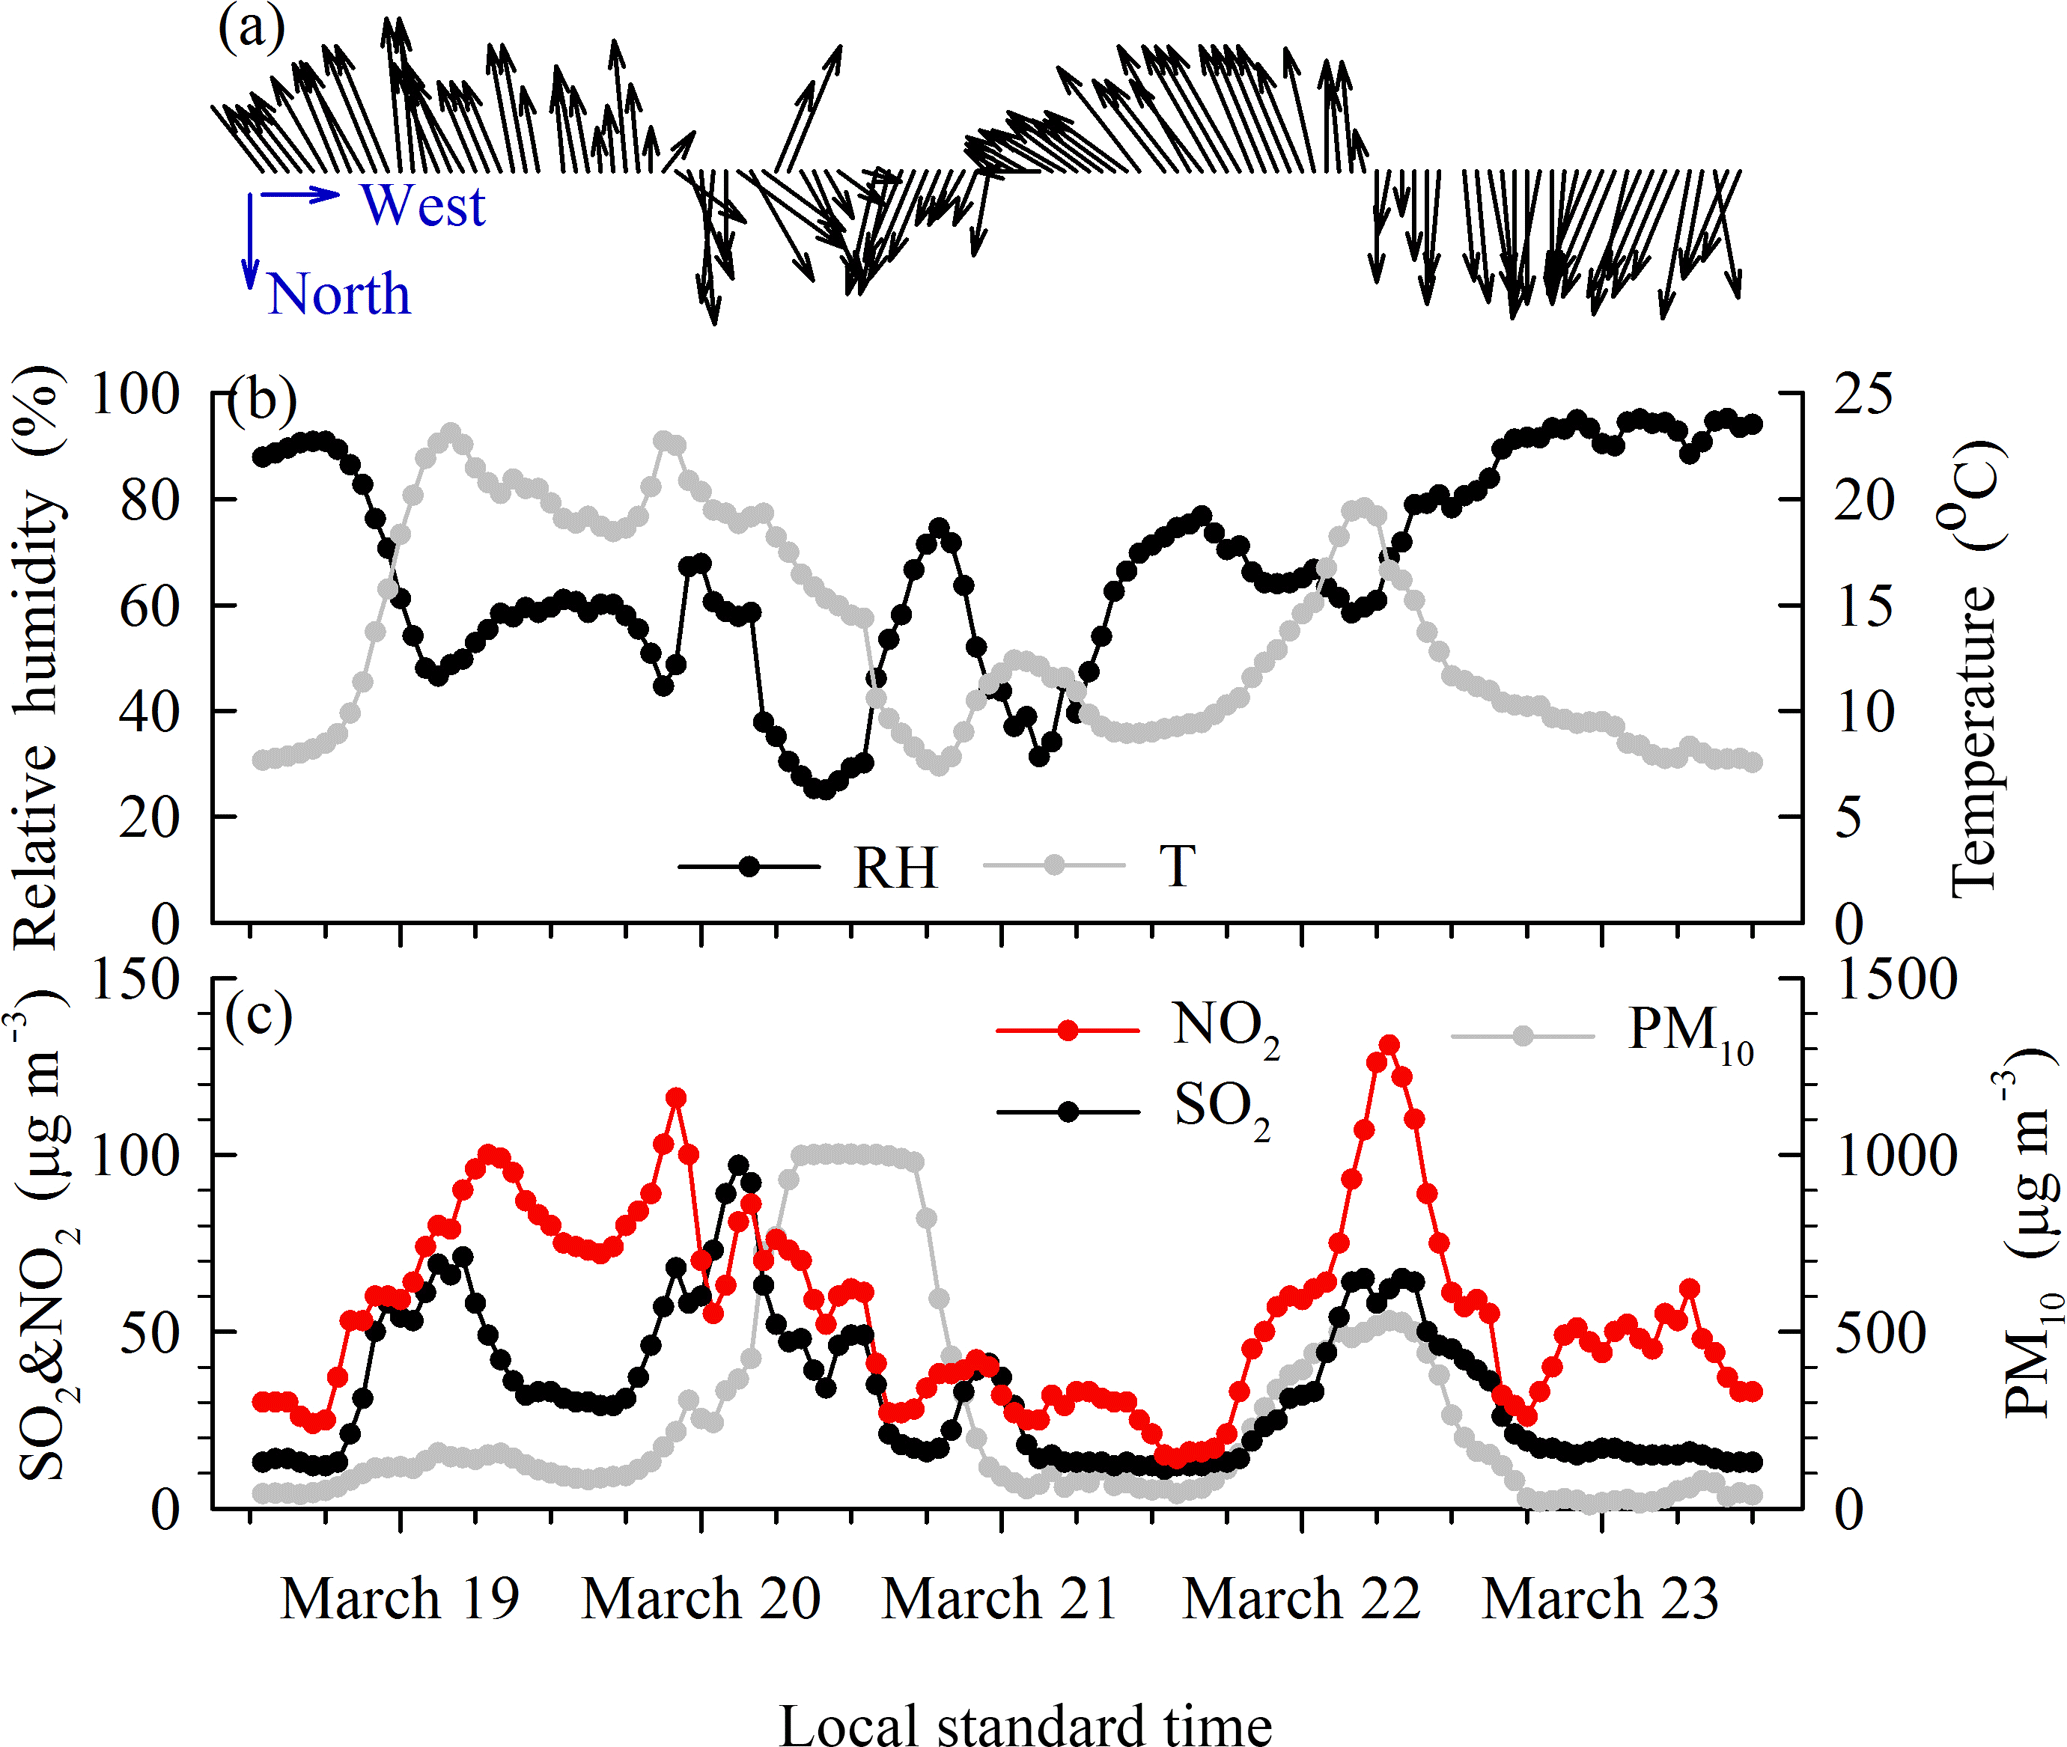
Figure 4Time series of PM10, SO2, NO2, and meteorological factors including wind conditions, relative humidity (RH), and ambient temperature (T) in Shanghai during 19–23 March 2010.
As visualized in Fig. 3, the two dust plumes were mostly transported at low altitudes below 1 km. It is expected that this type of transport would benefit for the mixing and interactions between dust particles and anthropogenic pollutants, as the anthropogenic emissions were mainly trapped within the boundary layer. Transport pathway is one of the most important factors accounting for the evolution of dust particles and the resulting environmental effects (Zaizen et al., 2014; Zhang et al., 2010). In this super dust storm, the two discontinuous dust plumes reaching Shanghai were distinctly different in their transport pathways, providing a great opportunity to study the chemical evolution of dust particles under different transport conditions.
3.3 Distinct behaviors of gaseous pollutants between two dust episodes
Figure 4 illustrates the different behaviors of the two identified dust episodes by plotting the temporal variations in emission precursors (i.e., SO2 and NO2) as well as PM10 and crucial meteorological parameters. As shown in Fig. 4a, the winds prevailed from the south before the onset of DS1 at ∼ 10:00 LST on 20 March. Starting from early morning of 19 March, SO2 and NO2 continuously climbed due to enhanced human activities. From 18:00 LST of 19 March to 06:00 LST of 20 March, the concentrations of NO2 and SO2 synchronously decreased. This was partly attributed to the prevailing southeast winds, i.e., sea breezes that had clean effects on the local pollution. Furthermore, the decrease in NO2 and SO2 occurred during night, when the anthropogenic emissions were relatively low during a day. During this period, SO2 and NO2 concentrations were relatively high with mean concentrations of 39 ± 19 and 70 ± 25 µg m−3, respectively. In the meantime, PM10 was at a moderate level of 112 ± 54 µg m−3, suggesting the dominance of anthropogenic emissions. It was observed that the peak hourly concentrations of SO2 and NO2 up to 97 and 116 µg m−3 occurred just a few hours before the sharp increase in PM10. This was due to the fact that air pollutants north of Shanghai were pushed by the cold front and accumulated before the dust plumes invaded (Guo et al., 2004), which was also evident from the time difference between the values of β and δv as shown in Fig. 3.
From 10:00 LST on 20 March to 11:00 LST on 21 March, the winds shifted from the north and northwest accompanied with a quick drop in relative humidity (RH) with a minimum of 25 % at 21:00 LST on 20 March, indicating the invasion of a strong cold front from northern China. Correspondingly, PM10 abruptly climbed from 16:00 LST and reached 1000 µg m−3 (a maximum value of 1000 µg m−3 was set in the TEOM 1405D monitor) within 4 h. This high level of PM10 lasted for ∼ 11 h till 04:00 LST on 21 March. During this dust episode, the concentrations of SO2 and NO2 decreased substantially and the lowest values of 17 and 27 µg m−3 (Fig. 4c) were recorded at 04:00 LST on 21 March due to the strong dilution effect of dust plumes. The ratios of SO2 ∕ PM10 and NO2 ∕ PM10 were as low as 0.04 ± 0.02 and 0.06 ± 0.03 in DS1 compared to 0.30 ± 0.05 and 0.57 ± 0.28 before DS1. After 12:00 LST on 21 March, the wind direction started to shift again from the southeast with an increase in RH. The PM10 concentrations quickly decreased below 200 µg m−3 within 5 h, indicating the pass of the first dust episode over Shanghai.
The second wave of dust (DS2) commenced after about half a day as indicated by the temporal variation in PM10 climbing quickly from 06:00 LST on 22 March. PM10 reached its peak of 530 µg m−3 observed at ∼ 18:00 LST on 22 March, much lower than the peak values during DS1. It should be noted that during the growth of DS2 (i.e., from 06:00 to 18:00 LST), southerly winds sustained until 18:00 LST on 22 March, opposite from DS1. As discussed above, DS2 had gone through the maritime environment during most of its transport trajectory. This can be corroborated by the moderately high RH (Fig. 4b). After 18:00 LST, 22 March, PM10 underwent a quick decline followed by the prevailing northeast winds and continuously elevated RH. This suggested the sea breezes after 18:00 LST were almost free of dust particles and acted as cleaner for the dust pollution that was previously accumulated. Compared to the mean RH of 46 % ± 18 % in DS1, RH in DS2 was much higher at 69 % ± 8 %. This was mainly attributed to the different transport pathways of the two dust episodes.
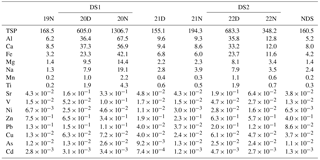
Table 1Concentrations of the measured elements (µg m−3) in TSP before, during, and after the dust periods from 19 to 22 March and on non-dust (NDS) days in Shanghai. N, D, and NDS represent the nighttime samples collected from 20:00 to 08:00 LST on the next day, the daytime samples collected from 08:00 to 20:00 LST, and the average of the non-dust samples collected from 25 to 27 March, respectively.
One interesting phenomenon that has been rarely observed was that the temporal variations in SO2 and NO2 varied fairly consistently with those in PM10 in DS2 (Fig. 4c), quite different from DS1 and previous studies (Fu et al., 2010; Guo et al., 2004) showing that dust usually had a clean effect on the local gaseous pollutants, causing an inverse relationship between SO2 ∕ NO2 and PM10. In this case, NO2 reached its maximum hourly concentration of 131 µg m−3 along with the maximum PM10 in DS2, the highest during the whole study period. This probably indicated that the dust particles in DS2 were externally mixed or “coated” with abundant gaseous pollutants. As a result, the SO2 ∕ PM10 and NO2 ∕ PM10 ratios reached 0.11 ± 0.03 and 0.20 ± 0.04 in DS2, respectively, much higher than those in DS1 and on a super dust day of 2 April 2007 in Shanghai (Fu et al., 2010), revealing that the dust plumes in DS2 were much more polluted.
In the following sections, we will investigate deeply into the chemical characteristics and evolution of the two dust episodes.
3.4 Chemical evolution of dust particles
3.4.1 Pollution elements significantly enhanced in dust periods
Table 1 lists the concentrations of measured elements in TSP before, during, and after the two dust episodes in Shanghai. D and N represent the samples that were collected in daytime (∼ 08:00 to ∼ 20:00 LST) and nighttime (∼ 20:00 to 08:00 LST in the next day), respectively. NDS represents the non-dust days from 25 to 27 March and the mean concentrations are shown in Table 1. To identify whether these elements were mainly derived from the crustal source or anthropogenic sources, enrichment factors of elements were calculated. Enrichment factor (EF) is defined as EF = , where (X∕XRef)particle is the mass ratio of a given element X to the reference element in particle, (X ∕ XRef)crust is the ratio in the crust (Lida, 2006), and Al is the reference element used in this study. Enrichment factors of Al, Cu, Ca, Fe, Mg, Na, Mn, Ti, Sr, Ni, and V were calculated to be lower than 5, indicating these 11 elements were mostly from the crustal source, while enrichment factors of As, Cd, Pb, and Zn were higher than 10 even during the dust periods (Fig. 5c), indicating these four elements were significantly influenced by anthropogenic sources. Hence, Al, Cu, Ca, Fe, Mg, Na, Mn, Ti, Sr, Ni, and V were classified as “crustal elements” while As, Cd, Pb, and Zn were classified as “pollution elements”. Due to the dilution effect of dust plumes, enrichment factors of the four pollution elements decreased from ∼ 100–150 in NDS to ∼ 10–50 in DS1 and ∼ 20–115 in DS2.
As shown in Table 1, the concentrations of the crustal elements before the dust event (19N) were as low as those on NDS days, but substantially increased in DS1 and DS2, about 3–13-fold and 1–7-fold of those on NDS days, respectively. The highest concentration of Al, widely used as a tracer for dust, reached 67.5 µg m−3 in DS1 (20N), comparable to the Al concentration on the super dust day of 2 April 2007 in Shanghai (Fu et al., 2010). The highest concentrations of crustal elements in DS1 (20N) were ∼ 2-fold of those in DS2 (22D), corroborating that the intensity of DS1 was stronger than in DS2.

Figure 5Variations in (a) the mass concentration ratio of each sample to the NDS sample for nc-As, nc-Cd, nc-Pb, and nc-Zn, (b) the mass ratios, and (c) enrichment factors of pollution elements As, Cd, Pb, and Zn in TSP during 19–22 March and non-dust (NDS) days. D, N, and NDS represent the daytime samples collected from 08:00 to 20:00 LST, the nighttime samples collected from 20:00 to 08:00 LST on the next day, and the average of the non-dust samples collected from 25 to 27 March, respectively.
As for the pollution elements, the non-crustal part (nc-) of As, Cd, Pb, and Zn were estimated as nc-X = X − Al × (X ∕ Al)crust. The concentrations of nc-As, nc-Cd, nc-Pb, and nc-Zn increased in both DS1 and DS2, about 1–4-fold of those on NDS days (Fig. 5a). As these elements were mainly derived from anthropogenic sources such as coal combustion, industrial processing, vehicle emissions, etc., their enhancement indicated that abundant pollutants had been transported to the downwind regions along with the dust plumes. The mean concentrations of nc-As, nc-Cd, nc-Pb, and nc-Zn were 23.5, 3.6, 154.2, and 580.1 ng m−3 in DS2, higher than those of 18.3, 3.1, 119.7, and 447.4 ng m−3 in DS1, indicating DS2 was more polluted. Consistently, the mass ratios of nc-As, nc-Cd, nc-Pb, and nc-Zn in TSP were 5.1 × 10⁻³, 7.2 × 10⁻⁴, 3.1 × 10⁻², and 1.2 × 10⁻¹ % in DS2, higher than those of 1.9 × 10⁻³, 3.7 × 10⁻⁴, 1.5 × 10⁻², and 6.2 × 10⁻² % in DS1 (Fig. 5b).
3.4.2 Crustal vs. secondary water-soluble ions
Figure 6 shows the evolution of major water-soluble ions in TSP during the whole dust event. The concentrations of Na+, K+, Mg2+, and Ca2+ increased the most among all the ions in both DS1 and DS2 due to their crustal origin, ∼ 2–5-fold and ∼ 2–3-fold of those in NDS. However, the mass ratios of these ions in TSP generally decreased in the dust periods (Fig. 6d), as the masses of dust particles were dominated by water-insoluble matters. Different from NDS, the concentrations of Ca2+ exceeded NH and ranked as the most abundant cation in the dust periods. This was because Asian dust particles are rich in calcium carbonate (Wang et al., 2005), which could react with acidic nitrogen and sulfur compounds to form Ca(NO3)2 and CaSO4. It has been found that Ca-rich particles in Asian dust transported to Japan were mostly spherical in shape (Zaizen et al., 2014), and many of the spherical Ca-rich particles contained sulfur and nitrogen compounds (Matsuki et al., 2006; Zaizen et al., 2014) due to the heterogeneous reactions. Recently, Pan et al. (2017) reported that the concentrations of both NO and Ca2+ increased in coarse-mode mineral dust in Beijing, particularly at high RH conditions due to the interaction between nitric acid and Ca-rich particles. It is further suggested that the impact of nitrate on modifying the morphology of dust particles has become increasingly important, as the NOx emissions in East Asia have been rapidly increasing. It is noted that the concentrations of Ca2+ in DS2 were comparable to those in DS1 (Fig. 6b), although the intensity of DS1 was much stronger than DS2. In addition, the mass ratios of Ca2+ in TSPs were even higher in DS2 than in DS1 (Fig. 6d). Collectively, these results indicated that more calcium in its soluble form was produced via the reactions between calcium carbonate and acids. This could also be revealed by the ratio of Ca2+ ∕ Ca that was higher in DS2 (0.2–0.5) than in DS1 (0.1–0.2) (Fig. 7a). In DS2, the dust plumes traveled over the ocean and carried a higher amount of water vapor as well as SO2 and NO2 than DS1 as discussed earlier. In this regard, the heterogeneous reaction between calcium carbonate and acidic gases was enhanced more in DS2, resulting in a higher fraction of calcium carbonate from dust particles that could be transformed to soluble calcium.
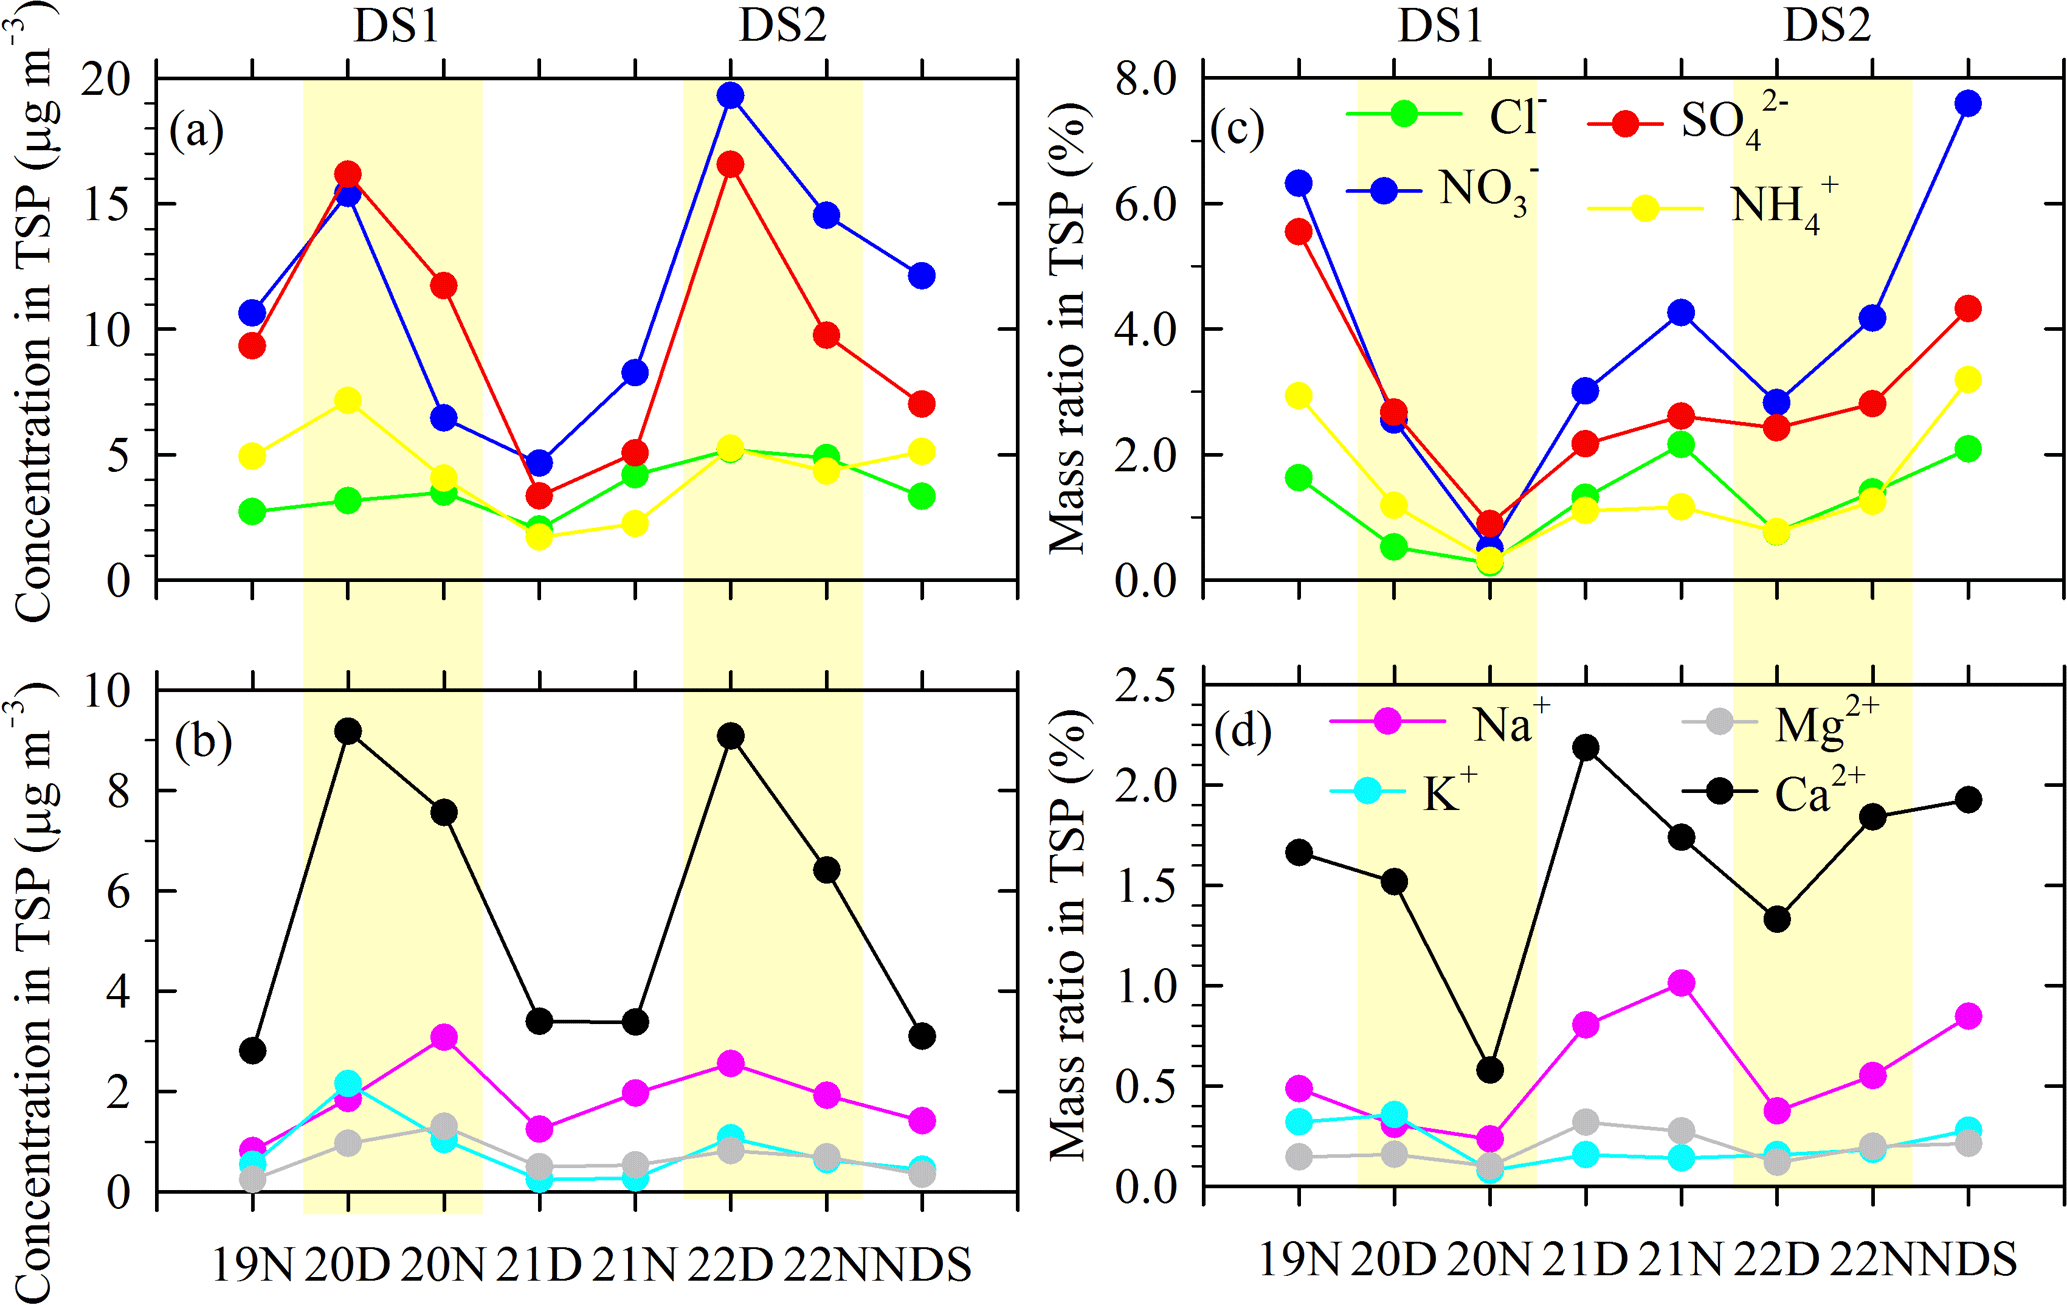
Figure 6Variations in the concentrations of water-soluble ions and their mass ratios in TSP during 19–22 March and NDS in 2010.
Cl− during the dust periods was moderately enhanced by ∼ 1–2-fold compared to NDS, indicating that Cl− was also impacted by the invasion of dust plumes. As shown in Fig. 6a and c, both the concentrations of Cl− and its mass ratios in TSP were higher in DS2 than in DS1. As the air masses of DS2 passed over the ocean, part of the high Cl− concentrations should be attributed to the contribution from sea salts. The average equivalent ratio of Cl− to Na+ ([Cl−] ∕ [Na+]) was 1.65 in NDS and 2.17 in 19N, higher than the ratio in seawater (1.17), indicating that anthropogenic sources such as coal combustion (Sun et al., 2014; Yao et al., 2002) contributed significantly to Cl− on the NDS days. The [Cl−] ∕ [Na+] ratio dropped to ∼ 1.0 in DS1 as massive continental particles invaded Shanghai, while in DS2 the ratio was elevated to 1.5. Thus, both sea salts and anthropogenic sources should contribute to the particulate Cl− in DS2.

Figure 7Variations in (a) the ratios of Ca2+ ∕ Ca, (b) the equivalent concentrations of the total anions to the total cations (anion ∕ cation), (c) the equivalent concentrations of NH to the sum of SO and NO ([NH] ∕ [SONO]), and (d) the equivalent concentrations of the sum of NH, Ca2+, and Mg2+ to the sum of SO and NO ([NH Ca Mg2+] ∕ [SONO]) in TSP during 19–22 March and NDS in 2010.
As for the secondary inorganic ions (i.e., SO, NO, and NH, their concentrations in TSP were elevated to 16.2, 15.4, and 7.2 µg m−3 in the daytime of 20 March (20D) in DS1. The sampling time of 20D was from ∼ 08:00 to 20:00 LST, including the short period of pollutant accumulation before the arrival of DS1. As a result, the high concentrations of SO and NO measured in 20D were contributed from both local and transported sulfate and nitrate, as well as from the heterogeneous reactions on dust particles. In the nighttime of 20 March (20N), the concentrations of NO and NH sharply decreased by 57.8 and 43.2 %, respectively. Although SO also decreased, its reduction extent was much weaker at 27.8 % and was still ∼ 2-fold that on NDS days (Fig. 6a). Nitrate formation on dust is strongly dependent on the ambient conditions. Low temperature, low relative humidity, strong wind, and low concentrations of pollution gases did not favor the heterogeneous reaction (Huang et al., 2010a; Yuan et al., 2008). Hence, strong dust events usually diluted the concentrations of nitrate (Duvall et al., 2008; Huang et al., 2010a; Wang et al., 2006). As for the sulfate formation on dust, SO2 could interact with various mineral components of dust particles to produce sulfate, and sulfate became mixed with the dust first competing with nitrate (Dupart et al., 2012; Sullivan et al., 2007). Hence, although the secondary particle components were diluted by the invasion of dust, the formation of sulfate could still be compensated for by the heterogeneous reaction on dust to some extent.
In the daytime of 22 March (22D) during DS2, the concentrations of SO and NO reached the highest during the study period with values of 16.6 and 19.3 µg m−3, respectively. Although SO and NO decreased in the nighttime of 22 March (22N), their levels were still higher than the NDS (Fig. 6a). Also, the mass ratios of SO and NO in TSPs were higher in DS2 than DS1 (Fig. 6c). These results indicated that SO and NO were more favorably formed in DS2. It was observed that the concentration of NO was even higher than that of SO in both daytime and nighttime samples during DS2, showing a contrary behavior to DS1. As discussed above, the formation of nitrate on dust strongly depends on the ambient conditions. During DS2, RH was at a moderately high level, enhancing the efficiency of aqueous processing on the particles. In addition, the abnormally high concentrations of NO2 (Fig. 4c) suggested the emission precursors were sufficient for the production of nitrate. Finally, high concentrations of nitrate during DS2 may be partially attributed to the reaction between sea salts and nitric acid (Hsu et al., 2014; Huang et al., 2010a) as the dust plumes traveled over the ocean. The formation of secondary aerosol species during DS2 should have involved the complex interactions between pollutant precursors, dust, and sea salts.
Figure 7b shows the equivalent ratio of the total anions to the total cations (A ∕ C) in TSP. The A ∕ C ratio dropped to ∼ 0.5 in DS1 from ∼ 0.9 in 19N, which was attributed to the existence of abundant CO in dust particles that cannot be detected using ion chromatography (Huang et al., 2010a). The A ∕ C ratio reached 0.85 and 0.80 in 22D and 22N in DS2, respectively, much higher than those in DS1, suggesting that a higher fraction of CaCO3 in the dust particles in DS2 were transformed to CaSO4 and Ca(NO3)2 than in DS1, consistent with the higher Ca2+ ∕ Ca ratio in DS2 than in DS1 (Fig. 7a). The equivalent ratio of NH to the sum of SO and NO ([NH] ∕ [SONO]) in TSP also indicated that the heterogeneous reactions between carbonate and acid gases were more promoted in DS2 compared to DS1. As shown in Fig. 7c, the [NH] ∕ [SONO] ratio was slightly higher than that on the NDS days, indicating that SO and NO could be completely neutralized by NH. In DS1, the [NH] ∕ [SONO] ratio was 0.68 and 0.65 in 20D and 20N, while in DS2 it was even lower at 0.45 and 0.55 in 22D and 22N, respectively. Apparently, NH was insufficient for completely neutralizing SO and NO in both dust episodes, particularly in DS2. The ammonium deficiency was also observed in Kinmen and Zhuhai (Hsu et al., 2014), an island site and a coastal site, respectively, during this super dust storm. We further investigated the [NHCaMg2+] ∕ [SONO] ratio. As shown in Fig. 7d, with the addition of Ca2+ and Mg2+, sulfate and nitrate had been completely neutralized, implying the important role of alkaline calcium and magnesium as the medium of dust heterogeneous reactions. By estimating the neutralization efficiency of Ca2+ and Mg2+ (NECa&Mg) as NE [NH] ∕ [SONO], the average value of NECa&Mg in DS1 and DS2 was 0.34 and 0.50, respectively. The higher NECa&Mg in DS2 also suggested the chemical processing via dust was efficient under the environmental conditions such as DS2 in this study.

Figure 8Vertical profiles of the average extinction coefficients of dust, pollution, and total particles (km−1), particle depolarization ratios (Particle depol., unitless), and the ratio of the dust extinction in the total particle extinction (Dust ratio, unitless) in four periods of 09:00–15:00 LST on 20 March (before DS1), 16:00–17:45 LST on 20 March (before the highest PM10 concentration in DS1), 18:00 LST on 20 March–04:45 LST on 21 March (during the highest PM10 concentration in DS1), and 06:00–18:00 LST on 22 March in DS2.
3.5 Vertical evolution of dust particles
In both DS1 and DS2, dust particles were mostly restrained below the altitude of 1 km. Strong vertical gradients of δv and β were observed (Fig. 3). To quantitatively investigate the evolution of vertical dust profiles, we selected four typical episodes as follows: (1) 09:00–15:00 LST on 20 March, an episode right before the arrival of DS1; (2) 16:00–17:45 LST on 20 March, an episode before the onset of maximum hourly PM10 concentrations in DS1; (3) 18:00 LST of 20 March–04:45 LST of 21 March, an episode that covers the highest PM10 concentration hours (> 1000 µg m−3) in DS1; (4) 06:00–18:00 LST on 22 March, an episode in DS2.
As shown in Fig. 8a, the mean σ between 09:00 and 15:00 LST on 20 March ranged from around 0.12 to 0.72 km−1 from near ground level to 1 km. During this period, the mean δp was relatively low at ∼ 0.02–0.08, suggesting spherical particles, i.e., pollution particles dominated. Accordingly, the contribution of dust to the total particle extinction (dust ratio) was less than 20 % (Fig. 8e). As discussed earlier, the high values of light extinction caused by pollution particles before the onset of DS1 were due to the pre-accumulation of local and transported pollutants brought by the invading cold front. On the pathway of DS1 (Fig. 2c), the air masses traveled over large areas with intense anthropogenic emissions and thus a large quantity of pollutants could be pushed to the downstream areas and accumulated before the dust plume arrived.
As DS1 invaded, the mean σ further increased and reached 0.73 km−1 near the surface level (Fig. 8b–c). In the meantime, the values of δp were elevated to be higher than 10 % from near the ground to ∼ 1 km (Fig.8f–g). When PM10 reached its highest concentrations (> 1000 µg m−3), the mean δp was ∼ 23–27 % extending from near the ground to ∼ 700 m (Fig. 8g). However, compared to the δp value of ∼ 30–35 % for the relatively pure Asian dust (Murayama et al., 2003; Sakai et al., 2003), the δp in DS1 was still lower, suggesting the mixing of dust with pollution to a certain extent. As shown in Fig. 8b–c, the mean σd obviously overwhelmed the mean σs and could be up to 0.82 km−1 near the surface level, while the mean σs dropped to less than 0.1 km−1. From near the ground to ∼ 700 m, no significant vertical gradients of δp and dust ratio were observed. This indicated DS1 had a top-down effect on modifying the bulk particle optical properties in the lower troposphere in this case. Within this altitude range, dust could account for ∼ 80–90 % of the total particle extinction coefficients while only a minor fraction of ∼ 10–20 % was attributed to the pollution particles. Above 700 m, δp and the dust ratio quickly deceased, suggesting the impact of dust on the light extinction was much weakened.
In DS2, the maximum σ and δp averaged between 06:00 and 18:00 LST on 22 March was ∼ 0.61 km−1 and 26 %, respectively, observed at an altitude of ∼ 300 m. Different from DS1, both δp and the dust ratio had a significant vertical gradient in DS2. As shown in Fig. 8h, δp decreased quickly from its maximum value at ∼ 250 m to 5 % at ∼ 750 m. Correspondingly, the dust ratios decreased from 88 to 25 %. Moreover, the vertical profiles of σd and σs showed distinctly different behaviors during this period. As shown in Fig. 8d, the maximum σd (∼ 0.55 km−1) appeared at the altitude of ∼ 250 m, while that of σs (∼ 0.25 km−1) appeared at a higher altitude of ∼ 800 m. As compared to DS1 (Fig. 8b–c), the σs in DS2 showed similar magnitudes below ∼ 270 m. Above this altitude, the σs in DS2 gradually increased while that in DS1 varied relatively stably with the altitudes. The enhancement of pollution particles in the middle layer during DS2 should be mainly attributed to its unique transport pathway. As shown in Fig. 2e, substantial air masses in the upper layer were transported from the south and may bring more moisture. The sounding data at a meteorology station (31.40∘ N, 121.46∘ E) in Shanghai supported this statement as shown in Fig. S2.
Opposite from the low relative humidity and its decreasing trend with altitude in DS1, RH in DS2 (measured at 08:00 and 20:00 LST on 22 March, respectively) showed much higher values and an increasing trend with altitude (Fig. S2). This phenomenon corroborated our discussions above that the meteorological conditions were more favorable for promoting the dust chemistry in DS2. As a result, the secondary aerosol formation via heterogeneous reaction yielded stronger particle extinction in DS2, especially in the middle and upper layers through 270 m till the top (2 km) where the particle extinctions caused by spherical particles were still significant. Conversely, due to the higher humidity in DS2, the soluble particle components should undergo stronger hygroscopic growth and thus partly explain the structure of the vertical profile of spherical particles as shown in Fig. 8d. It is commonly regarded that in the dry and less-oxidative environment that dust storms are usually associated with, the formation and growth of secondary particles are often depressed. However, under certain favorable conditions, new particle formation during dust events could still be discernible (Nie et al., 2014). In this study, vertical profiles of crucial meteorological parameters, pollutant precursors, and particle numbers were not available for diagnosing the new particle formation. Tethered balloon-based measurement (Li et al., 2015) could be a good platform for investigating the particle formation during dust events at different altitudes in future research.

Figure 9The spatial distribution of OMI ultraviolet aerosol index (unitless) and simulated mineral aerosols (µg m−3) from 20 to 22 March 2010.
3.6 Impact of dust chemistry on regional air quality
Chemical transport modeling (Methods in Sect. 2.5) was utilized to assess the impact of dust chemistry on the perturbation of air quality on the regional scale. The model performance of CMAQ with improved dust module has been evaluated against various observational datasets and it was demonstrated that the model has relatively good capability in capturing both magnitudes and temporal variability in bulk aerosol (e.g., PM10, aerosol optical depth) during the spring season over China (Dong et al., 2016). It has to be noted that the model only simulated the particle size up to 10 µm while the observation of particle chemistry included all the sizes (i.e., TSP); hence the mismatch of size distribution between the model and observation precluded the evaluation of the simulated particle chemical species in this study. In the following discussions, we focused on the qualitative assessment of the impact of dust chemistry on the regional air quality.
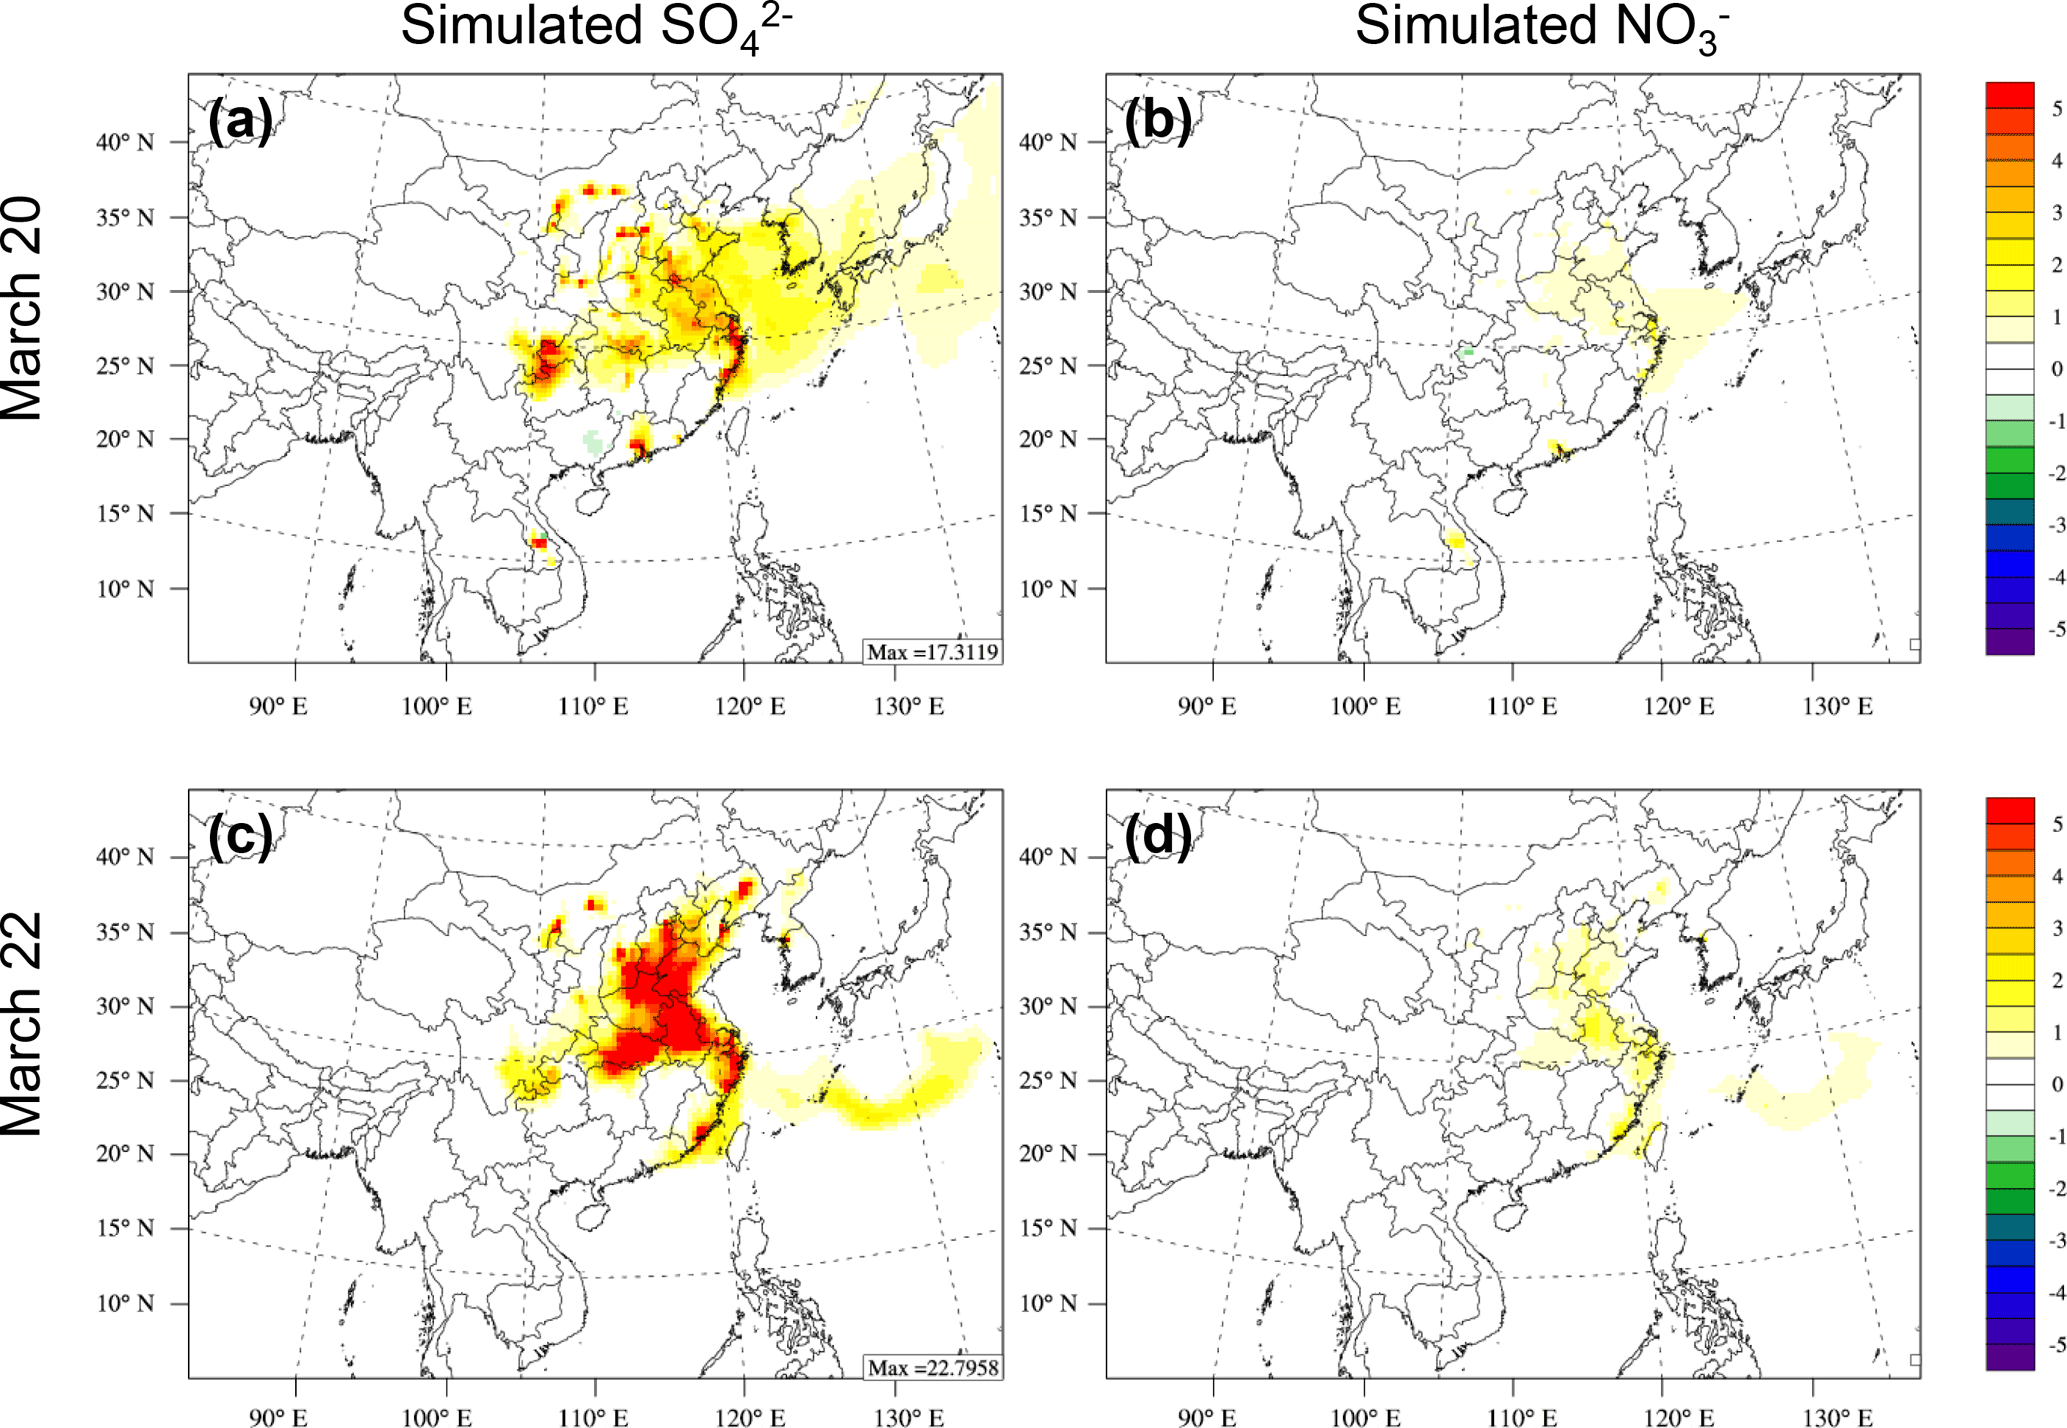
Figure 9 shows the spatial distribution of simulated mineral particles from 20–22 March 2010. Accordingly, we show the spatial distribution of ultraviolet aerosol index (UVAI) retrieved from OMI during the same period. UVAI is sensitive to absorbing particles, i.e., black carbon and mineral dust (Torres et al., 2007). Hence, the comparison between simulated mineral particles and observed UVAI could illustrate how the transport of dust was reproduced. However, based on the definition of aerosol index, it is a parameter based on the difference between radiance at two near-ultraviolet wavelengths. Thus, the comparison between satellite aerosol index and simulated mineral dust is only qualitative. As seen from Fig. 9, high values of UVAI were always observed over Southeast Asia and this was ascribed to the black carbon particles emitted from strong biomass burning over this region during the spring season (Fu et al., 2012; Huang et al., 2013; Tsay et al., 2013). We look particularly at the dust and its downwind regions over East Asia. On 20 March, high UVAI values stretched from the Gobi Desert to the North China Plain and the Yangtze River Delta. This transport pathway was relatively well reproduced by the model as we can see high concentrations of mineral particles over similar areas as well. On the following day of 21 March, the satellite observation illustrated the movement of the high-UVAI zones further southward and the drifting of dust plumes off the coastline of East China (Fig. 9c). Accordingly, the simulation showed similar behavior with strengthened concentrations of mineral particles over the Gobi Desert and downwind areas of the Yangtze River Delta (Fig. 9d). On 22 March, although UVAI signals were absent over most areas of East China due to the satellite swath, high UVAI values could still be observed over the tip of the Yangtze River Delta and the East China Sea. This is also relatively consistent with the model simulation that high concentrations of mineral particles hovered over the coastlines from the Yangtze River Delta to the Taiwan Strait. Overall, we demonstrated that the model is capable of capturing the spatial distribution of dust during the long-range transport.
Since we specifically focus on the interaction between dust and anthropogenic pollutants in this study, we have performed two simulations, i.e., one with dust emissions but without dust chemistry and the other one with dust chemistry. The impact of dust chemistry on particle chemical components could thus be quantified via the difference between these two simulations. Figure 10a and c show the spatial distribution of sulfate via the formation pathway of dust heterogeneous reactions, as well as for nitrate in Fig. 10b and d. Different from the spatial distribution of mineral particles (Fig. 9a–c), the formation of sulfate and nitrate via dust chemistry mainly occurred over northeastern China. It is expected that although the major source region of mineral dust is from the Gobi Desert in northern China, fewer anthropogenic emission sources existed there; hence relatively weak atmospheric chemical processing was simulated over the dust source region. Conversely, drier climate in northern China also suppressed the extent of heterogeneous reactions on the surface of dust. Hence, the strongest impact from dust heterogeneous reactions on the formation of secondary particles occurred in those populous areas where the interaction of anthropogenic precursors and dust was the strongest.
As for sulfate, the simulated concentration over Shanghai averaged 8.1, 3.1, and 8.5 µg m−3 from 20 to 22 March, respectively. This temporal variation corresponded to that from observation as discussed in Sect. 3.4.2. While it has to be noted again that the simulated particle species contained particulate sizes less than 10 µm, a close match between the simulation and observation was not expected. As we compare DS1 (Fig. 10a) and DS2 (Fig. 10c), the simulated sulfate during DS2 was evidently more intense than that during DS1 in a larger geographic region, which was fairly consistent with the observation. Since the daily emission rates digested by the model were almost constant during this period, meteorological conditions should be the determining factor, of which elevated humidity during DS2 has been diagnosed as the most important factor responsible for stronger dust chemistry.
As for nitrate, its spatial distribution pattern was as similar as that of sulfate at a certain extent. The simulated concentration of nitrate averaged 3.1, 2.3, and 5.2 µg m−3 over Shanghai from 20 to 22 March, respectively. Although the simulation results and observational data could not be statistically intercompared due to the size difference as stated above, we think the simulated nitrate should be largely underestimated. The ratio of simulated nitrate between DS2 and DS1 was 1.7, similar to that of ∼ 1.6 from observation. This suggested that the favorable meteorological conditions (e.g., higher humidity) for facilitating the dust heterogeneous reaction during DS2 have been accounted for by the model. In this regard, we ascribe the low-biased nitrate mainly to several aspects. First, the NOx emissions could have been underestimated. As indicated in Dong et al. (2016), who used the same anthropogenic emission inventory as this study, the model showed some underestimation of the total NO2 columns as compared to the OMI observation, especially over northeastern China (see Fig. 8 in Dong et al., 2016). Secondly, HNO3, N2O5, NO2, and NO3 were the major precursors of nitrate as implemented in the dust module. Reactions via HNO3 and N2O5 were the dominant pathways of nitrate formation due to their relatively high uptake coefficients on the dust. It was possible that the formation of HNO3 was underestimated, thus lowering the production of nitrate. However, this is just a guess as observation of gaseous HNO3 was not available in this study. Lastly, we think the underestimation of nitrate may be due to the omission of nitrate processing on the surface of sea salt, which was especially important for coastal cities such as Shanghai (Buseck and Posfai, 1999).
During 19–23 March 2010, a super dust storm swept extensive areas from northern China to southern China. Two separate dust periods were observed in Shanghai, one from ∼ 16:00 LST on 20 March to ∼ 10:00 LST on 21 March (DS1) and the other from ∼ 06:00 LST on 22 March to ∼ 00:00 LST on 23 March (DS2). In DS1, the dust plumes were mostly transported over those areas characterized by high pollution emissions in northern China, while the dust plumes in DS2 were transported over the coastal regions of eastern China with higher RH. The ratios of SO2 ∕ PM10 and NO2 ∕ PM10 were up to 0.11 ± 0.03 and 0.20 ± 0.04 in DS2, much higher than the values in DS1. In addition, the concentrations of typical elemental species such as As, Cd, Pb, and Zn were also more enriched in DS2 than in DS1, indicating the stronger mixing extent between dust and primary anthropogenic emissions in DS2. Due to the higher level of gaseous pollutant precursors associated with moderate relative humidity, SO and NO exhibited higher concentrations in DS2 than in DS1. The higher Ca2+ ∕ Ca ratio and lower [NH] ∕ [SONO] ratio in DS2 suggested that the heterogeneous reactions between calcites and acid gases were significantly promoted in DS2. Particularly, more NO than SO was formed in DS2, probably due to the high concentrations of NO2 and the complex reaction among dust, sea salts, and nitric acid. Vertical profiles of particle optical properties from lidar measurement retrieved high depolarization ratios of ∼ 23–27 % extending from near the ground to ∼ 700 m in DS1 and it was estimated that dust dominantly accounted for ∼ 80–90 % of the total particle extinction. In DS2, the vertical structure of particles changed dramatically from that of DS1. The maximum extinction coefficient of dust particles emerged at the altitude of ∼ 250 m in DS2, while that of pollution particles showed at a higher altitude of ∼ 800 m. The abnormal increase in humidity as a function of altitude from the southerly winds explained this phenomenon due to promoted heterogeneous reactions on dust particles and the subsequent particle hygroscopic growth.
Simulated mineral particles were compared to the remote sensing UVAI from satellites, showing consistent spatial patterns between model and observation. By applying the dust scheme with explicit chemistry mechanisms, evident impacts of dust heterogeneous reactions on secondary aerosol formation were reproduced over widespread areas of northeastern China where the anthropogenic emissions were intensive. The sulfate formation was relatively well simulated while the nitrate formation on dust was believed to be largely underestimated. More research on laboratory kinetic studies of nitrate dust chemistry is suggested. Also, the feedback between dust chemistry and regional climate change needs to be investigated in the future.
All data used in this paper are available by contacting Kan Huang (huangkan@fudan.edu.cn).
The supplement related to this article is available online at: https://doi.org/10.5194/acp-18-3505-2018-supplement.
The authors declare that they have no conflict of interest.
This article is part of the special issue “Anthropogenic dust and its climate impact”. It is not associated with a conference.
This work was supported by the National Natural Science Foundation of China
(nos. 41405115, 41429501, and 91644105) and National Key Technology Research
and Development Program of the Ministry of Science and Technology of China
(no. 2014BAC22B06). Qingyan Fu and Yanfen Lin would like to acknowledge
support from the Shanghai Science and Technology Fund (nos. 14DZ1202900 and
16DZ1204601) and National Key Technology Research and Development Program of
the Ministry of Science and Technology of China (no. 2014BAC22B00).
Edited by: Jianping Huang
Reviewed by: two anonymous referees
Bi, J., Shi, J., and Xie, Y.: Dust Aerosol Characteristics and Shortwave Radiative Impact at a Gobi Desert of Northwest China during the Spring of 2012, J. Meteorol. Soc. Jpn., 92, 33–56, 2014.
Bi, J., Huang, J., Holben, B., and Zhang, G.: Comparison of key absorption and optical properties between pure and transported anthropogenic dust over East and Central Asia, Atmos. Chem. Phys., 16, 15501–15516, https://doi.org/10.5194/acp-16-15501-2016, 2016.
Buseck, P. and Posfai, M.: Airborne minerals and related aerosol particles: Effects on climate and the environment, P. Natl. Acad. Sci. USA, 96, 3372–3379, https://doi.org/10.1073/pnas.96.7.3372, 1999.
Chen, S., Huang, J., Kang, L., Wang, H., Ma, X., He, Y., Yuan, T., Yang, B., Huang, Z., and Zhang, G.: Emission, transport, and radiative effects of mineral dust from the Taklimakan and Gobi deserts: comparison of measurements and model results, Atmos. Chem. Phys., 17, 2401–2421, https://doi.org/10.5194/acp-17-2401-2017, 2017.
Creamean, J. M., Suski, K. J., Rosenfeld, D., Cazorla, A., Demott, P. J., Sullivan, R. C., White, A. B., Ralph, F. M., Minnis, P., and Comstock, J. M.: Dust and biological aerosols from the Sahara and Asia influence precipitation in the western U.S., Science, 339, 1572, https://doi.org/10.1126/science.1227279, 2013.
Dong, X., Fu, J. S., Huang, K., Tong, D., and Zhuang, G.: Model development of dust emission and heterogeneous chemistry within the Community Multiscale Air Quality modeling system and its application over East Asia, Atmos. Chem. Phys., 16, 8157–8180, https://doi.org/10.5194/acp-16-8157-2016, 2016.
Dupart, Y., King, S. M., Nekat, B., Nowak, A., Wiedensohler, A., Herrmann, H., David, G., Thomas, B., Miffre, A., and Rairoux, P.: Mineral dust photochemistry induces nucleation events in the presence of SO2, P. Natl. Acad. Sci. USA, 109, 20842–20847, 2012.
Duvall, R. M., Majestic, B. J., Shafer, M. M., Chuang, P. Y., Simoneit, B. R. T., and Schauer, J. J.: The water-soluble fraction of carbon, sulfur, and crustal elements in Asian aerosols and Asian soils, Atmos. Environ., 42, 5872–5884, 2008.
Eguchi, K., Uno, I., Yumimoto, K., Takemura, T., Shimizu, A., Sugimoto, N., and Liu, Z.: Trans-pacific dust transport: integrated analysis of NASA/CALIPSO and a global aerosol transport model, Atmos. Chem. Phys., 9, 3137–3145, https://doi.org/10.5194/acp-9-3137-2009, 2009.
Fernald, F. G.: Analysis of atmospheric lidar observations: some comments, Appl. Optics, 23, 652–653, 1984.
Fischer, E. V., Perry, K. D., and Jaffe, D. A.: Optical and chemical properties of aerosols transported to Mount Bachelor during spring 2010, J. Geophys. Res.-Atmos., 116, D18202, https://doi.org/10.1029/2011JD015932, 2011.
Formenti, P., Schütz, L., Balkanski, Y., Desboeufs, K., Ebert, M., Kandler, K., Petzold, A., Scheuvens, D., Weinbruch, S., and Zhang, D.: Recent progress in understanding physical and chemical properties of African and Asian mineral dust, Atmos. Chem. Phys., 11, 8231–8256, https://doi.org/10.5194/acp-11-8231-2011, 2011.
Fu, J. S., Hsu, N. C., Gao, Y., Huang, K., Li, C., Lin, N.-H., and Tsay, S.-C.: Evaluating the influences of biomass burning during 2006 BASE-ASIA: a regional chemical transport modeling, Atmos. Chem. Phys., 12, 3837–3855, https://doi.org/10.5194/acp-12-3837-2012, 2012.
Fu, Q. Y., Zhuang, G. S., Li, J. A., Huang, K., Wang, Q. Z., Zhang, R., Fu, J., Lu, T., Chen, M., Wang, Q. A., Chen, Y., Xu, C., and Hou, B.: Source, long-range transport, and characteristics of a heavy dust pollution event in Shanghai, J. Geophys. Res.-Atmos. 115, D00K29, https://doi.org/10.1029/2009JD013208, 2010.
Fu, X., Wang, S. X., Cheng, Z., Xing, J., Zhao, B., Wang, J. D., and Hao, J. M.: Source, transport and impacts of a heavy dust event in the Yangtze River Delta, China, in 2011, Atmos. Chem. Phys., 14, 1239–1254, https://doi.org/10.5194/acp-14-1239-2014, 2014.
Guenther, A., Karl, T., Harley, P., Wiedinmyer, C., Palmer, P. I., and Geron, C.: Estimates of global terrestrial isoprene emissions using MEGAN (Model of Emissions of Gases and Aerosols from Nature), Atmos. Chem. Phys., 6, 3181–3210, https://doi.org/10.5194/acp-6-3181-2006, 2006.
Guo, J., Rahn, K. A., and Zhuang, G. S.: A mechanism for the increase of pollution elements in dust storms in Beijing, Atmos. Environ., 38, 855–862, 2004.
Hsu, S.-C., Lee, C. S. L., Huh, C.-A., Shaheen, R., Lin, F.-J., Liu, S. C., Liang, M.-C., and Tao, J.: Ammonium deficiency caused by heterogeneous reactions during a super Asian dust episode, J. Geophys. Res.-Atmos. 119, 6803–6817, https://doi.org/10.1002/2013JD021096, 2014.
Huang J., Wang, T., Wang, W., Li, Z., and Yan, H.: Climate effects of dust aerosols over East Asian arid and semiarid regions, J. Geophys. Res.-Atmos., 119, 11398–11416, 2014.
Huang, K., Zhuang, G. S., Li, J. A., Wang, Q. Z., Sun, Y. L., Lin, Y. F., and Fu, J. S.: Mixing of Asian dust with pollution aerosol and the transformation of aerosol components during the dust storm over China in spring 2007, J. Geophys. Res.-Atmos., 115, D00K13, https://doi.org/10.1029/2009JD013145, 2010a.
Huang, K., Zhuang, G. S., Lin, Y. F., Li, J. A., Sun, Y. L., Zhang, W. J., and Fu, J. S.: Relation between optical and chemical properties of dust aerosol over Beijing, China, J. Geophys. Res.-Atmos., 115, D00K16, https://doi.org/10.1029/2009JD013212, 2010b.
Huang, K., Zhuang, G., Lin, Y., Fu, J. S., Wang, Q., Liu, T., Zhang, R., Jiang, Y., Deng, C., Fu, Q., Hsu, N. C., and Cao, B.: Typical types and formation mechanisms of haze in an Eastern Asia megacity, Shanghai, Atmos. Chem. Phys., 12, 105–124, https://doi.org/10.5194/acp-12-105-2012, 2012.
Huang, K., Fu, J. S., Hsu, N. C., Gao, Y., Dong, X., Tsay, S. C., and Yun, F. L.: Impact assessment of biomass burning on air quality in Southeast and East Asia during BASE-ASIA, Atmos. Environ., 78, 291–302, 2013.
IPCC: Climate Change 2013: The Physical Science Basiss, Contribution of Working Group I to the Fifth Assessment Report of the Intergovernmental Panel on Climate Change, edited by: Stocker, T. F., Qin, D., Plattner, G.-K., Tignor, M., Allen, S. K., Boschung, J., Nauels, A., Xia, Y., Bex, V., and Midgley, P. M., Cambridge University Press, New York, USA, 2013.
Li, J., Fu, Q., Huo, J., Wang, D., Yang, W., Bian, Q., Duan, Y., Zhang, Y., Pan, J., Lin, Y., Huang, K., Bai, Z., Wang, S.-H., Fu, J. S., and Louie, P. K. K.: Tethered balloon-based black carbon profiles within the lower troposphere of Shanghai in the 2013 East China smog, Atmos. Environ., 123, 327–338, 2015.
Li, J. W., Han, Z. W., and Zhang, R. J.: Model study of atmospheric particulates during dust storm period in March 2010 over East Asia, Atmos. Environ., 45, 3954–3964, 2011.
Li, R. and Min, Q. L.: Impacts of mineral dust on the vertical structure of precipitation, J. Geophys. Res.-Atmos., 115, D09203, https://doi.org/10.1029/2009JD011925, 2010.
Lida, D. R.: Handbook of Chemistry and Physics: A Ready-Reference Book of Chemical and Physical Data, 86th ed., CRC Press, New York, USA, 14–17, 2006.
Liu, Z. Y., Sugimoto, N., and Murayama, T.: Extinction-to-backscatter ratio of Asian dust observed with high-spectral-resolution lidar and Raman lidar, Appl. Optics, 41, 2760–2767, 2002.
Matsuki, A., Iwasaka, Y., Shi, G., Zhang, D., Trochkine, D., Yamada, M., Kim, Y. S., Chen, B., Nagatani, T., and Miyazawa, T.: Morphological and chemical modification of mineral dust: Observational insight into the heterogeneous uptake of acidic gases, Geophys. Res. Lett., 32, 312–329, 2006.
Murayama, T., Masonis, S. J., Redemann, J., Anderson, T. L., Schmid, B., Livingston, J. M., Russell, P. B., Huebert, B., Howell, S. G., and Mcnaughton, C. S.: An intercomparison of lidar-derived aerosol optical properties with airborne measurements near Tokyo during ACE-Asia, J. Geophys. Res.-Atmos., 108, 8561, https://doi.org/10.1029/2002JD003259, 2003.
Nie, W., Ding, A., Wang, T., Kerminen, V.-M., George, C., Xue, L., Wang, W., Zhang, Q., Petäjä, T., Qi, X., Gao, X., Wang, X., Yang, X., Fu, C., and Kulmala, M.: Polluted dust promotes new particle formation and growth, Sci. Rep., 4, 6634, https://doi.org/10.1038/srep06634, 2014.
Pan, X., Uno, I., Zhe, W., Nishizawa, T., Sugimoto, N., Yamamoto, S., Yamamoto, S., Kobayashi, H., Sun, Y., Fu, P., Tang, X., and Wang, Z.: Real-time observational evidence of changing asian dust morphology with the mixing of heavy anthropogenic pollution, Sci. Rep., 7, 335, https://doi.org/10.1038/s41598-017-00444-w, 2017.
Reid, J. S., Hyer, E. J., Prins, E. M., Westphal, D. L., Zhang, J., Wang, J., Christopher, S. A., Curtis, C. A., Schmidt, C. C., and Eleuterio, D. P.: Global Monitoring and Forecasting of Biomass-Burning Smoke: Description of and Lessons From the Fire Locating and Modeling of Burning Emissions (FLAMBE) Program, IEEE J. Sel. Top. Appl., 2, 144–162, 2009.
Sakai, T., Nagai T., Nakazato M., Mano Y., and Matsumura T.: Ice clouds and Asian dust studied with lidar measurements of particle extinction-to-backscatter ratio, particle depolarization, and water-vapor mixing ratio over Tsukuba, Appl. Optics, 42, 7103–7116, 2003.
Shimizu, A., Sugimoto, N., Matsui, I., Arao, K., Uno, I., Murayama, T., Kagawa, N., Aoki, K., Uchiyama, A., and Yamazaki, A.: Continuous observations of Asian dust and other aerosols by polarization lidars in China and Japan during ACE-Asia, J. Geophys. Res.-Atmos., 109, D19S17, https://doi.org/10.1029/2002JD003253, 2004.
Shimizu, A., Nishizawa, T., Jin, Y., Kim, S. W., Wang, Z., Batdorj, D., and Sugimoto, N.: Evolution of a lidar network for tropospheric aerosol detection in east asia, Opt. Eng., 56, 031219, https://doi.org/10.1117/1.oe.56.3.031219, 2017.
Sugimoto, N., Matsui, I., Shimizu, A., Uno, I., Asai, K., Endoh, T., and Nakajima, T.: Observation of dust and anthropogenic aerosol plumes in the Northwest Pacific with a two-wavelength polarization lidar on board the research vessel Mirai, Geophys. Res. Lett., 29, 1901, https://doi.org/10.1029/2002GL015112, 2002.
Sullivan, R. C., Guazzotti, S. A., Sodeman, D. A., and Prather, K. A.: Direct observations of the atmospheric processing of Asian mineral dust, Atmos. Chem. Phys., 7, 1213–1236, https://doi.org/10.5194/acp-7-1213-2007, 2007.
Sun, Y. L., Zhuang, G. S., Ying, W., Han, L. H., Guo, J. H., Mo, D., Zhang, W. J., Wang, Z. F., and Hao, Z. P.: The air-borne particulate pollution in Beijing – concentration, composition, distribution and sources, Atmos. Environ., 38, 5991–6004, 2004.
Sun, Y. L., Zhuang, G. S., Huang, K., Li, J. A., Wang, Q. Z., Wang, Y., Lin, Y. F., Fu, J. S., Zhang, W. J., Tang, A. H., and Zhao, X. J.: Asian dust over northern China and its impact on the downstream aerosol chemistry in 2004, J. Geophys. Res.-Atmos., 115, D00K09, https://doi.org/10.1029/2009JD012757, 2010.
Sun, Y. L., Jiang, Q., Wang, Z. F., Fu, P. Q., Li, J., Yang, T., and Yin, Y.: Investigation of the sources and evolution processes of severe haze pollution in Beijing in January 2013, J. Geophys. Res.-Atmos., 119, 4380–4398, 2014.
Tatarov, B., Muller, D., Noh, Y. M., Lee, K. H., Shin, D. H., Shin, S. K., Sugimoto, N., Seifert, P., and Kim, Y. J.: Record heavy mineral dust outbreaks over Korea in 2010: Two cases observed with multiwavelength aerosol/depolarization/Raman-quartz lidar, Geophys. Res. Lett., 39, L14801, https://doi.org/10.1029/2012GL051972, 2012.
Tobo, Y., Zhang, D. Z., Matsuki, A., and Iwasaka, Y.: Asian dust particles converted into aqueous droplets under remote marine atmospheric conditions, P. Natl. Acad. Sci. USA, 107, 17905–17910, 2010.
Torres, O., Tanskanen, A., Veihelmann, B., Ahn, C., Braak, R., Bhartia, P. K., Veefkind, P., and Levelt, P.: Aerosols and surface UV products from Ozone Monitoring Instrument observations: An overview, J. Geophys. Res.-Atmos., 112, D24S47, https://doi.org/10.1029/2007JD008809, 2007.
Tsai, F., Tu, J.-Y., Hsu, S.-C., and Chen, W.-N.: Case study of the Asian dust and pollutant event in spring 2006: Source, transport, and contribution to Taiwan, Sci. Total Environ., 478, 163–174, 2014.
Tsai, F. J., Fang, Y. S., and Huang, S. J.: Case Study Of Asian Dust Event On March 19–25, 2010 And Its Impact On The Marginal Sea Of China, J. Mar. Sci. Technol.-Taiwan, 21, 353–360, 2013.
Tsai, J.-H. T., Huang, K.-L., Lin, N.-H., Chen, S.-J., Lin, T.-C., Chen, S.-C., Lin, C.-C., Hsu, S.-C., and Lin, W.-Y.: Influence of an Asian Dust Storm and Southeast Asian Biomass Burning on the Characteristics of Seashore Atmospheric Aerosols in Southern Taiwan, Aerosol Air Qual. Res., 12, 1105–1115, 2012.
Tsay, S. C., Hsu, N. C., Lau, K. M., Li, C., Gabriel, P. M., Ji, Q., Holben, B. N., Welton, E. J., Nguyen, A. X., and Janjai, S.: From BASE-ASIA toward 7-SEAS: A satellite-surface perspective of boreal spring biomass-burning aerosols and clouds in Southeast Asia, Atmos. Environ., 78, 20–34, 2013.
Uchiyama, A., Yamazaki, A., Togawa, H., Asano, J., and Shi, G.: Single Scattering Albedo of Aeolian Dust as Inferred from Sky-radiometer and in situ Ground-based Measurement, Sola, 1, 209–212, 2005.
Uno, I., Eguchi, K., Yumimoto, K., Takemura, T., Shimizu, A., Uematsu, M., Liu, Z. Y., Wang, Z. F., Hara, Y., and Sugimoto, N.: Asian dust transported one full circuit around the globe, Nat. Geosci., 2, 557–560, 2009.
Wang, S. H., Lin, N. H., OuYang, C. F., Wang, J. L., Campbell, J. R., Peng, C. M., Lee, C. T., Sheu, G. R., and Tsay, S. C.: Impact of Asian dust and continental pollutants on cloud chemistry observed in northern Taiwan during the experimental period of ABC/EAREX 2005, J. Geophys. Res.-Atmos., 115, D00K24, https://doi.org/10.1029/2009JD013692, 2010.
Wang, S. H., Tsay, S. C., Lin, N. H., Hsu, N. C., Bell, S. W., Li, C., Ji, Q., Jeong, M. J., Hansell, R. A., Welton, E. J., Holben, B. N., Sheu, G. R., Chu, Y. C., Chang, S. C., Liu, J. J., and Chiang, W. L.: First detailed observations of long-range transported dust over the northern South China Sea, Atmos. Environ., 45, 4804–4808, 2011.
Wang, S.-H., Hsu, N. C., Tsay, S.-C., Lin, N.-H., Sayer, A. M., Huang, S.-J., and Lau, W. K. M.: Can Asian dust trigger phytoplankton blooms in the oligotrophic northern South China Sea?, Geophys. Res. Lett., 39, L05811, https://doi.org/10.1029/2011GL050415, 2012.
Wang, Y., Zhuang, G. S., Sun, Y., and An, Z. S.: Water-soluble part of the aerosol in the dust storm season – evidence of the mixing between mineral and pollution aerosols, Atmos. Environ., 39, 7020–7029, 2005.
Wang, Y., Zhuang, G. S., Sun, Y. L., and An, Z. S.: The variation of characteristics and formation mechanisms of aerosols in dust, haze, and clear days in Beijing, Atmos. Environ., 40, 6579–6591, 2006.
Wu, Y., Han, Z., Nazmi, C., Gross, B., and Moshary, F.: A trans-Pacific Asian dust episode and its impacts to air quality in the east coast of U.S., Atmos. Environ., 106, 358–368, 2015.
Yao, X., Chan, C. K., Fang, M., Cadle, S., Chan, T., Mulawa, P., He, K., and Ye, B.: The water-soluble ionic composition of PM2.5 in Shanghai and Beijing, China, Atmos. Environ., 36, 4223–4234, 2002.
Yuan, H., Wang, Y., and Zhuang, G.: The simultaneous determination of organic acid, MSA with inorganic anions in aerosol and rainwater by ion chromatography, J. Instrum. Anal., 6, 6–12, 2003 (in Chinese).
Yuan, H., Zhuang, G. S., Li, J., Wang, Z. F., and Li, J.: Mixing of mineral with pollution aerosols in dust season in Beijing: Revealed by source apportionment study, Atmos. Environ., 42, 2141–2157, 2008.
Zaizen, Y., Naoe, H., Takahashi, H., and Okada, K.: Modification of Asian-dust particles transported by different routes – A case study, Atmos. Environ., 97, 435–446, 2014.
Zhang, W. J., Zhuang, G. S., Huang, K., Li, J. A., Zhang, R., Wang, Q. Z., Sun, Y. L., Fu, J. S., Chen, Y., Xu, D. Q., and Wang, W.: Mixing and transformation of Asian dust with pollution in the two dust storms over the northern China in 2006, Atmos. Environ., 44, 3394–3403, 2010.
Zhao, B., Wang, S., Dong, X., Wang, J., Duan, L., Fu, X., Hao, J., and Fu, J.: Environmental effects of the recent emission changes in China: implications for particulate matter pollution and soil acidification, Environ. Res. Lett., 8, 024031, https://doi.org/10.1088/1748-9326/8/2/024031, 2013.
Zhao, J., Zhang, F., Xu, Y., Chen, J., Yin, L., Shang, X., and Xu, L.: Chemical Characteristics of Particulate Matter during a Heavy Dust Episode in a Coastal City, Xiamen, 2010, Aerosol Air Qual. Res., 11, 300–309, 2011.
Zhao, T. L., Gong, S. L., Zhang, X. Y., Blanchet, J. P., Mckendry, I. G., and Zhou, Z. J.: A Simulated Climatology of Asian Dust Aerosol and Its Trans-Pacific Transport. Part I: Mean Climate and Validation, J. Climate, 19, 88–103, https://doi.org/10.1175/JCLI3605.1, 2006.
Zhuang, G. S., Yi, Z., Duce, R. A., and Brown, P. R.: Link between Iron and Sulfur Cycles Suggested by Detection of Fe(Ii) in Remote Marine Aerosols, Nature, 355, 537–539, 1992.
Zhuang, G. S., Guo, J. H., Yuan, H., and Zhao, X. J.: The compositions, sources, and size distribution of the dust storm from China in spring of 2000 and its impact on the global environment, Chinese Sci. Bull., 46, 895–901, 2001.