the Creative Commons Attribution 3.0 License.
the Creative Commons Attribution 3.0 License.
Atmospheric new particle formation at the research station Melpitz, Germany: connection with gaseous precursors and meteorological parameters
Johannes Größ
Amar Hamed
André Sonntag
Gerald Spindler
Hanna Elina Manninen
Tuomo Nieminen
Markku Kulmala
Urmas Hõrrak
Christian Plass-Dülmer
Alfred Wiedensohler
Wolfram Birmili
This paper revisits the atmospheric new particle formation (NPF) process in the polluted Central European troposphere, focusing on the connection with gas-phase precursors and meteorological parameters. Observations were made at the research station Melpitz (former East Germany) between 2008 and 2011 involving a neutral cluster and air ion spectrometer (NAIS). Particle formation events were classified by a new automated method based on the convolution integral of particle number concentration in the diameter interval 2–20 nm. To study the relevance of gaseous sulfuric acid as a precursor for nucleation, a proxy was derived on the basis of direct measurements during a 1-month campaign in May 2008. As a major result, the number concentration of freshly produced particles correlated significantly with the concentration of sulfur dioxide as the main precursor of sulfuric acid. The condensation sink, a factor potentially inhibiting NPF events, played a subordinate role only. The same held for experimentally determined ammonia concentrations. The analysis of meteorological parameters confirmed the absolute need for solar radiation to induce NPF events and demonstrated the presence of significant turbulence during those events. Due to its tight correlation with solar radiation, however, an independent effect of turbulence for NPF could not be established. Based on the diurnal evolution of aerosol, gas-phase, and meteorological parameters near the ground, we further conclude that the particle formation process is likely to start in elevated parts of the boundary layer rather than near ground level.
- Article
(7388 KB) - Full-text XML
- BibTeX
- EndNote


Atmospheric aerosol particles have been recognised as one of the major uncertainties in predicting atmospheric radiative forcing and thus future climate (IPCC, 2013). As a first effect, aerosol particles influence the Earth's radiation balance by scattering and absorbing solar radiation directly (Haywood and Boucher, 2000). Second, aerosol particles act as cloud condensation nuclei (CCN) and thus modify the radiative properties of cloud droplets in various ways (Lohmann and Feichter, 2005). The most influential aerosol effects are thought to be those related to changes in terrestrial temperature and precipitation patterns. Besides climate, atmospheric aerosol particles play a crucial role in the assessment of air quality and their adverse effects upon human health (Pope et al., 2006). Due to the complex interactions involved in the life cycle of aerosol particles, research has started with a highly integrated approach to elucidate aerosol climate effects across different temporal and spatial scales (Kulmala et al., 2011).
The nucleation of aerosol particles from gaseous precursors is one of the most important sources of atmospheric particle number. The formation of new aerosol particles in the atmosphere has been shown to occur in almost any atmospheric environment around the world (Weber et al., 1999; Kulmala et al., 2004; Jeong et al., 2010). Considerable efforts have been expended to make the smallest atmospheric particles (around 1 nm in diameter) and some of their properties visible by instrumentation (Sipilä et al., 2014). The body of atmospheric and laboratory studies has clearly identified sulfuric acid as a key precursor for atmospheric particle nucleation (Paasonen et al., 2010), although the nucleation rates obtained from field and laboratory observations have been reconciled only recently (Sipilä et al., 2010). Laboratory work suggests that the acid–base interaction, such as that found between sulfuric acid and ammonia, may play a crucial role in the stabilisation of molecular clusters under conditions relevant for the troposphere (Almeida et al., 2013; Schobesberger et al., 2015).
Important open questions remain: for example, the relevance of ion-induced formation and growth (Manninen et al., 2010; Yu and Turco, 2011) or the involvement of organic molecules in the nucleation process (Riccobono et al., 2014). Several works strongly suggested looking at the atmospheric particle formation process from a micrometeorological perspective, including the role of turbulent fluctuations (Easter and Peters, 1994; Nilsson et al., 2001). These ideas have not substantiated, for example in the form of widely applicable models.
The lifetime of freshly formed ultrafine particles and thus their chance to make a further impact on the radiative balance and the budget of CCN (cloud condensation nuclei) crucially depends on their ability to grow to larger diameters. Only rapid growth by condensation can prevent the particles from being lost by coagulation with bigger particles (Kerminen and Kulmala, 2002; Riipinen et al., 2011). An assessment of the climate effects induced by atmospheric nucleation thus requires accurate descriptions of the nucleation process itself (on a molecular level) and the subsequent growth of the nucleation-mode particles into the Aitken and accumulation mode.
For computational reasons, large-scale atmospheric models generally use parameterisations of particle nucleation and growth processes (Spracklen et al., 2010). Aerosol particle growth due to the condensation of organic precursors is often treated in highly simplified form. The chemical transport model GEOS-Chem-TOMAS (D'Andrea et al., 2013), for example, assumes that 10 % of monoterpene emissions will convert to secondary organic aerosol (SOA). The model then distributes this material onto the existing sectional size distribution according to either the mass in each section (thermodynamic limit) or the Fuchs-corrected surface area (kinetic limit). The work of D'Andrea et al. (2013) includes even a variant in which the growth of particles by SOA condensation is highly size dependent in the nucleation-mode size range based on experimental evaluations (Häkkinen et al., 2013). The rough estimate of a SOA yield and the inclusion of two alternative condensation mechanisms reflect the considerable uncertainties in current knowledge with regard to the condensational growth process. Overall, the degree to which particle nucleation is actually able to influence the budget of CCNs and thus terrestrial climate has to be considered highly uncertain (Kerminen et al., 2012; Westervelt et al., 2014).
Melpitz is an atmospheric research station in former East Germany where new particle formation events have been studied since 1996 (Birmili and Wiedensohler, 2000; Birmili et al., 2001). The frequency of new particle formation events at Melpitz tends to be high during the spring, summer, and autumn, with the fraction of NPF event days ranging between 30 and 50 % of all days in those seasons (Hamed et al., 2010). The average particle formation and growth rates of particles in the size range of 3–11 nm have been estimated as ∼ 10 and ∼ 4 nm h−1 in Melpitz and fall within the span of observations in the continental boundary layer (Kulmala et al., 2004). Wehner et al. (2005) emphasised the fact that sulfuric acid alone is by far not sufficient to explain the subsequent growth of the nucleation-mode particles. Hamed et al. (2010) suggested a connection between the observed decreasing trends in SO2 concentrations (−65 %), the fraction of NPF events (−45 %), and the particle formation rates (−68 %) between 1996 and 2006. Conversely, the growth rates of nucleated particles increased by 22 % over that period. The delineation of these trends points to an independence of the chemical species responsible for particle nucleation and growth.
This paper revisits atmospheric new particle formation at Melpitz with a novel data set collected between 2008 and 2011. A neutral cluster and air ion spectrometer (NAIS) was used to detect aerosol particles from 2 nm in size and at a higher time resolution than previously available. For a total of 269 observation days, we examined correlations between new particle formation events and calculated proxies for gaseous precursors, ternary nucleation rates, and meteorological parameters including small-scale turbulence.
Table 1Overview of data coverage 2008–2011 encompassing four periods I–IV. The list gives the number of days for which a complete diurnal cycle of NAIS data was available. Further columns indicate the availability of additional parameters, such as the particle number size distribution from the TDMPS-APS, the H2SO4 proxy, and NH3. Also, the serial numbers of the two NAIS instruments are indicated.
2.1 The research station in Melpitz
Measurements of nucleation-mode particles and particle number size distributions were performed from 2008 to 2011 at the atmospheric research station in Melpitz, eastern Germany (51∘32′ N, 12∘54′ E; 87 ). The station is surrounded by flat grasslands, agricultural pastures, and woodlands within several tens of kilometres. No orographic obstacles or larger sources of pollution lie within the immediate vicinity of the station. The Melpitz station is a part of the observation networks WMO-GAW (World Meteorological Organization Global Atmosphere Watch), ACTRIS (Aerosols, Clouds, and Trace gases Research InfraStructure network), and GUAN (German Ultrafine Aerosol Network; Birmili et al., 2016). Atmospheric particle size distributions at Melpitz have been regarded as representative of the regional atmospheric background in Central Europe (Asmi et al., 2011). For the basic features of particle number size distributions and particle mass concentrations as a function of meteorological parameters, see Engler et al. (2007) and Spindler et al. (2010).
2.2 Instrumentation
Particle number size distributions were measured using three independent particle size spectrometers: a neutral cluster and air ion spectrometer (NAIS), mobility diameters 2.0–40 nm; a twin differential mobility particle size spectrometer (TDMPS), mobility diameters 3–800 nm; and an aerodynamic particle size spectrometer (APS), aerodynamic diameters 0.5–10 µm. Using these instruments, a total of four measurement periods were covered (see Table 1).
2.2.1 Neutral cluster and air ion spectrometer (NAIS)
The neutral cluster and air ion spectrometer (NAIS) is an extended version of the air ion spectrometer (AIS; Mirme et al., 2007). The NAIS can measure the mobility distribution of ions plus the size distribution of neutral particles, while the AIS is only able to detect naturally charged ions. For the state of the art of this instrument, see Mirme and Mirme (2013). Briefly, the NAIS uses a charging-filtering section in order to measure particles that are neutrally charged in the atmosphere. The aerosol sample passes first through a charger–discharger unit. The instrument uses unipolar corona chargers for both charging and charge neutralisation. The neutraliser is also called the discharger. Charged particles are classified in the multichannel differential mobility analyser (DMA). The electric current carried by the particles is recorded by individual electrometrical amplifiers. The charged fraction of particles induced in the aerosol sample is estimated from the Fuchs theory (Fuchs and Sutugin, 1971). The corona ions generated in the unipolar charger are generally small (< 2 nm), with their exact size depending on concentration, air composition, polarity, and other factors related to particle charging (Manninen et al., 2010). Excess corona ions are removed by electrical filters and leave an instrumental size range for aerosol particle classification between 2 and 40 nm that can be interpreted as originally atmospheric particles with confidence (Asmi et al., 2009). The NAIS features two multichannel differential mobility analysers for detecting positively and negatively charged particles, respectively. By switching between different measurement modes, the NAIS can measure the mobility distribution of particles after positive and negative charging (“particle mode”) and also the mobility distribution of naturally charged particles and small ions (“ion mode”).
During our experiments two individual NAIS instruments were used. The instrument NAIS-4 was deployed at Melpitz between April 2008 and August 2009. Instrument NAIS-15 was deployed from June 2010 until October 2011. The NAIS-4 was calibrated in January 2008, showing an average performance compared to four other NAIS instruments (Asmi et al., 2009). This performance could be verified in a follow-up calibration experiment in July 2009 (Gagné et al., 2011). At Melpitz, the NAIS instruments sampled ambient air through a dedicated stainless steel pipe (diameter: 3.5 cm, length: 160 cm) at a flow rate of 60 L min−1. The sampling height was about 3.5 and 1 m above the roof of the measurement container. There were no obstacles in the NAIS sampling line except a metal grid that was designed to prevent insects from entering the instrument. The analyser columns of the instrument were cleaned every 4 weeks.
2.2.2 Twin DMPS and APS
Particle number size distributions were measured with a twin differential mobility particle size spectrometer (TDMPS). This instrument follows the design principle of Birmili et al. (1999) but circulates sheath air in a closed loop in compliance with recommendations for atmospheric aerosol particle number size distribution measurements (Wiedensohler et al., 2012). Briefly, the instrument consists of two differential mobility particle analysers (Vienna type) connected to a condensation particle counter (model 3010; TSI, Shoreview, MN, USA) and an ultrafine condensation particle counter (model 3025; TSI), which encompass a total particle size range between 3 and 800 nm. A measurement cycle lasts for 10 min.
Coarse particles were measured in an aerodynamic size range between 0.8 and 10 µm using an aerodynamic particle sizer (model 3321; TSI) with the upper cut-off defined by the air inlet system. Both the TDMPS and the APS are connected to an automatic regenerating adsorption aerosol dryer (Tuch et al., 2009), which ensures relative humidities below 30 % at all times in the aerosol sample. The sampling height of the corresponding inlets was about 5 and 2.5 m above the roof of the measurement container.
2.2.3 Merging multi-instrumental particle number size distributions
The NAIS, TDMPS, and APS number size distributions were merged as follows: from 2–10 nm, NAIS data were employed exclusively. The reason is that the current Melpitz TDMPS set-up suffers from enhanced particle losses below 10 nm because these measurements have been optimised with regard to long-term stability that involves the use of a regenerative dryer upstream of the instrument (see above). The extensive sampling system ensures low relative humidities in the sampling line at all times, but also causes non-recoverable particle losses at the lower tail of the TDMPS particle size distribution.
In the size range 10–20 nm, the NAIS and TDMPS number size distributions were cross-faded into each other using linear mixing as a function of logarithmic diameter between 10 nm (only NAIS) and 20 nm (only TDMPS). Above 20 nm, the NAIS size distributions become increasingly unreliable because the data inversion of that instrument does not take into account the multiple charges from particles bigger than 40 nm due to the limited size range of the instrument. Between 20 and 800 nm, TDMPS data were used exclusively, which exhibit their greatest reliability across this diameter range. Above 800 nm, APS data1 were used exclusively after converting the aerodynamic particle size distribution into a mobility particle size distribution using an effective particle density of 1.6 g cm−3.
2.2.4 Gas-phase measurements
Gaseous sulfuric acid (H2SO4) and the hydroxyl radical (•OH) were measured during an intensive measurement period of EUCAARI (European integrated project on aerosol, cloud, climate, and air interactions) by chemical ionisation mass spectrometry (CIMS; Berresheim et al., 2002). These measurements at Melpitz lasted from 1 to 31 May 2008. To make an estimate of H2SO4 for other periods, we calculated a proxy, which was determined on the basis of this 1-month data set. SO2 concentrations were measured by ultraviolet (UV) fluorescence using an APSA-360A gas analyser (Horiba; Kyoto, Japan). Ammonia concentrations were measured by MARGA (continuous Monitoring of AeRosol and GAses in ambient air; Metrohm Applikon B.V., Schiedam, the Netherlands).
2.2.5 Meteorological measurements and data
Local meteorological parameters, including temperature, pressure, relative humidity, horizontal wind speed, and wind direction, are collected at Melpitz on a routine basis. During an intensive campaign in 2010, 3-D wind speed was additionally measured on a mast of 6 m height using a sonic anemometer (model USA-1; METEK GmbH, Elmshorn). The sampling frequency of that instrument was 1 Hz. From these data, the turbulent heat flux and the turbulent kinetic energy (TKE) were calculated for 15 min intervals. Meteorological back trajectories were determined by the Hybrid Single Particle Lagrangian Integrated Trajectory (HYSPLIT) model provided by the US NOAA Air Resources Laboratory.
2.3 Chemical mass balance model for sulfuric acid
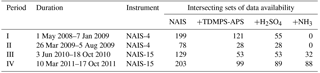
Gaseous sulfuric acid (H2SO4) and hydroxyl radicals (•OH) were only measured from 1–31 May 2008 (EUCAARI 2008). To scrutinise the relationship between H2SO4 and newly formed particles for the longer time period 2008–2011, the H2SO4 concentrations were estimated using a chemical mass balance model driven by solar radiation as a source of •OH. A proxy for [H2SO4] under daytime conditions will need, in a first step, a proxy for [•OH]. Rohrer et al. (2006) showed that there is a close relationship between [•OH] and the UV solar flux. The latter is closely correlated with global solar irradiance (Boy and Kulmala, 2002). Figure 1 shows the corresponding relationship between the global radiation flux and [•OH] for EUCAARI 2008 at Melpitz. On the basis of such a correlation, we devised the linear function
with Rad being global solar irradiance in W m−2 measured by a pyranometer and [•OH] the hydroxyl radical concentration measured by CIMS in cm−3. The proportionality parameter A was derived by linear regression, yielding a value of 6110 .
In a second step, H2SO4 concentrations were estimated using a modified version of the chemical mass balance model introduced by Weber et al. (1997).
This mass balance assumes that OH radical attack on SO2 is the process governing the production rate of H2SO4. Here, [•OH] is the hydroxyl radical concentration estimated from Eq. (1) in cm−3, [SO2] the measured sulfur dioxide concentration in cm−3, B a constant related to the reaction rate of the two above-mentioned species, and CS the condensation sink (Pirjola et al., 1999) in s−1. Here, CS was calculated from the particle number size distribution 3 nm–10 µm adjusted to ambient relative humidity. The hygroscopicity growth law necessary for this adjustment was derived from 1 year of hygroscopicity analyser measurements at Melpitz and is shown in Appendix A.

Figure 2Definition of the H2SO4 proxy based on the correlation of experimental and calculated values during EUCAARI 2008 (see also Eq. 2).
The term B[•OH][SO2] represents the production term of H2SO4 and CS is the loss term of H2SO4 by condensation onto the pre-existing particle population. The parameter B was derived by regression analysis of measured and estimated [H2SO4] for 9 days of data during the EUCAARI 2008 campaign (Fig. 2). Linear regression analysis yielded a value of 2.79 × 10⁻¹² cm3 s−1 for B. It is worth noting that the parameter B seems to depend significantly on the observation site. Petäjä et al. (2009) notably obtained a value of 8.6 × 10⁻¹⁰ cm3 s−1 for the boreal forest site Hyytiälä, Finland.
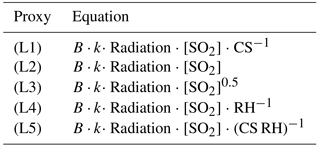
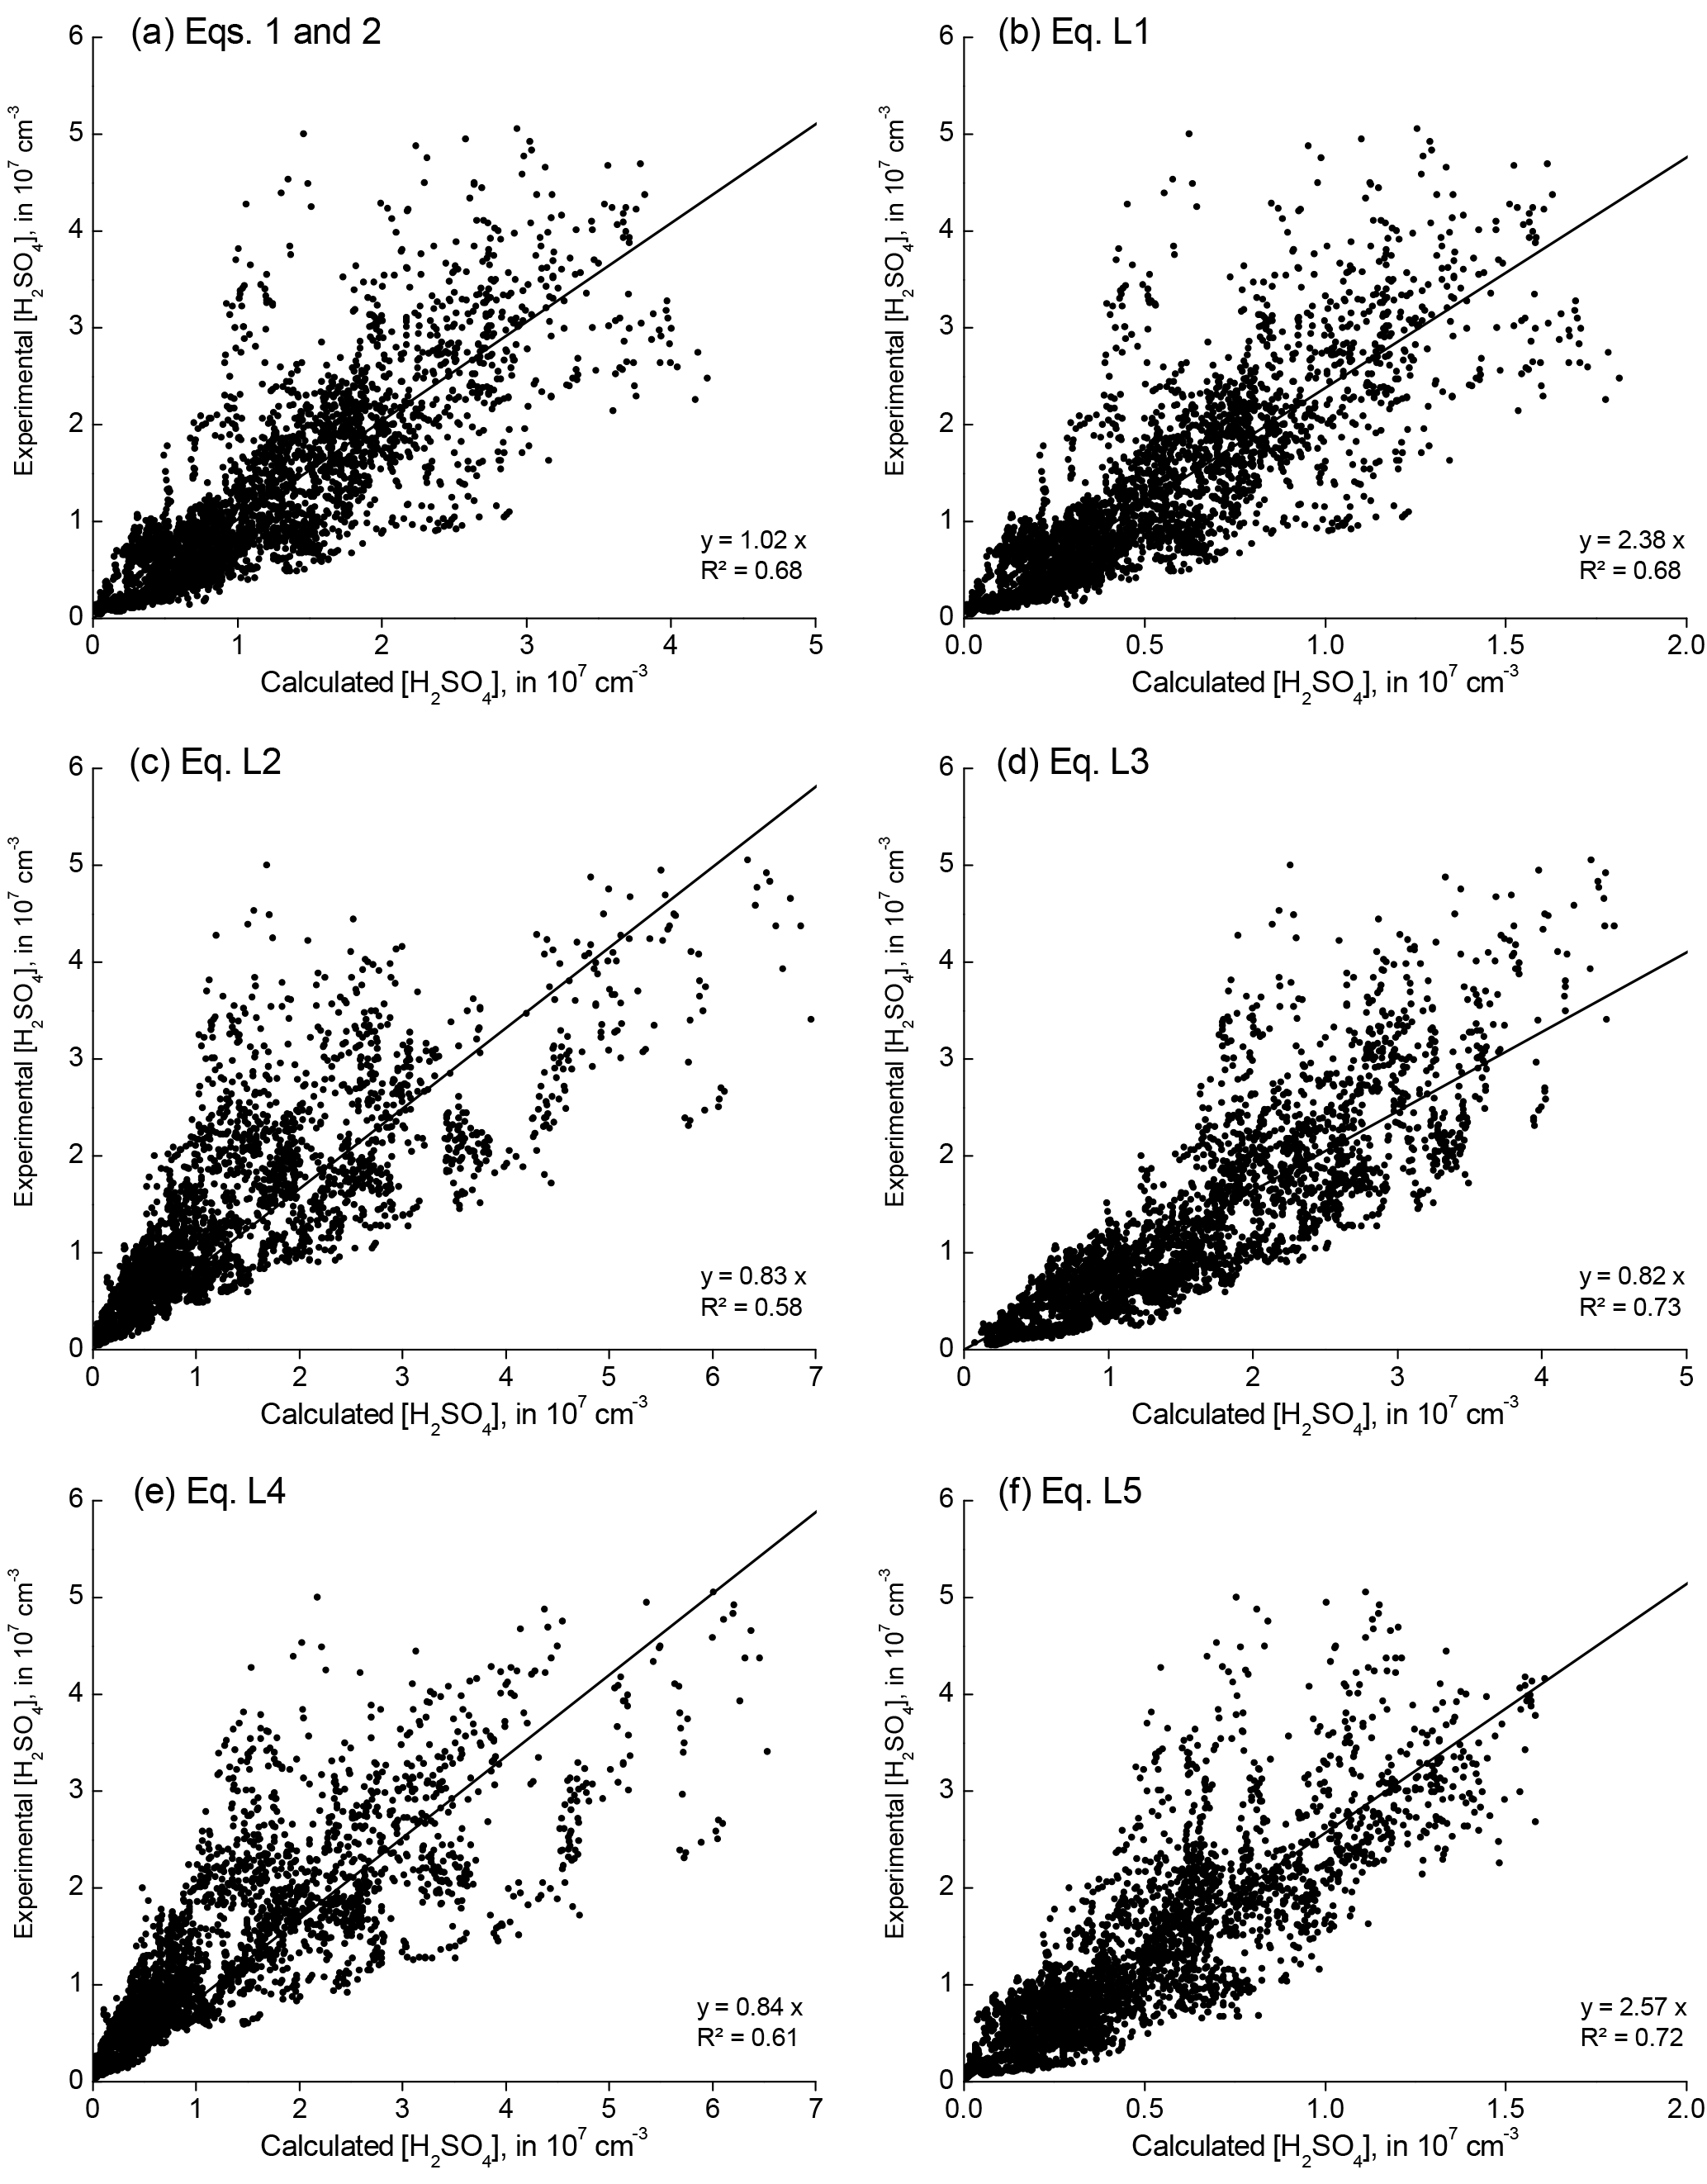
For reasons of consistency, this H2SO4 parameterisation was compared with proxy expressions used in previous work, particularly Mikkonen et al. (2011). Those authors performed an analysis of various linear and non-linear expressions for a H2SO4 proxy based on the same data set from Melpitz. For completeness, we reiterate these linear proxy expressions in Table B1 in Appendix B. The correlation results using these linear expressions are given in Fig. B1.
Mikkonen et al. (2011) concluded that their formula (L3) provided the best fit for the Melpitz EUCAARI 2008 data set. For this work, however, we preferred Eq. (2) for two reasons. First, it simulates CS from the particle size distribution (2 nm–10 µm) after adjustment to ambient relative humidity. (Mikkonen's proxies used CS on the basis of a dry particle number size distribution.) Second, Eq. (2) is based on a mass balance calculation that is assumed to be valid at least for daytime conditions and avoids some cross-sensitivities and non-linear dependencies that lack a mechanistic explanation.
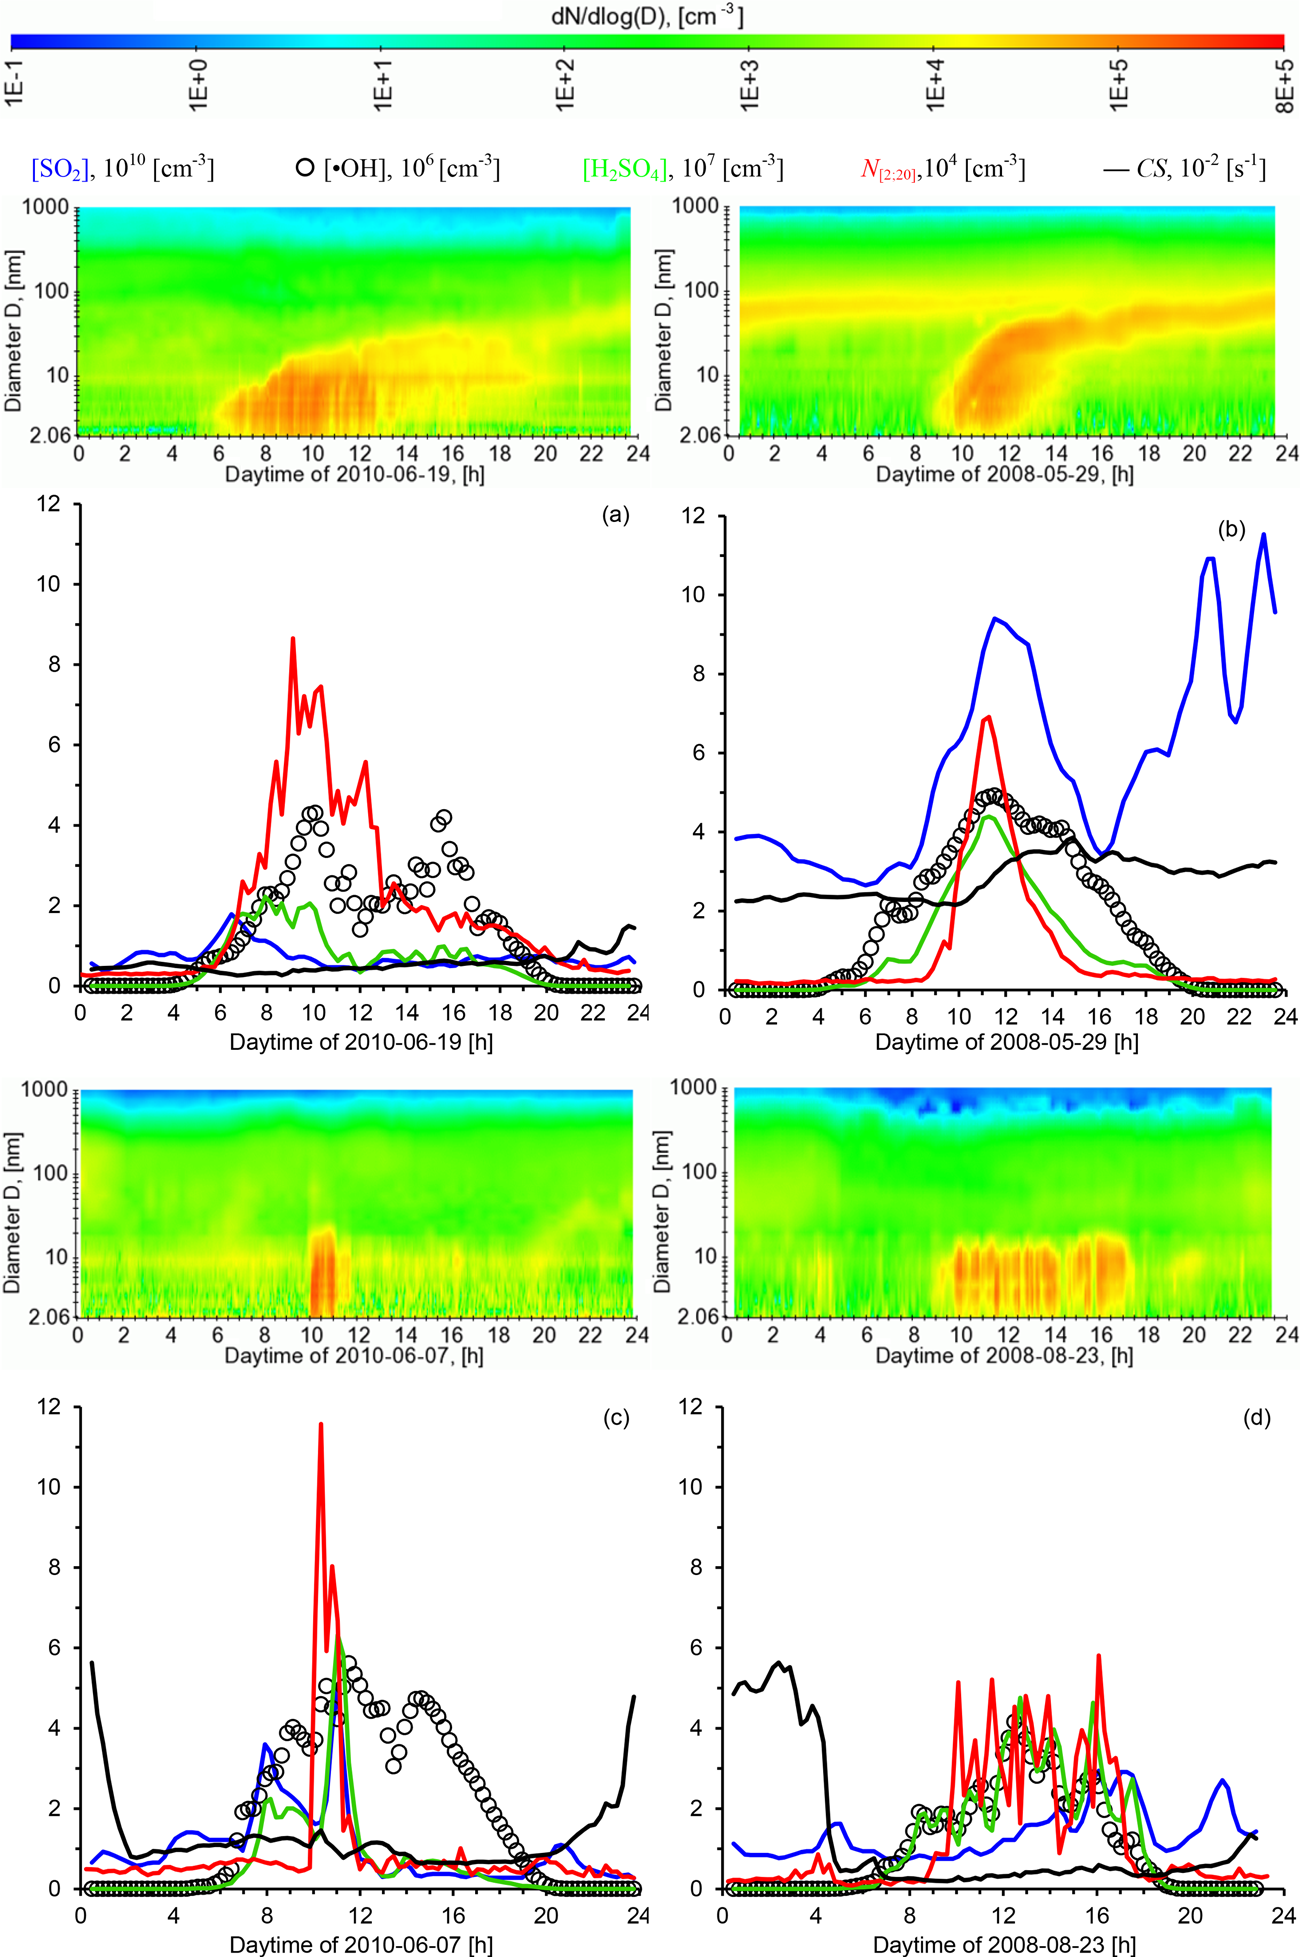
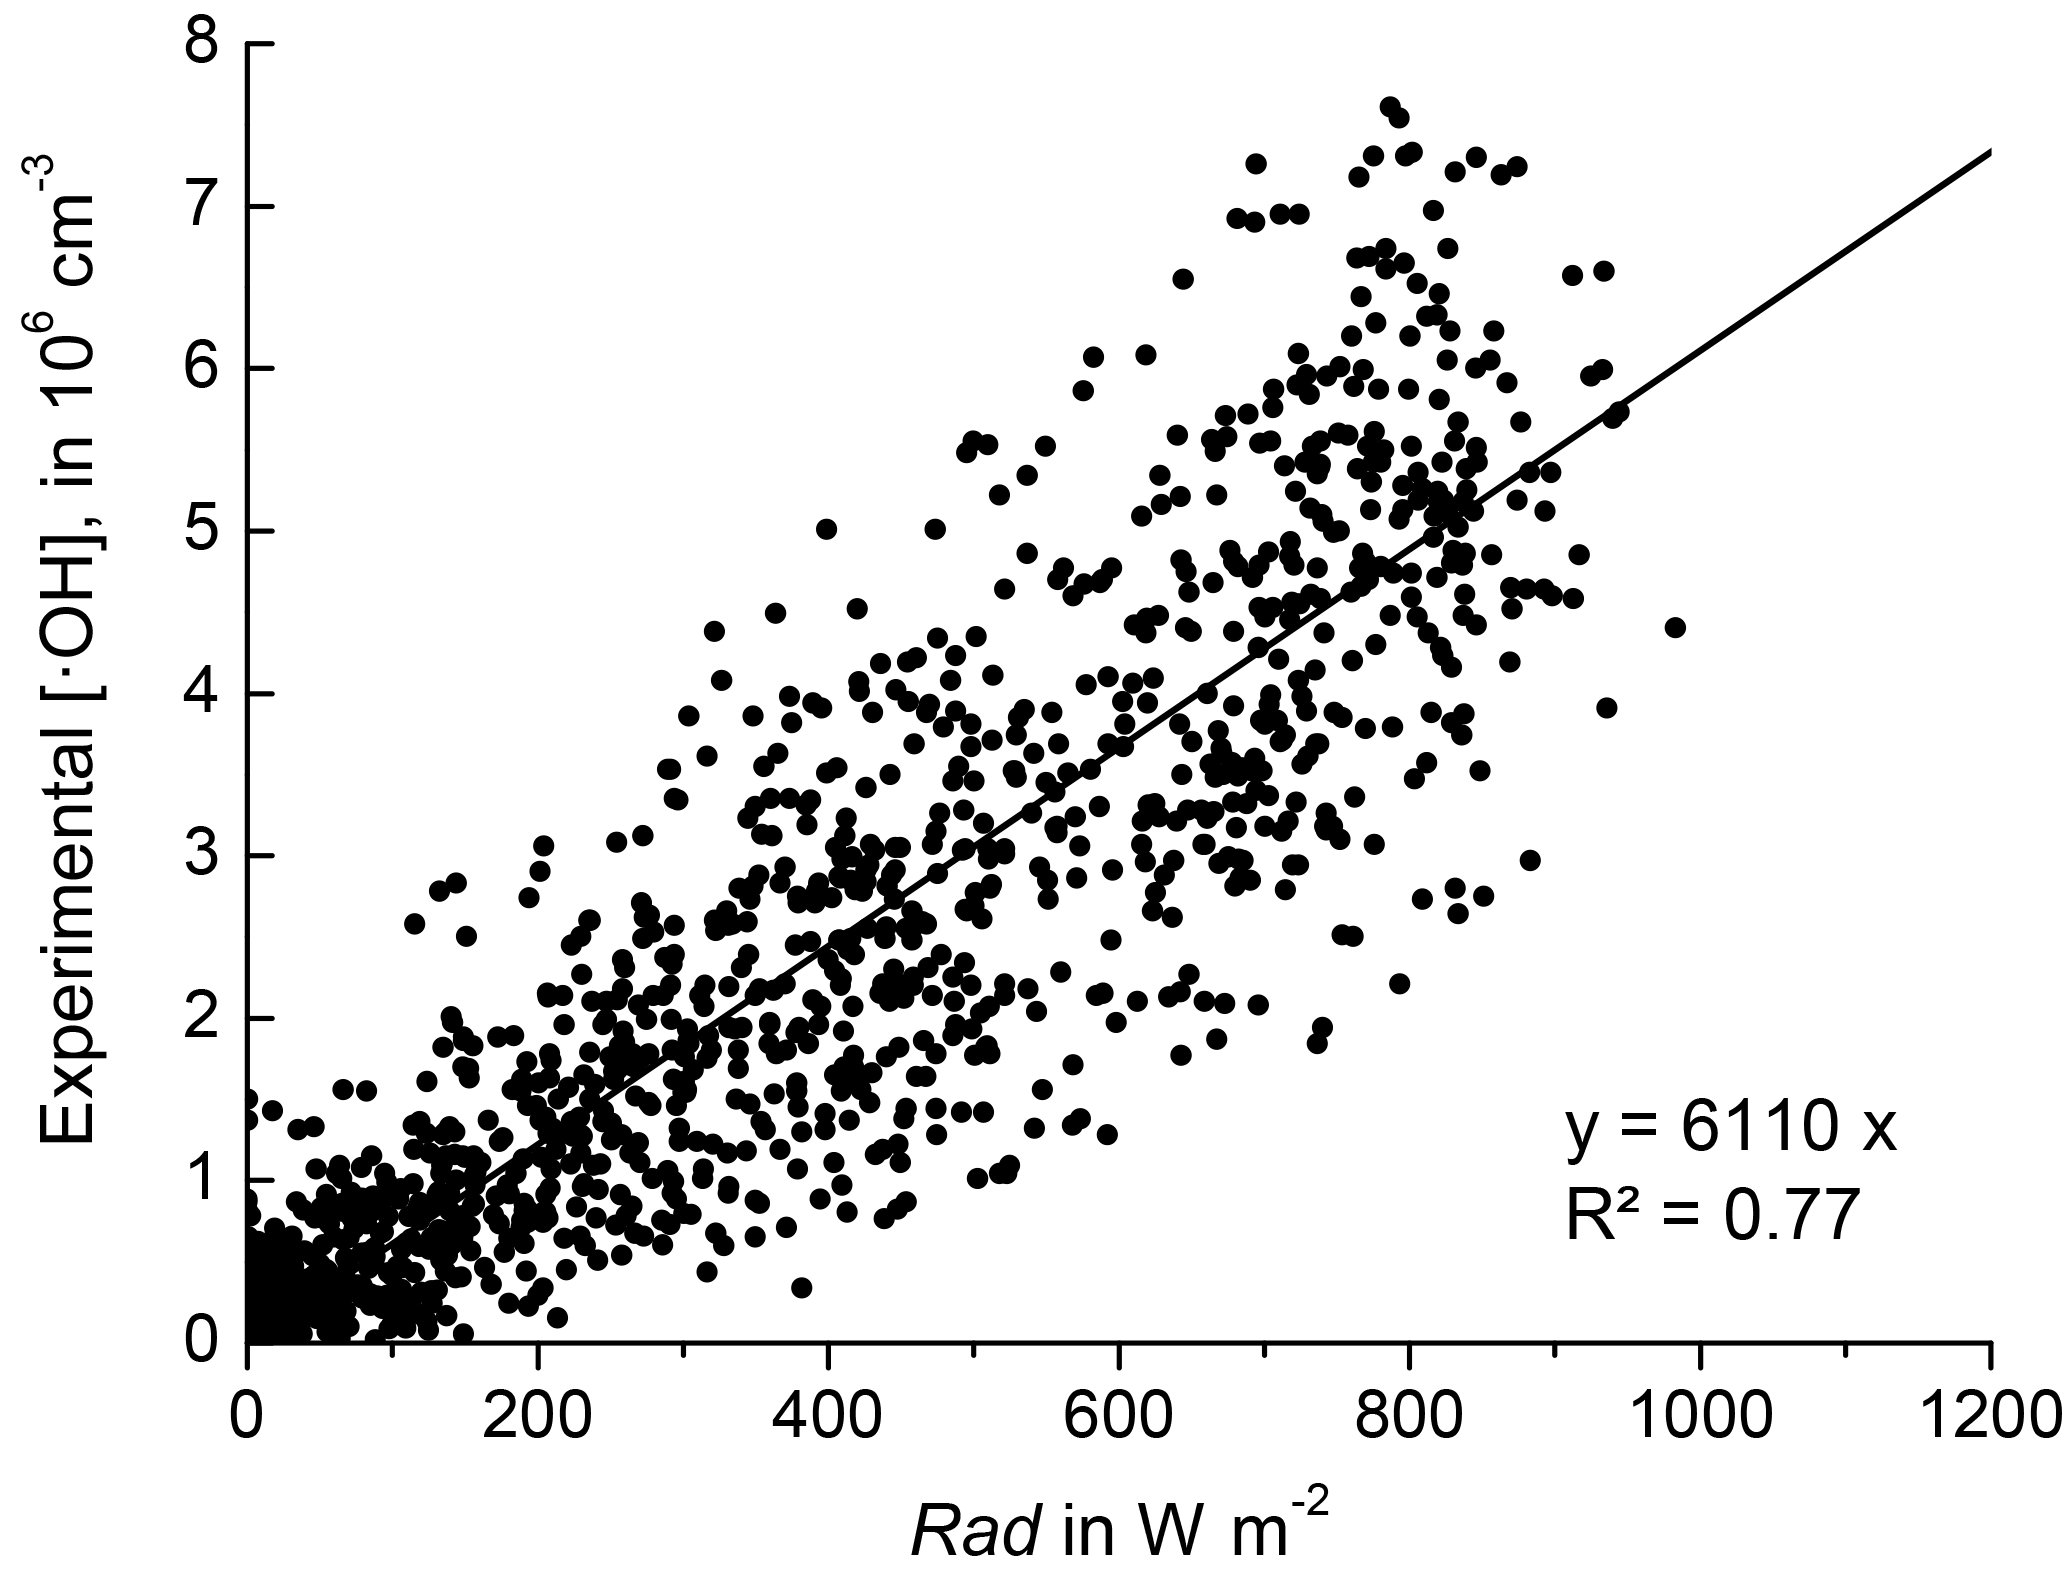
Figure 3Time series of aerosol and gas-phase parameters during four exemplary NPF events: (a) 19 June 2010, (b) 29 May 2008, (c) 7 June 2010, (d) 23 August 2008. Shown are particle number size distributions, the concentrations of sulfur dioxide SO2, the hydroxyl radical •OH, sulfuric acid H2SO4, ultrafine particle number N[2;20], and the condensational sink CS.
Figure 3 presents four cases of new particle formation (NPF) events at Melpitz covering a range of different observations. Contour diagrams show the particle number size distribution (2–1000 nm), the number concentration of freshly produced particles N[2;20] (aggregated from the NAIS and TDMPS data), the condensational sink (CS), and the gas-phase concentrations of SO2, •OH, and H2SO4. The four NPF events were chosen so that they represent a certain range of observations that are typical for Melpitz based on our subjective judgement. The diurnal course of solar radiation, including sunrise and sunset, can be tracked by the calculated •OH concentrations.
3.1 Case 1: NPF and subsequent growth under clean conditions
Figure 3a shows an NPF event on 19 June 2010 when particle formation and subsequent growth up to diameters around 50 nm was clearly visible. The NPF event started around 06:00 CET in a clean Atlantic air mass, as confirmed by back trajectories. CS was constantly low throughout the day, as was [SO2]. Until 10:00 CET, the sky was cloudless, leading to •OH concentrations calculated from Eq. (1) of around 4 × 106 cm−3. The combination of an ideal solar radiation flux, low CS, and low [SO2] (1–2 × 1010 cm−3) yielded moderate calculated concentrations of H2SO4 around 2 × 107 cm−3. This case is an example in which variations in the production rate of H2SO4 correlate with the variations in [•OH], while the concentrations in [SO2] remain almost constant. In the event classification to follow in Sect. 4, this event was classified as a Class I particle formation event.
3.2 Case 2: NPF and subsequent growth under polluted conditions
Like above, the NPF event on 29 May 2008 was marked by a pronounced particle growth up to around 70 nm (Fig. 3b). But in comparison to Case 1, significantly higher levels of both SO2 and CS prevailed. Figure 3b shows the trace of an Aitken mode (diameter around 60–100 nm) from the preceding day, which remains visible after the onset of NPF at 09:00 CET. Back trajectory analysis confirmed the presence of continental air originating from easterly directions. On this day, the high H2SO4 concentrations are caused primarily by the high level of SO2. CS was nearly constant before and during the onset of the NPF event and supposedly played a minor role in NPF and subsequent particle growth. In Sect. 4 this event is also classified as a Class I particle formation event.
3.3 Case 3: short-lived stationary NPF event
This case from 7 June 2010 represents a class of short-lived nucleation events, i.e. shorter than 2 h in duration (Fig. 3c). The NPF event started at 10:00 CET and was associated with a short peak in SO2. The size range from 2 to 20 nm was uniformly filled with aerosol particles and no growth was observed. Solar radiation produced [•OH] levels with a maximum around 5 × 106 cm−3 even later, but the reason for the cut-off of the NPF event was likely the drop in [SO2] at 12:00 CET. Back trajectory analysis suggested the advection of a clean maritime air mass from north-westerly directions. CS showed moderate values around 0.01 s−1 during daytime, but elevated values up to about 0.05 s−1 during nighttime.
3.4 Case 4: long-lived stationary NPF event
Like Case 3, this event from 23 August 2008 was characterised by a lack of particle growth (Fig. 3d). However, the duration of the NPF event was considerably longer than in Case 3, between 09:00 and 17:00 CET. Such observations are thought to be the result of a continuous influence by a stationary source or process. On this day, rather clean air from westerly directions prevailed with CS below 0.005 s−1 after 05:00 CET like in Case 1. Solar radiation and calculated [•OH] were fluctuating due to changes in cloudiness. It might be worth noting that just before, CS dropped from its considerably higher nighttime level of 0.04 s−1 due to a change from a continentally influenced towards a maritime-influenced air mass. We are not aware of any nearby anthropogenic sources of particles which could explain this behaviour.
3.5 Patterns and shapes of NPF events
The case studies reveal that NPF events at Melpitz occur in a great variety of patterns and shapes. One basic reason for this variety is the stationary nature of the measurements at a single point, which is shared by many comparable observations at other fixed sites. During the measurement, air masses of more or less diverging composition blow past the measurement site. Melpitz is located in Central Europe, a region where spatial gradients in air composition are a regular feature. Only if the wind speed is low compared to the spatial inhomogeneities of the air mass, one can expect an idealistic observation of new particle formation and subsequent growth. Besides air mass changes due to advection, the atmosphere almost always involves vertical mixing during the periods of NPF events due to convection aroused by intense solar radiation. If the air aloft contains different concentrations of trace gases and/or aerosol particles, concentrations near the ground will inevitably change even during the NPF process. Surprisingly, these issues only play a marginal role in the wide body of literature on experimental NPF studies. It therefore represents a great challenge to examine and quantify the ongoing processes simply on the basis of ground-based measurements. While efforts have been made to characterise the atmosphere during NPF events vertically and spatially (Stratmann et al., 2003), such efforts will only yield a limited number of observations and usually a restricted set of parameters that can technically be measured on an airborne platform. To examine the statistical relevance of the NPF process, long-term data sets are needed, which inevitably require some categorisation or classification. The next chapter is therefore dedicated to the classification of NPF events at Melpitz by making use of the extended set of aerosol parameters available.
4.1 Objectives of NPF event classification
Identifying and classifying NPF events is typically done with two intentions in mind:
-
examining the circumstances of fresh particle formation (i.e. gas-phase chemical, meteorological)
-
and evaluating the potential of NPF events to deliver total particle number concentration, CCN number concentration, and radiative forcing effects.
The main objective in this paper is to examine aspect (1), the circumstances of fresh particle formation. Our classification described in Sect. 4.2 is sensitive towards both high numbers of fresh particles (N[2;20]) and long durations of NPF events. The filter distinguishes events in which plenty of small particles occurred and/or that happened over a long duration. All events shown in Fig. 3 performed well under this method. For the purpose of examining aspect (1) we consider the filter adequate.
Aspect (2), i.e. questions regarding particle growth, CCN, and how many Aitken particles and optically active particles will be produced as a result of NPF, is another issue. While this aspect might ultimately be more relevant for climate and health implications than aspect (1), this needs a more extended analysis that would be beyond the scope of this paper. In this work we took major advantage of the NAIS instrument, which provides concentrations of particles down to 2 nm that are most suited to investigate aspect (1).
4.2 The convolution integral method
To examine gas-phase precursor and meteorological effects as a function of new particle formation (NPF) intensity, we developed a new method to classify the set of measured NPF events. The method is based on a convolution integral (CI) of time series of the number concentration of freshly nucleated particles (N[2;20]). The convolution integral is defined as
where f(t) is the time series of N[2;20], as averaged from a number of 27 manually selected NPF events, and g(t) the measured time series of N[2;20]; τ is a time lag between the two time series. The 27 selected NPF events featured very high peak values of N[2;20] and subsequent particle growth during a few hours. See Fig. C1 and Table C1 in Appendix C for the complete characteristics of the 27 events with respect to N[2;20]. The two events in Fig. 3a and b are representatives of this selection, with nucleation-mode particles growing to about 70 nm at midnight and eventually to about 90 nm on the next day.
The motivation behind the convolution integral (CI) method is to enable the automatic detection and classification of the NPF events. The CI function represents a simple time series in which NPF events can be detected as peaks in that series. The height of the peaks in the CI function is sensitive towards both the number concentration of new particles (N[2;20]) occurring during an event and the time duration of an event. Besides an automatic detection of the time window when NPF occurred, it is possible to objectively rank the detected NPF events according to the height of the detected peaks. The computation of the convolution integral also avoids some aspects that make the classification of NPF events problematic: (1) due to the finite width of the f(t) function, the CI function includes a smoothing of the original time series, which averages out possible experimental noise or very short-lived peak concentrations. This might help make the detection of NPF events more representative in that it captures the more significant events. (2) Any experimental data set might feature different time resolutions and limitations like data gaps. The CI method is able to even out such differences between different data sets in that it yields a standardised CI function on a regular time grid, which can be compared, for example, among different sites.
The weight function f(t) was calculated as an average of these 27 time series of N[2;20], with all time series centred around their peak value before averaging. In time, f(t) contains experimental values from 5 h prior to the maximum in N[2;20] to 10 h after. Outside this interval, f(t) was set to zero. No normalisation was made to the amplitude of N[2;20].
The 27 NPF events were selected to provide a realistic initialisation to the CI method. Of all properties of the function f(t), its width (relative to the timescale) is probably the most salient property. (The width of f(t) is visible as the red curve in Fig. C1.) Of all peaks in the original time series g(t) (N[2;20]), those peaks that have a similar width as f(t) will obtain a maximum response in the CI function in relation to their peak area. (This is a consequence of Eq. 3.) The width of f(t) is thus more important than its height because the height will come to effect in a multiplicative manner for all NPF events, while the width gains numerical relevance for such NPF events whose peak width in g(t) is the same or bigger than the width of f(t). The CI integral method will favour, in its ranking, events of such characteristics. For this reason, we selected the 27 most outstanding events (from visual inspection) with respect to both N[2;20] and also the continuous evolution of a new nucleation mode for a long duration as much as possible. We thought that these events are the ones that this analysis should ideally be looking for, although we would not aim to exclude other patterns of NPF events by default. As a matter of fact, the CI method will classify any day of observations on a continuous scale of CI ranging between values close to 0 and Max(CI). We are aware that the CI integral method might provide different results if, for instance, only very short-duration events are chosen. Such a choice would push NPF events with higher peak N[2;20] concentrations (even if only short-lived) higher in the ranking.

Figure 4Exemplary time series of the convolution integral CI from 16–30 May 2011 indicating the intensity of new particle formation.
In a second step, the time series of the CI was analysed for peak values. CI reaches a peak at the times when the peaks of f(t) and g(t) coincide. Because CI is calculated as an integral over concentration and time, higher peak values are reached when the NPF event represented by g(t) extends in time (cf. Fig. 3a, b) rather than being a short-lived event (Fig. 3c). This means that CI is not only sensitive to the absolute peak values of N[2;20] but also to the duration of the NPF event. Figure 4 illustrates a sample of the time series of CI with maximum values attained during midday, i.e. when NPF events take place.
In a third step, the peaks in CI(t) were detected and their peak values CIpeak subsequently classified according to their magnitude. Only the NPF events with peaks in CI occurring between sunrise and sunset were taken into account, i.e. those that can apparently be related to photochemical processes. (In fact, no significant nucleation was observed in Melpitz outside this period.) Figure 5 presents all peaks identified between sunrise and sunset as a function of time of day. As discussed before, the peak height is a combined measure of the attained particle number concentration N[2;20] and the event duration.
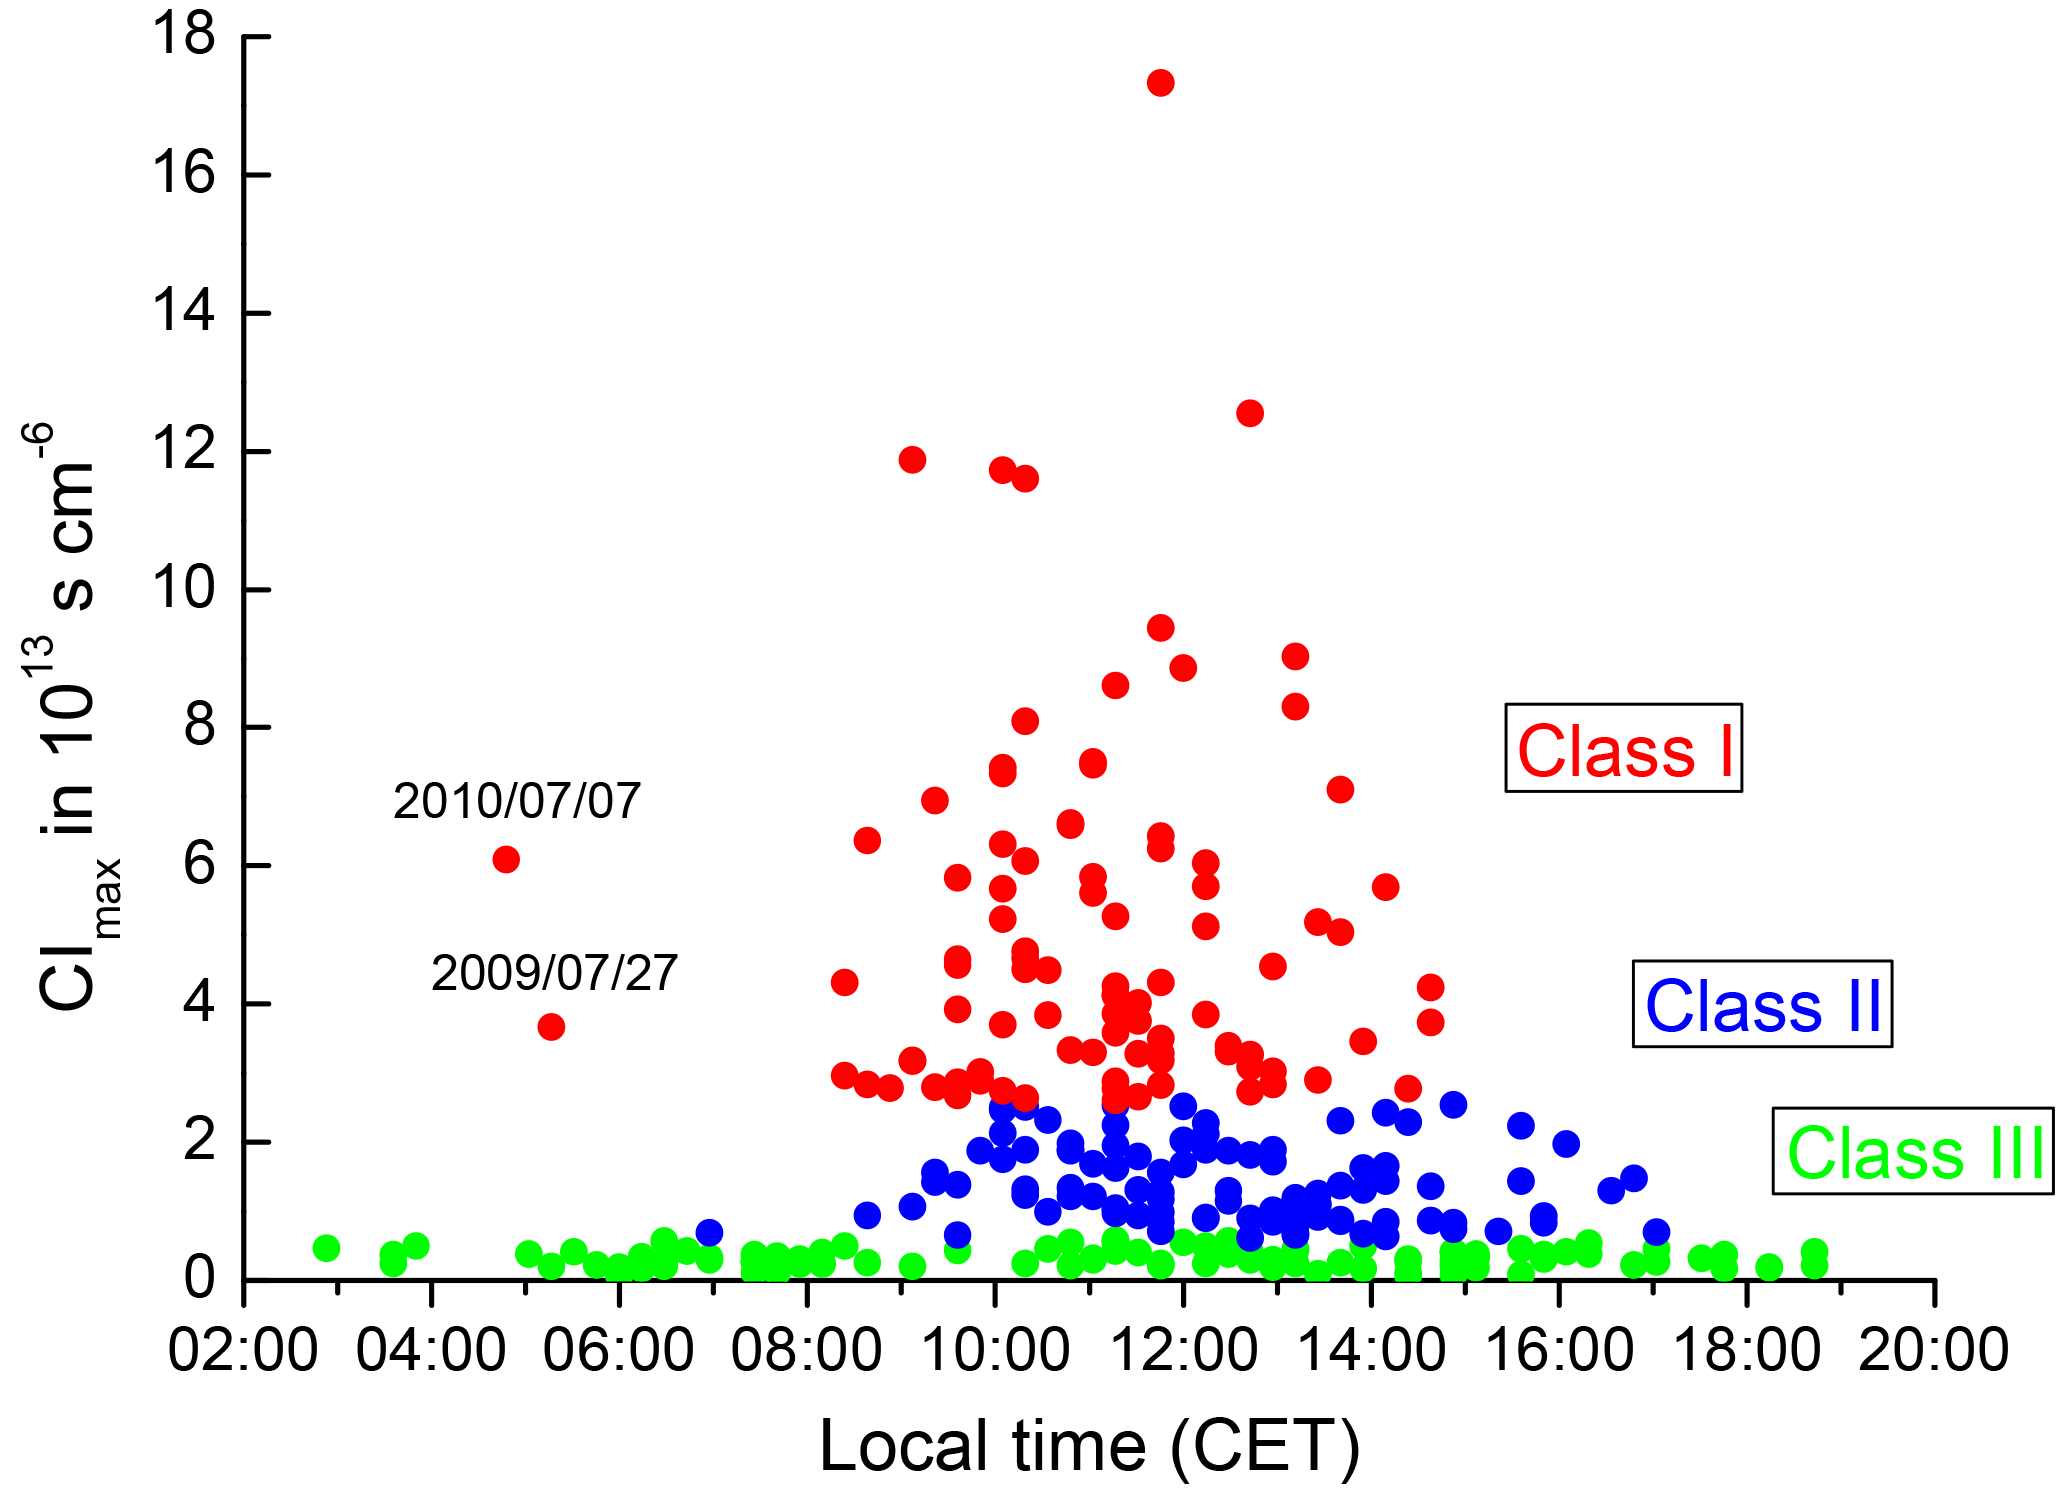
Figure 5Daily maximum of the convolution integral CI for all observation days as a function of the time of day of that maximum. Event classes were defined as Class I (red, intense new particle formation), Class II (blue, new particle formation at lower intensity), and Class III (green, NPF below significance level). See Table 2 for the exact threshold values.
Table 2Classification of NPF events according to their convolution integral peak (CImax) and two specific threshold values based on the complete NAIS-TDMPS data set.
4.3 Classification results
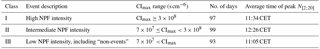
From the data cloud in Fig. 5, three event classes were defined as follows: Class I, showing CIpeak in the range 3 × 10⁸–1.2 × 10⁹ s cm−6, Class II with CIpeak in the range 7 × 10⁷–3 × 10⁸ s cm−6, and Class III with CIpeak below 7×10⁷ s cm−6 (see Table 2).
The motivation for the boundaries between the event classes is as follows: Class III represents the 83 NPF events of lowest intensity. As the NAIS instrument is very sensitive, it is able to detect short-lived peaks of small particles, even at very low concentration. In fact, a peak of N[2;20] can be defined for each day, no matter how low it might be. As can be seen from Fig. 5, these short and low peaks may take place any time between sunrise and sunset. We associate these very weak events with very small-scale particle bursts that do not evolve into a fully developed and spatially distributed nucleation event. In any case, this class of observations includes what most researchers would call “non-events”.
Class II represents 92 NPF events that take place at least a few hours after sunrise, i.e. when the atmospheric boundary layer has started to mix vertically. These events are usually longer-lived and reach higher concentrations in N[2;20]. The requirement of Class II events to surpass the threshold CIpeak = 7 × 10⁷ s cm−6 is clearly motivated by the shape of the data cloud in Fig. 5. Below this threshold, a daily maximum concentration of N[2;20] may take place any time between 02:00 and 20:00 CET, while the events above this threshold always exhibit a start time between sunrise and sunset, which is the case expected for photochemical NPF events.
Class I, in turn, represents the 94 most intense NPF events. These are always associated with high absolute values of N[2;20] and an event duration over several hours. Most of them, although not all, showed a clear particle growth pattern similar to that in Fig. 3a and b. The threshold in CIpeak between Class I and Class II events is somewhat arbitrary. In fact, we are facing a continuum of observations ranging from the lowest to the highest observations in NPF intensity. Guided by practical needs, we have attempted to create data subsets of similar dimension and have also tried to define a threshold above which the obvious particle growth pattern is a clear majority. This led to the threshold value of 3×10⁸ s cm−6.
Table 3Comparison of two classification schemes for new particle formation events: the CI method (Class I, Class II and Class III; see Table 2) and the University of Helsinki (UHEL) classification originally reported in Dal Maso et al. (2005).
4.4 Comparison with other classification methods
The introduction of a new NPF classification method requires some justification. Continuous observations of NPF events in the continental boundary layer with particle mobility spectrometers have been carried out since the mid-1990s (Kulmala et al., 2004). Continuous monitoring of air ions dates back even further to the 1980s (Hõrrak et al., 2003, and references therein). Since then, there have been various attempts to classify NPF events according to their relevant features and parameters, including the following approaches.
-
The University of Helsinki classification (Dal Maso et al., 2005): this elaborate method has been widely used to classify NPF events after several criteria, including the existence of a continuous trace of a nucleation mode, and whether apparent particle formation and growth rates can be derived with confidence. Somewhat problematic is the softness of some criteria, such as whether the mode concentration and diameter fluctuate strongly. Recent work has refined the nucleation-mode classification (Buenrostro Mazon et al., 2009; Manninen et al., 2010; Hirsikko et al., 2011), now classifying many previously “undefined” new particle formation events.
-
Methods based on peak values in absolute particle number concentration, sometimes requiring a certain shape of the evolution of the time series of nucleation-mode particle number concentration (e.g. Birmili et al., 2003).
-
Identification of new particle formation events based on the time series of multiple moments of the particle number size distribution (Heintzenberg et al., 2007).
Our newly developed scheme is tailored to the combined NAIS-TDMPS observations at the rural background Melpitz for the following reasons.
-
The number of freshly formed particles (here N[2;20]) is, after all, the most basic and most important indicator of recent particle nucleation. Any other parameters, such as apparent particle formation rates (often estimated by ΔN∕Δt or by a time delay between precursor concentrations and N) or particle growth rates, are subject to inherent uncertainties, such as those induced through air mass changes by convection and/or advection (Sect. 3.5).
-
At Melpitz, we found it hard to quantify the growth of neutral particles below 10 nm by tracking a mode in the NAIS or TDMPS size distributions. The observations indicate that if particles appear in significant numbers at the surface-based research station, they will appear across the entire interval 2–10 nm or even beyond (cf. Fig. 3a–d). When the total particle number concentration reaches its maximum, the nucleation-mode particles have very often reached the region of 20 nm in the size distribution already (Fig. 3a–d). Above that range 10–20 nm, the subsequent particle growth can usually be followed nicely using the TDMPS-based range of the size distribution (cf. Fig. 3a–b). These observations are a justification to use N[2;20] as an indicator for NPF events. The relatively wide interval N[2;20] also has the technical advantage that it produces a statistically sound signal with a low noise level.
-
Our method avoids the common problem of rigorously distinguishing between NPF events and non-events. Acknowledging the true observable continuum of observations between “zero” and “top-level” concentrations, we rather introduce three classes according to different degrees of NPF intensity.
-
Our method has a high degree of objectivity. (This means that it can be recorded in a way that any other researcher can reach exactly the same classification results.) This makes it similar to the approach by Heintzenberg et al. (2007). Some subjectivity arises from the choice of the 27 NPF events that serve as a “calibration” of the method (Table C1) and from the threshold values for CIpeak selected to separate the events into Classes I, II, and III, although these criteria can be recorded explicitly (Table 2).
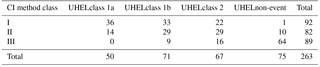
The comparison between the CI method and the University of Helsinki classification (Dal Maso et al., 2005) is shown in Table 3. Naturally, the two methods show a strong correlation when distinguishing between different degrees of observed particle formation. The days in UHEL class 1a coincide, for example, to 72 % with CI Class I. UHEL non-events coincide to 85 % with the analogous CI class 3. On the other hand, CI Class I splits up more evenly into UHEL classes 1a, 1b, and 2. One reason is that the UHEL scheme evaluates additional issues, such as whether the evolving nucleation mode can be clearly tracked over time (i.e unobstructed by background aerosol) or not. These are not issues in the CI method, which primarily weighs the number concentration of the observed particles and the duration of an NPF event.
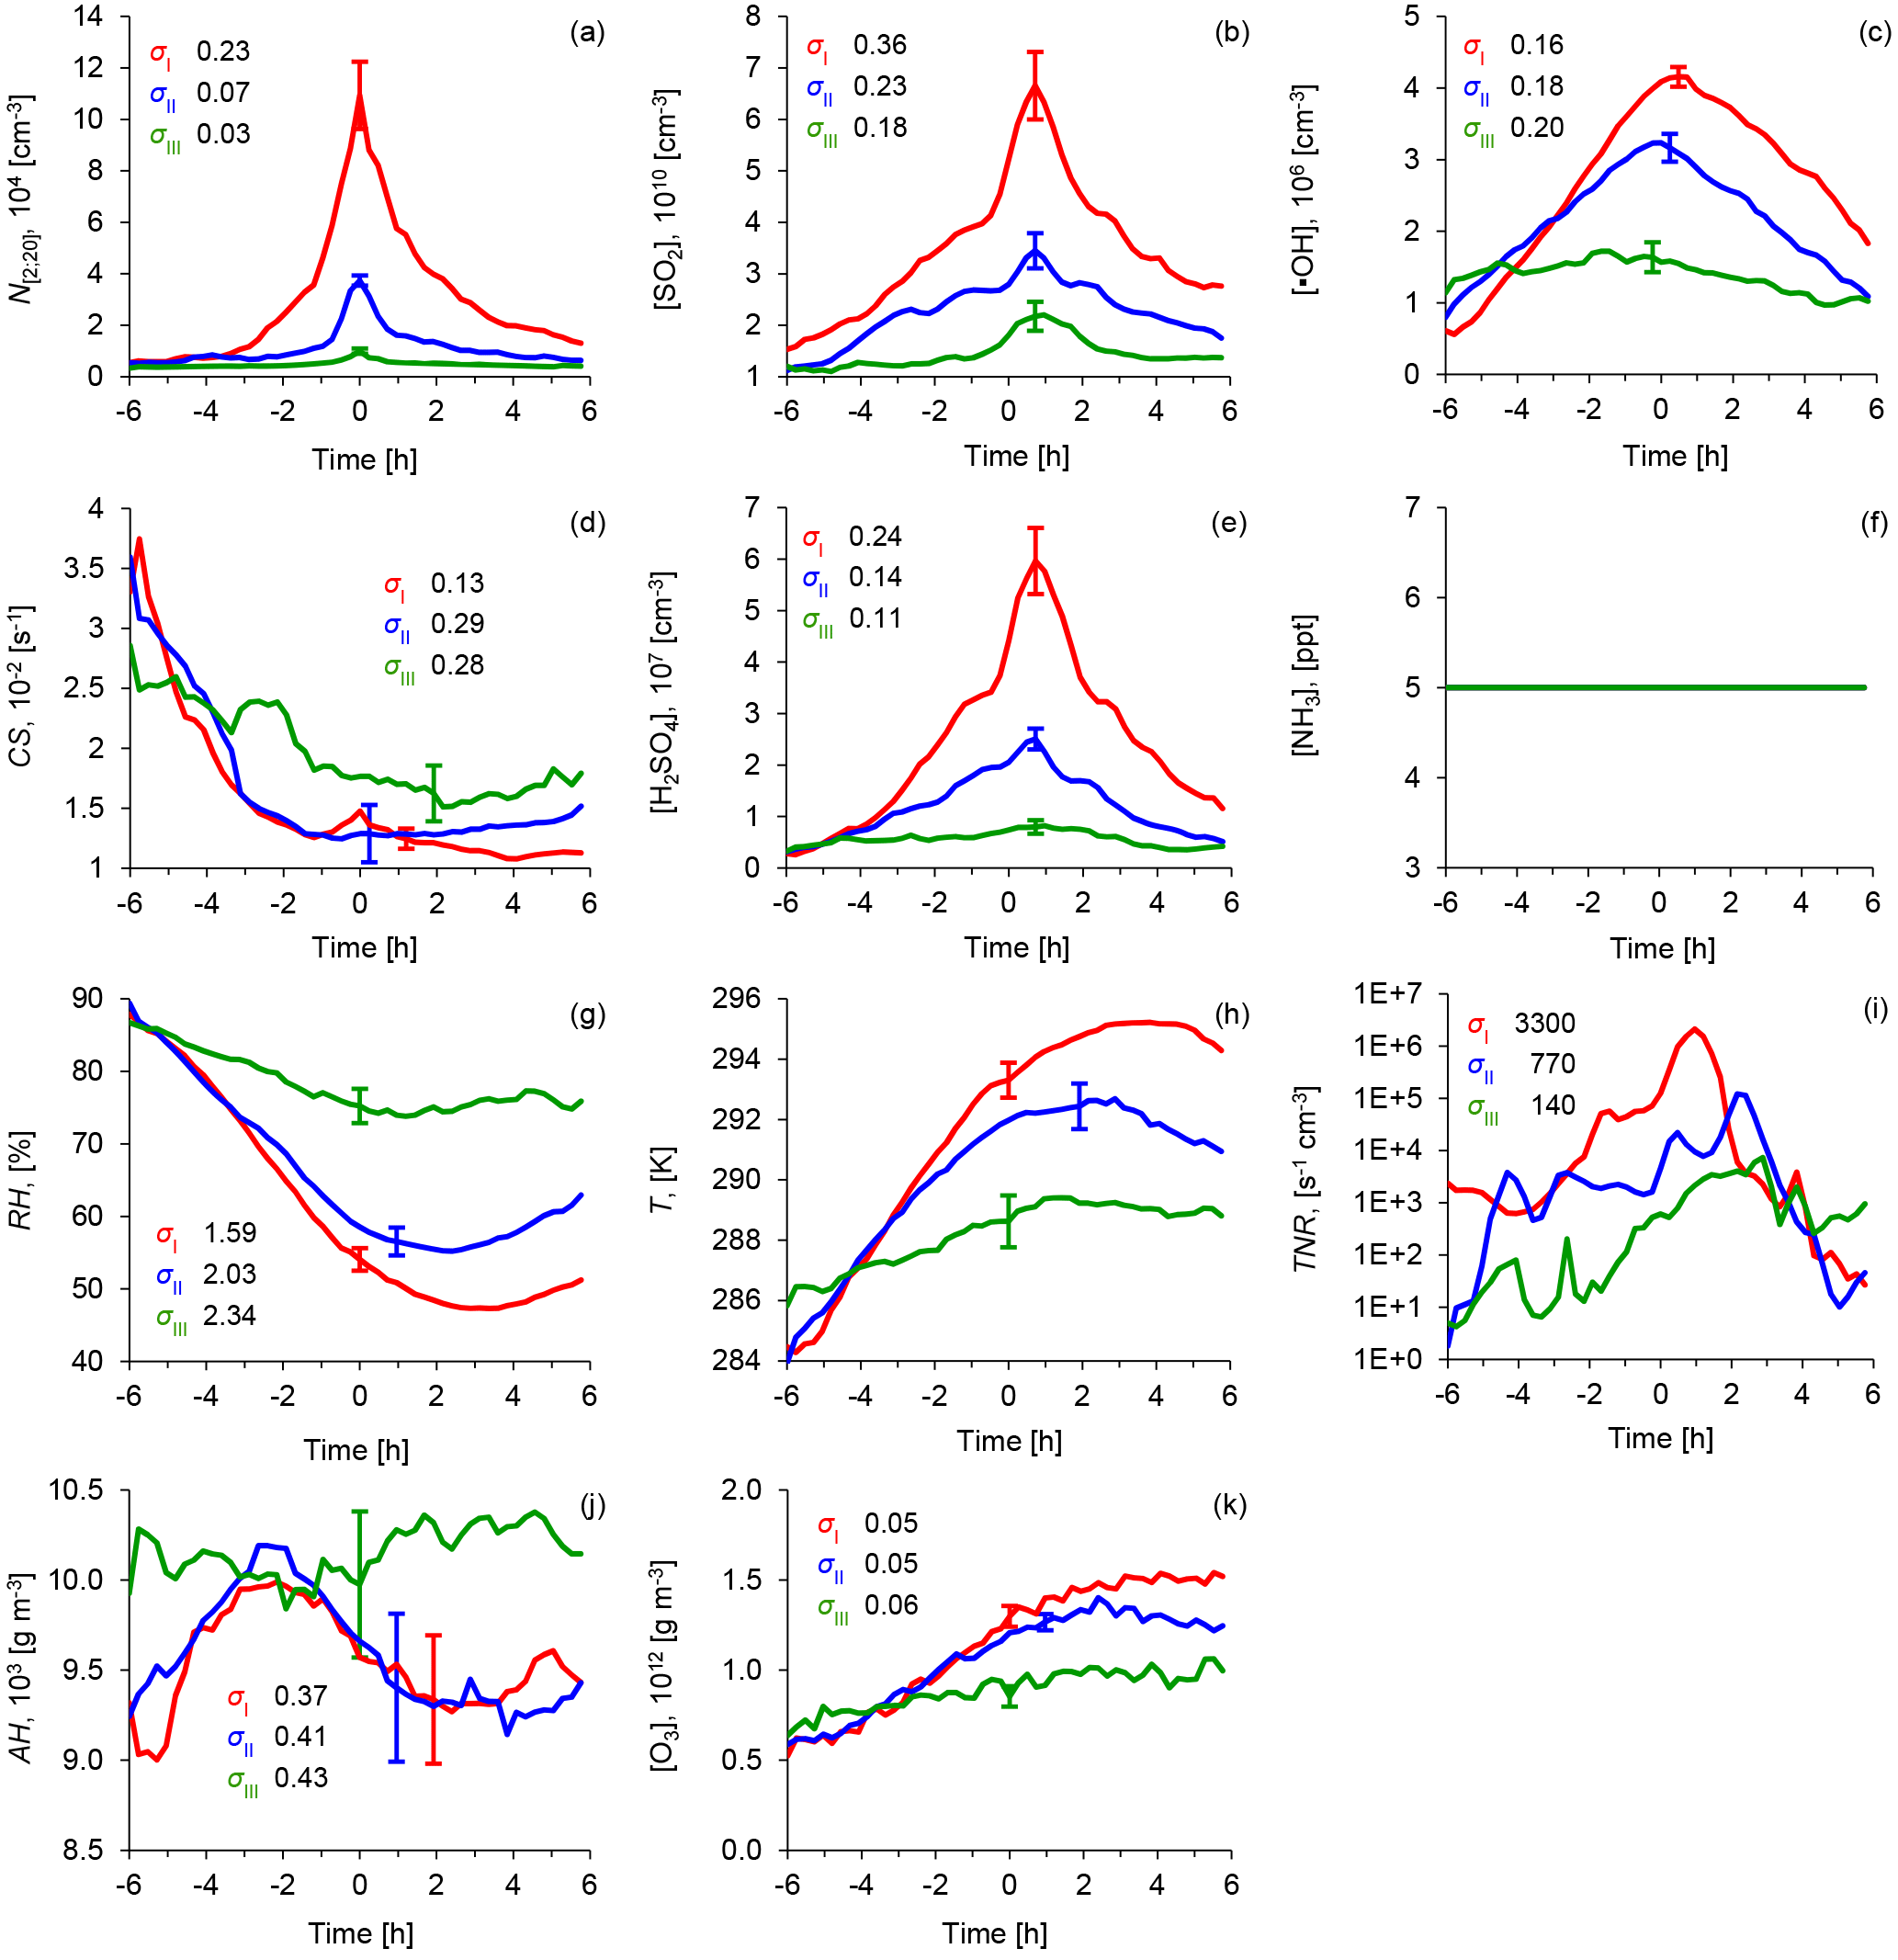
Figure 6Average diurnal cycles of atmospheric parameters for the three NPF event classes: red indicates a Class I event, blue indicates a Class II event, and green indicates Class III (weak events and “non-events”). The subfigures show concentrations of (a) ultrafine particles (N[2;20]), (b) sulfur dioxide (SO2), (c) hydroxyl radicals (•OH), (d) the condensational sink (CS), (e) calculated sulfuric acid (H2SO4), and (f) ammonia (NH3) using a constant value of 5 ppt, (g) relative humidity (RH), (h) temperature (T), (i) ternary nucleation rates (TNR) calculated according to Napari et al. (2002) and under the assumption of a constant ammonia concentration [NH3] = 5 ppt, (j) absolute humidity (AH), and (k) ozone (O3) concentrations. Data coverage: Class I (55 days), Class II (60 days), Class III (67 days). The σ values, indicated by whiskers, represent the standard error of the mean of each subpopulation. (Technically, this is calculated as .) The arithmetic means of the event peak times were 10:48 CET for Class I, 11:54 CET for Class II, and 11:46 CET for Class III.

Figure 7Average time series of (a) the concentrations of ultrafine particles (N[2;20]), (b) the vertical turbulent heat flux (), and (c) turbulent kinetic energy (TKE) for the year 2010 and three event classes (red indicates a Class I event, blue indicates a Class II event, and green indicates Class III including weak events and “non-events”). Whiskers indicate 1 SD. Data coverage: Class I (19 days), Class II (17 days), Class III (27 days).
5.1 Time evolution of NPF events
Having classified NPF events into strong, medium and weak NPF events, we now scrutinise the entire data set for correlations with gaseous precursors and meteorological parameters. Figure 6 shows the average diurnal cycles of measured atmospheric parameters that are considered relevant for the NPF process. Figure 7 adds the diurnal cycles of micro-meteorological parameters including the vertical turbulent heat flux and turbulent kinetic energy, which were collected in the year 2010. Importantly, the diurnal cycles of all parameters were moved in time prior to averaging, with the time of their peak in N[2;20] being set to t = 0. Each curve represents an arithmetic average over all days within the subsets defined in Table 2. [•OH] and [H2SO4] were estimated by the proxies in Eqs. (1) and (2). The ternary nucleation rates TNR were calculated according to Napari et al. (2002) using the in situ measurements or estimates for T, RH, [H2SO4], and [NH3]. Because of the limited data availability of [NH3] (2010 and 2011), a sensitivity analysis for ammonia concentrations was performed separately. A corresponding Fig. D1 can be found in the Appendix. Since the inclusion of ammonia in the analysis did not alter our conclusions, we feel confident in basing the conclusions on the full observation period 2008–2011 and the constraint of using a constant ammonia concentration of 5 ppt.
Time around sunrise (−6 h)
We start the description of the results 6 h prior to the event peak time, which is ca. 04:40 CET for Class I events, ca. 05:50 CET for Class II events, and ca. 05:10 for Class III events. This is the time before or just around sunrise on most of these days.
At this time, we see little to indication from the locally measured parameters of whether an NPF will happen or not a few hours later or which intensity the event will have: solar radiation and [⋅OH]calc are low, around 0.7–1.2×106 cm−3. Ozone levels are very similar for all event classes, around 6×10¹¹ g m−3. [SO2] is the same for all event classes, just below 1.1×1010 cm−3, as is RH at around 88 % on arithmetic average. [H2SO4]calc is at negligible levels, as is ternary nucleation rate (TNR). (As mentioned above, TNR was calculated according to Napari et al., 2002). Also, the turbulent heat flux available for the 2010 measurements () is very similar at around 0.01–0.025 K m s−1.
The few minor indications for NPF events to come are (1) Class I events show early morning temperatures below average. (2) Class I and II events show turbulent kinetic energy TKE below average. (3) Class I and II events show a condensation sink CS above average, and this CS is declining more rapidly than on non-event days. The meteorological indications (1) and (2) point to a surface layer that is highly stratified and calm on the morning of NPF events (Classes I and II). The rapid decrease in CS can be taken as an indicator for two processes: (1) vertical mixing is more efficient on NPF days, apparently driven by solar radiation, and (2) rapidly rising temperature transfers semi-volatile particulate matter, such as ammonium nitrate, and semi-volatile organics into the gas phase. Evidence for the latter process was given by highly time resolved measurements of chemical particle composition at Melpitz (Poulain et al., 2011).
First indications of NPF event (−3 h)
The evolution of many parameters is already indicative of whether an NPF event will happen or not 3 h before event peak time. Most importantly, solar radiation ([•OH]calc) is substantially higher on Class I and II event days compared to Class III event days. As a direct response, the near-surface temperature T is rising rapidly, and RH is decreasing. A significant increase in absolute humidity can be seen on Class I and II days 3 h before event peak time. This is interpreted as the vaporisation of the dew covering the grassland surrounding the Melpitz site.
CS decreases rapidly on the Class I and II days (Fig. 6d), while this effect is much less pronounced on Class III days. We attribute this effect to two reasons: first, semi-volatile compounds, such as ammonium nitrate, and semi-volatile organic matter present in the aerosol will partition from the particulate phase into the gas phase as ambient temperature rises. The importance of this effect has been demonstrated for the Melpitz site by mass spectrometric particulate matter measurements (Poulain et al., 2011). Second, vertical mixing starts in the lower layers of the atmosphere under the influence of intense solar radiation. This, as an overall effect, tends to dilute aerosols present in the surface layer.
We also checked the possible influence of local sources of trace gases and particles on the diurnal cycle of CS. In the warm season, which is representative of Class I and Class II event days, local and regional emissions of primary particles are overwhelmingly made up of sources like vehicular traffic. The black carbon (BC) mass concentration, which may be regarded as representative of such emissions, exhibits a weak average diurnal cycle, changing between 0.44 µg m−3 at midnight, 0.5 µg m−3 around 07:00 CET, and 0.32 µg m−3 around 16:00 CET. We attribute this morning maximum to local anthropogenic emissions from traffic. This maximum becomes visible only after the decline in CS has started. As shown in Fig. 6d, CS changes by a factor of approximately 5 between nighttime and daytime on Class I and II event days. As BC makes up less than 10 % of total particle mass at Melpitz, we rule out the possibility that any temporal changes in local anthropogenic emissions from traffic or domestic sources can account for the observed decline in CS. We conclude that the partitioning of semi-volatile particulate matter into the gas phase and vertical mixing are the major effects reducing CS before NPF events.
A key observation is the increase in [SO2] on Class I and II event days around 3 h before event peak time. From this time, the number of newly formed particles N[2;20] increases in proportion with [SO2]. It needs to be noted that within a radius of 100 km around Melpitz, sources of SO2 are scarce. In Germany, SO2 is emitted in noticeable quantities by single point sources (power plants) and domestic heating. Point sources are, as a matter of fact, far away from Melpitz, while domestic heating is likely to be irrelevant in the warm season of concern. Our interpretation is that the morning increase in near-surface [SO2] is caused by a combination of two processes: (i) first, [SO2] depletes at night due to dry deposition onto the surface. The deposition of SO2 onto the surface was confirmed in early experiments at Melpitz by gradient measurements (Spindler et al., 1996). This depletion of near-surface [SO2] yields the typical values of 1.1 × 1010 cm−3 in the early morning hours, regardless of whether an NPF event will take place or not (Fig. 6b). (ii) Vertical mixing, starting gradually after sunrise, will cause entrainment of SO2 from greater heights where SO2 did not have the opportunity to deposit. During past field experiments, nocturnal low-level jets have been shown to advect SO2 to the Melpitz area at heights of a few hundred metres, which were entrained to the ground after the onset of convection (Beyrich, 1994). (Nocturnal low-level jets originate from geostrophic winds and are able to advect air over long distances above a firm temperature inversion near the ground.) Unfortunately, we did not have the means to verify this hypothesis with rigour during this experiment.
Maximum in nucleation-mode number concentration (0 h)
Event peak time (t=0) was defined by the maximum in freshly formed particles N[2;20]. Class I events feature arithmetic mean concentrations around 1.1 × 105 cm−3, and Class II events around 3.7 × 104 cm−3 (Fig. 6a). Event peak time coincides with the maximum of solar radiation and [•OH]calc (Fig. 6c). [SO2], [H2SO4]calc, and TNR rise from Class III to Class I events. It is worth noting that on Class I days [SO2] exhibits an additional steep rise just before event peak time, emphasising the strong connection between N[2;20] and [SO2]. This peak translates into the proxy [H2SO4]calc and TNR as well. T, RH, and [O3] do not significantly differ between Class I and II events at t=0; they show the typical features of a near-surface measurement on a cloudless day. Absolute humidity decreases on Class I and II event days towards the middle of the day, which is interpreted as mixing with relatively dry air from aloft. It is noteworthy that on Class I event days, CS increases just in time with the maximum of N[2;20] and along with a continuing rise in [SO2]. In several case studies, we observed something which we interpreted as the simultaneous entrainment of SO2 and CS (e.g. 23 August 2008 in Fig. 3d). CS correlates most strongly with the number of bigger particles, i.e. in the Aitken and accumulation mode. It is our interpretation that in these cases, CS originates from the same or similar pollution sources that emit SO2. The newly formed particles < 20 nm contribute only little to CS, at most 15 % during event peak time for event class I, and much less outside that period.
Development after NPF event peak time (t>0 h)
After event peak time, the parameters N[2;20], [•OH]calc, [H2SO4]calc, and TNR decrease to their pre-event levels within a matter of a few hours. It is an interesting feature that for both Class I and II events the peak in [SO2], like the peaks in [H2SO4]calc and TNR, occurs around 1 h later than the peak in This implies that the entrainment of air rich in [SO2] continues even after some other parameter has started to waive the nucleation process.
5.2 Micrometeorological parameters
For the third measurement period in 2010, three-dimensional (3-D) wind parameters were measured at 1 s resolution 6 m above the ground with an ultrasonic anemometer. From the 3-D wind velocities, various turbulence parameters were calculated with a time resolution of 15 min. In Fig. 7 we illustrate the parameters that proved most sensitive to the class of NPF event, the turbulent heat flux , and the turbulent kinetic energy (TKE).
A prime result is that in all cases of Class I and II events, the boundary layer was turbulently mixed. In fact, we could not see a significant difference between Class I and II days with respect to the turbulence parameters. In contrast, a rather weak flux and TKE prevailed in Class III events. The diurnal evolution of the turbulence parameters is in close correspondence with the development of solar radiation and temperature (Fig. 6).
5.3 Reasons for the different peak times in N[2;20]
For the event peak times shown in Table 2, the difference between Class I and II is noticeable. Class III exhibits only low peaks in N[2;20] compared to the rest so that their time of peak concentrations is subject to considerable uncertainties. Class I events take place, on average, 52 min earlier than Class II events. We observed two prime differences between those event classes: (1) temperature rises faster on the mornings of Class I events, and (2) SO2 concentrations increase faster on the mornings of Class I events. Observation (1) has implications in that air from elevated layers will be mixed down to the ground sooner on Class I days compared to Class II days. Observation (2) points to the efficient downward mixing of possible SO2 plumes that are aloft. Recent research showed the presence of SO2-enriched atmospheric plumes and layers above the Melpitz site, where particle nucleation might have taken place some time before NPF was detected on the ground (Platis et al., 2016). It has been suggested that certain NPF events apparently start in a layer a few hundred metres aloft to be measured near the ground only after considerable delay. Two factors might cause Class I events to occur earlier than Class II events: (a) more rapid transport of elevated layers (often SO2-enriched at Melpitz; Beyrich, 1994) where nucleation can take place before it might be observed on the ground and (b) the presence of higher SO2 concentrations requiring less time until H2SO4 concentrations pass the threshold at which nucleation can take place. These explanations are still somewhat hypothetical, and an attempt to prove them will require concurrent observations in the relevant vertical layers above the flat-terrain site Melpitz.
5.4 Statistical significance
Remarkable differences in observed atmospheric conditions were found between Class I, II, and III event days and are discussed from Sec. 5.1 on. To supply a statistical statement, we performed Student's t tests to check whether the parameters [•OH], [SO2], [H2SO4], and CS were indeed different between these classes on a statistical level.
A Student's t test was used to decide wether the means of two populations (for example, CS on Class I and II event days) could be considered equal (null hypothesis) or different within statistical significance. Student's t distributions (Student, 1908) were used because they refer to the probability distribution of the mean of a normally distributed population in situations for which the sample size is small and population SD is unknown (Hazewinkel, 2011). As a significance level of the test, we chose 99 %. A test was performed for every pair of 15 min mean values of the aforementioned parameters. The tests determine the significance of the differences in mean values that can be seen in Fig. 6.
The result was that Class I and Class II are significantly different from Class III (weak events or non-events) in terms of [•OH] (also called solar radiation), [SO2], and [H2SO4] for every 15 min interval of the period between 4 h prior to and past event peak time. Significant differences could even be confirmed for CS during most of that time and, in addition, for the differences between Class I and Class II regarding [•OH], [SO2], and [H2SO4]. These results confirm that many of the atmospheric conditions found during Class I, Class II, and Class III events were substantially different and can thus be interpreted as influential factors for the occurrence of an NPF event of the corresponding class.
5.5 Examining the particle formation rate J2
To sum up the discussion of process parameters derived from the NPF events, formation rates of 2 nm particles (J2) were determined from the particle number size distributions measured by NAIS. The number concentration of particles in the size range 2–3 nm, N2–3, was integrated from the measured size distributions. Inspection of the data showed that during NPF events, the signal-to-noise ratio of the NAIS instrument at 2.06 nm is above the detection limit when averaged over 15 min intervals. J2 was calculated from the time derivative of N2–3, taking into account the coagulation losses of 2–3 nm particles onto larger particles and condensation growth out of the 2–3 nm size range as described in Kulmala et al. (2012).
Figure E1 shows the correlation between the calculated ternary nucleation rate TNR and the measured number concentration of 2–20 nm particles N[2;20] with the calculated H2SO4 concentration. Figure E2 shows corresponding data for the particle formation rate J2. Interestingly, N[2;20] seems to correlate more strongly with H2SO4 than J2 or TNR. One reason for the lower correlation between J2 and H2SO4 could be that the calculated J2 values can be more uncertain than the directly measured N[2;20] concentrations, making the J2 vs. H2SO4 more scattered. The J2 values obtained in this study fall within the same correlation with H2SO4 as observations made at other sites during the EUCAARI 2008–2009 campaign (right graph in Fig. E2; reproduced from Kerminen et al., 2010).
6.1 Basic findings of this work
As can be seen in Fig. 6, the intensity of newly formed particles (expressed by the three different classes based on N[2;20]) correlates with [•OH]calc, [H2SO4]calc, [SO2], and TNR on a diurnal scale. The most significant discrepancy between Class I–II and Class III events is made up by different levels of global radiation, manifested by [•OH]calc. It can also be seen that peaks in N[2;20] and [•OH]calc coincide within 30 min for event Class I and II. This simple and rather established correlation between nucleation-mode particles and solar radiation (e.g. Boy and Kulmala, 2002) seems to represent the most basic impact influencing NPF at Melpitz.
[H2SO4]calc turns out to be another major influential factor: the magnitudes of the daily peaks in N[2;20] and [H2SO4]calc scale in proportion across the three different classes. The effect of [H2SO4]calc can be broken down into the effects of [SO2], [•OH]calc, and CS. The difference in [H2SO4]calc between Classes I–II and III is mainly made up by radiation ([•OH]calc), while the difference in [H2SO4]calc between Classes I and II is primarily accounted for by different levels of [SO2]. The effect caused by differences in CS is comparatively minor; CS is slightly lower during Class II events than during Class III events, allowing for a higher steady-state [H2SO4]calc. The combination of the in situ measurements or estimates for T, RH, and [H2SO4] also yields the ternary particle nucleation rate shown in Fig. 6i. This essentially propagates the trend found for [H2SO4]calc, but does not yield significant new insights.
We obtained the following descriptions of different classes of NPF events at Melpitz.
-
Class I: days with significant solar radiation and high [SO2] levels.
-
Class II: days with significant solar radiation but average [SO2] levels.
-
Class III (containing weak events and non-events): days with significant cloud cover.
Many other features, such as the trend towards high temperatures (T), low relative humidities (RH), and a higher ozone mixing ratio [O3], can be directly linked to solar radiation as the prime source of these meteorological and photochemical processes. It is intriguing that the diurnal cycles of T, RH, [O3], [•OH]calc, , and TKE are very similar for event Classes I and II, but rather different from those in event Class III (including non-events). This suggests that the meteorological and photochemical processes on the days of Class I and II events are very similar.
6.2 Comparison with findings worldwide
To reinforce the findings of this work, we discuss to what extent the results depend on the observation site in Melpitz or, conversely, how they may be considered as general findings. Among the plethora of literature on the topic, we found certain key works from the following groups.
Fundamental study on the influence of solar radiation. Boy and Kulmala (2002) show strong correlations between NPF events and solar radiation at the boreal forest research site in Hyytiälä (SMEAR-II) in Finland. The preferred band of solar radiation was UV-A, while the study also found an anti-correlation with water vapour. The statements about solar radiation and water vapour fully agree with this work.
Studies suggesting a critical influence of SO2 and/or H2SO4. Jeong et al. (2006) report, for two sites in Canada and the northern US, that “SO2 and UV-B were highly correlated with particle concentration, suggesting a high association of photochemical processes with these local NPF events.” Stanier et al. (2004) report nucleation events during the Pittsburgh Air Quality Study, concluding that “local nucleation events were usually associated with elevated SO2 concentrations”. Zhang et al. (2004), from the same campaign, report that sulfate appeared to be the major species involved in the early growth of nucleation-mode particles, while relevant growth due to organic species was to begin only later. Woo et al. (2001) report a similar strong correlation between NPF events in Atlanta, US and anthropogenic SO2 as a precursor. Dunn et al. (2004) report, for observations in Mexico City, that “concentrations of particles with diameter greater than 10 nm increased an order of magnitude, and concentrations of sub 10 nm diameter particles increased at least 2 orders of magnitude over concentrations just before the event or on a day without nucleation. Large increases in SO2 concentrations and northerly winds also coincide with these events.”
In the Chinese megacity Beijing, located in a temperate climate and featuring high rates of anthropogenic particulate and gaseous emissions, the influence of SO2 and H2SO4 as precursors for NPF could be confirmed as well (Yue et al., 2010). Statistically, however, the highest nucleation-mode concentrations due to photochemical production could be found in clean air masses where CS is low (Wehner et al., 2008). Vakkari et al. (2011) report, for a site in the South African savannah, that “the occurrence of new particle formation and growth was strongly dependent on sulfuric acid” with SO2 as a precursor and that “the contribution of sulfuric acid to the growth immediately after nucleation was significant.”
Comparative studies in Europe, usually including Melpitz data. Manninen et al. (2010) compared observations similar to this work (NAIS measurements) at 12 observation sites across Europe. Among these sites, Melpitz exhibited the highest fraction of NPF days for the observation period (57 %). Manninen et al. (2010) confirmed that at Melpitz, NPF events showed little sensitivity to CS, while at other background sites (Hyytiälä, Cabauw, Hohenpeissenberg, Finokalia) there was a clear trend towards lower CS on NPF event days. Jaatinen et al. (2009) compared NPF event statistics and correlations for the sites Hyytiälä (Finland), Melpitz (Germany), and San Pietro Capofiume (Italy). They conclude that nucleation was found to occur frequently at all stations although “seasonal differences were observed for every station.” They conclude that in Hyytiälä the formation and growth of particles was characterised by a low pre-existing condensation sink and high biogenic VOC concentrations associated with the biological growth season, while in Melpitz and San Pietro Capofiume the high level of pollution arriving from the nearby industrial and agricultural sources plays a major role.
In summary, the correlation between NPF and solar radiation has been confirmed in a few statistically relevant studies, as has the connection of NPF events and anthropogenic SO2 plumes. On the issue of CS, the conclusions in the various works are in less agreement. In clean environments where SO2 levels are low, CS seems to be a factor unfavourable for NPF, while in areas with moderate SO2 levels, the influence of variations in CS steps back behind the dominating influence of solar radiation and SO2. In areas with extremely high levels of CS and gaseous pollutants, the occurrence of NPF events might even be limited by high CS. So far, we found no study analysing the role of ammonia on a longer statistical basis. In this respect, we consider our study a novelty.
At the research station Melpitz, NPF occurs rather frequently, with the majority of NPF events being under the influence of anthropogenic SO2 plumes as a main precursor for H2SO4 and subsequent nucleation. Among other observations, Melpitz compares best with the San Pietro Capofiume site in the Italian Po Valley and the various North American sites. NPF at Melpitz clearly behaves in a different fashion from continental background sites such as SMEAR-II in Finland, mountain sites, coastal sites, and heavily polluted locations such as Chinese megacities.
6.3 Where does nucleation take place?
The basic correlation of N[2;20] with [H2SO4] is interpreted as H2SO4 being a main factor responsible for the formation of new particles. There has, however, been the issue of where in the boundary layer particles would actually nucleate. If particles were formed above the ground and brought down through mixing, particles might be larger than 2–3 nm when they reach the surface. New observations have been made very recently using unmanned aircraft. Observations made by Platis et al. (2016) suggest that NPF events may start a few hundred metres above the surface to be measured near the ground only after considerable delay. During this delay time, it is natural to assume that particles grow to bigger diameters (up to 20 nm) before they are detected at ground level. These observations might have implications for the observed correlations between NPF parameters and gaseous precursors.
The correlation of N[2;20] with [H2SO4] being more solid than the correlation of J2 with [H2SO4] is somehow surprising because J2 refers to particles in the size range 2–3 nm that should actually be more close to the process of nucleation, which is thought to be initiated by [H2SO4]. Recent experimental work has raised one suspicion: if one assumes that particles are formed aloft and only subsequently mixed down to the ground (Platis et al., 2016), this would mean that many of the smallest particles have already grown into bigger sizes. Hypothetically, the actual nucleation could have terminated already when the particles from the nucleation burst reach the ground, and the particle number size distribution could well be shifted to the bigger sizes in the 2–20 nm interval. When looking at the NAIS observations from this work (Fig. 6), we almost always see new particles in a wide size range (2–10 nm or even bigger) when they first appear at the ground. This would then imply that the statistical connection between J2 and [H2SO4] is weakened because the smallest particles have already dynamically evolved at the time of measurement, while N[2;20] appears to be a better representative of the outcome of the nucleation process that happened at a previous moment upwind. This would have the consequence that ground-based measurements of the 2–3 nm particles might not necessarily be a useful indicator for nucleation processes happening at higher regions of the boundary layer and that N[2;20] might actually be a better representative of the outcome of the nucleation process. These conclusions are very tentative, since to date no comprehensive four-dimensional in situ data have been collected that would permit the establishment of the true spatial evolution of boundary layer NPF events (Platis et al., 2016).
This paper revisited the new particle formation process (NPF) in the Central European boundary layer at the Melpitz station using a new data set involving neutral cluster and air ion spectrometer (NAIS) data for 2008–2011. Particle formation events were classified by an automated method based on the convolution integral of particle number concentration in the diameter range 2–20 nm. In analogy to previous field studies, the intensity of solar radiation was confirmed as the main factor controlling the occurrence of NPF events. The absolute number of observed particles in the diameter range 2–20 nm, however, varied mainly in proportion with the concentration of sulfur dioxide as the presumed main precursor of sulfuric acid. This is consistent with a model picture that UV radiation is instrumental in generating OH radicals, which in turn form H2SO4 via OH radical attack on SO2. The condensation sink CS played a minor role in the NPF process in that its values were rather similar on event and non-event days. The same held for experimentally determined ammonia concentrations, a potential precursor of particle nucleation. It thus appears that at Melpitz, ammonia is always available in excess. The analysis of micrometeorological turbulence parameters demonstrated the presence of significant turbulence in the boundary layer on NPF events. Due to its close correlation with solar radiation, however, an independent effect of turbulence for NPF could not be established with certainty. An analysis of the diurnal cycles of aerosol, gas-phase, and meteorological parameters suggests that particle nucleation tends to happen aloft in the residual layer, i.e. in the remains of the mixed layer of the previous day. As a rationale we put forward the nighttime depletion of sulfur dioxide near the surface, the higher probability of particle nucleation at lower temperatures aloft, and the frequent observation of aged nucleation-mode particles (at least 10–20 nm in diameter) during observations of NPF near the ground.
Particle number size distributions measured by the TDMPS are available through the German Ultrafine Aerosol Network (GUAN; Birmili et al., 2016) at hourly time resolution (doi:10.5072/guan). All other data products used in the study are available from the Leibniz Institute for Tropospheric Research (Johannes Größ and Alfred Wiedensohler) upon reasonable request.
For the adjustment of particle number size distribution and thus CS to ambient relative humidity (Sect. 2.3), an empirical growth law based on an entire year (mid-2008–mid-2009) of hygroscopicity analyser (H-TDMA) measurements at Melpitz was used. The growth factors were measured at 90 % RH for the dry particle diameters 50, 75, 110, 165, and 265 nm. Parts of those data are illustrated in Zieger et al. (2014). The formula allows us to compute the hygroscopic growth factor as a function of dry particle diameter and relative humidity as follows:
with the exponent factor γ being parameterised as
This work examined several proxy functions for the parameterisation of sulfuric acid concentration in Melpitz. Table B1 lists these linear functions, which were used in previous work (Mikkonen et al., 2011). Figure B1 shows the associated data clouds based on 9 days of EUCAARI 2008 measurements.
Table B1Linear proxy functions for sulfuric acid parameterisation; reproduced from Mikkonen et al. (2011), Table 3.
The convolution integral in Sect. 4, Eq. (3) uses a function f(t) that is characteristic of significant NPF events; f(t) is an average time series of N[2;20] based on 27 manually selected NPF events. The selected NPF events featured high peak values of N[2;20] and subsequent particle growth during a few hours, such as those shown in Fig. 3a and b. The weight function f(t) represents the average time evolution of N[2;20] during the most intense NPF events. The original time series of N[2;20] are shown in Fig. C1, with their time bases shifted so that their peaks coincide. The list of the 27 NPF events with their associated maximum N[2;20] concentrations is given in Table C1.

Figure C1Time series of N[2;20] for the 27 manually selected NPF events listed in Table C1. The red curve indicates the arithmetic average of the time series, which are shifted so that they coincide in maximum number concentration.
Table C1List of 27 manually selected NPF event days whose average diurnal profiles of N[2;20] served as a reference function f(t) in Eq. (3). This list encompasses NPF events that showed clear patterns of particle nucleation and subsequent growth in terms of particle number size distributions.
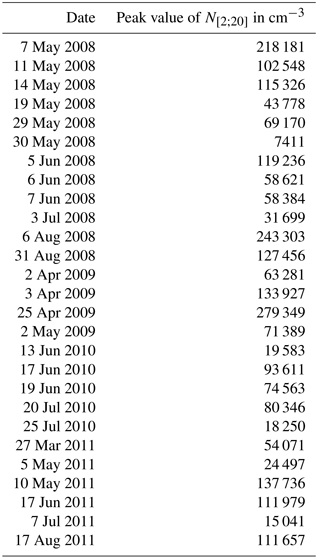
Figure D1 provides an alternative version of Fig. 6. The data in these graphs are, however, limited to the years 2010–2011 when experimental ammonia concentrations were available.

Figure D1Alternative version of Fig. 6 limited to the years 2010–2011 when experimental ammonia concentrations were available. The graphs show average diurnal cycles of atmospheric parameters for the three NPF event classes: red indicates a Class I event, blue indicates a Class II event, and green represents a Class III event, including weak events and “non-events”. The subfigures show the concentrations of (a) ultrafine particles (N[2;20]), (b) sulfur dioxide (SO2), (c) hydroxyl radicals (•OH), (d) the condensational sink (CS), (e) sulfuric acid (H2SO4), and (f) ammonia (NH3), (g) relative humidity (RH), (h) temperature (T), (i) the calculated ternary nucleation rate (TNR) according to Napari et al. (2002), (j) absolute humidity (AH), and (k) ozone (O3) concentration. The σ values, indicated by whiskers, represent the standard error of the mean of each subpopulation. (Technically, this is calculated as .) Data coverage: Class I (33 days), Class II (35 days), Class III (40 days). The arithmetic mean event peak times were Class I (10:48 CET), Class II (11:54 CET), Class III (11:46 CET).
Additional diagrams are provided to show cross-correlations within the data set. Figure E1 provides dependencies of the calculated ternary nucleation rate (TNR) and N[2;20] from [H2SO4], while Fig. E2 gives the correlation between the particle formation rate J2 and the calculated sulfuric acid concentration [H2SO4]. The figures provide a means of consistency checking with other studies.

Figure E1(a) Correlation between the ternary nucleation rate (TNR, with NH3 = 5 ppt) and ultrafine particle number concentration (N[2;20]). (b) Correlation between the particle number concentration N[2;20] and the calculated sulfuric acid concentration [H2SO4] in this work. Colours refer to event class Class I (red), Class II (blue), and Class III (green).
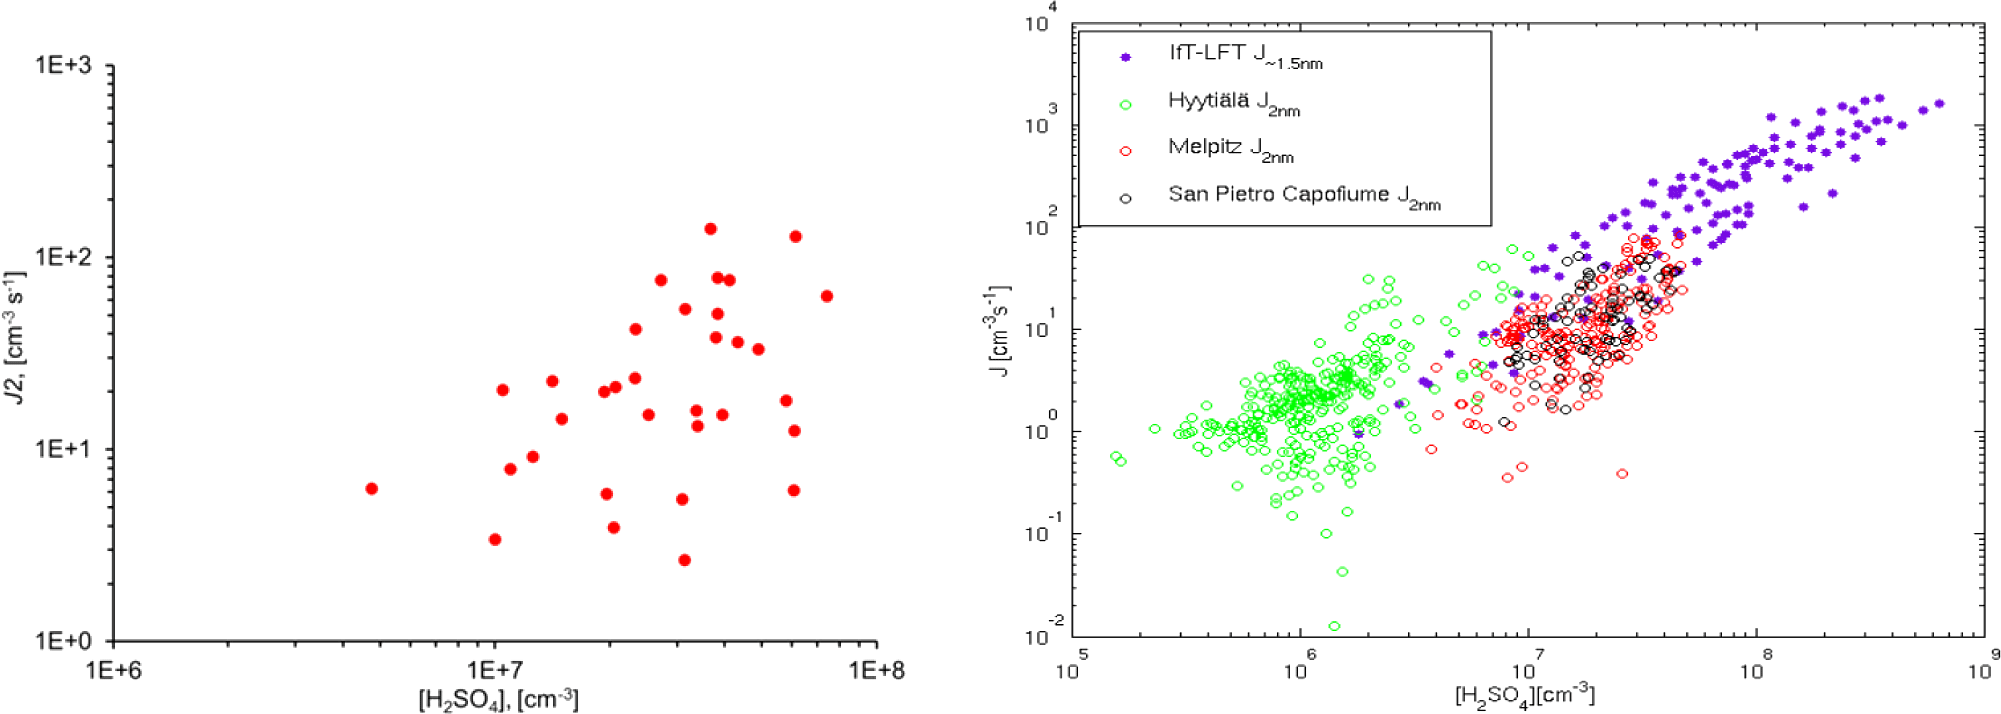
Figure E2Left: correlation between the particle formation rate J2 and the calculated sulfuric acid concentration [H2SO4] in this work. The diagram involves 33 cases of NPF events between 2008 and 2011. Right: the same relationship from Kerminen et al. (2010).
The authors declare that they have no conflict of interest.
The measurements and data analyses for this work were performed with support from the following research and infrastructure
projects: EUCAARI (European Integrated project on Aerosol, Cloud, Climate, and Air Quality Interactions), European
Commission FP6 contract 34684, ACTRIS (Aerosols, Clouds, and Trace gases Research InfraStructure Network), European
Commission FP7 contract 262254, and the German Federal Ministry of the Environment (BMU) grants F&E 370343200 and 371143232.
U. Hõrrak acknowledges institutional research funding IUT20-11 from the Estonian Ministry of Education and
Research. Credit also goes to the following TROPOS personnel: Achim Grüner (Melpitz station), Thomas Tuch (maintenance
of physical aerosol measurements), Kay Weinhold (quality assurance), and Jonas Hesemann (operation of the NAIS in 2008 and
2009).
Edited by: James Allan
Reviewed by: two
anonymous referees
Almeida, J., Schobesberger, S., Kürten, A., Ortega, I. K., Kupiainen-Määttä, O., Praplan, A. P., Adamov, A., Amorim, A., Bianchi, F., Breitenlechner, M., David, A., Dommen, J., Donahue, N. M., Downard, A., Dunne, E., Duplissy, J., Ehrhart, S., Flagan, R. C., Franchin, A., Guida, R., Hakala, J., Hansel, A., Heinritzi, M., Henschel, H., Jokinen, T., Junninen, H., Kajos, M., Kangasluoma, J., Keskinen, H., Kupc, A., Kurtén, T., Kvashin, A. N., Laaksonen, A., Lehtipalo, K., Leiminger, M., Leppä, J., Loukonen, V., Makhmutov, V., Mathot, S., McGrath, M. J., Nieminen, T., Olenius, T., Onnela, A., Petäjä, T., Riccobono, F., Riipinen, I., Rissanen, M., Rondo, L., Ruuskanen, T., Santos, F. D., Sarnela, N., Schallhart, S., Schnitzhofer, R., Seinfeld, J. H., Simon, M., Sipilä, M., Stozhkov, Y., Stratmann, F., Tomé, A., Tröstl, J., Tsagkogeorgas, G., Vaattovaara, P., Viisanen, Y., Virtanen, A., Vrtala, A., Wagner, P. E., Weingartner, E., Wex, H., Williamson, C., Wimmer, D., Ye, P., Yli-Juuti, T., Carslaw, K. S., Kulmala, M., Curtius, J., Baltensperger, U., Worsnop, D. R., Vehkamäki, H., and Kirkby, J.: Molecular understanding of sulphuric acid–amine particle nucleation in the atmosphere, Nature, 502, 359–363, https://doi.org/10.1038/nature12663, 2013. a
Asmi, E., Sipilä, M., Manninen, H. E., Vanhanen, J., Lehtipalo, K., Gagné, S., Neitola, K., Mirme, A., Mirme, S., Tamm, E., Uin, J., Komsaare, K., Attoui, M., and Kulmala, M.: Results of the first air ion spectrometer calibration and intercomparison workshop, Atmos. Chem. Phys., 9, 141–154, https://doi.org/10.5194/acp-9-141-2009, 2009. a, b
Asmi, A., Wiedensohler, A., Laj, P., Fjaeraa, A.-M., Sellegri, K., Birmili, W., Weingartner, E., Baltensperger, U., Zdimal, V., Zikova, N., Putaud, J.-P., Marinoni, A., Tunved, P., Hansson, H.-C., Fiebig, M., Kivekäs, N., Lihavainen, H., Asmi, E., Ulevicius, V., Aalto, P. P., Swietlicki, E., Kristensson, A., Mihalopoulos, N., Kalivitis, N., Kalapov, I., Kiss, G., de Leeuw, G., Henzing, B., Harrison, R. M., Beddows, D., O'Dowd, C., Jennings, S. G., Flentje, H., Weinhold, K., Meinhardt, F., Ries, L., and Kulmala, M.: Number size distributions and seasonality of submicron particles in Europe 2008–2009, Atmos. Chem. Phys., 11, 5505–5538, https://doi.org/10.5194/acp-11-5505-2011, 2011. a
Berresheim, H., Elste, T., Plass-Dülmer, C., Eisele, F. L., and Tanner, D. J.: Chemical ionization mass spectrometer for long-term measurements of atmospheric OH and H2SO4, Int. J. Mass Spectrom., 202, 91–109, https://doi.org/10.1016/S1387-3806(00)00233-5, 2002. a
Beyrich, F.: Determination of mixed layer heights from SODAR data using numerical model calculations (translated from German), PhD thesis, Freie Universität Berlin, Berlin, 1994. a, b
Birmili, W. and Wiedensohler, A.: New particle formation in the continental boundary laxer: Meteorological and gas phase parameter influence, Geophys. Res. Lett., 27, 20, 3325–3328, https://doi.org/10.1029/1999GL011221, 2000. a
Birmili, W., Stratmann, F., and Wiedensohler, A.: Design of a DMA-based size spectrometer for a large particle size range and stable operation, J. Aerosol Sci., 30, 549–553, https://doi.org/10.1016/S0021-8502(98)00047-0, 1999. a
Birmili, W., Wiedensohler, A., Heintzenberg, J., and Lehmann, K.: Atmospheric particle number size distribution in Central Europe: statistical relations to air masses and meteorology, J. Geophys. Res., D23, 32005–32018, https://doi.org/10.1029/2000JD000220, 2001. a
Birmili, W., Berresheim, H., Plass-Dülmer, C., Elste, T., Gilge, S., Wiedensohler, A., and Uhrner, U.: The Hohenpeissenberg aerosol formation experiment (HAFEX): a long-term study including size-resolved aerosol, H2SO4, OH, and monoterpenes measurements, Atmos. Chem. Phys., 3, 361–376, https://doi.org/10.5194/acp-3-361-2003, 2003. a
Birmili, W., Weinhold, K., Rasch, F., Sonntag, A., Sun, J., Merkel, M., Wiedensohler, A., Bastian, S., Schladitz, A., Löschau, G., Cyrys, J., Pitz, M., Gu, J., Kusch, T., Flentje, H., Quass, U., Kaminski, H., Kuhlbusch, T. A. J., Meinhardt, F., Schwerin, A., Bath, O., Ries, L., Gerwig, H., Wirtz, K., and Fiebig, M.: Long-term observations of tropospheric particle number size distributions and equivalent black carbon mass concentrations in the German Ultrafine Aerosol Network (GUAN), Earth Syst. Sci. Data, 8, 355–382, https://doi.org/10.5194/essd-8-355-2016, 2016. a
Boy, M. and Kulmala, M.: Nucleation events in the continental boundary layer: Influence of physical and meteorological parameters, Atmos. Chem. Phys., 2, 1–16, https://doi.org/10.5194/acp-2-1-2002, 2002. a, b, c
Buenrostro Mazon, S., Riipinen, I., Schultz, D. M., Valtanen, M., Dal Maso, M., Sogacheva, L., Junninen, H., Nieminen, T., Kerminen, V.-M., and Kulmala, M.: Classifying previously undefined days from eleven years of aerosol-particle-size distribution data from the SMEAR II station, Hyytiälä, Finland, Atmos. Chem. Phys., 9, 667–676, https://doi.org/10.5194/acp-9-667-2009, 2009. a
Dal Maso, M., Kulmala, M., Riipinen, I., Wagner, R., Hussein, T., Aalto, P. P., and Lehtinen, K. E. J.: Formation and growth of fresh atmospheric aerosols: eight years of aerosol size distribution data from SMEAR II, Hyytiälä, Finland, Boreal Environ. Res., 10, 323–336, 2005. a, b, c
D'Andrea, S. D., Häkkinen, S. A. K., Westervelt, D. M., Kuang, C., Levin, E. J. T., Kanawade, V. P., Leaitch, W. R., Spracklen, D. V., Riipinen, I., and Pierce, J. R.: Understanding global secondary organic aerosol amount and size-resolved condensational behavior, Atmos. Chem. Phys., 13, 11519–11534, https://doi.org/10.5194/acp-13-11519-2013, 2013. a, b
Dunn, M. J., Jiménez, J.-L., Baumgardner, D., Castro, T., McMurry, P. H., and Smith, J. N.: Measurements of Mexico City nanoparticle size distributions: Observations of new particle formation and growth, Geophys. Res. Lett., 31, L10102, https://doi.org/10.1029/2004GL019483, 2004. a
Easter, R. C. and Peters, L. K.: Binary homogeneous nucleation: temperature and relative humidity fluctuations, nonlinearity, and aspects of new particle production in the atmosphere, J. Appl. Meteorol., 33, 775–784, 1994. a
Engler, C., Rose, D., Wehner, B., Wiedensohler, A., Brüggemann, E., Gnauk, T., Spindler, G., Tuch, T., and Birmili, W.: Size distributions of non-volatile particle residuals (Dp < 800 nm) at a rural site in Germany and relation to air mass origin, Atmos. Chem. Phys., 7, 5785–5802, https://doi.org/10.5194/acp-7-5785-2007, 2007. a
Fuchs, N. A. and Sutugin, A. G.: Highly dispersed aerosols, in: Vol H of Topics in Current Aerosol Research, Pergamon Press, New York, 1971. a
Gagné, S., Lehtipalo, K., Manninen, H. E., Nieminen, T., Schobesberger, S., Franchin, A., Yli-Juuti, T., Boulon, J., Sonntag, A., Mirme, S., Mirme, A., Hõrrak, U., Petäjä, T., Asmi, E., and Kulmala, M.: Intercomparison of air ion spectrometers: an evaluation of results in varying conditions, Atmos. Meas. Tech., 4, 805–822, https://doi.org/10.5194/amt-4-805-2011, 2011. a
Hamed, A., Birmili, W., Joutsensaari, J., Mikkonen, S., Asmi, A., Wehner, B., Spindler, G., Jaatinen, A., Wiedensohler, A., Korhonen, H., Lehtinen, K. E. J., and Laaksonen, A.: Changes in the production rate of secondary aerosol particles in Central Europe in view of decreasing SO2 emissions between 1996 and 2006, Atmos. Chem. Phys., 10, 1071–1091, https://doi.org/10.5194/acp-10-1071-2010, 2010. a, b
Häkkinen, S. A. K., Manninen, H. E., Yli-Juuti, T., Merikanto, J., Kajos, M. K., Nieminen, T., D'Andrea, S. D., Asmi, A., Pierce, J. R., Kulmala, M., and Riipinen, I.: Semi-empirical parameterization of size-dependent atmospheric nanoparticle growth in continental environments, Atmos. Chem. Phys., 13, 7665–7682, https://doi.org/10.5194/acp-13-7665-2013, 2013. a
Haywood, J. and Boucher, O.: Estimates of the direct and indirect radiative forcing due to tropospheric aerosols: a review, Rev. Geophys., 38, 513–543, https://doi.org/10.1029/1999RG000078, 2000. a
Hazewinkel, M. (Ed.): Encyclopedia of Mathematics, Springer Science & Business Media B. V., available at: https://www.encyclopediaofmath.org (last access: 5 December 2017), 2010. a
Heintzenberg, J., Wehner, B., and Birmili, W.: “How to find bananas in the atmospheric aerosol”: new approach for analyzing atmospheric nucleation and growth events, Tellus B, 59, 273–282, https://doi.org/10.1111/j.1600-0889.2007.00249.x, 2007. a, b
Hirsikko, A., Nieminen, T., Gagné, S., Lehtipalo, K., Manninen, H. E., Ehn, M., Hõrrak, U., Kerminen, V.-M., Laakso, L., McMurry, P. H., Mirme, A., Mirme, S., Petäjä, T., Tammet, H., Vakkari, V., Vana, M., and Kulmala, M.: Atmospheric ions and nucleation: a review of observations, Atmos. Chem. Phys., 11, 767–798, https://doi.org/10.5194/acp-11-767-2011, 2011. a
Hõrrak, U., Salm, J., and Tammet, H.: Diurnal variation in the concentration of air ions of different mobility classes in a rural area, J. Geophys. Res., 108, 4653, https://doi.org/10.1029/2002JD003240, 2003. a
IPCC: Climate Change 2013: The Physical Science Basis, Contribution of Working Group I to the Fifth Assessment Report of the Intergovernmental Panel on Climate Change, edited by: Stocker, T. F., Qin, D., Plattner, G.-K., Tignor, M., Allen, S. K., Boschung, J., Nauels, A., Xia, Y., Bex, V., and Midgley, P. M., Cambridge University Press, Cambridge, UK and New York, NY, USA, 1535 pp., 2013. a
Jaatinen, A., Hamed, A., Joutsensaari, J., Mikkonen, S., Birmili, W., Wehner, B., Spindler, G., Wiedensohler, A., Decesari, S., Mircea, M., Facchini, M. C., Junninen, H., Kulmala, M., Lehtinen, K. E. J., and Laaksonen, A.: A comparison of new particle formation events in the boundary layer at three different sites in Europe, Boreal Environ. Res., 14, 481–498, 2009. a
Jeong, C.-H., Evans, G.-J., Hopke, P. K., Chalupa, D. J., and Utell, M.: Influence of atmospheric dispersion and new particle formation events on ambient particle number concentration in Rochester, United States, and Toronto, Canada, J. Air Waste Ma., 56, 431–443, https://doi.org/10.1080/10473289.2006.10464519, 2006. a
Jeong, C.-H., Evans, G. J., McGuire, M. L., Chang, R. Y.-W., Abbatt, J. P. D., Zeromskiene, K., Mozurkewich, M., Li, S.-M., and Leaitch, W. R.: Particle formation and growth at five rural and urban sites, Atmos. Chem. Phys., 10, 7979–7995, https://doi.org/10.5194/acp-10-7979-2010, 2010. a
Kerminen, V.-M. and Kulmala, M.: Analytical formulae connecting the “real” and the “apparent” nucleation rate and the nuclei number concentration for atmospheric nucleation events, J. Aerosol Sci., 33, 609–622, https://doi.org/10.1016/S0021-8502(01)00194-X, 2002. a
Kerminen, V.-M., Petäjä, T., Manninen, H. E., Paasonen, P., Nieminen, T., Sipilä, M., Junninen, H., Ehn, M., Gagné, S., Laakso, L., Riipinen, I., Vehkamäki, H., Kurten, T., Ortega, I. K., Dal Maso, M., Brus, D., Hyvärinen, A., Lihavainen, H., Leppä, J., Lehtinen, K. E. J., Mirme, A., Mirme, S., Hõrrak, U., Berndt, T., Stratmann, F., Birmili, W., Wiedensohler, A., Metzger, A., Dommen, J., Baltensperger, U., Kiendler-Scharr, A., Mentel, T. F., Wildt, J., Winkler, P. M., Wagner, P. E., Petzold, A., Minikin, A., Plass-Dülmer, C., Pöschl, U., Laaksonen, A., and Kulmala, M.: Atmospheric nucleation: highlights of the EUCAARI project and future directions, Atmos. Chem. Phys., 10, 10829–10848, https://doi.org/10.5194/acp-10-10829-2010, 2010. a, b
Kerminen, V.-M., Paramonov, M., Anttila, T., Riipinen, I., Fountoukis, C., Korhonen, H., Asmi, E., Laakso, L., Lihavainen, H., Swietlicki, E., Svenningsson, B., Asmi, A., Pandis, S. N., Kulmala, M., and Petäjä, T.: Cloud condensation nuclei production associated with atmospheric nucleation: a synthesis based on existing literature and new results, Atmos. Chem. Phys., 12, 12037–12059, https://doi.org/10.5194/acp-12-12037-2012, 2012. a
Kulmala, M., Vehkamäki, H., Petäjä, T., Dal Maso, M., Lauri, A., Kerminen, V.-M., Birmili, W., and McMurry, P. H.: Formation and growth of ultrafine atmospheric particles: a review of observations, J. Aerosol Sci., 35, 143–176, https://doi.org/10.1016/j.jaerosci.2003.10.003, 2004. a, b, c
Kulmala, M., Asmi, A., Lappalainen, H. K., Baltensperger, U., Brenguier, J.-L., Facchini, M. C., Hansson, H.-C., Hov, Ø., O'Dowd, C. D., Pöschl, U., Wiedensohler, A., Boers, R., Boucher, O., de Leeuw, G., Denier van der Gon, H. A. C., Feichter, J., Krejci, R., Laj, P., Lihavainen, H., Lohmann, U., McFiggans, G., Mentel, T., Pilinis, C., Riipinen, I., Schulz, M., Stohl, A., Swietlicki, E., Vignati, E., Alves, C., Amann, M., Ammann, M., Arabas, S., Artaxo, P., Baars, H., Beddows, D. C. S., Bergström, R., Beukes, J. P., Bilde, M., Burkhart, J. F., Canonaco, F., Clegg, S. L., Coe, H., Crumeyrolle, S., D'Anna, B., Decesari, S., Gilardoni, S., Fischer, M., Fjaeraa, A. M., Fountoukis, C., George, C., Gomes, L., Halloran, P., Hamburger, T., Harrison, R. M., Herrmann, H., Hoffmann, T., Hoose, C., Hu, M., Hyvärinen, A., Hõrrak, U., Iinuma, Y., Iversen, T., Josipovic, M., Kanakidou, M., Kiendler-Scharr, A., Kirkevåg, A., Kiss, G., Klimont, Z., Kolmonen, P., Komppula, M., Kristjánsson, J.-E., Laakso, L., Laaksonen, A., Labonnote, L., Lanz, V. A., Lehtinen, K. E. J., Rizzo, L. V., Makkonen, R., Manninen, H. E., McMeeking, G., Merikanto, J., Minikin, A., Mirme, S., Morgan, W. T., Nemitz, E., O'Donnell, D., Panwar, T. S., Pawlowska, H., Petzold, A., Pienaar, J. J., Pio, C., Plass-Duelmer, C., Prévôt, A. S. H., Pryor, S., Reddington, C. L., Roberts, G., Rosenfeld, D., Schwarz, J., Seland, Ø., Sellegri, K., Shen, X. J., Shiraiwa, M., Siebert, H., Sierau, B., Simpson, D., Sun, J. Y., Topping, D., Tunved, P., Vaattovaara, P., Vakkari, V., Veefkind, J. P., Visschedijk, A., Vuollekoski, H., Vuolo, R., Wehner, B., Wildt, J., Woodward, S., Worsnop, D. R., van Zadelhoff, G.-J., Zardini, A. A., Zhang, K., van Zyl, P. G., Kerminen, V.-M., S Carslaw, K., and Pandis, S. N.: General overview: European Integrated project on Aerosol Cloud Climate and Air Quality interactions (EUCAARI) – integrating aerosol research from nano to global scales, Atmos. Chem. Phys., 11, 13061–13143, https://doi.org/10.5194/acp-11-13061-2011, 2011. a
Kulmala, M., Petäjä, T., Nieminen, T., Sipilä, M., Manninen, H. E., Lehtipalo, K., Dal Maso, M., Aalto, P. P., Junninen, H., Paasonen, P., Riipinen, I., Lehtinen, K. E. J., Laaksonen, A., and Kerminen, V.-M.: Measurement of the nucleation of atmospheric aerosol particles, Nat. Protoc., 7, 1651–1667, https://doi.org/10.1038/nprot.2012.091, 2012. a
Lohmann, U. and Feichter, J.: Global indirect aerosol effects: a review, Atmos. Chem. Phys., 5, 715–737, https://doi.org/10.5194/acp-5-715-2005, 2005. a
Manninen, H. E., Nieminen, T., Asmi, E., Gagné, S., Häkkinen, S., Lehtipalo, K., Aalto, P., Vana, M., Mirme, A., Mirme, S., Hõrrak, U., Plass-Dülmer, C., Stange, G., Kiss, G., Hoffer, A., Törő, N., Moerman, M., Henzing, B., de Leeuw, G., Brinkenberg, M., Kouvarakis, G. N., Bougiatioti, A., Mihalopoulos, N., O'Dowd, C., Ceburnis, D., Arneth, A., Svenningsson, B., Swietlicki, E., Tarozzi, L., Decesari, S., Facchini, M. C., Birmili, W., Sonntag, A., Wiedensohler, A., Boulon, J., Sellegri, K., Laj, P., Gysel, M., Bukowiecki, N., Weingartner, E., Wehrle, G., Laaksonen, A., Hamed, A., Joutsensaari, J., Petäjä, T., Kerminen, V.-M., and Kulmala, M.: EUCAARI ion spectrometer measurements at 12 European sites – analysis of new particle formation events, Atmos. Chem. Phys., 10, 7907–7927, https://doi.org/10.5194/acp-10-7907-2010, 2010. a, b, c, d
Manninen, H. E., Franchin, A., Schobesberger, S., Hirsikko, A., Hakala, J., Skromulis, A., Kangasluoma, J., Ehn, M., Junninen, H., Mirme, A., Mirme, S., Sipilä, M., Petäjä, T., Worsnop, D. R., and Kulmala, M.: Characterisation of corona-generated ions used in a Neutral cluster and Air Ion Spectrometer (NAIS), Atmos. Meas. Tech., 4, 2767–2776, https://doi.org/10.5194/amt-4-2767-2011, 2011. a
Mikkonen, S., Romakkaniemi, S., Smith, J. N., Korhonen, H., Petäjä, T., Plass-Duelmer, C., Boy, M., McMurry, P. H., Lehtinen, K. E. J., Joutsensaari, J., Hamed, A., Mauldin III, R. L., Birmili, W., Spindler, G., Arnold, F., Kulmala, M., and Laaksonen, A.: A statistical proxy for sulphuric acid concentration, Atmos. Chem. Phys., 11, 11319–11334, https://doi.org/10.5194/acp-11-11319-2011, 2011. a, b, c, d, e
Mirme, A., Tamm, E., Mordas, G., Vana, M., Uin, J., Mirme, S., Bernotas, T., Laakso, L., Hirsikko, A., and Kulmala, M.: A wide range multi-channel air ion spectrometer, Boreal Environ. Res., 12, 247–264, 2007. a
Mirme, S. and Mirme, A.: The mathematical principles and design of the NAIS – a spectrometer for the measurement of cluster ion and nanometer aerosol size distributions, Atmos. Meas. Tech., 6, 1061–1071, https://doi.org/10.5194/amt-6-1061-2013, 2013. a
Napari, I., Noppel, M., Vehkamäki, H., and Kulmala, M.: Parametrization of ternary nucleation rates for H2SO4–NH3–H2O vapors, J. Geophys. Res., 107, 4381, https://doi.org/10.1029/2002JD002132, 2002. a, b, c, d
Nilsson, E. D., Rannik, Ü., Kulmala, M., Buzorius, G., and O'Dowd, C. D.: Effects of continental boundary layer evolution, convection, turbulence and entrainment, on aerosol formation, Tellus B, 53, 4, 441–461, 2001. a
Paasonen, P., Nieminen, T., Asmi, E., Manninen, H. E., Petäjä, T., Plass-Dülmer, C., Flentje, H., Birmili, W., Wiedensohler, A., Hõrrak, U., Metzger, A., Hamed, A., Laaksonen, A., Facchini, M. C., Kerminen, V.-M., and Kulmala, M.: On the roles of sulphuric acid and low-volatility organic vapours in the initial steps of atmospheric new particle formation, Atmos. Chem. Phys., 10, 11223–11242, https://doi.org/10.5194/acp-10-11223-2010, 2010. a
Petäjä, T., Mauldin, III, R. L., Kosciuch, E., McGrath, J., Nieminen, T., Paasonen, P., Boy, M., Adamov, A., Kotiaho, T., and Kulmala, M.: Sulfuric acid and OH concentrations in a boreal forest site, Atmos. Chem. Phys., 9, 7435–7448, https://doi.org/10.5194/acp-9-7435-2009, 2009. a
Pirjola, L., Kulmala, M., Wilck, M., Bischoff, A., Stratmann, F., and Otto, E.: Formation of sulphuric acid aerosols and cloud condensation nuclei: an expression for significant nucleation and model comparison, J. Aerosol Sci., 30, 1079–1094, https://doi.org/10.1016/S0021-8502(98)00776-9, 1999. a
Platis, A., Altstädter, B., Wehner, B., Wildmann, N., Lampert, A., Hermann, M., Birmili, W., and Bange, J.: An observational case study on the influence of atmospheric boundary-layer dynamics on new particle formation, Bound.-Lay. Meteorol., 158, 67–92, https://doi.org/10.1007/s10546-015-0084-y, 2016. a, b, c, d
Pope, C. A. and Dockery, D. W.: Health effects of fine particulate air pollution: lines that connect, J. Air Waste Manage., 56, 709–742, 2006. a
Poulain, L., Spindler, G., Birmili, W., Plass-Dülmer, C., Wiedensohler, A., and Herrmann, H.: Seasonal and diurnal variations of particulate nitrate and organic matter at the IfT research station Melpitz, Atmos. Chem. Phys., 11, 12579–12599, https://doi.org/10.5194/acp-11-12579-2011, 2011. a, b
Riccobono, F., Schobesberger, S., Scott, C. E., Dommen, J., Ortega, I. K., Rondo, L., Almeida, J., Amorim, A., Bianchi, F., Breitenlechner, M., David, A., Downard, A., Dunne, E. M., Duplissy, J., Ehrhart, S., Flagan, R. C., Franchin, A., Hansel, A., Junninen, H., Kajos, M., Keskinen, H., Kupc, A., Kürten, A., Kvashin, A. N., Laaksonen, A., Lehtipalo, K., Makhmutov, V., Mathot, S., Nieminen, T., Onnela, A., Petäjä, T., Praplan, A. P., Santos, F. D., Schallhart, S., Seinfeld, J. H., Sipilä, M., Spracklen, D. V., Stozhkov, Y., Stratmann, F., Tomé, A., Tsagkogeorgas, G., Vaattovaara, P., Viisanen, Y., Vrtala, A., Wagner, P. E., Weingartner, E., Wex, H., Wimmer, D., Carslaw, K. S., Curtius, J., Donahue, N. M., Kirkby, J., Kulmala, M., Worsnop, D. R., and Baltensperger, U.: Oxidation products of biogenic emissions contribute to nucleation of atmospheric particles, Science, 344, 717–721, https://doi.org/10.1126/science.1243527, 2014. a
Riipinen, I., Pierce, J. R., Yli-Juuti, T., Nieminen, T., Häkkinen, S., Ehn, M., Junninen, H., Lehtipalo, K., Petäjä, T., Slowik, J., Chang, R., Shantz, N. C., Abbatt, J., Leaitch, W. R., Kerminen, V.-M., Worsnop, D. R., Pandis, S. N., Donahue, N. M., and Kulmala, M.: Organic condensation: a vital link connecting aerosol formation to cloud condensation nuclei (CCN) concentrations, Atmos. Chem. Phys., 11, 3865–3878, https://doi.org/10.5194/acp-11-3865-2011, 2011. a
Rohrer, F. and Berresheim, H.: Strong correlation between levels of tropospheric hydroxyl radicals and solar ultraviolet radiation, Nature, 442, 184–187, https://doi.org/10.1038/nature04924, 2006. a
Schobesberger, S., Franchin, A., Bianchi, F., Rondo, L., Duplissy, J., Kürten, A., Ortega, I. K., Metzger, A., Schnitzhofer, R., Almeida, J., Amorim, A., Dommen, J., Dunne, E. M., Ehn, M., Gagné, S., Ickes, L., Junninen, H., Hansel, A., Kerminen, V.-M., Kirkby, J., Kupc, A., Laaksonen, A., Lehtipalo, K., Mathot, S., Onnela, A., Petäjä, T., Riccobono, F., Santos, F. D., Sipilä, M., Tomé, A., Tsagkogeorgas, G., Viisanen, Y., Wagner, P. E., Wimmer, D., Curtius, J., Donahue, N. M., Baltensperger, U., Kulmala, M., and Worsnop, D. R.: On the composition of ammonia–sulfuric-acid ion clusters during aerosol particle formation, Atmos. Chem. Phys., 15, 55–78, https://doi.org/10.5194/acp-15-55-2015, 2015. a
Sipilä, M., Berndt, T., Petäjä, T., Brus, D., Vanhanen, J., Stratmann, F., Patokoski, J., Mauldin III, R. L., Hyvärinen, A.-P., Lihavainen, H., and Kulmala, M.: Role of sulfuric acid in atmospheric nucleation, Science, 327, 1243–1246, https://doi.org/10.1126/science.1180315, 2010. a
Sipilä, M., Lehtipalo, K., and Kulmala, M.: Atmospheric particle nucleation, in: Aerosol Science – Technology and Applications, edited by: Colbeck, I., and Lazaridis, M., John Wiley and Sons, Chichester, UK, 153–180, 2014. a
Spindler, G., Mölders, N., Hanss, J., Beier, N., and Kramm, G.: Determining the dry deposition of SO2, O3, NO, and NO2 at the SANA core station Melpitz, Meteorol. Z., 5, 205–220, 1996. a
Spindler, G., Brüggemann, E., Gnauk, T., Grüner, A., Müller, K., and Herrmann, H.: A four-year size-segregated characterization study of particles PM10, PM2.5 and PM1 depending on air mass origin at Melpitz, Atmos. Environ., 44, 164–173, 2010. a
Spracklen, D. V., Carslaw, K. S., Merikanto, J., Mann, G. W., Reddington, C. L., Pickering, S., Ogren, J. A., Andrews, E., Baltensperger, U., Weingartner, E., Boy, M., Kulmala, M., Laakso, L., Lihavainen, H., Kivekäs, N., Komppula, M., Mihalopoulos, N., Kouvarakis, G., Jennings, S. G., O'Dowd, C., Birmili, W., Wiedensohler, A., Weller, R., Gras, J., Laj, P., Sellegri, K., Bonn, B., Krejci, R., Laaksonen, A., Hamed, A., Minikin, A., Harrison, R. M., Talbot, R., and Sun, J.: Explaining global surface aerosol number concentrations in terms of primary emissions and particle formation, Atmos. Chem. Phys., 10, 4775–4793, https://doi.org/10.5194/acp-10-4775-2010, 2010. a
Stanier, C. O., Khlystov, A. Y., and Pandis, S. N.: Ambient aerosol size distributions and number concentrations measured during the Pittsburgh Air Quality Study (PAQS), Atmos. Environ., 38, 3275–3284, https://doi.org/10.1016/j.atmosenv.2004.03.020, 2004. a
Student (W. S. Gosset): The probable error of a mean, Biometrika, 6, 1–25, https://doi.org/10.1093/biomet/6.1.1, 1908. a
Stratmann, F., Siebert, H., Spindler, G., Wehner, B., Althausen, D., Heintzenberg, J., Hellmuth, O., Rinke, R., Schmieder, U., Seidel, C., Tuch, T., Uhrner, U., Wiedensohler, A., Wandinger, U., Wendisch, M., Schell, D., and Stohl, A.: New-particle formation events in a continental boundary layer: first results from the SATURN experiment, Atmos. Chem. Phys., 3, 1445–1459, https://doi.org/10.5194/acp-3-1445-2003, 2003. a
Tuch, T. M., Haudek, A., Müller, T., Nowak, A., Wex, H., and Wiedensohler, A.: Design and performance of an automatic regenerating adsorption aerosol dryer for continuous operation at monitoring sites, Atmos. Meas. Tech., 2, 417–422, https://doi.org/10.5194/amt-2-417-2009, 2009. a
Vakkari, V., Laakso, H., Kulmala, M., Laaksonen, A., Mabaso, D., Molefe, M., Kgabi, N., and Laakso, L.: New particle formation events in semi-clean South African savannah, Atmos. Chem. Phys., 11, 3333–3346, https://doi.org/10.5194/acp-11-3333-2011, 2011. a
Weber, R. J., Marti, J. J., McMurry, P. H., Eisele, F. L., Tanner, D. J., and Jefferson, A.: Measurements of new particle formation and ultrafine particle growth rates at a clean continental site, J. Geophys. Res., 102, 4375–4385, https://doi.org/10.1029/96JD03656, 1997. a
Weber, R. J., McMurry, P. H., Mauldin III, R. L., Tanner, D. J., Eisele, F. L., Clarke, A. D., and Kapustin, V. N.: New particle formation in the remote troposphere: a comparison of observations at various sites, Geophys. Res. Lett., 26, 307–310, https://doi.org/10.1029/1998GL900308, 1999. a
Wehner, B., Petäjä, T., Boy, M., Engler, C., Birmili, W., Tuch, T., Wiedensohler, A., and Kulmala, M.: The contribution of sulfuric acid and non-volatile compounds on the growth of freshly formed atmospheric aerosols, Geophys. Res. Lett., 32, L17810, https://doi.org/10.1029/2005GL023827, 2005. a
Wehner, B., Birmili, W., Ditas, F., Wu, Z., Hu, M., Liu, X., Mao, J., Sugimoto, N., and Wiedensohler, A.: Relationships between submicrometer particulate air pollution and air mass history in Beijing, China, 2004–2006, Atmos. Chem. Phys., 8, 6155–6168, https://doi.org/10.5194/acp-8-6155-2008, 2008. a
Westervelt, D. M., Pierce, J. R., and Adams, P. J.: Analysis of feedbacks between nucleation rate, survival probability and cloud condensation nuclei formation, Atmos. Chem. Phys., 14, 5577–5597, https://doi.org/10.5194/acp-14-5577-2014, 2014. a
Wiedensohler, A., Birmili, W., Nowak, A., Sonntag, A., Weinhold, K., Merkel, M., Wehner, B., Tuch, T., Pfeifer, S., Fiebig, M., Fjäraa, A. M., Asmi, E., Sellegri, K., Depuy, R., Venzac, H., Villani, P., Laj, P., Aalto, P., Ogren, J. A., Swietlicki, E., Williams, P., Roldin, P., Quincey, P., Hüglin, C., Fierz-Schmidhauser, R., Gysel, M., Weingartner, E., Riccobono, F., Santos, S., Grüning, C., Faloon, K., Beddows, D., Harrison, R., Monahan, C., Jennings, S. G., O'Dowd, C. D., Marinoni, A., Horn, H.-G., Keck, L., Jiang, J., Scheckman, J., McMurry, P. H., Deng, Z., Zhao, C. S., Moerman, M., Henzing, B., de Leeuw, G., Löschau, G., and Bastian, S.: Mobility particle size spectrometers: harmonization of technical standards and data structure to facilitate high quality long-term observations of atmospheric particle number size distributions, Atmos. Meas. Tech., 5, 657–685, https://doi.org/10.5194/amt-5-657-2012, 2012. a
Woo, K. S., Chen, D. R., Pui, D. Y. H., and McMurry, P. H.: Measurement of Atlanta aerosol size distributions: Observations of ultrafine particle events, Aerosol Sci. Tech., 34, 75–87, https://doi.org/10.1080/02786820120056, 2001. a
Yu, F. and Turco, R. P.: The size-dependent charge fraction of sub-3-nm particles as a key diagnostic of competitive nucleation mechanisms under atmospheric conditions, Atmos. Chem. Phys., 11, 9451–9463, https://doi.org/10.5194/acp-11-9451-2011, 2011. a
Yue, D. L., Hu, M., Zhang, R. Y., Wang, Z. B., Zheng, J., Wu, Z. J., Wiedensohler, A., He, L. Y., Huang, X. F., and Zhu, T.: The roles of sulfuric acid in new particle formation and growth in the mega-city of Beijing, Atmos. Chem. Phys., 10, 4953–4960, https://doi.org/10.5194/acp-10-4953-2010, 2010. a
Zhang, Q. I., Stanier, C. O., Canagaratna, M. R., Jayne, J. T., Worsnop, D. R., Pandis, S. N., and Jimenez, J. L.: Insights into the chemistry of new particle formation and growth events in Pittsburgh based on aerosol mass spectrometry, Environ. Sci. Technol., 38, 4797–4809, https://doi.org/10.1021/es035417u, 2004. a
Zieger, P., Fierz-Schmidhauser, R., Poulain, L., Müller, T., Birmili, W., Spindler, G., Wiedensohler, A., Baltensperger, U., and Weingartner, E.: Influence of water uptake on the aerosol particle light scattering coefficients of the Central European aerosol, Tellus B, 66, 22716, https://doi.org/10.3402/tellusb.v66.22716, 2014. a
Technically, the lower limit of the APS is 500 nm in aerodynamic diameter. Converting this aerodynamic diameter into a mobility diameter yields a lower cut-off of 383 nm. Comparison with particle mobility size spectrometer data suggests, however, that the APS becomes increasingly unreliable at the lower end of its measurement range. (In principle, the APS performs best for large particles that are separated by their inertia in the instrument's counterflow. Smaller particles tend to separate only to a poor degree in the separation unit of the instrument.) Therefore, TDMPS data were used exclusively between 20 and 800 nm, with the APS data continuing the size distribution above that point.
- Abstract
- Introduction
- Methods and data
- Exemplary NPF events
- NPF event classification
- Correlations with gas-phase and meteorological parameters
- Discussion
- Conclusions
- Data availability
- Appendix A: Hygroscopic growth parameterisation
- Appendix B: Proxy functions for sulfuric acid parameterisation
- Appendix C: Characteristics of the 27 manually selected NPF events
- Appendix D: Alternate version of the diurnal cycles
- Appendix E: Additional correlation diagrams
- Competing interests
- Acknowledgements
- References