the Creative Commons Attribution 4.0 License.
the Creative Commons Attribution 4.0 License.
 | 07 Feb 2018
Age and gravitational separation of the stratospheric air over Indonesia
Satoshi Sugawara
Shigeyuki Ishidoya
Shuji Aoki
Shinji Morimoto
Takakiyo Nakazawa
Sakae Toyoda
Yoichi Inai
Fumio Hasebe
Chusaku Ikeda
Hideyuki Honda
Daisuke Goto
Fanny A. Putri
The gravitational separation of major atmospheric components, in addition to the age of air, would provide additional useful information about stratospheric circulation. However, observations of the age of air and gravitational separation are still geographically sparse, especially in the tropics. In order to address this issue, air samples were collected over Biak, Indonesia in February 2015 using four large plastic balloons, each loaded with two compact cryogenic samplers. With a vertical resolution of better than 2 km, air samples from seven different altitudes were analyzed for CO2 and SF6 mole fractions, δ15N of N2, δ18O of O2, and δ(Ar∕N2) to examine the vertically dependent age and gravitational separation of air in the tropical tropopause layer (TTL) and the equatorial stratosphere. By comparing their measured mole fractions with aircraft observations in the upper tropical troposphere, we have found that CO2 and SF6 ages increase gradually with increasing altitude from the TTL to 22 km, and then rapidly from there up to 29 km. The CO2 and SF6 ages agree well with each other in the TTL and in the lower stratosphere, but show a significant difference above 24 km. The average values of δ15N of N2, δ18O of O2, and δ(Ar∕N2) all show a small but distinct upward decrease due to the gravitational separation effect. Simulations with a two-dimensional atmospheric transport model indicate that the gravitational separation effect decreases as tropical upwelling is enhanced. From the model calculations with enhanced eddy mixing, it is also found that the upward increase in air age is magnified by horizontal mixing. These model simulations also show that the gravitational separation effect remains relatively constant in the lower stratosphere. The results of this study strongly suggest that the gravitational separation, combined with the age of air, can be used to diagnose air transport processes in the stratosphere.
- Article
(965 KB) - Full-text XML
- BibTeX
- EndNote


The mean age of air, defined as the mean transit time of air parcels in the stratosphere, provides important information about various stratospheric transport processes. It is expected that possible long-term changes in the Brewer–Dobson (BD) circulation are detectable from changes in the mean age of air evaluated from measurements of the stratospheric CO2 and SF6 mole fractions. Balloon and satellite observations (Engel et al., 2009, 2017; Stiller et al., 2012) found that the age of air derived from CO2 and SF6 in the stratosphere over the northern midlatitudes did not show any significant trend above 25 km over the last 30 years, although satellite observations have indicated that the SF6 age might have increased for the period 2002–2010. To further add fire to the debate, results obtained from balloon and satellite observations do not agree with the recent model predictions that the BD circulation is accelerated due to an enhancement of mass flux from the tropical troposphere into the stratosphere (Austin and Li, 2006; Li et al., 2008). More recently, Haenel et al. (2015) reported a negative trend in the age of air in the lowermost tropical stratosphere by revising the MIPAS SF6 age data. Bönisch et al. (2011) suggested that the increased upwelling in the tropics after 2000 enhanced the lower stratospheric transport from the tropics into the extra-tropics. From an analysis of the ERA-Interim dataset, Diallo et al. (2012) also showed a negative trend over the 1989–2010 period in the lower stratosphere below 25 km. Linz et al. (2017) discussed the strength of the meridional overturning circulation of the stratosphere by using satellite observation data of SF6 and N2O and suggested that a mesospheric SF6 loss is important for age estimation using SF6 mole fraction in the upper layer.
A clock tracer, such as CO2 or SF6, is lifted up from the tropical upper troposphere into the stratosphere and is transported to midlatitudes; part of this then returns to the lower latitudes via mixing process in the stratosphere, which results in increasing the clock tracer age in the lower latitudes. Therefore, to discuss a change in the mean age estimated using the clock tracer, it is important to separately evaluate the respective effects of mean circulation and mixing processes on the air age (Garny et al., 2014; Ploeger et al., 2015; Linz et al., 2016). Recently, it was shown by high-precision measurements of the isotopic ratios of N2, O2, and Ar and the Ar∕N2 ratio that the gravitational separation of the air is clearly observable in the northern midlatitude stratosphere (Ishidoya et al., 2006, 2008a, b, 2013). Ishidoya et al. (2013) also reported that the gravitational separation could be used as a new indicator to detect long-term behavior of the BD circulation.
Most stratospheric air originates in the tropical tropopause layer (TTL) and is then slowly lifted up from lower to upper levels. Therefore, observations of stratospheric air compositions, from which the age and gravitational separation of air are deduced, are necessary in the equatorial region to understand the various transport processes in the stratosphere. Collecting whole air with balloon-borne samplers is the most reliable method so far to precisely observe the mole fractions of atmospheric compositions from the tropopause to about 35 km. In previous studies, air sampling has been carried out in the low-latitude stratosphere (Volk et al., 1996; Patra et al., 1997; Schauffler et al., 1998; Andrews et al., 2001; Kaiser et al., 2006; Laube et al., 2010; Brinckmann et al., 2012). However, balloon measurements in the low latitudes, especially to high altitudes (∼ 30 km), have not been conducted as often as those in the middle and high latitudes, mainly due to the limited availability of balloon launching facilities.
To measure the CO2 and SF6 mole fractions, δ15N of N2, δ18O of O2, and δ(Ar∕N2) in the equatorial stratosphere, we conducted whole air sampling with balloon-borne cryogenic samplers over Biak, Indonesia in February 2015 as part of an observation campaign called “Coordinated Upper-troposphere-to-stratosphere Balloon Experiment in Biak” (CUBE/Biak; Hasebe et al., 2018) in cooperation with the National Institute of Aeronautics and Space of the Republic of Indonesia (LAPAN). In this paper, we present measured vertical profiles of the CO2 and SF6 mole fractions, δ15N of N2, δ18O of O2, and δ(Ar∕N2) and discuss some of the implications of these measurements on the age and gravitational separation of stratospheric air. We also simulated the age and gravitational separation of air using a two-dimensional model (SOCRATES; Huang et al., 1998; Park et al., 1999; Khosravi et al., 2002). Based on the simulation results, we discuss the effects of tropical upwelling and horizontal mixing on the age and gravitational separation of air.
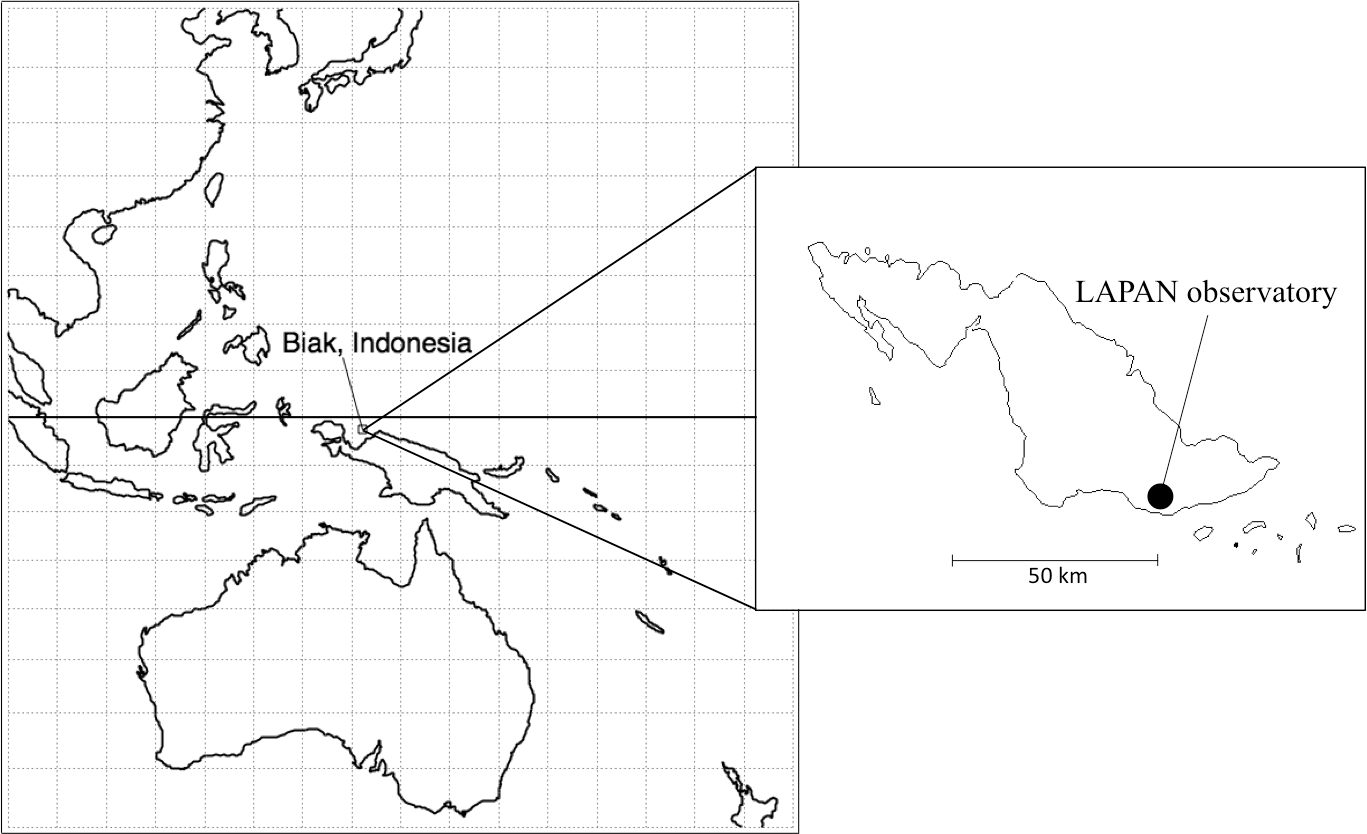
The collection of stratospheric air over Indonesia was performed using a balloon-borne cryogenic sampler. A map of the balloon launch site is shown in Fig. 1. The cryogenic air sampler is equipped with a cooling device called a Joule–Thomson (J–T) mini-cooler in which neon is liquefied to be used as a refrigerant for collecting stratospheric air cryogenically (Morimoto et al., 2009). Eight sets of cryogenic air samplers and four large plastic balloons were prepared for the Biak campaign. Each balloon was loaded with two air samplers to collect stratospheric air at two different altitudes. The balloons were launched from the LAPAN observatory at Biak (001∘10′32 S 136∘06′02 E) on 22, 24, 26, and 28 February 2015; the samplers were recovered from a coastal area of Biak on the same day of each launch. Thus, we successfully collected stratospheric air samples at eight altitudes from 17.2 to 28.7 km, with one at 17.2 and another at 18.5 km inside the tropical tropopause layer (TTL). In the present study, air sampling was performed during balloon ascent. In the past, we conducted a number of similar air samplings using a cryogenic sampler with liquid helium (Honda et al., 1996) in which we collected samples during the balloon ascent and descent over Japan; they showed that the outgassing from the balloon and payload had a negligibly small impact on the air sample quality even if air sampling was made during the balloon ascent (Morimoto et al., 2009; Nakazawa et al., 2002). One sampler assigned to 21 km leaked after landing due to a defect in electric circuit. Overall, the amount of air collected ranged from 2.0 to 9.3 L at standard temperature (0 ∘C) and pressure (1013.25 hPa) depending on the sampling altitude, which was enough to measure the mole fractions and isotopic ratios of various gases. The collected air samples were sent to Japan and then analyzed for δ15N of N2, δ18O of O2, and δ(Ar∕N2) using a mass spectrometer and for CO2 and SF6 mole fractions using a nondispersive infrared gas analyzer (NDIR) and a gas chromatograph (GC) equipped with an electron capture detector (ECD), respectively.
In this study, δ15N, δ18O, and δ(Ar∕N2) are defined as:
and
where n means the amount of each substance, and “sample” and “standard” denote the sample and standard gases, respectively. The technical details of our mass spectrometry analyses have been described in Ishidoya and Murayama (2014). In this study, only the method of sample air flow into the mass spectrometer was modified from the previous method described in Ishidoya et al. (2013). With this modification, only a miniscule amount of sample air split off from an inlet system was transferred to the mass spectrometer through a fused silica capillary. While the sample amount used for this method was larger than before, the precision was improved by 1 order of magnitude. In this study, we were able to determine δ15N, δ18O, and δ(Ar∕N2) more precisely than Ishidoya et al. (2013), with a respective reproducibility of about ±2, ±5, and ±7 per meg (±1σ), which is precise enough to detect small variations of interest in the stratosphere over the equatorial region. The detailed technical aspects of our CO2 analysis have been given in Nakazawa et al. (1995) and Aoki et al. (2003). The CO2 mole fraction was measured using an NDIR with an analytical precision of better than 0.02 µmol mol−1 by employing our new CO2 standard gases prepared in 2010 with a one-step dilution gravimetric method with an estimated uncertainty of 0.1 µmol mol−1.
Since our SF6 analysis procedure has not been published yet, a brief description is given here. The SF6 mole fraction of each sample was determined twice at Tohoku University (TU) and twice at the Miyagi University of Education (MUE) against our SF6 standard gas scale using their respective GCs. The analytical procedures at TU and MUE were basically the same, with a mixture of Ar (95 %) and CH4 (5 %) used as a carrier gas for both GCs, but while TU employed Agilent 6890 with a packed column, MUE used 7890N with a capillary column. The volume of a sample loop was 10 mL for the TU GC and 1 mL for the MUE GC. Our SF6 working standard gases used for the sample analysis were calibrated against our primary standard gases that were produced by using the seven-step dilution gravimetric method. The relationships between the ECD signal and the mole fractions of the primary standard gases were approximated with quadratic equations. We prepared the primary standard gases (3, 5, 10, 30 pmol mol−1, respectively) twice in 2001 (2001 scale) and 2002 (2002 scale) and found that the 2001 scale provides higher values by 0.10–0.15 pmol mol−1 than the 2002 scale in a range of observed atmospheric SF6 mole fractions. The 2001 scale was compared with those of other institutes in the 5th and 6th WMO/IAEA Round Robin Comparison Experiment programs (https://www.esrl.noaa.gov/gmd/ccgg/wmorr/), and the results showed that the 2001 scale is higher by 0.15 pmol mol−1 on average than the WMO X2006 scale. We also made an intercomparison of the SF6 standard gas among TU, MUE, and the National Institute of Environmental Studies (NIES), Japan in August 2016. The results indicated that the 2001 scale is higher by 0.10–0.15 pmol mol−1 than the NIES gravimetric scale, implying a good agreement between the 2002 scale and the NIES scale. Therefore, we decided to employ the 2002 scale for our measurements of the SF6 mole fraction. As a result, our calibration scale agreed to within our measurement precision with the WMO X2006 and NIES scales over the range of mole fractions observed in this study. The reproducibility of our SF6 analysis was estimated to be better than 0.09 pmol mol−1 based on 1 standard deviation (1σ) obtained from three replicate analyses of one air sample. The CH4 mole fraction of the air sample was also determined against our gravimetrically prepared CH4 standard gas system using the GC with a flame ionization detector (Sugawara et al., 1997), since the measured value is necessary for the estimation of CO2 age, as described below.
Table 1CO2 and SF6 mole fractions and ages observed over Biak, Indonesia in February 2015.
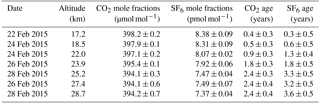
Table 2The values of δ15N of N2, δ18O of O2, δ(Ar∕N2), and <δ> observed over Biak, Indonesia in February 2015. All values are expressed as deviations from the measured values at 17.2 km.
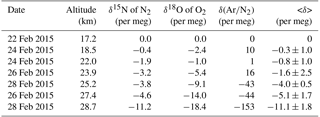

Figure 2(a) Vertical profiles of the CO2 and SF6 mole fractions observed over Biak, Indonesia on 22–28 February 2015 and Hokkaido, Japan (042∘30′00 N 143∘26′00 E) on 6 August 2015. Vertical error bars of CO2 represent vertical ranges of air sampling. (b) Same as panel (a) but for δ15N of N2, δ18O of O2, and δ(Ar∕N2) observed over Biak and Sanriku, Japan (039∘09′39 N 141∘49′19 E) on 4 June 2007 (Ishidoya et al., 2013); δ15N of N2, δ18O of O2, and δ(Ar∕N2) observed over Sanriku are expressed as deviations from the measured values at 14.5 km.
Possible deterioration of an air sample during storage should be closely examined and taken into account to accurately estimate the age of air from the measured mole fraction. From our experience of collecting air samples using the cryogenic sampler in Antarctica and the eastern equatorial Pacific, we have found that the CO2 mole fraction of air collected in a stainless steel bottle changes during sample storage, presumably due to CO2 absorption on the inner wall of the bottle. Although all the stainless steel bottles used in this study were repeatedly evacuated prior to use, the CO2 mole fraction still showed a slight decrease. Therefore, we carried out a sample storage test for each bottle to correct for the deterioration effect on CO2 mole fraction. The correction amount ranged from 0.0 to 0.7 µmol mol−1 depending on the bottle. These deterioration effects have a large influence on the age determination because the correction of 0.7 µmol mol−1 for CO2 mole fraction is equivalent to 0.3 years of age correction. Therefore, the maximum age error was estimated by taking into account this deterioration for each sampler. We did not make a similar storage test for SF6 prior to use; however, the SF6 mole fraction of sample air was reanalyzed 1 month after the first set of analyses to check for possible changes in the mole fraction during the storage period. Since changes in the SF6 mole fraction were found to be 0.01–0.07 pmol mol−1, the deterioration of SF6 during the storage period was neglected. The change in the CH4 mole fraction was also found to be within our measurement precision (Morimoto et al., 2009), and the impact of error propagation to the age determination was negligible.
3.1 Vertical profiles
Vertical profiles of the CO2 and SF6 mole fractions, δ15N of N2, δ18O of O2, and δ(Ar∕N2) in the TTL and stratosphere over Biak are shown in Fig. 2. The exact values are given in Tables 1 and 2. As shown in Fig. 2, the CO2 and SF6 mole fractions are high in the TTL and decrease with increasing altitude. Considering that there are no sources and sinks of CO2 and SF6 in the stratosphere, except for a small amount of CO2 production by CH4 oxidation, the observed vertical profiles of the two variables are mainly formed by atmospheric transport processes. In particular, tropical upwelling in the atmosphere plays an important role in the mole fraction decrease with altitude; i.e., temporal variations in the mole fraction in the upper tropical troposphere are recorded as a vertical distribution due to the upward air transport from the TTL to the stratosphere. It is also seen from Fig. 2 that the mole fractions do not change monotonically with altitude but decrease gradually from the TTL to 24 km and then rapidly to near constant values above 25 km. While the physical details of such complicated vertical CO2 and SF6 profiles are unclear, they can be reasonably reproduced by height-dependent upwelling and/or vertical and horizontal mixing. The vertical propagation of the CO2 seasonal cycle from the troposphere will likely influence the vertical distribution of the CO2 mole fraction, especially in the tropical lower stratosphere, since the seasonal amplitude in the tropical upper troposphere was observed to be larger than 3.3 µmol mol−1 (as described later). In this connection, it is worth noting that the stratospheric water vapor observed during the Biak campaign period showed a clear tape recorder signal of similar behavior (Hasebe et al., 2017). For a more quantitative study of the transport processes in the TTL and tropical stratosphere, we need to take a multiple prong approach of integrating CO2 and SF6 data with other variables, such as water vapor and O3, using assimilated meteorological data and trajectory analyses. Similar CO2 and SF6 profiles have been reported by previous studies primarily in the northern midlatitudes (Bischof et al., 1985; Schmidt and Khedim, 1991; Nakazawa et al., 1995, 2002; Aoki et al., 2003; Engel et al., 2009). However, the vertical gradient of the stratospheric CO2 profile is much smaller in the tropics than in the midlatitudes (e.g., Nakazawa et al., 1995; Aoki et al., 2003); a typical difference in the CO2 mole fraction between the lowermost and middle stratosphere (∼ 30 km) over Japan is about 8 µmol mol−1, whereas in the tropical stratosphere the difference is almost half of that observed in the midlatitudes. We also measured vertical distributions of CO2 and SF6 from 15 to 35 km over Hokkaido, Japan (42∘30′ N 143∘26′ E) in August 2015 (Fig. 2) using our traditional cryogenic sampler with liquid He (Nakazawa et al., 1995; Aoki et al., 2003). To compare the mole fractions of mid-stratospheric CO2 and SF6 in the tropics (Biak) with those observed in the northern midlatitudes (Hokkaido), average mole fractions were calculated at higher altitudes (potential temperatures larger than 600 K). The latitudinal differences in the CO2 and SF6 mole fractions were found to be 5.6 ± 0.9 and 1.0 ± 0.2 pmol mol−1, respectively. Considering that the air sampling over Hokkaido was carried out 6 months after Biak, these differences were obtained after taking into account the effects of the CO2 and SF6 increase and CO2 production by CH4 oxidation using the recent tropospheric increase rates of CO2, SF6, and CH4. If the transit time of an atmospheric tracer from the tropics to midlatitudes can be simply obtained by dividing the latitudinal difference of the mole fraction between the two regions by its recent tropospheric increase rate, then the above observed differences would yield 2.4 ± 0.4 years for CO2 and 3.1 ± 0.7 years for SF6. These transit times correspond to aging of the air during the poleward transport from the equatorial region to midlatitudes through the middle stratosphere. While the small difference in the transit time between CO2 and SF6 was not significant here, the difference in the mean age of air estimated from CO2 and SF6 will be discussed later.
As shown in Fig. 2, δ15N of N2, δ18O of O2, and δ(Ar∕N2) decrease gradually with increasing altitude. Differences between the values at the lowermost and uppermost height levels (hereafter written as Δδ) are 11.2, 18.4, and 153.3 per meg for δ15N, δ18O, and δ(Ar∕N2), respectively. Considering that the mass number differences of the related molecules are 1, 2, and 12 for δ15N, δ18O, and δ(Ar∕N2), respectively, Δδ seems to increase with increasing mass number difference. From a theoretical investigation of the molecular diffusion in polar firn air, the magnitude of the gravitational separation is proportional to the mass number difference (Etheridge et al., 1996), which can be expressed as
Here, Δm and Δδ0 are the mass number difference and the difference in δ values for Δm=1, respectively. Vertical distributions of the stable isotopic ratios of the major atmospheric components in the stratosphere were first reported by Ishidoya et al. (2006, 2008a, b). They concluded that the overall vertical structures of the isotopic ratios are basically caused by gravitational separation (Ishidoya et al., 2013) based on mass-dependent relationships between the related molecules. In this study, we also found by examining Δδ in terms of the mass number differences of related molecules that the relationship can be approximated by a proportional relationship, as shown in Fig. 3. This suggests that the upward decreases in δ15N, δ18O, and δ(Ar∕N2) are mass dependent and that gravitational separation is observable in the stratosphere, not only in the midlatitudes but also in the tropics. It is not clear what caused the small deviations in Δδ from the proportional relationship shown in Fig. 3. Thermal diffusion is one of the plausible causes, but its effect on our observational data taken by using our traditional cryogenic sampler was negligibly small (Ishidoya et al., 2013).

Figure 3The relationship between the mass number difference and the Δδ value. The Δδ value denotes the difference in δ15N of N2, δ18O of O2, or δ(Ar∕N2) between 17.2 and 28.7 km. The solid line represents a linear relationship between Δδ and the mass number difference.
After arranging all the observed δ15N, δ18O, and δ(Ar∕N2) measurements so that the values of the respective variables measured in the lowermost level become zero, we define an average value of δ15N, δ18O, and δ(Ar∕N2) as
which is normalized for the mass number differences. The average vertical gradient of <δ> above the tropopause was per meg km−1 in the midlatitude stratosphere (Ishidoya et al., 2013). On the other hand, our result shows that the average vertical gradient of <δ> was only per meg km−1 in the tropical stratosphere. The average <δ> value at the 14 hPa pressure level was about −35 per meg over Japan (Fig. 1 in Ishidoya et al., 2013), but only −11 per meg in the tropical stratosphere at the same pressure level. This implies that the gravitational separation in the stratosphere is much weaker in the tropics than in the midlatitudes.
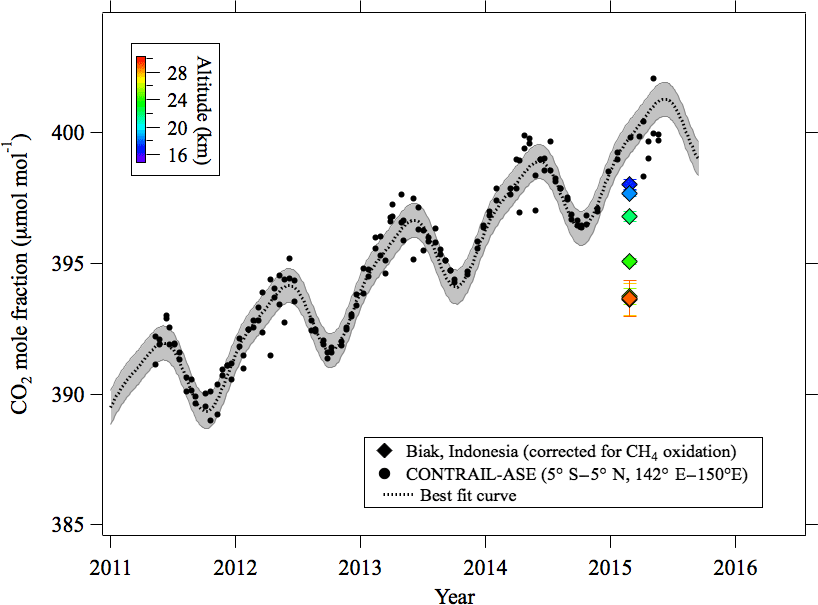
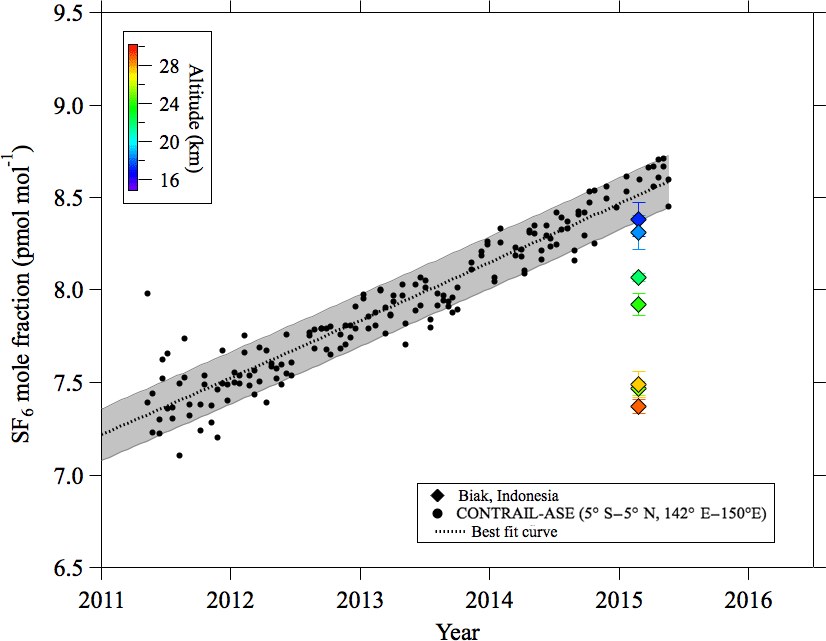
Figure 4Stratospheric CO2 mole fraction values observed over Biak and tropical upper tropospheric data (5∘ N–5∘ S, 142–150∘ E; 10–12.5 km) obtained by the CONTRAIL aircraft project. Also shown is the best fit curve fitted to the CONTRAIL data. The gray shading shows 1 standard deviation width calculated by using the fitting procedure.
3.2 Age of air
To estimate the age of stratospheric air using a clock tracer such as CO2 or SF6, a long-term record of its mole fraction observed in the upper troposphere is necessary as a reference. Since the tropospheric reference record is critical for calculating the stratospheric air age from the clock tracer data, it needs to be standardized. However, different data records have been used as a reference in different studies. For example, the data obtained at ground-based monitoring sites in tropical or subtropical regions were widely used for the tropospheric record after correcting for the mole fraction differences between the surface and the upper troposphere. Therefore, the estimated air ages have been plagued with large uncertainties due not only to the selection of the monitoring site, but also to the correction for the mole fraction difference between the site and the tropical upper troposphere. Uncertainties in the transport time from the boundary layer to the tropopause in the tropics have also been pointed out by Stiller et al. (2012). Recently, however, 10-year or longer mole fraction records of upper tropospheric CO2 and SF6 have become available from the automatic air sampling equipment (ASE) employed in the Comprehensive Observation Network for TRace gases by AIrLiner (CONTRAIL) program (Machida et al., 2008; Sawa et al., 2008; Matsueda et al., 2015). In this study, we have exploited the opportunity and constructed a set of tropical upper tropospheric CO2 and SF6 records from the CONTRAIL data obtained between 5∘ S and 5∘ N, between 142 and 150∘ E, and between 10 and 13 km over Southeast Asia. The selected CO2 and SF6 data are shown in Figs. 4 and 5, respectively, together with their best fit curves obtained by using the Nakazawa et al. (1997) algorithm. Although we do not have sufficient knowledge about the temporal variations in their mole fractions near the top of the TTL to obtain a definitive age of the stratospheric air (Waugh and Hall, 2002), we decided to use the upper tropospheric CONTRAIL data records as a reference. Therefore, the age of air estimated in this study could be slightly overestimated. Because the uncertainties associated with the best fit curves will cause an error in the age estimation, we estimated the confidence intervals for the best fit curves as the root mean squares of CONTRAIL data deviations from the curves, which were 0.65 µmol mol−1 and 0.14 pmol mol−1 for CO2 and SF6, respectively. These values were comparable to or larger than the uncertainties in the mole fraction analyses. How the propagation of uncertainty impacts the age estimation will be discussed later.
The CONTRAIL CO2 and SF6 mole fractions are determined against the NIES scales, while the stratospheric data obtained in this study are expressed in the TU scales. However, as pointed out above, the differences in the SF6 mole fraction scales between NIES and TU–MUE were found to be negligibly small. Therefore, our SF6 data can be directly compared with the CONTRAIL SF6 data. On the other hand, since we found that the TU CO2 mole fraction scale gives slightly higher values than the NIES scale, the TU CO2 data were shifted down by 0.20 µmol mol−1 based on the results of the 5th and 6th Round Robin intercomparison programs (https://www.esrl.noaa.gov/gmd/ccgg/wmorr/wmorr_results.php?rr=rr6¶m=co2).
The age of stratospheric air at each altitude was estimated by comparing the corresponding CO2 or SF6 mole fraction with the related reference curve obtained from the CONTRAIL data. In the case of a linear time variation in the clock tracer mole fraction, the mean age of air is determined by the difference in time between the observed mole fraction of a tracer in the stratosphere and the same value observed in the upper troposphere reference record. This is called the lag time (Waugh and Hall, 2002). As seen in Fig. 5, the SF6 mole fraction shows no clear seasonal cycle in the tropical upper troposphere and its secular increase for the last 10 years can be approximated by using a linear function. Therefore, the SF6 age was sometimes reported as the lag time. However, the nonlinear increase in the SF6 mole fraction should be considered for a more precise mean age estimation. On the other hand, the tropospheric CO2 mole fraction shows large seasonal cycle, as seen in Fig. 4. Such a seasonal cycle propagates into the TTL and the lower stratosphere and then gradually diminishes with increasing altitude due to air transport processes. Therefore, we cannot determine the CO2 age from the lag time. The damping and phase delay of the seasonal CO2 cycle in the stratosphere should be calculated theoretically using age spectra (Waugh and Hall, 2002). However, actual age spectra are usually unknown. Therefore, we used hypothetical age spectra to calculate the age of air. A simple formulation of the age spectrum was originally introduced by Hall and Plumb (1994) as a theoretical expression for a 1-D atmosphere. Their proposed function is mathematically equivalent to the inverse Gaussian distribution (Waugh and Hall, 2002). We assumed that the width of the age spectrum (d) is parameterized using the mean age (Γ), i.e., d2=0.7Γ (Waugh and Hall, 2002; Engel et al., 2008). In this study, the mole fraction of CO2 or SF6 in the stratosphere, x(Γ,t), was calculated as a convolution of the tropospheric reference curve, x0(t), and the age spectrum, G(Γ,t):
where Δt is the integration time interval. Then, the CO2 or SF6 age was determined by comparing the observed mole fraction with x(Γ,t). As mentioned before, a small amount of CO2 is produced by the chemical destruction of CH4 in the stratosphere. To correct for this effect, each observed CO2 mole fraction was adjusted using the CH4 mole fraction measured from the same air sample prior to the age calculation. The corrections were less than 0.1 and 0.36 µmol mol−1 for the lowermost and uppermost altitudes, respectively.
Ishidoya et al. (2013) pointed out that the mole fractions and isotopic ratios of all atmospheric constituents are influenced by gravitational separation and that its effect on a specified constituent can be evaluated from the <δ> value and the mass number difference between the constituent and the air. Since the molecular mass numbers of CO2 and SF6 are larger than the mean molecular mass of air, it is expected that their mole fractions are slightly separated gravitationally in the stratosphere, resulting in lower mole fractions compared to those in the absence of gravitational separation. In this study, we calculated the gravitational separation effect on the CO2 and SF6 mole fractions observed in the tropical stratosphere and found that the respective effects are at most −0.07 µmol mol−1 and −0.01 pmol mol−1, respectively. Therefore, the correction for gravitational separation is not necessary, at least up to ∼ 30 km.
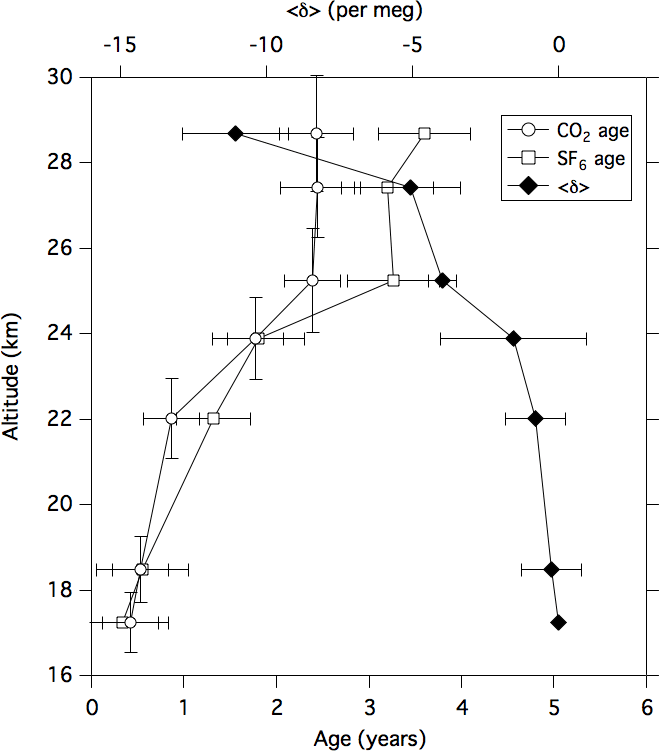
Figure 6Vertical profiles of the CO2 and SF6 ages and the <δ> value over Biak, Indonesia on 22–28 February 2015. The <δ> value represents an average of δ15N of N2, (δ18O of O2)∕2, and δ(Ar∕N2)∕12 (cf. text). Vertical error bars of CO2 age represent vertical ranges of air sampling.
The CO2 and SF6 ages estimated in this study are shown in Fig. 6 together with the <δ> values. These data are also tabulated in Tables 1 and 2. Considering the uncertainties associated with the CO2 and SF6 mole fraction measurements and the tropical tropospheric records, overall uncertainties in CO2 and SF6 ages were estimated by using the following procedure. First, normal pseudorandom numbers multiplied by 1σ were added to the observed mole fraction data. The same procedure was applied to the tropical tropospheric records. Then, the age calculation procedure described above was repeated for 1000 different sets of random numbers, and the standard deviations of ages were calculated. The overall uncertainties in the estimated ages are also shown in Table 1. As shown in Fig. 6, the CO2 and SF6 ages gradually increase with increasing altitude from the TTL to 22 km and then rapidly up to 25 km. The CO2 and SF6 ages show a good agreement with each other from the TTL to approximately 24 km, but they are significantly different above approximately 25 km. The average values of the CO2 and SF6 ages above 25 km showed a difference of about 1 year.
Our results show that the CO2 and SF6 ages were 0.5–0.6 years at the altitude of 18.5 km (∼ 70 hPa), which roughly corresponds to the top of the TTL. In addition to this, the CO2 and SF6 ages increased slightly with increasing altitude inside the upper layer of the TTL. These results suggest that the CO2 and SF6 ages increased by 0.5–0.6 years from the tropical upper troposphere (approximately 11–13 km) to the top of the TTL. This indicates that a strict specification of the tropospheric reference record around the TTL is essential for the comparison between different observations. In this connection, it should be noted that our age estimates could be positively biased to some extent, since we used the CONTRAIL data as the tropospheric reference record.
Andrews et al. (2001) estimated the tropical lower stratospheric air age at 20 ± 0.5 km to be approximately 1.0 year using the ER-2 aircraft. Note that their ages were estimated relative to the tropical tropopause. Even though it is not clear how different our age estimates are from the values estimated relative to the tropical tropopause, depending on the different tropospheric reference records, our CO2 and SF6 ages at 22 km are nearly consistent with their results. The ages of air observed at 25–30 km in balloon experiments were tabulated by Waugh and Hall (2002). Andrews et al. (2001) and Ray et al. (1999) estimated the CO2 and SF6 ages in the tropical mid-stratosphere (25–30 km) to be 3.5 and 4.0 years, respectively, from their balloon observations conducted at Juazeiro do Norte, Brazil (7∘ S) in 1997. Our results show that the CO2 and SF6 ages were 2.4 and 3.4 years on average at altitudes of 25–29 km. If we compare our age data directly with those observed over Brazil, the CO2 and SF6 ages in this study are smaller by approximately 1.1 and 0.6 years, respectively. This would be partly due to the different time and observation location, although the balloon data observed in the equatorial mid-stratosphere are still relatively sparse and not representative in time and space.
The SF6 age obtained in this study can be compared with the result obtained from the MIPAS satellite observations (Haenel et al., 2015). Haenel et al. (2015) estimated zonal mean SF6 ages for each season by using the SF6 mole fraction data from MIPAS for the period 2002–2012. They showed that the SF6 age over the equatorial region in the northern winter season was approximately 1.0 years at 17 km and 5.0 years at 30 km, with the age increasing almost linearly with increasing altitude. Since the tropospheric reference record used for the MIPAS SF6 age is ground-based global mean surface data, their age estimates are systematically larger than our estimates over the entire altitude range of the TTL to 30 km. By comparing our and the MIPAS SF6 ages at 17 km, the difference in the two ages is found to be approximately 0.8 years. Taking this difference into account, the middle stratospheric SF6 age obtained in this study is slightly lower than the MIPAS SF6 age.
In general, the age values obtained in this study are smaller than those reported previously for the midlatitude middle stratosphere (Engel et al., 2008; Ray et al., 2010; Ishidoya et al., 2013). Ishidoya et al. (2013) reported that the average value of CO2 age at heights above 20–28 km over Japan was 5.2 ± 0.4 years for the period 1995–2010. However, their CO2 age was estimated using ground-based data as the tropospheric reference record. Therefore, we reevaluated their CO2 age using the CONTRAIL data and found it to be 4.6 ± 0.4 years. Our latest observation over Japan in August 2015 showed the average middle stratospheric CO2 age to be 4.9 ± 0.3 years (our unpublished data). The two values are also close to the CO2 ages reported by Engel et al. (2008). From these results, we conclude that the middle stratospheric CO2 age difference between the tropics and the midlatitudes is approximately 2.2–2.5 years, which is consistent with the transit time roughly estimated from the CO2 mole fraction in Sect. 3.1. In summary, the CO2 age increases vertically by approximately 3.0 years from the TTL to the middle stratosphere in the tropics and also horizontally in the middle stratosphere by approximately 2.0 years from the tropics to the midlatitudes.
3.3 Difference in the CO2 and SF6 ages
The SF6 age is obviously larger than the CO2 age in the middle stratosphere, whether in the tropics or midlatitudes. As mentioned before, this study shows that the average CO2 and SF6 ages above the height at which the potential temperature was greater than 600 K over Biak are 2.4 ± 0.4 and 3.4 ± 0.5 years, respectively. On the other hand, our balloon observation over Japan in 2015 indicated an average SF6 age of 6.8 ± 0.8 years for the middle stratosphere (potential temperatures larger than 600 K), which is 1.9 ± 0.9 years larger than the CO2 age of 4.9 ± 0.3 years (our unpublished data). This result suggests that the difference in the middle stratospheric CO2 and SF6 ages increases with latitude from the tropics (1.0 years) to the midlatitudes (1.9 years).
The difference in the CO2 and SF6 ages has also been discussed in previous studies (Harnisch et al., 1998; Hall and Waugh, 1998; Strunk et al., 2000, Andrews et al., 2001). Harnisch et al. (1998) reported that the CO2 age is smaller by up to 3 years than the SF6 age in the middle stratosphere and then discussed the origin of excess CO2. Strunk et al. (2000) showed from their balloon observation in 1997 that the CO2 and SF6 ages agree well with each other and concluded that the discrepancy between the CO2 and SF6 ages reported by Harnisch et al. (1998) was caused by air sample degradation, such as CO2 production during storage in flasks. In this study, the sample degradation in the cryogenic sampler and the mole fraction scales of CO2 and SF6 for stratospheric and tropospheric data were carefully checked, as described in Sect. 2. Therefore, we were forced to find other causes for the difference between the CO2 and SF6 ages.
One possible cause is the propagation of the seasonal cycle of tropospheric CO2 into the stratosphere. The propagation effect of periodic tracer variations into the stratosphere was also discussed in Andrews et al. (2001) and Waugh and Hall (2002). Since the seasonal cycle of the CO2 mole fraction is significantly large in the tropical upper troposphere, its signal propagates into the TTL and then into the lower stratosphere via slow tropical upwelling. At the same time, the atmospheric mixing process broadens the width of the age spectra, resulting in damped seasonal amplitude with increasing altitude. For an ideal clock tracer that has increased or decreased monotonically in the troposphere, x(Γ,t) will be a single-valued function of Γ, which allows us to determine the mean age of air from the clock tracer mole fraction. On the other hand, if the CO2 seasonal cycle is still significantly large at the observation altitude, it is not necessarily guaranteed that x(Γ,t) is a single-valued function of Γ depending on the season. In such a case, the CO2 age will be underestimated or overestimated depending on the time of year, and it is difficult to estimate the CO2 age precisely from the mole fraction at that altitude. If that is the case, then the difference between the CO2 and SF6 ages caused by the CO2 seasonal cycle might be significant in the season when the CO2 mole fraction takes seasonal maxima and minima in the upper troposphere and the lower stratosphere. However, our results showed good agreement between the CO2 and SF6 ages in the TTL and the lower stratosphere. This is probably due to the fact that the seasonal CO2 variation in the equatorial upper troposphere takes an intermediate concentration value in February, a level between its maximum and minimum (Sawa et al., 2008). Therefore, it is likely that the propagation of the CO2 seasonal cycle would be a minor contributor to the difference in the middle stratospheric CO2 and SF6 ages.
We also examined the influence of mesospheric air because SF6 is decomposed by UV absorption and electron reactions in the mesosphere (e.g., Reddmann et al., 2001). Andrews et al. (2001) reported that the CO2 and SF6 ages observed by ER-2 are in agreement with each other for ages less than 3.0 years, while the SF6 age is 10–20 % larger than the CO2 age if older. They also suggested that the loss of mesospheric SF6 would lead to an excess in age at higher altitudes. The age-dependent difference between the CO2 and SF6 ages obtained by Andrews et al. (2001) is nearly consistent with that observed in this study. However, it is not yet clear how much the mesospheric SF6 loss affects the SF6 age observed in the tropical middle stratosphere.
The contribution of the mesospheric air subsidence to the stratospheric SF6 age was also discussed by Stiller et al. (2012). They proposed that the “over-aging” of SF6 in the midlatitude and high-latitude stratosphere could be due to the mixing of air with less SF6 inside the polar vortex with the midlatitude air, and they estimated the rate of change in the Northern Hemispheric air age caused by the mixing to be 0.04 years per year of age. They also suggested that this effect is halved (0.02 years per year of age) if the mixing of the polar vortex air occurs throughout the stratosphere. Therefore, if the SF6 age is estimated to be 5.0 years for a certain altitude in the Northern Hemisphere, the “true” SF6 age should be 4.8 years or 4.9 years. More recently, Ray et al. (2017) also reported that the SF6 age in the stratosphere must account for a potential influence from the polar vortex air. However, the difference between the CO2 and SF6 ages obtained in this study is so large that the “polar vortex mixing” effect is not a major factor. Linz et al. (2017) compared the MIPAS SF6 age with the N2O age calculated from the N2O data from the Global OZone Chemistry And Related trace gas Data records for the Stratosphere (GOZCARDS) and showed that the MIPAS SF6 age is larger than the N2O age in the tropics. The CO2 and SF6 ages observed in this study are consistent with the N2O age rather than the MIPAS SF6 age, although the observation period is different.
The vertical distribution of gravitational separation, shown by <δ> in Fig. 6, could give us useful information about a possible process that produces the observed difference in the CO2 and SF6 ages in the middle stratosphere. As seen in Fig. 6, the increases in the SF6 age with increasing height in the upper layer are accompanied by gravitational separation enhancement. Similar phenomena were also observed in the high latitudes from our previous balloon experiments (Ishidoya et al., 2017). Gravitational separation is completely independent of any chemical processes in the atmosphere, and therefore it could be an indicator of atmospheric transport processes (Ishidoya et al., 2013). Since gravitational separation will be highly enhanced in the upper stratosphere and the mesosphere, there is a possibility that the impact of SF6 loss on the SF6 age in the upper air or in the polar vortex can be evaluated by using gravitational separation data.
3.4 Numerical simulations of gravitational separation
The gravitational separation effect of atmospheric constituents is mainly governed by two factors: (1) mass-independent transport and (2) mass-dependent molecular diffusion; the former reduces the effect and the latter enhances it. In general, since the mass-dependent molecular diffusion flux of a specific constituent, i, (hereafter written as Fmi) is much smaller than the mass-independent flux, Fmi is usually neglected except for the mass transport above the mesosphere. A theoretical expression for the vertical component of the molecular diffusion flux (Fmi,z) is given by
where ni, Dmi, mi, and αTi are the number density, the molecular diffusion coefficient, the molecular mass, and the thermal diffusion factor of a specific constituent, i, respectively, and g, R, and T denote the gravitational acceleration, the gas constant, and temperature, respectively (Banks and Kockarts, 1973). The relative difference in the number density (n) ratio of constituent i and j between the stratosphere and the troposphere, δi,j, is defined as
where subscripts str and trp denote the stratosphere and the troposphere, respectively. In the theoretical expression given by Eq. (5), the molecular dependence arises from mi, Dmi, and αTi. As described in Sect. 3.1, Δδ is nearly proportional to the mass number differences of the related molecules (see Fig. 3), suggesting that the molecular mass difference is a main cause of molecular separation and αTi does not play an important role. Indeed, in a previous study (Ishidoya et al., 2013), we confirmed that the molecular separations of atmospheric major compositions due to thermal diffusion are not proportional to the mass number differences. If mj is larger than mi, the number density ratio, nj∕ni, decreases with increasing altitude due to the mass-dependent flux, resulting in the upward decrease in the δ value (see Fig. 6). In our observations of the major atmospheric constituents, i and j correspond to 14N14N and 15N14N, 16O16O and 18O16O, or N2 and Ar, for which mi<mj. Therefore, the gravitational separation of two related molecules is enhanced as the δ value is lowered. In addition, the separation effect by molecular diffusion is enhanced with increasing altitude due to the rapid increase in the molecular diffusion coefficient, Dmi. Ishidoya et al. (2013) made a similar comment related to their results observed in the northern midlatitude stratosphere. The most striking result obtained in this study is that the magnitude of gravitational separation is significantly different between the midlatitude and the equatorial regions. As described before, the magnitude of gravitational separation in the equatorial stratosphere is almost one-third of that observed in the northern midlatitude at 14 hPa. The TTL and the stratosphere over the tropics are characterized by a slow upward motion of air. We suggest that this tropical upwelling has a relatively large contribution to the mass-independent flux and significantly weakens the gravitational separation effect.
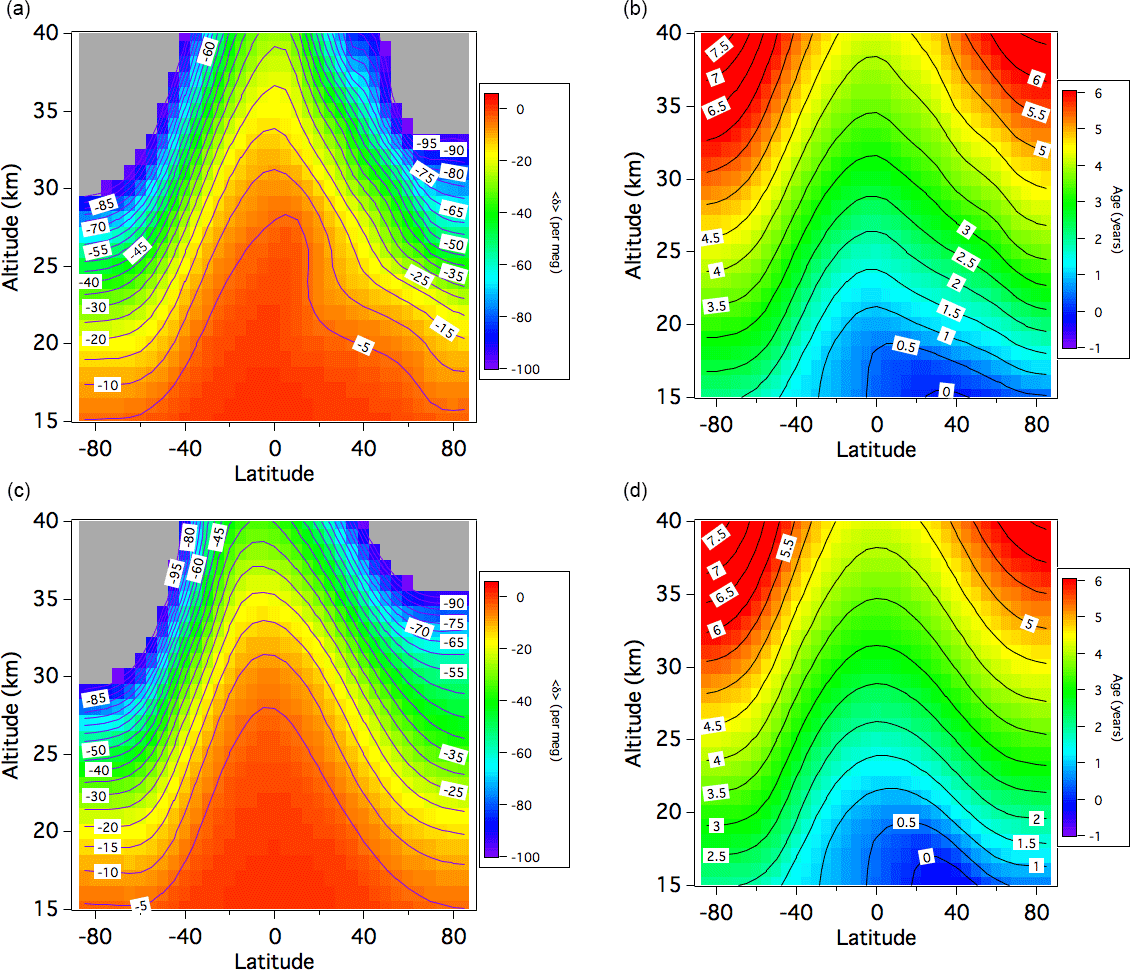
Figure 7(a) Average meridional distributions of the <δ> value for DJF calculated using the SOCRATES model with the control run (cf. text). The <δ> values lower than −100 per meg are shown in gray. (b) Same as panel (a), but for the age of air. (c, d) Same as panels (a) and (b), but for JJA.
To examine the relative contributions of the tropical upwelling to the gravitational separation effect, we performed numerical simulations using a two-dimensional model of the middle atmosphere (SOCRATES) developed by the National Center for Atmospheric Research (NCAR; Huang et al., 1998; Park et al., 1999; Khosravi et al., 2002). Since details of our model calculation have already been described in Ishidoya et al. (2013), a brief description is given here. In the present simulations, we neglected the thermal diffusion flux by setting αTi, which appears in Eq. (5), to zero. Even by doing this, the term involving the temperature gradient still remains in Eq. (5). This term does not represent the thermal diffusion flux, but is theoretically arisen from the flux components caused by concentration and pressure gradients (Banks and Kockarts, 1973). Then we calculated the 44CO2 and 45CO2 mole fractions to derive the <δ> value. Note that the mass number difference between 44CO2 and 45CO2 molecules is 1. Therefore the model-calculated <δ> value can be directly compared with the observed <δ> value. Because our purpose is to simulate the gravitational separation in 44CO2 and 45CO2 molecules, it is not necessary to reproduce δ(45CO2) variations in the actual atmosphere. Taking this into account, their mole fractions in the lowermost layer of the model were fixed at known values, assuming their mole fraction ratio, n(45CO2)∕n(44CO2), to be constant. Before simulating the gravitational separation, we performed preliminary calculations to evaluate the time constant that characterizes how long it takes to attain a steady state. In the preliminary calculation, the initial <δ> value was set to zero in the entire atmosphere (i.e., molecules are not gravitationally separated), and then a 50-year calculation was performed for 44CO2 and 45CO2 mole fractions. From this calculation, the time constant of the gravitational separation was estimated to be about 5 to 8 years at altitudes of 20–30 km. Considering this result, a 20-year spin-up calculation was carried out with no 44CO2 and 45CO2 increases in the lowermost layer, and then a 30-year simulation was performed in which 44CO2 and 45CO2 were monotonically increased at the model surface without seasonal variations and keeping their mole fraction ratio constant. The age of air was also calculated from the model-simulated CO2 mole fraction. The age of air was determined as the difference between the time when the same CO2 mole fraction value was found in the tropical upper troposphere and at a certain altitude in the stratosphere. The systematic difference between the calculated and observed ages was adjusted so that the age calculated for the TTL agrees with the observed value.
In our model simulations, we first calculated the <δ> value and the age of air under the SOCRATES baseline atmospheric condition (Huang et al., 1998). However, the air age and <δ> calculated from this standard run were found to be significantly lower and higher, respectively, compared to the observed values. Previous studies also pointed out that the air age calculated by the SOCRATES standard run is underestimated, probably due to a faster residual mean circulation (Park et al., 1999; Ishidoya et al., 2013). By examining the SOCRATES baseline condition, we found that the mean ascending rate at levels of 18 to 24 km over the Equator to be approximately 0.5 mm s−1 (∼ 16 km yr−1). This value was obviously larger than the typical values of 0.2–0.3 mm s−1 (6–10 km yr−1) reported by previous studies (Mote et al., 1996; Randel et al., 2001). Therefore, we calculated the <δ> value and the age of air again by arbitrarily suppressing the residual mean meridional circulation to 60 % of the standard run (hereafter written as the “control run”), corresponding to a mean ascending rate of 0.3 mm s−1 (∼ 10 km yr−1) over the Equator. The average meridional distributions of the <δ> value calculated with the control run for DJF and JJA are shown in Fig. 7 together with the results for the age of air. Ishidoya et al. (2013) reported that the average CO2 age and <δ> in the 30–35 km height layer over Japan for JJA were 4.8 ± 0.4 years and −50 ± 19 per meg, respectively. Note that the CO2 age in Ishidoya et al. (2013) was converted to the CONTRAIL-based value in this study. As shown in Fig. 7c and d, the calculated values of <δ> and the age of air at mid-stratosphere over northern midlatitudes in JJA are nearly consistent with the results observed over Japan. However, the calculated age could not reproduce the rapid increase in CO2 age with increasing height from the tropopause to about 24 km or the slower increase or almost constant CO2 age above 24 km observed over Japan. The model result also shows that the vertical <δ> gradient is very small over the Equator, rapidly increasing toward the pole. The vertical gradient of the age of air shows a similar variation (Fig. 7b). However, the latitudinal difference in the vertical age gradient is smaller than that of the <δ> value. This phenomenon is caused by a strong dependence of the gravitational separation on the vertical air transport. In general, the gravitational separation is enhanced with increasing altitude due to the height dependency of the molecular diffusion coefficient. However, the upward mean flow from the lower part, where air compositions are not gravitationally separated, significantly weakens the molecular separation effect at a certain altitude in the stratosphere.
To examine the equatorial <δ> dependency on the mean meridional circulation, average vertical profiles over the Equator for DJF simulated by assuming different mean ascending rates are shown in Fig. 8 together with the observational results over Indonesia. As seen in this figure, the suppression of the mean meridional circulation improves the discrepancy between the model-calculated and observed <δ> values over the equatorial region. However, the air age calculated with the control run is still underestimated, in particular above 24 km. To reduce the air age difference between the observation and simulation, we further suppressed the mean meridional circulation to 50 % of the standard run. It is obvious from Fig. 8b that the age difference is reduced as expected, but the calculated age is still smaller than the observed value above 22 km. On the other hand, the further suppression of the mean meridional circulation yields an anomalous overestimation of gravitational separation, implying that the vertical gradient of the <δ> value is sensitive to the ascending air motion. The overestimated effect of gravitational separation could arise from unrealistic mixing processes in the model atmosphere, such as horizontal and/or vertical eddy diffusion. To examine the contribution of horizontal mixing to the model-simulated air age and <δ> value, these two variables were recalculated by intensifying the horizontal eddy diffusivity, Kyy, by a factor of 1.5. As shown in Fig. 8, the result indicates that an upward increase in the air age is further enhanced due to additional aging caused by horizontal mixing. However, gravitational separation does not show any appreciable change, especially in the lower stratosphere, suggesting that gravitational separation is insensitive to horizontal mixing. From these results, it is suggested that the changes in the mean meridional circulation and the horizontal eddy diffusion have different impacts on the gravitational separation and the age of air.
Our two-dimensional model results could not reproduce the observed vertical profiles of the mean age of air and gravitational separation by assuming a specific scenario, as shown in Fig. 8. In order to extend our study on gravitational separation, a three-dimensional model study is needed. It is expected that a three-dimensional model incorporated with the molecular diffusion process can be constrained by gravitational separation data.
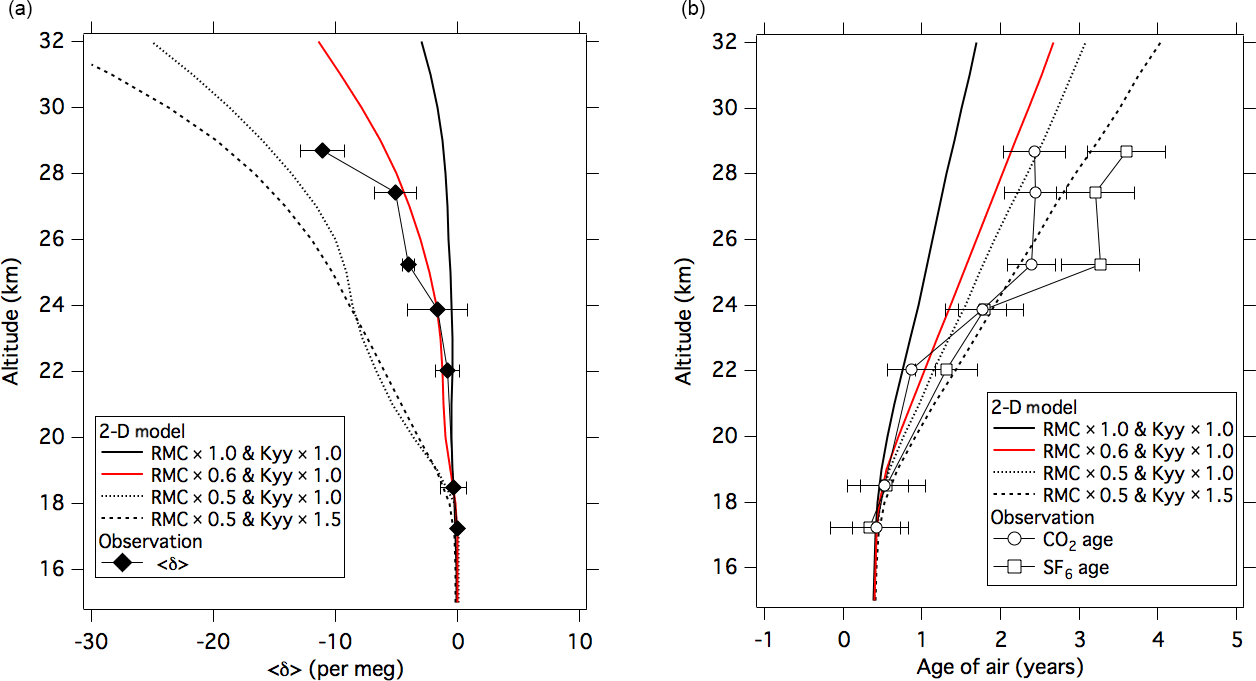
Figure 8(a) Average vertical profiles of <δ> over the Equator for DJF calculated using the SOCRATES model as a standard run (black solid line), suppressed residual mean circulation (RMC) runs (red line and black dotted line), and suppressed residual mean circulation and enhanced horizontal eddy diffusion (Kyy) run (black dashed line). The <δ> values observed over Biak are also plotted (closed diamonds). (b) Same as in panel (a) but for the age of air. The observed CO2 and SF6 ages are shown as open circles and squares, respectively. Model results are shifted so that the age values at 17 km are equal to CO2 age observed at 17.2 km.
To investigate the age and gravitational separation of air in the equatorial stratosphere, we observed CO2 and SF6 mole fractions, δ18O of O2, δ15N of N2, and δ (Ar∕N2) at altitudes of 17 to 29 km over Biak, Indonesia in February 2015 using a set of cryogenic samplers. The CO2 and SF6 ages were carefully estimated from their measured mole fractions by comparing with the CONTRAIL tropical upper tropospheric data, after applying necessary corrections to the mole fraction scales used in different laboratories. The SF6 and CO2 ages showed a general increase with height. The SF6 age and its vertical gradient obtained in this study are nearly consistent with those obtained by MIPAS satellite observations. The SF6 age is in good agreement with the CO2 age below 24 km but increases at heights above 25 km, probably due to an over-aging of SF6 resulting from the influence of upper air with low SF6 mole fractions. To better understand the difference between the SF6 and CO2 ages above 25 km, it is necessary to investigate the effect of mesospheric SF6 losses on the stratospheric SF6 age in detail. We also found a very small but significant upward decrease in <δ>. This implies that gravitational separation occurs within the entire stratosphere and its magnitude is altitude dependent. By comparing with the observational results at midlatitudes, it was confirmed that the tropical upwelling weakens gravitational separation in the TTL and in the lower stratosphere. Simulations with the SOCRATES two-dimensional transport model revealed that gravitational separation is highly sensitive to the strength of tropical upwelling.
Uncertainties and issues raised in this study require further observations of air compositions and model analyses for a better understanding of gravitational separation and the age of air in the stratosphere. The knowledge obtained would be crucial for investigating stratospheric air transport processes. To enhance our understanding of the dynamics and chemistry in the TTL and the equatorial stratosphere in more detail, more comprehensive studies that include a water vapor “tape recorder”, other atmospheric constituents, and their isotopic signatures are also necessary.
The datasets, including measurements and model simulations, can be accessed by contacting the corresponding author. The CONTRAIL dataset is available upon request by contacting Toshinobu Machida (tmachida@nies.go.jp).
The authors declare that they have no conflict of interest.
We deeply thank the Scientific Ballooning
(DAIKIKYU) Research and Operation Group of the Institute of Space and
Astronautical Science (ISAS), JAXA, Japan and the staff of LAPAN, Indonesia
for their cooperation in our stratospheric air sampling. This study was
supported by JSPS KAKENHI grant numbers JS26220101, JS15K05282, and 15H02814.
This work was also selected and supported as a small-size project by ISAS,
JAXA. We also gratefully acknowledge the CONTRAIL team for providing their
data for this study.
Edited by: Peter Haynes
Reviewed by: two anonymous referees
Andrews, A. E., Boering, K. A., Daube, B. C., Wofsy, S. C., Loewenstein, M., Jost, H., Podolske, J. R., Webster, C. R., Herman, R. L., Scott, D. C., Flesch, G. J., Moyer, E. J., Elkins, J. W., Dutton, G. S., Hurst, D. F., Moore, F. L., Ray, E. A., Romashkin, P. A., and Strahan, S. E.: Mean ages of stratospheric air derived from in situ observations of CO2, CH4, and N2O, J. Geophys. Res., 106, 32295–32314, 2001.
Aoki, S., Nakazawa, T., Machida, T., Sugawara, S., Morimoto, S., Hashida, G., Yamanouchi, T., Kawamura, K., and Honda, H.: Carbon dioxide variations in the stratosphere over Japan, Scandinavia and Antarctica, Tellus, 55B, 178–186, 2003.
Austin, J. and Li, F.: On the relationship between the strength of the Brewer–Dobson circulation and the age of stratospheric air, Geophys. Res. Lett., 33, L17807, https://doi.org/10.1029/2006GL026867, 2006.
Banks, P. M. and Kockarts, G.: Aeronomy, Parts A and B, Academic Press, Inc. New York, 1973.
Bischof, W., Borchers, R., Fabian, P., and Kruger, B. C.: Increased concentration and vertical distribution of carbon dioxide in the stratosphere, Nature, 316, 708–710, 1985.
Bönisch, H., Engel, A., Birner, Th., Hoor, P., Tarasick, D. W., and Ray, E. A.: On the structural changes in the Brewer-Dobson circulation after 2000, Atmos. Chem. Phys., 11, 3937–3948, https://doi.org/10.5194/acp-11-3937-2011, 2011.
Brinckmann, S., Engel, A., Bönisch, H., Quack, B., and Atlas, E.: Short-lived brominated hydrocarbons – observations in the source regions and the tropical tropopause layer, Atmos. Chem. Phys., 12, 1213–1228, https://doi.org/10.5194/acp-12-1213-2012, 2012.
Diallo, M., Legras, B., and Chédin, A.: Age of stratospheric air in the ERA-Interim, Atmos. Chem. Phys., 12, 12133–12154, https://doi.org/10.5194/acp-12-12133-2012, 2012.
Engel, A., Möbius, T., Bönisch, H., Schmidt, U., Heinz, R., Levin, I., Atlas, E., Aoki, S., Nakazawa, T., Sugawara, S., Moore, F., Hurst, D., Elkins, J., Schauffler, S., Andrews, A., and Boering, K.: Age of stratospheric air unchanged within uncertainties over the past 30 years, Nature Geosci., 2, 28–31, https://doi.org/10.1038/Ngeo388, 2009.
Engel, A., Bönisch, H., Ullrich, M., Sitals, R., Membrive, O., Danis, F., and Crevoisier, C.: Mean age of stratospheric air derived from AirCore observations, Atmos. Chem. Phys., 17, 6825–6838, https://doi.org/10.5194/acp-17-6825-2017, 2017.
Etheridge, D. M., Steele, L. P., Langenfelds, R. L., Francey, R. J., Barnola, J.-M., and Morgan, V. I.: Natural and anthropogenic changes in atmospheric CO2 over the last 1000 years from air in Antarctic ice and firn, J. Geophys. Res., 101, 4115–4128, 1996.
Garny, H., Birner, T., Bönisch, H., and Bunze, F.: The effects of mixing on age of air, J. Geophys. Res.-Atmos., 119, 7015–7034, https://doi.org/10.1002/2013JD021417, 2014.
Haenel, F. J., Stiller, G. P., von Clarmann, T., Funke, B., Eckert, E., Glatthor, N., Grabowski, U., Kellmann, S., Kiefer, M., Linden, A., and Reddmann, T.: Reassessment of MIPAS age of air trends and variability, Atmos. Chem. Phys., 15, 13161–13176, https://doi.org/10.5194/acp-15-13161-2015, 2015.
Hall, T. M. and Plumb, R. A.: Age as a diagnostic of stratospheric transport, J. Geophys. Res., 99, 1059–1070, 1994.
Hall, T. M. and Waugh, D. W.: Influence of nonlocal chemistry on tracer distributions: inferring mean age of air from SF6, J. Geophys. Res., 103, 13327–13336, 1998.
Harnisch, J., Bischof, W., Borchers, R., Fabian, P., and Maiss, M.: A stratospheric excess CO2 – due to tropical deep convection, Geophys. Res. Lett., 25, 63–66, 1998.
Hasebe, F., Aoki, S., Morimoto, S., Inai, Y., Nakazawa, T., Sugawara, S., Ikeda, C., Honda, H., Yamazaki, H., Halimurrahman, Komala, N., Putri, F., Budiyono, A., Soedjarwo, M., Ishidoya, S., Toyoda, S., Shibata, T., Hayashi, M., Eguchi, N., Nishi, N., Fujiwara, M., Ogino, S., Shiotani, M., and Sugidachi, T.: Coordinated Upper-troposphere-to-stratosphere Balloon Experiment in Biak (CUBE/Biak), B. Am. Meteor. Soc., https://doi.org/10.1175/BAMS-D-16-0289.1, in press, 2018.
Honda, H., S. Aoki, T. Nakazawa, S. Morimoto, and N. Yajima: Cryogenic air sampling system for measurements of the concentrations of stratospheric trace gases and their isotopic ratios over Antarctica, J. Geomagn. Geoelectr., 48, 1145–1155, 1996.
Huang, T. Walters, S., Brasseur, G., Hauglustaine, D., and Wu, W.: Description of SOCRATES – A chemical dynamical radiative two-dimensional model, NCAR/TN-440+EDD NCAR TECHNICAL NOTE, 1998.
Ishidoya, S. and Murayama, S.: Development of high precision continuous measuring system of the atmospheric O2/N2 and Ar∕N2 ratios and its application to the observation in Tsukuba, Japan, Tellus 66B, 22574, https://doi.org/10.3402/tellusb.v66.22574, 2014.
Ishidoya, S., Sugawara, S., Hashida, G., Morimoto, S., Aoki, S., Nakazawa, T., and Yamanouchi, T.: Vertical profiles of the O2/N2 ratio in the stratosphere over Japan and Antarctica, Geophys. Res. Lett., 33, L13701, https://doi.org/10.1029/2006GL025886, 2006.
Ishidoya, S., Sugawara, S., Morimoto, S., Aoki, S., and Nakazawa, T.: Gravitational separation of major atmospheric components of nitrogen and oxygen in the stratosphere, Geophys. Res. Lett., 35, L03811, https://doi.org/10.1029/2007GL030456, 2008a.
Ishidoya, S., Morimoto, S., Sugawara, S., Watai, T., Machida, T. Aoki, S., Nakazawa, T., and Yamanouchi, T.: Gravitational separation suggested by O2/N2, δ15N of N2, δ18O of O2, Ar∕N2 observed in the lowermost part of the stratosphere at northern middle and high latitudes in the early spring of 2002, Geophys. Res. Lett., 35, L03812, https://doi.org/10.1029/2007GL031526, 2008b.
Ishidoya, S., Sugawara, S., Morimoto, S., Aoki, S., Nakazawa, T., Honda, H., and Murayama, S.: Gravitational separation in the stratosphere – a new indicator of atmospheric circulation, Atmos. Chem. Phys., 13, 8787–8796, https://doi.org/10.5194/acp-13-8787-2013, 2013.
Kaiser, J., Engel, A., Borchers, R., and Röckmann, T.: Probing stratospheric transport and chemistry with new balloon and aircraft observations of the meridional and vertical N2O isotope distribution, Atmos. Chem. Phys., 6, 3535–3556, https://doi.org/10.5194/acp-6-3535-2006, 2006.
Khosravi, R., Brasseur, G., Smith, A., Rusch, D., Walters, S., Chabrillat, and Kockarts, G.: Response of the mesosphere to human-induced perturbations and solar variability calculated by a 2-D model, J. Geophys. Res., 107, 4358, https://doi.org/10.1029/2001JD001235, 2002.
Laube, J. C., Engel, A., Bönisch, H., Möbius, T., Sturges, W. T., Braß, M., and Röckmann, T.: Fractional release factors of long-lived halogenated organic compounds in the tropical stratosphere, Atmos. Chem. Phys., 10, 1093–1103, https://doi.org/10.5194/acp-10-1093-2010, 2010.
Li, F., Austin, J., and Wilson, J.: The Strength of the Brewer–Dobson Circulation in a changing climate: Coupled chemistry–climate model simulations, J. Climate, 21, 40–57, https://doi.org/10.1175/2007JCLI1663.1, 2008.
Linz, M., Plumb, R. A., Gerber, E. P., and Sheshadri, A.: The relationship between age of air and the diabatic circulation of the stratosphere, J. Atmos. Sci., 73, 4507–4518, https://doi.org/10.1175/JAS-D-16-0125.1, 2016.
Linz, M., Plumb R. A., Gerber, E. P., Haenel F. J., Stiller G., Kinnison D. E., Ming A., and Neu J. L., The strength of the meridional overturning circulation of the stratosphere, Nature Geosci. 10, 663–667, https://doi.org/10.1038/ngeo3013, 2017.
Machida, T., Matsueda, H., Sawa, Y., Nakagawa, Y., Hirotani, K., Kondo, N., Goto, K., Nakazawa, N., Ishikawa, K., and Ogawa, T.: Worldwide measurements of atmospheric CO2 and other trace gas species using commercial airlines, J. Atmos. Ocean. Tech., 25, 1744–1754, https://doi.org/10.1175/2008JTECHA1082.1, 2008.
Matsueda, H., Machida, T., Sawa, Y., and Niwa, Y.: Long-term change of CO2 latitudinal distribution in the upper troposphere, Geophys. Res. Lett., 42, 2508–2514, https://doi.org/10.1002/2014GL062768, 2015.
Morimoto, S., Yamanouchi, T., Honda, H., Iijima, I., Yoshida, T., Aoki, S., Nakazawa, T., Ishidoya S., and Sugawara, S.: A new compact cryogenic air sampler and its application in stratospheric greenhouse gas observation at Syowa station, Antarctica. J. Atmos. Ocean. Tech., 26, 2182–2191, https://doi.org/10.1175/2009JTECHA1283.1, 2009.
Mote, P. W., Rosenlof, K. H., McIntyre, M. E., Carr, E. S., Gille, J. C., Holton, J. R., Kinnersley, J. S., Pumphrey, H. C., Russell III, J. M., and Waters, J. W.: An atmospheric tape recorder: The imprint of tropical tropopause temperatures on stratospheric water vapor, J. Geophys. Res., 101, 3989–4006, https://doi.org/10.1029/95JD03422, 1996.
Nakazawa, T., Machida, T., Sugawara, S., Murayama, S., Morimoto, S., Hashida, G., Honda, H., and Itoh, T.: Measurements of the stratospheric carbon dioxide concentration over Japan using a balloon-borne cryogenic sampler, Geophys. Res. Lett., 22, 1229, https://doi.org/10.1029/95GL01188, 1995.
Nakazawa, T., Ishizawa, M., Higuchi K., and Trivett, B. A. N.: Two curve fitting methods applied to CO2 flask data, Environmetrics, 8, 197–218, 1997.
Nakazawa, T., Aoki, S., Kawamura, K., Saeki, T., Sugawara, S., Honda, H., Hashida, G., Morimoto, S., Yoshida, N., Toyoda, S., Makide, Y., and Shirai, T.: Variations of stratospheric trace gases measured using a balloon-borne cryogenic sampler, Adv. Space Res., 30, 1349–1357, https://doi.org/10.1016/S0273-1177(02)00551-3, 2002.
Park, J. H., Ko, M. K. W., Jackman, C. H., Plumb, R. A., Kaye, J. A., and Sage, K. H.: Models and Measurements Intercomparison II, NASA/TM-1999-209554, available at: http://www.cs.odu.edu/~mln/ltrs-pdfs/NASA-99-tm209554.pdf, 1999.
Patra, P., Lal, S., Subbaraya, B., Jackman, C. H., and Rajaratnam, P.: Observed vertical profile of sulfur hexafluoride (SF6) and its atmospheric applications, J. Geophys. Res., 102, 8855–8859, 1997.
Ploeger, F., Abalos, M., Birner, T., Konopka, P., Legras, B., Müller, R., and Riese, M.: Quantifying the effects of mixing and residual circulation on trends of stratospheric mean age of air, Geophys. Res. Lett., 42, 2047–2054, https://doi.org/10.1002/2014GL062927, 2015.
Randel, W. J., Wu, F., Gettelman, A., Russell III, J. M., Zawodny, J. M., and Oltmans, S. J.: Seasonal variation of water vapor in the lower stratosphere observed in Halogen Occultation Experiment data, J. Geophys. Res., 106, 14313–14325, 2001.
Ray, E. A., Moore, F. L., Elkins, J. W., Dutton, G. S., Fahey, D. W., Vömel, H., Oltmans, S. J., and Rosenlof, K. H.: Transport into the northern hemisphere lowermost stratosphere revealed by in situ tracer measurements, J. Geophys. Res., 104, 26565–26580, 1999.
Ray, E. A., Moore, F. L., Rosenlof, K. H., Davis, S. M., Boenisch, H., Morgenstern, O., Smale, D., Rozanov, E., Hegglin, M., Pitari, G., Mancini, E., Braesicke, P., Butchart, N., Hardiman, S., Li, F., Shibata, K., and Plummer, D. A.: Evidence for changes in stratospheric transport and mixing over the past three decades based on multiple data sets and tropical leaky pipe analysis, J. Geophys. Res., 115, D21304, https://doi.org/10.1029/2010JD014206, 2010.
Ray, E. A., Moore, F. L., Elkins, J. W., Rosenlof, K. H., Laube, J. C., Röckmann, T., Marsh, D. R., and Andrews, A. E., Quantification of the SF6 lifetime based on mesospheric loss measured in the stratospheric polar vortex, J. Geophys. Res.-Atmos., 122, 4626–4638, https://doi.org/10.1002/2016JD026198, 2017.
Reddmann, T., Ruhnke, R., and Kouker, W.: Three-dimensional model simulations of SF6 with mesospheric chemistry, J. Geophys. Res., 106, 14525–14537, 2001.
Sawa, Y., Machida, T., and Matsueda, H.: Seasonal variations of CO2 near the tropopause observation by commercial aircraft, J. Geophys. Res., 113, D23301, https://doi.org/10.1029/2008JD010568, 2008.
Schauffler, S. M., Atlas, E. L., Flocke, F., Lueb, R. A., Stroud, V., and Travnicek, W.: Measurements of bromine containing organic compounds at the tropical tropopause, Geophys. Res. Ltt., 25, 317–320, 1998.
Schmidt, U. and Kheidim, A.: In situ measurements of carbon dioxide in the winter Arctic vortex and at midlatitudes: an indicator of the age of stratospheric air, Geophys. Res. Lett., 18, 763–766, 1991.
Stiller, G. P., von Clarmann, T., Haenel, F., Funke, B., Glatthor, N., Grabowski, U., Kellmann, S., Kiefer, M., Linden, A., Lossow, S., and López-Puertas, M.: Observed temporal evolution of global mean age of stratospheric air for the 2002 to 2010 period, Atmos. Chem. Phys., 12, 3311–3331, https://doi.org/10.5194/acp-12-3311-2012, 2012.
Strunk, M., Engel, A., Schmidt, U., Volk, C. M., Wetter, T., Levin, I., and Glatzel-Mattheier, H.: CO2 and SF6 as stratospheric age tracers: Consistency and the effect of mesospheric SF6 loss, Geophys. Res. Lett., 27, 341–344, 2000.
Sugawara, S., Nakazawa, T., Shirakawa, Y., Kawamura, K., and Aoki, S.: Vertical profile of the carbon isotopic ratio of stratospheric methane over Japan, Geophys. Res. Lett., 24, 2989–2992, 1997.
Volk, C. M., Elkins, J. W., Fahey, D. W., Salawitch, R. J., Dutton, G. S., Gilligan, J. M., Proffitt, M. H., Loewenstein, M., Podolske, J. R., Minschwaner, K., Margitan, J. J., and Chan, K. R.: Quantifying transport between the tropical and mid-latitude lower stratosphere, Science, 272, 1763–1768, 1996.
Waugh, D. W. and Hall, T. M.: Age of stratospheric air: Theory, observations, and models, Rev. Geophys., 40, 1010, https://doi.org/10.1029/2000RG000101, 2002.