the Creative Commons Attribution 4.0 License.
the Creative Commons Attribution 4.0 License.
 | 21 Dec 2018
Satellite-based estimate of the variability of warm cloud properties associated with aerosol and meteorological conditions
Yuqin Liu
Jiahua Zhang
Putian Zhou
Tao Lin
Juan Hong
Lamei Shi
Fengmei Yao
Jun Wu
Huadong Guo
Gerrit de Leeuw
Aerosol–cloud interaction (ACI) is examined using 10 years of data from the MODIS/Terra (morning orbit) and MODIS/Aqua (afternoon orbit) satellites. Aerosol optical depth (AOD) and cloud properties retrieved from both sensors are used to explore in a statistical sense the morning-to-afternoon variation of cloud properties in conditions with low and high AOD, over both land and ocean. The results show that the interaction between aerosol particles and clouds is more complex and of greater uncertainty over land than over ocean. The variation in d(Cloud_X), defined as the mean change in cloud property Cloud_X between the morning and afternoon overpasses in high-AOD conditions minus that in low-AOD conditions, is different over land and ocean. This applies to cloud droplet effective radius (CDR), cloud fraction (CF) and cloud top pressure (CTP), but not to cloud optical thickness (COT) and cloud liquid water path (CWP). Both COT and CWP increase over land and ocean after the time step, irrespective of the AOD. However, the initial AOD conditions can affect the amplitude of variation of COT and CWP. The effects of initial cloud fraction and meteorological conditions on the change in CF under low- and high-AOD conditions after the 3 h time step over land are also explored. Two cases are considered: (1) when the cloud cover increases and (2) when the cloud cover decreases. For both cases, we find that almost all values of d(CF) are positive, indicating that the variations of CF are larger in high AOD than that in low AOD after the 3 h time step. The results also show that a large increase in cloud fraction occurs when scenes experience large AOD and stronger upward motion of air parcels. Furthermore, the increase rate of cloud cover is larger for high AOD with increasing relative humidity (RH) when RH is larger than 20 %. We also find that a smaller increase in cloud fraction occurs when scenes experience larger AOD and larger initial cloud cover. Overall, the analysis of the diurnal variation of cloud properties provides a better understanding of aerosol–cloud interaction over land and ocean.


Clouds and cloud systems are crucial elements in the energy cycle of our planet (Hartmann et al., 1992; Webb et al., 2006). Clouds affect the global energy budget by reflecting incoming solar radiation, and thus cool the Earth surface, and by absorbing and re-emitting outgoing terrestrial radiation which contributes to warming of the surface. In addition to the radiative effects, clouds also influence the hydrological cycle of the Earth through precipitation (Stephens et al., 2002). Due to interactions with aerosols, the climatic effects of clouds are further complicated (Rosenfeld, 2000; Twomey, 1974, 1977). Aerosols can serve as cloud condensation nuclei (CCN), depending on their hygroscopic properties, and when activated they can change the cloud microphysical properties. The increase in CCN, while the liquid water path remains constant, usually results in more numerous cloud droplets with smaller cloud droplet radius (CDR) due to the competition for the same amount of water vapor. Thus, cloud albedo increases and the smaller cloud droplet effective radius in most cases results in the suppression of precipitation, which in turn results in a longer cloud lifetime, and the maintenance of a larger liquid water path (Albrecht, 1989; Feingold et al., 2001). Therefore, it is important to understand the interaction between aerosols and clouds and the effect of different processes on cloud development.
Numerous studies have shown that aerosol particles can affect cloud properties on regional and global scales (Krüger and Graßl, 2002; Menon et al., 2008; Rosenfeld et al., 2014; Sporre et al., 2014; Saponaro et al., 2017). Satellite measurements suggest that the cloud droplet effective radius decreases with increasing aerosol optical depth (AOD, which is used in this paper as a proxy for aerosol concentration), which is consistent with Twomey's theory (Kaufman et al., 2005; Matheson et al., 2005; Meskhidze and Nenes, 2010). However, other observational and model studies reported that CDR tends to increase with aerosol loading in some study areas, especially over land (Feingold et al., 2001; Yuan et al., 2008; Grandey and Stier, 2010; Liu et al., 2017). A different behavior of cloud cover as a function of AOD for different aerosol loadings (low or high) has been found by Kaufman and Koren (2006) and Koren et al. (2008). However, the observed correlations between aerosol and cloud cannot be simply attributed to the effects of aerosols on clouds alone since other factors such as variations in meteorological conditions could play a role (Loeb and Schuster, 2008; Reutter et al., 2009; Koren et al., 2010; Su et al., 2010; Stathopoulos et al., 2017).
“Snapshot” studies, where the aerosol and cloud properties are retrieved at the same time, have the advantage that they represent the total time-integrated effect of aerosols on cloud properties (Meskhidze et al., 2009; Gryspeerdt et al., 2014). However, the use of snapshot correlations is limited to a single overpass time and limits the ability to distinguish aerosol–cloud interactions (ACIs) from meteorological covariation or retrieval errors (Gryspeerdt et al., 2014). Therefore, the history of meteorological forcing is an important determinant of cloud state. Matsui et al. (2006) investigated the properties of low clouds derived from semi-global observations by the Tropical Rainfall Measurement Mission (TRMM) and explored the correlations of these cloud properties with aerosols (as indicated by the aerosol index or AI) and with lower-tropospheric stability (LTS) on a diurnal scale. They found that aerosols affect the CDR more strongly for low LTS than for high LTS. Mauger and Norris (2007) used MODIS/Terra data to examine the evolution of marine boundary layer clouds over several days but they may have missed important effects occurring on a sub-daily timescale. Meskhidze et al. (2009) investigated the evolution of cloud properties between the MODIS/Terra and MODIS/Aqua overpasses as a function of MODIS/Terra AOD and found an apparent increase in the breakup rate of stratocumulus clouds in high-AOD environments. However, they did not explain meteorological covariation that may generate spurious correlations.
Considering the complex aerosol composition and increasing aerosol trend during the last decades over eastern China (Guo et al., 2011), a systematic assessment of the effect of aerosols on the properties of warm clouds is needed, over both land and ocean. In this paper, aerosol–cloud interaction is examined using multi-year statistics of remotely sensed data from the two MODIS sensors aboard NASA's Terra (daytime equator crossing time at 10:30 LT) and Aqua (daytime equator crossing time at 13:30 LT) satellites. The retrieval of the AOD and cloud properties from both sensors allows us to explore the morning-to-afternoon variation of cloud properties in conditions with either low or high AOD, over land and over ocean, and for different climate regimes. This variety of conditions allows us to identify similarities and differences in the effects of aerosols on clouds and thus better understand aerosol–cloud interaction. We also explore the effect of meteorological history on the interaction between aerosols and clouds. We focus on low-level water clouds. The paper is organized as follows. The data and region of interest are described in Sect. 2. The main methodology is introduced in Sect. 3. The results and analysis are presented in Sect. 4. Overall conclusions and potential future improvements are discussed in Sect. 5.
2.1 Study area
Aerosol concentrations in eastern China are very high due to both direct emissions and secondary aerosol formation from precursor gases such as NO2, SO2 and volatile organic compounds (VOCs). They are produced by anthropogenic activities such as industry, transportation and heating, black carbon and other carbonaceous aerosols produced by biomass burning, and dust aerosols produced from the deserts. Aerosol particles influence the local climate such as monsoon intensity and the distribution of precipitation. In eastern China, the monsoon in turn plays an important role in the wet deposition and transport of aerosol particles (Li et al., 2016). The Asian monsoon system plays an important role in the precipitation across the country (Kourtidis et al., 2015). In early April, the pre-monsoonal rain period starts over southern China and the summer monsoon rain belt moves northward to the Yangtze River basin in June. Further, the rain belt arrives in northern China in July and the monsoon rain belt propagates back to southern China in August. The length of the rain season differs between southern and northern China with the migration of the monsoon across China (Song et al., 2011). Based on these characteristics, four regions with different aerosol emission levels and climate characteristics were selected to study the indirect effects of aerosol particles on cloud micro- and macrophysical properties. The Beijing–Tianjin–Hebei (BTH), Yangtze River Delta (YRD) and Pearl River Delta (PRD) urban clusters are characterized as a temperate monsoon climate region, a subtropical monsoon climate region and a tropical monsoon climate region, respectively. The BTH domain (35.5–40.5∘ N, 113.5–120.5∘ E) is an area with high AOD levels due to rapid industrial and economic development (Fig. 1). The YRD domain (28–33∘ N, 117–122∘ E) is a major source region of black carbon (Streets et al., 2001; Bond et al., 2004) and sulfate (Lu et al., 2010). The PRD domain (21.5–24.5∘ N, 111.5–115.5∘ E) is an area within the Intertropical Convergence Zone (ITCZ) migration belt, with high anthropogenic aerosol emissions (Streets et al., 2003, 2008; Lei et al., 2011). In addition, one domain (20–25∘ N and 125–130∘ E), which is located in the East China Sea (ECS for short), has been selected as the study area for comparison. The ECS domain is relatively clean, but it is often impacted by aerosol particles transported from the highly industrialized eastern China (Wang et al., 2014). The study period is 10 years, i.e., 2008–2017.
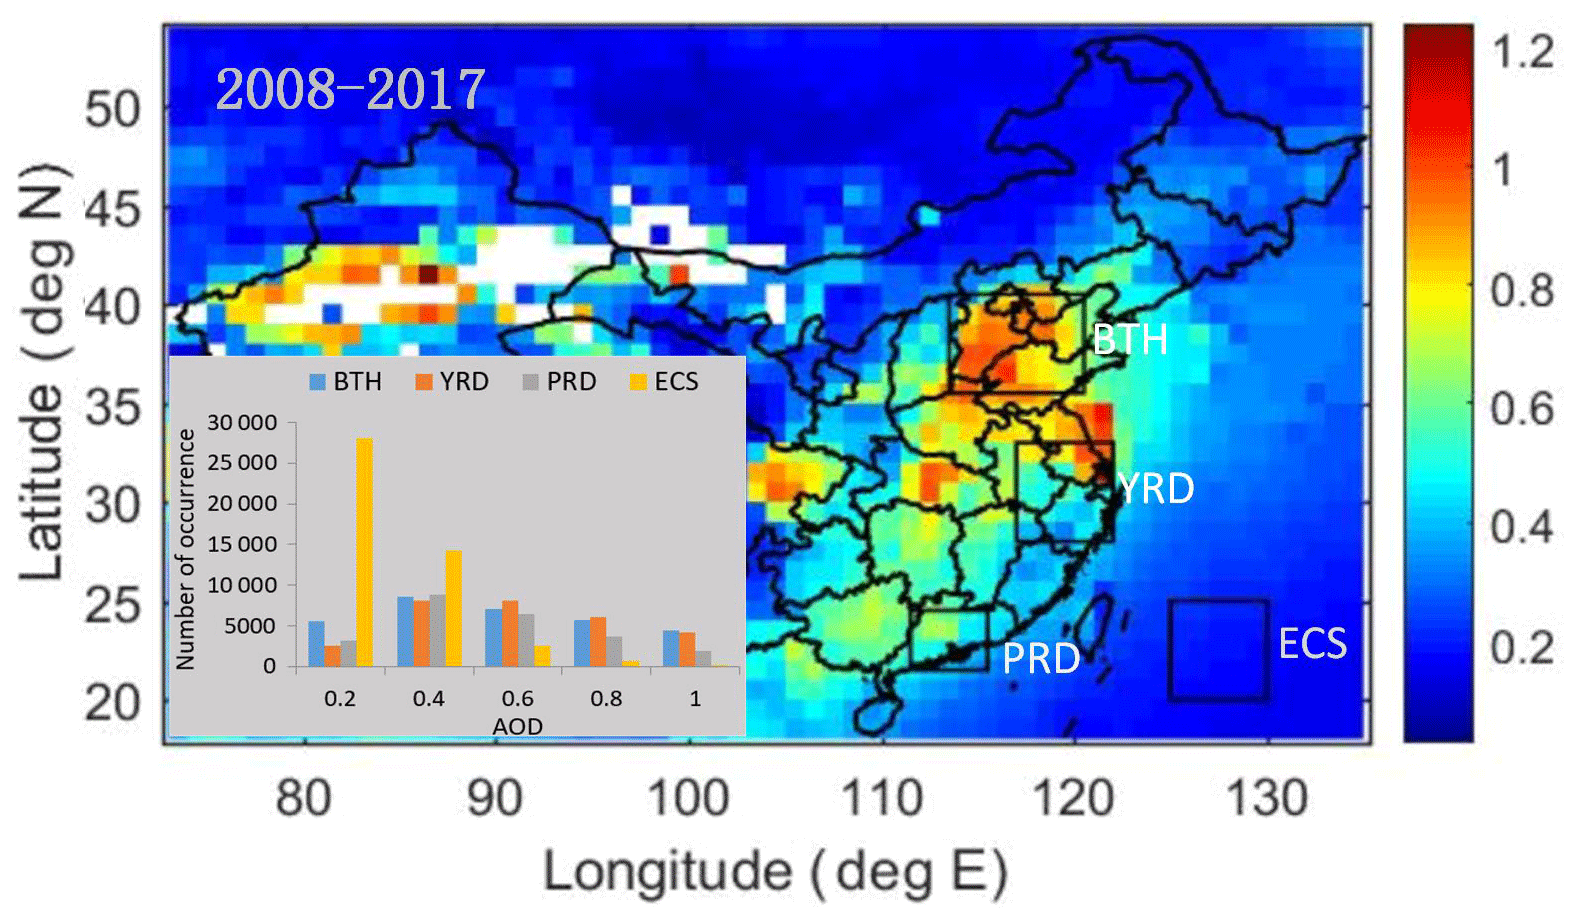
Figure 1Map of MODIS/AQUA level 3 AOD over eastern China averaged over the period from 2008 to 2017. The location of the four clusters (three urban and one ocean) studied here (Beijing–Tianjin–Hebei: BTH, Yangtze River Delta: YRD, Pearl River Delta: PRD and East China Sea: ECS) are marked with black rectangles. The inset shows a histogram for the occurrence of AOD values in each of the four clusters during the period 2008–2017.
2.2 Data used
The aerosol and cloud properties used in this study were derived from the MODIS instruments on the Terra and Aqua satellites. Since these instruments are of the same design, errors due to instrument differences are minimal although some differences have been reported due to degradation of MODIS/Terra (Xiong et al., 2008; Levy et al., 2010). The MODIS L3 collection 6.1 data (which were downloaded from https://ladsweb.modaps.eosdis.nasa.gov/, last access: 12 December 2018) provide daily aerosol and cloud parameters on a 1∘ by 1∘ spatial grid. The time difference between the Terra and Aqua overpasses is about 3 h, with variations due to swath width. In the following, the time difference between the MODIS/Terra and Aqua observations is referred to as the time step. The application of daily MODIS satellite data on a 1∘ by 1∘ spatial grid in this study on aerosol–cloud interaction ensures that the aerosol and cloud retrievals are coincident. The MODIS instruments have 36 spectral bands – the first seven of these (0.47–2.13 µm) are used for the retrieval of aerosol properties (Remer et al., 2005) while cloud properties are retrieved using additional wavelengths in other parts of the spectrum (Platnick et al., 2003). More detailed information on algorithms for the retrieval of aerosol and cloud properties is provided at http://modis-atmos.gsfc.nasa.gov (last access: 12 December 2018). In this study on ACI we use the AOD at 550 nm (referred to as AOD throughout this manuscript), CDR, cloud liquid water path (CWP), cloud optical thickness (COT), cloud fraction (CF), cloud top pressure (CTP) and cloud top temperature (CTT) from both instruments. AOD is used as a proxy for the amount of aerosol particles in the atmospheric column to investigate ACI (Andreae, 2009; Kourtidis et al., 2015). To reduce a possible overestimation of the AOD, cases with AOD greater than 0.8 were excluded from further analysis. The focus of this study is on warm clouds with CTP larger than 700 hPa, CTT larger than 273 K and CWP lower than 200 g m−2, as most aerosols exist in the lower troposphere (Michibata et al., 2014).
In addition, to explore the effect of meteorological conditions on ACI, we use the daily temperature at the 1000 and 700 hPa levels, relative humidity (RH) at the 750 hPa level and pressure vertical velocity (PVV) at the 750 hPa level. LTS is defined as the difference in potential temperature between the free troposphere (700 hPa) and the surface, which can be regarded as a measure of the strength of the inversion that caps the planetary boundary layer (Klein and Hartmann, 1993; Wood and Bretherton, 2006). These meteorological data were obtained from daily ERA-Interim reanalysis data which contain global meteorological conditions on a grid of with 37 levels in the vertical (1000–1 hPa) every 6 h (00:00, 06:00, 12:00, 18:00 UTC) (http://apps.ecmwf.int/datasets/data/interim-full-daily/, last access: 12 December 2018). The meteorological properties were resampled to 10:30 (local time) by taking a weighted average of the properties at the two closest times (00:00 and 06:00 UTC) provided by ERA-Interim.
In this study, high and low AOD are defined as the highest and lowest quartile for each location to reduce climatological spatial gradients in aerosol and cloud parameters. As a result, the difference between high and low AOD varies by location. So, for each grid cell, 3642 data samples are available for the 10-year study period.
3.1 Normalization for initial background
For the comparison of the difference in cloud properties in high- and in low-AOD conditions and the change in this difference during the time step, we need to ensure that the initial conditions are similar; i.e., the probability distributions of a cloud parameter Cloud_X at the start of the time step for the low- and high-AOD cases should be similar. Any change in this distribution at the end of the time step can then be attributed to changes in cloud properties due to aerosol and/or meteorological effects. To reduce the difference between the initial probability distribution of Cloud_X in high- and low-AOD conditions at the start of the time step, normalized histograms of cloud properties and meteorological parameters are made for high- and low-AOD conditions following the method described by Gryspeerdt et al. (2014).
In Fig. 2 we illustrate the process to remove possible effects linking, as an example, CF and AOD. Normalized histograms of CF are made for the high- and low-AOD conditions following Gryspeerdt et al. (2014), with the difference that in the current study AOD is used instead of AI (Andreae, 2009; Kourtidis et al., 2015). The CF probability density functions for low- and high-AOD conditions at the start time are different as illustrated in Fig. 2a. This difference indicates a link between CF and AOD at the start of the time step which needs to be removed to detect the effect of changes during the time step. This is achieved following the process described in more detail by Gryspeerdt et al. (2014). In brief, for each bin datapoints are drawn out randomly from the conditions with the larger probability density frequency until both distributions match. This is performed independently for each bin and the entire process is repeated until the normalized histograms in both AOD conditions are similar. As a result of this normalization process, the CF distributions at the start of the time step are nearly identical for both AOD conditions; i.e., the non-aerosol effect linking CF and AOD has been removed. This technique has also been applied to ensure that the high- and low-AOD conditions have the same probability distributions for CDR, COT, CWP and CTP at the start time. Among those cloud properties, this process of normalization has the greatest effect on the cloud fraction and its dependence on aerosol–cloud interaction. Throughout the study, we only take a subset of original data by removing random samples until the histograms are similar.
Note that here and in the following sections, normalized histograms of cloud properties for the high- and low-AOD populations are made for the whole region (Sect. 3.1), because the data volume based on each location is relatively small. However, the difference between the cloud properties for low and high AOD at the start time is based on each location (Sect. 4.1). So the difference in the cloud properties between the low and high AOD at the start time is not zero.
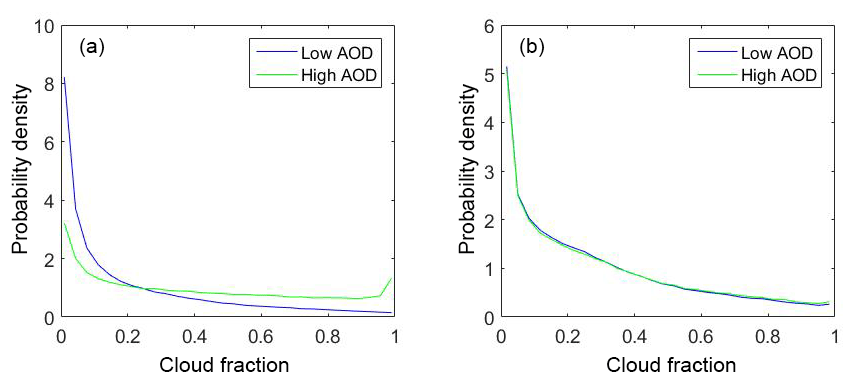
Figure 2An example of the probability density distribution of warm cloud fraction (CF) for low- and high-AOD conditions. (a) There is a strong link between AOD and CF before histogram normalization; (b) the link is reduced after histogram normalization.
3.2 The definition of d(Cloud_X)
After removal of the potential relationships between AOD and cloud parameters at the time of the Terra (morning) overpass, as described in Sect. 3.1, effects of aerosol particles on cloud properties are investigated from the change in the relationship between AOD and cloud parameters over the time step. For cloud property Cloud_X (where X = CF, COT, CWP, CDR or CTP), the change during the time step is indicated by ΔCloud_X. The mean ΔCloud_X for high AOD is then indicated by and by for low AOD. The difference between the mean change in Cloud_X during the time step in high- and low-AOD conditions is then indicated by d(Cloud_X):
The high AOD is representative of polluted atmospheric conditions, and the low AOD is representative of clean atmospheric conditions. The difference (d(Cloud_X)) between the mean values of the cloud property Cloud_X during clean (low AOD) and polluted (high AOD) conditions indicates the effect of these two aerosol cases on the cloud property Cloud_X. For example, d(CWP) would be the difference between the mean change in CWP in high-AOD conditions minus that in low-AOD conditions.
A Student's t test is used to determine whether two data sets are significantly different from each other. The marker * at the top right corner of symbol “+” (or “−”) denotes that the difference between a change in cloud property and zero is significant (at a 95 % confidence level).
4.1 The difference in cloud properties between the low and high AOD at the start time
The difference in the mean cloud properties (CDR, CF, COT, CWP and CTP) during high- and low-AOD conditions at the start time for each grid cell; i.e., represents the change in cloud properties due to the higher AOD. Figure 3 shows the spatial distributions of these differences (left column) and sample series of the difference (right column) for the four regions of interest. The selection of samples for each region is according to the pixels in the region. Figure 3a1–a2 show that, over the ECS, CDR is smaller at high AOD than at low AOD, which is consistent with Twomey's effect. In contrast, over the three urban clusters, CDR is larger at high AOD. This behavior has been observed before for warm clouds in conditions with high AOD (Liu et al., 2017) and may result from the intense competition for the available water vapor and the evaporation of smaller droplets as a consequence of the high aerosol abundance over these regions (Yuan et al., 2008; Tang et al., 2014; Wang et al., 2014; Liu et al., 2017). For COT (Fig. 3b1–b2) the values are significantly higher at high AOD over the ECS and the BTH; however, COT does not show a significant difference between the situations at low and high AOD over the YRD and PRD. These results indicate that there is no clear dependence of COT on aerosol load and also the aerosol type may influence the aerosol effect on COT. Figure 3c1–c2 show that CWP is lower at high AOD over the ECS, which is in clear contrast with the so-called “lifetime effect” proposed by Albrecht in 1989. In contrast, over the BTH, CWP behaves similar to COT and is higher at high AOD. Furthermore, CWP is also higher at high AOD. Ackerman et al. (2004) reported that CWP is not generally observed to be larger, but significantly smaller in high-AOD conditions. They reported that CWP response to the increasing AOD is determined by the balance of two competitive factors: moistening from precipitation decrease and drying from increasing entrainment of dry overlaying air. With increasing AOD, CF does not show any significant correlation between changes in AOD and CDR variations over the BTH and YRD. However, CF is larger at high AOD over the PRD and ECS. Wang et al. (2014) also found that, when aerosol loading is relatively small, cloud cover is found to increase over the YRD and ECS in response to aerosol enhancement regardless of RH conditions. Meanwhile, over the YRD urban cluster CTP is higher at high AOD, as suggested by Liu et al. (2017). In contrast, CTP is lower at high AOD over the BTH and ECS. Many studies have also reported that with higher cloud altitude CTP decreases in most of the places as AOD increases except for some regions at low AOD (Myhre et al., 2007; Kaufman et al., 2005; Alam et al., 2010). This might have resulted from the suppression of precipitation by increasing cloud lifetime and thus also affecting the cloud albedo and cloud top pressure.

Figure 3Spatial distribution of the differences in cloud properties (top to bottom: CDR, COT, CWP, CF and CTP) between the highest and the lowest MODIS AOD quartiles (highest–lowest) at the start time of the time step (MODIS/Terra) (left, a1–e1) and sample series of the differences in cloud properties (CDR, COT, CWP, CF and CTP) between the highest and the lowest MODIS AOD quartiles (highest–lowest) at the start time of the time step (MODIS/Terra) (right, a2–e2) over eastern China for the time period 2008–2017. See legend at the bottom for the meaning of the colors identifying the different regions.
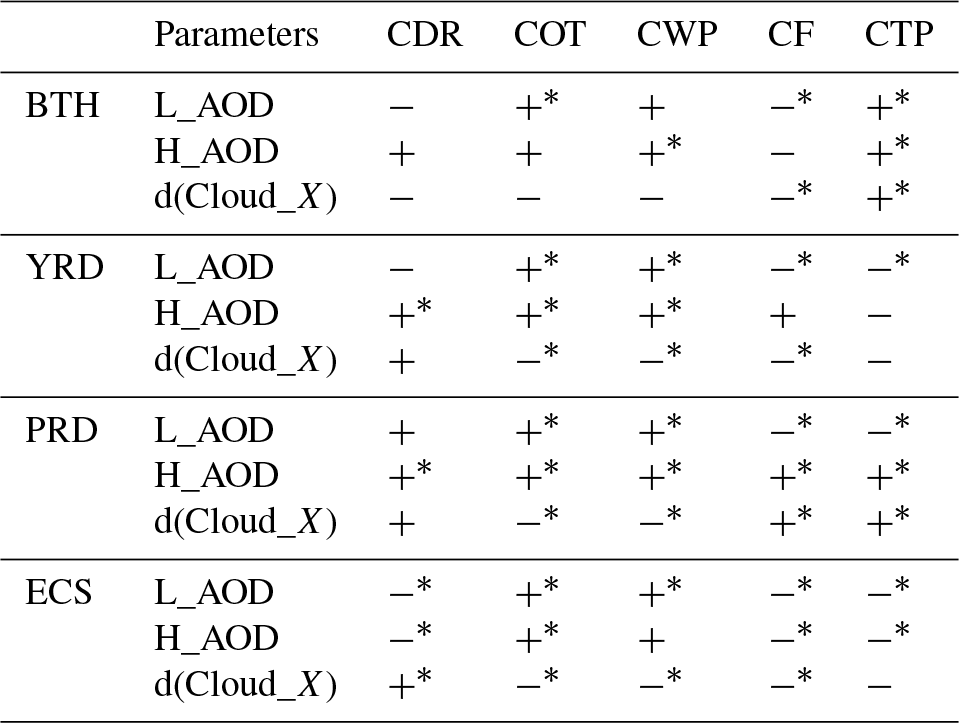
To better characterize the variation in cloud properties between high and low AOD, Table 1 summarizes the difference in cloud properties between high and low AOD at start time for the four study areas. We find that different regions with various aerosol emission levels and different climate characteristics show different ACI patterns. Some links between aerosol and cloud in the four regions are different from those of previous studies over China (Wang et al., 2014; Tang et al., 2014; Kourtidis et al., 2015; Liu et al., 2017), which might be due to the use of different data sets (MODIS C6.1 versus older versions), hypothesis, and target areas characterized by complex aerosol composition and varying meteorological conditions. Overall, the result implies that the interaction between aerosol particles and clouds is more complex and of greater uncertainty over land (BTH, YRD and PRD) than over ocean (ECS). Jin and Shepherd (2008) also noted that aerosols affect clouds more significantly over ocean than over land. They suggested that dynamic processes related to factors like urban land cover may play at least an equally critical role in cloud formation.
Table 1The responses of cloud properties to the increasing AOD.
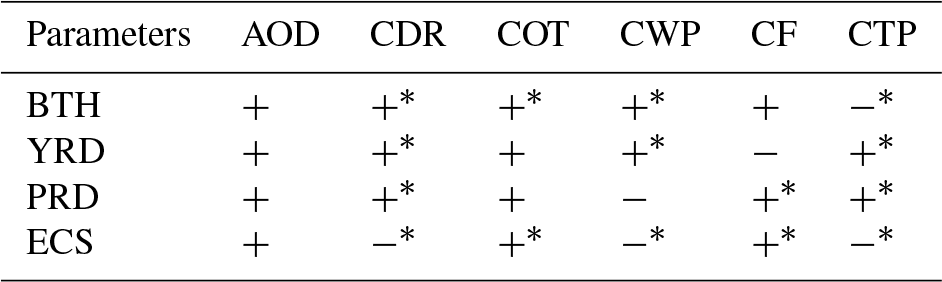
Note that “+” indicates increasing, “−” indicates decreasing, and * at the top right corner of the symbol “+” (or “−”) denotes that the difference between a change in cloud property and zero is significant (at a 95 % confidence level).
4.2 The meteorology of the four target regions
The meteorological and aerosol effects on clouds are reported to be tightly connected, and this connection must be accounted for in any study of aerosol–cloud interactions (Stevens and Feingold, 2009; Koren et al., 2010). Although normalized histograms of meteorological parameters are made for high- and low-AOD conditions at the start time, the normalization described in Sect. 3.1 is based on the whole region. Differences in meteorological conditions may still occur between each 1∘ by 1∘ grid cell. In this study, we analyze the meteorology of the different regions, in support of the interpretation of the regional variation of the relationships between aerosols and clouds.
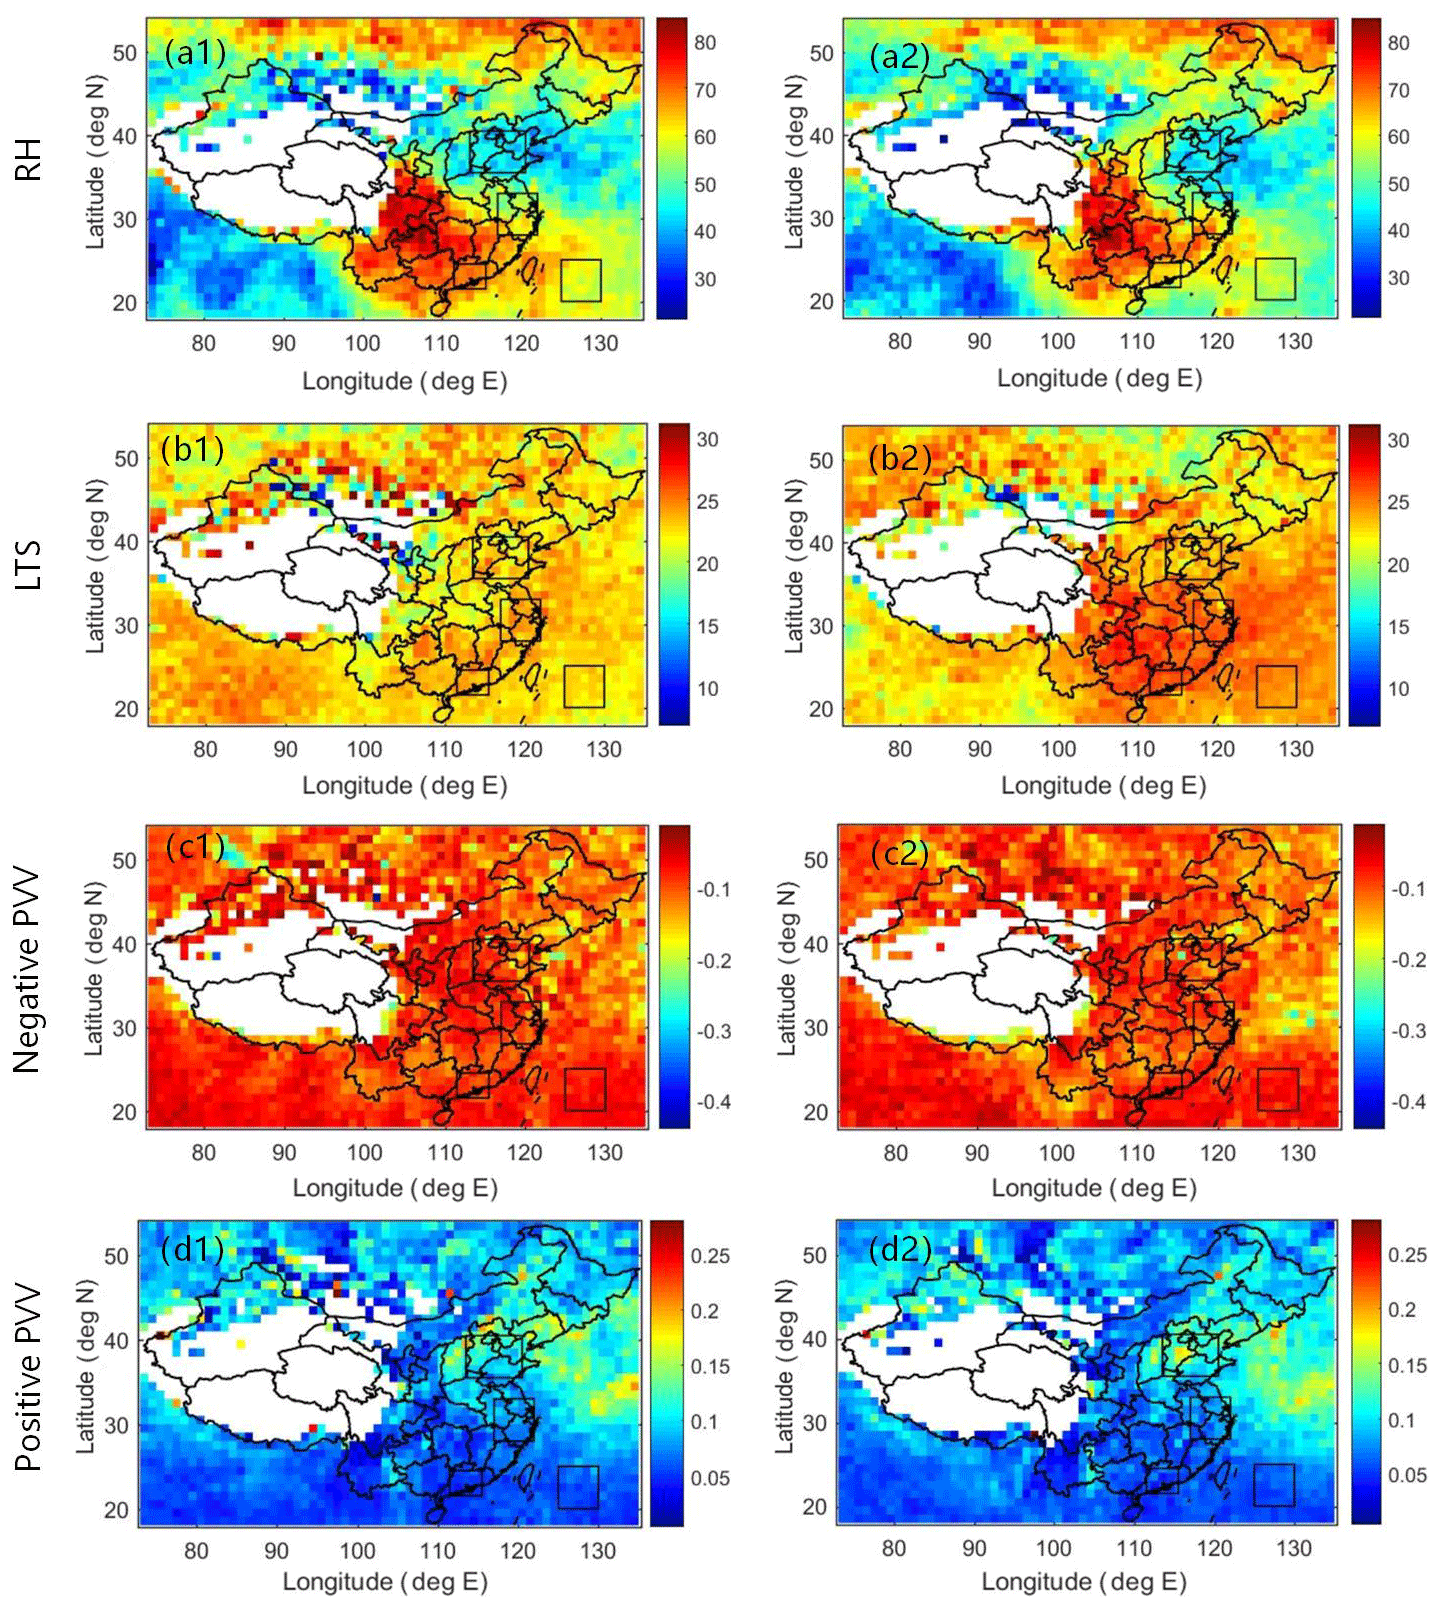
Figure 4Spatial distributions of meteorological parameters (top to bottom: RH, LTS, negative PVV and positive PVV) at the start time of the time step (MODIS/Terra) for low-AOD conditions (left, a1–d1) and for high-AOD conditions (right, a2–d2). All the data are averaged over all years between 2008 and 2017.
The spatial variations of meteorological parameters over the four regions, averaged over the years 2008–2017, are shown in Fig. 4. Over the urban clusters, we can see an increasing north–south pattern in RH and LTS, with the highest values found in the PRD. For the positive PVV, the spatial distributions for the low- and high-AOD situations are remarkably similar, with the highest values over the BTH and decreasing toward the south to near zero over the PRD. In contrast, the negative PVV is highest over the BTH, with little variation over the study area. Overall, the meteorological parameters over the YRD and PRD are similar to those over the ECS, irrespective of the AOD. Furthermore, the LTS is significantly larger in the high-AOD conditions for all four regions. Zhao et al. (2006) proposed that the enhancement in atmospheric stability tends to depress upward motion and precipitation, leading to an increase in aerosol particles. The spatial distributions of both positive and negative PVV in the low-AOD conditions are similar to those in high-AOD conditions.
4.3 The mean change in cloud properties over the time step for low and high AOD
The differences between the mean afternoon and morning values of cloud properties in each grid cell in either low- or high-AOD conditions show the variation of cloud properties during 3 h of cloud evolution at low and high aerosol concentrations. Figure 5 presents the spatial distributions (left, a1–e1) and the sample series (right, a2–e2) of differences in cloud properties (CDR, COT, CWP, CF and CTP) after this 3 h period for the lowest MODIS/Terra AOD quartiles. Figure 6 shows the spatial distributions (left, a1–e1) and sample series (right, a2–e2) of these differences for the highest MODIS/Terra AOD quartiles.
Overall, we look at statistics for a large data set of 10 years. Concerning the effect of aerosol loading on cloud parameters in each urban cluster, a decrease in CF occurs over the BTH for low-AOD conditions, which is opposite to the CTP variation for both AOD conditions. For the variations of CDR over the YRD urban cluster, a significant increase occurs under high-AOD conditions, which may be attributed to the higher RH (see Fig. 4a1, a2). As regards the variation of CF and CTP, a significant decrease occurs under low-AOD conditions. Likewise, an increase in the CDR was observed for high-AOD conditions over the PRD urban cluster. Furthermore, decreases in CF and CTP were observed for low-AOD conditions and increases in CF and CTP were observed for high-AOD conditions. From the perspective of considering all urban clusters (BTH, YRD and PRD), both COT and CWP increase over land during the 3 h time step for both low and high AOD. Overall, the variation in cloud properties after the time step over BTH is less significant than over the YRD and PRD for both low- and high-AOD conditions. This may result from less humid and more unstable atmospheric environments over the BTH than over the other two urban clusters (as shown in Sect. 4.2). Over the ECS, in both low- and high-AOD conditions, CDR, CF and CTP decrease during the time step while COT and CWP increase (see Figs. 5 and 6).
In general, the variations over 3 h in COT and CWP over land are similar to those over ocean for both low- and high-AOD conditions. Another similarity is that CF decreases for low-AOD conditions over land and ocean during the 3 h time step. Having a closer look at the CF variation over the YRD and PRD, we see that CF increases in high-AOD conditions during the 3 h time step. This implies that the variation of CF may depend on the initial AOD conditions. The decrease in afternoon cloud cover over ocean confirms that the largest cover for marine clouds is reached early in the morning as was also concluded by Meskhidze et al. (2009). Meanwhile, a significant difference is found between land and ocean areas, i.e., in high-AOD conditions CDR increases over land but decreases over ocean during the 3 h time step. Table 2 summaries the differences in cloud properties between the Aqua and Terra overpasses for high- and low-AOD conditions over land and ocean during the time period 2008–2017.

Figure 5Spatial distributions of differences in cloud properties (CDR, COT, CWP, CF and CTP) between Aqua and Terra overpasses (3 h) for the lowest MODIS/Terra AOD quartiles (left, a1–e1). Sample series of the differences in cloud properties (CDR, COT, CWP, CF and CTP) between the values at the start time and the end time of the time step for the lowest MODIS AOD quartiles (right, a2–e2).
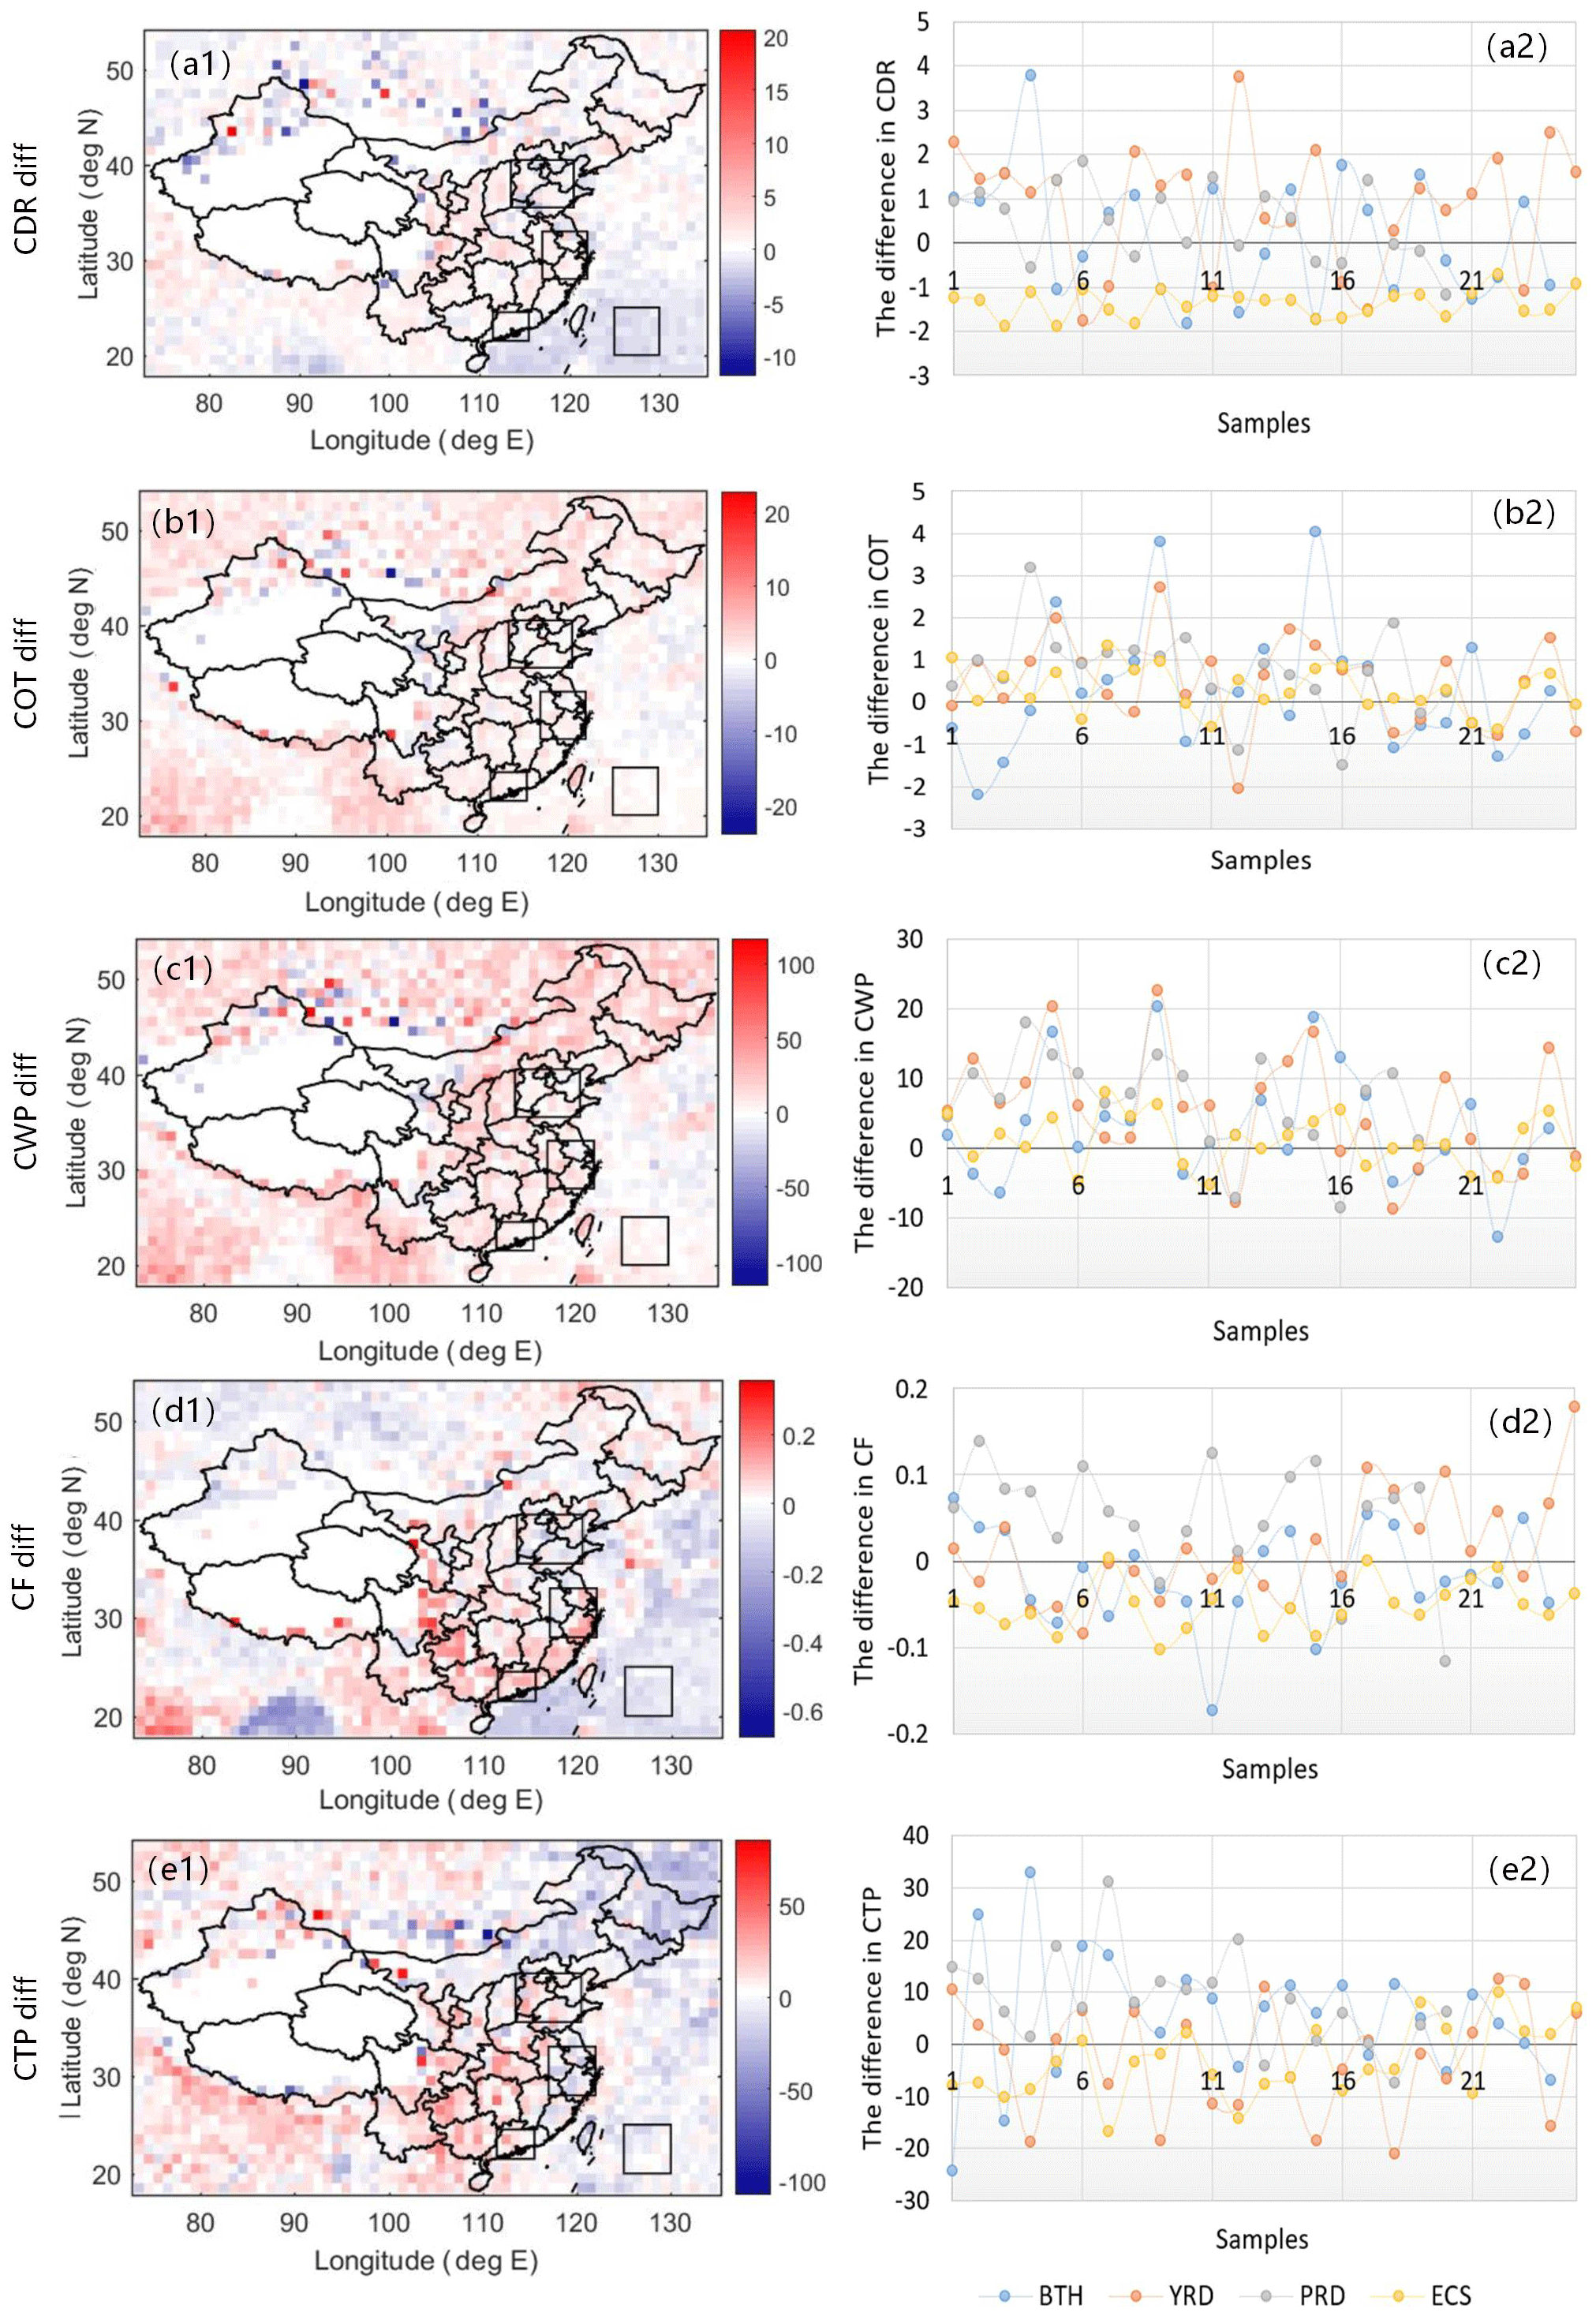
Figure 6Spatial distributions of differences in cloud properties (CDR, COT, CWP, CF and CTP) between Aqua and Terra overpasses (3 h) for the highest MODIS/Terra AOD quartiles (left, a1–e1). Sample series of the differences in cloud properties (CDR, COT, CWP, CF and CTP) between the values at the start time and the end time of the time step for the highest MODIS AOD quartiles (right, a2–e2).
Table 2Differences in cloud properties between Aqua and Terra for high and low AOD, over land and ocean.
Note that “+” indicates increasing, “−” indicates decreasing, and * at the top right corner of symbol “+” (or “−”) denotes that the difference between a change in cloud property and zero is significant (at a 95 % confidence level).
The differences between the mean changes in cloud properties (CF, COT, CWP, CDR and CTP) between the Terra and Aqua overpasses in high- and in low-AOD conditions (d(Cloud_X) as defined in Sect. 3.2) are investigated to identify the effect of aerosol particles on the cloud properties. Figure 7 shows the differences between the mean change in cloud properties at low- and high-AOD conditions during the two observations at 10:30 and 13:30.
Figure 7 shows that the values of d(CDR) over the three urban clusters are not mostly positive or negative, which indicates that in two AOD conditions over land the variation in CDR during the 3 h between the MODIS/Terra and Aqua overpasses is similar. Over the ECS the values of d(CDR) are positive, which indicates that the CDR in high-AOD conditions decreases much more than during low-AOD conditions over ocean. Wang et al. (2014) also reported a negative correlation between CDR and AOD over the ECS, in accordance with the Twomey effect. Furthermore, CDR tends to be smallest in polluted and strong-inversion environments, an outcome in good agreement with the findings of Matsui et al. (2006). Most of the d(COT) values are negative over the four regions, especially for the YRD, PRD and ECS. This shows that the COT increases less in high-AOD conditions than in low-AOD conditions, over both land and ocean, which is in contrast with the findings of Meskhidze et al. (2009). Likewise, the values of d(CWP) are almost all negative over the four regions although over the BTH urban cluster the values are not clear. This indicates that in high-AOD conditions the CWP increases less during the time step than in low-AOD conditions, a result in accordance with the conclusion that higher LTS is linked with a slightly lower CWP (Matsui et al., 2006). We can conclude that the variation trend of COT and CWP after 3 h depends little on the initial AOD, but the initial AOD conditions can affect the amplitude of variation of COT and CWP. Meanwhile, the values of d(CF) are smaller than zero over the ECS. This shows that the cloud fraction in high-AOD conditions over the ECS decreases less than that in low-AOD conditions. However, Meskhidze et al. (2009) found that an increase in the aerosol concentration may lead to enhanced reduction of afternoon cloud coverage and optical thickness for marine stratocumulus regions off the coast of California, Peru, and southern Africa. Therefore, the connection between AOD and variation of cloud cover could be a response to regional-scale changes in aerosol covarying with meteorological conditions. The value of d(CF) is overall positive over the PRD, which indicates that over the PRD in high-AOD conditions the cloud cover increases much more than the cloud cover decreases in low-AOD conditions. Mauger and Norris (2007) have shown that scenes with large AOD and large cloud fraction experienced greater LTS. As regards CTP, we find that the values of d(CTP) are positive over the BTH and PRD urban cluster, but the values of d(CTP) over the other two regions do not show a clear pattern. This indicates that in high-AOD conditions over the PRD region the CTP increases much more than the CTP decreases in low-AOD conditions. We can conclude that the variation in d(Cloud_X) is different for continental and oceanic clouds. This applies to CDR, cloud fraction and CTP, but not to COT and CWP. Table 2 summarizes the differences between the mean changes in cloud properties for low and high AOD over the time step of 3 h.
Based on the above findings, we conclude that over the ECS the values of CDR, CWP and CTP are smaller but the values of COT and CF are larger in high-AOD conditions. After the 3 h time step, CDR, CF and CTP become smaller, irrespective of the AOD. Furthermore, CDR decreases much more in high-AOD conditions but CF and CTP decreases much more in high-AOD conditions. In contrast, COT and CWP become larger in both AOD conditions, and more significantly in low-AOD conditions. Over the urban clusters, COT and CWP also increase over the time step in both AOD conditions, especially for the low-AOD condition. For CF the values in low-AOD conditions decrease over the time step. The CTP change behaves different among the three urban clusters during the 3 h.

Figure 7Spatial distributions (left, a1–e1) and sample time series (right, a2–e2) of d(Cloud_X) (as defined in Sect. 3.2) for CDR, COT, CWP, CF and CTP over eastern China during the time period 2008–2017.
4.4 Meteorological effects
In order to explore the initial meteorological effects on the correlations between AOD and the cloud fraction, we determine the difference in mean cloud parameters between the high- and low-AOD conditions at the end of the time step (d(Cloud_X)) in meteorological variable space rather than in longitude–latitude space. Therefore, we define high and low AOD as the highest and lowest quartile for each bin of the meteorological parameters, respectively. Figure 8 shows the effect of meteorological factors (PVV, RH, LTS and initial cloud fraction) on the d(CF) when the cloud cover increases (ΔCloud_X > 0) under both low- and high-AOD conditions over land after the 3 h time step. Figure 9 shows the effect of meteorological factors on the d(CF) when the cloud cover deceases (ΔCloud_X < 0) under both low- and high-AOD conditions over land after the 3 h time step. From both figures we find that almost all d(CF) values are positive, indicating that the variations of CF are larger in high AOD than that in low AOD after the 3 h time step.
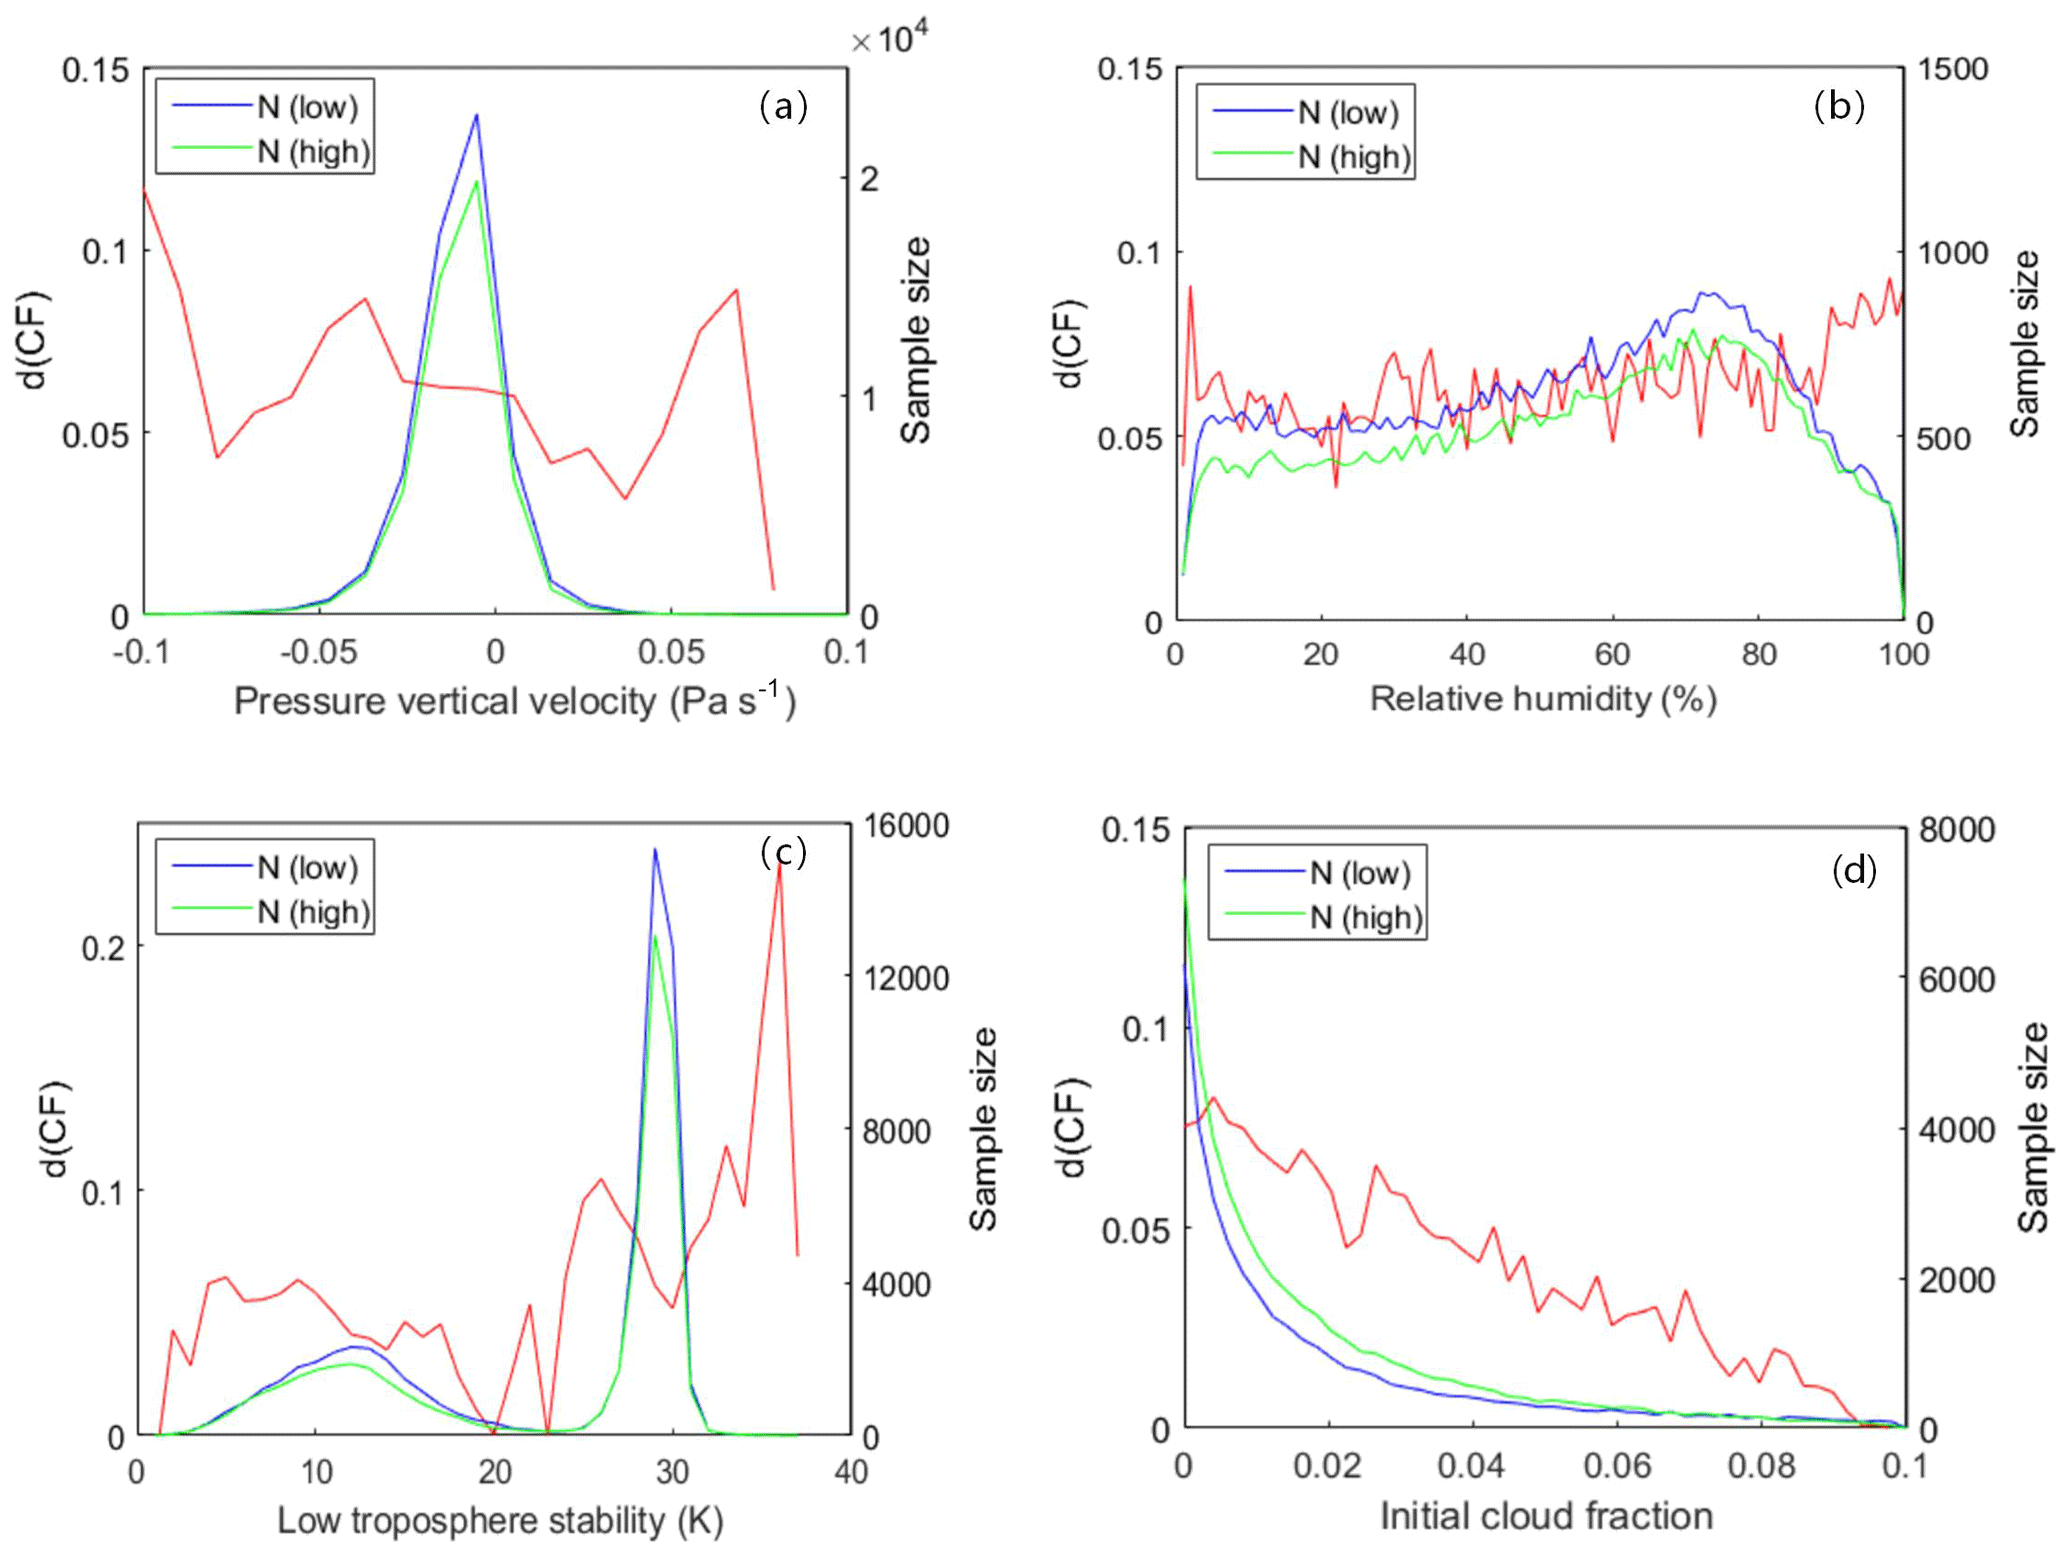
Figure 8Variation of d(CF) (red) as function of initial meteorological parameters and cloud fraction for warm clouds when the cloud cover increases under both low- and high-AOD conditions over land after the 3 h time step. The distribution of points for low (blue) and high (green) AOD as a function of meteorological parameters is shown by the solid lines. This plot is composed from MODIS data (including Terra and Aqua) for all warm cloud points over the years 2008–2017. Meteorological parameters are plotted along the horizontal axis, the left vertical axis denotes d(CF), and the right vertical axis denotes the number of high- and low-AOD samples.
The PVV, a measure of dynamic convection strength, is very important for cloud formation. Negative PVV is indicative of upward air motion; adiabatic expansion and cooling; and hence, if cooling is sufficient, cloud formation (Jones et al., 2009). Figure 8a shows that the d(CF) decreases with the PVV over the range from −0.05 to 0.05 Pa s−1 as cloud cover increases in both conditions over the 3 h time step. This indicates that the weaker downward motion and stronger upward motion of air parcels makes the difference between the increment of cloud cover in high- and low-AOD conditions larger: in other words, the increase rate of cloud cover is larger for high AOD under stronger upward motion of air parcels. Jones et al. (2009) showed that stronger upward motion of air parcels can promote the cloud formation in both high- and low-AOD conditions, but they did not report the increase rate of cloud formation in both AOD conditions. While cloud cover decreases in both conditions over the 3 h time step, Fig. 9a shows that the d(CF) increases with the PVV over the range from −0.05 to 0 Pa s−1 and decreases with the PVV over the range from 0 to 0.05 Pa s−1. This indicates that the decrease rate of cloud cover is smaller for high AOD both under stronger upward motion of air parcels and stronger downward motion of air parcels. Outside this range of PVV values the relationship becomes harder to determine due to the reduced data volume in both cases.
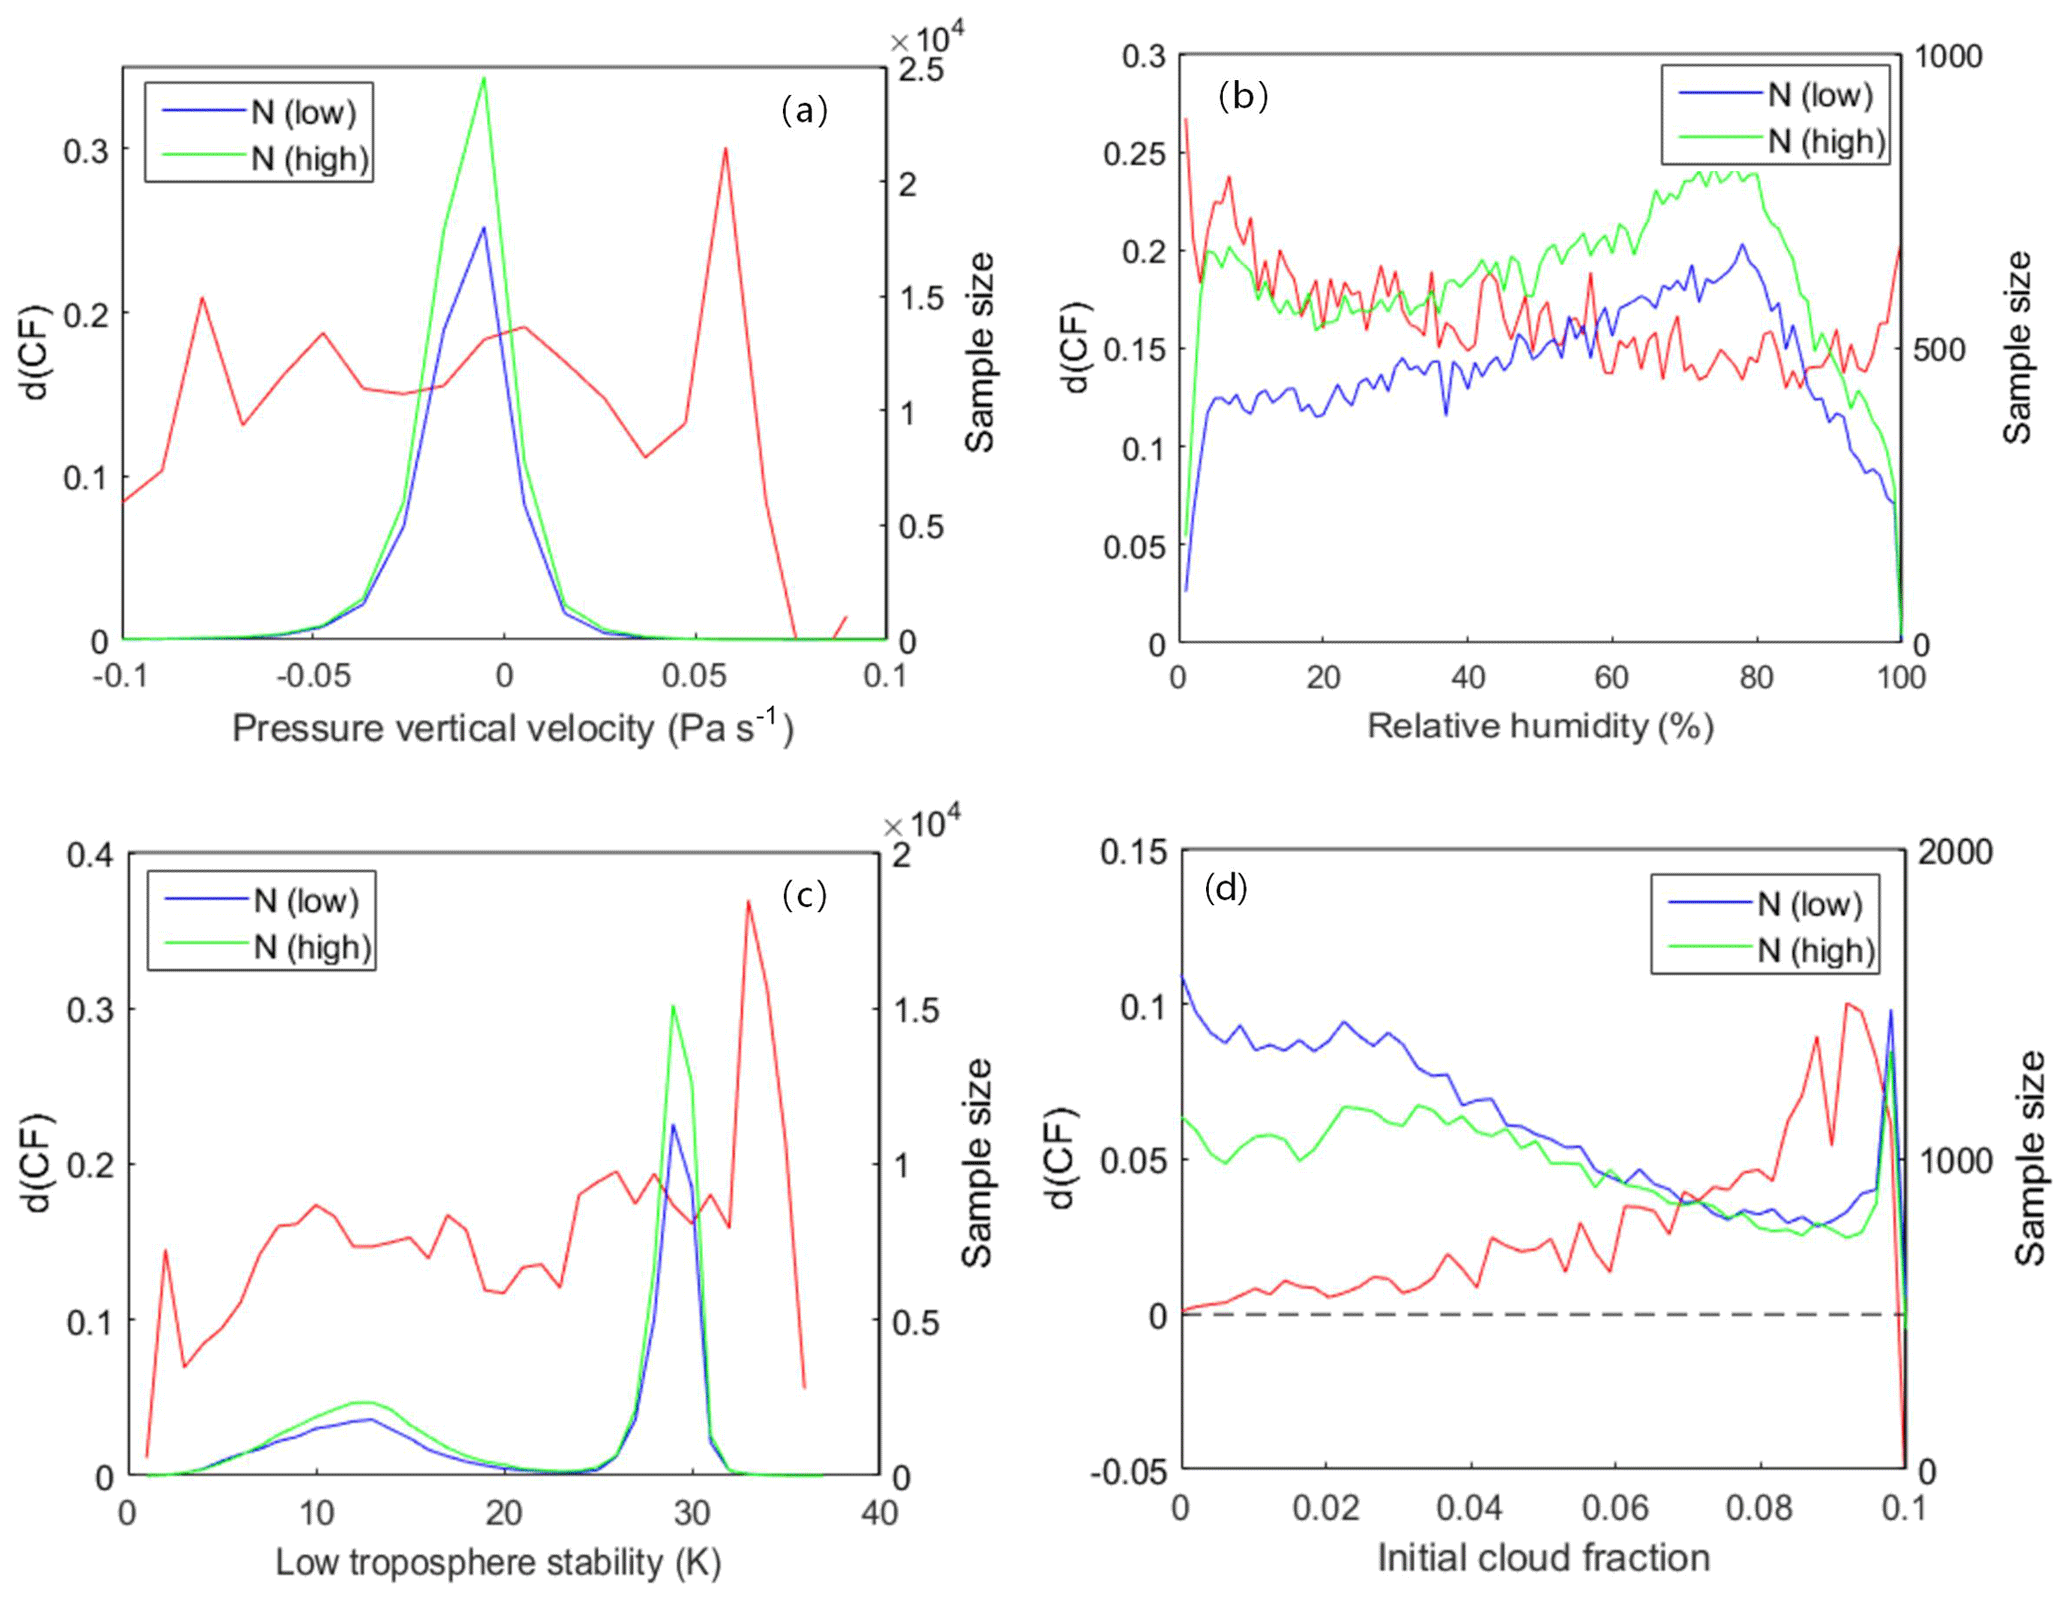
Figure 9The same as Fig. 8 but for warm clouds when the cloud cover decreases under both low- and high-AOD conditions over land after the 3 h time step.
Figure 8b shows that the d(CF) decreases with increasing RH when RH is lower than 20 %. This implies that the increase rate of cloud cover is smaller for high AOD with increasing RH. However, when RH is larger than 20 %, the increase rate of cloud cover is larger for high AOD with increasing RH. An increase in d(CF) occurs due to activation of CCN and formation of clouds (Feingold et al., 2003; Liu et al., 2017). It should be noted that the variation of d(CF) with increasing RH above around 80 % is uncertain as the sample sizes of high- and low-AOD conditions are small. In contrast, the d(CF) values become smaller with increasing RH over the whole RH range (see Fig. 9b), indicating that the decrease rate of cloud cover is smaller for high AOD than that for low AOD with increasing RH.
The LTS is an indicator for the mixing state of the atmospheric layer adjacent to the surface. It describes to some extent the atmosphere's tendency to promote or suppress vertical motion (Medeiros and Stevens, 2011), which in turn affects cloud properties (Klein and Hartmann, 1993). Low LTS represents a relatively unstable atmosphere and high LTS represents a more stable atmosphere. Both Figs. 8c and 9c show that the d(CF) increases and then decreases with increasing LTS when LTS is lower than 20 K, but increases with increasing LTS for higher values (LTS > 20 K). However, the sample sizes of high- and low-AOD conditions are extremely disproportionate when LTS is larger than 20 K. Therefore, it is difficult to reach a conclusion from the relationship between d(CF) and LTS when LTS is larger than 20 K.
Figure 8d shows a strong negative relationship between d(CF) and initial cloud fraction. The d(CF) increases with increasing initial cloud cover, even though the data volume becomes smaller over the range from 0 to 1.0. This implies that the increase rate of cloud cover becomes smaller for high AOD with an increase in the initial cloud cover. Likewise, Fig. 9d also shows that d(CF) decreases with increasing initial cloud cover, indicating that the decrease rate of cloud cover becomes larger for high AOD with increasing initial cloud cover. This phenomenon is different from the observed weak relationship between d(CF) and initial cloud fraction in the oceanic shallow cumulus regime (Gryspeerdt et al., 2014). It may result from the combination of the above two cases.
The large anthropogenic emissions in eastern China render this area an important hotspot for studying how cloud microphysical properties are affected by anthropogenic aerosols (Ding et al., 2013). In this work, based on the near-simultaneous aerosol and cloud retrievals provided by MODIS, together with the ERA-Interim reanalysis data, we investigated the effect of aerosol loading, using AOD as a proxy, on aerosol–cloud interactions. Aerosol–cloud interaction was studied over three major urban clusters in eastern China and over one area over the East China Sea. These four areas are representative of different climatic regions and pollution levels. Data over these four study areas were collected for the years 2008 to 2017 and analyzed in a statistical sense. Both MODIS/Terra and MODIS/Aqua data were used to study the difference in cloud properties between the morning and the early afternoon, i.e., with a time difference of 3 h.
In order to reduce differences in the initial distributions of cloud and meteorological parameters between high- and low-AOD conditions at the start of the time step, normalized histograms of these parameters were made for high- and low-AOD conditions following the method described by Gryspeerdt et al. (2014). After that, the difference between cloud properties (CDR, COT, CWP, CF and CTP) in high- and low-AOD conditions during the Terra overpass at 10:30 LT for each grid was investigated. We looked at statistics for the 10-year data set and found that different regions with various aerosol emission levels, aerosol types and different climate characteristics show different patterns of ACI. The ACI is more complex over land (BTH, YRD and PRD) than over ocean (ECS). Next, the mean change in cloud properties during the 3 h between the observations in low- and high-AOD conditions, as provided by the differences in the observations by MODIS/Terra (morning) and MODIS/Aqua (afternoon) overpasses, was examined and differences were analyzed. The results show that the COT and CWP over land and ocean were increased after the 3 h time step, irrespective of the initial AOD conditions. Furthermore, we investigated the difference between the mean change in cloud properties (CDR, COT, CWP, CF and CTP) in low- and high-AOD conditions between the two observations. We found that the variation in d(Cloud_X) is different for continental and oceanic clouds. This applies to CDR, cloud fraction and CTP, but not to COT and CWP. Both COT and CWP increase over land and ocean after the time step, irrespective of the AOD. The variation trend of COT and CWP after 3 h depends little on the initial AOD, but the initial AOD conditions can affect the amplitude of variation of COT and CWP.
Constrained by relative humidity and boundary thermodynamic and dynamic conditions, the variation of d(CF) in response to aerosol abundance over land was also analyzed. Two cases were considered: (1) when the cloud cover increases under both low- and high-AOD conditions after the 3 h time step and (2) when the cloud cover decreases under both low- and high-AOD conditions after the 3 h time step. From both cases, we find that almost all d(CF) values are positive, indicating that the variations of CF are larger in high AOD than that in low AOD after the 3 h time step. The results show that cloud cover increases much more for high AOD under stronger upward motion of air parcels; meanwhile, the increase rate of cloud cover is larger for high AOD with increasing RH when RH is greater than 20 %. With regards to the effect of LTS on the change in cloud cover, scenes with large cloud fraction variation experience large AOD and large LTS when LTS is smaller than 10 K. Conversely, scenes with smaller cloud fraction variation experience large AOD and large LTS when LTS is larger than 10 K and smaller than 20 K. We also find that a smaller increase in the rate of cloud fraction occurs when scenes experience larger AOD and larger initial cloud cover.
In summary, whilst we have reduced the error due to meteorological effects on aerosol retrieval, meteorological covariation with the cloud and aerosol properties is harder to remove. As aerosol–cloud interaction is a complex problem, it is important to synergistically use multiple observation products and atmospheric models to explore the mechanisms of aerosol–cloud interaction. Therefore, further analysis can be carried out in future work.
All data used in this study are publicly available. The satellite data from the MODIS instrument used in this study were obtained from https://ladsweb.nascom.nasa.gov/search/ (last access: 12 December 2018, Liu, 2018a). The ECMWF ERA-Interim data were collected from the ECMWF data server http://apps.ecmwf.int/datasets/data/interim-full-daily/levtype=pl/ (last access: 12 December 2018, Liu, 2018b).
YL and JZ designed the research. YL led the analyses. YL and GL wrote the manuscript with major input from PZ and further input from all other authors. All authors contributed to interpreting the results and to the finalization and revision of the manuscript.
The authors declare that they have no conflict of interest.
This work was supported by the Strategic Priority Research Program of the
Chinese Academy of Sciences-A (no. XDA19030402), the National Key Research
and Development Program of China (no. 2016YFD0300101), the Natural Science
Foundation of China (no. 31571565, 31671585), the Key Basic Research Project
of Shandong Natural Science Foundation of China (no. ZR2017ZB0422) and the
China Postdoctoral Science Foundation (no. 2018M630733). We are grateful for
the easy access to MODIS data products provided by NASA. We also thank ECMWF
for providing daily ERA-Interim reanalysis data.
Edited by: Rob MacKenzie
Reviewed by: one
anonymous referee
Ackerman, A. S., Kirkpatrick, M. P., Stevens, D. E., and Toown, O. B.: The impact of humidity above stratiform clouds on indirect aerosol climate forcing, Nature, 432, 1014–1017, https://doi.org/10.1038/nature03174, 2004.
Alam, K., Jawed Iqbal, K., Blaschke, T., Qureshi, S., and Khan, G.: Monitoring spatio-temporal variations in aerosols and aerosol-cloud interactions over Pakistan using MODIS data, Adv. Space Res., 46, 1162–1176, https://doi.org/10.1016/j.asr.2010.06.025, 2010.
Albrecht, B. A.: Aerosols, cloud microphysics, and fractional cloudiness, Science, 245, 1227–1231, 1989.
Andreae, M. O.: Correlation between cloud condensation nuclei concentration and aerosol optical thickness in remote and polluted regions, Atmos. Chem. Phys., 9, 543–556, https://doi.org/10.5194/acp-9-543-2009, 2009.
Bond, T. C., Streets, D. G., Yarber, K. F., Nelson, S. M., Woo, J. H., and Klimont, Z.: A technology-based global inventory of black and organic carbon emissions from combustion, J. Geophys. Res.-Atmos., 109, D14203, https://doi.org/10.1029/2003JD003697, 2004.
Ding, A. J., Fu, C. B., Yang, X. Q., Sun, J. N., Zheng, L. F., Xie, Y. N., Herrmann, E., Nie, W., Petäjä, T., Kerminen, V.-M., and Kulmala, M.: Ozone and fine particle in the western Yangtze River Delta: an overview of 1 yr data at the SORPES station, Atmos. Chem. Phys., 13, 5813–5830, https://doi.org/10.5194/acp-13-5813-2013, 2013.
Feingold, G., Remer, L. A., Ramaprasad, J., and Kaufman, Y. J.: Analysis of smoke impact on clouds in Brazilian biomass burning regions: an extension of Twomey's approach, J. Geophys. Res., 106, 22907–22922, 2001.
Feingold, G., Eberhard, W., Veron, D., and Previdi, M.: First measurements of the Twomey indirect effect using ground-based remote sensors, Geophys. Res. Lett., 30, 1287, https://doi.org/10.1029/2002GL016633, 2003.
Grandey, B. S. and Stier, P.: A critical look at spatial scale choices in satellite-based aerosol indirect effect studies, Atmos. Chem. Phys., 10, 11459–11470, https://doi.org/10.5194/acp-10-11459-2010, 2010.
Gryspeerdt, E., Stier, P., and Partridge, D. G.: Satellite observations of cloud regime development: the role of aerosol processes, Atmos. Chem. Phys., 14, 1141-1158, https://doi.org/10.5194/acp-14-1141-2014, 2014.
Guo, J. P., Zhang, X. Y., Wu, Y. R., Zhaxi, Y. Z., Che, H. Z., La, B., Wang, W., and Li, X. W.: Spatio-temporal variation trends of satellite-based aerosol optical depth in China during 1980–2008, Atmos. Environ., 45, 6802–6811, 2011.
Hartmann, D. L., Ocker-Bell, M. E., and Michelsen, M. L.: The effect of cloud type on Earth's energy balance: Global analysis, J. Climate, 5, 1281–1304, 1992.
Jin, M. L. and Shepherd, J. M.: Aerosol relationships to warm season clouds and rainfall at monthly scales over east China: Urban land versus ocean, J. Geophys. Res., 113, D24S90, https://doi.org/10.1029/2008JD010276, 2008.
Jones, T. A., Christopher, S. A., and Quaas, J.: A six year satellite-based assessment of the regional variations in aerosol indirect effects, Atmos. Chem. Phys., 9, 4091–4114, https://doi.org/10.5194/acp-9-4091-2009, 2009.
Kaufman, Y. J. and Koren, I.: Smoke and Pollution Aerosol Effect on Cloud Cover, Science, 313, 655–658, https://doi.org/10.1126/science.1126232, 2006.
Kaufman, Y. J., Koren, I., Remer, L. A., Rosenfeld, D., and Rudich, Y.: The effect of smoke, dust, and pollution aerosol on shallow cloud development over the Atlantic Ocean, P. Natl. Acad. Sci. USA, 102, 11207–11212, https://doi.org/10.1073/pnas.0505191102, 2005.
Klein, S. A. and Hartmann, D. L.: The seasonal cycle of low stratiform clouds, J. Climate, 6, 1587–1606, 1993.
Koren, I., Martins, J. V., Remer, L. A., and Afargan, H.: Smoke invigoration versus inhabitation of clouds over the Amazon, Science, 321, 946–949, https://doi.org/10.1126/science.1159185, 2008.
Koren, I., Feingold, G., and Remer, L. A.: The invigoration of deep convective clouds over the Atlantic: aerosol effect, meteorology or retrieval artifact?, Atmos. Chem. Phys., 10, 8855–8872, https://doi.org/10.5194/acp-10-8855-2010, 2010.
Kourtidis, K., Stathopoulos, S., Georgoulias, A. K., Alexandri, G., and Rapsomanikis, S.: A study of the impact of synoptic weather conditions and water vapor on aerosol–cloud relationships over major urban clusters of China, Atmos. Chem. Phys., 15, 10955–10964, https://doi.org/10.5194/acp-15-10955-2015, 2015.
Krüger, O. and Graßl, H.: The indirect aerosol effect over Europe, Geophys. Res. Lett., 29, 1925, https://doi.org/10.1029/2001GL014081, 2002.
Lei, Y., Zhang, Q., He, K. B., and Streets, D. G.: Primary anthropogenic aerosol emission trends for China, 1990–2005, Atmos. Chem. Phys., 11, 931–954, https://doi.org/10.5194/acp-11-931-2011, 2011.
Levy, R. C., Remer, L. A., Kleidman, R. G., Mattoo, S., Ichoku, C., Kahn, R., and Eck, T. F.: Global evaluation of the Collection 5 MODIS dark-target aerosol products over land, Atmos. Chem. Phys., 10, 10399–10420, https://doi.org/10.5194/acp-10-10399-2010, 2010.
Li, Z., Lau, W. K.-M., Ramanathan, V., Wu, G., Ding, Y., Manoj, M. G., Liu, J., Qian, Y., Li, J., Zhou, T., and Fan, J.: Aerosol and monsoon climate interactions over Asia, Rev. Geophys., 54, 866–929, https://doi.org/10.1002/2015RG000500, 2016.
Liu, Y. Q.: MODIS L3 collection 6.1 data, Institute of Urban Environment, Chinese Academy of Sciences, available at: https://ladsweb.nascom.nasa.gov/search/, last access: 12 December 2018a.
Liu, Y. Q.: ERA-Interim reanalysis data set, Institute of Urban Environment, Chinese Academy of Sciences, available at: http://apps.ecmwf.int/datasets/data/interim-full-daily/ levtype=pl/, last access: 12 December 2018b.
Liu, Y., de Leeuw, G., Kerminen, V.-M., Zhang, J., Zhou, P., Nie, W., Qi, X., Hong, J., Wang, Y., Ding, A., Guo, H., Krüger, O., Kulmala, M., and Petäjä, T.: Analysis of aerosol effects on warm clouds over the Yangtze River Delta from multi-sensor satellite observations, Atmos. Chem. Phys., 17, 5623–5641, https://doi.org/10.5194/acp-17-5623-2017, 2017.
Loeb, N. G. and Schuster, G. L.: An observational study of the relationship between cloud, aerosol and meteorology in broken lowlevel cloud conditions, J. Geophys. Res.-Atmos., 113, D14214, https://doi.org/10.1029/2007JD009763, 2008.
Lu, Z., Streets, D. G., Zhang, Q., Wang, S., Carmichael, G. R., Cheng, Y. F., Wei, C., Chin, M., Diehl, T., and Tan, Q.: Sulfur dioxide emissions in China and sulfur trends in East Asia since 2000, Atmos. Chem. Phys., 10, 6311–6331, https://doi.org/10.5194/acp-10-6311-2010, 2010.
Matheson, M. A., Coakley Jr., J. A., and Tahnk, W. R.: Aerosol and cloud property from relationships for summer stratiform clouds in the northeastern Atlantic from advanced very high resolution radiometer observations, J. Geophys. Res., 110, D24204, https://doi.org/10.1029/2005JD006165, 2005.
Matsui, T., Masunaga, H., Kreidenweis, S. M., Pielke Sr., R. A., Tao, W.-K., Chin, M., and Kaufman, Y. J.: Satellite based assessment of marine low cloud variability associated with aerosol, atmospheric stability, and the diurnal cycle, J. Geophys. Res., 111, D17204, https://doi.org/10.1029/2005JD006097, 2006.
Mauger, G. S. and Norris, J. R.: Meteorological bias in satellite estimates of aerosol-cloud relationships, Geophys. Res. Lett., 34, L16824, https://doi.org/10.1029/2007GL029952, 2007.
Medeiros, B. and Stevens, B.: Revealing differences in GCM representations of low clouds, Clim. Dynam., 36, 385–399, 2011.
Menon, S., Del Genio, A. D., Kaufman, Y., Bennartz, R., Koch, D., Loeb, N., and Orlikowski, D.: Analysis signatures of aerosolcloud interactions from satellite retrievals and the GISS GCM to constrain the aerosol indirect effect, J. Geophys. Res.-Atmos., 113, D14S22, https://doi.org/10.1029/2007jd009442, 2008.
Meskhidze, N. and Nenes, A.: Effects of ocean ecosystem on marine aerosol-cloud interaction, Adv. Meteorol., 2010, 239808, https://doi.org/10.1155/2010/239808, 2010.
Meskhidze, N., Remer, L. A., Platnick, S., Negrón Juárez, R., Lichtenberger, A. M., and Aiyyer, A. R.: Exploring the differences in cloud properties observed by the Terra and Aqua MODIS Sensors, Atmos. Chem. Phys., 9, 3461–3475, https://doi.org/10.5194/acp-9-3461-2009, 2009.
Michibata, T., Kawamoto, K., and Takemura, T.: The effects of aerosols on water cloud microphysics and macrophysics based on satellite-retrieved data over East Asia and the North Pacific, Atmos. Chem. Phys., 14, 11935–11948, https://doi.org/10.5194/acp-14-11935-2014, 2014.
Myhre, G., Stordal, F., Johnsrud, M., Kaufman, Y. J., Rosenfeld, D., Storelvmo, T., Kristjansson, J. E., Berntsen, T. K., Myhre, A., and Isaksen, I. S. A.: Aerosol-cloud interaction inferred from MODIS satellite data and global aerosol models, Atmos. Chem. Phys., 7, 3081–3101, https://doi.org/10.5194/acp-7-3081-2007, 2007.
Platnick, S., King, M. D., Ackerman, S. A., Menzel, W. P., Baum, B. A., Riedi, J. C., and Frey, R. A.: The MODIS cloud products: algorithms and examples from Terra, IEEE T. Geosci. Remote, 41, 459–473, 2003.
Remer, L. A., Kaufman, Y. J., Tanre, D., Mattoo, S., Chu, D. A., Martins, J. V., Li, R. R., Ichoku, C., Levy, R. C., Kleidman, R. G., Eck, T. F., Vermote, E., and Holben, B. N.: The MODIS aerosol algorithm, products, and validation, J. Atmos. Sci., 62, 947–973, https://doi.org/10.1175/JAS3385.1, 2005.
Reutter, P., Su, H., Trentmann, J., Simmel, M., Rose, D., Gunthe, S. S., Wernli, H., Andreae, M. O., and Pöschl, U.: Aerosol- and updraft-limited regimes of cloud droplet formation: influence of particle number, size and hygroscopicity on the activation of cloud condensation nuclei (CCN), Atmos. Chem. Phys., 9, 7067–7080, https://doi.org/10.5194/acp-9-7067-2009, 2009.
Rosenfeld, D.: Suppression of rain and snow by urban and industrial air pollution, Science, 287, 1793–1796, 2000.
Rosenfeld, D., Andreae, M. O., Asmi, A., Chin, M., de Leeuw, G., Donovan, D., Kahn, R., Kinne, S., Kivekäs, N., Kulmala, M., Lau, W., Schmidt, S., Suni, T., Wagner, T., Wild, M., and Quaas, J.: Global observations of aerosol-cloudprecipitation-climate interactions, Rev. Geophys., 52, 750–808, https://doi.org/10.1002/2013RG000441, 2014.
Saponaro, G., Kolmonen, P., Sogacheva, L., Rodriguez, E., Virtanen, T., and de Leeuw, G.: Estimates of the aerosol indirect effect over the Baltic Sea region derived from 12 years of MODIS observations, Atmos. Chem. Phys., 17, 3133–3143, https://doi.org/10.5194/acp-17-3133-2017, 2017.
Song, Y., Achberger, C., and Linderholm, H. W.: Rain-season trends in precipitation and their effect in different climate regions of China during 1961–2008, Environ. Res. Lett., 6, 034025, https://doi.org/10.1088/1748-9326/6/3/034025, 2011.
Sporre, M. K., Swietlicki, E., Glantz, P., and Kulmala, M.: A long-term satellite study of aerosol effects on convective clouds in Nordic background air, Atmos. Chem. Phys., 14, 2203–2217, https://doi.org/10.5194/acp-14-2203-2014, 2014.
Stathopoulos, S., Georgoulias, A. K., and Kourtidis, K.: Spaceborne observations of aerosol-cloud relations for cloud systems of different heights, Atmos. Res., 183, 191–201, 2017.
Stephens, G., Vane, D. G., Boain, R. J., Mace, G. G., Sassen, K., Wang, Z., Illingworth, A. J., O'Connor, E. J., Rossow, W. B., Durden, S. L., Miller, S. D., Austin, R. T., Benedetti, A., and Mitrescu, C.: The CloudSat mission and the A-Train: A new dimension of space-based observations of clouds and precipitation, Bulletin of the American Meteorological Society, B. Am. Meteorol. Soc., 83, 1771–1790, 2002.
Stevens, B. and Feingold, G.: Untangling aerosol effects on clouds and precipitation in a buffered system, Nature, 461, 607–613, https://doi.org/10.1038/nature08281, 2009.
Streets, D. G., Gupta, S., Waldhoff, S. T., Wang, M. Q., Bond, T. C., and Yiyun, B.: Black carbon emissions in China, Atmos. Environ., 35, 4281–4296, 2001.
Streets, D. G., Bond, T. C., Carmichael, G. R., Fernandes, S. D., Fu, Q., He, D., Klimont, Z., Nelson, S. M., Tsai, N. Y., Wang, M. Q., Woo, J. H., and Yarber, K. F.: An inventory of gaseous and primary aerosol emissions in Asia in the year 2000, J. Geophys. Res.-Atmos., 108, 8809, https://doi.org/10.1029/2002JD003093, 2003.
Streets, D. G., Yu, C., Wu, Y., Chin, M., Zhao, Z. C., Hayasaka, T., and Shi, G. Y.: Aerosol trends over China, 1980–2000, Atmos. Res., 88, 174–182, 2008.
Su, W., Loeb, N. G., Xu, K.-M., Schuster, G. L., and Eitzen, Z. A.: An estimate of aerosol indirect effect from satellite measurements with concurrent meteorological analysis, J. Geophys. Res.-Atmos., 115, D18219, https://doi.org/10.1029/2010JD013948, 2010.
Tang, J., Wang, P., Mickley, L. J., Xia, X., Liao, H., Yue, X., Sun, L., and Xia, J.: Positive relationship between liquid cloud droplet effective radius and aerosol optical depth over Eastern China from satellite data, Atmos. Environ., 84, 244–253, 2014.
Twomey, S.: Pollution and the planetary albedo, Atmos. Environ., 41, 120–125, 1974.
Twomey, S.: The influence of pollution on the shortwave albedo of clouds, J. Atmos. Sci., 34, 1149–1152, 1977.
Wang, F., Guo, J., Zhang, J., Wu, Y., Zhang, X., Deng, M., and Li, X.: Satellite observed aerosol-induced variability in warm cloud properties under different meteorological conditions over eastern China, Atmos. Environ., 84, 122–132, 2014.
Webb, M. J., Senior, C. A., Sexton, D. M. H., Ingram, W. J., Williams, K. D., Ringer, M. A., McAvaney, B. J., Colman, R., Soden, B. J., Gudgel, R., Knutson, T., Emori, S., Ogura, T., Tsushima, Y., Andronova, N., Li, B., Musat, I., Bony, S., and Taylor, K. E.: On the contribution of local feedback mechanisms to the range of climate sensitivity in two GCM ensembles, Clim. Dynam., 27, 17–38, 2006.
Wood, R. and Bretherton, C. S.: On the relationship between Stratiform Low Cloud Cover and Lower-Tropospheric Stability, J. Climate, 19, 6425–6432, 2006.
Xiong, X., Wu, A., and Cao, C.: On-orbit calibration and inter-comparison of Terra and Aqua MODIS surface temperature spectral bands, Int. J. Remote Sens., 29, 5347–5359, https://doi.org/10.1080/01431160802036300, 2008.
Yuan, T., Li, Z., Zhang, R., and Fan, J.: Increase of cloud droplet size with aerosol optical depth: an observation and modeling study, J. Geophys. Res., 113, D04201, https://doi.org/10.1029/2007JD008632, 2008.
Zhao, C. S., Tie, X. X., and Lin, Y. P.: A possible positive feedback of reduction of precipitation and increase in aerosols over eastern central China, Geophys. Res. Lett., 33, L11814, https://doi.org/10.1029/2006GL025959, 2006.