the Creative Commons Attribution 4.0 License.
the Creative Commons Attribution 4.0 License.
 | 18 Apr 2024
Opposite effects of aerosols and meteorological parameters on warm clouds in two contrasting regions over eastern China
Yuqin Liu
Tao Lin
Jiahua Zhang
Yiyi Huang
Xian Wu
Hong Ye
Guoqin Zhang
Xin Cao
The sensitivity (S) of cloud parameters to the influence of different aerosol and meteorological parameters has in most previous aerosol–cloud interaction (aci) studies been addressed using traditional statistical methods. In the current study, relationships between cloud droplet effective radius (CER) and aerosol optical depth (AOD, used as a proxy for cloud condensation nuclei, CCN), i.e., the sensitivity (S) of CER to AOD, are investigated with different constraints of AOD and cloud liquid water path (LWP). In addition to traditional statistical methods, the geographical detector method (GDM) is applied in this study to quantify the relative importance of the effects of aerosol and meteorological parameters, as well as their interaction, on S. Moderate Resolution Imaging Spectroradiometer (MODIS) C6 L3 data and European Centre for Medium-Range Weather Forecasts (ECMWF) ERA-5 reanalysis data, for the period from 2008 to 2022, were used to investigate aci over eastern China. Two contrasting areas were selected: the heavily polluted Yangtze River Delta (YRD) and a relatively clean area over the East China Sea (ECS). Linear regression analysis shows that CER decreases with the increase in AOD (negative S) in the moderately polluted atmosphere () over the ECS, whereas, in contrast, CER increases with increasing AOD (positive S) in the polluted atmosphere (AOD>0.3) over the YRD. Evaluation of S as function of the LWP shows that in the moderately polluted atmosphere over the ECS, S is negative in the LWP interval [40 g m−2, 200 g m−2], and the sensitivity of CER to AOD is substantially stronger as LWP is larger. In contrast, in the polluted atmosphere over the YRD, S is positive in the LWP interval [0 g m−2, 120 g m−2] and does not change notably as function of LWP in this interval. The study further shows that over the ECS, the CER is larger for higher low tropospheric stability (LTS) and relative humidity (RH) but lower for higher pressure vertical velocity (PVV). Over the YRD, there is no significant influence of LTS on the relationship between CER and AOD. The GDM has been used as an independent method to analyze the sensitivity of cloud parameters to AOD and meteorological parameters (RH, LTS and PVV). The GDM has also been used to analyze the effects of interactions between two parameters and thus obtain information on confounding meteorological effects on the aci. Over the ECS, cloud parameters are sensitive to almost all parameters considered except for cloud top pressure (CTP), and the sensitivity to AOD is larger than that to any of the meteorological factors. Among the meteorological factors, the cloud parameters are most sensitive to PVV and least sensitive to RH. Over the YRD, the explanatory power of the sensitivity of cloud parameters to AOD and meteorological parameters is much smaller than over the ECS, except for RH, which has a statistically significant influence on CTP and can explain 74 % of the variation of CTP. The results from the GDM analysis show that cloud parameters are more sensitive to the combination of aerosol and a meteorological parameter than to each parameter alone, but confounding effects due to co-variation of both parameters cannot be excluded.
- Article
(7568 KB) - Full-text XML
- Companion paper 1
- Companion paper 2
- Companion paper 3
-
Supplement
(375 KB) - BibTeX
- EndNote


The atmosphere is primarily composed of gases, i.e., nitrogen, oxygen, and several noble gases, as well as a wide variety of trace gases that occur in relatively small and highly variable amounts. In addition, liquid and solid particles are suspended in the atmosphere. The suspension of solid and liquid particles in the gaseous medium is technically defined as an aerosol, but usually the term aerosol refers to the particulate component only (Seinfeld and Pandis, 1998). The aerosol particles originate from a large variation of both direct and indirect sources. The concentrations and chemical and physical properties of aerosol particles change under the influence of a variety of atmospheric processes and thus are variable in space and time. The residence time of tropospheric aerosol particles varies from hours to weeks (Bellouin et al., 2020), depending on particle size and atmospheric conditions. Directly emitted aerosol types include, e.g., sea spray, dust, smoke, volcanic ash and pollen. Secondary formation of aerosol particles occurs through nucleation and subsequent growth by physical and chemical processes such as condensation, coagulation and multiphase chemical reactions on the particle surface, involving precursor gases such as sulfur dioxide (SO2), nitrogen dioxide (NO2), ammonia (NH3) and volatile organic compounds (VOCs).
Aerosol particles are important for climate, air quality and heterogenous chemical processes. Aerosol particles affect climate by their interaction with radiation (aerosol radiation interaction, ari), which exerts a radiative forcing on the Earth energy budget, which results in rapid adjustments of global mean atmospheric quantities such as temperature. The sign and strength of radiative forcing (RF) due to ari (RFari) vary with environmental parameters (Bellouin et al., 2020). In particular, aerosol particles scatter incoming solar radiation back into space, but the effect of RFari depends on the brightness of the aerosol with respect to that of the underlying surface. The scattering of (bright) aerosol over a darker surface results in cooling and reduction of the warming effect of greenhouse gases (GHGs). In contrast, the interaction of absorbing aerosol particles with solar radiation may result in local heating and thus reinforce the GHG effect and influence meteorological processes.
Aerosol particles can act as cloud condensation nuclei (CCN, in liquid clouds) or ice nucleating particles (INP, in ice clouds), depending on their chemical composition and size. When CCN are activated they can modify cloud microphysical properties and precipitation and thus indirectly influence the Earth's radiative budget (aerosol–cloud interactions, aci) (Tao et al., 2012; Fan et al., 2016; Rosenfeld et al., 2019; Rao and Dey, 2020; Bellouin et al., 2020). An increase in CCN concentrations leads to an increase in the number of cloud droplets (Nd) and, if the cloud liquid water path (LWP) remains unchanged, the decrease in the cloud droplet effective radius (CER). The smaller CER in turn results in the enhanced reflection of solar radiation and thus cloud albedo and enhanced RF due to aci (RFaci). This effect of the increase in the number of aerosol particles on cloud properties at constant LWP is often referred to as the Twomey effect (Twomey, 1977; Feingold, et al., 2001; Matheson et al., 2005; Koren et al., 2005; Meskhidze and Nenes, 2010; Costantino and Bréon, 2010, 2013). Rapid adjustments are another component of RFaci, which may also lead to the modification of other cloud properties in response to the increase in Nd and decrease in CER, such as a decrease in precipitation efficiency, resulting in the increase in the LWP and the amount of clouds, thus enhancing the reflection of solar radiation (Albrecht, 1989). These two effects of aci are sometimes referred to as the cloud albedo and cloud lifetime effects (Quaas et al., 2008).
The CER is an important factor affecting cloud physical processes and optical properties. Slingo (1990) pointed out that a reduction in the average CER by 15 %–20 % can balance the radiative forcing at the top of the atmosphere caused by a doubling of carbon dioxide. Therefore, small changes in cloud microphysical properties may lead to important climate impacts (Zhao et al., 2018). Further study on the sensitivity of CER to aerosols (SCER-A, further referred to as S), together with meteorological parameters influencing aci, can improve our understanding of these processes and the effects of aci on RF, leading to improved aerosol–cloud parameterizations in regional climate models. The variation in Nd with CCN is referred to as the susceptibility β (; e.g., Gryspeerdt et al., 2023), and the variation of CER with CCN is referred to as the sensitivity S (Eq. 1 in Sect. 3.1). Much of the variation of aerosol–cloud effective radiative forcing in ensembles of climate models is due to the variation in β, while β is also central to the strength of cloud adjustments (Gryspeerdt et al., 2023).
The sensitivity of microphysical properties of clouds to aerosol has been studied based on data from a large number of monitoring campaigns, using satellite, aircraft and ground-based observations and using model simulations. Because of the large spatial coverage, satellite instruments have been widely used to study aerosol–cloud interaction in different conditions, confirming the high sensitivity of cloud properties to aerosol (e.g., Yuan et al., 2008; Rosenfeld et al., 2014; Saponaro et al., 2017; Liu et al., 2018; Q. Liu et al., 2021; Pandey et al., 2020; Christensen et al., 2020). In studies on S utilizing satellite data, which is the subject of the current study, the aerosol optical depth (AOD) is often used as a proxy for the aerosol concentration, which is justified by the correlation of AOD and CCN published by Andreae (2009). However, AOD is determined by all aerosol particles in the atmospheric column, including particles that do not act as CCN; depends on the relative humidity (RH) throughout the atmospheric column; does not provide information on chemical composition; and may be influenced by aerosol in disconnected layers. The use of the Aerosol Index (AI), the product of AOD and the Ångström exponent (AE; describing the spectral variation of AOD), is suggested as a better indicator of CCN because AE includes information on aerosol size (e.g., Nakajima et al., 2001). However, the AE is determined from AOD retrieved at two or more wavelengths, and the evaluation of the results versus ground-based reference data shows the large uncertainty in AE. Therefore, in recent MODIS product collections, AE is not provided over land (e.g., Levy et al., 2013; Kourtidis et al., 2015). AE is also not well defined for low AOD for which uncertainty is largest (Bellouin et al., 2020; Gryspeerdt et al., 2023). The issues associated with using AOD or AI as proxy for CCN were discussed by, among others, Rosenfeld et al. (2014), who do not recommend the use of AI while also concluding that no better proxy is available. Therefore, in this study, AOD is used as a proxy for CCN to study S. It is noted that in other studies, e.g., Jia et al. (2022), both AOD and AI have been used and the results show similar behavior.
Many studies confirmed the Twomey effect (e.g., Chen et al., 2014; Christensen et al., 2016; Jia et al., 2019). However, other studies show that, over some areas and especially over land in situations with high AOD, the CER increases with the increase in AOD, in contrast to the hypothesis of the Twomey effect (e.g., Feingold et al., 2001; Yuan et al., 2008; Grandey and Stier, 2010; Tang et al., 2014; Wang et al., 2015; Jia et al., 2019; Liu et al., 2020). It is noted that in these studies, the relationship between CER and aerosol concentration was not constrained by LWP, although this is the premise of the Twomey effect.
Meteorological conditions are important factors determining both the occurrence of clouds and cloud properties, and therefore, in aci studies, the variation of meteorological conditions needs to be considered together with the variation of AOD (e.g., Myhre et al., 2007; Tang et al., 2014). On the one hand, meteorological parameters influence the Twomey effect. Jones et al. (2009) concluded that vertical motion, aerosol type and aerosol layer height do make a significant contribution to RFaci and that these factors are often more important than total aerosol concentration alone and that the relative importance of each differs significantly from region to region. Wang et al. (2014) proved that the well-recognized aerosol effect mingles with meteorological conditions (RH and pressure vertical velocity, PVV), which likely is the main reason for the positive values of S over land. Tang et al. (2014) observed the Twomey effect over ocean but a positive CER–AOD relationship over eastern China, which they attributed to changes in relative humidity and wind fields. Tang et al. (2014) concluded that “our results suggest that the effect of meteorology may not be negligible when investigating the aerosol indirect effect on a large scale, especially when the weather conditions are complex and change frequently”. Andersen and Cermak (2015) studied biomass burning aerosol over the Atlantic Ocean (September–December) in stable and unstable environments (low tropospheric stability, LTS) and observed that the aerosol effect is stronger in unstable environment, especially during biomass burning episodes. These authors concluded that “the observed absolute differences in CER between stable and unstable environments are driven by cloud dynamical effects (CER and LWP are positively associated), or meteorology”. Jia et al. (2022) inferred that S increases remarkably with both cloud base height and cloud geometric thickness (proxies for vertical velocity at cloud base), suggesting that stronger aci generally occurs under larger updraft velocity conditions. On the other hand, the meteorological parameters also influence the potential adjustments. Koren et al. (2010) reported that observed cloud top height and cloud fraction correlate best with model pressure updraft velocity and relative humidity. Quaas et al. (2010) discussed the relationship between total cloud cover and AOD, often observed in satellite data, based on model simulations to test six hypotheses. These authors concluded that the increase in aerosol optical depth that accompanies the swelling of aerosol particles in humid air masses is the dominant process contributing to the observed correlation, confirming earlier conclusions by Myhre et al. (2007). Boucher and Quaas (2012) reported that aerosol humidification has a large impact on the relationship between AOD and rain rate and that discriminating the data into classes of pressure vertical velocity and/or relative humidity does not eliminate these meteorological effects. Gryspeerdt et al. (2014b) studied the relationship between aerosol and initial cloud cover as a function of RH and vertical convection strength. Liu et al. (2017) showed that the increase in cloud cover is promoted in an environment with high RH. A rising air mass can promote the formation of thicker and higher clouds.
The above are examples of studies addressing the influence of different aerosol and meteorological parameters on the sensitivity of cloud parameters to aerosol and potential confounding effects. Most of them used traditional statistical methods or stratified the data according to confounding meteorological parameters (e.g., Saponaro et al., 2017; Ma et al., 2018). In the current study the geographical detector method (GDM) is applied as a complementary tool to quantify the relative importance of the effects of nine parameters on S. The GDM is explained in detail in Sect. 3.2. In brief, a set of statistical methods is used to detect the spatial variability of aerosol and cloud properties, which are spatially differentiated, and evaluate the occurrence of correlations in their behavior and the driving forces behind these correlations (Wang and Hu, 2012; Wang et al., 2016). The basic idea of the GDM is that the spatial distributions of two variables tend to be similar if these two variables are connected (Zhang and Zhao, 2018). The method is used in this study to analyze the relative importance of different factors, and interactions between them, influencing aci.
The focus of the current study is to establish a CER–aerosol parameterization scheme by the application of the GDM to satellite data over two contrasting areas, i.e., the Yangtze River Delta (YRD) in eastern China, with high aerosol concentrations, and a relatively clean area over the East China Sea (ECS). The satellite data are first used to study the CER sensitivity to aerosol for different AOD regimes and all LWP values, followed by constraining the LWP in different intervals. It is noted that RFaci is formulated in terms of Nd, whereas studies on the Twomey effects often use CER alone instead of Nd, such that they were not really looking at the Twomey effect in isolation and not really studying the RFaci either (McComiskey and Feingold, 2012). CER is readily available as a satellite retrieval product, although in particular over land the reliability is questioned (Grandey and Stier, 2010), whereas Nd is derived from CER and the cloud optical thickness (COT) (e.g., Grandey and Stier, 2010; Arola et al., 2022). While Nd is affected by biases in the CER retrieval, these are different to the CER biases alone (and in some cases may offset each other; Painemal and Zuidema, 2011). For marine stratocumulus clouds, the Nd retrieval appears to be surprisingly accurate (Gryspeerdt et al., 2022). The comparison of global maps of the sensitivities of CER and Nd to AOD by Grandey and Stier (2010) exhibits very similar patterns. In this study, the CER sensitivity to AOD is stratified by LWP, which, however, poses problems in the evaluation of RFaci. However, the current study focuses on understanding effects of different parameters on CER sensitivity to aerosol rather than the application to determine RFaci.
The results from the CER sensitivity study are used to guide the application of GDM to determine the relative effects of different parameters on aci. Relations between CER and AOD, meteorological conditions, and several cloud properties are determined, including combined effects of different influencing parameters.
2.1 Study area
The complex aerosol composition and the high aerosol concentrations render eastern China an interesting area for a variety of studies of processes involving aerosols, including the current study on the use of satellite data for the systematic assessment of aci, i.e., S, adjustments and confounding meteorological factors. The study focuses on two areas, i.e., the Yangtze River Delta (YRD, 26–35° N, 113–122° E) in eastern China and the East China Sea (ECS, 19–28° N, 125–134° E). The locations of the YRD and the ECS are shown in the map in Fig. 1.
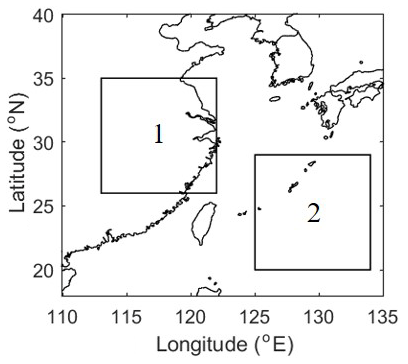
Figure 1Map showing the locations of the two study areas selected for aerosol—cloud interaction studies: area 1 is the Yangtze River Delta (YRD; 26–35° N, 113–122° E) and area 2 indicates the selected East China Sea area (ECS; 20–29° N, 125–134° E).
The YRD has a developed economy, with much industrial activity, large harbors (sea and river) and related busy ship traffic, and dense population in large urban centers, all with high traffic intensity and high energy consumption. In addition to the direct emission of black carbon, also aerosol precursor gases such as NO2, SO2 and VOCs are emitted from the combustion of biomass, coal and petrochemical fuels, leading to the formation of secondary aerosol particles such as nitrate and sulfate aerosols, while agricultural activities result in the emission of dust, ammonia and biological VOCs (BVOCs) into the atmosphere. These activities and associated emissions result in the occurrence of high AOD over the YRD. Over the East China Sea (ECS) the main aerosol types are sea spray aerosol generated by the interaction between wind and waves and anthropogenic pollutants transported from the Asian continent over the ocean in the East Asian outflow. During transport over hundreds of kilometers, aerosol particles are removed by several processes such as dry and wet deposition, and hence the aerosol concentrations decrease and the AOD becomes relatively low and is dominated by sea spray aerosol. In view of the differences in aerosol composition and concentrations, the polluted YRD area and the relatively clean ECS area were selected as contrasting regions for the study of the influence of aerosols on cloud properties over land and over ocean.
2.2 Data used
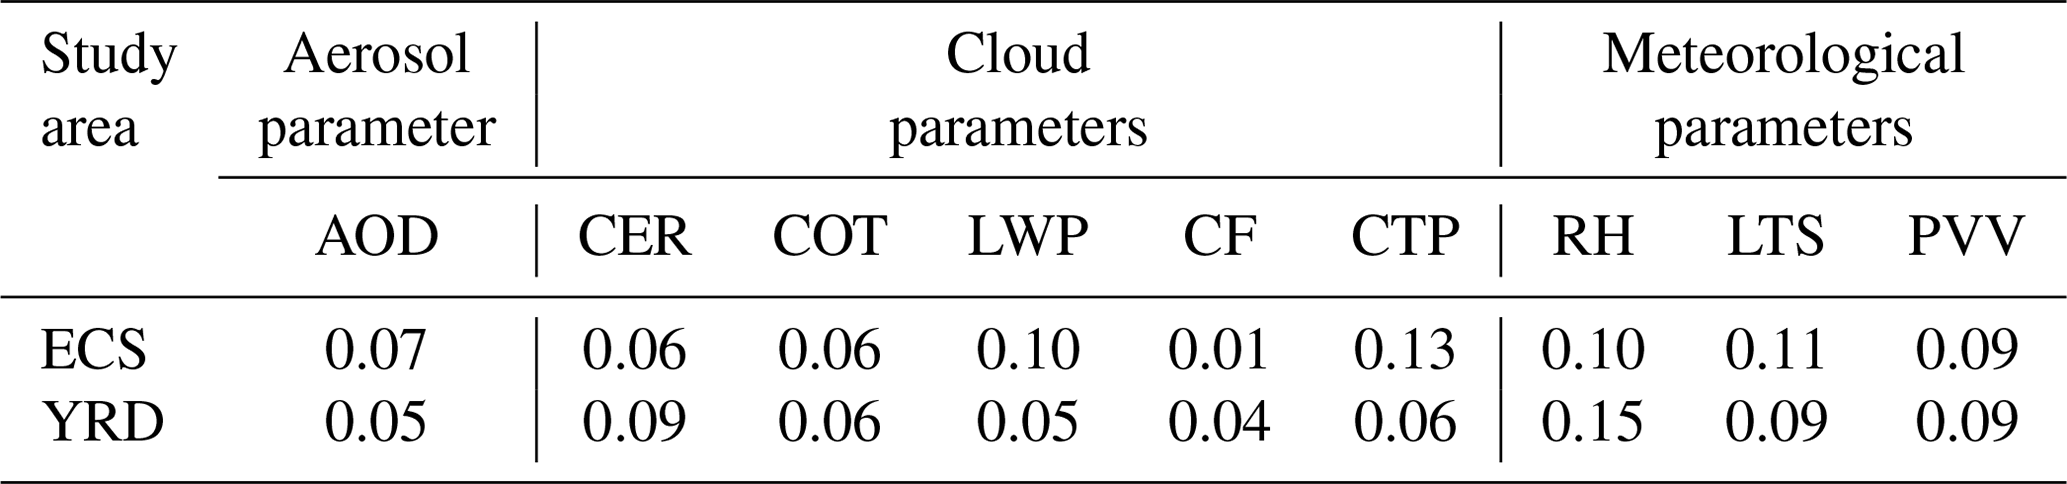
In this study, aerosol and cloud properties were used (see Table 1), which were derived from measurements from the Moderate Resolution Imaging Spectroradiometer (MODIS) aboard the Aqua satellite, for the period 2008–2022 (15 years). These data were selected because the MODIS data are widely used, and therefore they are well characterized. In addition, the Aqua satellite flies in an afternoon orbit with local overpass time around 13:30 local time (LT), when the atmospheric boundary layer is well developed. MODIS L3 Collection 6.1 daily aerosol and cloud parameters were downloaded from the LAADS website (Platnick et al., 2017a) with a spatial resolution of 1°×1°. Aerosol retrieval is only executed in clear-sky conditions, whereas cloud properties can only be retrieved in cloudy skies. Hence, it is not possible to obtain co-located aerosol and cloud data from satellite. For satellite-based aci studies it is assumed that, following, e.g., Jia et al. (2022), aerosol properties are homogeneous enough to be representative for those in adjacent cloud areas. Consequences of this assumption were discussed by McComiskey and Feingold (2012). The MODIS instrument has 36 spectral bands – aerosol properties are retrieved using the first seven of these (0.47–2.13 µm) (Remer et al., 2005; Levy et al., 2013; Sayer et al., 2014, 2017), while additional wavelengths in other parts of the spectrum are used for the retrieval of cloud properties (Platnick et al., 2003, 2017b). Detailed information on algorithms for the retrieval of aerosol and cloud properties is provided at http://modis-atmos.gsfc.nasa.gov (last access: 1 July 2021). In this study we use the AOD at 550 nm (referred to as AOD throughout this paper), CER, COT, cloud liquid water path (LWP), cloud top pressure (CTP), cloud fraction (CF) and cloud top temperature (CTT). The MODIS Collection 6.1 AOD product over China has been validated by, e.g., Che et al. (2019) and globally over land and ocean by Wei et al. (2019). MODIS C6.1 cloud products were evaluated by Platnick et al. (2017b). The validation of CER and LWP, the primary cloud products used in this paper, was described by Painemal and Zuidema (2011), who compared MODIS C5 with in situ data (aircraft), and likewise the MODIS C6.1 CER product was evaluated by Fu et al. (2022) by comparison with airborne measurements. Fu et al. (2022) concluded that their “validation, along with in situ validation of MODIS CER from other regions (e.g., Painemal and Zuidema, 2011; Ahn et al., 2018), provides additional confidence in the global distribution of bias-adjusted MODIS CER reported in Fu et al. (2019)”. It is noted that COT and CER are retrieved, whereas LWP is secondarily derived (e.g., Painemal and Zuidema, 2011). AOD is used as a proxy for the amount of CCN in the atmospheric column to investigate aci (Andreae, 2009), which seems to be the best alternative (Rosenfeld et al., 2014). As discussed in the Introduction, the use of an AE-based correction is not recommended over land (e.g., Kourtidis et al., 2015). Comparisons with surface-based sun photometer data show that Collection 6 improves upon Collection 5, and overall, 69.4 % of MODIS Collection 6 AODs fall within the expected uncertainty of ± (0.05+15 %) (Levy et al., 2013; Tan et al., 2017). To reduce a possible overestimation of the AOD (e.g., due to cloud contamination), cases with AOD greater than 1.5 were excluded from further analysis. The choice of this threshold is based on reports by Christensen et al. (2017) and Varnái and Marshak (2009), rather than 0.6 used by Brennan et al. (2005), who used MOD06 Collection 04 products. Christensen et al. (2017) used MOD06 C6 data (1 km×1 km) and reported that “large aerosol optical depths remain in the MODIS-observed pixels near cloud edges, due primarily to 3D effects (Varnái and Marshak, 2009) and the swelling of aerosols by higher relative humidity”. Varnái and Marshak (2009) noted that beyond 15 km contamination effects were minimized in MODIS data (1 km×1 km). Furthermore, we discarded scenes (1° × 1°) in which the aerosol distribution is heterogeneous, i.e., with a standard deviation higher than the mean value (Saponaro et al., 2017; Jia et al., 2022). As most aerosol particles are located in the lower troposphere (Michibata et al., 2014), to avoid deep convective clouds, the focus in this study is on warm clouds with CTT larger than 273 K and CTP larger than 700 hPa, while LWP larger than 200 g m−2 is excluded (Wang et al., 2014). Transparent–cloudy pixels (COT < 5) were discarded to limit uncertainties (Grosvenor et al., 2018). The solar zenith angle was restricted to SZA<65° and the viewing zenith angle to VZA < 55° to avoid the large biases in COT and CER retrievals at larger angles (Grosvenor et al., 2018). To ensure that the data used only included single-layer liquid clouds and nonprecipitating cases, the filtering criteria described by Saponaro et al. (2017) were applied.
Table 1Parameters used in the present study, together with the sources, time periods and spatial resolutions.

Confounding meteorological effects on aci were explored using the daily temperature at the 700 and 1000 hPa levels, RH at the 750 hPa level and PVV at the 750 hPa level. Low tropospheric stability (LTS), which is defined as the difference in potential temperature between the free troposphere (700 hPa) and the surface (1000 hPa), is used as a measure of the strength of the inversion that caps the planetary boundary layer (Klein and Hartmann, 1993; Wood and Bretherton, 2006). These meteorological data were retrieved from the ECMWF ERA-5 reanalysis data, which provide global meteorological conditions at 0.25°×0.25° resolution for 37 pressure levels in the vertical (1000–1 hPa), for every 1 h (UTC). The meteorological parameters were resampled to the MODIS/Aqua overpass time at 13:30 LT by taking a weighted average at the two closest times (05:00 and 06:00 UTC) provided by the ECMWF ERA-5 reanalysis data.
3.1 Sensitivity of cloud parameters to changes in aerosol concentrations
Changes in aerosol loading lead to an adjustment of cloud optical or microphysical parameters (COT, CER, etc.). Aerosol particles can become CCN or INP, depending on their chemical composition and ambient temperature. When these nuclei are activated, they become cloud droplets due to condensation of water vapor. When the concentration of aerosol particles increases, often also the number of CCN or INP may increase and thus the number of cloud droplets may increase. However, if the liquid water content in the cloud does not change (as indicated by a constant LWP), the condensable water will be distributed over more cloud droplets, which thus remain smaller; i.e., the CER decreases and the cloud albedo increases when the aerosol concentration increases. On the basis of findings of Kaufman and Fraser (1997), Feingold et al. (2001) pointed out that the sensitivity of cloud microphysical properties (e.g., CER) to changes in aerosol (e.g., AOD) can be described by the following formula:
where re represents the CER and α represents the AOD. Following Andreae (2009), AOD and CCN are correlated and AOD varies with CCN following a power law relationship. Equation (1) describes the relative change of CER with the relative change of the AOD for constant LWP. It is noted that this formulation differs from that used in recent studies (e.g., Bellouin et al., 2020), where S is expressed in Nd with no restriction in LWP. The sensitivity S of CER to AOD can be determined as the slope of a linear fit to a log–log plot of CER versus AOD. It is noted that S is a function of CER and effects on CER directly influence S. In this study effects on S and CER are used interchangeably. Relations between CER and AOD are determined through Eq. (1) and correlation coefficients R. The significance of these relations is determined by using the Student's t test; i.e., the results are statistically significant when the p value is smaller than 0.01, where p is defined as the probability of obtaining a result equal to or more extreme than what was actually observed.
3.2 Geographical detector method
The geographical detector method (GDM) is introduced to analyze which factors influence the aci and identify possible correlations between different factors. The GDM is based on the assumption that if an independent variable has an important influence on its dependent counterpart, their spatial distributions should also have evident similarities (Wang and Hu, 2012; Wang et al., 2016). The GDM not only accounts for the rank order of the variables as determined by the Spearman's rank method but also spatial information. The geographical detector provides four modules, including factor detector, interaction detector, risk detector and ecological detector. In this study, the first two modules are used to detect interactions between different parameters, based on their spatial variations, and thus reveal the driving factors for aerosol–cloud interaction over the target regions. The influencing factors (x) considered in this study are aerosol and meteorological parameters, and the dependent factors (y) are S and cloud parameters. In the GDM, for example, the CER data are recorded in a raster grid as illustrated in Fig. 2. The data in the raster grid are transformed into 2D point vector files, with each point containing a value for the CER and for one of the influencing parameters x. The dependent (CER) and influencing (x) parameters are separated into two layers with the same grid. In the x layer, the Jenks natural breaks classification method (Brewer and Pickle, 2002), aiming to minimize the variance within the group and maximize the variance between groups, was applied to categorize the whole region into i subregions (3 in Fig. 2), according to pre-defined ranges of influencing factors (e.g., AOD). In each subregion, the influencing factor (x) varies within certain limits, with variance σi. The power of determination q of x to y (also referred to as power of the influencing factor) determines the extent to which a factor (x) influences the dependent factor (y) over the whole study area and is calculated using Eq. (2):
where i () is the number of subregions of factor x, N represents the total number of spatial units over the entire study area, Ni denotes the number of samples in subregion i, and and σ2 denote the variance of the samples in the subregion i and the total variance in the entire study area, respectively. The value of q varies between 0 and 1, i.e., q[0,1], where 0 indicates that factor x has no influence on y and the closer q is to 1, the greater the influence of x. For instance, if q=0.5, x can explain 50 % of the variation of y. In this study, multi-years of mean values of influencing factors (x) and dependent factors (y) were calculated for each raster grid. Then, we classified the influencing factors (e.g., AOD and meteorological parameters) into five subregions by the Jenks natural breaks classification method (Brewer and Pickle, 2002). For example, AOD needs to be classified into five levels using the Jenks natural breaks classification method, and the AOD source data needs to be reclassified into one to five natural numbers from small to large and then counted into the grid. Therefore, the input of the independent variable AOD is a type variable. However, it should be noted that the GDM also has unstable characteristics. On the one hand, it is due to the MAUP (modified area unit problem) variable area unit problem, which can be understood as the influence of the scale effect. Due to the limitation of data resolution used in this study, the spatial statistical unit is 1°×1°. On the other hand, the methods used for data discretization can also have an impact. This study attempts to determine the optimal number of classifications by examining the impact of the number of classification levels (three to eight) on the GDM output results. The results show that the number of classification levels does not affect the relative importance of cloud factors on the cloud. Here we classify the values of each cloud factor into five levels during the period of 2008–2022.

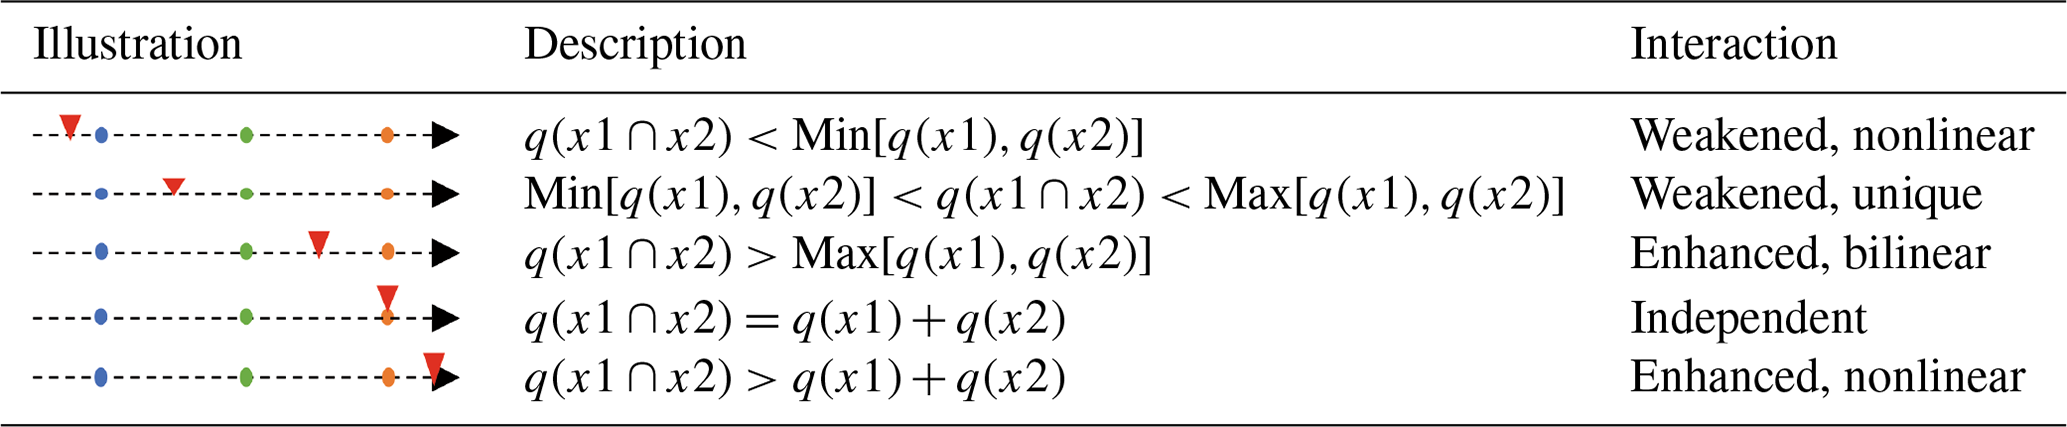
The interaction detector can be used to test for the influence of interaction between different influencing factors, e.g., x1 and x2, on the dependent factor (y) and whether this interaction weakens or enhances the influence of each of x1 or x2 on the dependent variable, y, or whether they are independent in influencing y. For example, Fig. 3a shows the spatial distribution of the dependent variable, y. The factors x1 and x2 both vary across the study region, but in different ways, and for each factor different subregions can be distinguished by application of the Jenks classification method described above to each factor separately. This is illustrated in Fig. 3b and c where, as an example, three different subregions are considered for each factor. Usually, the dependent variable y is influenced by several different factors xi (Fig. 3), and the combined effect of two or more factors may have a weaker or stronger influence on y than each of the individual factors. The q values for the influences of factors x1 and x2 on y, obtained from the application of the factor detector method (Eq. 2), may be represented as q(x1) and q(x2). Hence, a new spatial unit and subregions may be generated by overlaying the factor strata x1 and x2, written as x1∩x2, where ∩ denotes the interaction between factor strata x1 and x2 as illustrated in Fig. 3d. Thus, the q value of the interaction of x1∩x2 may be obtained, represented as q(x1∩x2). Comparing the q value of the interaction of the pair of factors and the q value of each of the two individual factors, five categories of the interaction factor relationship can be considered, which are summarized in Table 2. If , this is referred to as a nonlinear enhancement of two variables. And if , this is referred to as a bilinear enhancement of two variables. The occurrence of nonlinear enhancement and bilinear enhancement is indicated with the q values in Table 2 and in the caption of Fig. 7.

Figure 3Detection of interaction (see text for explanation).
Table 2Interaction categories of two factors and the interaction relationship.
It is noted that the q values of multiple influencing factors are considered separately and they may sum up to larger than 100 %. However, when the variables are correlated they must be considered together and the interaction q value must be evaluated.
The geographical detector method has been used to detect influencing factors for several different purposes (e.g., Wang et al., 2018; Zhang and Zhao, 2018; Zhou et al., 2018). For example, the GDM was used to detect the influence of annual and seasonal factors on the spatial–temporal characteristics of surface water quality (Wang et al., 2018). Other examples are the application of the GDM to examine factors influencing regional energy-related carbon emissions (Zhang and Zhao, 2018) and to examine effects of socioeconomic development on fine particulate matter (PM2.5) in China (Zhou et al., 2018). In the current study, the GDM was used to detect the impact of nine variables and their interactions on S and cloud parameters over land and ocean. The advantages of using the GDM in this approach are the following: (1) stratified independent variables enhance the representation of a sample unit, so it has higher statistical accuracy than other models with the same sample size; (2) the use of a q-statistic value can afford a higher level of explanatory power but does not require the existence of a linear relationship between independent and dependent variables; (3) the GDM can determine the true interaction between two variables and is not limited to pre-established multiplicative interactions (Wang et al., 2010); (4) the use of the GDM does not need to consider the collinearity of multiple independent variables (Wang et al., 2010).
4.1 Spatial distribution and correlation analysis of AOD and cloud parameters
The spatial variations of the AOD and the cloud properties (CER, COT, CF, CTP and LWP) over the study area, averaged over the years 2008–2022, are presented in Fig. 4. Figure 4a shows a large difference between the AOD over land and ocean, with the highest values over the northern part of the YRD (averaged AOD larger than 0.5) and the lowest values over the southeastern part of the ECS (<0.1); the AOD decreases gradually from land to ocean. The spatial distributions of the CER, COT, CF, CTP and LWP over the YRD and ECS in Figs. 4b–f show that for each of them there is a distinct difference between those over land and over ocean both as regards the values and the spatial variation. Over the ECS, the CER is largest in the south and decreases toward the north of this area, and the values are overall substantially larger than over the YRD, where the CER varies somewhat and decreases from north to south. The variation of the CER with AOD over the YRD is opposite to what would be expected, which will be discussed in Sect. 4.2. The COT also varies somewhat over the YRD, but in contrast to the CER, COT increases from north to south. Over the ECS, the COT is generally lower than over the YRD, with the highest values in the northwest, which gradually decrease toward the southeast. Clearly, the CER is higher and the COT is lower over the ECS than over the YRD.

Figure 4Spatial distributions of AOD (a), CER (b), COT (c), CF (d), CTP (e) and LWP (f), averaged over the years 2008–2022, over the study area, with the YRD and ECS marked by the squares.
The spatial distributions of CF, CTP and LWP are clearly different. Over the ECS, CF increases from the southeast to the northwest, opposite to the variations of the CTP and the LWP, which are lower in the north of the ECS than in the south. Over ocean the clouds are generally lower (higher CTP) than over land, and CTP varies over the study area with the highest values over land, in the north. Over the YRD, the spatial patterns of the CF and CTP are opposite, with CF increasing from south to north and CTP decreasing. Over the YRD, the spatial distributions of COT and LWP are similar, with higher values toward the south. Over the ECS, the LWP varies, with the lowest values in the northwest and the highest values in the south. The high values of the CER over the ECS could be due to the dominance of sea spray aerosol, the high hygroscopicity of which makes these particles very efficient CCN, which in this environment over ocean with high water vapor concentrations results in larger CER. The influence of different factors on the sensitivity of cloud parameters to aerosol and the adjustments are discussed in the following sections, based on both statistical methods and the application of the GDM.
4.2 Sensitivity of CER to AOD
Equation (1) shows that the value of the sensitivity S of CER to AOD is determined by the slope of a linear fit to a log–log plot of CER versus AOD. To investigate S, we used correlated data pairs for 15 years, the data were binned in AOD intervals with a bin width of 0.02 and the CER data in each AOD bin were averaged. Logarithmic plots of the averaged CER data versus AOD over the YRD and the ECS are presented in Fig. 5. Figure 5a and b show different regimes for the variation of the CER with the AOD over the YRD and the ECS. The first regime, for AOD≤0.05, shows the increase in CER with AOD over both regions, followed by a variable CER over the YRD and a gradually stronger decrease over the ECS for AOD between 0.05 and 0.1. In view of this variability and the uncertainty of AOD of ± (0.05+15 %) over land and ± (0.03+5 %) over ocean (Levy et al., 2013), S will not be investigated for AOD<0.1. For higher AOD, S changes for AOD around 0.3. Thus, the second regime is selected as the part of the CER vs. AOD relationship where AOD varies between 0.1 and 0.3. In this AOD regime, the CER fluctuates a little with AOD over the YRD (Fig. 5a) and S is close to 0 (no discernible Twomey effect). In contrast, over the ECS the CER clearly decreases with AOD for AOD increasing from 0.1 to 0.3 (Fig. 5b), in good agreement with expectation based on the Twomey effect, and the correlation between CER and AOD is high with R=0.99 and statistically significant. Note, however, that no selection was made for LWP, and the condition of constant LWP was not fulfilled. This will be further discussed in Sect. 4.3.

Figure 5Variation of CER with AOD over the YRD (a) and the ECS (b). Here all CER data were averaged in AOD bins, from 0.0 to 1.5 with a step of 0.02. Note that the data are plotted on a log–log scale. The lines for the YRD data for AOD>0.3 and for the ECS data for represent least-square fits to the binned data, and the resulting relations are presented in each figure. The marker ∗ at the top-right corner of the R value indicates that the correlation is statistically significant with p<0.01. The thin vertical lines indicate the AOD regimes as explained in the text.
In the third regime, where AOD>0.3, CER increases with increasing AOD over the YRD, with correlation coefficient R=0.79. In contrast, over the ECS the CER does not significantly change with increasing AOD for AOD>0.3 (very small S). However, the large uncertainty in the bin-averaged CER in this AOD regime, increasing with increasing AOD, indicates a very variable S between high-AOD events which on a statistical basis cannot be further analyzed and likely depends on the type of aerosol present during each event and the meteorological conditions. The reason for the increase in CER with increasing AOD (S positive) over the YRD may be similar to that described by Feingold et al. (2001), i.e., in the presence of a large number of aerosol particles (CCN) competing for a limited amount of water vapor, only a subset of aerosol particles is activated. Once activated, these particles continue to grow faster, thus preventing water vapor from condensing onto smaller aerosol particles that are less susceptible to activation. As a result, the amount of available water vapor is distributed over a subset of aerosol particles, which thus become cloud droplets with relatively large CER, and the CER in turn increases with further increasing AOD (Liu et al., 2017).
The CER sensitivity to AOD is stronger over the ECS () than over the YRD (AOD>0.3). It is anticipated that during the relatively low AOD over the ECS in AOD regime 2 () the aerosol number concentration is dominated by sea spray aerosol particles (de Leeuw et al., 2011), which are hygroscopic and thus provide good CCN, while over open ocean also the RH is generally high. Hence, the available water vapor will be readily distributed over all CCN, resulting in the decrease in the CER and a strong correlation with AOD. Further, the AOD over open ocean does not reach high values in the absence of continental influence, and even in very high wind speeds the AOD does not exceed 0.2 (Huang et al., 2010; Smirnov et al., 2012). Hence, AOD higher than 0.2 over the ECS is influenced by long-range transport of aerosol produced over land with lower hygroscopicity, and thus lower susceptibility to act as CCN, which explains the breakdown of the Twomey effect over the ECS for elevated AOD. In fact, the data in Fig. 5b show that the CER–AOD relationship starts to flatten for AOD∼0.2 and is flat for AOD larger than ∼0.3. Overall, Fig. 5 shows that the Twomey effect is clear in the second AOD regime over the ECS and the anti-Twomey effect in the third AOD regime over the YRD. For this reason, further analysis focuses on the aci over the ECS for AOD between 0.1 and 0.3, as well as over the YRD for AOD>0.3.
To study the spatial variation of S over the study area, S has been calculated in each grid cell by application of Eq. (1) to all observations over the YRD for which AOD>0.3 and to all observations over the ECS for which . The results are plotted in Fig. 6, which shows maps of S, the correlation coefficient R between CER and AOD, and the statistical P value for each grid cell over the study area. Figure 6b shows that over the ECS, for the second AOD regime (0.1–0.3), S is negative, with large negative correlation coefficients (−0.66 to −0.98) which mostly are statistically significant (p<0.01). These results show the good correlation between CER and AOD, consistent with the cloud albedo effect. In contrast, over the YRD, for the third AOD regime (>0.3), S is mostly positive and the correlation between CER and AOD is positive; i.e., high aerosol loading results in larger CER for AOD>0.3, as was also concluded from Fig. 5. The data in Fig. 6a also show that, over the YRD, S is largest over the area to the north of Shanghai but R is relatively weak (0.11 to 0.35), and for the majority of the cells the correlations are not statistically significant (p∼0.1 or larger). South of Shanghai the correlations are small and not statistically significant. The observed anti-Twomey effect of aerosols over the YRD has also been reported in earlier publications such as Jin and Shepherd (2008), Yuan et al. (2008) and Liu et al. (2017). Factors influencing the relationship between AOD and cloud parameters have been reported in the literature, such as hygroscopic effects (e.g., Qiu et al., 2017), atmospheric stability, cloud dynamics, cloud height (Shao and Liu, 2005) and land cover type (Jin and Shepherd, 2008; Ten Hoeve et al., 2011). The effects of competing mechanisms and their possible influence on the observed response of CER to high AOD in the YRD will be further discussed in the following sections.
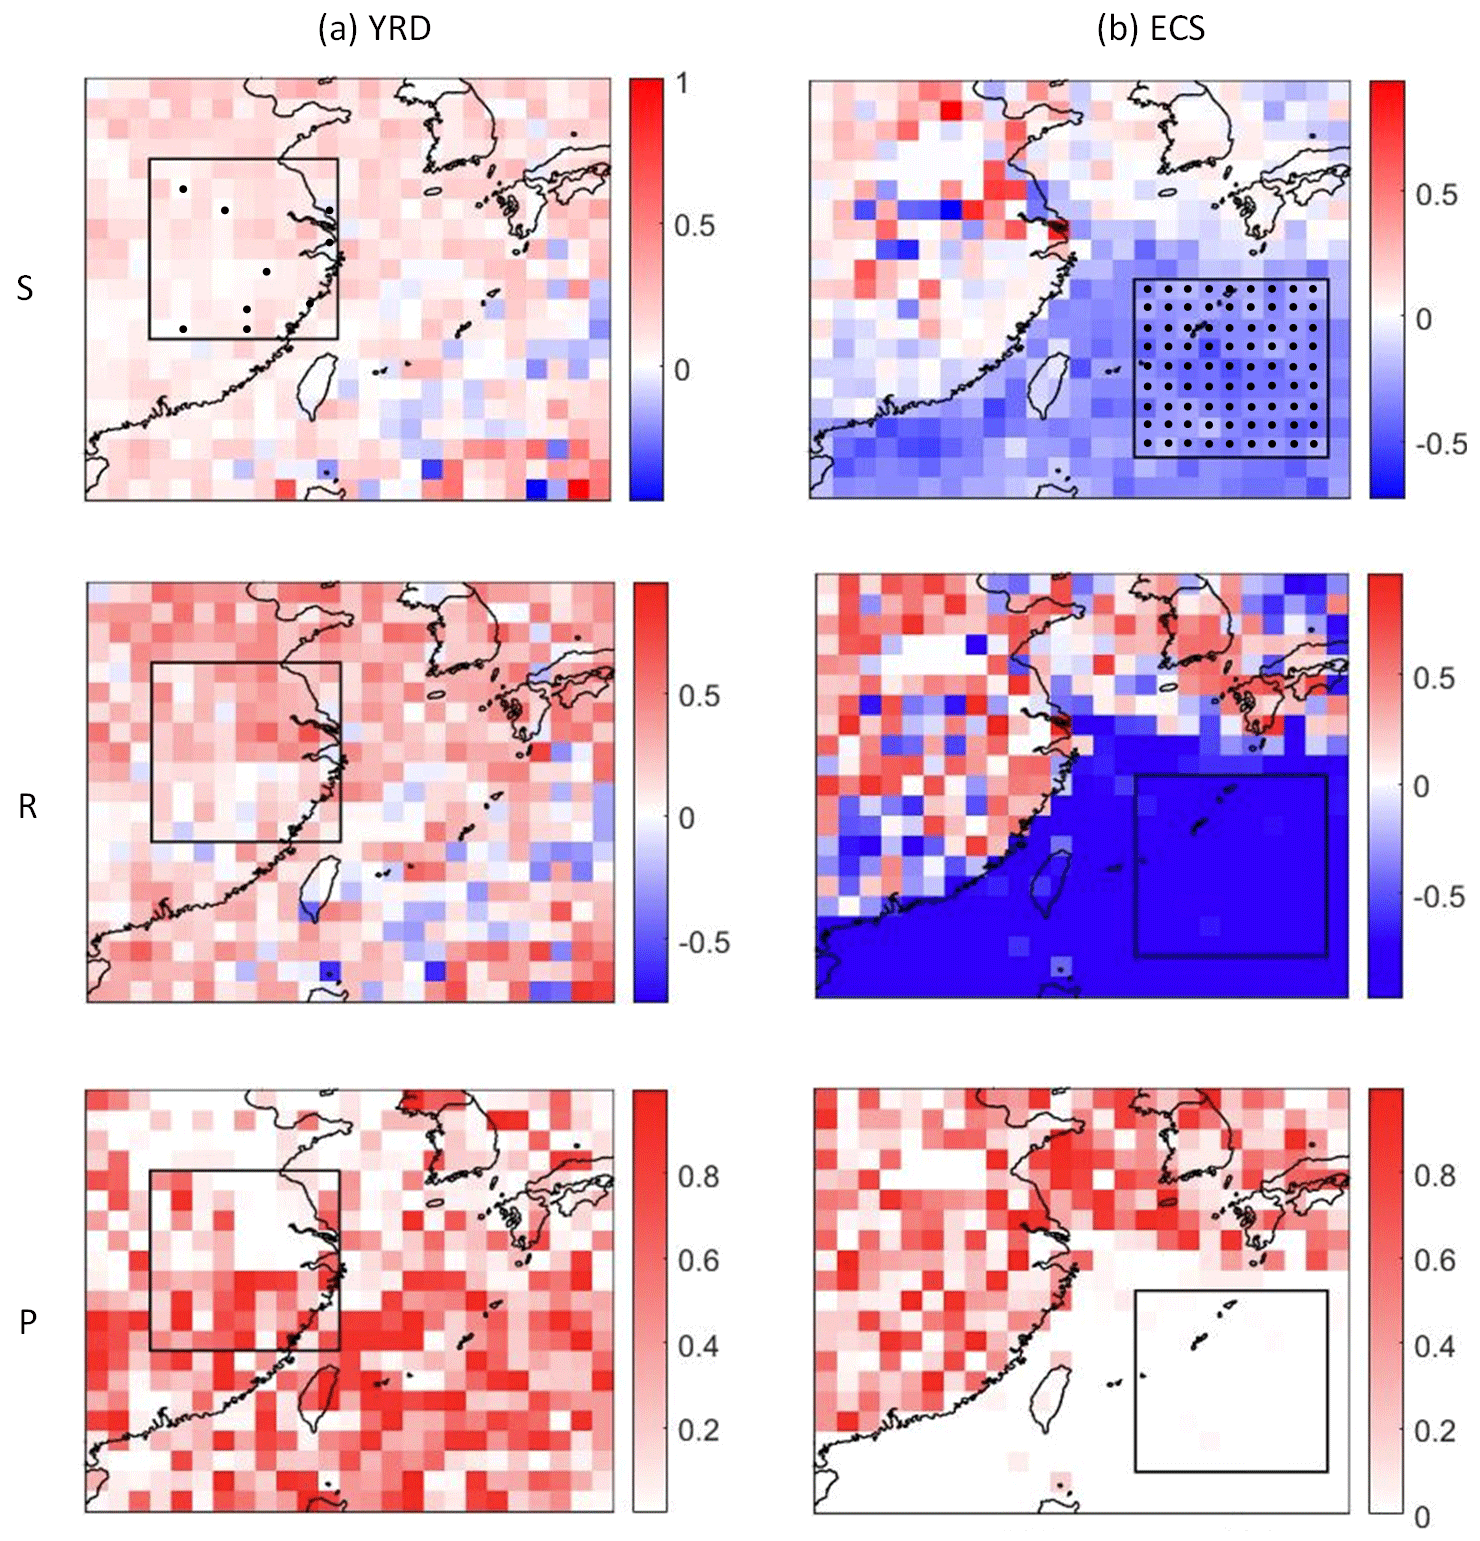
Figure 6Using the AOD as a proxy for CCN, estimates of the CER sensitivity to aerosol (S) were calculated for each grid point in both study areas. Maps of the spatial distributions of S, the correlation coefficients and the statistical P values in each grid point are presented over the YRD (a) for the AOD regime with AOD>0.3 and over the ECS (b) for the AOD regime with . S, R and P values are color coded following the color bars on the right of each figure. The black solid dots in the top figures (S) indicate that the S value is negative in the grid point over the YRD and ECS.
4.3 Sensitivity of CER to AOD stratified by LWP
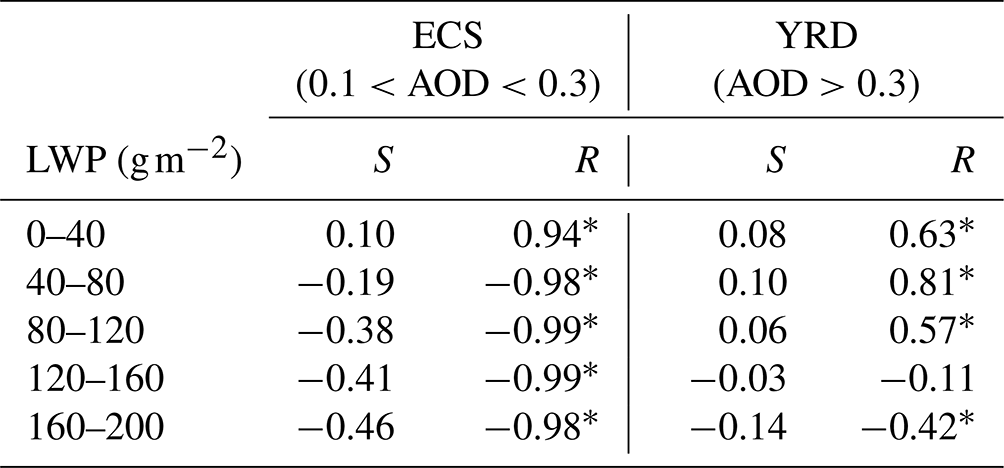
In the data presentation and discussion of S in Sect. 4.2, the condition of constant LWP for the application of Eq. (1) and the occurrence of the cloud albedo effect were not considered. In this section the effect of LWP on S will be further investigated. To this end, the condition of constant LWP is approached by stratifying LWP into five intervals, each with a width of 40 g m−2, for the LWP range of [0 g m−2, 200 g m−2]. S was calculated over the YRD and the ECS, for each LWP interval using Eq. (1) for all observations over the YRD for which AOD>0.3 and for all observations over the ECS for which . The results are presented in Table 3, together with the corresponding correlation coefficients R between CER and AOD in the relevant AOD regimes. The data in Table 3 show that over the ECS, S is negative and statistically significant for all four LWP ranges between 40 and 200 g m−2. The sensitivity becomes stronger as LWP increases, i.e., S changes from −0.19 (LWP 40–80 g m−2) to −0.46 in the highest LWP range (160–200 g m−3), with corresponding R of −0.98 to −0.99. Thus, the magnitude of the LWP has a substantial influence on the albedo effect. Over the YRD, S is positive and statistically significant in the first three LWP regimes, with values varying between 0.06 and 0.10 and a correlation R between 0.57 and 0.81. These data show that, in contrast to the ECS, over the YRD the variation of the LWP has little influence on S, and thus the magnitude of the LWP has little influence on the cloud albedo effect.
Table 3Estimates of S, computed using Eq. (1), and correlation coefficients R between CER and AOD, stratified by LWP, over the ECS for and over the YRD for AOD>0.3. Statistically significant data points are indicated with ∗ (p value < 0.01).
In summary, the data show that both over the ECS and the YRD the relationships between the CER and the AOD are significant, but for different LWP intervals ([0 g m−2, 120 g m−2] over the YRD and [40 g m−2, 200 g m−2] over the ECS) and for different AOD regimes ( over the ECS and AOD>0.3 over the YRD), and that the CER–AOD relation follows the Twomey effect over the ECS and the anti-Twomey effect over the YRD.
The variation of S with changes in LWP indicates that the condition of constant LWP is not truly satisfied: if the data would be stratified according to smaller LWP intervals (quasi-constant LWP, Ma et al., 2018), S would likely vary more smoothly with LWP. As mentioned in the Introduction, LWP is not directly retrieved but calculated form CER and COT, and thus also the calculation of S is to some extent affected by LWP. We further note the results by Ma et al. (2018); i.e., the slope of CER versus AI (comparable to S in this paper) varies little with LWP, with positive values over land and negative values over ocean, and thus behaves similar to the data in Table 3 for YRD and ECS.
In the following study on the effects of the AOD and different cloud and meteorological properties on S and adjustments, these differences will be taken into account; i.e., over the YRD only data with AOD>0.3 and LWP in the range from 0 to 120 g m−2 will be used, and over the ECS only data with AOD in the interval [0.1,0.3] and LWP in the range from 40 to 200 g m−2 will be used.
4.4 Behavior of CER and other cloud properties with the increase in AOD
Scatterplots of CER versus other cloud properties (COT, CF and CTP), with AOD as third parameter (color-coded), over the ECS and the YRD, are presented in Fig. 7. Over the ECS, the CER and CTP decrease (the cloud top height increases) with the increase in AOD, and the COT and CF increase. The increase in AOD indicates an increase in the aerosol concentration and thus potentially the number of CCN, which in turn, upon activation, results in the increase in the number of cloud droplets and thus an increase in the COT. The positive correlation between COT and AOD over the ECS suggests that the thicker clouds contain more water droplets and are formed in a more polluted atmosphere, which, as discussed in Sect. 4.2, results from the influence of long-range transport of aerosol produced over land on the aerosol burden over ocean. But at the same time, as Fig. 7a shows, CER decreases with increasing AOD, resulting in the increase in cloud albedo and thus also in the increase in COT. The increase in cloud top height with AOD indicates that both the horizontal and vertical expansion of the clouds are also enhanced. These observations are in agreement with the strong correlation between aerosol loading and cloud vertical development for convective clouds over the North Atlantic reported by Koren et al. (2005). Although there is a strong correlation between AOD, CF and CTP, this does not imply evidence of an aerosol effect (Quaas et al., 2010; Gryspeerdt et al., 2014a).
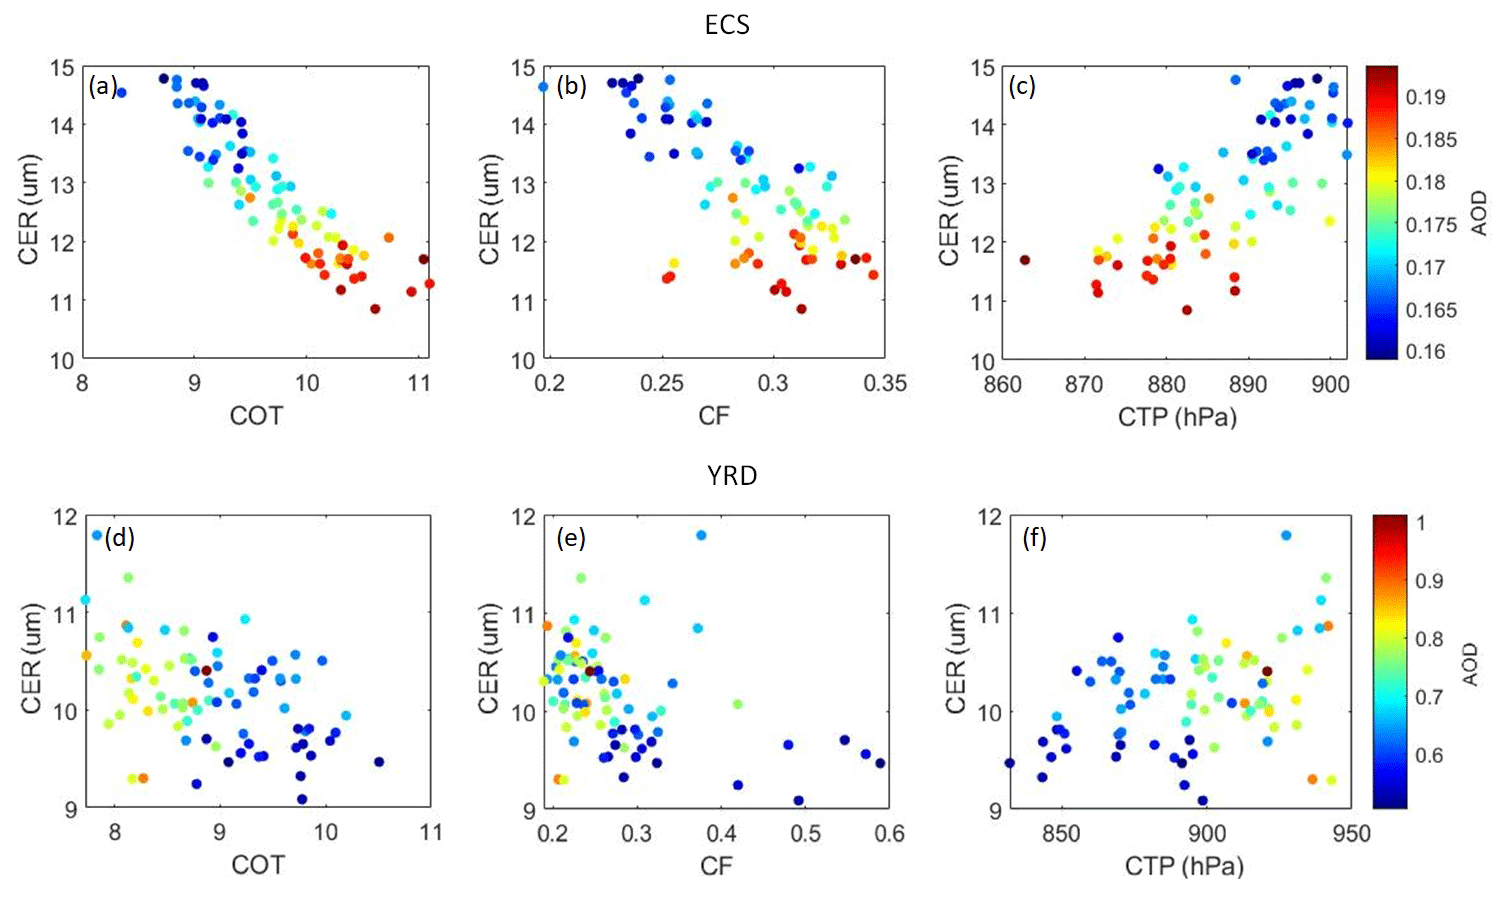
Figure 7Scatterplots of CER versus other cloud parameters (COT, CF and CTP; left to right) over the ECS (a–c) and the YRD (d–f), with AOD as third parameter, color coded following the scale on the right.
In contrast to the situation over the ECS, over the YRD the increase in AOD results in an increase in the CER and CTP (the cloud top height decreases) and a decrease in the COT. These observations are consistent with those proposed by Liu et al. (2017) in the same study region. The decrease in the CF with increasing AOD could be explained as follows. Due to the high concentration of smoke particles over the YRD (Shen et al., 2021), aerosol particles absorb solar radiation, which results in local heating of the aerosol layer and cooling of the surface (Li et al., 2017). This in turn stabilizes the temperature profile and reduces the relative humidity and surface moisture fluxes (evapotranspiration) (Koren et al., 2008) and thus also cloudiness. Reduced cloud cover exposes greater areas of the aerosol layer to direct irradiation from the Sun and therefore produces more intense heating of the aerosol layer, further reducing cloudiness (Koren et al., 2008). It is noted that this process is different from that proposed by Liu et al. (2017), i.e., that the CF increases with increasing AOD in polluted and heavily polluted conditions (AOD>0.3). In the study of Liu et al. (2017), the LWP range was not constrained; i.e., aerosol–cloud interaction was studied considering the whole LWP range. The data presented in Table 3 show that S significantly changes between the three LWP intervals between 0 and 120 g m−2 where S is positive (anti-Twomey effect), and for a larger LWP it is negative but statistically not significant. Figure 8 shows that CER and CTP substantially increase, whereas COT and CF decrease with increasing AOD in the two LWP intervals between 40–120 g m−2. However, in the other three LWP intervals the relationships between these cloud parameters and AOD are not evident. The different explanations offered here and in Liu et el. (2017) may be related to the different aerosol and cloud data sets used by Liu et al. (2017) and in the current study. On the one hand, the data sets have a different spatial resolution and cover a different time period. The data sets used in the study of Liu et al. (2017) are MYD04 Level 2 Collection 5 and MYD06 Level 2 Collection 5 in the period from 2007 to 2010. During that period the AOD over the YRD was at a maximum and decreased substantially in later years (Y. Liu et al., 2021; de Leeuw et al., 2022, 2023). On the other hand, in the study of Liu et al. (2017), the MODIS-retrieved AOD was averaged over an area with a radius of 50 km from the CALIOP target, and the MODIS-retrieved cloud data were averaged within a radius of 5 km from the CALIOP target. Hence, the AOD and cloud parameters were not representative for the same area, in particular in cases with inhomogeneous spatial distributions.
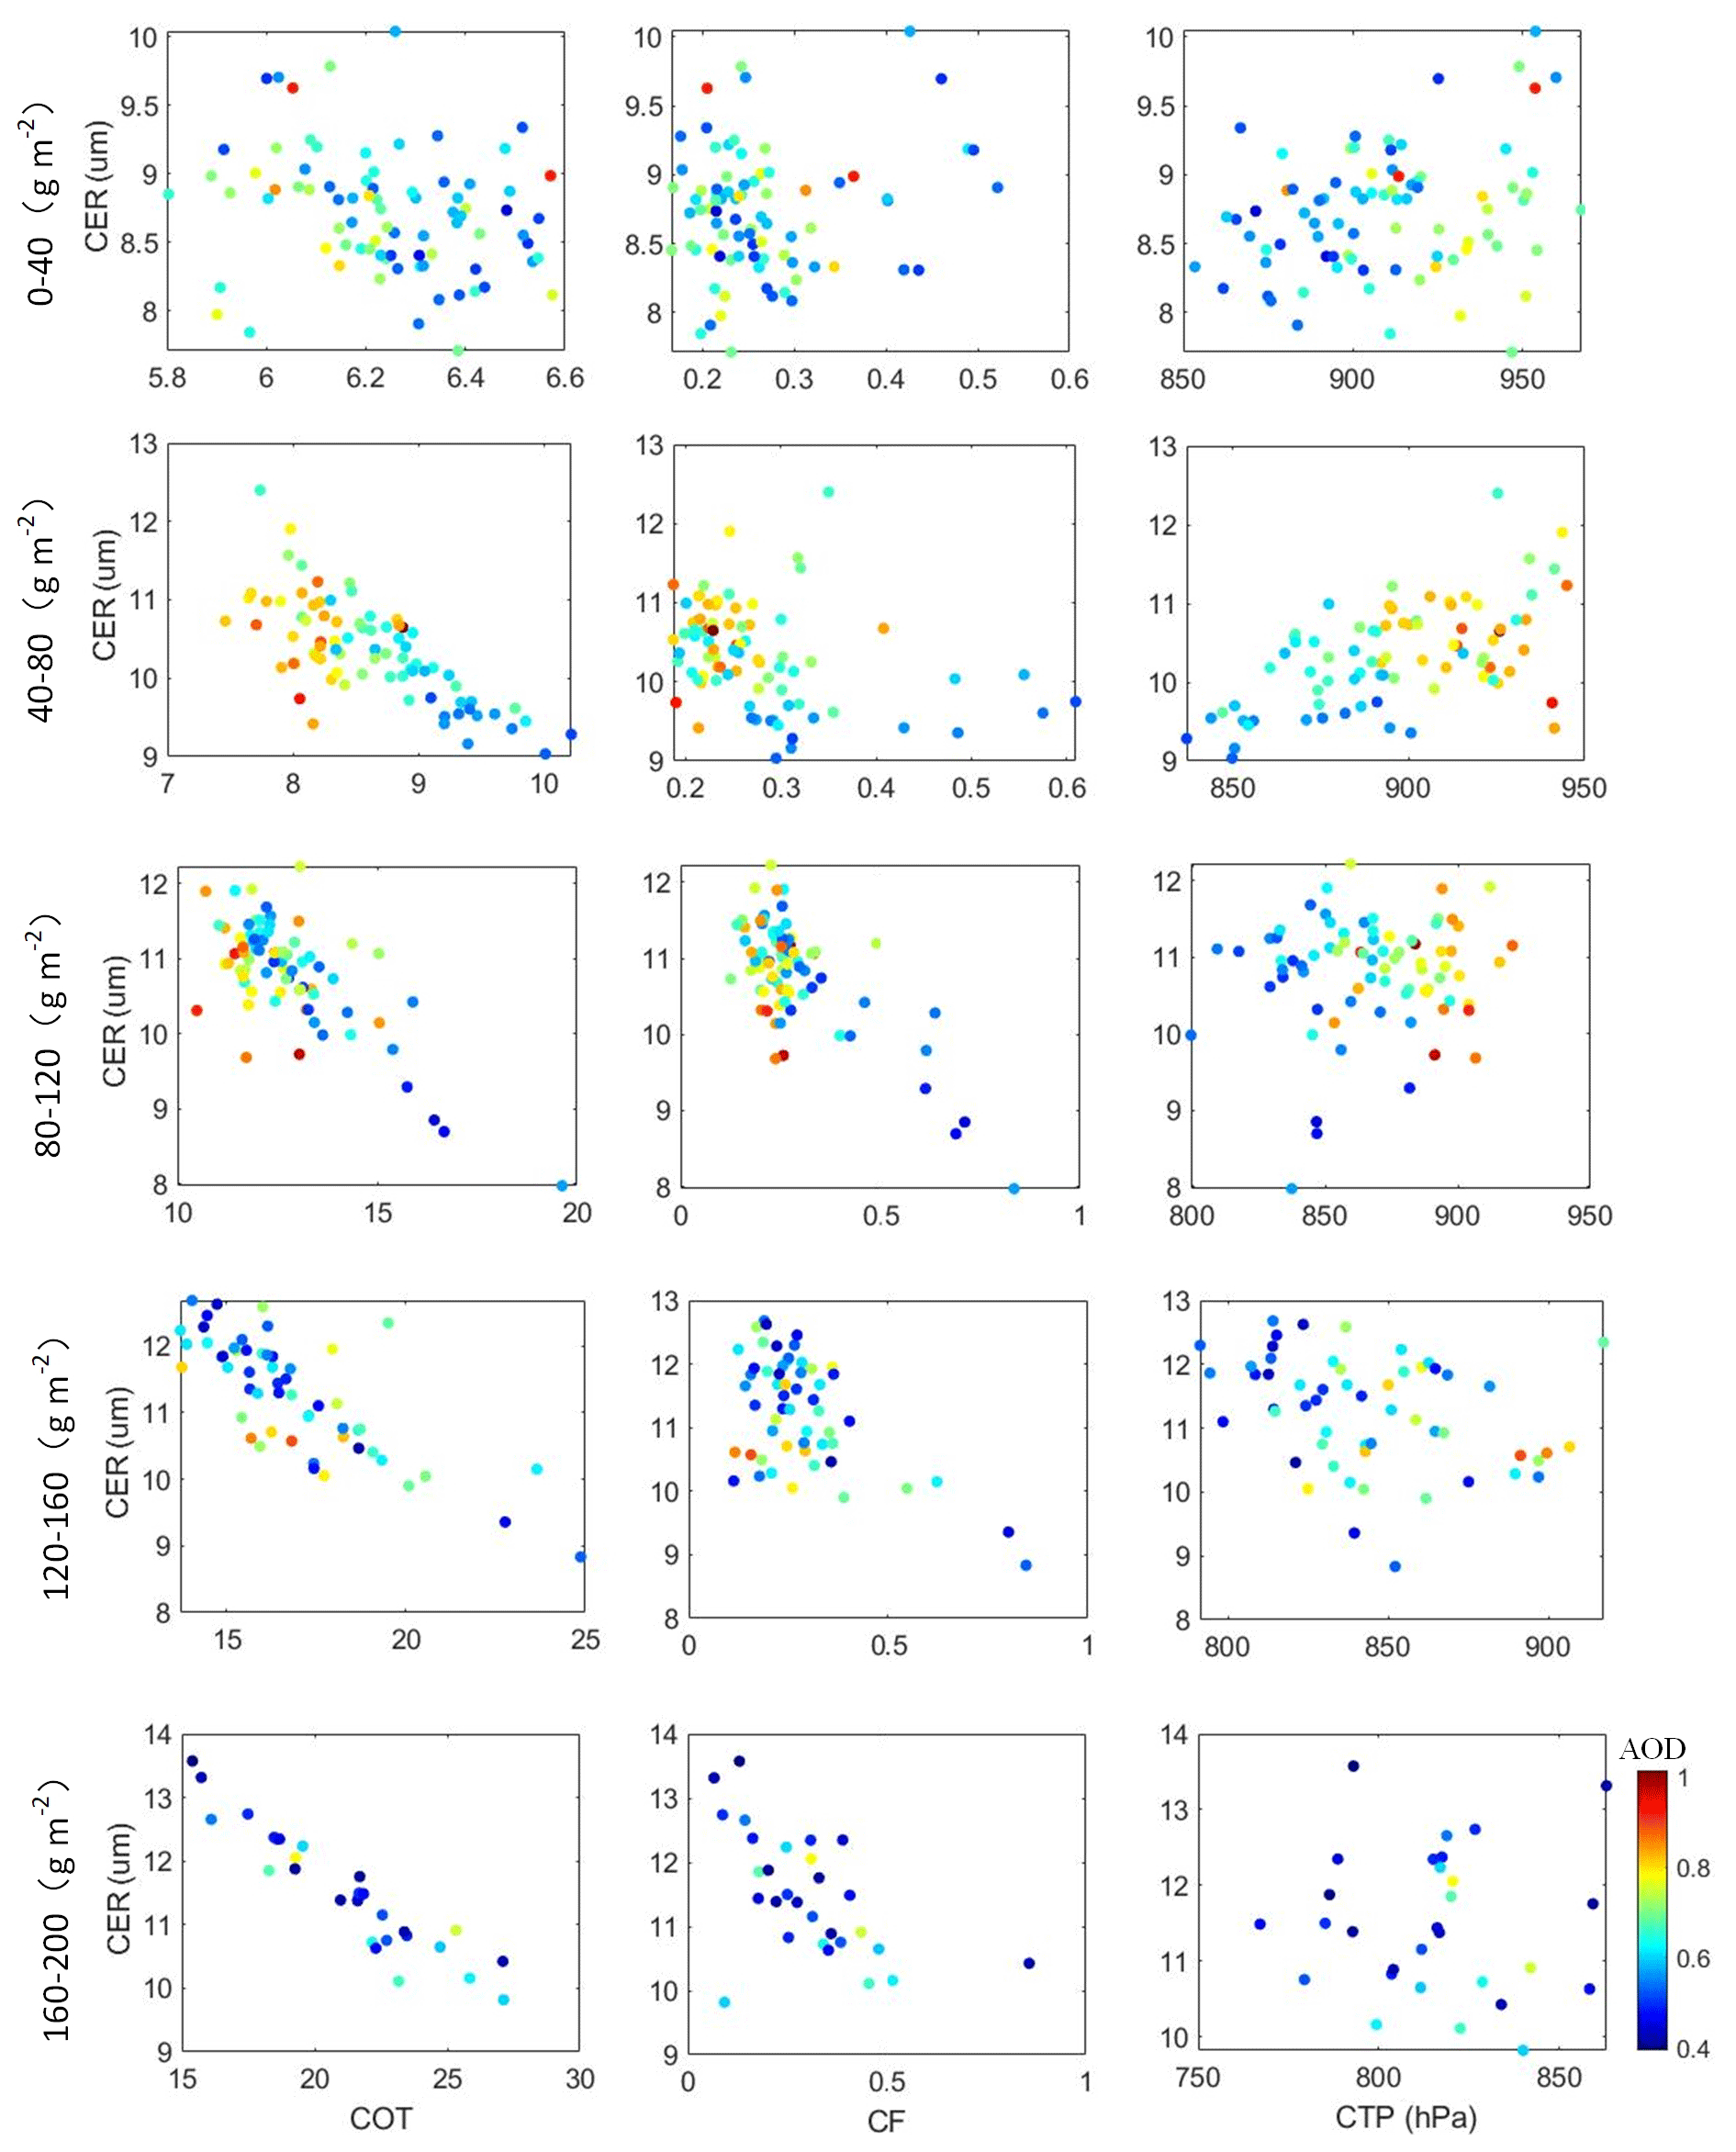
Figure 8Scatterplots of CER versus other cloud parameters (COT, CF and CTP; left to right) over the YRD, for five different LWP intervals between 0 and 200 g m−2. The AOD for each grid point is color coded following the scale on the right.
4.5 Behavior of CER and AOD in different meteorological conditions
Scatterplots of the CER versus AOD over the ECS and the YRD, with meteorological factors (LTS, RH, PVV) (color coded) as a third parameter, are presented in Fig. 9. Over the ECS (Fig. 9a), the AOD is inversely related to LTS, whereas the CER increases with increasing LTS. This observation is different from the findings of Saponaro et al. (2017), who reported that there is no significant influence of atmospheric stability (LTS) on the relationship between CER and AOD. Likewise, the AOD is inversely related to RH, whereas CER increases with increasing RH. These two observations indicate that RH and LTS have a similar effect on the relationship between AOD and CER. In contrast, with the increase in PVV, the AOD becomes larger but the CER becomes smaller. The CER vs. AOD curves show that, overall, the meteorological conditions do not change the functional relationship between AOD and CER, but quantitatively they do have an effect. The change of meteorological conditions plays an important role in the variation of CER.

Figure 9Scatterplots of CER versus meteorological parameters (LTS, RH and PVV; left to right) over the CS (a–c) and the YRD (d–f). The AOD for each grid point is color coded following the scale on the right.
Different from the situation over the ECS, over the YRD the effect of meteorological conditions on the CER is weak as shown in Fig. 9d–f. RH and PVV have an inverse effect on the relationship between AOD and CER. There is no significant influence of atmospheric stability (LTS) on the relationship between CER and AOD as suggested by Saponaro et al. (2017). Overall, aerosol concentration plays a more important role in the effects of different factors on CER over the YRD.
4.6 Application of the geographical detector method
4.6.1 Factor detector analysis
The GDM factor detector module was used to analyze the influence of nine factors (AOD, cloud and meteorological parameters) on S over the YRD and the ECS, for the conditions summarized at the end of Sect. 4.3. These factors are summarized in Table 4, together with q, i.e., the explanatory power of that factor to S (Eq. 2), over the ECS and the YRD. The data in Table 4 show that the influences of the nine proxy variables on S are rather weak and not statistically significant. They can explain only 1 %–15 % of the variation of S in both target regions.
Table 4q values for factors which may influence S over the ECS and the YRD, evaluated for data collected in the period from 2008–2022.
The GDM factor detector module was also used to analyze the influence of the AOD and meteorological parameters (RH, LTS and PVV) on adjustments of cloud properties. The results in Table 5 show that AOD and PVV influence all cloud parameters over the ECS except CTP, with q values which are statistically significant at the 1 % level. The q values for AOD show that this factor can explain 46 % (for CF) to 81 % (for CER) of the variation in the cloud parameters considered in this study, and PVV can explain 47 % (for CF) to 70 % (for CER) of the variation in the cloud parameters. For LTS and RH, the q values for CER are statistically significant but with smaller explanatory power than for AOD and PVV. In contrast, the q value of LTS for LWP is statistically significant and not much smaller than for PVV.
Table 5q values for factors which may influence cloud parameters over the ECS, evaluated for data collected in the period from 2008–2022.
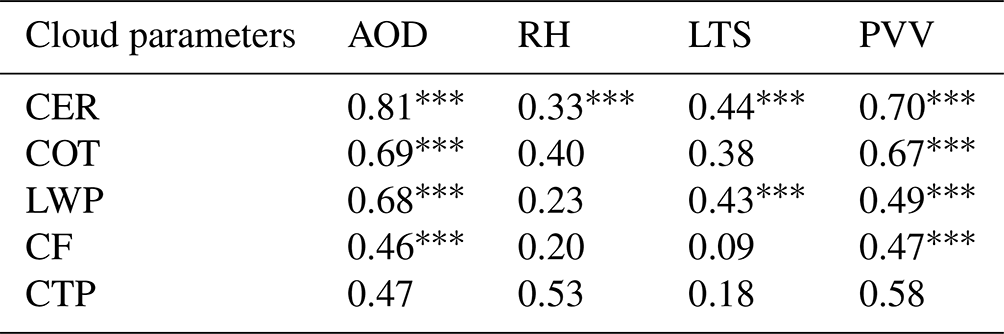
Note: indicates that the q value is significant at the 0.01 level (p<0.01).
The results from a similar analysis of the data over the YRD (Table 6) show that AOD has a statistically significant influence at the 1 % level on COT and CF, but with much smaller explanatory power than over the ECS. AOD can explain 31 % of the variation of CER, but the statistical significance is small (p<0.1). Among the meteorological parameters, RH has a statistically significant influence on CTP and can explain 74 % of the variation of the CTP, and LTS can explain 55 % of the variation of the LWP and 50 % of the variation of the CF with p<0.01. The explanatory power for the effects of RH (32 %) and PVV (18 %) on LWP has low statistical significance (p<0.1).
Table 6q values for factors which may influence cloud parameters over the YRD, evaluated for data collected in the period from 2008–2022.
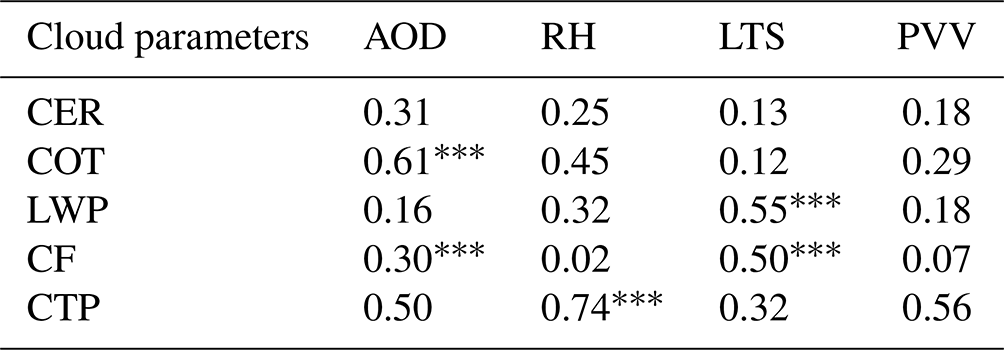
Note: indicates that the q value is significant at the 0.01 level (p<0.01).
Tables 5 and 6 list q values for individual factors, together with p showing the absence of statistical significance in many cases, especially over the YRD, and often the explanatory power is not high when the significance is low. These data show that cloud parameters are dominated by aerosol effects over the ECS, but meteorological influences on cloud parameters predominate over the YRD, and these conclusions are consistent with the results published by Andersen and Cermak (2015). Among the meteorological parameters, we also find that PVV (with the highest q in the three meteorological parameters) predominantly influences cloud parameters over the ECS. Jones et al. (2009) and Jia et al. (2022) reported that stronger aerosol cloud interactions typically occur under higher updraft velocity conditions. In addition, we find that CTP is mainly affected by RH () and PVV (q=0.56) over the YRD, as suggested by Koren et al. (2010). Koren et al. reported that observed cloud top height correlates best with model pressure updraft velocity and relative humidity. To some extent, LTS influences CER () and LWP () over the ECS, while, in contrast, over the YRD LTS predominantly influences CF () and LWP (). Matsui et al. (2004) and Tan et al. (2017) reported that aerosol impact on CER is stronger in more dynamic environments that feature a lower LTS and argue that very high LTS environments dynamically suppress cloud droplet growth and reduce aci intensity. While strong correlations between AOD and cloud parameters have been previously observed, they are likely due to the swelling of aerosol particles in humid air masses (Quaas et al., 2010) rather than an aerosol influence, which is in agreement with findings by, e.g., Myhre et al. (2007), Twohy et al. (2009) and Quaas et al. (2010).
4.6.2 Interaction detector analysis
The q values of the combined effect of two parameters (AOD, RH, LTS, PVV) influencing the cloud parameters over the YRD and the ECS, derived using the GDM as described in Sect. 3.2, are presented in the matrix in Fig. 10. The data in Fig. 10 show that the q values for the interaction of a pair of factors are larger than the q values for any of the individual parameters (Table 5). Over the ECS, the combined effects all exhibit a bilinear enhancement over the time period of this analysis. The q values for the combined effects on CER over the ECS show that the explanatory power of AOD together with each of the three meteorological parameters, RH, LTS and PVV, is high, with 86 %, 84 % and 92 %, respectively. Also for the combination of LTS and PVV the explanatory power is high (90 %). Further inspection of the data in Fig. 10 shows that the explanatory powers of the combined effects are high for several combinations of parameters, such as the combination of AOD with RH, LTS or PVV, which all have high explanatory power for COT. The data in Fig. 10 show that the combination of AOD and PVV results in high explanatory power for their influence on four cloud parameters (CER, COT, LWP and CF), and the combination of LTS with RH has high explanatory power for their effects on CTP. Among the meteorological parameters, we find that the combined effect of AOD and PVV predominantly influences cloud parameters over the ECS. The result is in accord with the findings of Jones et al. (2009) and Jia et al. (2022) that stronger aerosol cloud interactions typically occur under higher updraft velocity conditions.
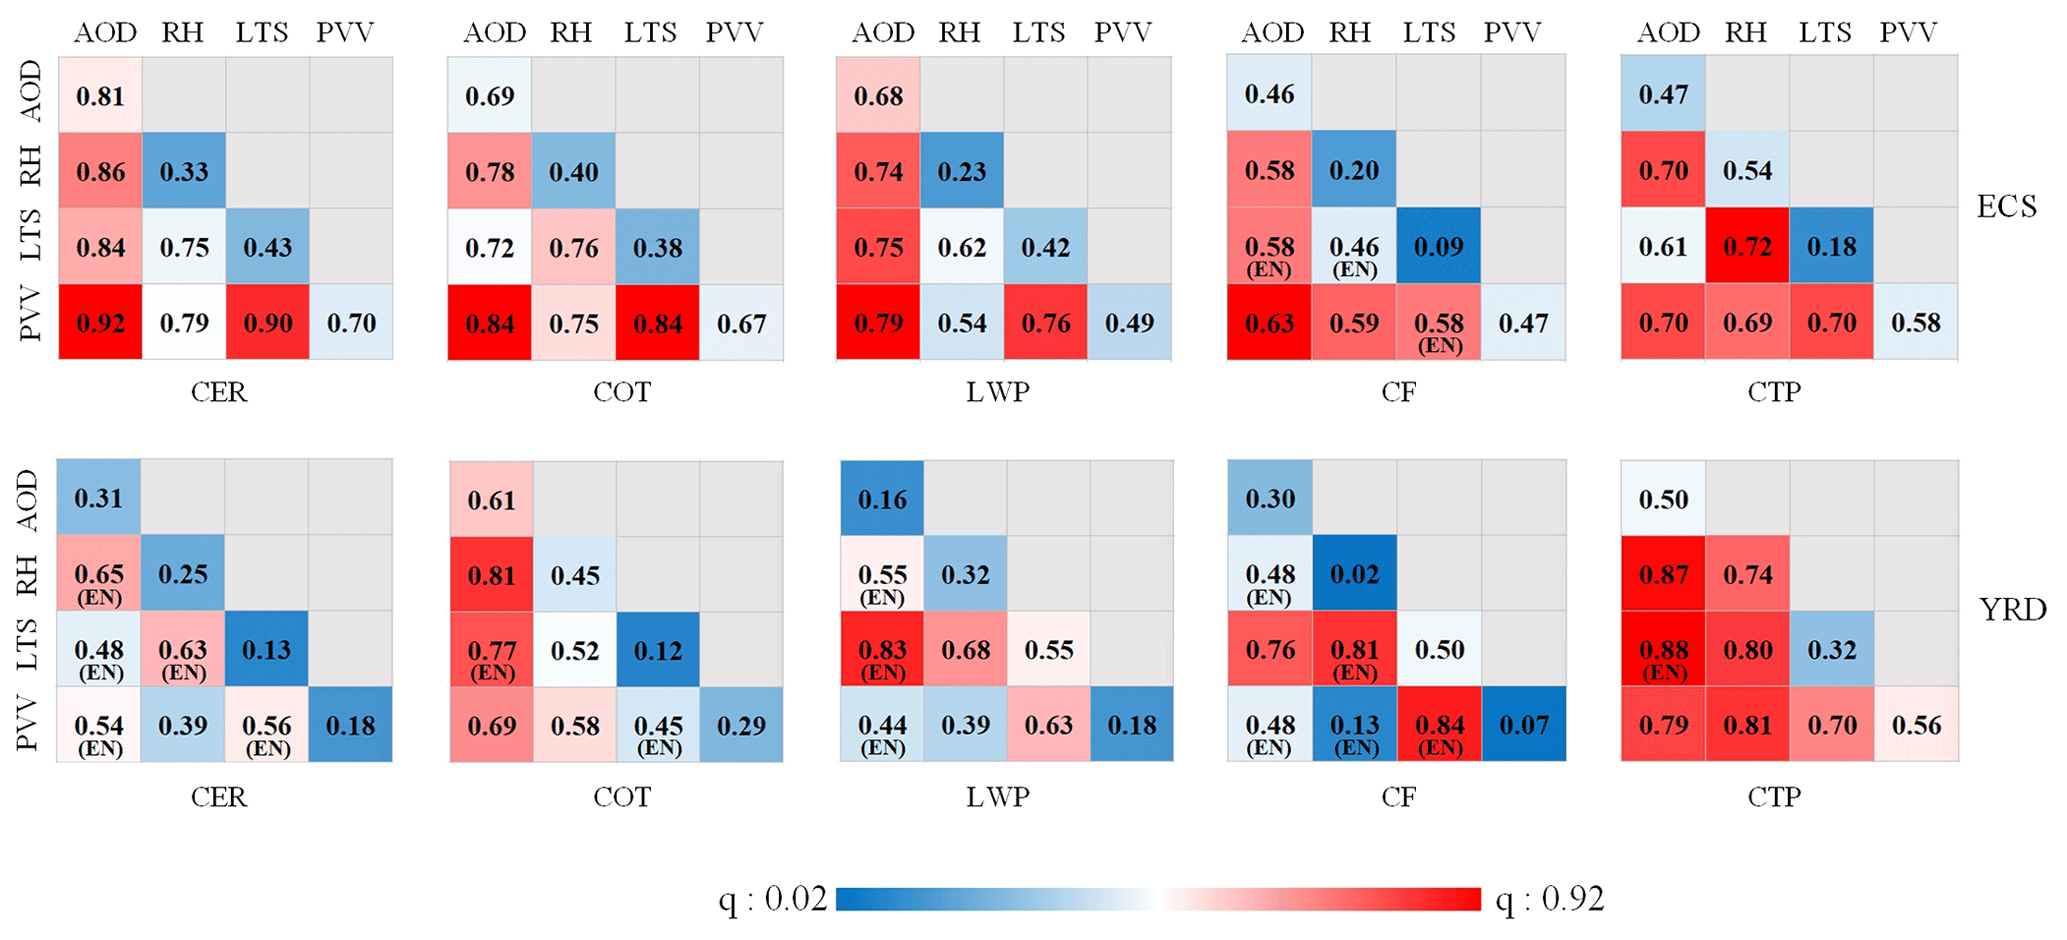
Figure 10q values derived using the GDM for the combined effects of AOD, RH, LTS and PVV on cloud parameters over the ECS (top) and the YRD (bottom). In addition to the numbers, the q values are color coded according to the color scale (linear from 0.04 to 0.92) at the bottom, for easy identification. (EN) below a q value indicates the nonlinear enhancement of two variables (if ), and the absence of a label below a q value indicates a bilinear enhancing of two variables (if ).
Over the YRD, half of the q values for the combined effects on cloud properties exhibit nonlinear enhancement over the time period of this analysis, indicating that the combined effects on cloud properties are much larger than that over the ECS. The data in Fig. 10 show that the combination of AOD and RH results in high explanatory power for their influence on CER and COT, and the combination of AOD with LTS has high explanatory power for their effects on LWP and CTP. The combined effects of PVV and LTS on the CF result in the highest explanatory power of 0.84. The data in Fig. 10 also show that cloud parameters are more sensitive to the combination of AOD and a meteorological parameter than to AOD alone (Table 6). Furthermore, the data do show that meteorological factors enhance the explanatory power of the AOD on cloud parameters over both regions. For example, the individual q values for the influence of AOD and PVV over the ECS were 0.81 and 0.70, but for the combined influence the q statistic is as high as 0.92. The results from the GDM interaction detector analysis clearly show the enhancement of the interaction q values over the q values for the individual factors. In other words, the explanatory power of the combined effects of aerosol and a meteorological parameter is larger than that of each parameter alone. Thus, the GDM provides an alternative way to obtain information on confounding effects of different parameters. We can conclude that aerosol and meteorological conditions do make a significant contribution to cloud parameters, that confounding effects of different factors are often more important than each parameter alone, and that the relative importance of each parameter differs significantly over the ECS and YRD.
Warm cloud properties over eastern China have been investigated in relation to aerosol and meteorological conditions using 15 years (2008–2022) of data from passive (MODIS/Aqua) satellite measurements, together with the ECMWF ERA-5 reanalysis meteorological data. The Yangtze River Delta, a heavily polluted region in eastern China, and the East China Sea, with a relatively clean atmosphere, were selected as study areas. Relationships between cloud droplet effective radius and AOD (used as a proxy for CCN), i.e., the sensitivity S of CER to changes in AOD, were constructed for different constraints of AOD and LWP. The effects of AOD on CER were investigated for three AOD regimes. In view of the uncertainty of MODIS-retrieved AOD and the scatter in the CER–AOD relations, data for 1 were not considered. In the moderately polluted AOD regime (), the CER over the YRD did not change significantly with AOD, whereas over the ECS the CER strongly decreased with AOD and the derived relationship between CER and AOD is statistically significant. In the third AOD regime, with AOD>0.3, the CER increased with increasing AOD over the YRD. In contrast, over the ECS there was no clear relation between CER and AOD, although CER variability increased with AOD>0.3, especially for higher AOD (). Based on these results, two different AOD regimes were selected for further investigation of aci: over the ECS and AOD>0.3 over the YRD. The spatial distribution of S, here defined as the relative change in CER as a function of the relative change in AOD (Eq. 1), averaged over the 15 years study period, shows that it was negative and statistically significant over the ECS and positive over the YRD. These results were obtained using data with no restriction on LWP. Stratification by LWP shows that over the YRD, for AOD>0.3, S is positive for LWP in the interval [0–120 g m−2], with very small differences between three LWP intervals (0–40, 40–80 and 80–120 g m−2). In contrast, over the ECS, for AOD in the range from 0.1 to 0.3, S is negative in the LWP interval [40–200 g m−2], and the value of S is substantially different between the four LWP intervals, with S increasing with LWP, as shown in Table 3.
These results were obtained using data from a period of 15 years. During this period, the aerosol properties changed in response to the expanding economy, resulting in the increase in the AOD until 2007, and the implementation of the emission reduction policy, resulting in the decrease in the AOD from 2014, which flattened from about 2018 (de Leeuw et al., 2021, 2022, 2023). To account for these changes, the sensitivity S was determined for the periods 2008–2014 and 2015–2022, without stratification for LWP (see Figs. S1 and S2 in the Supplement). The results for the ECS show no significant difference between the CER–AOD relations during these two periods. Over the YRD, however, the data for 2008–2014 show a clear decrease in CER with increasing AOD for , and for larger AOD the CER increased, with a statistically significant correlation (R=0.87) and S=0.10 as compared to S=0.08 for the whole period. In contrast, the data for 2015–2022 show no clear correlation between CER and AOD for both AOD intervals over the YRD. A similar exercise for shorter periods, i.e., for each year between 2008 and 2022, shows similar behavior as for the whole period 2008–2022, over both study areas, with interannual variations of the value of S. However, the statistical significance is low (large p) due to the small number of data samples in each year.
It is noticed that in recent papers (e.g., Gryspeerdt et al., 2023; Arola et al., 2022) the usefulness of correlating aerosol and cloud parameters has been seriously challenged because cloud variability and retrieval errors are such that correlations between AOD and cloud properties (Nd, CER, LWP) can be spurious. Gryspeerdt et al. (2023) discussed aci in terms of the susceptibility β of Nd to aerosol rather than the sensitivity S of CER to aerosol (see the discussion in the Introduction on the use of Nd vs. CER), and the problem arises with low-aerosol conditions due to larger aerosol retrieval uncertainty due to surface correction (larger surface effect on the radiance at the top of the atmosphere), which applies equally to β and S. In the current study we did not consider the lowest aerosol conditions by limiting the data to situations with AOD≥0.1, as discussed in Sect. 4.2. Furthermore, we stratified the analysis for moderate () and high (0.3≥AOD) aerosol regimes, based on the data.
Arola et al. (2022) addressed the susceptibility of Nd to changes in aerosol and the adjustment of LWP (using satellite observations), as well as confounding factors, in particular co-variability of Nd and LWP induced by meteorological effects. They show how errors in the retrieved CER and COT or spatial heterogeneity in cloud fields influence the Nd–LWP relation. However, both Nd and LWP are not retrieved but derived from CER and COT. Using Eqs. (1) and (2) in Arola et al. (2022), the Nd–LWP relationship can be shown to have a highly non-linear dependence on CER, and thus it is no surprise that any error in CER strongly affects the relation between Nd and LWP. Their experiments, i.e., using smaller scales (5°×5°) to reduce spatial meteorological variability or using snapshots to remove meteorological variability in time, did not lead to a conclusion on whether the Nd–LWP variability is due to spatial heterogeneity in the cloud fields or due to retrieval errors. The main message from this part of the study (using satellite data) by Arola et al. (2022) is “the spatial variability of CER introduces a bias which moreover becomes stronger in conditions where the CER values are lower on average”. Experiments with simulated measurements show that “the main cause of the negative LWP vs. Nd slopes is the error in CER”. Arola et al. emphasize that the spatial cloud variability and retrieval errors in CER and COT are similar sources for negative bias in LWP adjustment and that these sources could not be separately assessed in their simulations. The implication of the findings of Arola et al. (2022) on the adjustment of LWP for the results of the current study on the sensitivity of CER to aerosol (or CCN, using AOD as proxy) is that the assumption of constant LWP may be violated. This would affect the results presented in Sect. 4.3, where LWP was stratified and S was found to vary with LWP. In view of the LWP adjustment to changes in aerosol, the variation of CER sensitivity with LWP may be somewhat different from that reported in Sect. 4.3.
The above results were obtained by using traditional statistical methods where relationships were derived from scatterplots of CER versus AOD, stratified in two different AOD regimes and five different LWP regimes, as discussed above. The data were also analyzed by using the GDM to determine which factors influence aci and identify how interactions between different parameters influence the results of the aci analysis, i.e., the sensitivity and resulting adjustments. In particular, the GDM provides information on the extent to which the effect of individual factors is influenced by other factors. As shown in Sect. 4.6.1, the effect of individual factors may be overestimated when confounding effects of other factors are not accounted for. The interaction detector analysis (Sect. 4.6.2) shows a more realistic estimate of the effects on aci when different factors are analyzed together. The factor detector analysis (Sect. 4.6.1) shows that over the ECS, cloud parameters are most sensitive to AOD, as indicated by the large and statistically significant q values. Among the meteorological factors, PVV has more influence on the variations of the cloud parameters than RH and LTS. Over the YRD, AOD has the largest influence on COT, with large and significant q values. Among the meteorological factors, the effect of LTS on CF is greater than that of RH and PVV. However, the q values may sum up to over 100 % when the variables are not independent, i.e., the explanatory power of such variables is too high. The evaluation of the effects of interaction between different factors on aci corrects these clearly unrealistic situations. The analysis in Sect. 4.6.2 shows that the interactive q-statistic values derived in this study are larger than any of the values for single variables; i.e., the explanatory power of a combination of factors is higher than that of individual factors but less than 100 %. However, although the GDM provides evidence of the effects of aerosol and meteorological factors and their interactions on cloud properties and quantifies the relative contributions to aci, it cannot quantify the absolute contributions with confidence. Moreover, it should be noted that although the results show correlations, they do not provide evidence that the aerosol variation indeed causes some change in cloud properties. As regards large regions: Grandey and Stier (2010) recommend 4°×4° as the largest size and “if data exist at higher gridded resolution the possibility of analyzing data at this higher resolution should be seriously considered”. In this study the resolution of MYD08 data used is 1°×1°, and the GDM does not detect significant relationships for regions smaller than 9°×9° due to insufficient samples. In the future, higher-resolution data can be used for GDM by controlling the size of the study area to be less than 4°×4°.
The response of different cloud parameters to variations in AOD and in meteorological conditions has been analyzed using traditional statistical methods to determine the sensitivity S of CER to aerosol for different aerosol regimes and stratified according to LWP. The results show the contrasting behavior over a polluted region over land (YRD) and a relatively clean region over ocean (ECS). In the intermediate aerosol regime (), CER does not significantly change with AOD over the YRD (S≈0), but over the ECS S is negative and increases with increasing LWP. In the high-aerosol regime (AOD>0.3), S is positive over the YRD but varies little with LWP, whereas over the ECS the CER does not change with AOD. These results may be influenced by confounding effects of meteorological parameters. The study further shows that over the ECS, the CER is larger for higher LTS and RH but lower for higher PVV. Over the YRD, there is no significant influence of LTS on the relationship between CER and AOD.
The GDM has been applied to determine which factors influence S and cloud parameters, and the interaction detector analysis has been used to determine the combined effect of different parameters on cloud parameters. The results from the GDM interaction detector analysis clearly show the enhancement of the interaction q values over the q values for the individual factors. In other words, the explanatory power of the combined effects of aerosol and a meteorological parameter is larger than that of each parameter alone. Thus, the GDM provides an alternative way to obtain information on confounding effects of different parameters. We conclude that aerosol and meteorological conditions significantly influence cloud parameters and that combined effects of different factors are often more important than the effect of each individual factor. The relative importance of each factor differs significantly over the ECS and YRD.
The results of this study contribute to improve the understanding of the indirect effects of aerosols and the role of various driving factors on the cloud microphysical properties. By comparison with aerosol and cloud observations, the regional climate model's ability to simulate changes in cloud parameters can be evaluated. A more accurate description of the relative contribution of meteorological factors can improve the parameterization scheme of the model over eastern China.
All data used in this study are publicly available. The satellite data from the MODIS instrument used in this study are available at https://doi.org/10.5067/MODIS/MYD08_D3.061 (Platnick et al., 2017a). The the ECMWF ERA-5 reanalysis data were collected from the ECMWF ERA-5 reanalysis data server https://doi.org/10.24381/cds.6860a573 (Hersbach et al., 2023).
The supplement related to this article is available online at: https://doi.org/10.5194/acp-24-4651-2024-supplement.
YL and GdL designed the research. YL led the analyses. YL and TL wrote the manuscript with major input from JZ and GdL and further input from all other authors. All authors contributed to interpreting the results and to the finalization and revision of the manuscript.
The contact author has declared that none of the authors has any competing interests.
Publisher's note: Copernicus Publications remains neutral with regard to jurisdictional claims made in the text, published maps, institutional affiliations, or any other geographical representation in this paper. While Copernicus Publications makes every effort to include appropriate place names, the final responsibility lies with the authors.
This work was supported by the National Natural Science Foundation of China (grant no. 42001290), the Natural Science Foundation of China (grant no. 41871253) and the National Key R&D Program of China (project no. 2022YFC3800701). We are grateful for the easy access to MODIS data products provided by NASA. We also thank ECMWF for providing daily ERA-5 reanalysis data. The study contributes to the ESA/MOST cooperation project “Dragon 5”, topic “3 Atmosphere”, subtopic “3.2 Air quality”.
This research has been supported by the National Natural Science Foundation of China (grant nos. 42001290 and 41871253).
This paper was edited by Stelios Kazadzis and reviewed by three anonymous referees.
Ahn, E., Huang, Y., Siems, S. T., and Manton, M. J.: A comparison of cloud microphysical properties derived from MODIS and CALIPSO with in situ measurements over the wintertime Southern Ocean, J. Geophys. Res.-Atmos., 123, 11120–11140, https://doi.org/10.1029/2018JD028535, 2018.
Albrecht, B. A.: Aerosols, cloud microphysics, and fractional cloudiness, Science, 245, 1227–1230, 1989.
Andersen, H. and Cermak, J.: How thermodynamic environments control stratocumulus microphysics and interactions with aerosols, Environ. Res. Lett., 10, 024004, https://doi.org/10.1088/1748-9326/10/2/024004, 2015.
Andreae, M. O.: Correlation between cloud condensation nuclei concentration and aerosol optical thickness in remote and polluted regions, Atmos. Chem. Phys., 9, 543–556, https://doi.org/10.5194/acp-9-543-2009, 2009.
Arola, A., Lipponen, A., Kolmonen, P., Virtanen, T. H., Bellouin, N., Grosvenor, D. P., Gryspeerdt, E., Quaas, J., and Kokkola, H.: Aerosol effects on clouds are concealed by natural cloud heterogeneity and satellite retrieval errors, Nat. Commun., 13, 7357, https://doi.org/10.1038/s41467-022-34948-5, 2022.
Bellouin, N., Quaas, J., Gryspeerdt, E., Kinne, S., Stier, P., Watson-Parris, D., Boucher, O., Carslaw, K. S., Christensen, M., Daniau, A-L., Dufresne, J.-L., Feingold, G., Fiedler, S., Foster, P., Gettelman, A., Haywood, J. M., Lohmann, U., Malavelle, F., Mauritsen, T., McCoy, D. T., Schulz, M., Schwartz, S. E., Sourdeval, O., Storelvmo, T., Toll, V., Winker, D., and Stevens, B: Bounding global aerosol radiative forcing of climate change, Rev. Geophys., 58, e2019RG000660, https://doi.org/10.1029/2019RG000660, 2020.
Boucher, O. and Quaas, J.: Water vapour affects both rain and aerosol optical depth, Nat. Geosci., 6, 4–5, https://doi.org/10.1038/ngeo1692, 2012.
Brennan, J. I., Kaufman, Y. J., Koren, I., and Li, R. R.: Aerosol-Cloud Interactions-Misclassification of MODIS Clouds in Heavy Aerosol, IEEE T. Geoscience Remote, 43, 911–915, 2005.
Brewer, C. A. and Pickle, L.: Evaluation of methods for classifying epidemiological data on choropleth maps in series, Ann. Assoc. Am. Geogr., 92, 662–681, 2002.
Che, H. Z., Yang, L. K., Liu, C., Xia, X. A., Wang, Y. Q., Wang, H., Wang, H., Lu, X. F., and Zhang, X. Y.: Long-term validation of MODIS C6 and C6.1 Dark Target aerosol products over China using CARSNET and AERONET, Chemosphere, 236, 124268, https://doi.org/10.1016/j.chemosphere.2019.06.238, 2019.
Chen, Y.-C., Christensen, M. W., Stephens, G. L., and Seinfeld, J. H.: Satellite-based estimate of global aerosol-cloud radiative forcing by marine warm clouds, Nat. Geosci., 7, 643–646, https://doi.org/10.1038/ngeo2214, 2014.
Christensen, M. W., Chen, Y.-C., and Stephens, G. L.: Aerosol indirect effect dictated by liquid clouds, J. Geophys. Res., 121, 14636–14650, https://doi.org/10.1002/2016JD025245, 2016.
Christensen, M. W., Neubauer, D., Poulsen, C. A., Thomas, G. E., McGarragh, G. R., Povey, A. C., Proud, S. R., and Grainger, R. G.: Unveiling aerosol–cloud interactions – Part 1: Cloud contamination in satellite products enhances the aerosol indirect forcing estimate, Atmos. Chem. Phys., 17, 13151–13164, https://doi.org/10.5194/acp-17-13151-2017, 2017.
Christensen, M. W., Jones, W. K., and Stier, P.: Aerosols enhance cloud lifetime and brightness along the stratus-to-cumulus transition, P. Natl. Acad. Sci. USA, 117, 17591–17598, https://doi.org/10.1073/pnas.1921231117, 2020.
Costantino, L. and Bréon, F.-M.: Analysis of aerosol-cloud interaction from multi-sensor satellite observations, Geophys. Res. Lett., 37, L11801, https://doi.org/10.1029/2009GL041828, 2010.
Costantino, L. and Bréon, F.-M.: Aerosol indirect effect on warm clouds over South-East Atlantic, from co-located MODIS and CALIPSO observations, Atmos. Chem. Phys., 13, 69–88, https://doi.org/10.5194/acp-13-69-2013, 2013.
de Leeuw, G., Andreas, E. L., Anguelova, M. D., Fairall, C. W., Lewis, E. R., O'Dowd, C., Schulz, M., and Schwartz, S. E.: Production flux of sea spray aerosol, Rev. Geophys., 49, RG2001, https://doi.org/10.1029/2010RG000349, 2011.
de Leeuw, G., van der A, R., Bai, J., Xue, Y., Varotsos, C., Li, Z., Fan, C., Chen, X., Christodoulakis, I., Ding, J., Hou, X., Kouremadas, G., Li, D., Wang, J., Zara, M., Zhang, K., and Zhang, Y.: Air Quality over China, Remote Sens.-Basel, 13, 3542, https://doi.org/10.3390/rs13173542, 2021.
de Leeuw, G., Fan, C., Li, Z., Dong, J., Li, Y., Ou, Y., and Zhu, S.: Spatiotemporal variation and provincial scale differences of the AOD across China during 2000–2021, Atmos. Pollut. Res., 13, 101359, https://doi.org/10.1016/j.apr.2022.101359, 2022.
de Leeuw, G., Kang, H., Fan, C., Li, Z., Fang, C., and Zhang, Y.: Meteorological and anthropogenic contributions to changes in the Aerosol Optical Depth (AOD) over China during the last decade, Atmos. Environ., 301, 119676, https://doi.org/10.1016/j.atmosenv.2023.119676, 2023.
Fan, J., Wang, Y., Rosenfeld, D., and Liu, X.: Review of aerosol-cloud interactions: Mechanisms, significance, and challenges, J. Atmos. Sci., 73, 4221–4252, 2016.
Feingold, G., Remer, L. A., Ramaprasad, J., and Kaufman, Y. J.: Analysis of smoke impact on clouds in Brazilian biomass burning regions: an extension of Twomey's approach, J. Geophys. Res., 106, 22907–22922, 2001.
Fu, D., Di Girolamo, L., Liang, L., and Zhao, G.: Regional biases in MODIS marine liquid water cloud drop effective radius deduced through fusion with MISR, J. Geophys. Res.-Atmos., 124, 13182–13196, https://doi.org/10.1029/2019JD031063, 2019.
Fu, D., Di Girolamo, L., Rauber, R. M., McFarquhar, G. M., Nesbitt, S. W., Loveridge, J., Hong, Y., van Diedenhoven, B., Cairns, B., Alexandrov, M. D., Lawson, P., Woods, S., Tanelli, S., Schmidt, S., Hostetler, C., and Scarino, A. J.: An evaluation of the liquid cloud droplet effective radius derived from MODIS, airborne remote sensing, and in situ measurements from CAMP2Ex, Atmos. Chem. Phys., 22, 8259–8285, https://doi.org/10.5194/acp-22-8259-2022, 2022.
Grosvenor, D. P., Sourdeval, O., Zuidema, P., Ackerman, A., Alexandrov, M. D., Bennartz, R., Boers, R., Cairns, B., Chiu, J. C., Christensen, M., Deneke, H., Diamond, M., Feingold, G., Fridlind, A., Hünerbein, A., Knist, C., Kollias, P., Marshak, A., McCoy, D., Merk, D., Painemal, D., Rausch, J., Rosenfeld, D., Russchenberg, H., Seifert, P., Sinclair, K., Stier, P., Diedenhoven, B. V., Wendisch, M., Werner, F., Wood, R., Zhang, Z., and Quaas, J.: Remote sensing of droplet number concentration in warm clouds: A review of the current state of knowledge and perspectives, Rev. Geophys., 56, 409–453, https://doi.org/10.1029/2017RG000593, 2018.
Grandey, B. S. and Stier, P.: A critical look at spatial scale choices in satellite-based aerosol indirect effect studies, Atmos. Chem. Phys., 10, 11459–11470, https://doi.org/10.5194/acp-10-11459-2010, 2010.
Gryspeerdt, E., Stier, P., and Grandey, B. S.: Cloud fraction mediates the aerosol optical depth-cloud top height relationship, Geophys. Res. Lett., 41, 3622–3627, https://doi.org/10.1002/2014GL059524, 2014a.
Gryspeerdt, E., Stier, P., and Partridge, D. G.: Satellite observations of cloud regime development: the role of aerosol processes, Atmos. Chem. Phys., 14, 1141–1158, https://doi.org/10.5194/acp-14-1141-2014, 2014b.
Gryspeerdt, E., Glassmeier, F., Feingold, G., Hoffmann, F., and Murray-Watson, R. J.: Observing short-timescale cloud development to constrain aerosol–cloud interactions, Atmos. Chem. Phys., 22, 11727–11738, https://doi.org/10.5194/acp-22-11727-2022, 2022.
Gryspeerdt, E., Povey, A. C., Grainger, R. G., Hasekamp, O., Hsu, N. C., Mulcahy, J. P., Sayer, A. M., and Sorooshian, A.: Uncertainty in aerosol–cloud radiative forcing is driven by clean conditions, Atmos. Chem. Phys., 23, 4115–4122, https://doi.org/10.5194/acp-23-4115-2023, 2023.
Hersbach, H., Bell, B., Berrisford, P., Biavati, G., Horányi, A., Muñoz Sabater, J., Nicolas, J., Peubey, C., Radu, R., Rozum, I., Schepers, D., Simmons, A., Soci, C., Dee, D., and Thépaut, J.-N.: ERA5 monthly averaged data on pressure levels from 1940 to present, Copernicus Climate Change Service (C3S) Climate Data Store (CDS) [data set], https://doi.org/10.24381/cds.6860a573, 2023.
Huang, H., Thomas, G. E., and Grainger, R. G.: Relationship between wind speed and aerosol optical depth over remote ocean, Atmos. Chem. Phys., 10, 5943–5950, https://doi.org/10.5194/acp-10-5943-2010, 2010.
Jia, H., Ma, X., Quaas, J., Yin, Y., and Qiu, T.: Is positive correlation between cloud droplet effective radius and aerosol optical depth over land due to retrieval artifacts or real physical processes?, Atmos. Chem. Phys., 19, 8879–8896, https://doi.org/10.5194/acp-19-8879-2019, 2019.
Jia, H., Quaas, J., Gryspeerdt, E., Böhm, C., and Sourdeval, O.: Addressing the difficulties in quantifying droplet number response to aerosol from satellite observations, Atmos. Chem. Phys., 22, 7353–7372, https://doi.org/10.5194/acp-22-7353-2022, 2022.
Jin, M. L. and Shepherd, J. M.: Aerosol relationships to warm season clouds and rainfall at monthly scales over east China: Urban land versus ocean, J. Geophys. Res., 113, D24S90, https://doi.org/10.1029/2008JD010276, 2008.
Jones, T. A., Christopher, S. A., and Quaas, J.: A six year satellite-based assessment of the regional variations in aerosol indirect effects, Atmos. Chem. Phys., 9, 4091–4114, https://doi.org/10.5194/acp-9-4091-2009, 2009.
Kaufman, Y. J. and Fraser, R. S.: The effect of smoke particles on clouds and climate forcing, Science, 277, 1636–1639, 1997.
Klein, S. A. and Hartmann, D. L.: The seasonal cycle of low stratiform clouds, J. Climate, 6, 1587–1606, 1993.
Koren, I., Kaufman, Y. J., Rosenfeld, D., Remer, L. A., and Rudich, Y.: Aerosol invigoration and restructuring of Atlantic convective clouds, Geophys. Res. Lett., 32, L14828, https://doi.org/10.1029/2005GL023187, 2005.
Koren, I., Martins, J. V., Remer, L. A., and Afargan, H.: Smoke invigoration versus inhabitation of clouds over the Amazon, Science, 321, 946–949, https://doi.org/10.1126/science.1159185, 2008.
Koren, I., Feingold, G., and Remer, L. A.: The invigoration of deep convective clouds over the Atlantic: aerosol effect, meteorology or retrieval artifact?, Atmos. Chem. Phys., 10, 8855–8872, https://doi.org/10.5194/acp-10-8855-2010, 2010.
Kourtidis, K., Stathopoulos, S., Georgoulias, A. K., Alexandri, G., and Rapsomanikis, S.: A study of the impact of synoptic weather conditions and water vapor on aerosol–cloud relationships over major urban clusters of China, Atmos. Chem. Phys., 15, 10955–10964, https://doi.org/10.5194/acp-15-10955-2015, 2015.
Levy, R. C., Mattoo, S., Munchak, L. A., Remer, L. A., Sayer, A. M., Patadia, F., and Hsu, N. C.: The Collection 6 MODIS aerosol products over land and ocean, Atmos. Meas. Tech., 6, 2989–3034, https://doi.org/10.5194/amt-6-2989-2013, 2013.
Li, Z. Q., Guo, J. P., Ding, A. J., Liao, H., Liu, J. J., Sun, Y. L., Wang, T. J., Xue, H. W., Zhang, H. S., and Zhu, B.: Aerosol and boundary-layer interactions and impact on air quality, Natl. Sci. Rev., 4, 810–833, https://doi.org/10.1093/nsr/nwx117, 2017.
Liu, Q., Duan, S. Y., He, Q. S., Chen, Y. H., Zhang, H., Cheng, N. X., Huang, Y. W., Chen, B., Zhan, Q. Y., and Li, J. Z.: The variability of warm cloud droplet radius induced by aerosols and water vapor in Shanghai from MODIS observations, Atmos. Res., 253, 105470, https://doi.org/10.1016/j.atmosres.2021.105470, 2021.
Liu, T. Q., Liu, Q., Chen, Y. H., Wang, W. C., Zhang, H., Li, D., and Sheng, J.: Effect of aerosols on the macro- and micro-physical properties of warm clouds in the Beijing-Tianjin-Heibei region, Sci. Total Environ., 720, 137618, https://doi.org/10.1016/j.scitotenv.2020.137618, 2020.
Liu, Y., de Leeuw, G., Kerminen, V.-M., Zhang, J., Zhou, P., Nie, W., Qi, X., Hong, J., Wang, Y., Ding, A., Guo, H., Krüger, O., Kulmala, M., and Petäjä, T.: Analysis of aerosol effects on warm clouds over the Yangtze River Delta from multi-sensor satellite observations, Atmos. Chem. Phys., 17, 5623–5641, https://doi.org/10.5194/acp-17-5623-2017, 2017.
Liu, Y., Zhang, J., Zhou, P., Lin, T., Hong, J., Shi, L., Yao, F., Wu, J., Guo, H., and de Leeuw, G.: Satellite-based estimate of the variability of warm cloud properties associated with aerosol and meteorological conditions, Atmos. Chem. Phys., 18, 18187–18202, https://doi.org/10.5194/acp-18-18187-2018, 2018.
Liu, Y., Lin, T., Hong, J., Wang, Y., Shi, L., Huang, Y., Wu, X., Zhou, H., Zhang, J., and de Leeuw, G.: Multi-dimensional satellite observations of aerosol properties and aerosol types over three major urban clusters in eastern China, Atmos. Chem. Phys., 21, 12331–12358, https://doi.org/10.5194/acp-21-12331-2021, 2021.
Ma, X., Jia, H., Yu, F., and Quaas, J.: Opposite aerosol index-cloud droplet effective radius correlations over major industrial regions and their adjacent oceans, Geophys. Res. Lett., 45, 5771–5778, https://doi.org/10.1029/2018GL077562, 2018.
Matheson, M. A., Coakley Jr., J. A., and Tahnk, W. R.: Aerosol and cloud property from relationships for summer stratiform clouds in the northeastern Atlantic from advanced very high resolution radiometer observations, J. Geophys. Res., 110, D24204, https://doi.org/10.1029/2005JD006165, 2005.
Matsui, T., Masunaga, H., and Pielke Sr., R. A.: Impact of aerosols and atmospheric thermodynamics on cloud properties within the climate system, Geophys. Res. Lett., 31, L06109, https://doi.org/10.1029/2003GL019287, 2004.
McComiskey, A. and Feingold, G.: The scale problem in quantifying aerosol indirect effects, Atmos. Chem. Phys., 12, 1031–1049, https://doi.org/10.5194/acp-12-1031-2012, 2012.
Meskhidze, N. and Nenes, A.: Effects of ocean ecosystem on marine aerosol-cloud interaction, Adv. Meteorol., 2010, 239808, https://doi.org/10.1155/2010/239808, 2010.
Michibata, T., Kawamoto, K., and Takemura, T.: The effects of aerosols on water cloud microphysics and macrophysics based on satellite-retrieved data over East Asia and the North Pacific, Atmos. Chem. Phys., 14, 11935–11948, https://doi.org/10.5194/acp-14-11935-2014, 2014.
Myhre, G., Stordal, F., Johnsrud, M., Kaufman, Y. J., Rosenfeld, D., Storelvmo, T., Kristjansson, J. E., Berntsen, T. K., Myhre, A., and Isaksen, I. S. A.: Aerosol-cloud interaction inferred from MODIS satellite data and global aerosol models, Atmos. Chem. Phys., 7, 3081–3101, https://doi.org/10.5194/acp-7-3081-2007, 2007.
Nakajima, T., Higurashi, A., Kawamoto, K., and Penner, J. E.: A possible correlation between satellite-derived cloud and aerosol microphysical parameters, Geophys. Res. Lett., 28, 1171–1174, https://doi.org/10.1029/2000GL012186, 2001.
Painemal, D. and Zuidema, P.: Assessment of MODIS cloud effective radius and optical thickness retrievals over the Southeast Pacific with VOCALS-REx in situ measurements, J. Geophys. Res., 116, D24206, https://doi.org/10.1029/2011JD016155, 2011.
Pandey, S. K., Vinoj, V., and Panwar, A.: The short-term variability of aerosols and their impact on cloud properties and radiative effect over the Indo-Gangetic Plain, Atmos. Pollut. Res., 11, 630–638, 2020.
Platnick, S., King, M. D., Ackerman, S. A., Menzel, W. P., Baum, B. A., Riédi, J. C., and Frey, R. A.: The MODIS Cloud Products: Algorithms and Examples From Terra, IEEE T. Geosci., 41, 459–473, https://doi.org/10.1109/TGRS.2002.808301, 2003.
Platnick, S., King, M., and Hubanks, P.: MYD08_D3 - MODIS/Aqua Aerosol Cloud Water Vapor Ozone Daily L3 Global 1Deg CMG, NASA MODIS Adaptive Processing System, Goddard Space Flight Center [data set], USA, https://doi.org/10.5067/MODIS/MYD08_D3.061, 2017a.
Platnick, S., Meyer, K. G., King, M. D., Wind, G., Amarasinghe, N., Marchant, B., Arnold, G. T., Zhang, Z., Hubanks, P. A., Holz, R. E., Yang, P., Ridgway, W. L., and Riedi, J.: The MODIS cloud optical and microphysical products: Collection 6 updates and examples from Terra and Aqua, IEEE T. Geosci. Remote, 55, 502–525, https://doi.org/10.1109/TGRS.2016.2610522, 2017b.
Quaas, J., Boucher, O., Bellouin, N., and Kinne, S.: Satellite-based estimate of the direct and indirect aerosol climate forcing, J. Geophys. Res., 113, D05204, https://doi.org/10.1029/2007JD008962, 2008.
Quaas, J., Stevens, B., Stier, P., and Lohmann, U.: Interpreting the cloud cover – aerosol optical depth relationship found in satellite data using a general circulation model, Atmos. Chem. Phys., 10, 6129–6135, https://doi.org/10.5194/acp-10-6129-2010, 2010.
Qiu, Y., Zhao, C., Guo, J., and Li, J.: 8-Year ground-based observational analysis about the seasonal variation of the aerosol-cloud droplet effective radius relationship at SGP site, Atmos. Environ., 164, 139–146, https://doi.org/10.1016/j.atmosenv.2017.06.002, 2017.
Rao, S. and Dey, S.: Consistent signal of aerosol indirect and semi-direct effect on water clouds in the oceanic regions adjacent to the Indian subcontinent, Atmos. Res., 232, 104677, https://doi.org/10.1016/j.atmsores.2019.104677, 2020.
Remer, L. A., Kaufman, Y. J., Tanre, D., Mattoo, S., Chu, D. A., Martins, J. V., Li, R. R., Ichoku, C., Levy, R. C., Kleidman, R. G., Eck, T. F., Vermote, E., and Holben, B. N.: The MODIS aerosol algorithm, products, and validation, J. Atmos. Sci., 62, 947–973, https://doi.org/10.1175/JAS3385.1, 2005.
Rosenfeld, D., Andreae, M. O., Asmi, A., Chin, M., de Leeuw, G., Donovan, D., Kahn, R., Kinne, S., Kivekäs, N., Kulmala, M., Lau, W., Schmidt, S., Suni, T., Wagner, T., Wild, M., and Quaas, J.: Global observations of aerosol-cloud-precipitation-climate interactions, Rev. Geophys., 52, 750–808, https://doi.org/10.1002/2013RG000441, 2014.
Rosenfeld, D., Zhu, Y. N., Wang, M. H., Zheng, Y. T., Goren, T., and Yu, S. C.: Aerosol-driven droplet concentrations dominate coverage and water of oceanic low-level clouds, Science, 363, eaav0566, https://doi.org/10.1126/science.avv0566, 2019.
Saponaro, G., Kolmonen, P., Sogacheva, L., Rodriguez, E., Virtanen, T., and de Leeuw, G.: Estimates of the aerosol indirect effect over the Baltic Sea region derived from 12 years of MODIS observations, Atmos. Chem. Phys., 17, 3133–3143, https://doi.org/10.5194/acp-17-3133-2017, 2017.
Sayer, A. M.: Interactive comment on “Two decades of satellite observations of AOD over mainland China” by Gerrit de Leeuw et al., https://doi.org/10.5194/acp-2017-838-RC1, 2017.
Sayer, A. M., Munchak, L. A., Hsu, N. C., Levy, R. C., Bettenhausen, C., and Jeong, M. J.: MODIS Collection 6 aerosol products: Comparison between Aqua's e-Deep Blue, Dark Target, and “merged” data sets, and usage recommendations, J. Geophys. Res.-Atmos., 119, 13965–13989, https://doi.org/10.1002/2014jd022453, 2014.
Seinfeld, J. H. and Pandis, S. N.: Atmospheric Chemistry and Physics: From Air Pollution to Climate Change, John Wiley and Sons, Inc., New York, ISBN 0-471-17815-2, 1998.
Shao, H. F. and Liu, G. S.: Why is the satellite observed aerosol's indirect effect so variable?, Geophys. Res. Lett., 32, L15802, https://doi.org/10.1029/2005GL023260, 2005.
Shen, L. J., Wang, H. L., Kong, X. C., Zhang, C., Shi, S. S., and Zhu, B.: Characterization of black carbon aerosol in the Yangtze River Delta, China Seasonal variation and source apportionment, Atmos. Pollut. Res., 12, 195–209, 2021.
Slingo, A.: Sensitivity of the Earth's radiation budget to changes in low clouds, Nature, 343, 49–51, 1990.
Smirnov, A., Sayer, A. M., Holben, B. N., Hsu, N. C., Sakerin, S. M., Macke, A., Nelson, N. B., Courcoux, Y., Smyth, T. J., Croot, P., Quinn, P. K., Sciare, J., Gulev, S. K., Piketh, S., Losno, R., Kinne, S., and Radionov, V. F.: Effect of wind speed on aerosol optical depth over remote oceans, based on data from the Maritime Aerosol Network, Atmos. Meas. Tech., 5, 377–388, https://doi.org/10.5194/amt-5-377-2012, 2012.
Tan, S., Han, Z., Wang, B., and Shi, G.: Variability in the correlation between satellite-derived liquid cloud droplet effective radius and aerosol index over the northern Pacific Ocean, Tellus B, 69, 1391656, https://doi.org/10.1080/16000889.2017.1391656, 2017.
Tang, J., Wang, P., Mickley, L. J., Xia, X., Liao, H., Yue, X., Sun, L., and Xia, J.: Positive relationship between liquid cloud droplet effective radius and aerosol optical depth over Eastern China from satellite data, Atmos. Environ., 84, 244–253, https://doi.org/10.1016/j.atmosenv.2013.08.024, 2014.
Tao, W. K., Chen, J. P., Li, Z., Wang, C. E., and Zhang, C. D.: Impact of aerosols on convective clouds and precipitation, Rev. Geophys., 50, RG2001, https://doi.org/10.1029/2011RG000369, 2012.
Ten Hoeve, J. E., Remer, L. A., and Jacobson, M. Z.: Microphysical and radiative effects of aerosols on warm clouds during the Amazon biomass burning season as observed by MODIS: impacts of water vapor and land cover, Atmos. Chem. Phys., 11, 3021–3036, https://doi.org/10.5194/acp-11-3021-2011, 2011.
Twohy, C. H., Coakley Jr., J. A., and Tahnk, W. R.: Effect of changes in relative humidity on aerosol scattering near clouds, J. Geophys. Res., 114, D05205, https://doi.org/10.1029/2008JD010991, 2009.
Twomey, S.: The influence of pollution on the shortwave albedo of clouds, J. Atmos. Sci., 34, 1149–1152, 1977.
Varnái, T. and Marshak, A.: MODIS observations of enhanced clear sky reflectance near clouds, Geophys. Res. Lett., 36, L06807, https://doi.org/10.1029/2008GL037089, 2009.
Wang, F., Guo, J., Zhang, J., Wu, Y., Zhang, X., Deng, M., and Li, X.: Satellite observed aerosol-induced variability in warm cloud properties under different meteorological conditions over eastern China, Atmos. Environ., 84, 122–132, 2014.
Wang, F., Guo, J., Zhang, J., Huang, J., Min, M., Chen, T., Liu, H., Deng, M., and Li, X.: Multi-sensor quantification of aerosol-induced variability in warm clouds over eastern China, Atmos. Environ., 113, 1–9, https://doi.org/10.1016/j.atmosenv.2015.04.063, 2015.
Wang, J. F. and Hu, Y.: Environmental health risk detection with GeogDetector, Environ. Modell. Softw., 33, 114–115, 2012.
Wang, J. F., Li, X. H., Christakos, G., Liao, Y. L., Zhang, T., Gu, X., and Zheng, X. Y.: Geographical detectors-based health risk assessment and its application in the neural tube defects study of the Heshun Region, China, Int. J. Geogr. Inf. Sci., 24, 107–127, 2010.
Wang, J. F., Zhang, T. L., and Fu, B. J.: A measure of spatial stratified heterogeneity, Ecol. Indic., 67, 250–256, 2016.
Wang, J. X., Hu, M. G., Zhang, F. S., and Gao, B. B.: Influential factors detection for surface water quality with geographical detectors in China, Stoch. Env. Res. Risk A, 32, 2633–2645, 2018.
Wei, J., Li, Z., Peng, Y., and Sun, L.: MODIS Collection 6.1 aerosol optical depth products over land and ocean: validation and comparison, Atmos. Environ., 201, 428–440, https://doi.org/10.1016/j.atmosenv.2018.12.004, 2019.
Wood, R. and Bretherton, C. S.: On the relationship between Stratiform Low Cloud Cover and Lower-Tropospheric Stability, J. Climate, 19, 6425–6432, 2006.
Yuan, T., Li, Z., Zhang, R., and Fan, J.: Increase of cloud droplet size with aerosol optical depth: an observation and modeling study, J. Geophys. Res., 113, D04201, https://doi.org/10.1029/2007JD008632, 2008.
Zhang, X. L. and Zhao, Y.: Identification of the driving factors' influences on regional energy-related carbon emissions in China based on geographical detector method, Environ. Sci. Pollut. R., 25, 9626–9635, 2018.
Zhao, C. F., Qiu, Y. M., Dong, X. B., Wang, Z. E., Peng, Y. R., Li, B. D., Wu, Z. H., and Wang, Y.: Negative aerosol-cloud re relationship from aircraft observations over Hebei, China, Earth and Space Science, 5, 19–29, 2018.
Zhou, C. S., Chen, J., and Wang, S. J.: Examining the effects of socioeconomic development on fine particulate matter (PM2.5) in China's cities using spatial regression and the geographical detector technique, Sci. Total Environ., 619, 436–445, 2018.
- Article
(7568 KB) - Full-text XML