the Creative Commons Attribution 4.0 License.
the Creative Commons Attribution 4.0 License.
 | 05 Dec 2018
Two years of online measurement of fine particulate nitrate in the western Yangtze River Delta: influences of thermodynamics and N2O5 hydrolysis
Xuguang Chi
Yuning Xie
Xin Huang
Zheng Xu
Ximeng Qi
Zhengning Xu
Lei Wang
Tianyi Wang
Particulate nitrate contributes a large fraction of secondary aerosols. Despite understanding of its important role in regional air quality and global climate, long-term continuous measurements are rather limited in China. In this study, we conducted online measurement of PM2.5 (particulate matter with diameters less than 2.5 µm) nitrate for 2 years from March 2014 to February 2016 using the Monitor for AeRosols and Gases in ambient Air (MARGA) in the western Yangtze River Delta (YRD), eastern China, and investigate the main factors that influenced its temporal variations and formation pathways. Compared to other sites in China, an overall high concentration of particulate nitrate was observed, with a mean value of 15.8 µg m−3 (0.5 to 92.6 µg m−3). Nitrate on average accounted for 32 % of the total mass of water-soluble ions and the proportion increased with PM loading, indicating that nitrate is a major driver of haze pollution episodes in this region. Sufficient ammonia drove most nitrate into the particle phase in the form of ammonium nitrate. A typical seasonal cycle of nitrate was observed, with the concentrations in winter on average 2 times higher than those in summer mainly due to different meteorological conditions. In summer, the diurnal variation of particulate nitrate was determined by thermodynamic equilibrium, resulting in a much lower concentration during daytime despite a considerable photochemical production. Air masses from the polluted YRD and biomass burning region contributed to the high nitrate concentration during summer. In winter, particulate nitrate did not reveal an evident diurnal variation. Regional transport from northern China played an important role in enhancing nitrate concentration. A total of 18 nitrate episodes were selected to understand the processes that drive the formation of high concentration of nitrate. Rapid nitrate formation was observed during the pre-episode (the day before nitrate episode day) nights, and dominated the increase of total water-soluble ions. Calculated nitrate from N2O5 hydrolysis was highly correlated to and accounted for 80 % of the observed nitrate, suggesting that N2O5 hydrolysis was a major contributor to the nitrate episodes. Our results suggested that rapid formation of nitrate could be a main cause for extreme aerosol pollution events in the YRD during winter, and illustrated the urgent need to control NOx emission.
- Article
(10784 KB) - Full-text XML
-
Supplement
(617 KB) - BibTeX
- EndNote


Particulate nitrate (), as a major aerosol component in the atmosphere, reduces atmospheric visibility (Charlson and Heintzenberg, 1995), influences human health, alters radiative forcing and hence influences regional and even global climate (IPCC, 2013). Compared to sulfate, nitrate has a larger scattering albedo under low relative humidity (RH) conditions that causes a stronger influence on visibility (Lei and Wuebbles, 2013). A high concentration of particulate nitrate has been demonstrated to be one of the major reasons for the frequent occurrence of haze episodes in China (Wang and Zhang, 2009; Wen et al., 2015; H. Wang et al., 2017). In recent decades, the Chinese government started to control emissions of air pollutants, with a special effort on SO2 reduction. This resulted in a remarkable decrease of ambient SO2 and sulfate concentrations after 2006 (van der A et al., 2017; J. Wang et al., 2017). However, particulate nitrate, as well as its proportion in particulate matter (PM), showed increasing trends due to the strong emission of nitrogen oxides (NOx) (Lei and Wuebbles, 2013, Nie et al., 2013; Yang et al., 2017).
Particulate nitrate can be formed from multiple pathways. The gas-phase reaction of NO2 and OH radicals is one major pathway to form nitric acid (HNO3) (Calvert and Stockwell, 1983), which subsequently reacts with ammonia (NH3) to produce ammonium nitrate (NH4NO3). As typical photochemical processes, these reactions dominate daytime nitrate formation, and have been widely investigated in both field and modeling studies (Sharma et al., 2007; Petetin et al., 2016). Heterogeneous uptake of the photochemical formed nitric acid by alkali compounds, e.g., dust and sea salt particles, is also a considerable pathway to form nitrate in some regions (Bian et al., 2014). During nighttime, the hydrolysis of dinitrogen pentoxide (N2O5) is believed to be the dominate pathway to form particulate nitrate. N2O5 is an important reactive nitrogen species in the polluted troposphere (Brown et al., 2007, 2003; Osthoff et al., 2006; Li et al., 2017; Brown and Stutz, 2012; T. Wang et al., 2016; X. Wang et al., 2017) and accumulates via the reversible reaction between NO2 and NO3 radicals produced from the reaction of NO2 with O3. Due to the rapid photolysis of NO3 radicals, the contribution of N2O5 hydrolysis to nitrate concentration during daytime of a sunny day is usually small, while during nighttime, N2O5 concentration can be up to a ppb level and form nitric acid via a reaction with water vapor, or particulate nitrate directly via heterogeneous hydrolysis on the wet surface (J. Wang et al., 2017; Wen et al., 2018; Thornton et al., 2003). In China, pollution episodes with high nitrate concentrations mostly occur in winter, during which the photochemical production of nitrate should be weak overall. N2O5 hydrolysis thus has the potential to be a crucial contributor; however there is still a lack of observational evidence.
Collecting particulate matter on a filter with subsequent ion chromatography (IC) analysis in laboratories is the conventional method to measure the concentration of particulate nitrate. The un-denuded filter pack system, which is most widely used, can suffer from both positive artifacts through absorbing gas-phase nitric acid and negative artifacts through the evaporation of ammonium nitrate (Nie et al., 2010; Pathak et al., 2009; Wang et al., 2010). A denuder system can minimize these sampling artifacts by adding denuders to remove the interfering gases and backup filters to collect the evaporated vapors (John et al., 1988). However, the operation of such a denuder system is extremely labor-intensive, and thus it is not widely used. In addition, the poor time resolution of filter-based measurement can limit our understanding on the formation and chemical evolution of the particulate nitrate. To overcome these shortcomings, several continuous and semi-continuous techniques have been developed based on an online denuded IC system (e.g., the ambient ion monitor (AIM), the gas and aerosol collector with ion chromatography (GAC-IC), the particle-into-liquid sample ion chromatography (PILS-IC) and the Monitor for AeRosols and Gases in ambient Air (MARGA)), as well as mass spectrometry (e.g., AMS). Pathak et al. (2011) applied an AIM instrument in Beijing and Shanghai for 1 month and found that the heterogeneous hydrolysis of N2O5 contributed 50 %–100 % of the nighttime nitrate formation. Xue and Yuan (2013) deployed a PILS-IC system in Hong Kong for less than a month and showed a more active nitrate formation during PM episodes than normal days. Wen et al. (2015) used the MARGA instrument in Yucheng, northern China, during summer and emphasized the important roles of O3 and NH3 in nitrate formation. Yang et al. (2017) carried out field observation with the ACSM (Aerosol Chemical Speciation Monitor) in Beijing for half a month and pointed out the importance of aerosol nitrate in haze formation. However, despite an increasing number of studies using online techniques, continuous measurements with more than a 1-year period are still very limited.
The Yangtze River Delta (YRD), located in eastern China, with megacities including Shanghai, Nanjing and Suzhou, has suffered from heavy particulate matter pollution and photochemical pollution (Ding et al., 2013b, c; H. L. Wang et al., 2016; J. Wang et al., 2016; D. Wang et al., 2016). Previous studies indicated the important role of nitrate in pollution episodes (Hua et al., 2015; Du et al., 2011; Yang et al., 2017). For example, Y. Zhang et al. (2015) carried out an observation with ACSM in urban Nanjing during summer and autumn, and found that nitrate and organic aerosols dominated the PM1 composition. Shi et al. (2014) used the MARGA instrument in Shanghai for months and found an increasing contribution of nitrate to PM1 mass during pollution periods. H. L. Wang et al. (2016) reported temporal variation and transport of PM2.5 (particulate matter with diameters less than 2.5 µm) water-soluble ions, including nitrate, in an urban site in Shanghai based on 3-year continuous measurement using MARGA. However, detailed investigation of the possible mechanisms governing nitrate behavior during haze pollution is still rare.
In this study, we present a 2-year continuous measurement of particulate nitrate using MARGA at a rural site in Nanjing, a megacity in the western YRD region, with the aim of obtaining a comprehensive understanding of particulate nitrate behaviors and investigating the processes affecting nitrate in haze episodes. We first conducted general statistical analysis of particulate nitrate and characterized the seasonal variation and diurnal pattern. A thermodynamic model was then applied to investigate the gas–particle partition of nitrate. The influence of air masses was also investigated by conducting backward Lagrangian dispersion modeling. Finally, we selected 18 nitrate episodes and investigated the main processes influencing their evolution.
2.1 Sample site and instrumentation
SORPES (Station for Observing Regional Processes of the Earth System; 118∘57′ E, 32∘07′ N) is located on the top of a small hill (40 m above sea level) in the Xianlin campus of Nanjing University, located in the outskirts of Nanjing, China. The station is an ideal receptor of air masses from the YRD, with little influence of local emissions and urban pollution from Nanjing. Detailed description can be found in previous studies (Ding et al., 2013c, 2016b).
The measurement was conducted from March 2014 to February 2016. Hourly concentrations of water-soluble gases of HCl, HNO3, HONO, SO2 and NH3, and water-soluble ions in PM2.5, including Cl−, , , , Na+, K+, Ca2+ and Mg2+, were measured with the MARGA instrument (designed and manufactured by Applikon Analytical B.V., the Netherlands), employed in connection with a Thermo PM2.5 cyclone inlet. The sampling system was comprised of two parts: a Wet Rotating Denuder for gases and a Steam-Jet Aerosol Collector for aerosols, working at an air flow of 1 m3 h−1 (ten Brink et al., 2007; Rumsey et al., 2014). After each hour's collection, the samples were analyzed using ion chromatography. The instrument was calibrated on an hourly basis using internal standard liquid (bromide lithium), ensuring a stable and reliable ion chromatograph. Concentrations of all aerosol ions and gases have a precision of 0.001 µg m−3 (Xie et al., 2015). The PM2.5 ion dataset from MARGA provided more than 15 000 hourly samples over the 24 months of measurements, considering points where , and were all available. Trace gases (i.e., O3, SO2, NOx, NO) and PM2.5 mass concentrations were also measured at SORPES (Ding et al., 2013c, 2016b; Nie et al., 2015), together with meteorological data including wind speed/direction, temperature and relative humidity.
2.2 Thermodynamic constants and ISORROPIA II
Formation of ammonium nitrate involves an equilibrium reaction between the gas-phase NH3 and HNO3, and particle-phase NH4NO3. The gas–particle partitioning is temperature-dependent, and the equilibrium constant can be calculated as follows (units ) (Sun et al., 2011; Seinfeld and Pandis, 2006):
ISORROPIA II (available at http://isorropia.eas.gatech.edu/, last access: 12 January 2018) is a thermodynamic model used commonly in inorganic aerosol research (Fountoukis and Nenes, 2007). To analyze the gas–particulate pathway for nitrate formation, HNO3 was modeled with ISORROPIA II, run in forward model iteratively (Pusede et al., 2016; Fountoukis and Nenes, 2007). ISORROPIA II was initialized as . Calculated HNO3(g) was added back to , while we always use as input total ammonium. ISORROPIA II was solved iteratively until output changed by <2 % by mass. The phase state was set as metastable. We assume that gases and aerosol are in equilibrium, that aerosols are homogeneous and internally mixed, and that factors that are unaccounted for do not influence the thermodynamics of the system (Vayenas et al., 2005).
2.3 Lagrangian dispersion modeling
To help understand the influence of air masses, backward Lagrangian particulate dispersion modeling (LPDM) was carried out based on a method developed and evaluated by Ding et al. (2013a). The LPDM was conducted using the Hybrid Single-Particulate Lagrangian Integrated Trajectory model developed in the Air Resource Laboratory (ARL) of the National Oceanic and Atmospheric Administration using the ARL format Global Data Assimilation System data. The model calculates the position of particulates by mean wind and a turbulence transport component after they are released at the source point for a backward simulation. For each hour, 3000 particulates were released at 100 m altitude over the site and were traced backward for a 3-day period. The hourly position of each particulate was calculated using a 3-D particulate, i.e., horizontal and vertical, method. The residence time at 100 m altitude, i.e., footprint “retroplume”, which represents the distribution of the surface probability or residence time of the simulated air mass, was used to understand the contribution from potential source regions (Ding et al., 2013a, c; Shen et al., 2018).
Table 1Major gas-phase and heterogeneous reactions involving NO3 and N2O5.
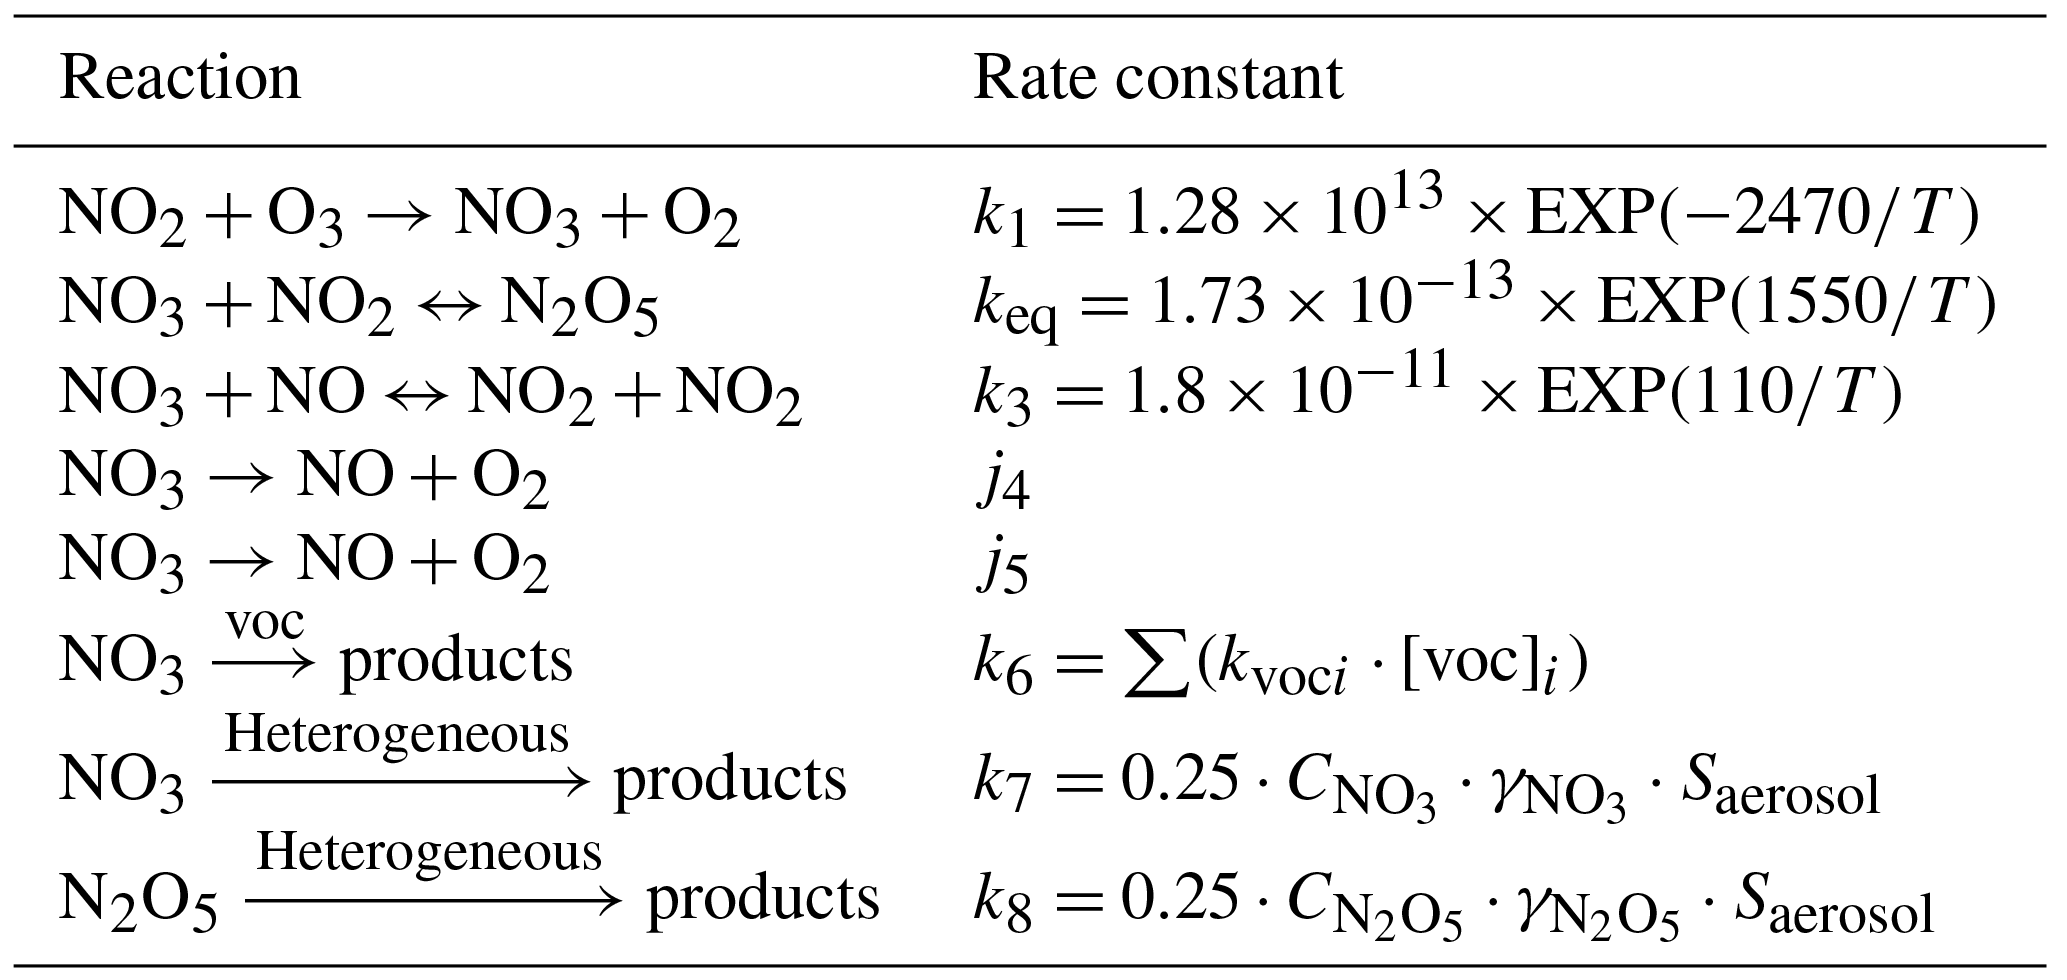

Figure 1Average mass concentrations of particulate nitrate at different sampling sites in (a) summer and (b) winter. The left panel shows the map color coded by 2 years (2014–2015) of averaged tropospheric NO2 from the OMI satellite (http://www.temis.nl/airpollution/no2.html, last access: 11 January 2018). The pink bars are for this study.
2.4 Steady-state predictions
Based on their short lifetimes, the concentrations of the NO3 radicals and N2O5 can be predicted using steady-state calculations due to a lack of measurement data (Osthoff et al., 2006). The formation and loss of N2O5 associated with a series of chemical reactions are listed in Table 1. For the heterogeneous processes, we used 0.004 and 0.03 as the uptake coefficients of the NO3 radicals and N2O5 (γNO3 and γN2O5), respectively (Aldener et al., 2006; Wen et al., 2015; Knopf et al., 2011; Brown et al., 2006). Due to the lack of measurement during 2014–2016, the volatile organic compound (VOC) data used here were the average nighttime values that were measured at the SORPES station during the wintertime of 2017. The corresponding rate constant can be found in Master Chemical Mechanism (MCM version 3.1, http://mcm.leeds.ac.uk/MCM/, last access: 20 January 2018). The uncertainty that was caused by the limited VOC measurements and the variation of N2O5 uptake coefficient was estimated and discussed in the Supplement.
3.1 Overall results
MARGA was deployed to continuously measure the eight water-soluble ions (WSI) of PM2.5 and several gas-phase species from March 2014 to February 2016, with a time resolution of 1 h. Nitrate (), sulfate () and ammonium () were the major components, with 2-year averaged concentrations of 15.8 (±13.4), 15.3 (±10.6) and 10.4 (±7.6) µg m−3, respectively. In the present study, we focused on nitrate, and discussed the temporal variation and its association with physicochemical processes. The concentrations of PM2.5 nitrate changed largely from 0.5 to 92.6 µg m−3 during the measurement period, and accounted for 3 % to 58 % of total WSI ( µg m−3). The highest hourly nitrate concentration occurred on 23 December 2015, together with high concentrations of sulfate (65.5 µg m−3) and ammonium (56.8 µg m−3). Heavy haze episodes like this occurred at our site frequently during winter. To understand the influence of wind on nitrate concentrations, the wind rose plot is given in Fig. S2 in the Supplement. The prevailing winds at the SORPES station were from northeast and east during the 2-year observation period. Particulate nitrate tended to accumulate or form under stagnant conditions of low wind speed. The wind from west and east can lead to a higher nitrate concentration and also other aerosol components (Ding et al., 2013b, c; Shen et al., 2018), which may be associated with air masses from the biomass burning region and the city clusters of YRD.
To get an overall picture of nitrate distribution in the developed region of coastal China, we reviewed results from available nitrate measurements in the three most polluted regions of the North China Plain (NCP), YRD and Pearl River Delta (PRD), and summarized their concentration, sampling sites and measurement techniques in Fig. 1. The corresponding data and references are listed in Table S2 in the Supplement. Measurements in summer and winter were separated due to the large seasonal difference of particulate nitrate. Despite these measurements being from various measurement techniques, the results still can give us some insights about the differences in spatial and temporal scales. First, particulate nitrate generally showed the highest concentration in the NCP, followed by the YRD and the PRD. This was in consistence with the spatial distribution of NO2 – a major gas precursor of nitrate. Second, evident seasonal variations can be observed at all three regions, with much higher concentrations in winter. Third, an overall increase of particulate nitrate was implied in the NCP and the YRD in the past decade, especially that during summertime (shown in Fig. 1a). Nevertheless, particulate nitrate in the PRD revealed an overall decreasing trend. It should be noted that the datasets cited in Fig. 1 were obtained from different sites with different techniques. Trends inferred from these datasets could suffer from considerable uncertainty. Compared to these previous studies, the nitrate concentration during summertime at the SORPES station was lower than that in the NCP, but higher than that in the YRD and the PRD cities. In terms of wintertime, nitrate concentration at the SORPES station was slightly lower than that in the NCP, comparable with that in the YRD and higher than that in the PRD.
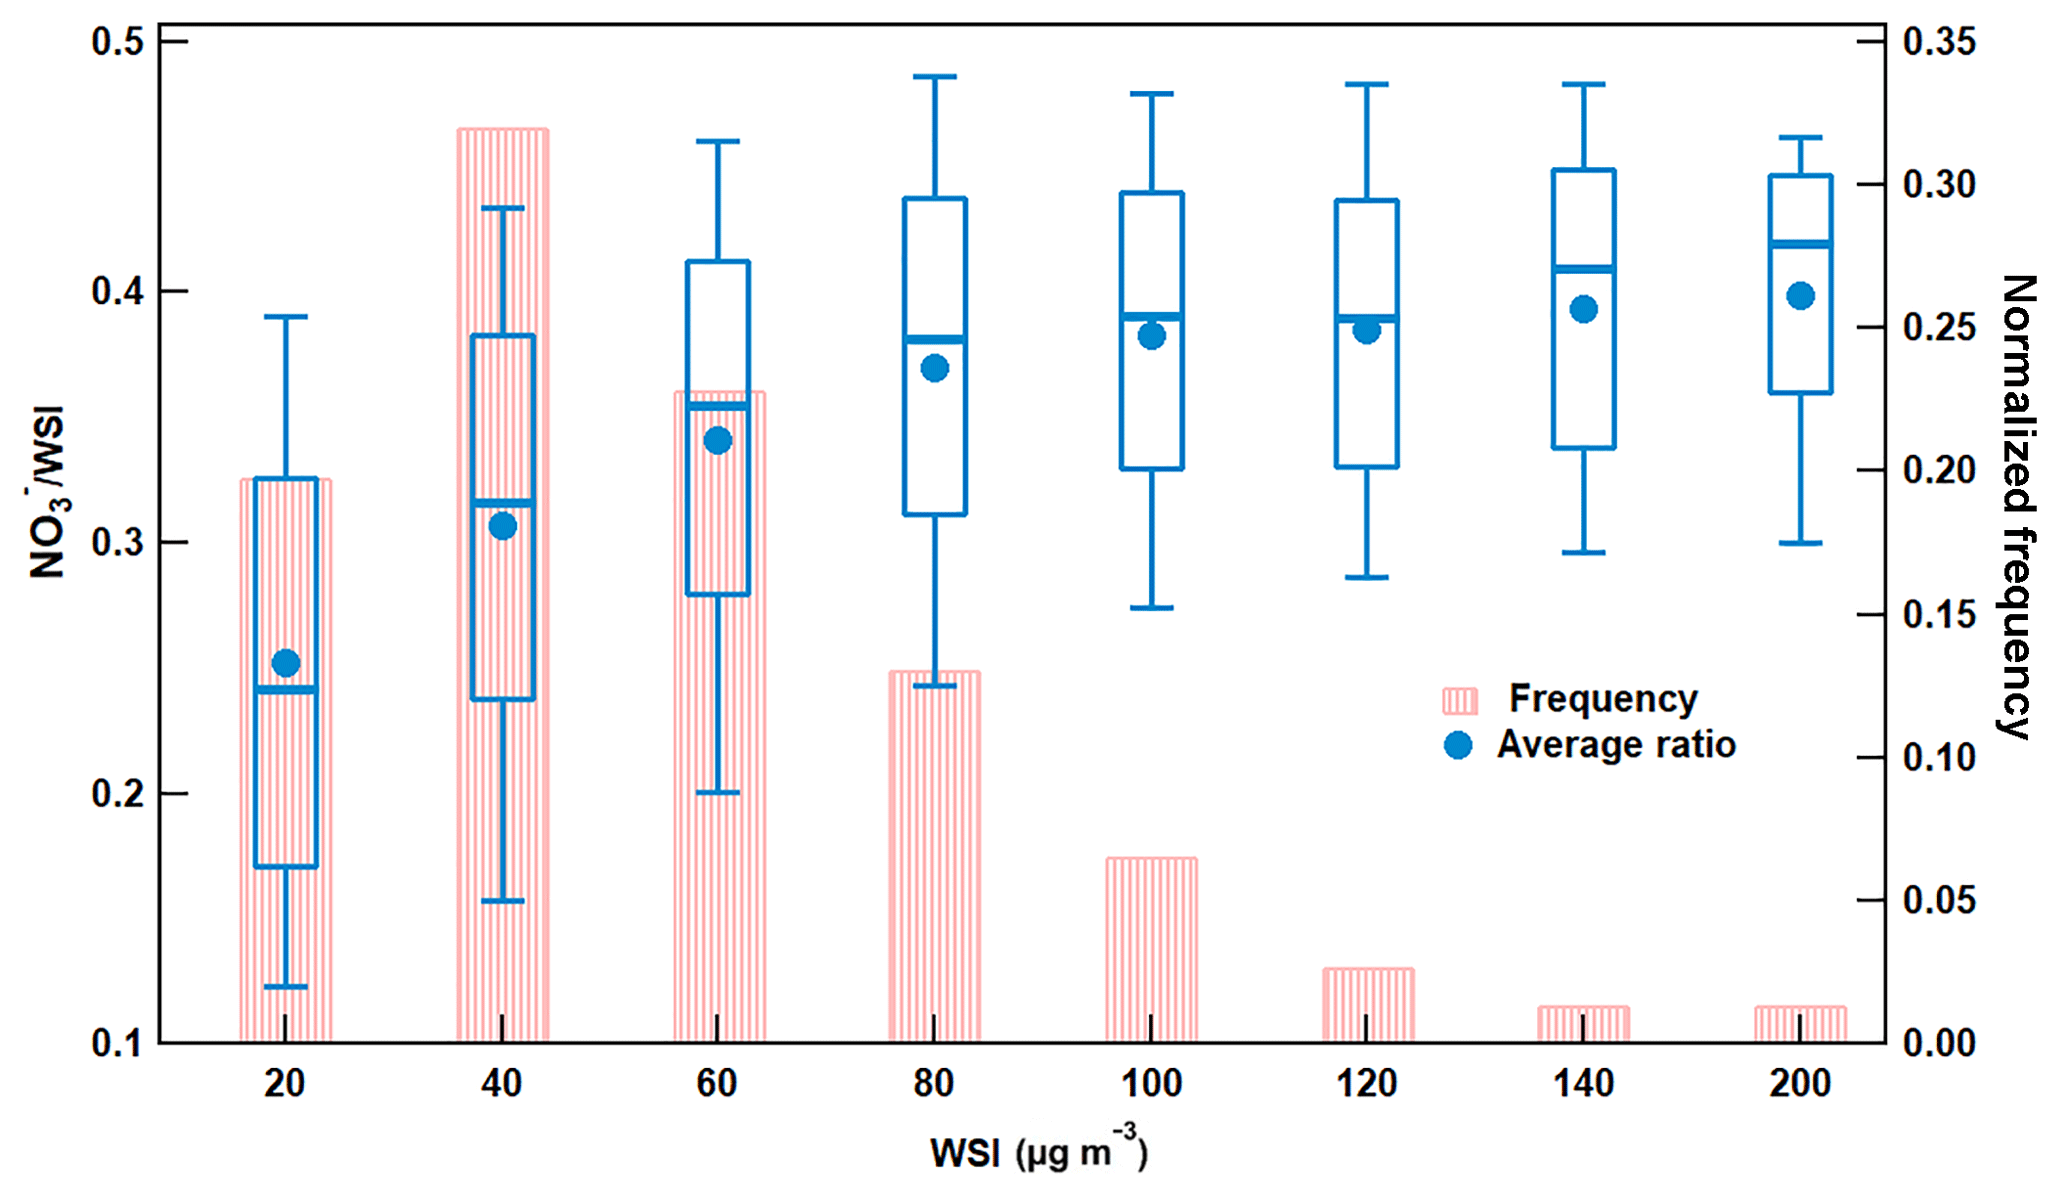
Figure 2Average proportion of nitrate and normalized frequency of occurrence at different mass concentration bins of water-soluble ions at SORPES. For the ratio, box boundaries represent the interquartile range, bars represent 5 %–95 % percentile range and horizontal lines represent the median value.

Figure 3Scatter plots of (a) nitrate vs. total WSI color coded by air temperature, (b) molar concentrations of ammonium with nitrate molar concentrations plus 2 times the sulfate molar concentrations.
Figure 2 illustrates the occurrence frequency of the loading of particle matter in different concentration ranges and the changes of nitrate proportion along with the PM loading. Note that the PM loading here was indicated by the mass of total WSI. The highest frequency of WSI concentrations occurred in a range of 20–40 µg m−3, and gradually decreased with increasing concentration. Heavy PM pollution with WSI concentrations higher than 100 µg m−3 occurred during more than 5 % of the time during this study. The contribution of nitrate to total WSI increased with the PM loading, ranging from ∼25 % with WSI concentration lower than 20 µg m−3 to ∼40 % when WSI was higher than 140 µg m−3. These results suggested that nitrate was a major driver of haze episodes with high PM peaks in this region.
Figure 3a shows the scatter plot of particulate nitrate and total WSI. The correlation coefficient was 0.92, and nitrate accounted for 32 % of the total WSI. Air temperature greatly affected the contribution of nitrate to total WSI. Its proportion can be up to 58 % in the temperature range of 0 to 5 ∘C and only 3 % at temperatures higher than 30 ∘C, indicating the important role of thermodynamic equilibrium in nitrate concentration. We further investigated the neutralization extent of sulfate and nitrate by ammonium (Fig. 3b). Ammonium was overall enough to neutralize both sulfate and nitrate, suggesting that the particulate nitrate mostly existed as ammonium nitrate at the SORPES station. This is different from the ammonia-poor regions, where the uptake of HNO3 to dust/sea salt particles was found to be important to PM2.5 nitrate (Griffith et al., 2015). Seasonal difference can be observed for the molar ratio of ammonium to the sum of sulfate and nitrate. In spring and early summer, a fraction of the particulate nitrate is present as Ca(NO3)2 and KNO3, which could explain the data points below the regression line in Fig. 3b. In winter, considerable ammonium exists as NH4Cl (Hu et al., 2017), resulting in the data points above the regression line.

Figure 4Monthly averaged nitrate (blue), sulfate (red), NOx (orange) mass concentrations and nitrate to sulfate molar-based ratio (grey) measured at the SORPES station during March 2014 to February 2016. For the nitrate to sulfate ratio (a) and sulfate (b), bold solid lines are the median values, shaded areas represent percentiles of 75 % and 25 % and diamonds represent the mean values. For nitrate (c), box boundaries represent the interquartile range, bars represent 5 %–95 % percentile range, horizontal lines represent the median value and crosses represent mean values.
3.2 Characteristics of fine particular nitrate in different seasons
3.2.1 Seasonal pattern and its main causes
Figure 4 shows the composite seasonal pattern of NOx, PM2.5 nitrate, sulfate and the molar-based ratio of nitrate to sulfate during the 2-year period at the SORPES station. The seasonal variations of other related species and nitrate∕PM2.5 ratio are shown in Table S3. Similar to previous studies (Griffith et al., 2015), a typical seasonal variation was observed for particulate nitrate (and its ratio to sulfate, i.e., ), with a maximum value of 23.7 µg m−3 (140 %) in January and a minimum of 8.4 µg m−3 (66 %) in August and September. Particulate sulfate exhibits a relatively less pronounced seasonal pattern with a small peak in June. The low value of particulate nitrate during summer can be generally explained by the higher temperature, higher and unstable boundary layer and relative clean air masses induced by the summer monsoon (Ding et al., 2013c) despite the increased photochemical formation. In contrast, the high values during winter were generally due to the lower temperature, lower and stable boundary layer and relative stronger continental outflow from northern China, where anthropogenic emission was relatively high due to heating in winter (Ding et al., 2013c). Different chemical processes that affect nitrate concentrations between summer and winter will be discussed later. NOx, the major precursor, followed the changes of particulate nitrate, except for that during February and June. In addition, a secondary peak of particulate nitrate can be observed during June, which can be explained as the influence from agricultural burning in eastern China (Ding et al., 2013b, c; Xie et al., 2015; Shen et al., 2018). The concentrations of potassium, a biomass burning tracer in this region (Ding et al., 2013b; Xie et al., 2015), clearly showed a consistent peak (Fig. S3) with both particulate nitrate and sulfate, as well as the discrepancy of NOx and nitrate concentrations (Ding et al., 2013b; Xie et al., 2015; Nie et al., 2015) shown in Fig. 4, while in February, the nitrate concentration did not show a concurrent decrease in NOx during the Chinese Spring Festival (Ding et al., 2013c). The observations might suggest that particulate nitrate is influenced by regional transport but not local emissions in February.
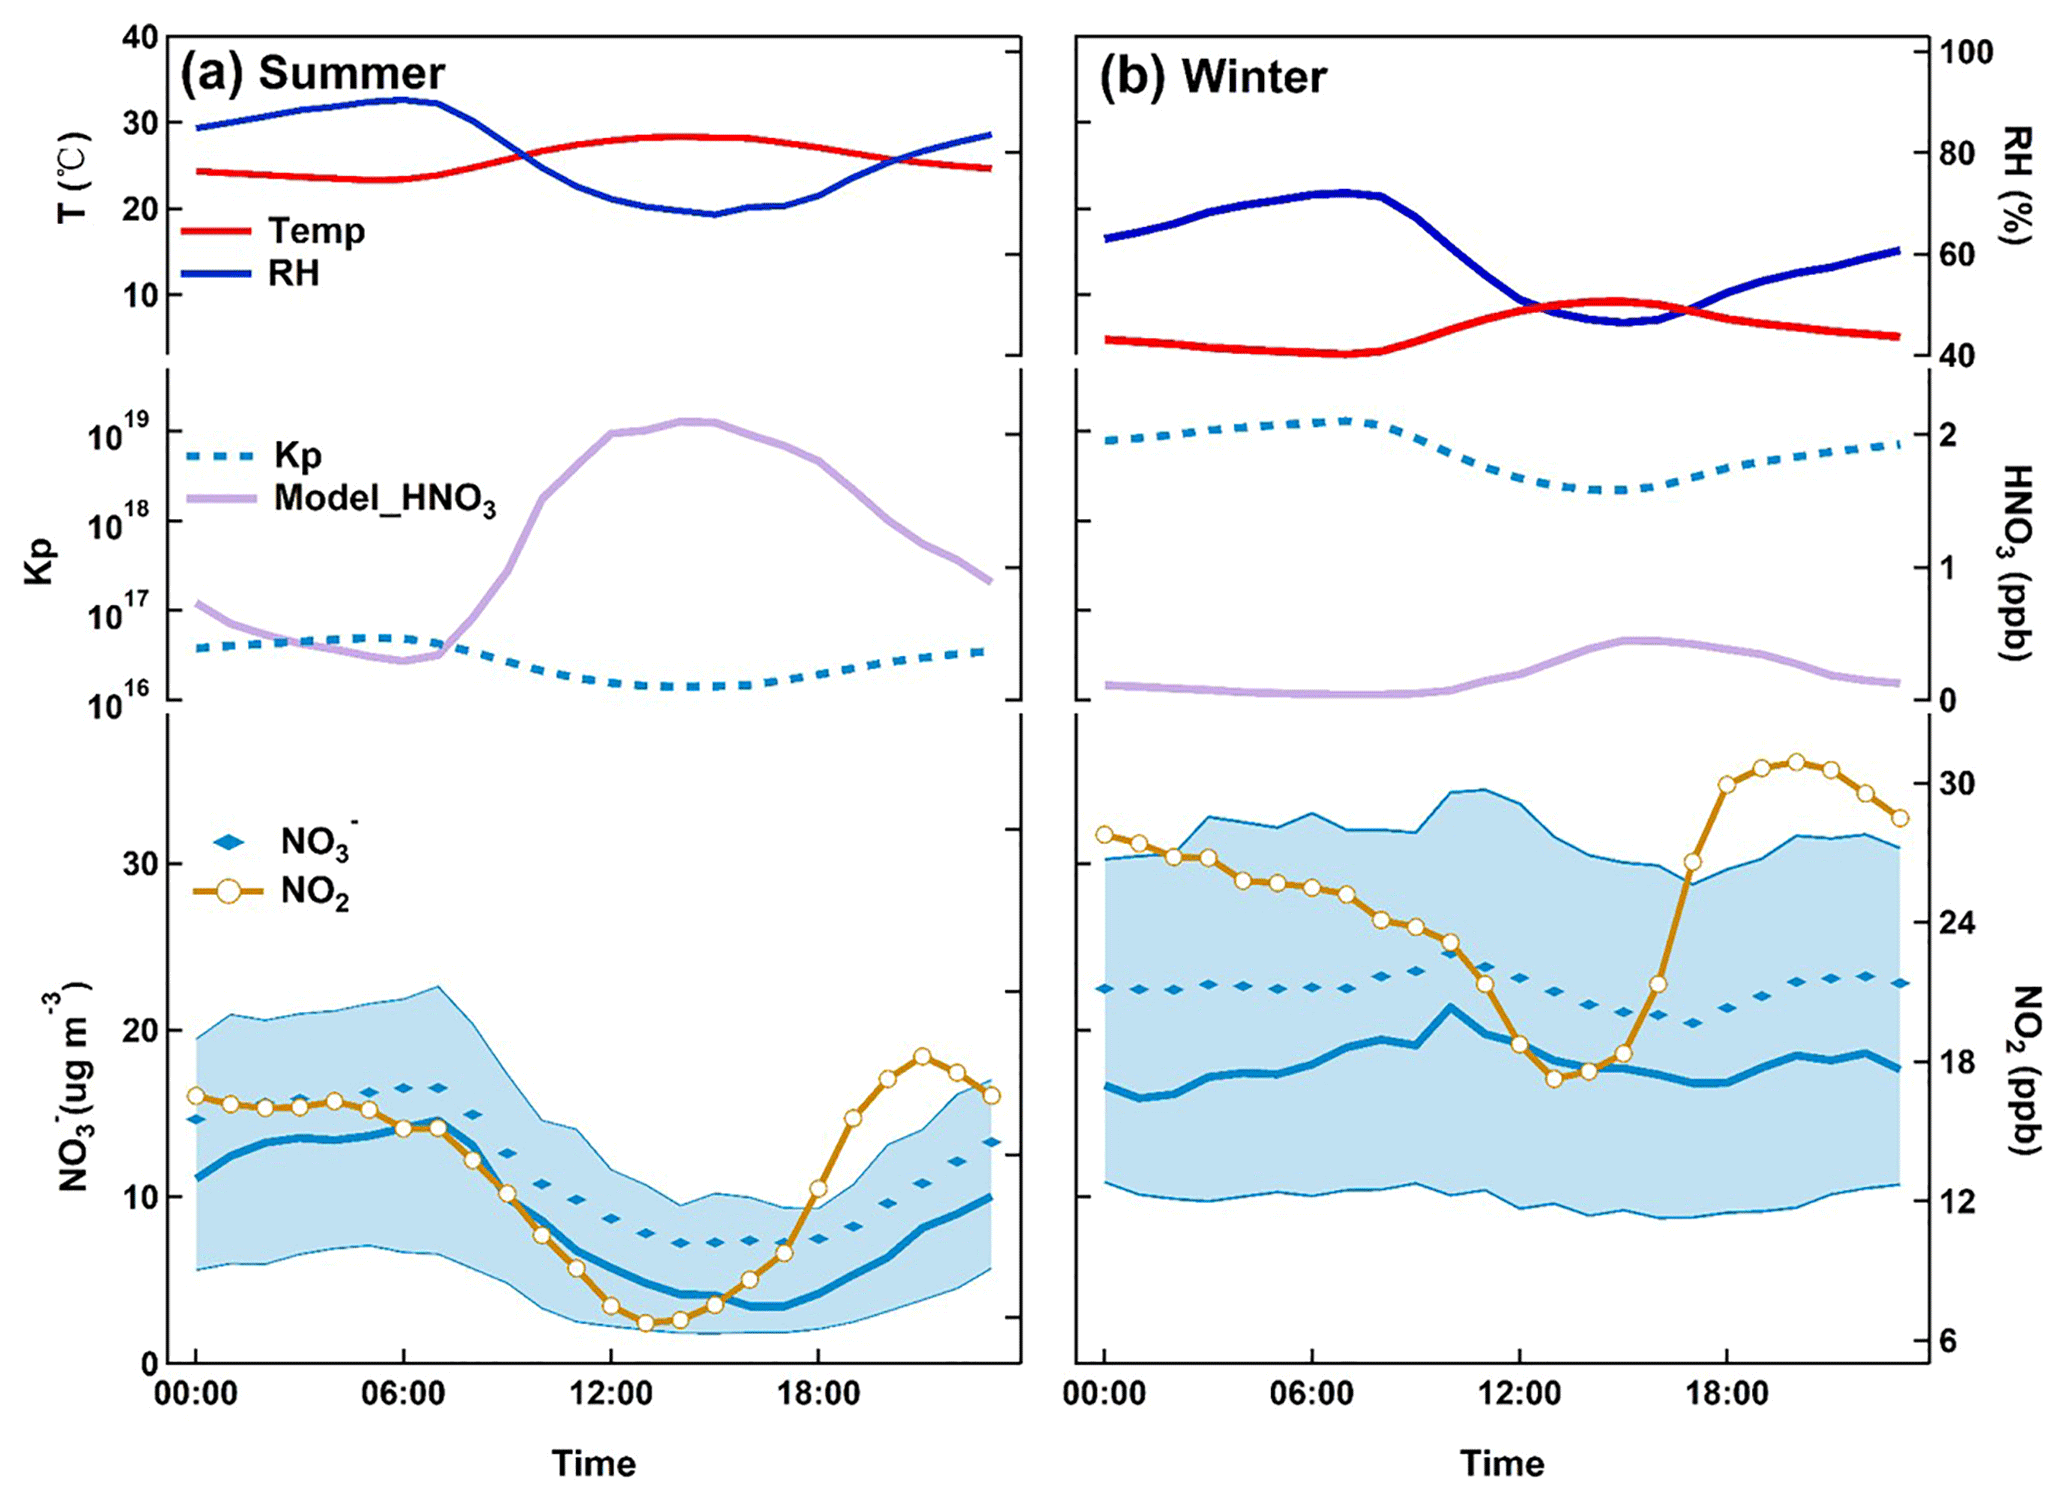
Figure 5Diurnal variation of particulate nitrate in (a) summer and (b) winter. For nitrate, bold solid lines are the median values, shaded areas represent percentiles of 75 % and 25 % and diamonds represent mean values. Diurnal averages of NO2 and modeled nitric acid mass concentrations are also provided with temperature and RH.
3.2.2 Diurnal cycles during summer and winter
In Fig. 5, we show the averaged diurnal variations of particulate nitrate, nitrogen dioxide, nitric acid, equilibrium constant (K), air temperature and RH during summer and winter during the 2 years. Nitric acid was calculated using ISORROPIA II. In summer (Fig. 5a), the fine particulate nitrate showed a typical diurnal cycle in which the maximum concentration occurred at 07:00, with an average concentration of 16.5 µg m−3 and a minimum value at 14:00 (7.2 µg m−3). This summertime diurnal pattern of nitrate is very similar to the findings in Shandong (Wen et al., 2015) and New York (Sun et al., 2011). However, it is quite different from the findings in Hong Kong (Griffith et al., 2015), where nitrate concentration peaks in the daytime in summer. Ambient temperature and the development of boundary layer are the major drivers to the observed diurnal variation of particulate nitrate, and high temperature and high boundary layer during daytime lead to evaporation and dilution of the particulate nitrate (Y. Zhang et al., 2015; Ding et al., 2016b). Nitric acid, which accounted for 20 % of the total nitrate , revealed its high concentration (around 2 ppb) in the noontime (12:00–15:00). NO2, the precursor of nitrate, showed a peak concentration of 18.2 ppb at 21:00, and remained at a high level during the whole night. The equilibrium constant, K, was calculated to understand the influence of gas–particulate partitioning on the observed diurnal variation of particulate nitrate (Sun et al., 2011). As shown in Fig. 5a, K showed the same diurnal pattern as particulate nitrate, suggesting the thermodynamics is the major factor influencing the diurnal variation of particle nitrate during summer.
In winter, the diurnal variation is small with a moderate peak at around 10:00. Compared to that in summer, K showed similar diurnal variation, but was not correlated to particulate nitrate, indicating factors other than the control of temperature. The observed peak in the late morning was probably due to downward mixing from the residual layer where particulate nitrate was formed aloft during the night and brought to the surface after sunrise following the breakup of the boundary layer (Baasandorj et al., 2017; Young et al., 2016; Pusede et al., 2016). Direct vertical observations are needed to further investigate this issue.
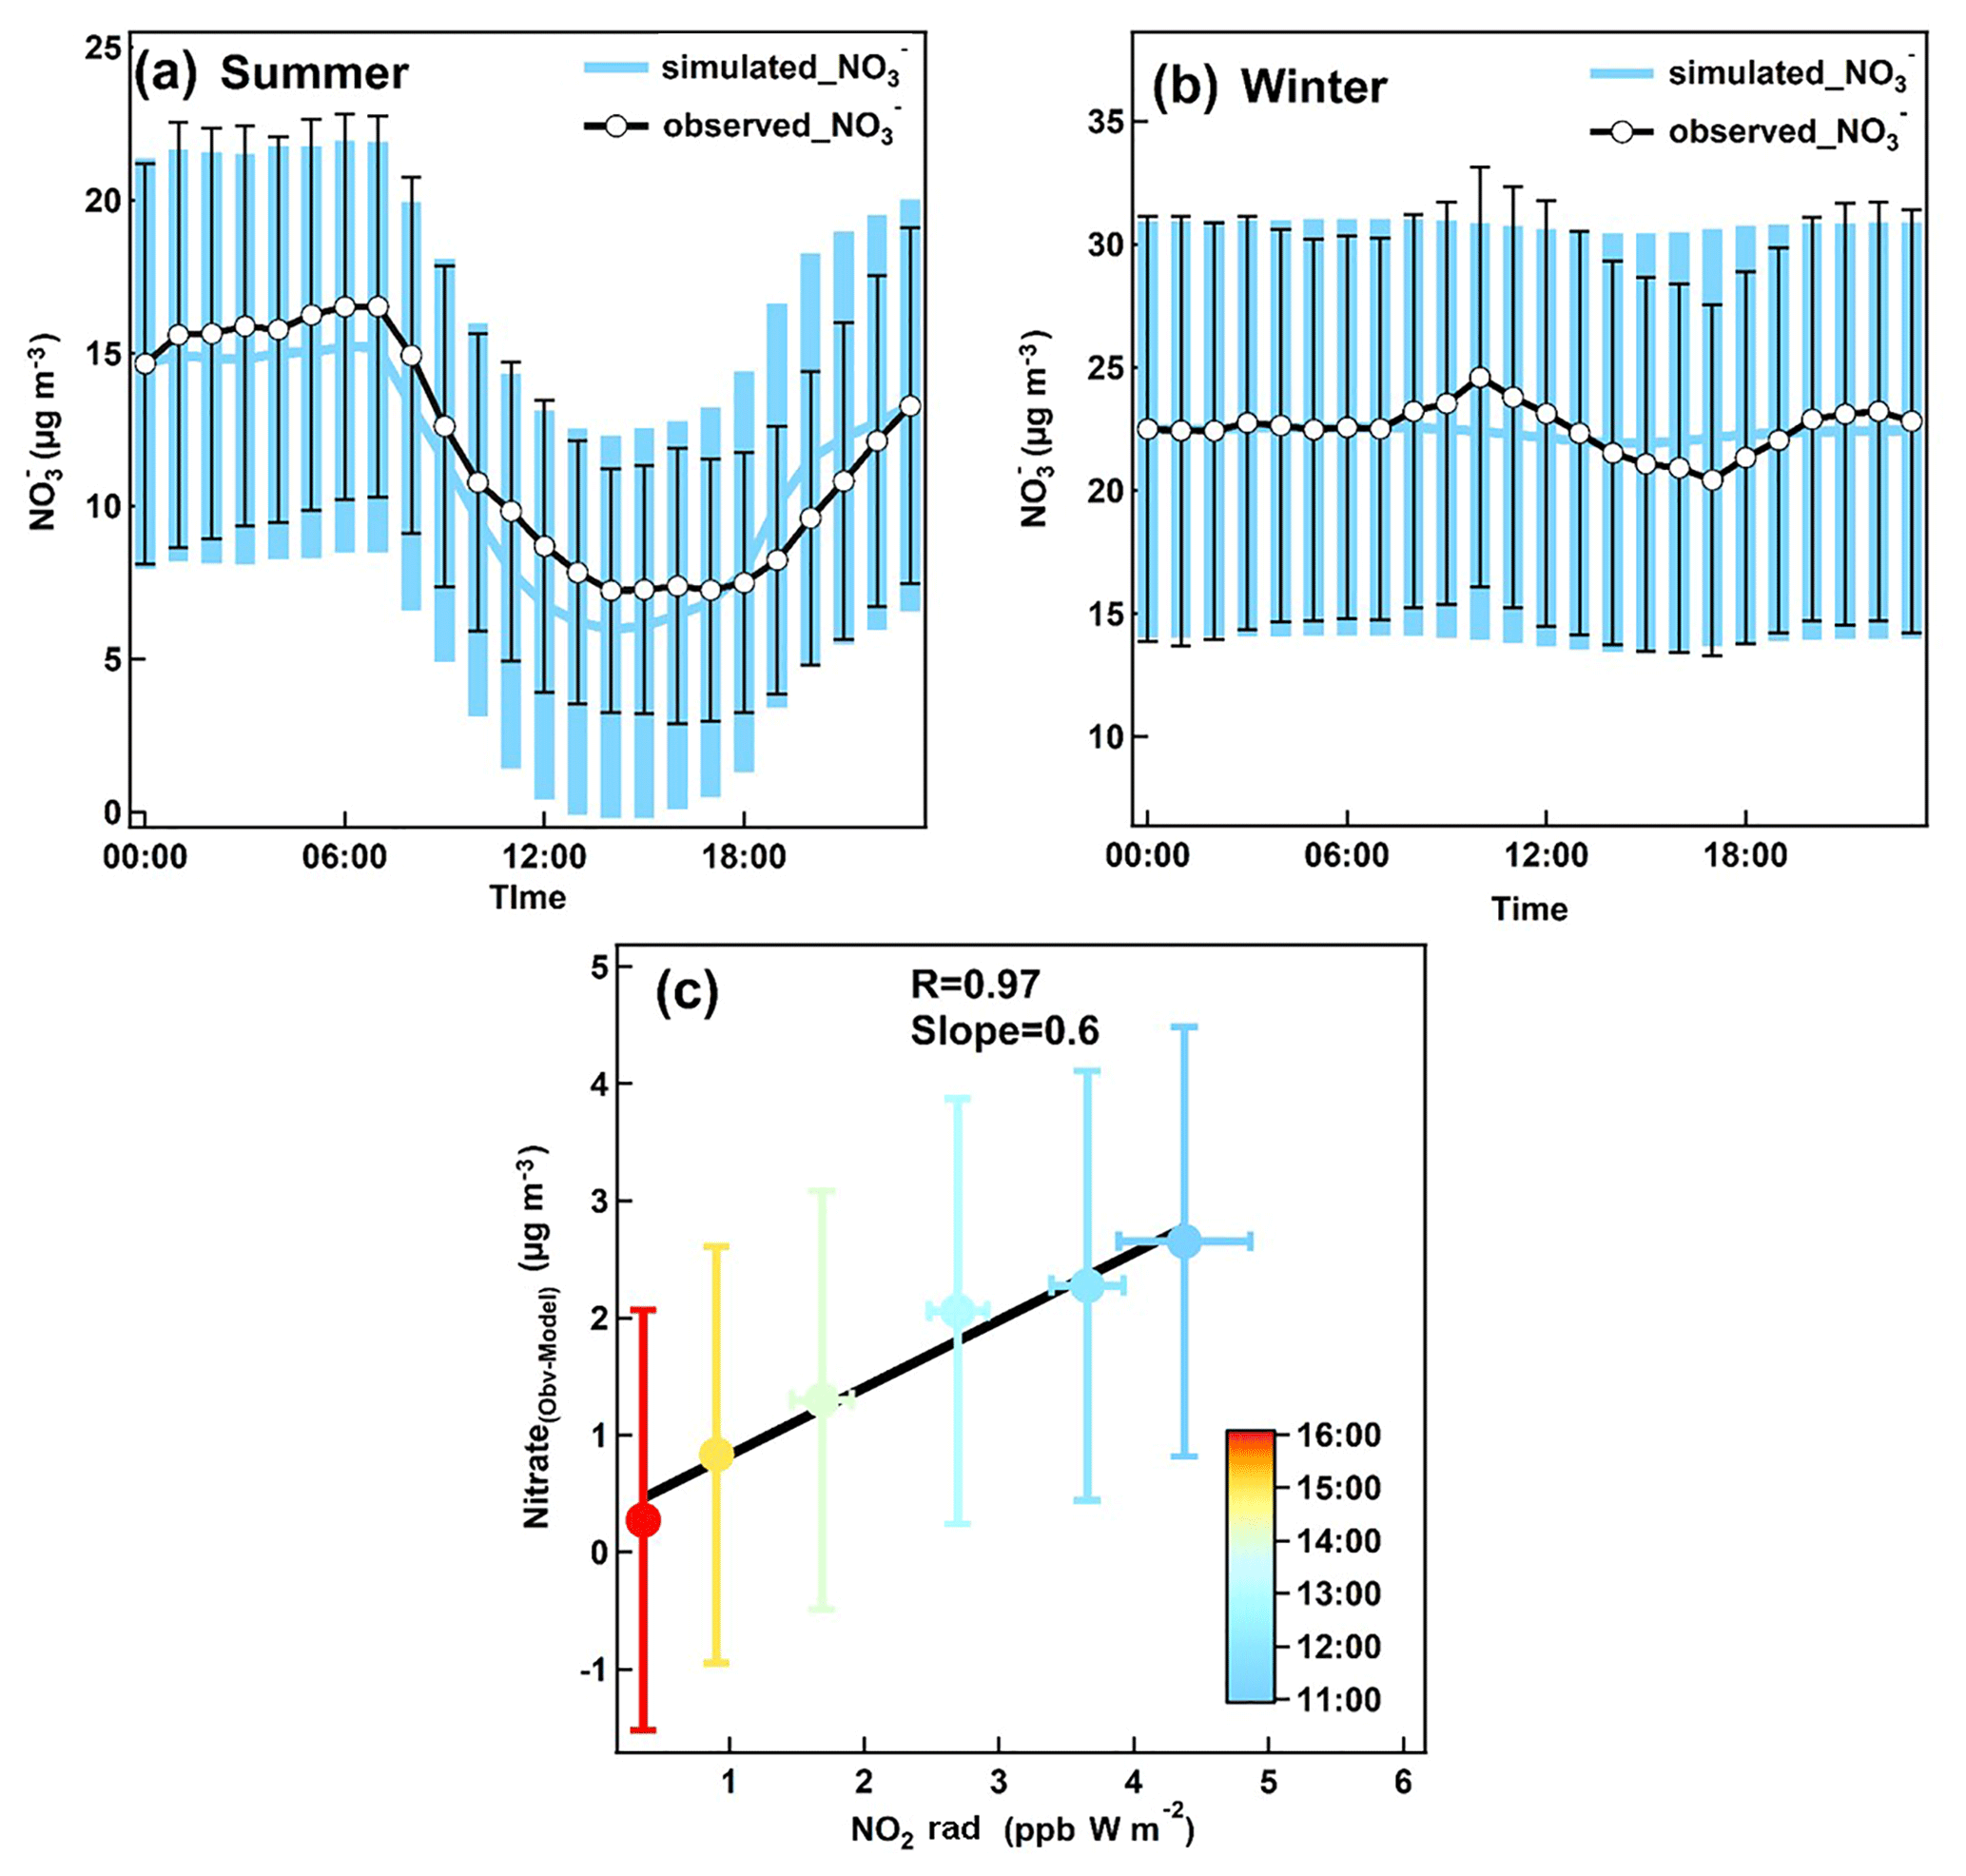
Figure 6Modeled nitrate diurnal variations in (a) summer and (b) winter, together with the observed nitrate concentrations. Error bars provided are the standard deviation of the mean at each hourly interval. (c) Scatter plot of the difference between model and observed nitrate average mass concentrations with the product of NO2 and radiation color coded by the hour of day for the samples.
To further investigate factors influencing the nitrate behaviors other than thermodynamics, ISORROPIA II was used to simulate the diurnal variation of nitrate. Hourly concentrations of all species (both gas- and aerosol-phase species) at 00:00 were used as the initial value of each specific day. Hourly data of temperature and relative humidity were used as the input data to constrain the model. The ISORROPIA II model was set in forward mode and a metastable phase state. The calculated diurnal variations are shown in Fig. 6 together with the observed results.
The differences between the calculation and the observation could be attributed to (1) the development of boundary layer, (2) the dry deposition of nitric acid and (3) chemical processes, which has not been considered yet in the model. As shown in Fig. 6a, the overall diurnal pattern of nitrate in summer is well captured by the model except for three periods. The differences after midnight are likely caused by the effect of the boundary layer height and some chemical processes. Faster increase of model nitrate after 18:00 was attributed to a lack of dry deposition of nitric acid in the model. During noontime the observed nitrate concentration was expected to be lower than the calculated value because of the development of the boundary layer and the stronger dry deposition of nitric acid associated with stronger turbulence mixing, which were neglected in the model. However, in contrast, the observation was considerably higher than the calculated value. It indicates a strong production of nitrate via photochemical processes in summer. Figure 6c shows that the difference between calculated and observed nitrate concentration had a good correlation with the product of NO2 and solar radiation, a proxy for the production rate of nitric acid (Zhang et al., 2005; Young et al., 2016), further suggesting that photo-oxidation of NO2 is an important source of nitrate during summer, even though thermodynamic equilibrium is the dominate factor controlling the diurnal cycle. Wen et al. (2018) also demonstrated that photochemical production of nitric acid is a major contributor to daytime nitrate increase during summer in North China Plain. In winter, the influence of thermodynamics on diurnal cycle is small due to the relatively low temperature throughout the day. The peaks in the morning may be caused by the mixing down of a residual layer enriched in nitrate as mentioned above, while the decline during the afternoon is supposed to be the result of dilution associated with the boundary layer development.
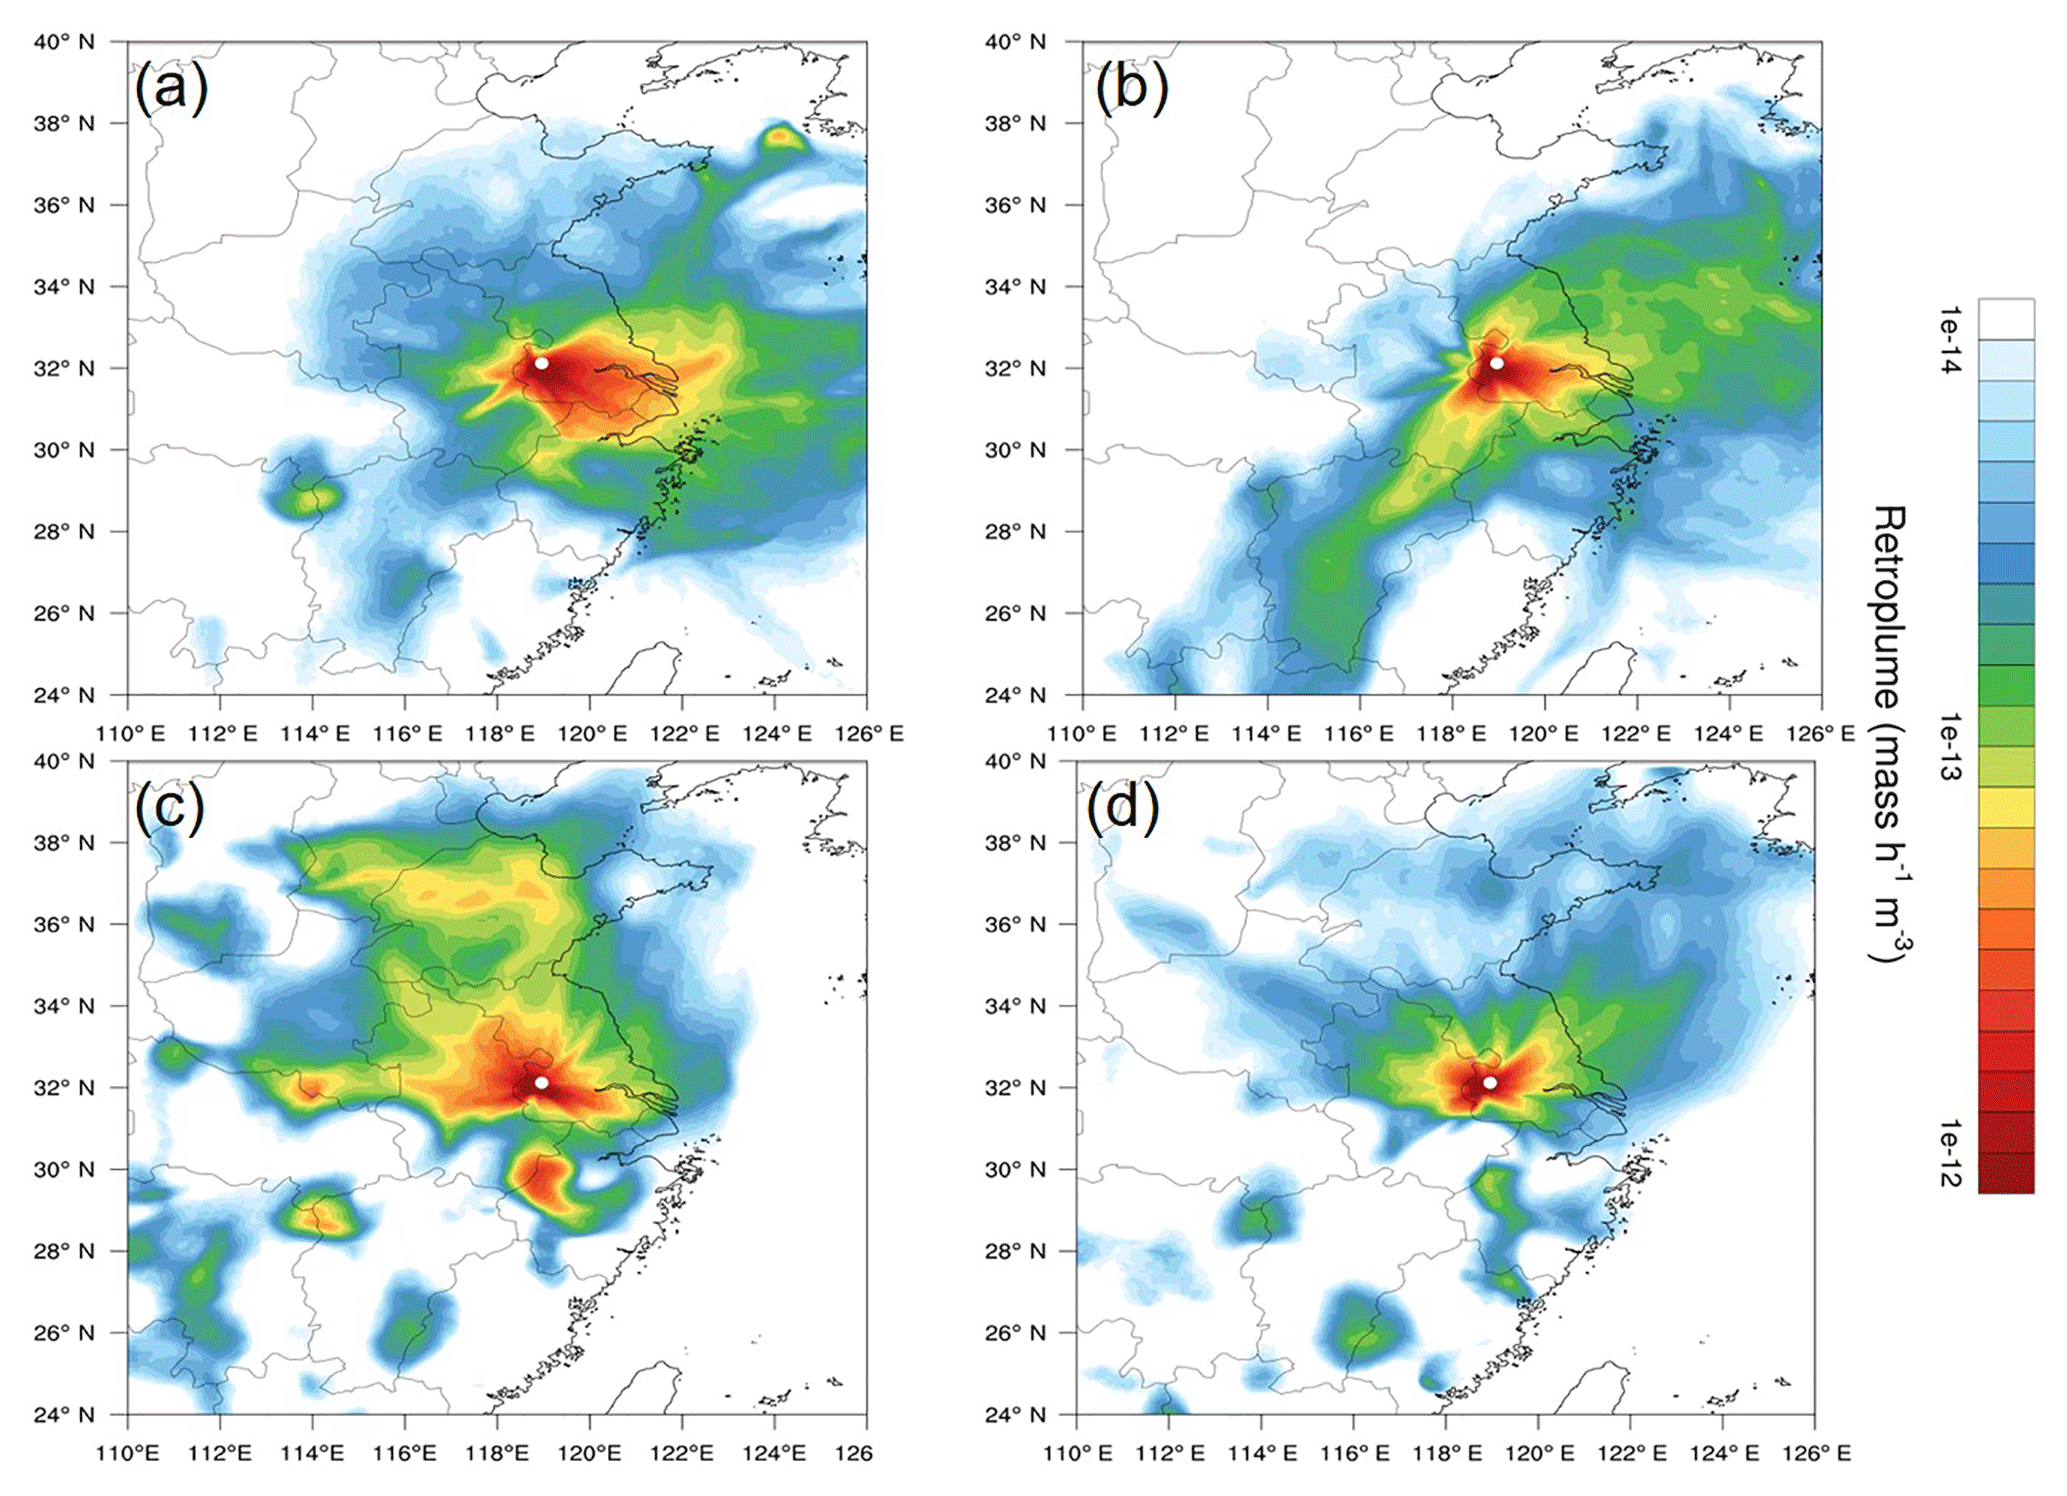
Figure 7The averaged retroplumes (i.e., 100 m footprint) of the selected events: (a) top 25 % nitrate concentrations in summer, (b) bottom 25 % nitrate concentrations in summer, (c) top 25 % nitrate concentrations in winter and (d) bottom 25 % nitrate concentrations in winter.
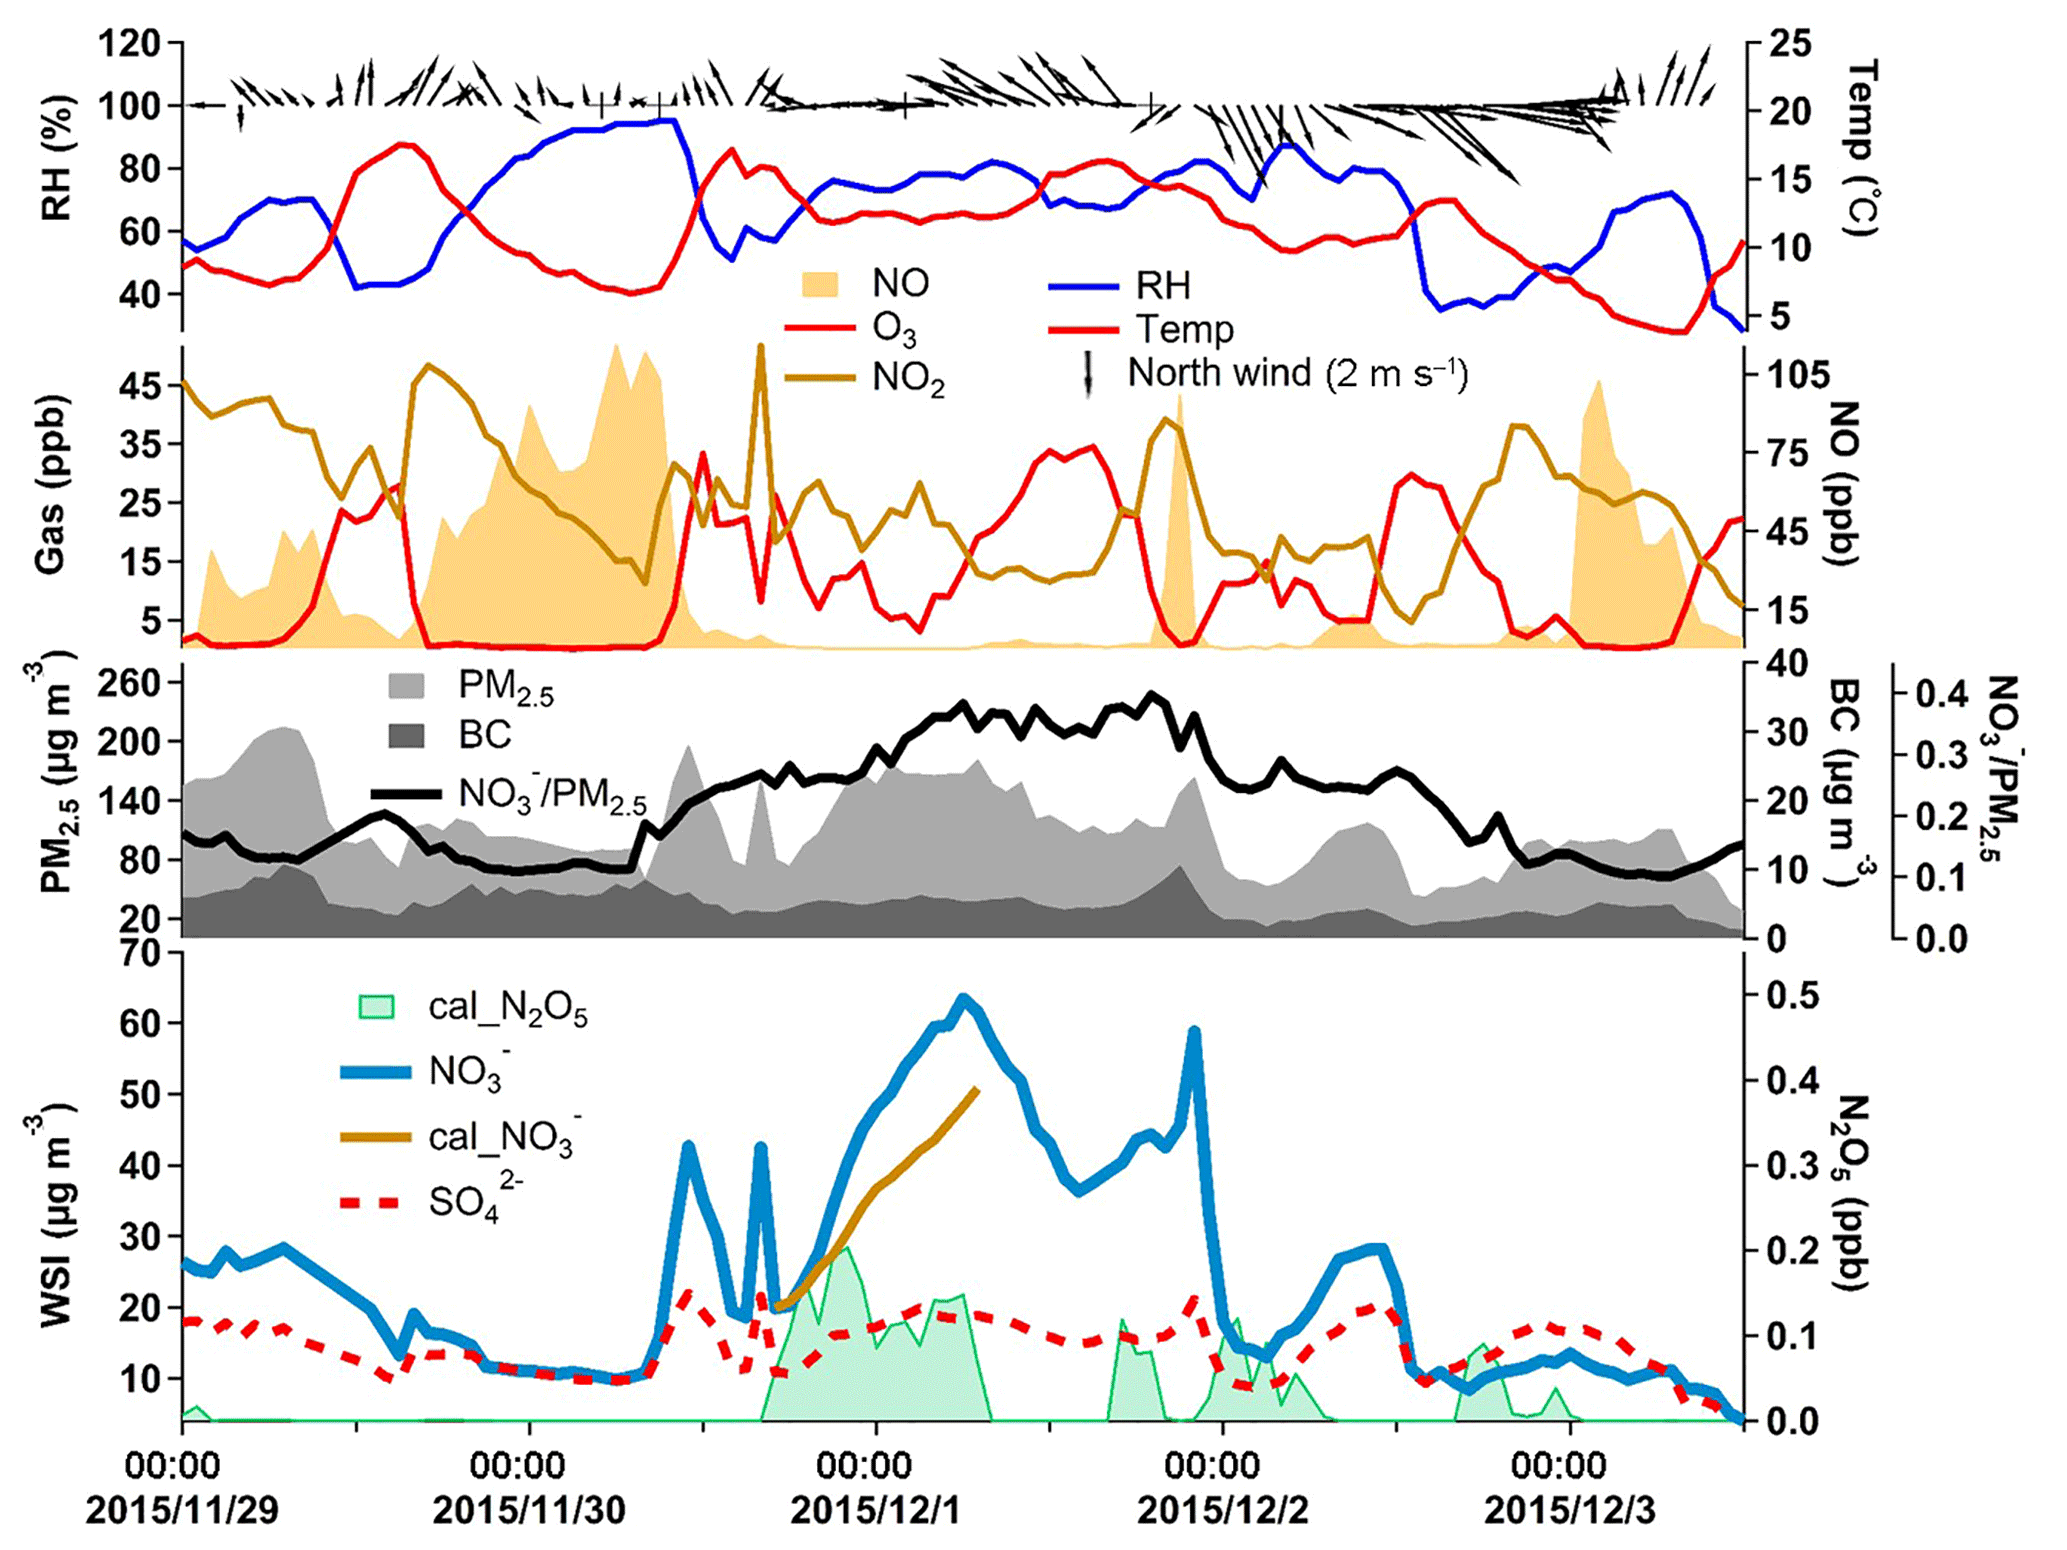
Figure 8Time series of meteorological data and the concentrations of trace gases related to nitrate formation during 29 November to 3 December 2015. Cal_ represents the nitrate concentrations calculated from the hydrolysis of N2O5.
3.2.3 Influence of air mass transport
Meteorological processes play a key role in air mass long-range transport and local accumulation (Ding et al., 2013a, c, 2016a; Zhang et al., 2016). In order to investigate the influence of air mass transport on nitrate concentrations, Lagrangian dispersion modeling was conducted for the sampling days with the top and bottom 25 % nitrate concentrations in summer and winter, respectively (Ding et al., 2013a). Figure 7 shows the retroplumes, i.e., footprint at an altitude of 100 m, of the selected days during summer and winter, respectively. In summer, high concentrations of nitrate tended to be associated with the air masses from the west of Nanjing (mostly Anhui Province) and the YRD (Suzhou–Shanghai city clusters and northern Zhejiang Province) (Fig. 7a). The YRD is a high NOx emission region (Fig. 1), from which air masses could bring a high concentration of NOx to enhance the nitrate concentration at the SORPES station. Biomass burning is the possible cause of the high nitrate loading with air mass from the west of Nanjing (Fig. S4). In winter, regional transport from northern China played an important role in enhancing nitrate concentrations. As shown in Fig. 8c, a large part of air masses for the highest 25 % sampling days was from the North China Plain, which has the strongest NOx emission in China (Fig. 1). It should be noted here that the longer lifetime of particulate nitrate during winter might be the main cause that promoted the contribution of regional transport to the observed nitrate at SORPES. In contrast, the lowest 25 % sampling days during winter tended to be accompanied by the air mass from Nanjing local and marine areas.
3.3 Contribution of N2O5 hydrolysis to nitrate episodes
Similar to findings from previous studies (Y. W. Zhang et al., 2015), nitrate was found to increase significantly during this study and become the largest contributor of PM2.5 during the haze episodes (Fig. 2). Generally, these pollution episodes mainly occurred in winter (Figs. 3a and 4), during which the photochemical production of nitric acid should be weak. N2O5 hydrolysis was thus proposed to be a potential important formation pathway. Here we investigated the nitrate episodes in detail and discussed their relationship to the N2O5 hydrolysis during the nights before.
In Fig. 8, we show a typical case of nitrate episodes from 30 November to 2 December 2015. Fast nitrate formation was observed, which was likely caused by hydrolysis of N2O5. Nitrate increased significantly from 20.3 µg m−3 at 18:00 of 30 November to 63 µg m−3 at 06:00 of 1 December 2015. The ratio of nitrate to PM2.5 also exhibited a large increase from 25 % at 18:00 to 38 % at 06:00. In contrast, other PM2.5 components, e.g., sulfate and black carbon, showed only slight increases. A high concentration of NO2, a considerable level of O3 and an extremely low concentration of NO provided favorable conditions for forming NO3 and N2O5 (Brown et al., 2003). The meteorological conditions during these 12 h were stable with low wind speed and high relative humidity, which, combined with the relatively high concentration of PM, would promote the hydrolysis of N2O5 (Riemer, 2003).
N2O5 concentrations were calculated using steady-state approximation (Osthoff et al., 2006; Wang et al., 2014; Wen et al., 2015), and the result is shown in Fig. 8. The calculated N2O5 exhibited a much higher concentration during the night of 30 November compared to the days before and after. Particulate nitrate formed from N2O5 hydrolysis was then computed during the 12 h period. Nitrate concentration at 18:00 of 30 November 2015 (20 µg m−3) was selected as the initial value, and 31 µg m−3 of particulate nitrate was produced in the following 12 h, suggesting that approximately 80 % of increased particulate nitrate can be attributed to the hydrolysis of N2O5 in this case.
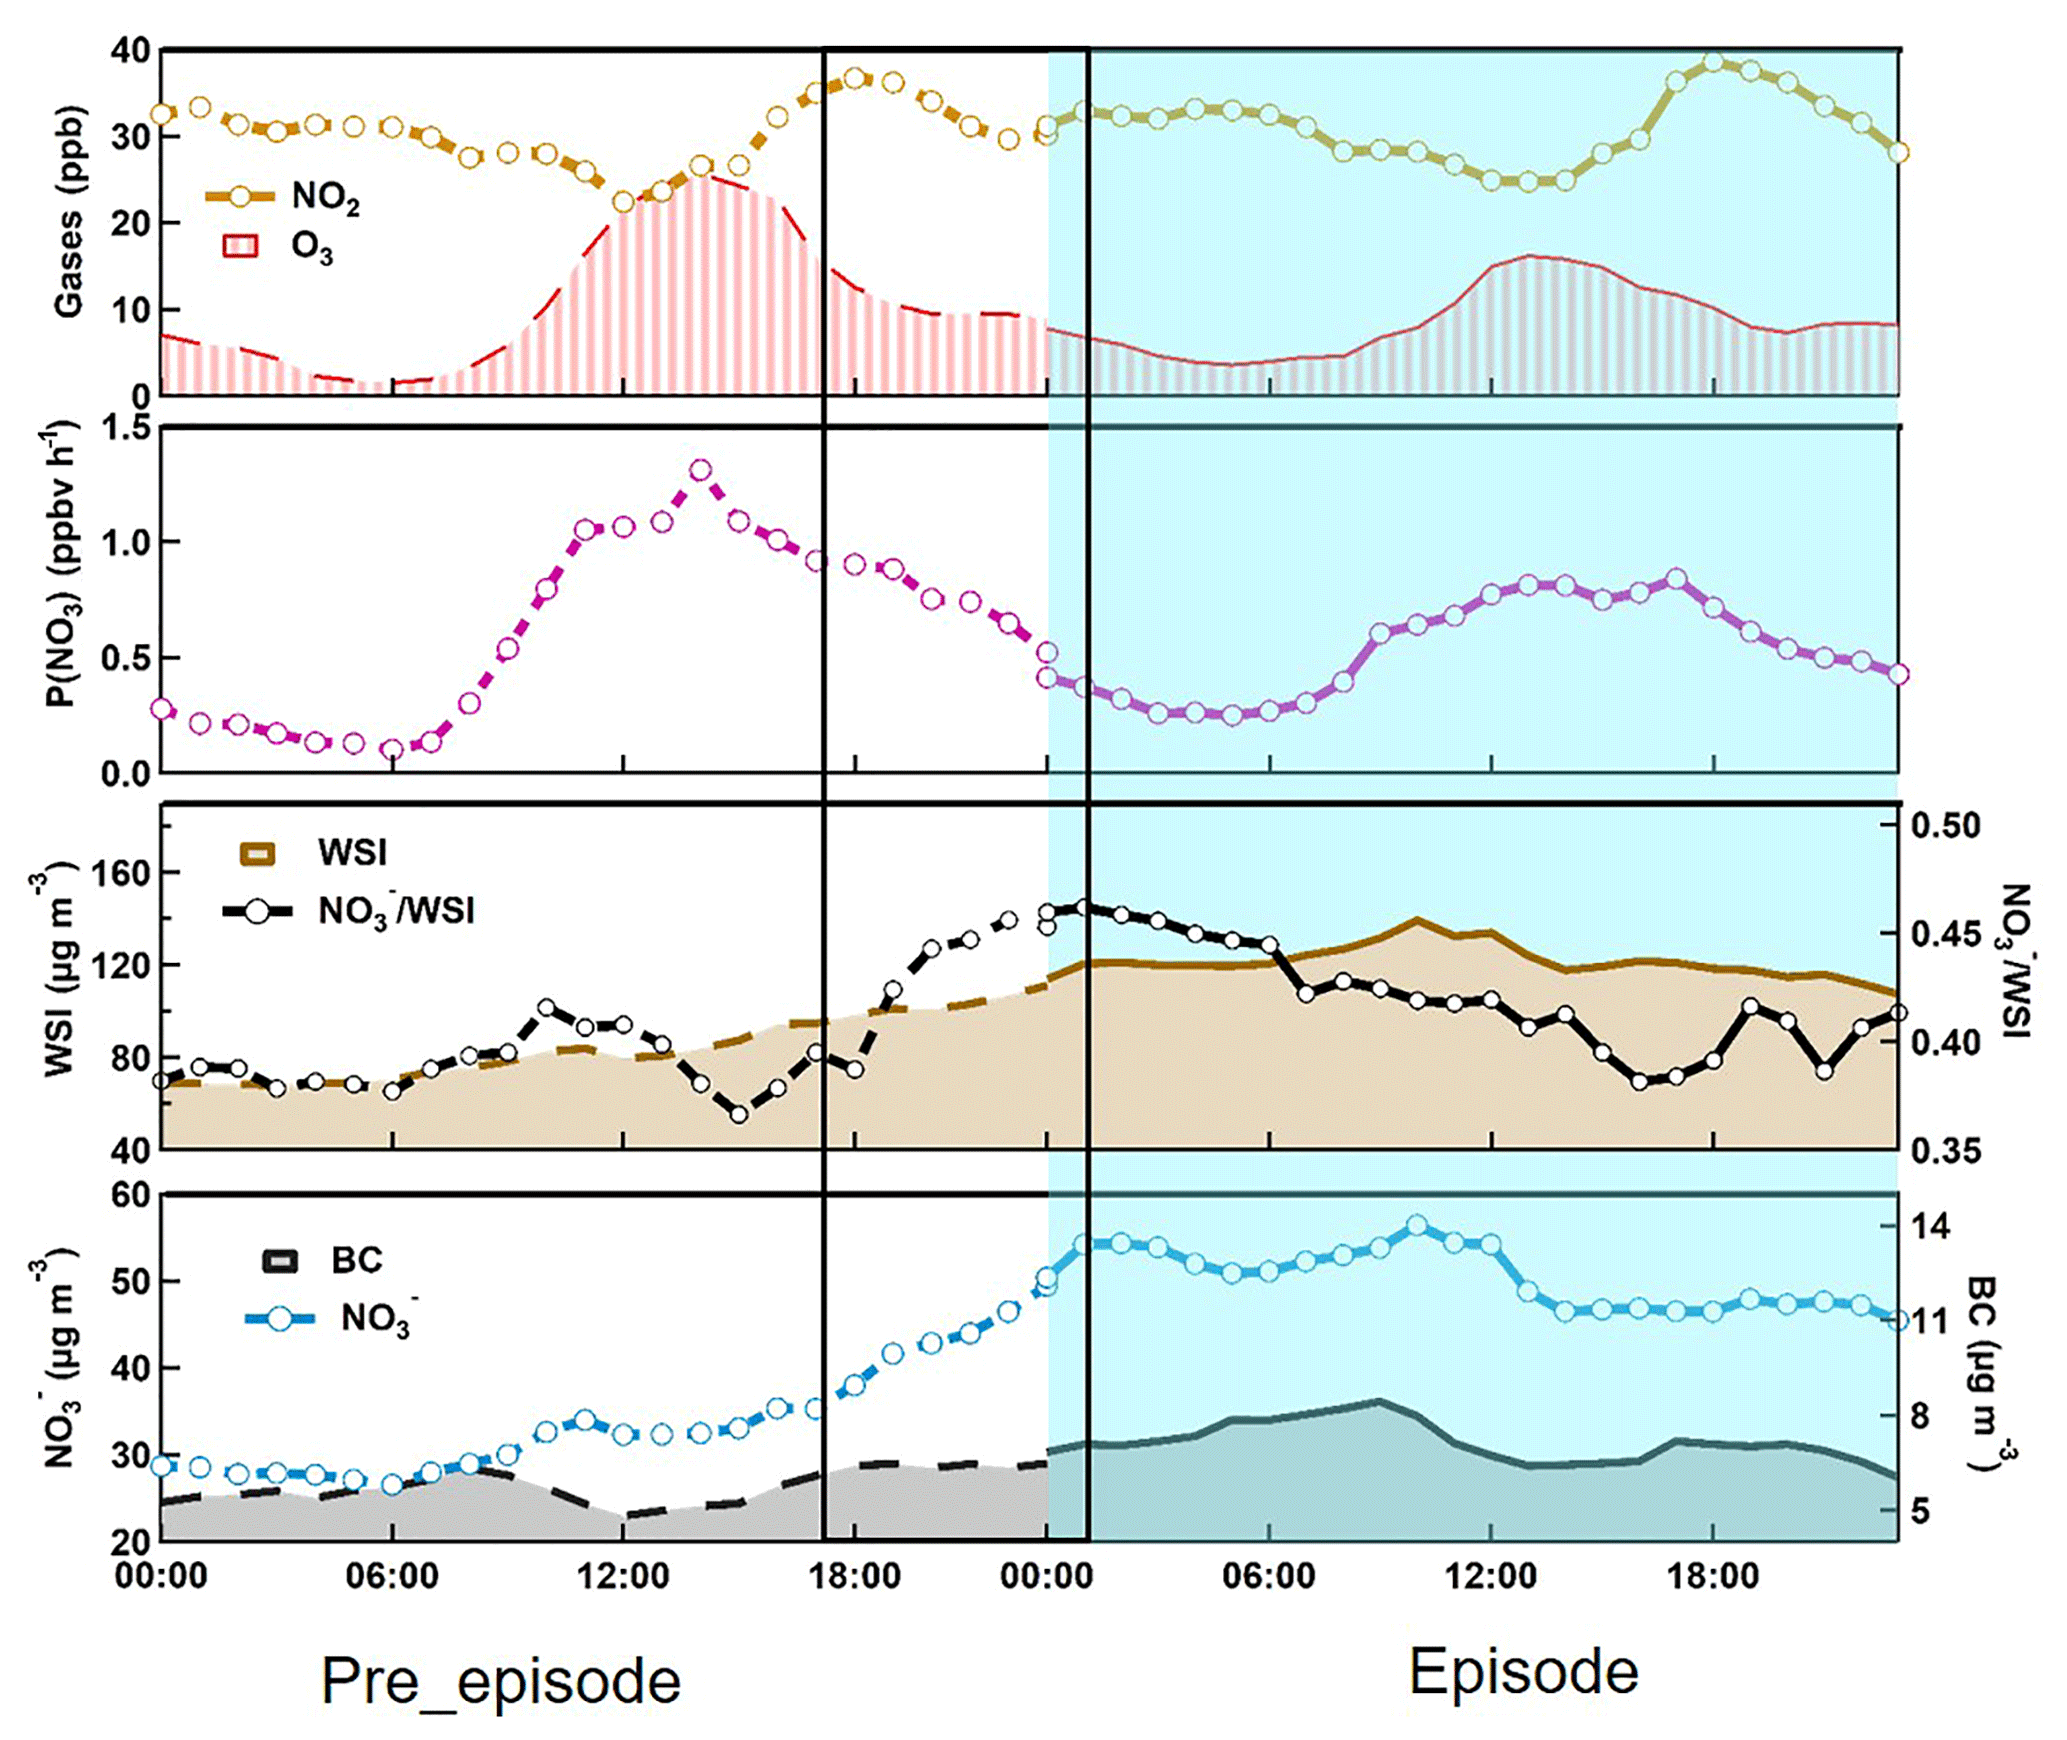
Figure 9Diurnal variations of particulate nitrate, black carbon, the total water-soluble ions, nitrate to WSI ratio, P (NO3), NO2 and O3 averaged for nitrate episode days with exceedances of 1 mean plus 2 standard deviations. The left side shows the pre-episode days and the right side shows the episode days during the winter of the entire 2-year period. The solid line box corresponds to the rapid growth of nitrate at night. It should be noted that P(NO3) is calculated by the product of NO2 and O3 multiplied by the rate constant k1 of NO2+O3 reaction.
To further understand the contribution of N2O5 hydrolysis, sampling days with daily-averaged nitrate concentration exceeding the mean plus twice the standard deviation were selected as the nitrate episode days. In total, 18 episode days were selected during the 2-year measurement, with 16 days in winter and the other 2 days in the biomass burning season. In Fig. 9, we present the averaged diurnal pattern of particulate nitrate and its related parameters on the 18 selected episode and pre-episode days. For the episode days, particulate nitrate revealed a similar diurnal pattern to that of the whole winter (Fig. 5). Nitrate maintained a high concentration during the whole day, with a small peak around 10:00 in the morning. However, for the pre-episode days, a clear buildup of nitrate can be observed, especially during the nighttime from 17:00 of the pre-episode days to 01:00 of the episode days (as marked in Fig. 9). The average increment of ammonium nitrate exceeded 24 µg m−3 during this 9 h period of the pre-episode nighttime. The total WSI also increased during this period, which was mostly attributed to ammonium nitrate (almost 90 %) and resulted in an evident increase of the ratio of nitrate to total WSI. Compared to nitrate, black carbon, a tracer of primary emissions, showed little change during the pre-episode day. The retroplume shown in Fig. S5 suggests that the air masses that arrived at the SORPES station on the pre-episode and episode days were almost the same. These results suggest that secondary formation other than accumulation was the major contributor to the observed increase of particulate nitrate.
Since the observed nitrate formation mostly occurred during the nighttime of pre-episode days when the photochemical production of nitric acid would be largely suppressed, N2O5 hydrolysis is thus believed to be the major contributor. As showed in Fig. 9, compared to those during episode days, NO2 concentration was comparable with the average concentrations of 28 ppb, but the O3 concentration was higher during pre-episode days. This resulted in a higher production rate of N2O5 proxy (PNO3) in pre-episode days, and favored the formation of nitrate from the hydrolysis of N2O5. We further calculated the contribution of N2O5 hydrolysis to nitrate formation during the periods from 17:00 to 23:00 of each pre-episode day (excluding two windy days). A good correlation (R=0.8) was observed between the calculated nitrate and observed nitrate (Fig. 10), with a slope of 0.77, indicating that the observed nitrate formation during nitrate episodes was significantly attributed to the hydrolysis of N2O5. It should be noted that this calculation suffered from considerable uncertainties due to the variability of actual VOC concentrations and the N2O5 uptake coefficient. The detailed uncertainty calculation is discussed in the Supplement (Fig. S1).
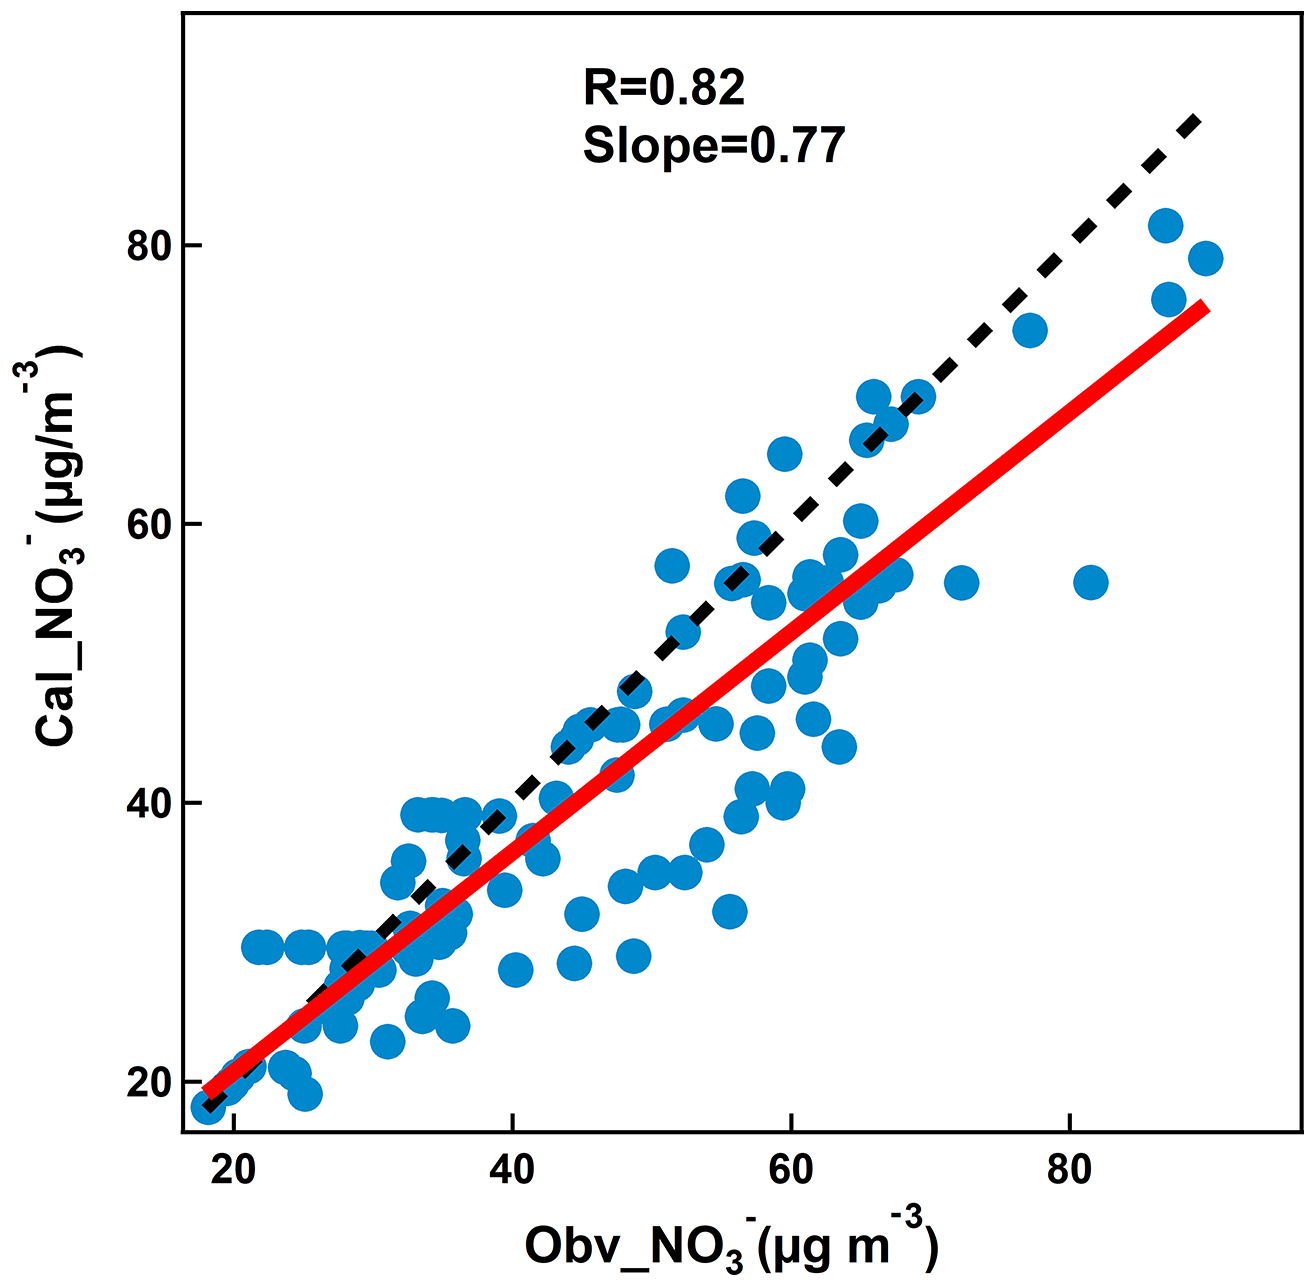
Figure 10Scatter plot of calculated nitrate concentrations and observed nitrate concentrations from 17:00 to 23:00 of each episode.
Online measurements of fine particulate nitrate along with trace gases and PM2.5 mass concentrations were conducted for 2 years from March 2014 to February 2016 using MARGA at the SORPES station, a rural receptor site in the Yangtze River Delta, eastern China. Hourly nitrate concentration varied from 0.5 to 92.6 µg m−3, with an averaged value of 15.8 µg m−3, which was generally higher than the measurement at the sites in the YRD and the PRD, but lower than that at the sites in the NCP. The contribution of nitrate to total WSI increased from 25 % with WSI concentrations lower than 20 µg m−3 to 40 % when WSI was higher than 140 µg m−3, suggesting a major driver of nitrate to the aerosol pollution in the YRD. NH3 is enough to neutralize the acidic compounds of aerosol, and ammonium nitrate was thus the predominate form of the observed particulate nitrate. A clear seasonal variation of nitrate was observed, with peak values in January and December and the lowest values in August and September. Biomass burning plumes contributed to the nitrate concentration evidently and resulted in a secondary peak during June. In summer, thermodynamic equilibrium was the major factor influencing the diurnal variation of nitrate, and it resulted in a much lower concentration at noontime. Nevertheless, the observed nitrate at noontime was considerably higher than the value predicted by the ISORROPIA II model, indicating a strong production of nitrate through the photo-oxidation of NO2. Air masses from YRD and the biomass burning region were associated with high nitrate concentrations during summer. In winter, the diurnal variation of nitrate was weak. Regional transport from the North China Plain contributed largely to the observed high nitrate concentrations.
Nitrate episodes, defined as daily-averaged concentration exceeding the mean value plus twice the standard deviation, were further investigated to understand the chemical processes towards forming particulate nitrate and their contribution to pollution episodes. A clear buildup of nitrate can be observed during the pre-episode night, which dominated the increase of total WSI. N2O5 hydrolysis was demonstrated to contribute 80 % of the observed nitrate formation, suggesting its critical role in an aerosol pollution episode. In view of the significant emission of NO, which is the main sink of N2O5 during the night, stronger production of N2O5 is expected in the upper boundary layer, e.g., residual layer, and this residual-layer N2O5 will contribute to the nitrate formation in the entire boundary layer. In summary, our study provides evidence that particulate nitrate, especially that formed from N2O5 hydrolysis, is a crucial contributor to aerosol pollution episodes in eastern China.
The GDAS data used in the HYSPLIT calculation can be acquired from ftp://arlftp.arlhq.noaa.gov/pub/archives/gdas1, last access: 13 January 2018. Measurement data at SORPES, including aerosol data and relevant trace gases as well as meteorological data, are available upon request from the corresponding author before the SORPES database is open to the public.
The supplement related to this article is available online at: https://doi.org/10.5194/acp-18-17177-2018-supplement.
AD designed the study. PS and WN contributed to the measurements, data analysis, and the first draft of this paper. WN, XC, YX, ZhengX, XQ, ZhengnX, LW, and TW participated in observation at SORPES. AD, WN, XH, and QZ contributed to analysis, modeling, and the editing of the paper.
The authors declare that they have no conflict of interest.
This article is part of the special issue “Multiphase chemistry of secondary aerosol formation under severe haze”. It is not associated with a conference.
The research was supported by the National Key Research & Development Program
of China (2016YFC0200500) and the National Science Foundation of China
(41725020, 41505109, 91644218, 41675145).
Edited by: Daniel Knopf
Reviewed by: two anonymous referees
Aldener, M., Brown, S. S., Stark, H., Williams, E. J., Lerner, B. M., Kuster, W. C., Goldan, P. D., Quinn, P. K., Bates, T. S., Fehsenfeld, F. C., and Ravishankara, A. R.: Reactivity and loss mechanisms of NO3 and N2O5 in a polluted marine environment: Results from in situ measurements during New England Air Quality Study 2002, J. Geophys. Res.-Atmos., 111, D23S73, https://doi.org/10.1029/2006JD007252, 2006.
Baasandorj, M., Hoch, S. W., Bares, R., Lin, J. C., Brown, S. S., Millet, D. B., Martin, R., Kelly, K., Zarzana, K. J., Whiteman, C. D., Dube, W. P., Tonnesen, G., Jaramillo, I. C., and Sohl, J.: Coupling between Chemical and Meteorological Processes under Persistent Cold-Air Pool Conditions: Evolution of Wintertime PM2.5 Pollution Events and N2O5 Observations in Utah's Salt Lake Valley, Environ. Sci. Technol., 51, 5941–5950, https://doi.org/10.1021/acs.est.6b06603, 2017.
Bian, Q., Huang, X. H. H., and Yu, J. Z.: One-year observations of size distribution characteristics of major aerosol constituents at a coastal receptor site in Hong Kong – Part 1: Inorganic ions and oxalate, Atmos. Chem. Phys., 14, 9013–9027, https://doi.org/10.5194/acp-14-9013-2014, 2014.
Brown, S. S. and Stutz, J.: Nighttime radical observations and chemistry, Chem. Soc. Rev., 41, 6405–6447, 2012.
Brown, S. S., Stark, H., Ryerson, T. B., Williams, E. J., Nicks, D. K., Trainer, M., Fehsenfeld, F. C., and Ravishankara, A. R.: Nitrogen oxides in the nocturnal boundary layer: Simultaneous in situ measurements of NO3, N2O5, NO2, NO, and O3, J. Geophys. Res.-Atmos., 108, 4299, https://doi.org/10.1029/2002JD002917, 2003.
Brown, S. S., Ryerson, T. B., Wollny, A. G., Brock, C. A., Peltier, R., Sullivan, A. P., Weber, R. J., Dube, W. P., Trainer, M., Meagher, J. F., Fehsenfeld, F. C., and Ravishankara, A. R.: Variability in nocturnal nitrogen oxide processing and its role in regional air quality, Science, 311, 67–70, 2006.
Brown, S. S., Dubé, W. P., Osthoff, H. D., Wolfe, D. E., Angevine, W. M., and Ravishankara, A. R.: High resolution vertical distributions of NO3 and N2O5 through the nocturnal boundary layer, Atmos. Chem. Phys., 7, 139–149, https://doi.org/10.5194/acp-7-139-2007, 2007.
Calvert, J. G. and Stockwell, W. R.: Acidic generation in the troposphere by gas phase chemistry, Environ. Sci. Technol., 17, 428–443, 1983.
Charlson, R. and Heintzenberg, J.: Aerosol Forcing of Climate Environmental Sciences Research Report, 1995.
Ding, A. J., Wang, T., and Fu, C.: Transport characteristics and origins of carbon monoxide and ozone in Hong Kong, South China, J. Geophys. Res.-Atmos., 118, 9475–9488, https://doi.org/10.1002/jgrd.50714, 2013a.
Ding, A. J., Fu, C. B., Yang, X. Q., Sun, J. N., Petäjä, T., Kerminen, V.-M., Wang, T., Xie, Y., Herrmann, E., Zheng, L. F., Nie, W., Liu, Q., Wei, X. L., and Kulmala, M.: Intense atmospheric pollution modifies weather: a case of mixed biomass burning with fossil fuel combustion pollution in eastern China, Atmos. Chem. Phys., 13, 10545–10554, https://doi.org/10.5194/acp-13-10545-2013, 2013b.
Ding, A. J., Fu, C. B., Yang, X. Q., Sun, J. N., Zheng, L. F., Xie, Y. N., Herrmann, E., Nie, W., Petäjä, T., Kerminen, V.-M., and Kulmala, M.: Ozone and fine particle in the western Yangtze River Delta: an overview of 1 yr data at the SORPES station, Atmos. Chem. Phys., 13, 5813–5830, https://doi.org/10.5194/acp-13-5813-2013, 2013c.
Ding, A. J., Huang, X., Nie, W., Sun, J. N., Kerminen, V.-M., Petaja, T., Su, H., Cheng, Y. F., Yang, X.-Q., Wang, M. H., Chi, X. G., Wang, J. P., Virkkula, A., Guo, W. D., Yuan, J., Wang, S. Y., Zhang, R. J., Wu, Y. F., Song, Y., Zhu, T., Zilitinkevich, S., Kulmala, M., and Fu, C. B.: Ehanced haze pollution by black carbon in megacities in China, Geophys. Res. Lett., 43, 2873–2879, 2016a.
Ding, A. J., Nie, W., Huang, X., Chi, X., Sun, J., Kerminen,V.-M., Xu, Z., Guo, W., Petäjä, T., Yang, X., Kulmala, M., and Fu, C.: Long-term observation of air pollution-weather/climate interactions at the SORPES station: a review and outlook, Front. Environ. Sci. Eng., 10, 15, https://doi.org/10.1007/s11783-016-0877-3, 2016b.
Du, H., Kong, L., Cheng, T., Chen, J., Du, J., Li, L., Xia, X., Leng, C., and Huang, G.: Insights into summertime haze pollution events over Shanghai based on online water-soluble ionic composition of aerosols, Atmos. Environ., 45, 5131–5137, https://doi.org/10.1016/j.atmosenv.2011.06.027, 2011.
Fountoukis, C. and Nenes, A.: ISORROPIA II: a computationally efficient thermodynamic equilibrium model for K+–Ca2+–Mg2+––Na+–––Cl−–H2O aerosols, Atmos. Chem. Phys., 7, 4639–4659, https://doi.org/10.5194/acp-7-4639-2007, 2007.
Griffith, S. M., Huang, X. H. H., Louie, P. K. K., and Yu, J. Z.: Characterizing the thermodynamic and chemical composition factors controlling PM2.5 nitrate: Insights gained from two years of online measurements in Hong Kong, Atmos. Environ., 122, 864–875, https://doi.org/10.1016/j.atmosenv.2015.02.009, 2015.
Hu, W., Hu, M., Hu, W.-W., Zheng, J., Chen, C., Wu, Y., and Guo, S.: Seasonal variations in high time-resolved chemical compositions, sources, and evolution of atmospheric submicron aerosols in the megacity Beijing, Atmos. Chem. Phys., 17, 9979–10000, https://doi.org/10.5194/acp-17-9979-2017, 2017.
Hua, Y., Cheng, Z., Wang, S., Jiang, J., Chen, D., Cai, S., Fu, X., Fu, Q., Chen, C., Xu, B., and Yu, J.: Characteristics and source apportionment of PM2.5 during a fall heavy haze episode in the Yangtze River Delta of China, Atmos. Environ., 123, 380–391, https://doi.org/10.1016/j.atmosenv.2015.03.046, 2015.
IPCC: Climate Change 2013: The Physical Science Basis. Contribution of Working Group I to the Fifth Assessment Report of the Intergovernmental Panel on Climate Change, edited by: Stocker, T., Dahe, Q., and Plattner, G.-K., Cambridge University Press, Cambridge, UK and New York, NY, USA, 2013.
John, W., Wall, S. M., and Ondo, J. L.: A New Method for Nitric-Acid and Nitrate Aerosol Measurement Using the Dichotomous Sampler, Atmos. Environ., 22, 1627–1635, 1988.
Knopf, D. A., Forrester, S. M., and Slade, J. H.: Heterogeneous oxidation kinetics of organic biomass burning aerosol surrogates by O3, NO2, N2O5, and NO3, Phys. Chem. Chem. Phys., 13, 21050–21062, 2011.
Lei, H. and Wuebbles, D. J.: Chemical competition in nitrate and sulfate formations and its effect on air quality, Atmos. Environ., 80, 472–477, https://doi.org/10.1016/j.atmosenv.2013.08.036, 2013.
Li, H., Zhang, Q., Zhang, Q., Chen, C., Wang, L., Wei, Z., Zhou, S., Parworth, C., Zheng, B., Canonaco, F., Prévôt, A. S. H., Chen, P., Zhang, H., Wallington, T. J., and He, K.: Wintertime aerosol chemistry and haze evolution in an extremely polluted city of the North China Plain: significant contribution from coal and biomass combustion, Atmos. Chem. Phys., 17, 4751–4768, https://doi.org/10.5194/acp-17-4751-2017, 2017.
Nie, W., Wang, T., Gao, X., Pathak, R. K., Wang, X., Gao, R., Zhang, Q., Yang, L., and Wang, W.: Comparison among filter-based, impactor-based and continuous techniques for measuring atmospheric fine sulfate and nitrate, Atmos. Environ., 44, 4396–4403, https://doi.org/10.1016/j.atmosenv.2010.07.047, 2010.
Nie, W., Wang, T., Wang, W., Wei, X., and Liu, Q.: Atmospheric concentrations of particulate sulfate and nitrate in Hong Kong during 1995–2008: Impact of local emission and super-regional transport, Atmos. Environ., 76, 43–51, 2013.
Nie, W., Ding, A. J., Xie, Y. N., Xu, Z., Mao, H., Kerminen, V.-M., Zheng, L. F., Qi, X. M., Huang, X., Yang, X.-Q., Sun, J. N., Herrmann, E., Petäjä, T., Kulmala, M., and Fu, C. B.: Influence of biomass burning plumes on HONO chemistry in eastern China, Atmos. Chem. Phys., 15, 1147–1159, https://doi.org/10.5194/acp-15-1147-2015, 2015.
Osthoff, H. D., Sommariva, R., Baynard, T., Pettersson, A., Williams, E. J., Lerner, B. M., Roberts, J. M., Stark, H., Goldan, P. D., Kuster, W. C., Bates, T. S., Coffman, D., Ravishankara, A. R., and Brown, S. S.: Observation of daytime N2O5 in the marine boundary layer during New England Air Quality Study-Intercontinental Transport and Chemical Transformation 2004, J. Geophys. Res.-Atmos., 111, D23S14, https://doi.org/10.1029/2006jd007593, 2006.
Pathak, R. K., Wu, W. S., and Wang, T.: Summertime PM2.5 ionic species in four major cities of China: nitrate formation in an ammonia-deficient atmosphere, Atmos. Chem. Phys., 9, 1711–1722, https://doi.org/10.5194/acp-9-1711-2009, 2009.
Pathak, R. K., Wang, T., and Wu, W. S.: Nighttime enhancement of PM2.5 nitrate in ammonia-poor atmospheric conditions in Beijing and Shanghai: Plausible contributions of heterogeneous hydrolysis of N2O5 and HNO3 partitioning, Atmos. Environ., 45, 1183–1191, https://doi.org/10.1016/j.atmosenv.2010.09.003, 2011.
Petetin, H., Sciare, J., Bressi, M., Gros, V., Rosso, A., Sanchez, O., Sarda-Estève, R., Petit, J.-E., and Beekmann, M.: Assessing the ammonium nitrate formation regime in the Paris megacity and its representation in the CHIMERE model, Atmos. Chem. Phys., 16, 10419–10440, https://doi.org/10.5194/acp-16-10419-2016, 2016.
Pusede, S. E., Duffey, K. C., Shusterman, A. A., Saleh, A., Laughner, J. L., Wooldridge, P. J., Zhang, Q., Parworth, C. L., Kim, H., Capps, S. L., Valin, L. C., Cappa, C. D., Fried, A., Walega, J., Nowak, J. B., Weinheimer, A. J., Hoff, R. M., Berkoff, T. A., Beyersdorf, A. J., Olson, J., Crawford, J. H., and Cohen, R. C.: On the effectiveness of nitrogen oxide reductions as a control over ammonium nitrate aerosol, Atmos. Chem. Phys., 16, 2575–2596, https://doi.org/10.5194/acp-16-2575-2016, 2016.
Riemer, N.: Impact of the heterogeneous hydrolysis of N2O5 on chemistry and nitrate aerosol formation in the lower troposphere under photosmog conditions, J. Geophys. Res., 108, 4144, https://doi.org/10.1029/2002jd002436, 2003.
Rumsey, I. C., Cowen, K. A., Walker, J. T., Kelly, T. J., Hanft, E. A., Mishoe, K., Rogers, C., Proost, R., Beachley, G. M., Lear, G., Frelink, T., and Otjes, R. P.: An assessment of the performance of the Monitor for AeRosols and GAses in ambient air (MARGA): a semi-continuous method for soluble compounds, Atmos. Chem. Phys., 14, 5639–5658, https://doi.org/10.5194/acp-14-5639-2014, 2014.
Seinfeld, J. H. and Pandis, S. N.: Atmospheric Chemistry and Physics: From Air Pollution to Climate Change, John Wiley & Sons, New York, 2nd edn., 13, 1232 pp., 978-0-471-72018-8, 2006.
Sharma, M., Kishore, S., Tripathi, S. N., and Behera, S. N.: Role of atmospheric ammonia in the formation of inorganic secondary particulate matter: A study at Kanpur, India, J. Atmos. Chem., 58, 1–17, https://doi.org/10.1007/s10874-007-9074-x, 2007.
Shen, Y., Virkkula, A., Ding, A., Wang, J., Chi, X., Nie, W., Qi, X., Huang, X., Liu, Q., Zheng, L., Xu, Z., Petäjä, T., Aalto, P. P., Fu, C., and Kulmala, M.: Aerosol optical properties at SORPES in Nanjing, east China, Atmos. Chem. Phys., 18, 5265–5292, https://doi.org/10.5194/acp-18-5265-2018, 2018.
Shi, Y., Chen, J., Hu, D., Wang, L., Yang, X., and Wang, X.: Airborne submicron particulate (PM1) pollution in Shanghai, China: chemical variability, formation/dissociation of associated semi-volatile components and the impacts on visibility, Sci. Total Environ., 473–474, 199–206, https://doi.org/10.1016/j.scitotenv.2013.12.024, 2014.
Sun, Y.-L., Zhang, Q., Schwab, J. J., Demerjian, K. L., Chen, W.-N., Bae, M.-S., Hung, H.-M., Hogrefe, O., Frank, B., Rattigan, O. V., and Lin, Y.-C.: Characterization of the sources and processes of organic and inorganic aerosols in New York city with a high-resolution time-of-flight aerosol mass apectrometer, Atmos. Chem. Phys., 11, 1581–1602, https://doi.org/10.5194/acp-11-1581-2011, 2011.
ten Brink, H., Otjes, R., Jongejan, P., and Slanina, S.: An instrument for semi-continuous monitoring of the size-distribution of nitrate, ammonium, sulphate and chloride in aerosol, Atmos. Environ., 41, 2768–2779, https://doi.org/10.1016/j.atmosenv.2006.11.041, 2007.
Thornton, J. A., Braban, C. F., and Abbatt, J. P. D.: N2O5 hydrolysis on sub-micron organic aerosols: the effect of relative humidity, particle phase, and particle size, Phys. Chem. Chem. Phys., 5, 4593–4603, 2003.
van der A, R. J., Mijling, B., Ding, J., Koukouli, M. E., Liu, F., Li, Q., Mao, H., and Theys, N.: Cleaning up the air: effectiveness of air quality policy for SO2 and NOx emissions in China, Atmos. Chem. Phys., 17, 1775–1789, https://doi.org/10.5194/acp-17-1775-2017, 2017.
Vayenas, D. V., Takahama, S., Davidson, C. I., and Pandis, S. N.: Simulation of the thermodynamics and removal processes in the sulfate-ammonia-nitric acid system during winter: Implications for PM2.5 control strategies, J. Geophys. Res.-Atmos., 110, D07S14, 2005.
Wang, D., Zhou, B., Fu, Q., Zhao, Q., Zhang, Q., Chen, J., Yang, X., Duan, Y., and Li, J.: Intense secondary aerosol formation due to strong atmospheric photochemical reactions in summer: observations at a rural site in eastern Yangtze River Delta of China, Sci. Total Environ., 571, 1454–1466, https://doi.org/10.1016/j.scitotenv.2016.06.212, 2016.
Wang, H., Lu, K., Chen, X., Zhu, Q., Chen, Q., Guo, S., Jiang, M., Li, X., Shang, D., Tan, Z., Wu, Y., Wu, Z., Zou, Q., Zheng, Y., Zeng, L., Zhu, T., Hu, M., and Zhang, Y.: High N2O5 Concentrations Observed in Urban Beijing: Implications of a Large Nitrate Formation Pathway, Environ. Sci. Tech. Let., 4, 416–420, https://doi.org/10.1021/acs.estlett.7b00341, 2017.
Wang, H. L., Qiao, L. P., Lou S. R., Zhou, M., Ding, A. J., Huang, H. Y., Chen, J. M., Wang, Q., Tao, S. K., Chen, C. H., Li, L., and Huang, C.: Chemical composition of PM2.5 and meterological impact among three years in urban Shanghai, China, J. Clean. Prod., 112, 1302–1311, 2016.
Wang, J., Ge, X., Chen, Y., Shen, Y., Zhang, Q., Sun, Y., Xu, J., Ge, S., Yu, H., and Chen, M.: Highly time-resolved urban aerosol characteristics during springtime in Yangtze River Delta, China: insights from soot particle aerosol mass spectrometry, Atmos. Chem. Phys., 16, 9109–9127, https://doi.org/10.5194/acp-16-9109-2016, 2016.
Wang, J., Zhao, B., Wang, S., Yang, F., Xing, J., Morawska, L., Ding, A., Kulmala, M., Kerminen, V.-M., Kujansuu, J., Wang, Z., Ding, D., Zhang, X., Wang, H., Tian, M., Petäjä, T., Jiang, J., and Hao, J.: Particulate matter pollution over China and the effects of control policies, Sci. Total Environ., 584, 426–447, 2017.
Wang, T., Nie, W., Gao, J., Xue, L. K., Gao, X. M., Wang, X. F., Qiu, J., Poon, C. N., Meinardi, S., Blake, D., Wang, S. L., Ding, A. J., Chai, F. H., Zhang, Q. Z., and Wang, W. X.: Air quality during the 2008 Beijing Olympics: secondary pollutants and regional impact, Atmos. Chem. Phys., 10, 7603–7615, https://doi.org/10.5194/acp-10-7603-2010, 2010.
Wang, T., Tham, Y. J., Xue, L. K., Li, Q. Y., Zha, Q. Z., Wang, Z., Poon, S. C. N., Dube, W. P., Blake, D. R., Louie, P. K. K., Luk, C. W. Y., Tsui, W., and Brown, S. S.: Observations of nitryl chloride and modeling its source and effect on ozone in the planetary boundary layer of southern China, J. Geophys. Res.-Atmos., 121, 2476–2489, https://doi.org/10.1002/2015JD024556, 2016d.
Wang, X. and Zhang, Y.: Particulate Nitrate Formation in a Highly Polluted Urban Area: A Case Study by Single-Particle Mass Spectrometry in Shanghai Environ. Sci. Technol., 43, 3061–3066, 2009.
Wang, X., Wang, H., Xue, L., Wang, T., Wang, L., Gu, R., Wang, W., Tham, Y. J., Wang, Z., Yang, L., Chen, J., and Wang, W.: Observations of N2O5 and ClNO2 at a polluted urban surface site in North China: High N2O5 uptake coefficients and low ClNO2 product yields, Atmos. Environ., 156, 125–134, https://doi.org/10.1016/j.atmosenv.2017.02.035, 2017.
Wang, X. F., Chen, J. M., Sun, J. F., Li, W. J., Yang, L. X., Wen, L., Wang, W. X., Wang, X. M., Collett, J. L., Shi, Y., Zhang, Q. Z., Hu, J. T., Yao, L., Zhu, Y. H., Sui, X., Sun, X. M., and Mellouki, A.: Severe haze episodes and seriously polluted fog water in Ji'nan, China, Sci. Total Environ., 493, 133–137, 2014.
Wen, L., Chen, J., Yang, L., Wang, X., Caihong, X., Sui, X., Yao, L., Zhu, Y., Zhang, J., Zhu, T., and Wang, W.: Enhanced formation of fine particulate nitrate at a rural site on the North China Plain in summer: The important roles of ammonia and ozone, Atmos. Environ., 101, 294–302, https://doi.org/10.1016/j.atmosenv.2014.11.037, 2015.
Wen, L., Xue, L., Wang, X., Xu, C., Chen, T., Yang, L., Wang, T., Zhang, Q., and Wang, W.: Summertime fine particulate nitrate pollution in the North China Plain: increasing trends, formation mechanisms and implications for control policy, Atmos. Chem. Phys., 18, 11261–11275, https://doi.org/10.5194/acp-18-11261-2018, 2018.
Xie, Y., Ding, A., and Nie, W.: Enhanced sulfate formation by nitrogen dioxide: Implications from in situ observations at the SORPES station, J. Geophys. Res.-Atmos., 120, 12679–12694, 2015.
Xue, J. and Yuan., Z.: Insights into factors afferting nitrate in PM2.5 in a polluted high NOx environment through hourly observations and size distribution measurements, J. Geophys. Res.-Atmos., 119, 4888–4902, 2013.
Yang, T., Sun, Y., Zhang, W., Wang, Z., Liu, X., Fu, P., and Wang, X.: Evolutionary processes and sources of high-nitrate haze episodes over Beijing, Spring, J. Environ. Sci. (China), 54, 142–151, https://doi.org/10.1016/j.jes.2016.04.024, 2017.
Young, D. E., Kim, H., Parworth, C., Zhou, S., Zhang, X., Cappa, C. D., Seco, R., Kim, S., and Zhang, Q.: Influences of emission sources and meteorology on aerosol chemistry in a polluted urban environment: results from DISCOVER-AQ California, Atmos. Chem. Phys., 16, 5427–5451, https://doi.org/10.5194/acp-16-5427-2016, 2016.
Zhang, Q., Canagaratna, M. R., Jayne, J. T., Worsnop, D. R., and Jimenez, J. L.: Time- and size-resolved chemical composition of submicron particles in Pittsburgh: Implications for aerosol sources and processes, J. Geophys. Res.-Atmos., 110, D07S09, https://doi.org/10.1029/2004JD004649, 2005.
Zhang, Y., Tang, L., Yu, H., Wang, Z., Sun, Y., Qin, W., Chen, W., Chen, C., Ding, A., Wu, J., Ge, S., Chen, C., and Zhou, H.-C.: Chemical composition, sources and evolution processes of aerosol at an urban site in Yangtze River Delta, China during wintertime, Atmos. Environ., 123, 339–349, https://doi.org/10.1016/j.atmosenv.2015.08.017, 2015.
Zhang, Y., Ding, A., Mao, H., Nie, W., Zhou, D., Liu, L., Huang, X., and Fu, C.: Impact of synoptic weather patterns and inter-decadal climate variability on air quality in the North China Plain during 1980–2013, Atmos. Environ., 124, 119–128, 2016.
Zhang, Y. W., Zhang, X. Y., Zhang, Y. M., Shen, X. J., Sun, J. Y., Ma, Q. L., Yu, X. M., Zhu, J. L., Zhang, L., and Che, H. C.: Significant concentration changes of chemical components of PM1 in the Yangtze River Delta area of China and the implications for the formation mechanism of heavy haze-fog pollution, Sci. Total Environ., 538, 7–15, https://doi.org/10.1016/j.scitotenv.2015.06.104, 2015.