the Creative Commons Attribution 4.0 License.
the Creative Commons Attribution 4.0 License.
 | 03 Dec 2018
Application of a hygroscopicity tandem differential mobility analyzer for characterizing PM emissions in exhaust plumes from an aircraft engine burning conventional and alternative fuels
Prem Lobo
Donald E. Hagen
Steven C. Achterberg
Wenyan Liu
Philip D. Whitefield
In the last several decades, significant efforts have been directed toward better understanding the gaseous and particulate matter (PM) emissions from aircraft gas turbine engines. However, limited information is available on the hygroscopic properties of aircraft engine PM emissions which play an important role in the water absorption, airborne lifetime, obscuring effect, and detrimental health effects of these particles. This paper reports the description and detailed lab-based performance evaluation of a robust hygroscopicity tandem differential mobility analyzer (HTDMA) in terms of hygroscopic properties such as growth factor (GF) and the hygroscopicity parameter (κ). The HTDMA system was subsequently deployed during the Alternative Aviation Fuel EXperiment (AAFEX) II field campaign to measure the hygroscopic properties of aircraft engine PM emissions in the exhaust plumes from a CFM56-2C1 engine burning several types of fuels. The fuels used were conventional JP-8, tallow-based hydroprocessed esters and fatty acids (HEFA), Fischer–Tropsch, a blend of HEFA and JP-8, and Fischer–Tropsch doped with tetrahydrothiophene (an organosulfur compound). It was observed that GF and κ increased with fuel sulfur content and engine thrust condition, and decreased with increasing dry particle diameter. The highest GF and κ values were found in the smallest particles, typically those with diameters of 10 nm.
- Article
(3599 KB) - Full-text XML
-
Supplement
(399 KB) - BibTeX
- EndNote


The increase in aviation related activities has led to concern about the emissions from aircraft operations and their impact on local air quality (Unal et al., 2005; Woody et al., 2011), global climate (Lee et al., 2009; Brasseur et al., 2016), and public health (Levy et al., 2012; Brunelle-Yeung et al., 2014). The primary products of conventional jet fuel combustion in an aircraft engine are NOx, unburned hydrocarbon (UHC), CO, SOx, CO2, H2O, and soot aerosol or soot particulate matter (PM). As the aircraft engine exhaust plume expands, mixes with ambient air, and cools, volatile species present in the gas phase at the engine exit plane undergo gas-to-particle conversion and begin to condense onto existing soot particles and form new particles (Onasch et al., 2009; Lobo et al., 2012; Timko et al., 2013). The black carbon component of the PM is referred to as non-volatile particulate matter (nvPM), while the volatile component consists of sulfates, nitrates, and organic compounds (Onasch et al., 2009). The composition of the volatile PM in the expanding aircraft engine exhaust plume varies greatly and depends on a number of factors such as fuel composition, ambient meteorological conditions, and plume age (Lobo et al., 2007, 2012, 2015a; Timko et al., 2013).
The commercial aviation sector has been focused on developing and implementing sustainable alternative jet fuels for use by airlines to diversify fuel supplies and mitigate the impacts of aircraft engine emissions. The American Society for Testing and Materials (ASTM) and other fuel specification bodies have established a standard specification for the manufacture of aviation turbine fuel consisting of conventional and synthetic blending components under ASTM D7566 (ASTM International, 2016). The pure alternative fuels have low to negligible amounts of aromatic, naphthalene, and sulfur content when compared to conventional jet fuel. Studies have shown that nvPM and sulfur oxide emissions are dramatically reduced during alternative fuel combustion in aircraft engines (Timko et al., 2010; Lobo et al., 2011, 2015b, 2016; Beyersdorf et al., 2014; Moore et al., 2015). The nvPM at the engine exit plane is hydrophobic, but as the nvPM evolves in the expanding plume, its aging results in enhanced hydrophilicity (Weingartner et al., 1997; Zhang et al., 2008).
Investigation of atmospheric pollution, and in particular atmospheric visibility, has shown that aerosol optical properties are affected by size, composition, and hygroscopic growth of particles (Tang et al., 1981; Horvath, 1995; Kim et al., 2006; Meier et al., 2009). In urban environments, emissions from vehicles including soot, sulfates, and nitrates have been found to be the main contributors to visibility degradation (Ferron et al., 2005; Kim et al., 2006).
Hygroscopicity tandem differential mobility analysis (HTDMA) systems have been widely used to measure the hygroscopic growth properties of PM in the subsaturated regime in different environments (Massling et al., 2007; Swietlicki et al., 2008; Park et al., 2009b; Wu et al., 2013). HTDMA measurements of PM emissions from jet engine combustors (Gysel et al., 2003; Popovicheva et al., 2008) have also been performed. However, the application of a HTDMA system to measure the hygroscopic properties of PM emissions in evolving aircraft engine exhaust plumes from the combustion of different fuels has not been previously performed.
For field measurements, where ambient temperature and humidity cannot be controlled, the HTDMA system must be fairly rugged, stable, and versatile. The Missouri University of Science and Technology (MST) has developed a HTDMA system to quantify the hygroscopic properties of PM emitted from aircraft engines. The HTDMA system was automated to operate such that it could determine the hygroscopic properties for an aerosol in approximately 45 s. This is critical when conducting aircraft engine emission tests which can be quite expensive, and where the expanding exhaust plumes are subject to perturbations in wind speed and wind direction. This paper reports the results of lab-based experiments to evaluate the performance of the MST HTDMA system and in-field measurements of PM emissions in exhaust plumes from the combustion of conventional and alternative fuels in a CFM56-2C1 engine during the Alternative Aviation Fuels EXperiment (AAFEX) II field campaign.
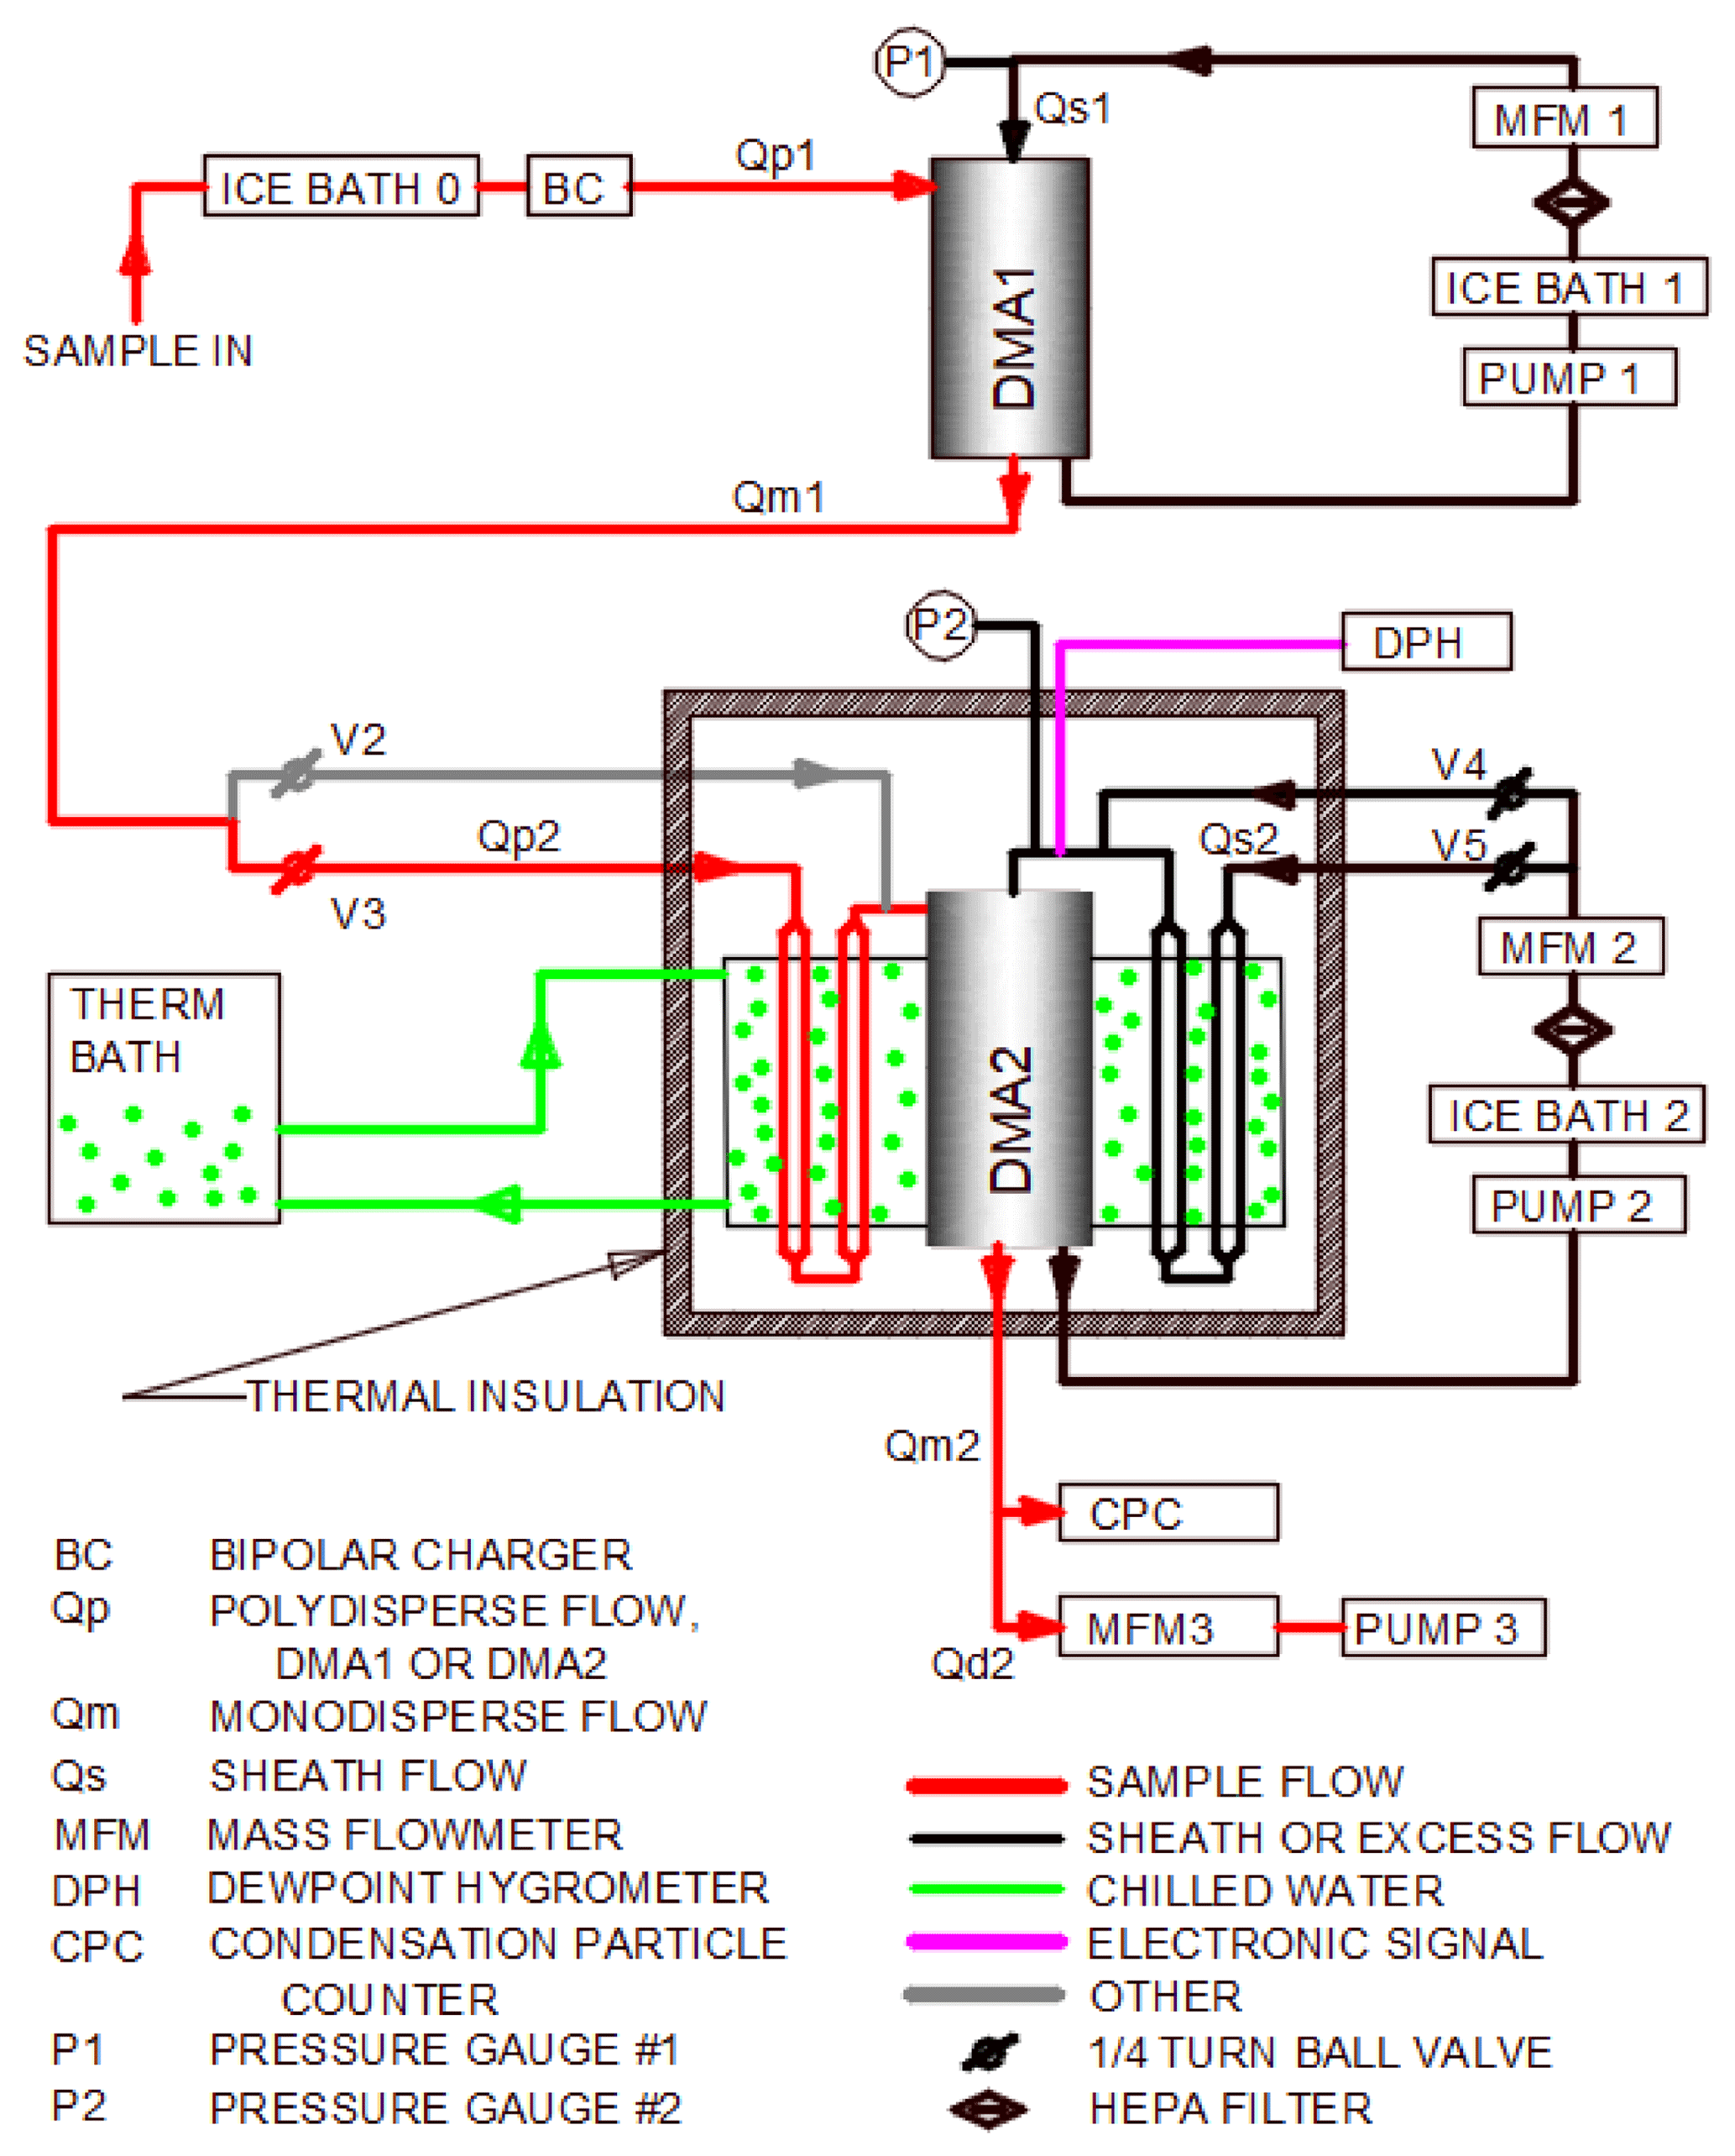
The MST HTDMA system consists of two differential mobility analyzers (DMAs), a humidifier (HUM), and a condensation particle counter (CPC), similar to other systems (McMurry and Stolzenburg, 1989). Figure 1 presents the schematic of the MST HTDMA system. The polydisperse aerosol was first preconditioned by passing through an ice bath (IB-0) to remove excess water vapor as much as reasonably possible and returning it to room temperature with a saturation ratio of ∼0.15. The aerosol was then brought to charge equilibrium by passing it through a bipolar charger (BC), which can contain 500 to 2000 µCi of polonium-210 prior to entering the first DMA (DMA1). The DMAs used in the HTDMA system were custom designed and have been used in previous studies to classify aerosols based on electrical mobility (Schmid, 2000). The DMAs were of cylindrical geometry and had the following dimensions: effective inner length of 72.77 cm, a sample flow annulus with an inner diameter of 5.07 cm, and an outer diameter of 8.88 cm. The polydisperse aerosol flow rate (Qp) was set to 3 L min−1 and the sheath flow rate (Qs) was adjusted to 15 L min−1 using mass flow meters (Aalborg Instruments GFM 371) which were calibrated periodically. In DMA1, the polydisperse aerosol was classified by size, and monodisperse particles with a “dry” size (Xd) selected. The excess flow in the DMA was recirculated as Qs1, after passing through a second ice bath (IB-1) and a high-efficiency particulate air (HEPA) filter to further ensure that the sample remained dry and had not prematurely deliquesced to a solution droplet. DMA1 was set at a fixed voltage, permitting the selection of a monodisperse aerosol. The monodisperse sample flow (Qm1) out of DMA1 entered the humidifier (HUM) section of the HTDMA system, where it is referred to as the polydisperse flow, Qp2. The HUM brought the aerosol sample to a controlled, precisely known saturation ratio (SR), typically 0.91 to 0.99, which caused the particles to deliquesce to a new equilibrium “wet” diameter (Xw). Valves V2 and V3 were used to direct the aerosol flow Qp2 to either pass through HUM (wet mode) or to bypass it (dry mode). Valves V4 and V5 were used to achieve the same function for the sheath air flow (Qs2). The third ice bath (IB-2) in the Qs2 loop removed the water vapor from Qs2 and minimized any unwanted vapors co-emitted from the combustion process. The second DMA (DMA2) in conjunction with a CPC (TSI 3022) measured Xw. The MST HTDMA system was designed to provide only one SR condition and to hold that value regardless of variations in ambient temperature and humidity or sampling duration. The water bath that encased HUM/DMA2 was maintained at a fixed temperature by a refrigerated water re-circulator that controlled the water temperature around the HUM/DMA2 to 16±0.1 ∘C. This water passed alongside the Qp2 and Qs2 lines (not shown in figure). Thus, the dew point achieved in HUM was well below room temperature. The water flow rate through the water bath surrounding HUM/DMA2 was approximately 5 L min−1.
The SR values in flows Qp2 and Qs2 were brought to near unity at 16 ∘C by passing the aerosol through stainless-steel tubes lined with wet cloth. The flow Qp2 passed through four such tubes (11 mm ID × 762 mm L), thus having a total length of 3048 mm and a residence time of 5.8 s. The flow Qs2 passed through eight similar tubes, thus having a total length of 6096 mm and a residence time of 2.3 s. Theoretical studies have shown that the lengths of wet-walled tubing should be sufficient to bring the Qp2 and Qs2 to very near SR of 1 (Fitzgerald et al., 1981). Just before entering DMA2, the SR of Qs2 was measured by a dew point hygrometer (DPH) (Vaisala HMP247). The flow Qd, in parallel with the CPC, reduced the lag time (LT2) between when voltage was imposed on DMA2 and when particles selected by that voltage reached the CPC.
During routine operation, to maximize the data acquisition frequency, the HTDMA system was computer controlled by a LabVIEW program (LV). When the program was initiated, it (1) set the desired voltage (HV1) in DMA1 causing it to deliver dry particles of diameter Xd, (2) waited long enough for this monodisperse aerosol to travel from the outlet of DMA1 through the HUM and into DMA2, (3) set the high voltage in DMA2 (HV2) to some fraction of that in DMA1 (typically 0.1 × HV1), and (4) caused HV2 to step through 104 increments such that the final value was a multiple of HV1 (typically 10 × HV1). During the stepwise voltage increase of HV2 (the logarithm of the voltage was linear with time.), LV recorded (at 1 Hz) values of HV1, HV2, Qs1, Qs2, Qd, P1, P2, SR, CPC concentration, and elapsed time (dt). The operator provided the general region (in time) where the peak in CPC readings occurred as input, and LV fitted a quadratic function to the CPC concentration time series. The quadratic function was differentiated and the value of dt at the maximum was obtained (dtmax). Based on calibrations performed previously, LV computed the lag time (LT2) between when a certain diameter of droplet was selected by DMA2 and when it arrived at the CPC. This lag time has been found to be a function of Qs2 and Qp2. LV found the value of the high voltage on the central rod of DMA2 at that time. It then computed the wet diameter (Xw) of the solution droplet (using the operating equation of the DMA2) and finally computed the hygroscopic properties. LV was developed such that the hygroscopic properties could be determined on more than one Xd. LV changes the particle diameter produced by DMA1 before the end of the voltage sweep on DMA2. The new particle diameter selected did not arrive at DMA2 while the current HV2 voltage sweep was running but did arrive immediately after that sweep had been completed. DMA2 then immediately started the sweep on this new wet diameter. Thus, the time taken to flush the tubing and the HUM is minimized. This reduced the time for performing HV2 sweeps on 12 different dry diameters to ∼9 min.
Periodically, experiments were performed where a challenge aerosol of a pure inorganic salt (sodium chloride, NaCl, ammonium sulfate, (NH4)2SO4, potassium iodide, KI, or potassium chloride, KCl) was used to validate/update the calibration of DPH (as described in Suda and Peters, 2013). During an automated stepwise increase of HV2, the diameters Xd and Xw were precisely determined. The calculated saturation ratios (SR-calc) were obtained from knowledge of the dry diameter Xd, the wet diameter Xw, and the fact that the particles were a pure chemical of known properties. The SR-calc values were computed and compared to the value reported by the dew point hygrometer (SR-DPH). A calibration for the DPH was thus obtained. Typically, a value of 0.85 to 0.99 is obtained for SR-calc.
In the MST HTDMA system, the SR is measured in the growth region by performing experiments (as recommended by Johnson et al., 2008). The SR is a function of not only the water vapor–air mixing ratio but also a function of gas temperature. Even though the mixing ratio will not change as Qs2 travels from the region of the DPH to the middle of DMA2, the temperature may, resulting in a potential change in SR. Thus, it is better to self-calibrate the HTDMA system using this method. Furthermore, it is generally known that reliable measurements of SR from commercial instruments become very hard to obtain the closer one gets to SR of 1.
All HTDMA systems described in the literature are designed to provide precise values for the hygroscopic growth factor. Furthermore, almost all of these systems have the ability to vary the SR, thus requiring separate thermostating for the HUM and for DMA2 (Suda and Peters, 2013; Woods et al., 2013; Shi et al., 2012; Fors et al., 2010; Park et al., 2009a; Massling et al., 2011; Hu et al., 2010; Biskos et al., 2006; Lopez-Yglesias et al., 2014). Others (Johnson et al., 2008; Cubison et al., 2005) utilize controlled mixing of humid and dry air to achieve the desired humidity. Some systems include water baths (Hennig et al., 2005; Weingartner et al., 2002), temperature-controlled cabinets (Cocker et al., 2001), and passive, insulated regions (Virkkula et al., 1999; Johnson et al., 2008).
Although these designs offer very good precision and the ability to vary the SR, they may not be well suited for field measurements, since most of them involve two separate volumes that must have their temperatures maintained very precisely. It is the temperature difference between these two volumes that is the critically important parameter. The MST HTDMA system was designed to be less susceptible to ambient temperature fluctuations. This was achieved by encasing both the HUM and DMA2 in the same thermostated container (volume ∼ 14 L). Other systems have also immersed DMA2 and the HUM in a water bath (Cubison et al., 2005; Hennig et al., 2005; Weingartner et al., 2002) to minimize the temperature gradients. In the MST HTDMA system, temperature drifts are not critical, since the temperature difference between the HUM and the DMA2 (and the exposure time of the Qp2 and Qs2 in HUM) is what determines the SR, and that remains constant (zero temperature difference).
Suda and Peters (2013) discussed the problem of DMA offset, whereby the diameter as measured by DMA1 may be slightly different from the diameter as measured by DMA2, even if they both sample the same aerosol simultaneously. This situation was avoided in the MST HTDMA system by performing a self-calibration. To accomplish this, an inorganic challenge aerosol (e.g., (NH4)2SO4)) was delivered to DMA1, and LV directed DMA1 to deliver sample particles with a given diameter Xd. The HUM was bypassed and LV initiated a voltage sweep on DMA2, which yielded a diameter Xwswp. This was repeated for a series of Xd values ranging from 10 to 160 nm, establishing a calibration curve between Xd and Xwswp, with Xd taken as the true diameter. Within LV, this calibration was utilized to synchronize the two DMAs. Since DMA1 was static during a voltage sweep and its Xd involves no error from uncertainties in the lag time (LT2), DMA1 was chosen as the reference.
3.1 Determining the saturation ratio
The SR can be calculated from Köhler theory (Pruppacher and Klett, 1978). For hybrid particles that are composed of a spherical, insoluble core of diameter Xu surrounded by a spherical shell of soluble material, SR can be calculated from
where Xw is the diameter of the solution droplet. By expanding ln (SR) in a Taylor series and keeping only the first term in the expansion, an error of less than 4.5 % is introduced. Thus, Eq. (1) can be approximated as
where Mw is the molecular weight of water, σw∕a is the surface tension of the solution–air interface ( N m−1), R is the universal gas constant [8.31 (N m K−1 mol−1)], T is the absolute temperature, ρw is the density of water, ν is the number of ions into which the solute material disassociates, ms is the mass of the dry (salt or solute) particle, Φs is the osmotic coefficient of the solution droplet, and Ms is the molecular weight of the solute.
For particles composed of a single, pure chemical species with no insoluble core (Xu=0),
and A and B remain as defined above. The mass of the dry (salt or solute) particle is given by
The osmotic coefficients for selected solute materials as a function of the molality have been reported in the literature (Hamer and Wu, 1972; Robinson and Stokes, 2002; Staples, 1981). We find that Φs can be related to the square root of the molality (ψ) by a sixth-order polynomial function. Hence, Φs is dry and wet diameter dependent, and this must be taken into account. The molality (ψ) (number of moles of the solute/mass of solvent in kilograms) is given by
where n is the number of moles of the solute. Examples of how Φs is determined are provided in the Supplement.
Thus, a pure chemical of known properties can be used to self-calibrate the HTDMA and verify SR.
3.2 Determining the water activity factor, aw
The Köhler theory (Pruppacher and Klett, 1978) describes how the SR over an aqueous solution droplet is related to other parameters characterizing the water droplet.
where aw is the activity of water in solution, and Xw is the diameter of the droplet determined by the voltage sweep of DMA2/CPC. Thus, aw can be calculated from Eq. (8).
3.3 Determining the growth factor
The growth factor (GF) is the most commonly used parameter to describe the hygroscopic properties of particles. It is defined as
where Xw is the wet particle diameter and Xd is the dry particle diameter. GF is a function of SR and provides a measure of the relative change in size of the particle as a result of water absorption.
3.4 Determining the hygroscopicity parameter (κ)
Petters and Kreidenweis (2007) proposed that a single parameter representation for hygroscopicity was better to model complex, multicomponent particle types such as atmospheric particles containing insoluble components. The hygroscopicity parameter (κ) is defined through its effect on the water activity of the solution by
where Vsolute is the volume of the dry particulate matter and Vwater is the volume of the water. It should be noted that Vsolute also includes the volume of the insoluble core, if there is one. For clarity, we note that
The κ, calculated from Eq. (10), is an excellent choice when studying ambient aerosols that derive from the agglomeration of particles from multiple sources. It should be noted that κ can also be calculated from the GF and aw without determining the wet and dry volumes (Holmgren et al., 2014).
Thus, for an aerosol of unknown composition, Eq. (8) is used to compute aw, Eq. (9) to compute GF, and then Eq. (13) to compute κ. It should also be noted that, for an aerosol of unknown composition, only Eqs. (8)–(13) are used, and none of these require any prior knowledge of the physical or chemical properties of the aerosol.
4.1 Performance evaluation using pure inorganic salts
The performance of the MST HTDMA system was evaluated by measuring GFs of pure inorganic salts and comparing them to theory. The values of GF vs. Xd were measured and plotted for NaCl, (NH4)2SO4, KI, and KCl in Fig. 2. To obtain the theoretical GF, the SR-calc (Eqs. 3–5) for the largest two or three dry particle diameters was computed and an average was obtained. From this SR-calc, a non-linear equation solver was utilized to compute the theoretical Xw (using Eqs. 3–5) for the other sizes. The GF could then be computed (Eq. 9). There is excellent agreement between the measured growth factor and the value predicted from theory. It should also be noted that the osmotic coefficient Φs is quite different from unity in several of the cases.
The dry diameter estimate (Xd) requires knowledge of the average particle diameter actually exiting DMA1. A weighted average (neglecting doubly charged particles) is given by
where SNNk is the differential size distribution entering the HTDMA system (measured here by a Cambustion DMS500), Xk is the particle diameter, Fk is the fraction of particles of diameter Xk that carry one elementary charge (Hagen and Alofs, 1983), TFk is the transfer function of DMA1, and dlogXk is the differential in logX between adjacent data points in SNNk.
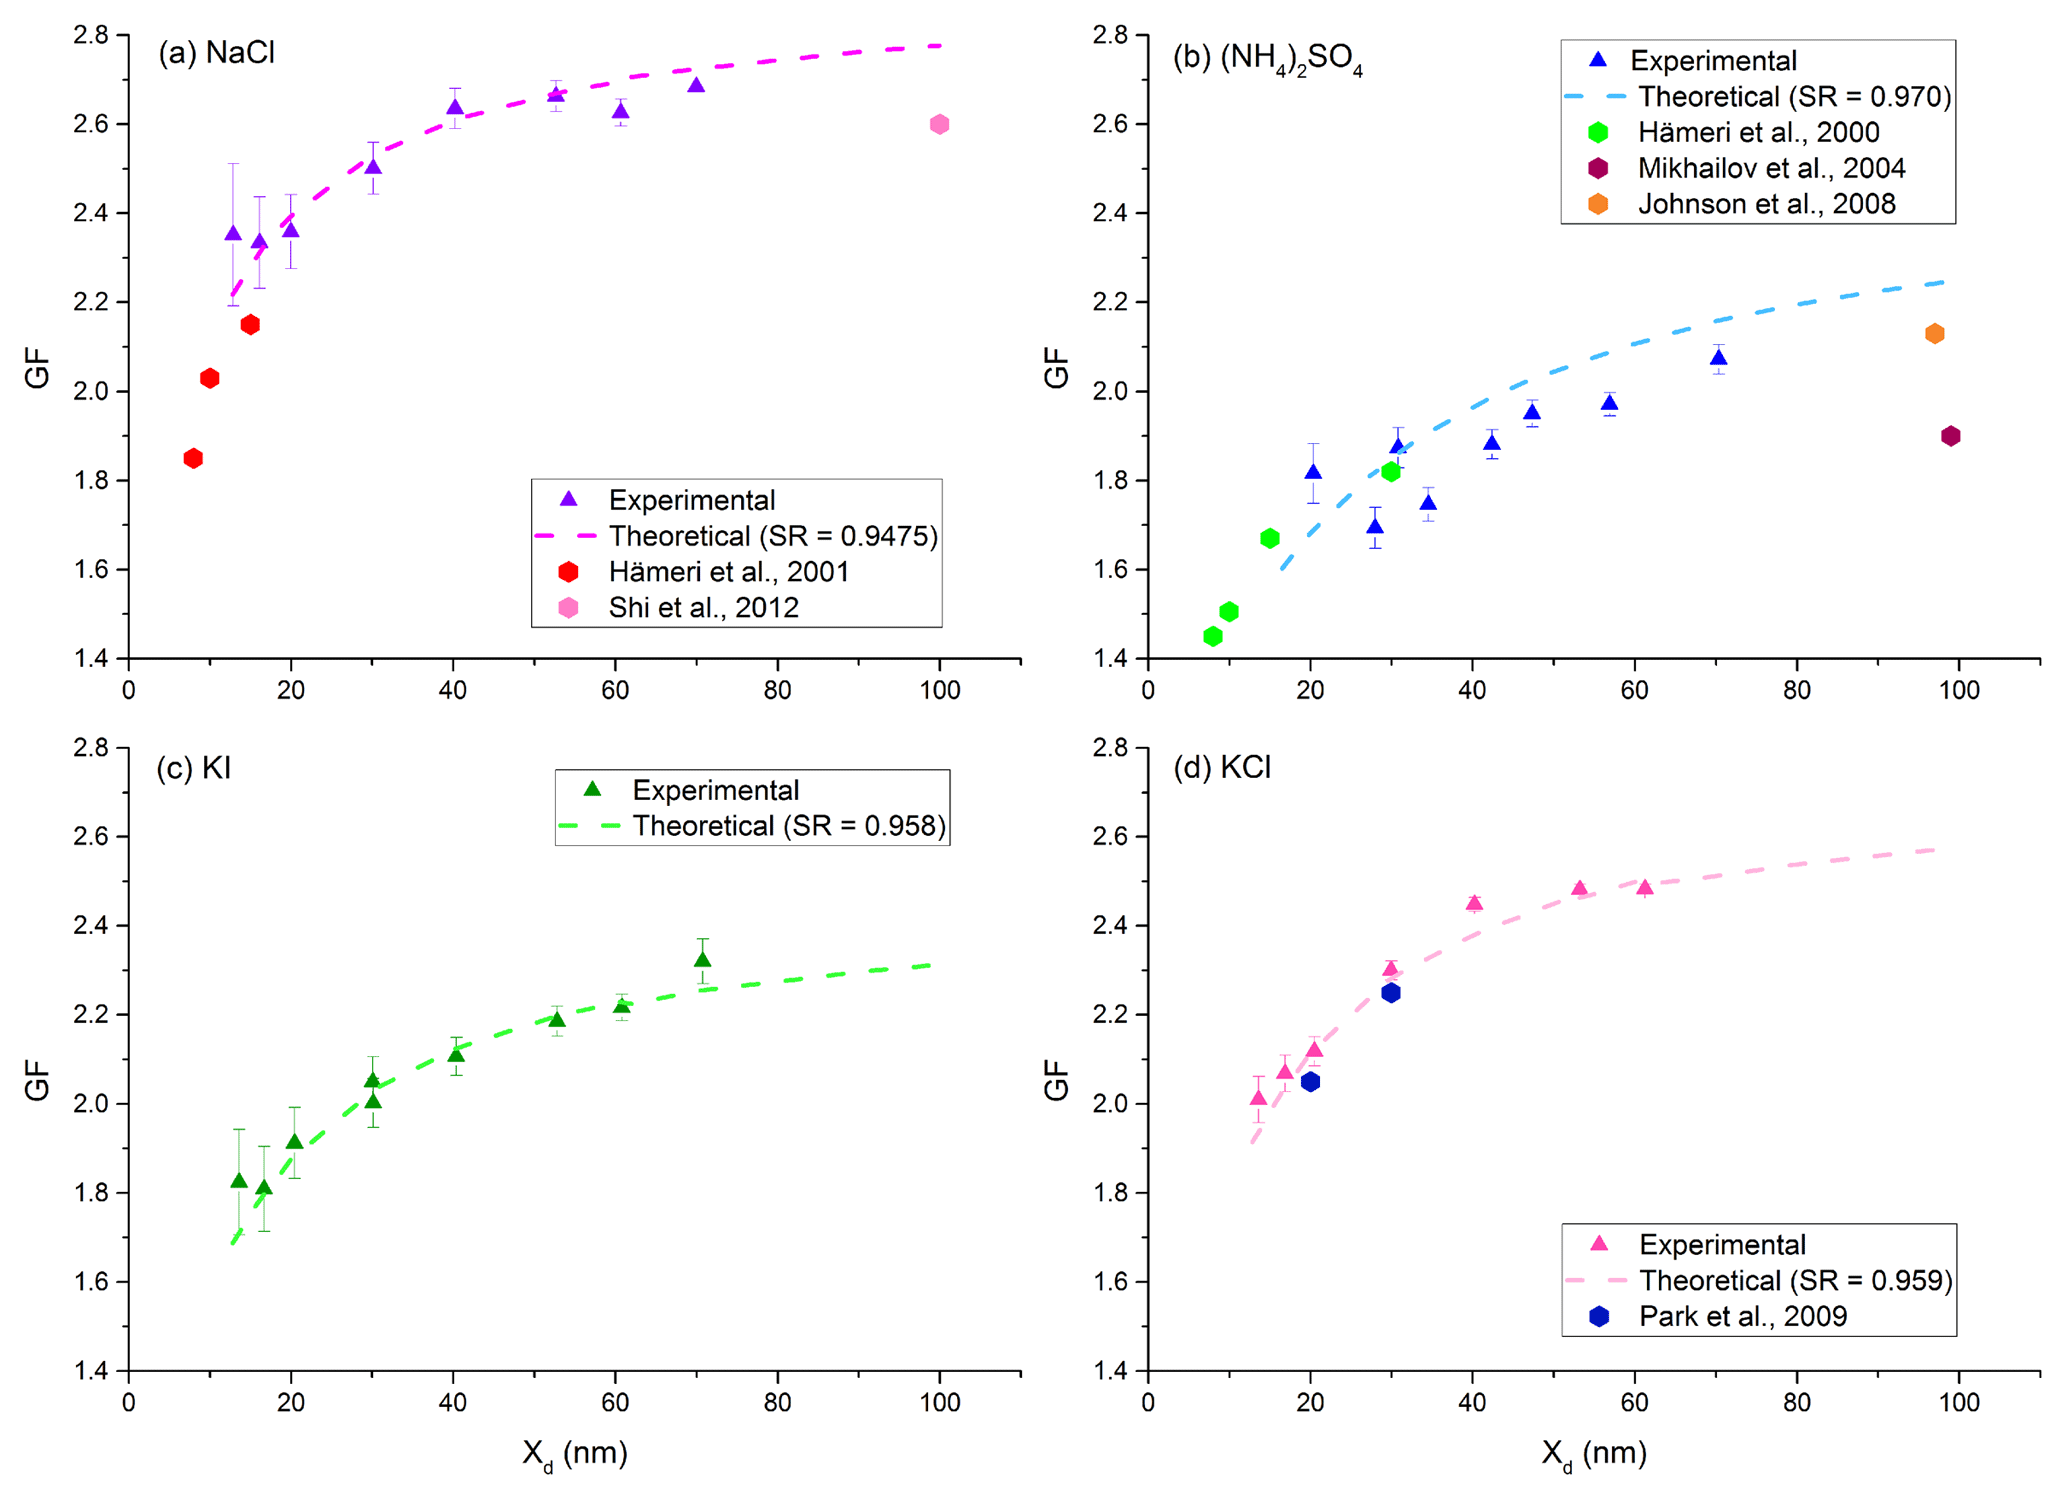
Figure 2Growth factor as a function of dry particle diameter (Xd) for NaCl (a), (NH4)2SO4 (b), KI (c), and KCl (d).
The use of Eq. (14) rather than the DMA1 set point value for the average particle diameter provided a more accurate Xd value for these pure chemicals. The DMS500 reported the peak in SNNk at approximately 27 nm for the nebulizer and the solutions of pure solute chemicals used. Since SNNk and Fk were both monotonically increasing over the range where TFk was non-zero, the Xavg was greater than the set point diameter of DMA1. For example, when DMA1 was set to extract particles with Xd=12.76 nm, the value of Xavg from Eq. (14) was found to be 13.49 nm, which resulted in a change to the GF from 2.33 to 2.22 (a 5 % correction). This correction was taken into account for particle diameters less than 20 nm. For particles diameters larger than 20 nm, the correction is insignificant. This correction can be utilized for any diameter Xd as long as the SNNk, the Fk, and the TFk are known.
Most HTDMA systems for which data are reported in the literature are designed to scan the SR (called humidigrams) and report (1) the GF for a wide SR range (0.20 < SR < 1), and (2) the deliquescence relative humidity, i.e., the SR at which the dry particles abruptly begin to take on liquid water and grow to much larger solution droplets. The MST HTDMA system was not designed to perform humidigrams. By inspection of humidigrams in the literature and with knowledge of the SR that was recorded in the MST HTDMA, the GF from these other systems can be estimated. Figure 2a–d present the experimentally obtained GF as a function of Xd for various inorganic salts. The theoretical values along with those reported in the literature from other systems are in good agreement with the GF determined by the MST HTDMA.
Figure 3 shows plots of κ vs. Xd for the same four chemicals. Also plotted are the ranges of κ values for (NH4)2SO4 and NaCl as reported by Petters and Kreidenweis (2007). There is good agreement between the κ values reported by the MST HTDMA system and those from literature.
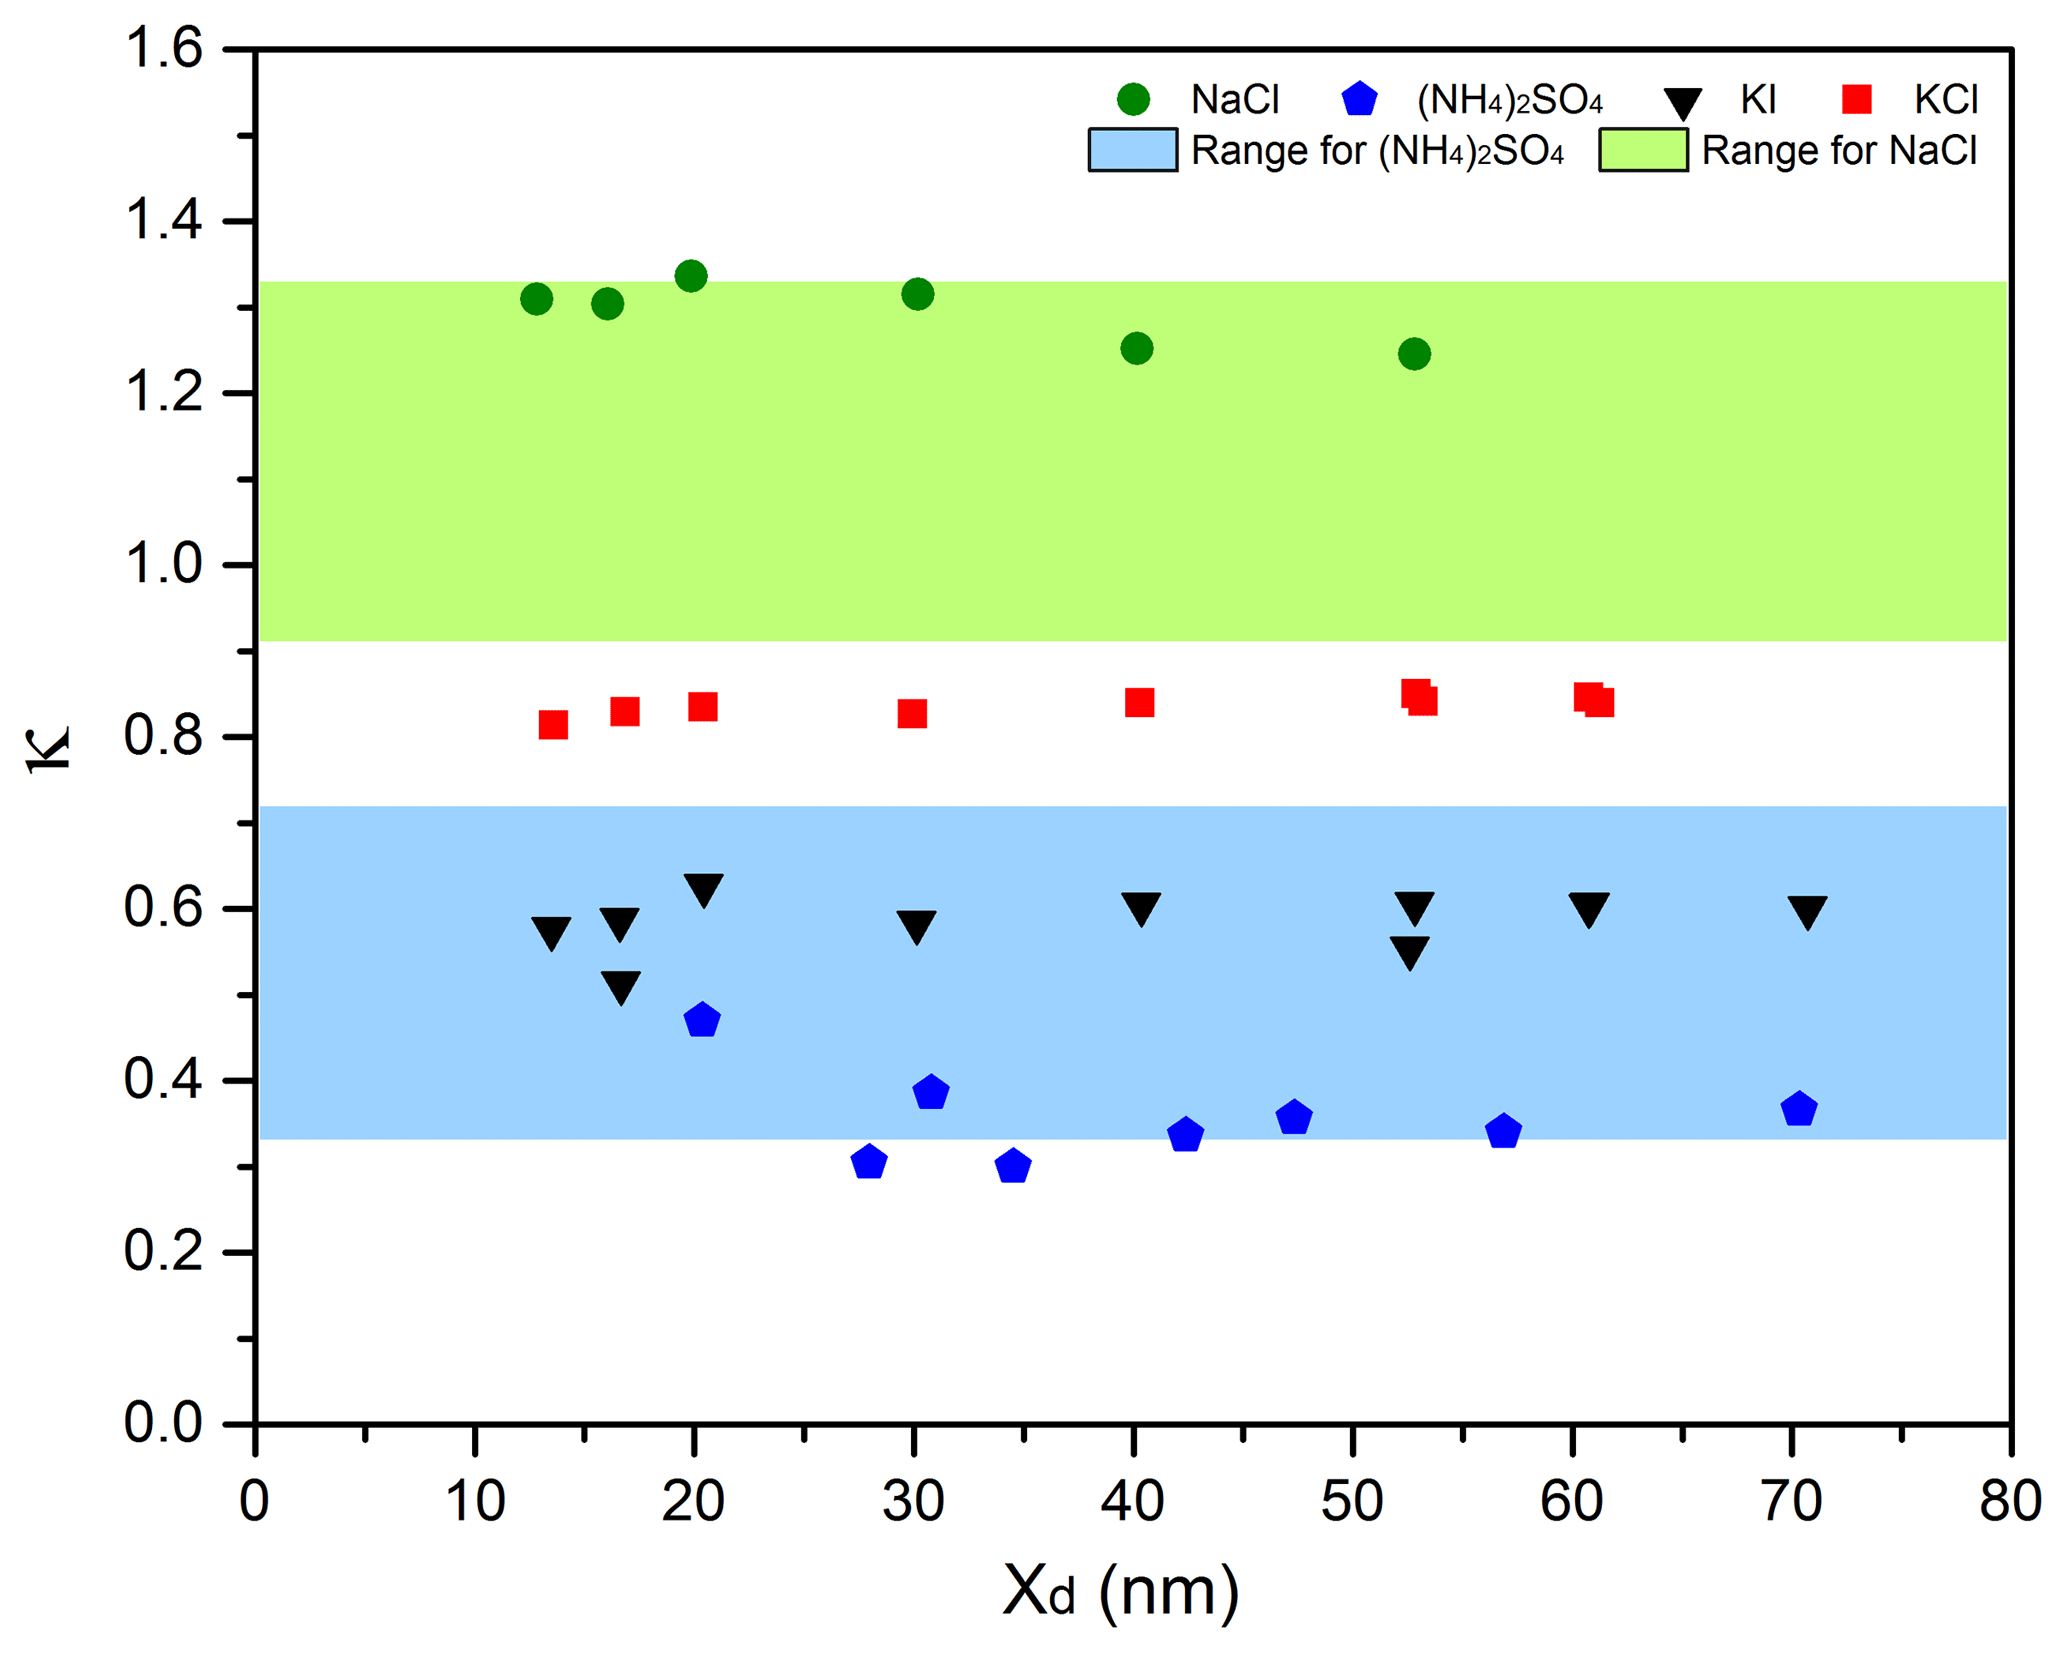
Figure 3Hygroscopicity parameter (κ) as a function of dry particle diameter (Xd) for NaCl, (NH4)2SO4, KI, and KCl.
4.2 Residence time
Since the deliquescence technique is an equilibrium based methodology, the closeness to equilibrium must be validated, especially for the larger droplets (which grow more slowly). For such a test, the HTDMA system was configured to select a dry diameter (Xd=17, 30, or 51 nm) of (NH4)2SO4 aerosol. The wet diameter (Xw) was measured, allowing calculation of GF and SR-calc. This was repeated for a series of Qp2 values, which varied the residence time. The results are shown in Fig. 4.

Figure 4GF (a) and SR-calc (b) as a function of polydisperse flow rate Qp2, with challenge (NH4)2SO4 aerosols of 17, 30, and 51 nm.
From Fig. 4a and b, a small dependence of GF and SR-calc on Qp2 is observed. Utilizing a small Qp2 would be best to achieve the highest SR value. However, very small values of Qp2 result in very low concentration delivered to the CPC. In field measurements where the sample is diluted with ambient air, the concentration is already quite low, leading to signal to noise issues. Alternatively, at large values of Qp2, the peak is too broad. To avoid both of these extremes, the HTDMA system was operated at Qp2=3.0 L min−1.
The HTDMA system, when deployed in the field, is primarily intended to study particles with small Xd values and small GFs. These particles will probably not grow large enough to experience insufficient growth time problems. However, it is good practice to periodically check the system and the sample aerosol by choosing a large Xd (30 nm or larger) to determine if changes to Qp2 result in a change to SR. If this is the case, then it is better to maintain Qp2 at a lower value (2.0 L min−1).
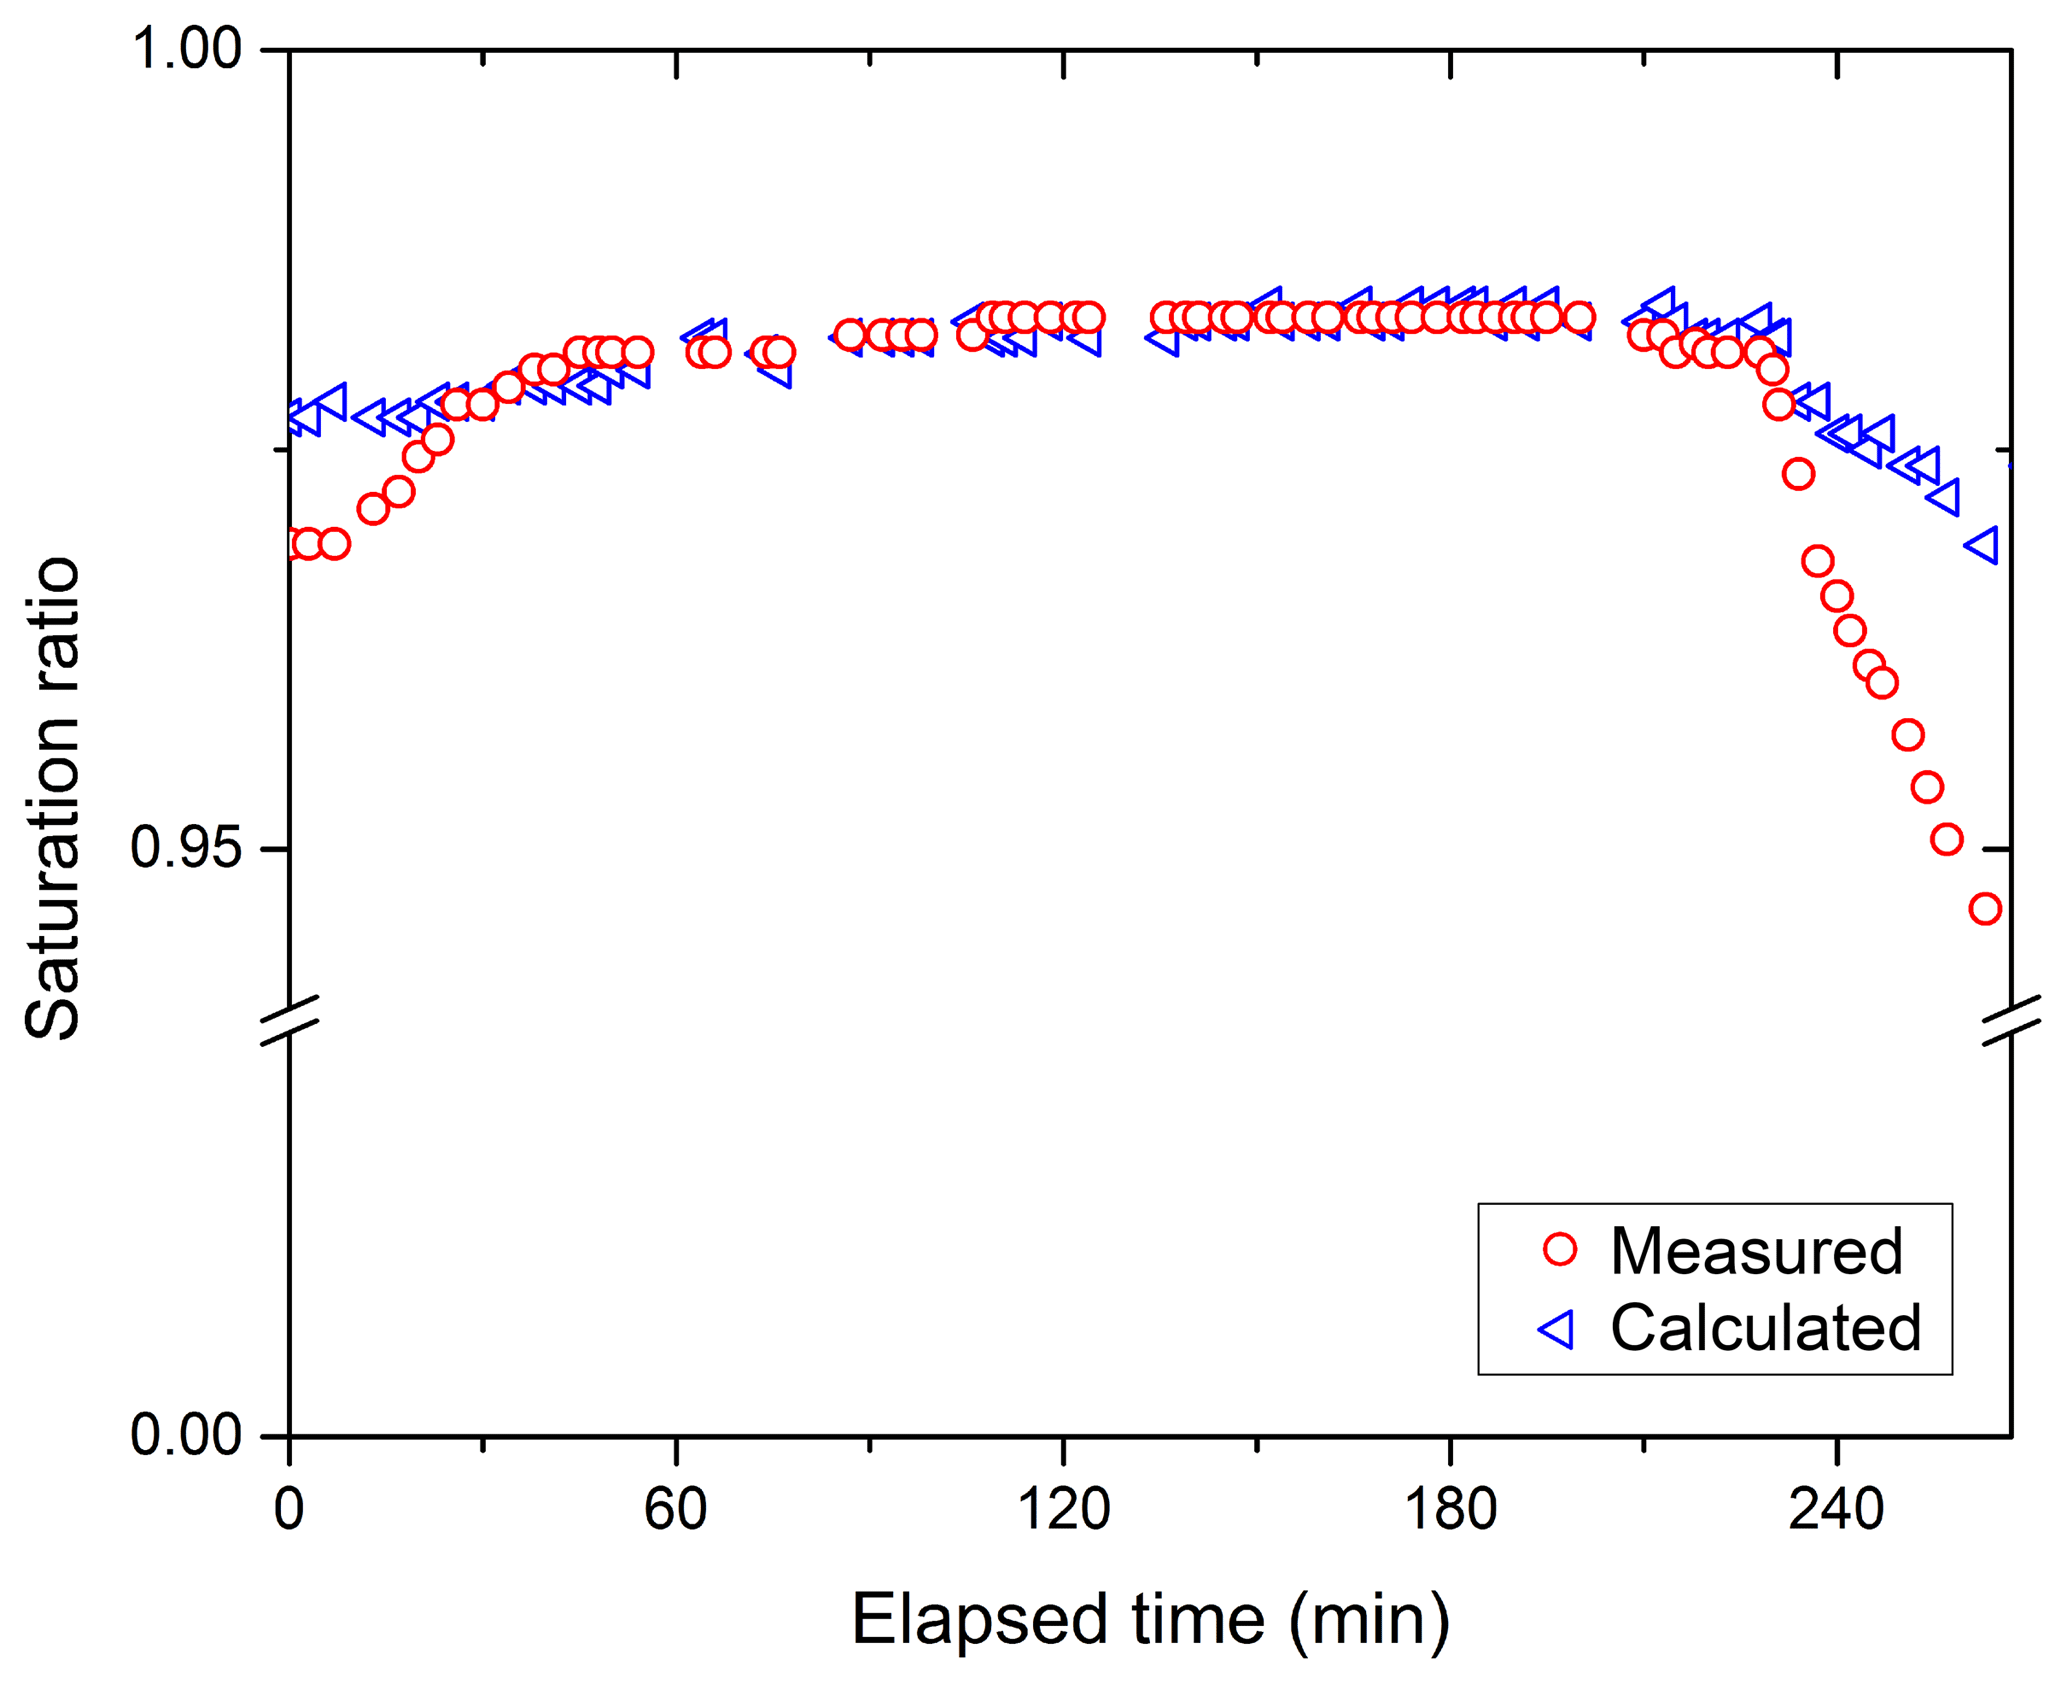
Figure 5SR as a function of elapsed time since last wetting for pure particles of (NH4)2SO4. The uncertainty in the SR (calculated) is approximately 0.008.
4.3 Stability over long operating times
For field applications, the HTDMA system is required to maintain stable operation for long periods of time. The HUM tubes are wetted at the beginning of the day and need to be periodically re-wetted to maintain a stable SR. The time after which the HUM tubes need to be re-wetted was experimentally determined. Figure 5 displays the results of determining the SR-calc by using particles of pure (NH4)2SO4 (Xu=0 in Eq. 1) and measuring the wet diameter Xw, given that the dry diameter set in DMA1 is held constant. Experiments were performed where the HUM tubes were wet thoroughly, and then automated scans were conducted for several hours with no further tube wetting. After the experimental measurements were performed, the SR was calculated from Eq. (5). Figure 5 shows the measured SR of the Qsh2 as determined by DPH. It can be seen that the calculated and the measured SR remained constant for a period of over 225 min without having to re-wet the tubes.
When required, tube re-wetting was accomplished using a LabVIEW program which acted through a relay board to energize a peristaltic pump and sequentially opened 12 pinch valves for a short period (set by the operator), allowing each tube to be re-wet in sequence. After re-wetting, valves at the bottom of the 12 stainless-steel tubes were manually opened to allow excess water to drain. During normal operations in the field, the HUM tubes were re-wetted every 150 min.
4.4 Stability over varying ambient temperature conditions
The HTDMA must be able to operate under varying ambient temperature conditions in the field. The stability of the HTDMA system was assessed using pure (NH4)2SO4 as the challenge aerosol. DMA1 was set to extract dry particles of 30 nm. An automated voltage sweep with DMA2 was performed every 2 min to determine Xw. The SR-calc was computed using Eq. (1), with Xu=0. At t=20 min (and 40 min), the ambient conditions surrounding the HTDMA system were abruptly changed by blowing cold air over the bottom of the HUM tubes (or not blowing cold air over the bottom of the HUM), which is not as well thermally insulated as the rest of the HTDMA system (Fig. 1). This experiment was repeated four times on four different days. The SR-calc remained constant over the duration of any one run as shown in Fig. 6. The average standard deviation in SR-calc divided by the average SR-calc for that trial over all four trials (120 measurements) was 0.0019, indicating that this system was insensitive to ambient temperature fluctuations.

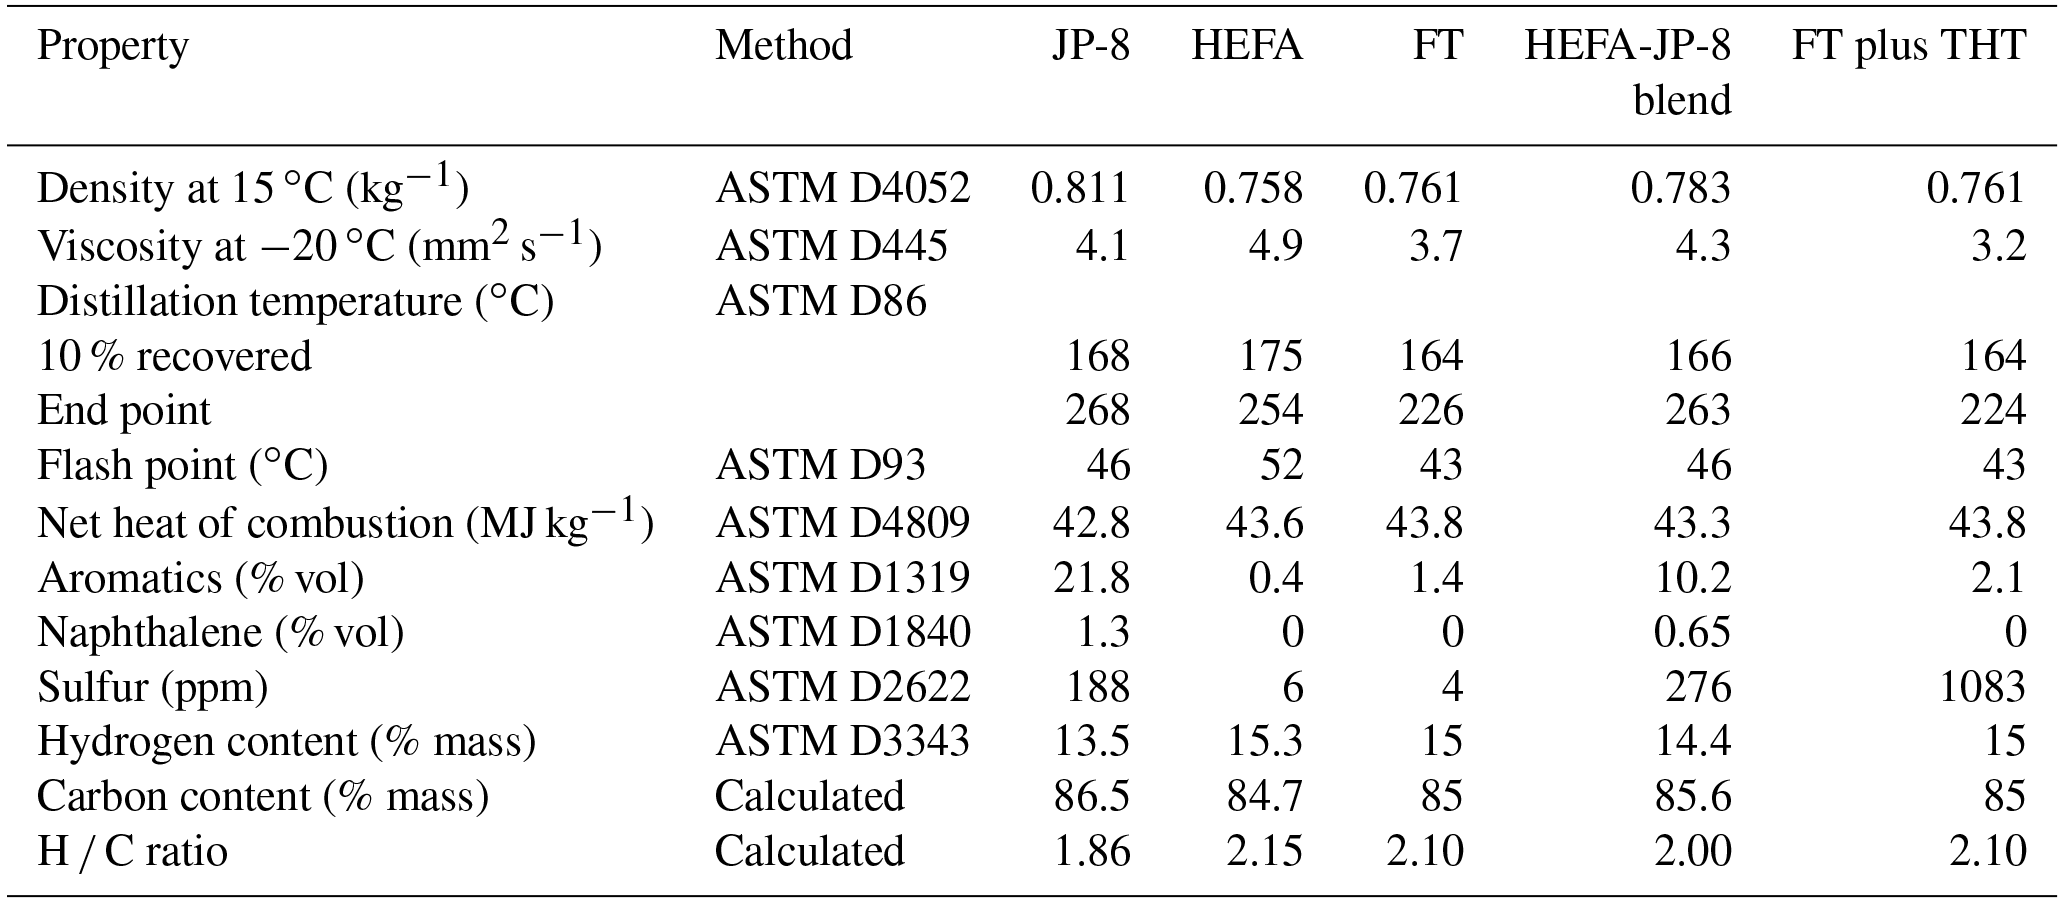
The MST HTDMA system was deployed as part of the Alternative Aviation Fuels EXperiment (AAFEX II) campaign conducted during 20 March–2 April 2011 at the NASA Dryden Aircraft Operations Facility (DAOF), Palmdale, CA, USA. The NASA DC-8 aircraft equipped with CFM56-2C1 engines was utilized as the emissions source. The aircraft was parked in an open-air run-up facility with no other aircraft or emission sources in the vicinity of the test site. Detailed descriptions of the test site and experimental setup have been previously reported (Timko et al., 2013; Moore et al., 2015). The main objective of the campaign was to investigate the gaseous and PM emissions characteristics of the CFM56-2C1 engine burning conventional and alternative fuels as a function of engine thrust conditions at several sampling locations in the exhaust plume. PM emissions data were acquired for a typical cycle which consisted of the following engine thrust conditions: 4 %, 7 %, 30 %, 65 %, 85 %, and 100 % rated thrust. Two test cycles were run for each fuel – one stepping up from 4 % to 100 % rated thrust and the other stepping down from 100 % to 4 % rated thrust. Five fuels were used during the campaign: (1) JP-8 (the military equivalent of conventional Jet A/JetA-1), (2) tallow-based hydroprocessed esters and fatty acids (HEFA), (3) coal-derived Sasol Fischer–Tropsch (FT), (4) a blend of HEFA and JP-8, and (5) FT doped with tetrahydrothiophene (THT) to boost the sulfur content of the fuel. A summary of selected fuel properties is provided in Table 1. Chemical and physical analyses of the HEFA and FT fuels have been reported elsewhere (Corporan et al., 2011).
The emissions from the CFM56-2C1 engine were measured at several distances (1, 30, and 143 m) from the engine exit plane to study the PM characteristics as the exhaust plume cooled and mixed with ambient air. Only data acquired at the 143 m location are presented and discussed here to investigate the hygroscopic properties of the evolving plume.

Figure 7Total (T) and non-volatile (NV) PM number-based emission index (EIn) size distributions for the various fuels at the 100 % engine thrust condition.
A 5.08 cm aluminum tube (∼1.3 m above the concrete apron) positioned downwind from engine no. 3 on the starboard side of the aircraft was used to extract exhaust plume samples at the 143 m location. The exhaust was transported through the tube to a small trailer approximately 18 m away which housed the MST HTDMA system to measure hygroscopic properties. The exhaust gas flow rate through the 0.052 m ID × 18 m L tubing was well over 100 L min−1. Also housed in the trailer was a Cambustion DMS500 (Reavell et al., 2002; Hagen et al., 2009) which measured the real-time particle size distributions, and a LI-COR 840A nondispersive infrared (NDIR) detector that measured exhaust CO2 concentration. Ambient meteorological conditions such as temperature, pressure, and relative humidity were also monitored and recorded throughout the campaign. The exhaust samples at 4 % and 7 % engine thrust conditions were impacted by the ambient conditions, specifically, wind speed and wind direction. However, the CO2 measurements during the 7 % trust periods were approximately twice the background level, indicating that the exhaust plume was being sampled.
The DMS500 measured total PM size distributions. The nvPM size distributions were obtained by passing the sample through a thermal denuder. The thermal denuder consisted of a coil of stainless-steel tubing (0.457 cm ID) housed in a temperature-controlled aluminium box heated to 300 ∘C, followed by a cooling section. It is similar in design to that used by Saleh et al. (2011) and has been used in a previous study (Rye et al., 2012). Laboratory evaluations have demonstrated that H2SO4 droplets of diameter 10–100 nm are almost completely evaporated in the thermal denuder.
The total and nvPM number-based size distributions were converted to number-based emission index (EIn) distributions to account for varying amounts of dilution for each plume, and are presented for selected fuels at the 100 % thrust condition shown in Fig. 7. The total PM size distributions are bimodal with a strong nucleation mode (<20 nm) and an accumulation mode. These observations are consistent with those reported for PM emissions measured downwind of several different aircraft engine types (Lobo et al., 2007, 2012, 2015a). The enhancement of the nucleation mode in measurements made downwind of the engine exit plane is due to gas-to-particle conversion in the exhaust plume driven by fuel composition, ambient conditions, and degree of mixing. Timko et al. (2013) found that the driving force for gas-to-particle conversion in the expanding exhaust plume was the ratio of particle precursors (both organic and sulfate) to soot.
The sulfur in the fuel is oxidized to SO2, a portion of which then undergoes oxidation to SO3 and subsequently to sulfuric acid (H2SO4) in the exhaust plume (Miake-Lye et al., 1998; Schumann et al., 2002). The H2SO4 either homogenously nucleates to form pure H2SO4 droplets or condenses onto existing soot particles to form hybrid particles that have significant water-soluble components (Gysel et al., 2003; Wyslouzil et al., 1994).
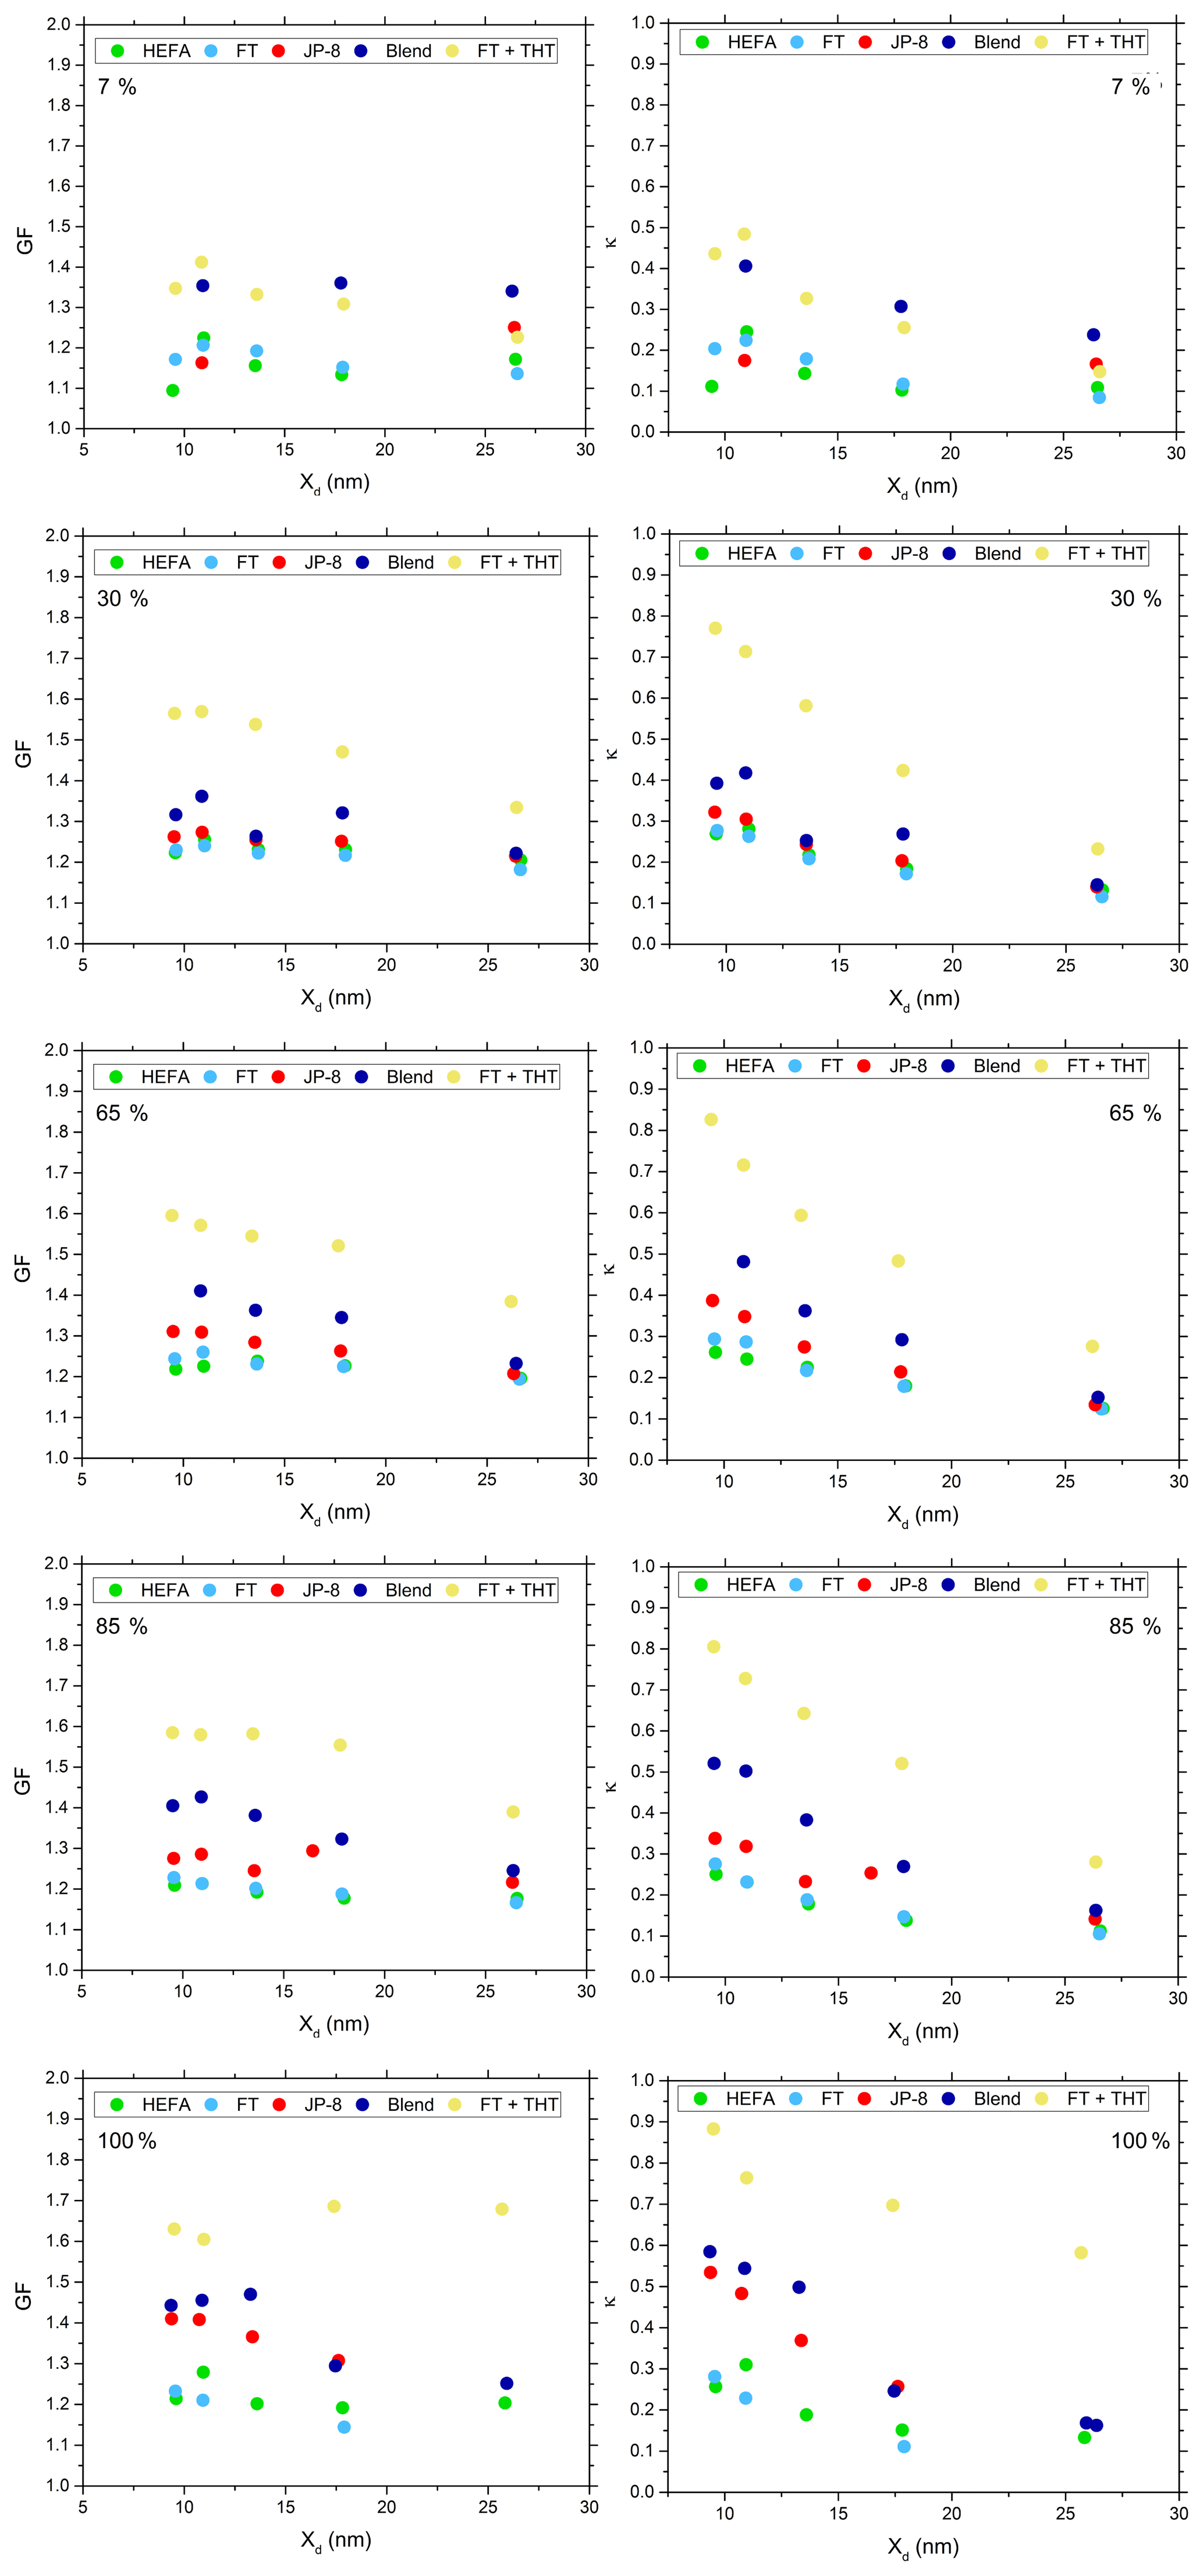
Figure 8GF and κ as a function of Xd for particles generated at different engine thrust conditions and different fuels.
The data acquired with the MST HTDMA system was used to calculate GF and κ of these particles as a function of fuel type, engine thrust condition, and dry particle diameter. The HTDMA was operated with a SR of 0.91. Figure 8 shows GF and κ as a function of Xd for particles generated at different engine thrust conditions and different fuels. The uncertainty in GF was 9 % for particles with diameter ∼10 nm and 3 % for the larger diameters (26 nm). The uncertainty in κ was 7 % and 2 % for particles with diameter ∼10 and ∼26 nm, respectively.
Gysel et al. (2007) state that H2SO4 is expected to retain water at 5 %–10 % relative humidity, corresponding to a growth factor of ∼1.15, and took this into account when calculating the mixed particle growth factor in their data. This procedure was similarly followed for the current dataset. Thus, the measured Xd values were scaled by a factor of 0.869.
For a given engine thrust condition, both GF and κ increased with increasing fuel sulfur content. GF and κ were also observed to be dependent on particle diameter, with the highest GF and κ for particles ∼ 10 nm, and decreasing for large particle diameters. This increase in GF and κ corresponds to the nucleation mode in the size distributions (Fig. 7), which was composed of particles or droplets formed by the homogeneous nucleation of low equilibrium vapor pressure species, such as H2SO4 and other water-soluble organic compounds. The GF and κ were also found to increase with increasing engine thrust condition for a given Xd, with the largest values observed at the 100 % engine thrust condition.
Gysel et al. (2003) reported GF of particles from a jet engine combustor burning three different fuels with 50, 410, and 1270 ppm of sulfur at two inlet temperature operating conditions: 566 and 766 K. These data are in good agreement with the current study for very low sulfur (HEFA and FT) fuels, conventional JP-8, and the sulfur-enhanced FT (FT plus THT), respectively.
A robust, mobile HTDMA system has been developed for field measurements that involve (1) particle sources that are very expensive to operate, (2) exhaust plumes influenced by wind speed and direction, and (3) varying meteorological conditions. The GF exhibited by particles of four inorganic salts was studied and found to be in good agreement with theory and with other experimental data reported in the literature. The fixed SR provided by the HTDMA system during laboratory evaluation (typically ∼0.98) was found to be quite constant over long periods of time, even when the ambient temperature varied considerably, making the MST HTDMA system suitable for field experiments. The HTDMA was demonstrated to perform a scan to determine GF and κ for one dry diameter in approximately 45 s. It performed scans over as many as 12 dry diameters sequentially in ∼9 min. The HTDMA system provided parameterization for hygroscopic properties for aircraft engine exhaust plumes in terms of GF and κ during the AAFEX II field campaign. It was observed that GF and κ (1) increased with fuel sulfur content, (2) increased with increasing engine thrust condition, and (3) decreased with increasing dry particle diameter.
The data included in this paper can be obtained by contacting the authors.
| AAFEX | Alternative Aviation Fuels EXperiment |
| ASTM | American Society for Testing and Materials |
| BC | Bipolar charger |
| CPC | Condensation particle counter |
| DPH | Dew point hygrometer |
| DMA | Differential mobility analyzer |
| DRH | Deliquescence relative humidity – the humidity at which the dry |
| particles abruptly take on water and become solution drops | |
| FT | Fischer–Tropsch |
| GF | Growth factor, Xw∕Xd |
| HTDMA | Hygroscopicity tandem differential mobility analyzer |
| HEFA | Hydroprocessed esters and fatty acids |
| HUM | Humidifier |
| HV1, HV2 | High voltage in DMA1 or DMA2 |
| IB | Ice bath |
| LV | LabVIEW program |
| MST | Missouri University of Science and Technology |
| nvPM | Non-volatile particulate matter |
| PM | Particulate matter |
| R | Ideal gas law constant |
| SR | Saturation ratio |
| SR-calc | Value of SR calculated from measured values of Xd and Xw |
| when using a pure salt | |
| SR-DPH | Value of SR measured by the dew point hygrometer |
| THT | Tetrahydrothiophene |
| dt | s | elapsed time since a trial run began |
| dtmax | s | value of dt when CPC reading is at its maximum |
| Fk | fraction of particles of diameter Xk that carry one elementary charge | |
| LT2 | s | lag time between when voltage is imposed on DMA2 and when the particles |
| selected by that voltage reach the CPC | ||
| Ms | g mol−1 | molecular weight of solute |
| Mw | g mol−1 | molecular weight of water |
| ms | g | mass of water-soluble portion of the dry particle |
| P1, P2 | psia | pressure in Qs1, Qs2 flow in either DMA1 or DMA2 |
| Qp1, Qp2 | L min−1 | polydisperse aerosol gas flow rate, either for DMA1 or DMA2 |
| Qs1, Qs2 | L min−1 | sheath gas flow rate, either for DMA1 or DMA2 |
| Qm1, Qm2 | L min−1 | monodisperse aerosol gas flow rate, either for DMA1 or DMA2 |
| Qd | L min−1 | flow rate of dump gas in parallel with the CPC |
| SNNk | differential size distribution entering the HTDMA system | |
| T | K | absolute temperature |
| TFk | value of transfer function of DMA1 for kth point in the series to determine Xavg | |
| Xavg | nm | average particle diameter exiting the dry DMA, DMA1 |
| Xd | nm | set point diameter of DMA1 |
| Xu | nm | diameter of insoluble core in hybrid particle |
| Xw | nm | diameter of wet particle or solution droplet formed from dry particle after passing |
| through the HUM | ||
| Xwswp | nm | diameter of particles (solution drops) exiting DMA2 as measured by LV doing |
| an automated sweep | ||
| Xk | nm | the kth particle diameter in the series to determine the Xavg |
| Ψ | mol kg−1 | molality of the solution droplet |
| ν | number of ions into which the soluble salt disassociates | |
| Φs | osmotic coefficient of the solution droplet | |
| ρs | g cm−3 | density of soluble material in hybrid particle |
| ρw | g cm−3 | density of water |
| σw∕a | N m−1 | surface tension of water against air |
The supplement related to this article is available online at: https://doi.org/10.5194/acp-18-17029-2018-supplement.
MBT, PL, DEH, and PDW designed the study. MBT performed the laboratory evaluations and field measurements. MBT and SCA developed the LabVIEW code. MBT, PL, SCA, and WL analyzed the data. MBT, PL, and WL prepared the figures. MBT and PL wrote the initial manuscript and subsequent revisions with contributions from DEH, SCA, WL, and PDW.
The authors declare that they have no conflict of interest.
This work was partly funded by the US Federal Aviation Administration (FAA)
through the Partnership for AiR Transportation for Noise and Emissions
Reduction (PARTNER) – an FAA–NASA–Transport Canada–US DoD–US EPA sponsored
Center of Excellence Project 20 under grant no. 09-C-NE-MST amendment 003.
Any opinions, findings, and conclusions or recommendations expressed in this
paper are those of the authors and do not necessarily reflect the views of
the FAA. We thank the entire AAFEX II project team for their support during
the campaign. Otmar Schmid performed many early experiments to validate
the worthiness of this device and provided impetus for continued effort to
develop this instrument. We thank Veronica Villines Teat, Emitt Witt,
Christian Hurst, Nicholas Altese, Elizabeth Black, and Jonathon Sidwell for
their assistance in gathering some of the data. We are also grateful to
Markus Petters and Sonia Kreidenweis for their assistance with the κ calculations.
Edited by: Ari Laaksonen
Reviewed by: three anonymous referees
ASTM International: Standard Specification for Aviation Turbine Fuel Containing Synthesized Hydrocarbons, ASTM D7566, West Conshohocken, PA, https://doi.org/10.1520/D7566-16B, 2016.
Beyersdorf, A. J., Timko, M. T., Ziemba, L. D., Bulzan, D., Corporan, E., Herndon, S. C., Howard, R., Miake-Lye, R., Thornhill, K. L., Winstead, E., Wey, C., Yu, Z., and Anderson, B. E.: Reductions in aircraft particulate emissions due to the use of Fischer–Tropsch fuels, Atmos. Chem. Phys., 14, 11–23, https://doi.org/10.5194/acp-14-11-2014, 2014.
Biskos, G., Paulsen, D., Russell, L. M., Fuseck, P. R., and Martin, S. T.: Prompt deliquescence and efflorescence of aerosol nanoparticles, Atmos. Chem. Phys., 6, 4633–4642, https://doi.org/10.5194/acp-6-4633-2006, 2006.
Brasseur, G. P., Gupta, M., Anderson, B. E., Balasubramanian, S., Barrett, S., Duda, D., Fleming, G., Forster, P. M., Fuglestvedt, J., Gettelman, A., Halthore, R. N., Jacob, S. D., Jacobson, M. Z., Khodayari, A., Liou, K. N., Lund, M. T., Miake-Lye, R. C., Minnis, P., Olsen, S., Penner, J. E., Prinn, R., Schumann, U., Selkirk, H. B., Sokolov, A., Unger, N., Wolfe, P., Wong, H. W., Wuebbles, D. W., Yi, B., Yang, P., and Zhou, C.: Impact of aviation on climate: FAA's Aviation Climate Change Research Initiative (ACCRI) Phase II, B. Am. Meteorol. Soc., 97, 561–583, https://doi.org/10.1175/BAMS-D-13-00089.1, 2016.
Brunelle-Yeung, E., Masek, T., Rojo, J. J., Levy, J. I., Arunachalam, S., Miller, S. M., Barrett, S. R. H., Kuhn, S. R., and Waitz, I. A.: Assessing the impact of aviation environmental policies on public health, Transport Policy, 34, 21–28, https://doi.org/10.1016/j.tranpol.2014.02.015, 2014.
Cocker, D. R., Flagan, R. C., and Seinfeld, J. H.: State-of-the-Art Chamber Facility for Studying Atmospheric Aerosol Chemistry, Environ. Sci. Technol., 35, 2594–2601, https://doi.org/10.1021/es0019169, 2001.
Corporan, E., Edwards, T., Shafer, L., DeWitt, M. J., Klingshirn, C., Zabarnick, S., West, Z., Striebich, R., Graham, J., and Klein, J.: Chemical, Thermal Stability, Seal Swell, and Emissions Studies of Alternative Jet Fuels, Energy Fuels, 25, 955–966, https://doi.org/10.1021/ef101520v, 2011.
Cubison, M. J., Coe, H., and Gysel, M.: A modified hygroscopic tandem DMA and a data retrieval method based on optimal estimation, J. Aerosol Sci., 36, 846–865, https://doi.org/10.1016/j.jaerosci.2004.11.009, 2005.
Ferron, G. A., Karg, E., Busch, B., and Heyder, J.: Ambient particles at an urban, semi-urban and rural site in Central Europe: hygroscopic properties, Atmos. Environ., 39, 343–352, https://doi.org/10.1016/j.atmosenv.2004.09.015, 2005.
Fitzgerald, J., Rogers, J., and Hudson, C. F.: Review of isothermal haze chamber performance, J. Rech. Atmos., 15, 333-346, 1981.
Fors, E. O., Rissler, J., Massling, A., Svenningsson, B., Andreae, M. O., Dusek, U., Frank, G. P., Hoffer, A., Bilde, M., Kiss, G., Janitsek, S., Henning, S., Facchini, M. C., Decesari, S., and Swietlicki, E.: Hygroscopic properties of Amazonian biomass burning and European background HULUS and investigation of their effects on surface tension with two models linking H-TDMA to CCNC data, Atmos. Chem. Phys., 10, 5625–5639, https://doi.org/10.5194/acp-10-5625-2010, 2010.
Gysel, M., Nyeki, S., Weingartner, E., Baltensperger, U., Giebl, H., Hitzenberger, R., Petzold, A., and Wilson, C. W.: Properties of jet engine combustion particles during the PartEmis experiment, Hygroscopicity at subsaturated conditions, Geophys. Res. Lett., 30, 20-1–20-4, https://doi.org/10.1029/2003GL016896, 2003.
Gysel, M., Crosier, J., Topping, D. O., Whitehead, J. D., Bower, K. N., Cubison, M. J., Williams, P. I., Flynn, M. J., McFiggans, G. B., and Coe, H.: Closure study between chemical composition and hygroscopic growth of aerosol particles during TORCH2, Atmos. Chem. Phys., 7, 6131–6144, https://doi.org/10.5194/acp-7-6131-2007, 2007.
Hagen, D. E. and Alofs, D. J.: Linear inversion method to obtain aerosol size distributions from measurements with a differential mobility analyzer, Aerosol Sci. Tech., 2, 465–475, https://doi.org/10.1080/02786828308958650, 1983.
Hagen, D. E., Lobo, P., Whitefield, P. D., Trueblood, M. B., Alofs, D. J., and Schmid, O.: Performance Evaluation of a Fast Mobility-Based Particle Spectrometer for Aircraft Exhaust, J. Propul. Power, 25, 628–634, https://doi.org/10.2514/1.37654, 2009.
Hamer, W. J. and Wu, Y.-C.: Osmotic coefficients and mean activity coefficients of uni-univalent electrolytes in water at 25C, J. Phys. Chem. Ref. Data, 1, 1–54, https://doi.org/10.1063/1.3253108, 1972.
Hämeri, K., Väkevä, M., Hansson, H.-C., and Laaksonen, A.: Hygroscopic growth of ultrafine ammonium sulphate aerosol measured using an ultrafine tandem differential mobility analyser, J. Geophys. Res., 105, 22231–22242, https://doi.org/10.1029/2000JD900220, 2000.
Hämeri, K., Laaksonen, A., Väkevä, M., and Suni, T.: Hygroscopic growth of ultrafine sodium chloride particles, J. Geophys. Res., 106, 20749–20757, https://doi.org/10.1029/2000JD000200, 2001.
Hennig, T., Massling, A., Brechtel, F. J., and Wiedensohler, A.: A Tandem DMA for highly temperature-stabilized hygroscopic particle growth measurements between 90 % and 98 % relative humidity, J. Aerosol Sci., 36, 1210–1223, https://doi.org/10.1016/j.jaerosci.2005.01.005, 2005.
Holmgren, H., Sellegri, K., Hervo, M., Rose, C., Freney, E., Villani, P., and Laj, P.: Hygroscopic properties and mixing state of aerosol measured at the high-altitude site Puy de Dome (1465 m a.s.l.), France, Atmos. Chem. Phys., 14, 9537–9554, https://doi.org/10.5194/acp-14-9537-2014, 2014.
Horvath, H.: Estimation of the Average Visibility in Central Europe, Atmos. Environ., 29, 241–246, https://doi.org/10.1016/1352-2310(94)00236-E, 1995.
Hu, D., Qiao, L., Chen, J., Ye, X., Yang, X., Cheng, T., and Fang, W.: Hygroscopicity of inorganic aerosols: Size and Relative Humidity Effects on the Growth Factor, Aerosol Air Qual. Res., 10, 255–264, https://doi.org/10.4209/aaqr.2009.12.0076, 2010.
Johnson, G. R., Fletcher, C., Meyer, N., Modini, R., and Ristovski, Z. D.: A robust, portable H-TDMA for field use, J. Aerosol Sci., 39, 850–861, https://doi.org/10.1016/j.jaerosci.2008.05.005, 2008.
Kim, Y. J., Kim, K. W., Kim, S. D., Lee, B. K., and Han, J. S.: Fine particulate matter characteristics and its impact on visibility impairment at two urban sites in Korea: Seoul and Incheon, Atmos. Environ., 40, S593–S605, https://doi.org/10.1016/j.atmosenv.2005.11.076, 2006.
Lee, D. S., Fahey, D. W., Forster, P. M., Newton, P. J., Wit, R. C. N., Lim, L. L., Owen, B., and Sausen, R.: Aviation and global climate change in the 21st century, Atmos. Environ., 43, 3520–3537, https://doi.org/10.1016/j.atmosenv.2009.04.024, 2009.
Levy, J. I., Woody, M., Baek, B. H., Shankar, U., and Arunachalam, S.: Current and future particulate-matter-related mortality risks in the United States from aviation emissions during landing and takeoff, Risk Analysis, 32, 237–249, https://doi.org/10.1111/j.1539-6924.2011.01660.x, 2012.
Lobo, P., Hagen, D. E., Whitefield, P. D., and Alofs, D. J.: Physical characterization of aerosol emissions from a commercial gas turbine engine, J. Propul. Power, 23, 919–929, https://doi.org/10.2514/1.26772, 2007.
Lobo, P., Hagen, D. E., and Whitefield, P. D.: Comparison of PM emissions from a Commercial Jet Engine burning Conventional, Biomass, and Fischer–Tropsch Fuels, Environ. Sci. Technol., 45, 10744–10749, https://doi.org/10.1021/es201902e, 2011.
Lobo, P., Hagen, D. E., and Whitefield, P. D.: Measurement and analysis of aircraft engine PM emissions downwind of an active runway at the Oakland International Airport, Atmos. Environ., 61, 114–123, https://doi.org/10.1016/j.atmosenv.2012.07.028, 2012.
Lobo, P., Hagen, D. E., Whitefield, P. D., and Raper, D.: PM emissions measurements of in-service commercial aircraft engines during the Delta-Atlanta Hartsfield Study, Atmos. Environ., 104, 237–245, https://doi.org/10.1016/j.atmosenv.2015.01.020, 2015a.
Lobo, P., Christie, S., Khandelwal, B., Blakey, S. G., and Raper, D. W.: Evaluation of Non-volatile Particulate Matter Emission Characteristics of an Aircraft Auxiliary Power Unit with varying Alternative Jet Fuel Blend Ratios, Energy Fuels, 29, 7705–7711, https://doi.org/10.1021/acs.energyfuels.5b01758, 2015b.
Lobo, P., Condevaux, J., Yu, Z., Kuhlmann, J., Hagen, D. E., Miake-Lye, R. C., Whitefield, P. D., and Raper, D. W.: Demonstration of a Regulatory Method for Aircraft Engine Nonvolatile PM Emissions Measurements with Conventional and Isoparaffinic Kerosene fuels, Energy Fuels, 30, 7770–7777, https://doi.org/10.1021/acs.energyfuels.6b01581, 2016.
Lopez-Yglesias, X. F., Yeung, M. C., Dey, S. E., Brechtel, F. J., and Chan, C. K.: Performance evaluation of the Brechtel Mfg. Humidified Tandem Differential Mobility Analyzer (BMI HTDMA) for studying hygroscopic properties of aerosol particles, Aerosol Sci. Tech., 48, 969–980, https://doi.org/10.1080/02786826.2014.952366, 2014.
Massling, A., Leinert, S., Wiedensohler, A., and Covert, D.: Hygroscopic growth of sub-micrometer and one-micrometer aerosol particles measured during ACE-Asia, Atmos. Chem. Phys., 7, 3249–3259, https://doi.org/10.5194/acp-7-3249-2007, 2007.
Massling, A., Niedermeier, N., Hennig, T., Fors, E. O., Swietlicki, E., Ehn, M., Hameri, K., Villani, P., Laj, P., Good, N., McFiggans, G., and Wiedensohler, A.: Results and recommendations from an intercomparison of six Hygroscopicity-TDMA systems, Atmos. Meas. Tech., 4, 485–497, https://doi.org/10.5194/amt-4-485-2011, 2011.
McMurry, P. H. and Stolzenburg, M. R.: On the Sensitivity of Particle Size to Relative Humidity for Los Angeles Aerosols, Atmos. Environ., 23, 497–507, https://doi.org/10.1016/0004-6981(89)90593-3, 1989.
Meier, J., Wehner, B., Massling, A., Birmili, W., Nowak, A., Gnauk, T., Brüggemann, E., Herrmann, H., Min, H., and Wiedensohler, A.: Hygroscopic growth of urban aerosol particles in Beijing (China) during wintertime: a comparison of three experimental methods, Atmos. Chem. Phys., 9, 6865–6880, https://doi.org/10.5194/acp-9-6865-2009, 2009.
Miake-Lye, R. C., Anderson, B. E., Cofer, W. R., Wallio, H. A., Nowicki, G. D., Ballenthin, J. O., Hunton, D. E., Knighton, W. B., Miller, T. M., Seeley, J. V., and Viggiano, A. A.: SOx oxidation and volatile aerosol in aircraft exhaust plumes depend on fuel sulfur content, Geophys. Res. Lett., 25, 1677–1680, https://doi.org/10.1029/98GL00064, 1998.
Mikhailov, E., Vlasenko, S., Niessner, R., and Pöschl, U.: Interaction of aerosol particles composed of protein and salts with water vapor: hygroscopic growth and microstructural rearrangement, Atmos. Chem. Phys., 34, 323–350, https://doi.org/10.5194/acp-4-323-2004, 2004.
Moore, R. H., Shook, M., Beyersdorf, A., Corr, C., Herndon, S., Knighton, W. B., Miake-Lye, R., Thornhill, K. L., Winstead, E. L., Yu, Z., Ziemba, L. D., and Anderson, B. E.: Influence of Jet Fuel Composition on Aircraft Engine Emissions: A Synthesis of Aerosol Emissions Data from the NASA APEX, AAFEX, and ACCESS Missions, Energy Fuels, 29, 2591–2600, https://doi.org/10.1021/ef502618w, 2015.
Onasch, T. B., Jayne, J. T., Herndon, S., Worsnop, D. R., Miake-Lye, R. C., Mortimer, I. P., and Anderson, B. E.: Chemical properties of aircraft engine particulate exhaust emissions, J. Propul. Power, 25, 1121–1137, https://doi.org/10.2514/1.36371, 2009.
Park, K., Kim, J. S., and Miller, A. L.: A study on effects of size and structure on hygroscopicity of nanoparticles using a tandem differential mobility analyzer and TEM, J. Nanopart. Res., 11, 175–183, https://doi.org/10.1007/s11051-008-9462-4, 2009a.
Park, K., Kim, J. S., and Park, S. H.: Measurements of hygroscopicity and volatility of atmospheric ultrafine particles during ultrafine particle formation events at urban, industrial, and coastal sites, Environ. Sci. Technol., 43, 6710–6716, https://doi.org/10.1021/es900398q, 2009b.
Petters, M. D. and Kreidenweis, S. M.: A single parameter representation of hygroscopic growth and cloud condensation nucleus activity, Atmos. Chem. Phys., 7, 1961–1971, https://doi.org/10.5194/acp-7-1961-2007, 2007.
Popovicheva, O., Persiantseva, N. M., Shonija, N. K., DeMott, P., Koehler, K., Petters, M., Kreidenweis, S., Tishkova, V., Demirdjian, B., and Suzanne, J.: Water interaction with hydrophobic and hydrophilic soot particles, Phys. Chem. Chem. Phys., 10, 2332–2344, https://doi.org/10.1039/b718944n, 2008.
Pruppacher, H. R. and Klett, J. D.: Microphysics of Clouds and Precipitation, 1st Edn., D. Reidel Publishing Co, Dordrecht, Holland, 141–146, 1978.
Reavell, K., Hands, T., and Collings, N.: A fast response particulate spectrometer for combustion aerosols, SAE Technical Paper 2002-01-2714, : Society of Automotive Engineers, Warrendale, PA, USA, https://doi.org/10.4271/2002-01-2714, 2002.
Robinson, R. A., and Stokes, R. H: Electrolyte Solutions, 2nd Edn., Dover Publications, Mineola, New York, 2002.
Rye, L., Lobo, P., Williams, P. I., Uryga-Bugajska, I., Christie, S., Wilson, C., Hagen, D., Whitefield, P., Blakey, S., Coe, H., Raper, D., and Pourkashanian, M.: Inadequacy of Optical Smoke Measurements for Characterization of Non-Light Absorbing Particulate Matter Emissions from Gas Turbine Engines, Combust. Sci. Technol., 184, 2068–2083, https://doi.org/10.1080/00102202.2012.697499, 2012.
Saleh, R., Shihadeh, A., and Khlystov, A.: On transport phenomena and equilibration time scales in thermodenuders, Atmos. Meas. Tech., 4, 571–581, https://doi.org/10.5194/amt-4-571-2011, 2011.
Schmid, O.: Tandem differential mobility analyzer studies and aerosol volatility, PhD thesis, University of Missouri-Rolla, Rolla, Missouri, USA, 1–206, 2000.
Schumann, U., Arnold, F., Busen, R., Curtius, J., Kärcher, B., Kiendler, A., Petzold, A., Schlager, H., Schröder, F., and Wohlfrom, K. H.: Influence of fuel sulfur on the composition of aircraft exhaust plumes: The experiments SULFUR 1–7, J. Geophys. Res., 107, AAC 2-1–AAC 2-27, https://doi.org/10.1029/2001JD000813, 2002.
Shi, Y., Ge, M., and Wang, W.: Hygroscopicity of internally mixed aerosol particles containing benzoic acid and inorganic salts, Atmos. Environ., 60, 9–17, https://doi.org/10.1016/j.atmosenv.2012.06.034, 2012.
Staples, B. R.: Activity and osmotic coefficients of aqueous sulfuric acid at 298.15 K, J. Phys. Chem. Ref. Data, 10, 779–798, https://doi.org/10.1063/1.555648, 1981.
Suda, S. R. and Petters, M.: Accurate determination of aerosol activity coefficients at relative humidities up to 99 % using the hygroscopicity tandem differential mobility analyzer technique, Aerosol Sci. Tech., 47, 991–1000, https://doi.org/10.1080/02786826.2013.807906, 2013.
Swietlicki, E., Hansson, H. C., Hämeri, K., Svenningsson, B., Massling, A., McFiggans, G., McMurry, P. H., Petäjä, T., Tunved, P., Gysel, M., Topping, D., Weingartner, E., Baltensperger, U., Rissler, J., Wiedensohler, A., and Kulmala, M.: Hygroscopic properties of submicrometer atmospheric aerosol particles measured with H-TDMA instruments in various environments – a review, Tellus B, 60, 432–469, https://doi.org/10.1111/j.1600-0889.2008.00350.x, 2008.
Tang, I. N., Wong, W. T., and Munkelwitz, H. R.: The relative importance of atmospheric sulfates and nitrates in visibility reduction, Atmos. Environ., 15, 2463–2471, https://doi.org/10.1016/0004-6981(81)90062-7, 1981.
Timko, M. T., Yu, Z., Onasch, T. B., Wong, H.-W., Miake-Lye, R. C., Beyersdorf, A. J., Anderson, B. E., Thornhill, K. L., Winstead, E. L., Corporan, E., DeWitt, M. J., Klingshirn, C. D., Wey, C., Tacina, K., Liscinsky, D. S., Howard, R., and Bhargava, A.: Particulate Emissions of Gas Turbine Engine Combustion of a Fischer–Tropsch Synthetic Fuel, Energy Fuels, 24, 5883–5896, https://doi.org/10.1021/ef100727t, 2010.
Timko, M. T., Fortner, E., Franklin, J., Yu, Z., Wong, H. W., Onasch, T. B., Miake-Lye, R. C., and Herndon, S. C.: Atmospheric measurements of the physical evolution of aircraft exhaust plumes, Environ. Sci. Technol., 47, 3513–3520, https://doi.org/10.1021/es304349c, 2013.
Unal, A., Hu, Y., Chang, M. E., Odman, M. T., and Russell, A. G.: Airport related emissions and impacts on air quality: Application to the Atlanta International Airport, Atmos. Environ., 39, 5787–5798, https://doi.org/10.1016/j.atmosenv.2005.05.051, 2005.
Virkkula, A., Van Dingenen, R., Raes, F., and Hjorth, J.: Hygroscopic properties of aerosol formed by oxidation of limonene, α-pinene, and β-pinene, J. Geophys. Res., 104, 3569–3579, https://doi.org/10.1029/1998JD100017, 1999.
Weingartner, E., Burtscher, H., and Baltensperger, U.: Hygroscopic properties of carbon and diesel soot particles, Atmos. Environ., 31, 2311–2327, https://doi.org/10.1016/S1352-2310(97)00023-X, 1997.
Weingartner, E., Gysel, M., and Baltensperger, U.: Hygroscopicity of aerosol particles at low temperatures. 1. New low-temperature H-TDMA instrument: Setup and first applications, Environ. Sci. Technol., 36, 55–62, https://doi.org/10.1021/es010054o, 2002.
Woods, E., Heylman, K. D., Gibson, A. K., Ashwell, A. P., and Rossi, S. R.: Effects of NOy aging on the dehydration dynamics of model sea spray aerosols, J. Phys. Chem. A, 117, 4214–4222, https://doi.org/10.1021/jp401646d, 2013.
Woody, M., Baek, B. H., Adelman, Z., Omary, M., Lam, Y. F., West, J. J., and Arunachalam, S.: An assessment of aviation's contribution to current and future fine particulate matter in the United States, Atmos. Environ., 45, 3424–3433, https://doi.org/10.1016/j.atmosenv.2011.03.041, 2011.
Wu, Z., Birmili, W., Poulain, L., Wang, Z., Merkel, M., Fahlbusch, B., van Pinxteren, D., Herrmann, H., and Wiedensohler, A.: Particle hygroscopicity during atmospheric new particle formation events: implications for the chemical species contributing to particle growth, Atmos. Chem. Phys., 13, 6637–6646, https://doi.org/10.5194/acp-13-6637-2013, 2013
Wyslouzil, B. E., Carleton, K. L., Sonnenfroh, D. M., Rawlins, W. T., and Arnold, S.: Observation of hydration of single, modified carbon aerosols, Geophys. Res. Lett., 21, 2107–2110, https://doi.org/10.1029/94GL01588, 1994.
Zhang, R., Khalizov, A. F., Pagels, J., Zhang, D., Xue, H., and McMurry, P. H.: Variability in morphology, hygroscopicity, and optical properties of soot aerosols during atmospheric processing, P. Natl. Acad. Sci. USA, 105, 10291–10296, https://doi.org/10.1073/pnas.0804860105, 2008.