the Creative Commons Attribution 3.0 License.
the Creative Commons Attribution 3.0 License.
Three years of measurements of light-absorbing aerosols over coastal Namibia: seasonality, origin, and transport
Paola Formenti
Stuart John Piketh
Andreas Namwoonde
Danitza Klopper
Roelof Burger
Mathieu Cazaunau
Anaïs Feron
Cécile Gaimoz
Stephen Broccardo
Nicola Walton
Karine Desboeufs
Guillaume Siour
Mattheus Hanghome
Samuel Mafwila
Edosa Omoregie
Wolfgang Junkermann
Willy Maenhaut
Continuous measurements between July 2012 and December 2015 at the Henties Bay Aerosol Observatory (HBAO; 22∘ S, 14∘05′ E), Namibia, show that, during the austral wintertime, transport of light-absorbing black carbon aerosols occurs at low level into the marine boundary layer. The average of daily concentrations of equivalent black carbon (eBC) over the whole sampling period is 53 (±55) ng m−3. Peak values above 200 ng m−3 and up to 800 ng m−3 occur seasonally from May to August, ahead of the dry season peak of biomass burning in southern Africa (August to October). Analysis of 3-day air mass back-trajectories show that air masses from the South Atlantic Ocean south of Henties Bay are generally cleaner than air having originated over the ocean north of Henties Bay, influenced by the outflow of the major biomass burning plume, and from the continent, where wildfires occur. Additional episodic peak concentrations, even for oceanic transport, indicate that pollution from distant sources in South Africa and maritime traffic along the Atlantic ship tracks could be important. While we expect the direct radiative effect to be negligible, the indirect effect on the microphysical properties of the stratocumulus clouds and the deposition to the ocean could be significant and deserve further investigation, specifically ahead of the dry season.
- Article
(16691 KB) - Full-text XML
-
Supplement
(257 KB) - BibTeX
- EndNote


Aerosol particles of natural and anthropogenic origin affect the Earth's climate and modulate the greenhouse effect of long-lived gases (Boucher et al., 2013). The extent of this modulation depends on their nature, in particular on their chemical composition and size distribution determining their interactions with radiation and clouds. Current understanding suggests that atmospheric aerosols increase the global outgoing shortwave radiation, enhancing the atmospheric albedo, thereby counteracting the warming effect of greenhouse gases (Boucher et al., 2013). However, light-absorbing aerosols, such as black carbon (BC) from fossil fuel combustion and biomass burning, can reduce the amount of outgoing radiation at the top of atmosphere (TOA), finally adding to the greenhouse effect (Haywood and Shine, 1995; Jacobson, 2001; Chung and Seinfeld, 2002; Bond and Bergstrom, 2006; Koch and Del Genio, 2010; Bond et al., 2013). The heating radiative effect of BC aerosols is either enhanced or suppressed if they are above or below clouds, respectively (Keil and Haywood, 2003; Koch and Del Genio, 2010). The local heating induced by light absorption below clouds could modify the cloud properties by enhancing the vertical motion and increasing the cloud cover and liquid water content (Koch and Del Genio, 2010). Finally, by entrainment into clouds, BC-containing aerosols could cause the cloud to evaporate and rise (Hansen et al., 1997) and reduce the cloud mean drop size diameters, increase droplet concentrations and henceforth reflectivity (Seinfeld and Pandis, 1997).
These processes are relevant to the western coast of southern Africa, pointed out by the latest Intergovernmental Panel for Climate Change (IPCC) report as a region where future warming and reductions in precipitation should be severe (Maúre et al., 2018).
The west coast of southern Africa is characterised by a persistent and extended stratocumulus cloud deck topping a shallow, stable marine boundary layer maintained by the cold sea-surface temperatures of the Benguela Current (Cook et al., 2004; Tyson and Preston-Whyte, 2002), and by high loading of light-absorbing aerosols, mostly from seasonal biomass burning in the austral dry season (Swap et al., 2002), but possibly from various local and distant anthropogenic activities including ship traffic and energy production (Piketh et al., 1999; Formenti et al., 1999; Tournadre, 2004). Stratocumulus clouds are highly reflective and efficient in modifying the net radiative balance at TOA (Boucher et al., 2013). However, the mechanisms by which they could interact with light-absorbing aerosols, and the direct and indirect effects of those interactions on the regional radiative budget, are largely unknown (Keil and Haywood, 2003; Flato et al., 2013; Myhre et al., 2013).
To address these questions, a large observational effort was initiated in the last few years by a number of coordinated intensive airborne and ground-based field campaigns, analysis of spaceborne observations, and climate modelling (Zuidema et al., 2016). These experiments focused on the dry season period between July and October, when biomass burning aerosols contribute by optically dense plumes with instantaneous aerosol optical depth (AOD) systematically larger than 0.5 at mid-visible wavelengths (Swap et al., 2002). The emission, transport and direct radiative effect of light-absorbing carbonaceous aerosols by biomass burning aerosols also motivated previous experiments, such as the Southern African Regional Science Initiative (SAFARI 2000; Swap et al., 2002) and the Southern African Fire-Atmosphere Research Initiative (SAFARI; Andreae et al., 1996).
However, little is known about the aerosol concentrations and properties outside this season.
To fill this gap, this paper presents the first results of the mass concentrations of light-absorbing carbonaceous aerosols on the Atlantic coast of Namibia from 3 years of observations at the Henties Bay Aerosol Observatory (HBAO; 22∘ S, 14∘05′ E) long-term ground-based surface station.
Measurements of the mass concentrations of equivalent black carbon (eBC) recorded between July 2012 and December 2015 in the marine boundary layer below the stratocumulus deck are analysed to gather new knowledge on importance and seasonality. Observations are coupled with calculations of air mass back-trajectories to identify the dominant transport patterns and quantify their contributions. A comparison to the MERRA-2 model reanalysis is performed.
Surface observations of aerosol particles are conducted at the Henties Bay Aerosol Observatory (HBAO; http://www.hbao.cnrs.fr/, last access: 12 November 2018), a recent regional station in the Global Atmosphere Watch (GAW) programme of the World Meteorological Organization (WMO). The research centre is located on the Sam Nujoma Marine and Coastal Resources Research Centre (SANUMARC) of the University of Namibia in Henties Bay (22∘ S, 14∘05′ E), Namibia (Fig. 1). Henties Bay is a small town in an arid environment with no vegetation, no industrial activity and very little traffic. Energy usage is predominantly a mix of electricity and gas, with some solid fuel combustion (wood) due to low availability (Andreas Namwoonde, personal communication, 2017). The monitoring site, situated on the university campus, is located on the coast approximately 100 m from the shoreline. To the east are the Namibian gravel plains, 3 km to the south of the campus is the town of Henties Bay and to the north is the Omaruru riverbed (river mouth approximately 100 m from SANUMARC). The population of Henties Bay ranges between 4600 and 6000 inhabitants, according to the Namibia 2011 Population and Housing Census Main Report (available at http://cms.my.na/assets/documents/p19dmn58guram30ttun89rdrp1.pdf, last access: 12 November 2018).
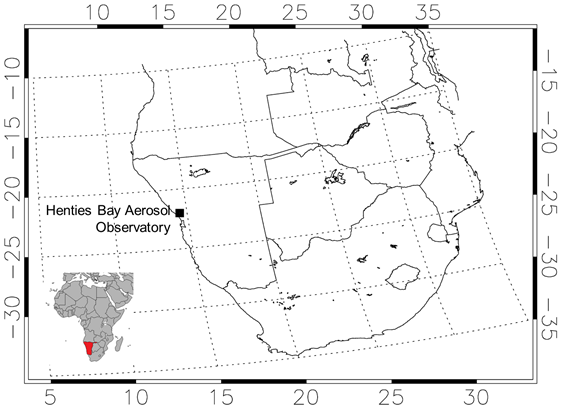

Figure 2(a) comparisons of the time series of daily eBC mass concentrations (ng m−3) measured at HBAO and predicted by the MERRA-2 reanalysis. The light grey boxes indicate periods of increasing concentrations. The light blue boxes indicate periods of decreasing concentrations; (b) box and whisker plot representation of the respective monthly variability.
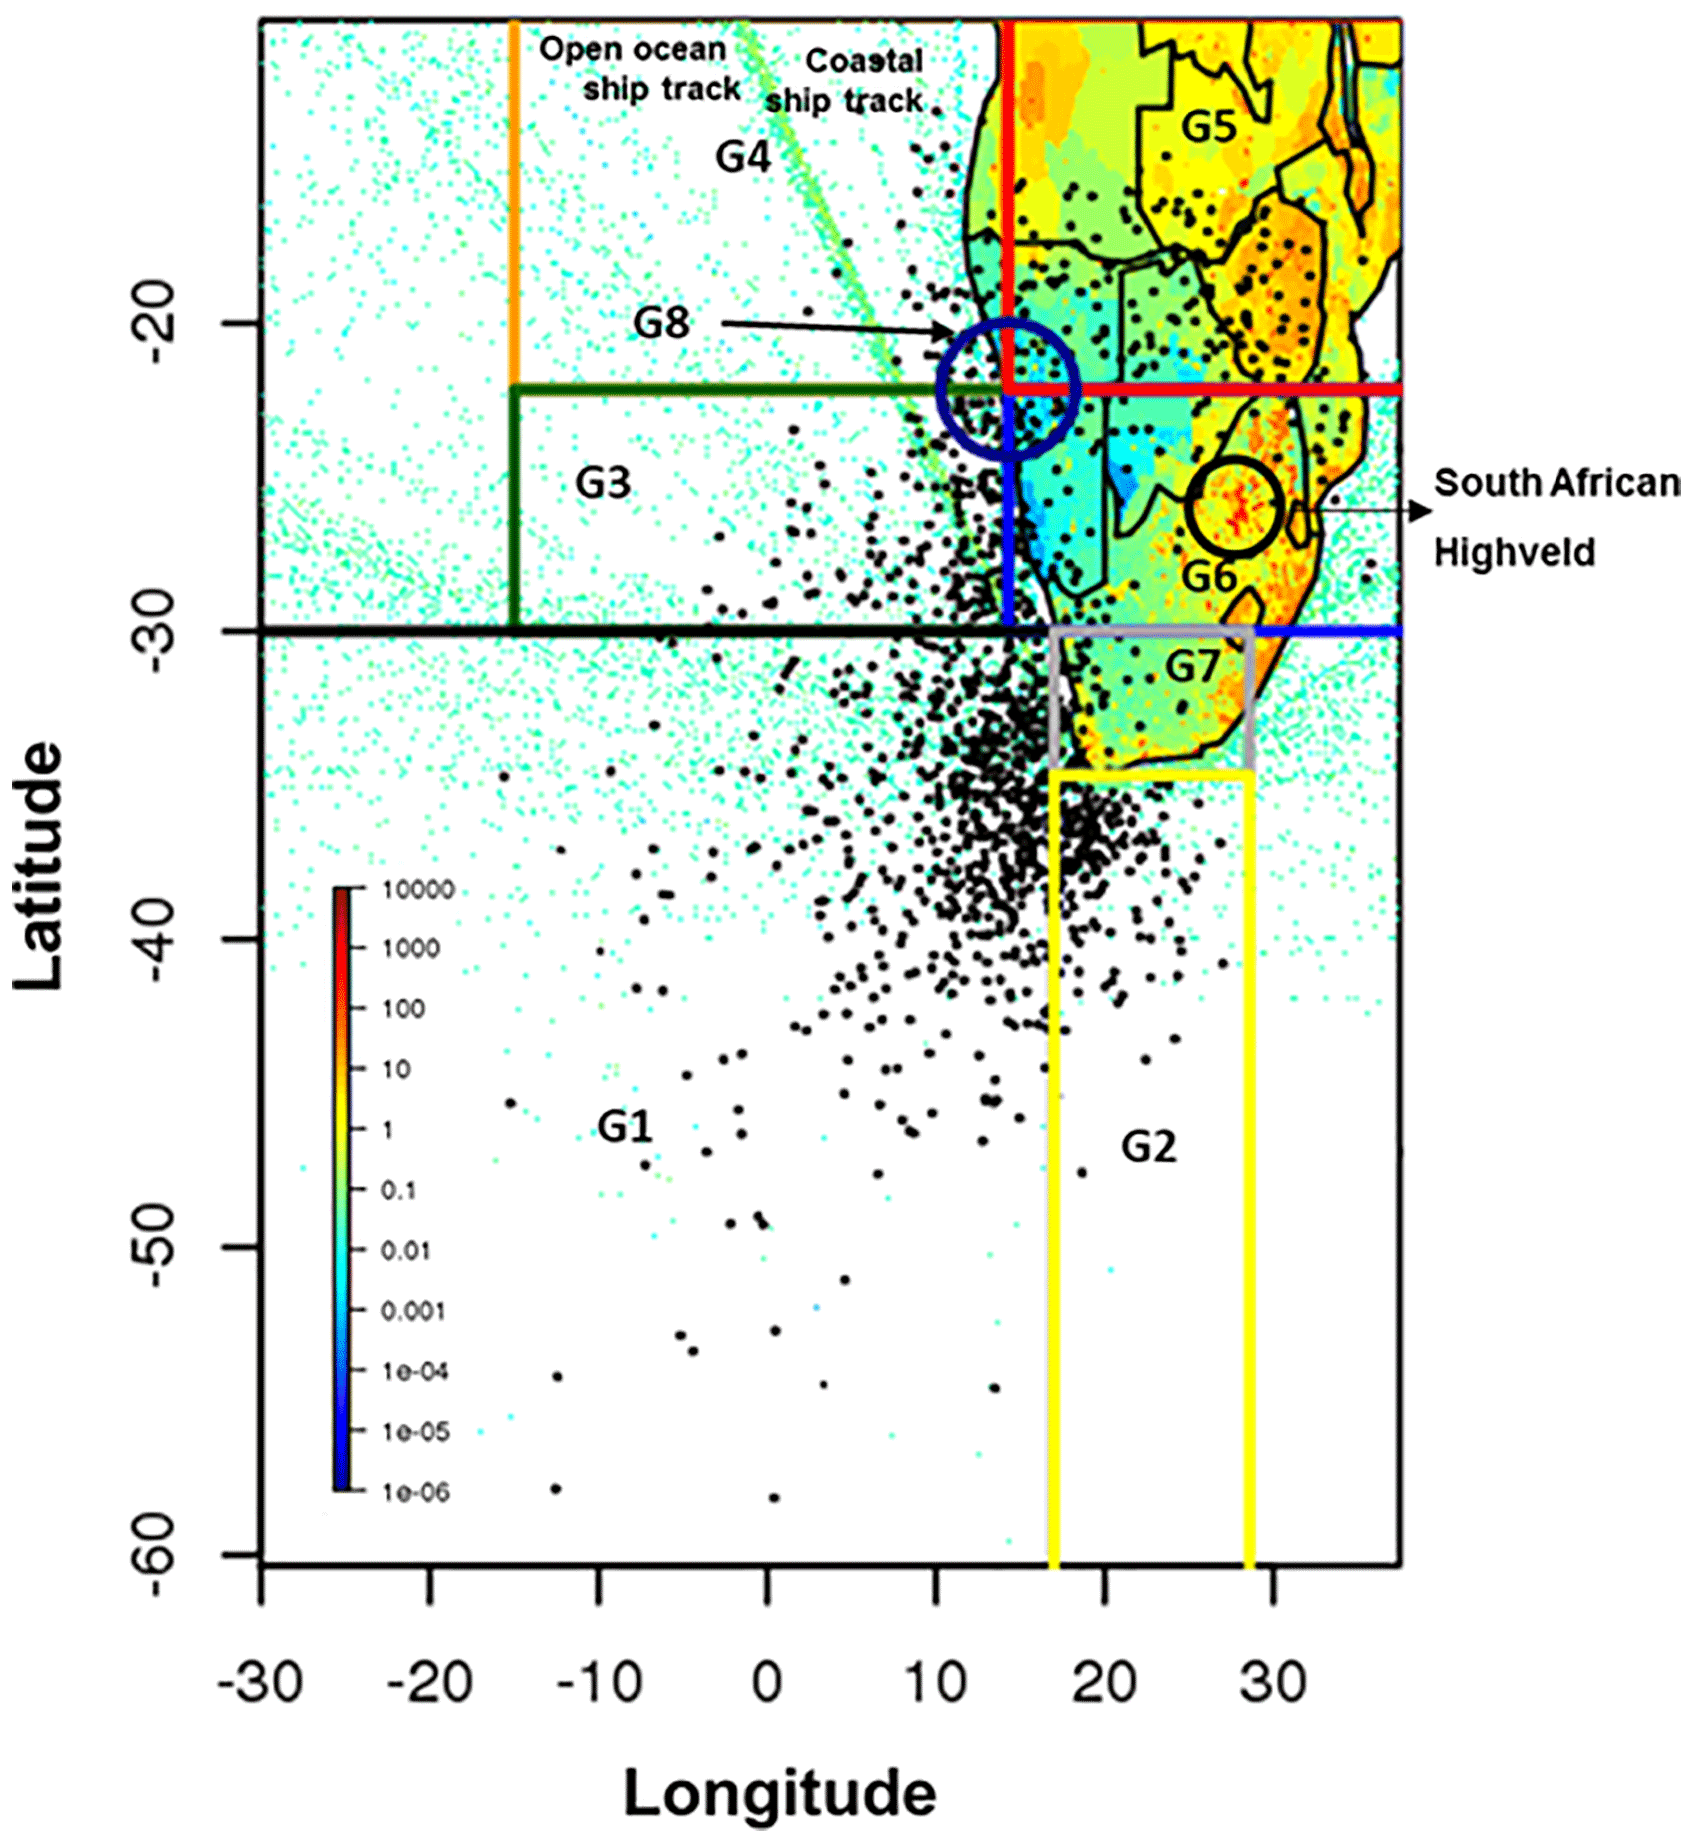
Figure 3Geographical boundaries of the sectors used to classify the air mass back-trajectories superimposed to the emission grid maps at of BC aerosols from anthropogenic activities for the year 2010 provided by the HTAP_V2 inventory. Emissions are expressed in tonnes.
2.1 Measurements of light – optical attenuation
Instruments at HBAO operate from a roof terrace at approximately 30 m above the ground. The terrace hosts the sampling inlets, from which air is drawn into a laboratory room located underneath by straight stainless-steel pipes to avoid particle losses. The optical attenuation of light (ATN) by aerosol particles smaller than 1 µm in aerodynamic diameter was measured by a single-wavelength aethalometer (model AE-14U, Magee Sci., Berkeley, CA, USA) operating at 880 nm and sampling at 3.5 (±0.1) L min−1 from a certified PM1 inlet (BGI Inc., Waltham, MA). The physical principle of operation of the aethalometer is detailed in Hansen et al. (1984). Measurements were performed at a 5 min time resolution and stored on a data logger (model CR-1000, Campbell Sci. Ltd.). The original dataset was screened to eliminate spikes and peaks lasting less than 2 h, generally associated with open fires for barbecuing meat. The data record extended from July 2012 to December 2015, with an extended data gap between January and July 2014 due instrument maintenance.
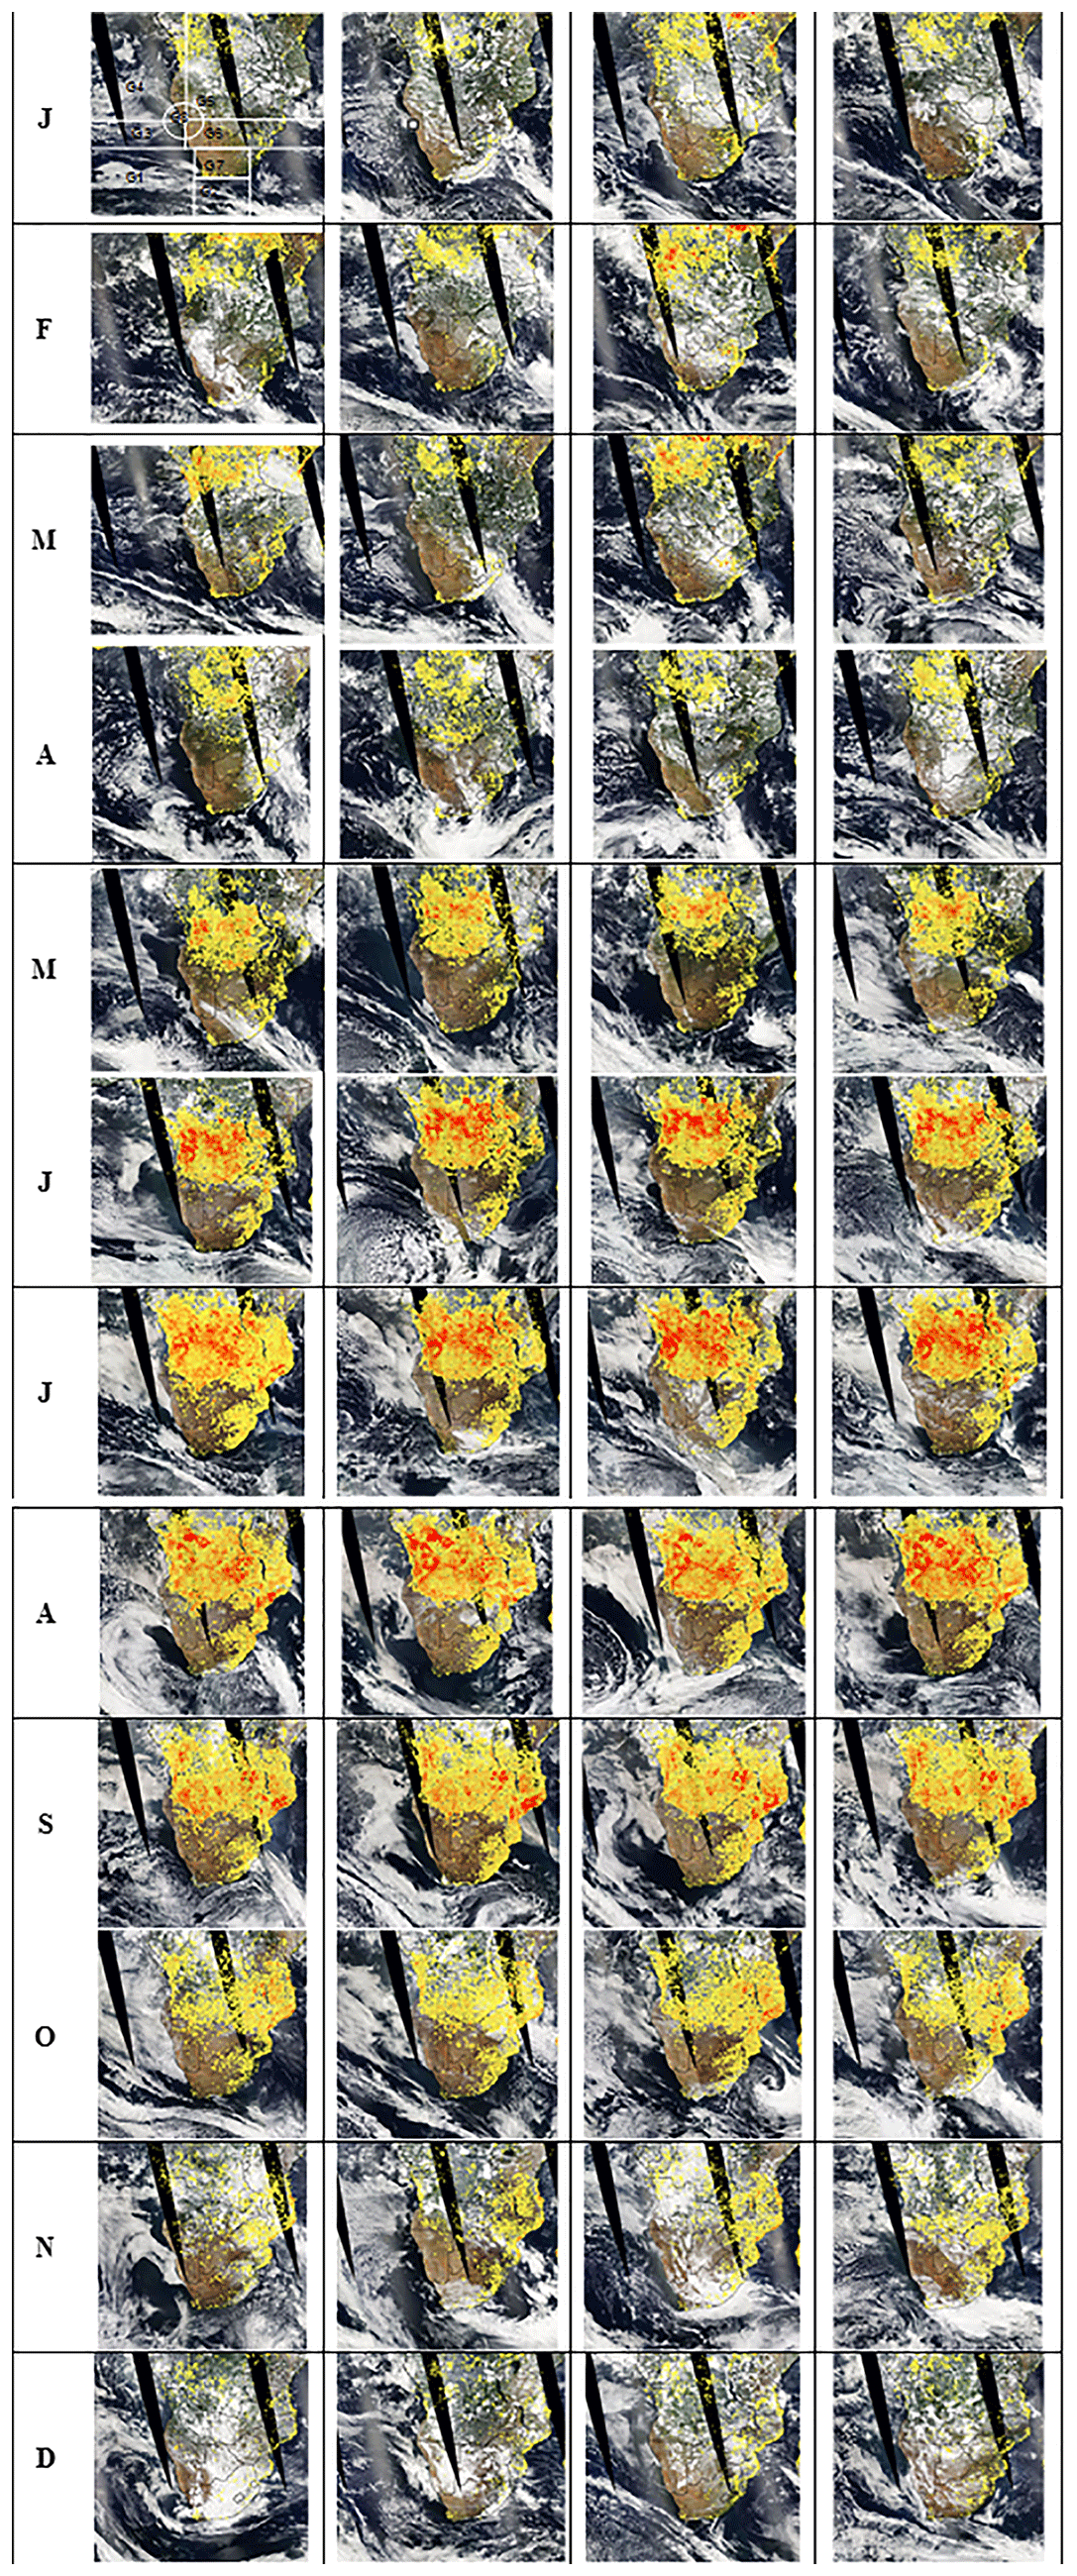
Figure 4Fire counts per pixel from MODIS/Aqua provided by the NASA Fire Information for Resources Management System (FIRMS). Colours range from yellow (1 fire count per pixel) to red (>100 fire counts per pixel). The underlying image is the corrected reflectance (true colour) measured by MODIS/Aqua on the first day of each month.
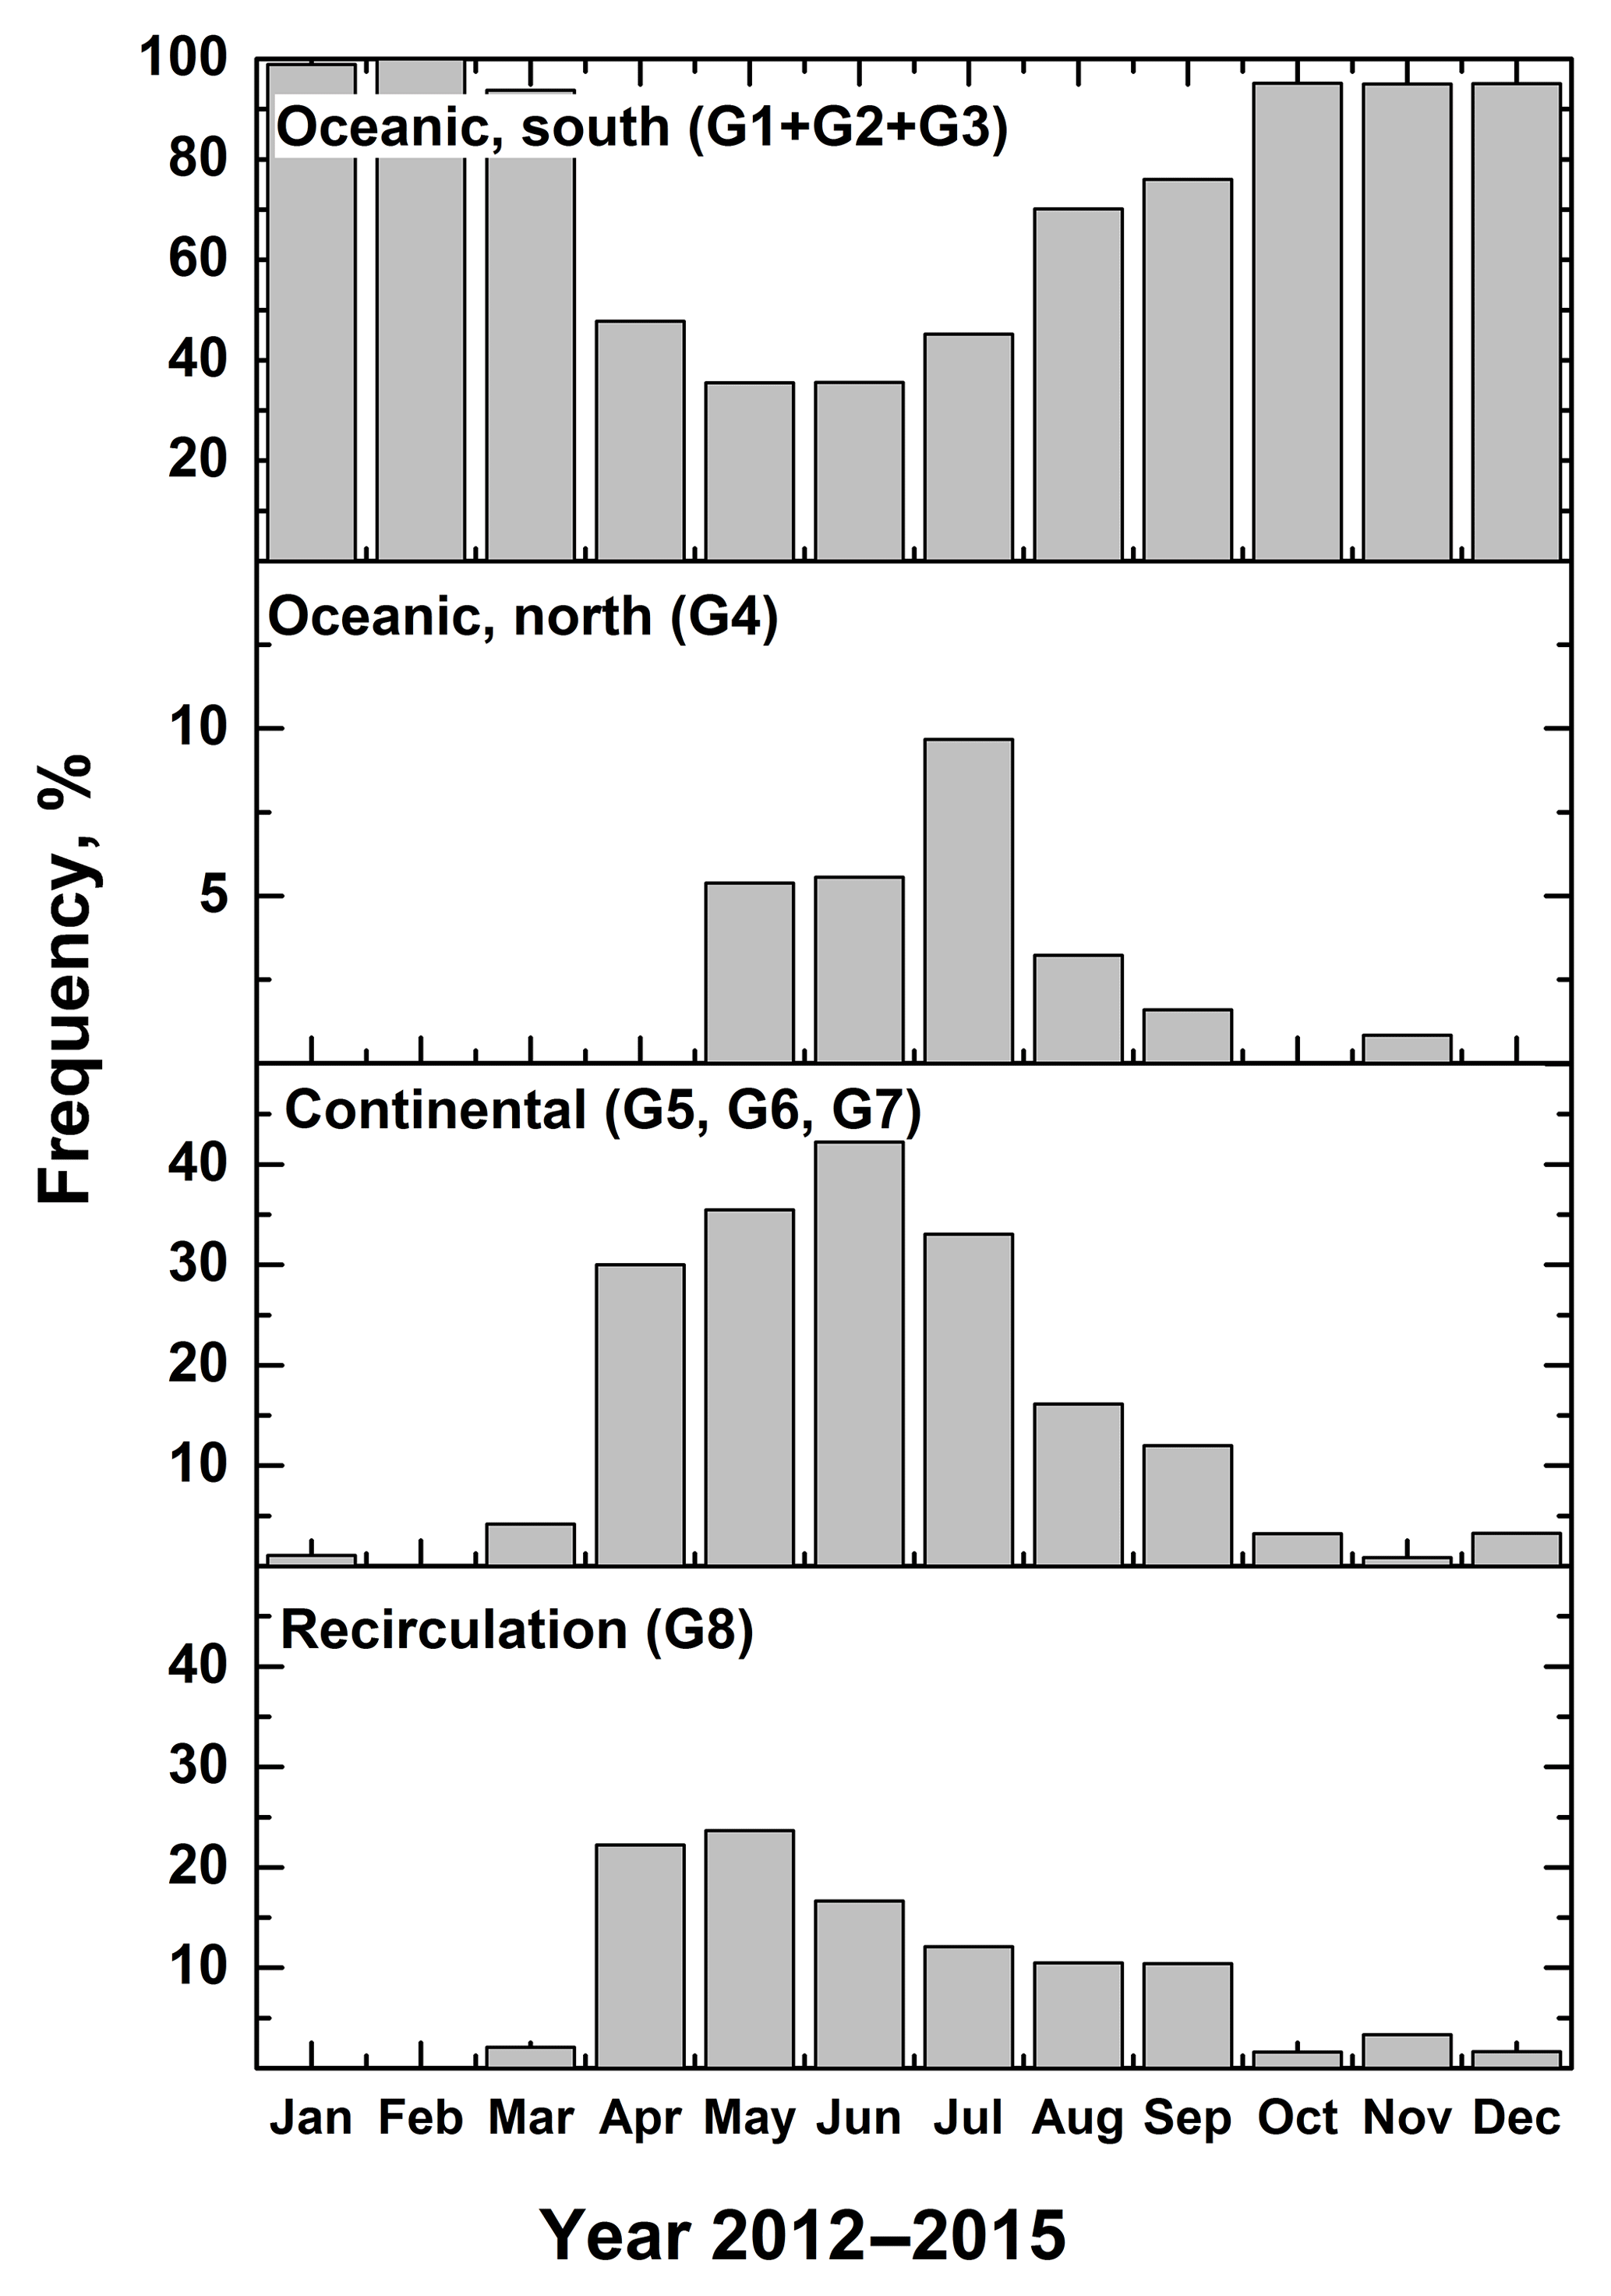
Figure 5Seasonal variation in the transport pathways of air masses reaching HBAO between 2012 and 2015.
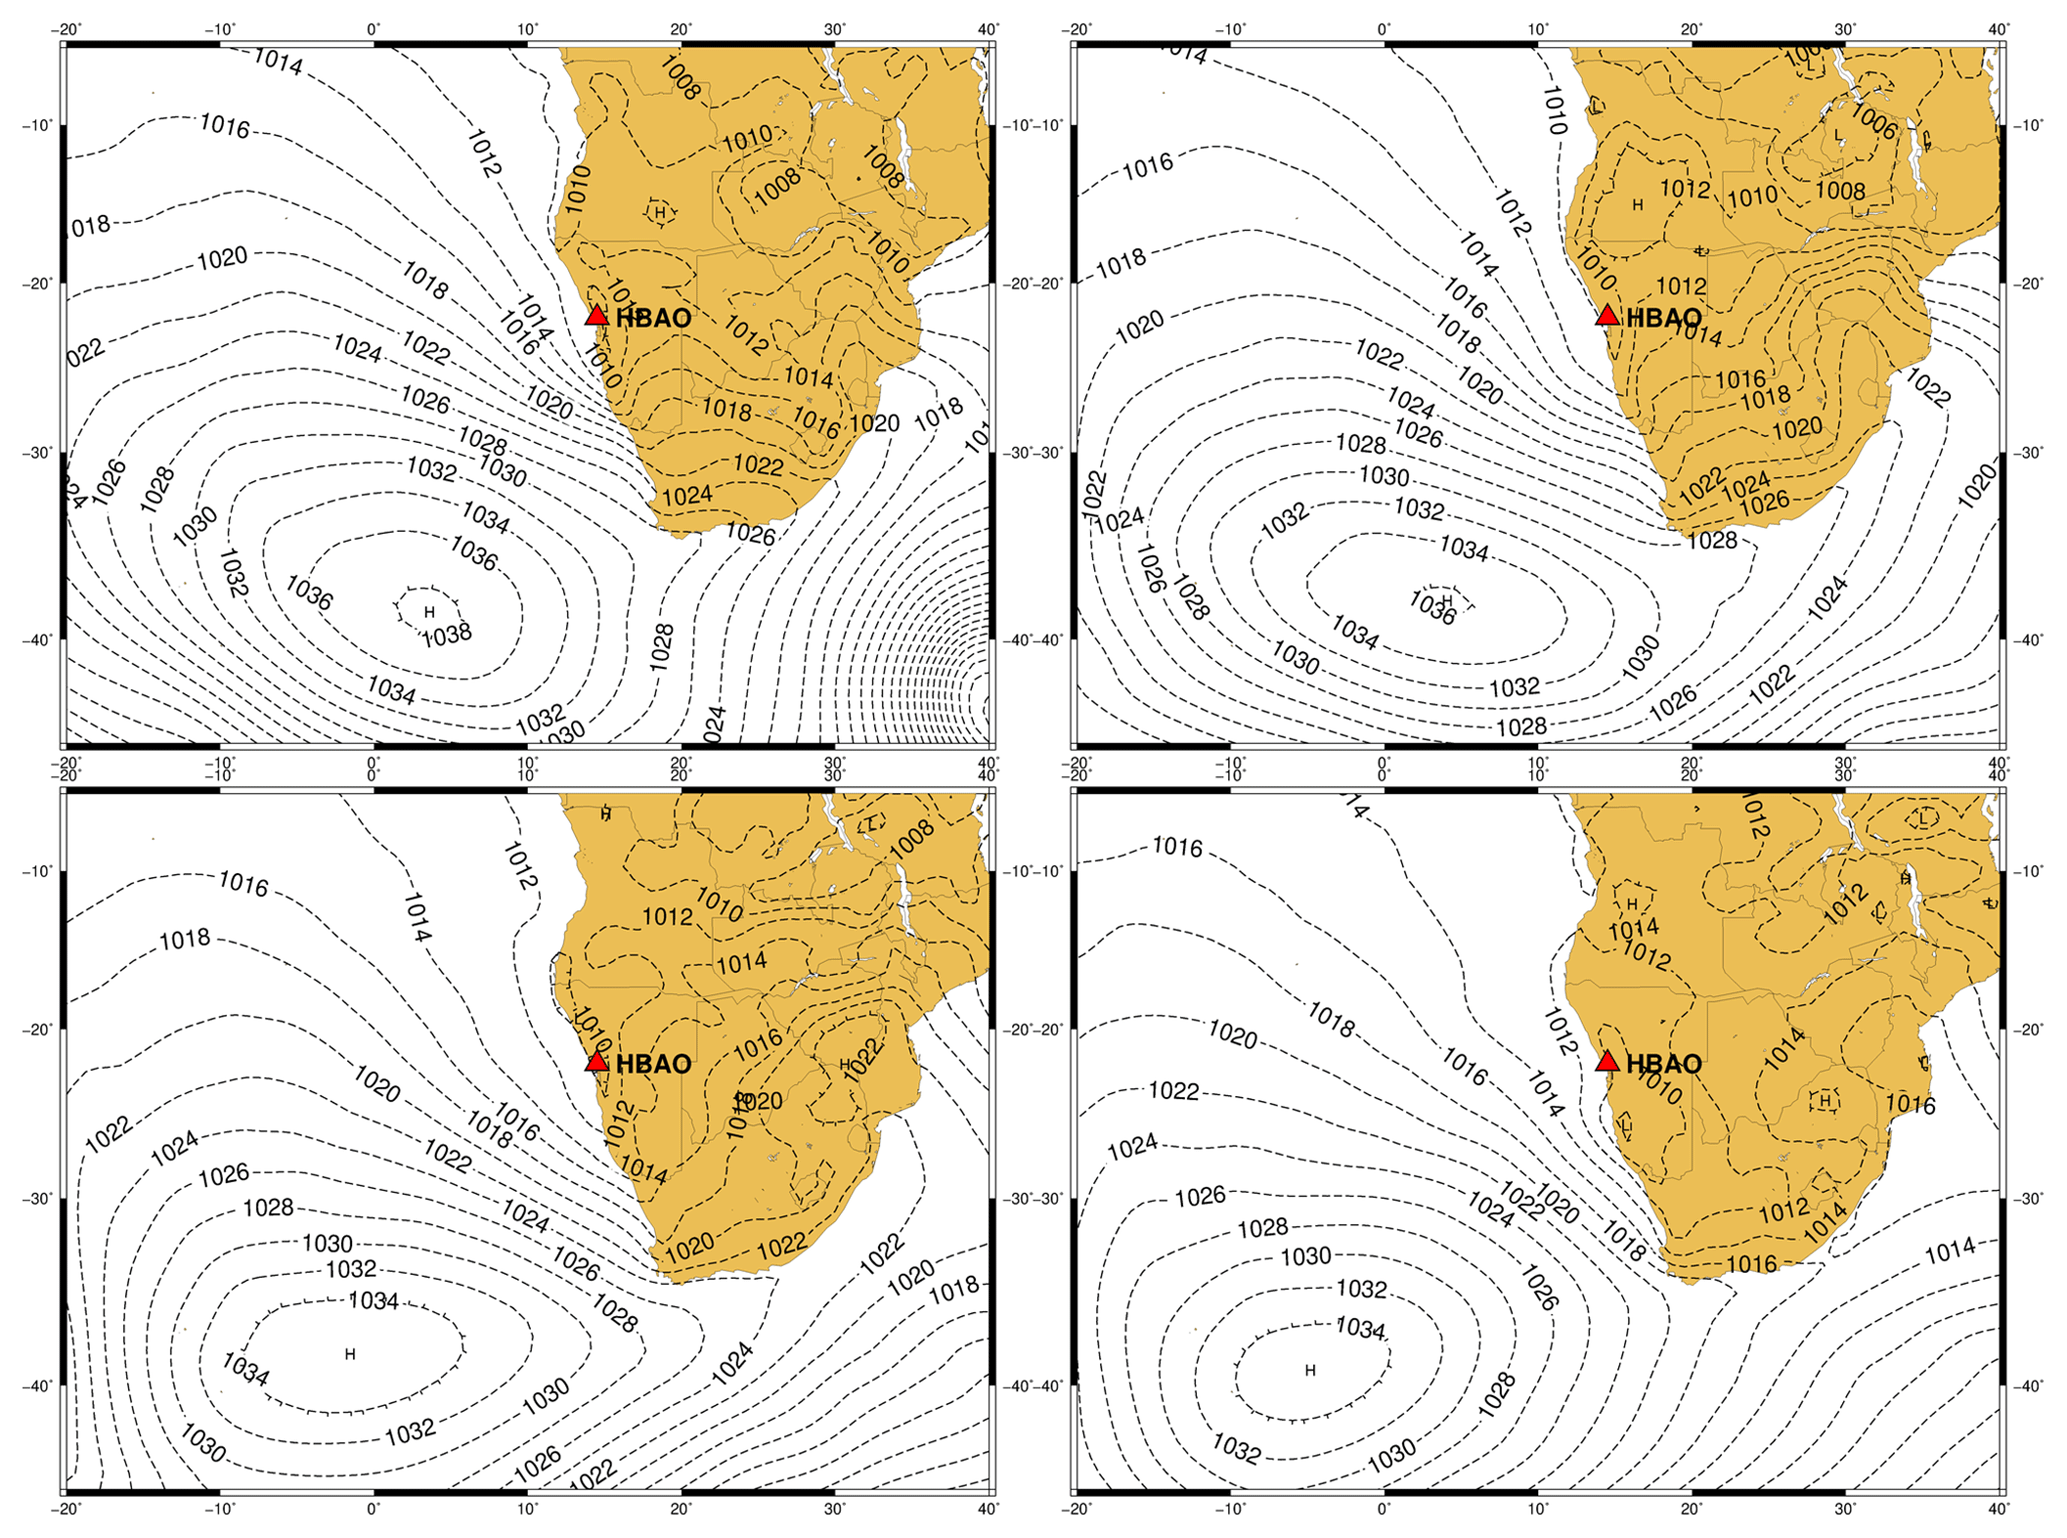
Figure 6Case study of mean sea level pressure over the subcontinent and adjacent South Atlantic Ocean for 16–19 November 2014 illustrating the synoptic circulation that results in the transport of air masses from sector G1.
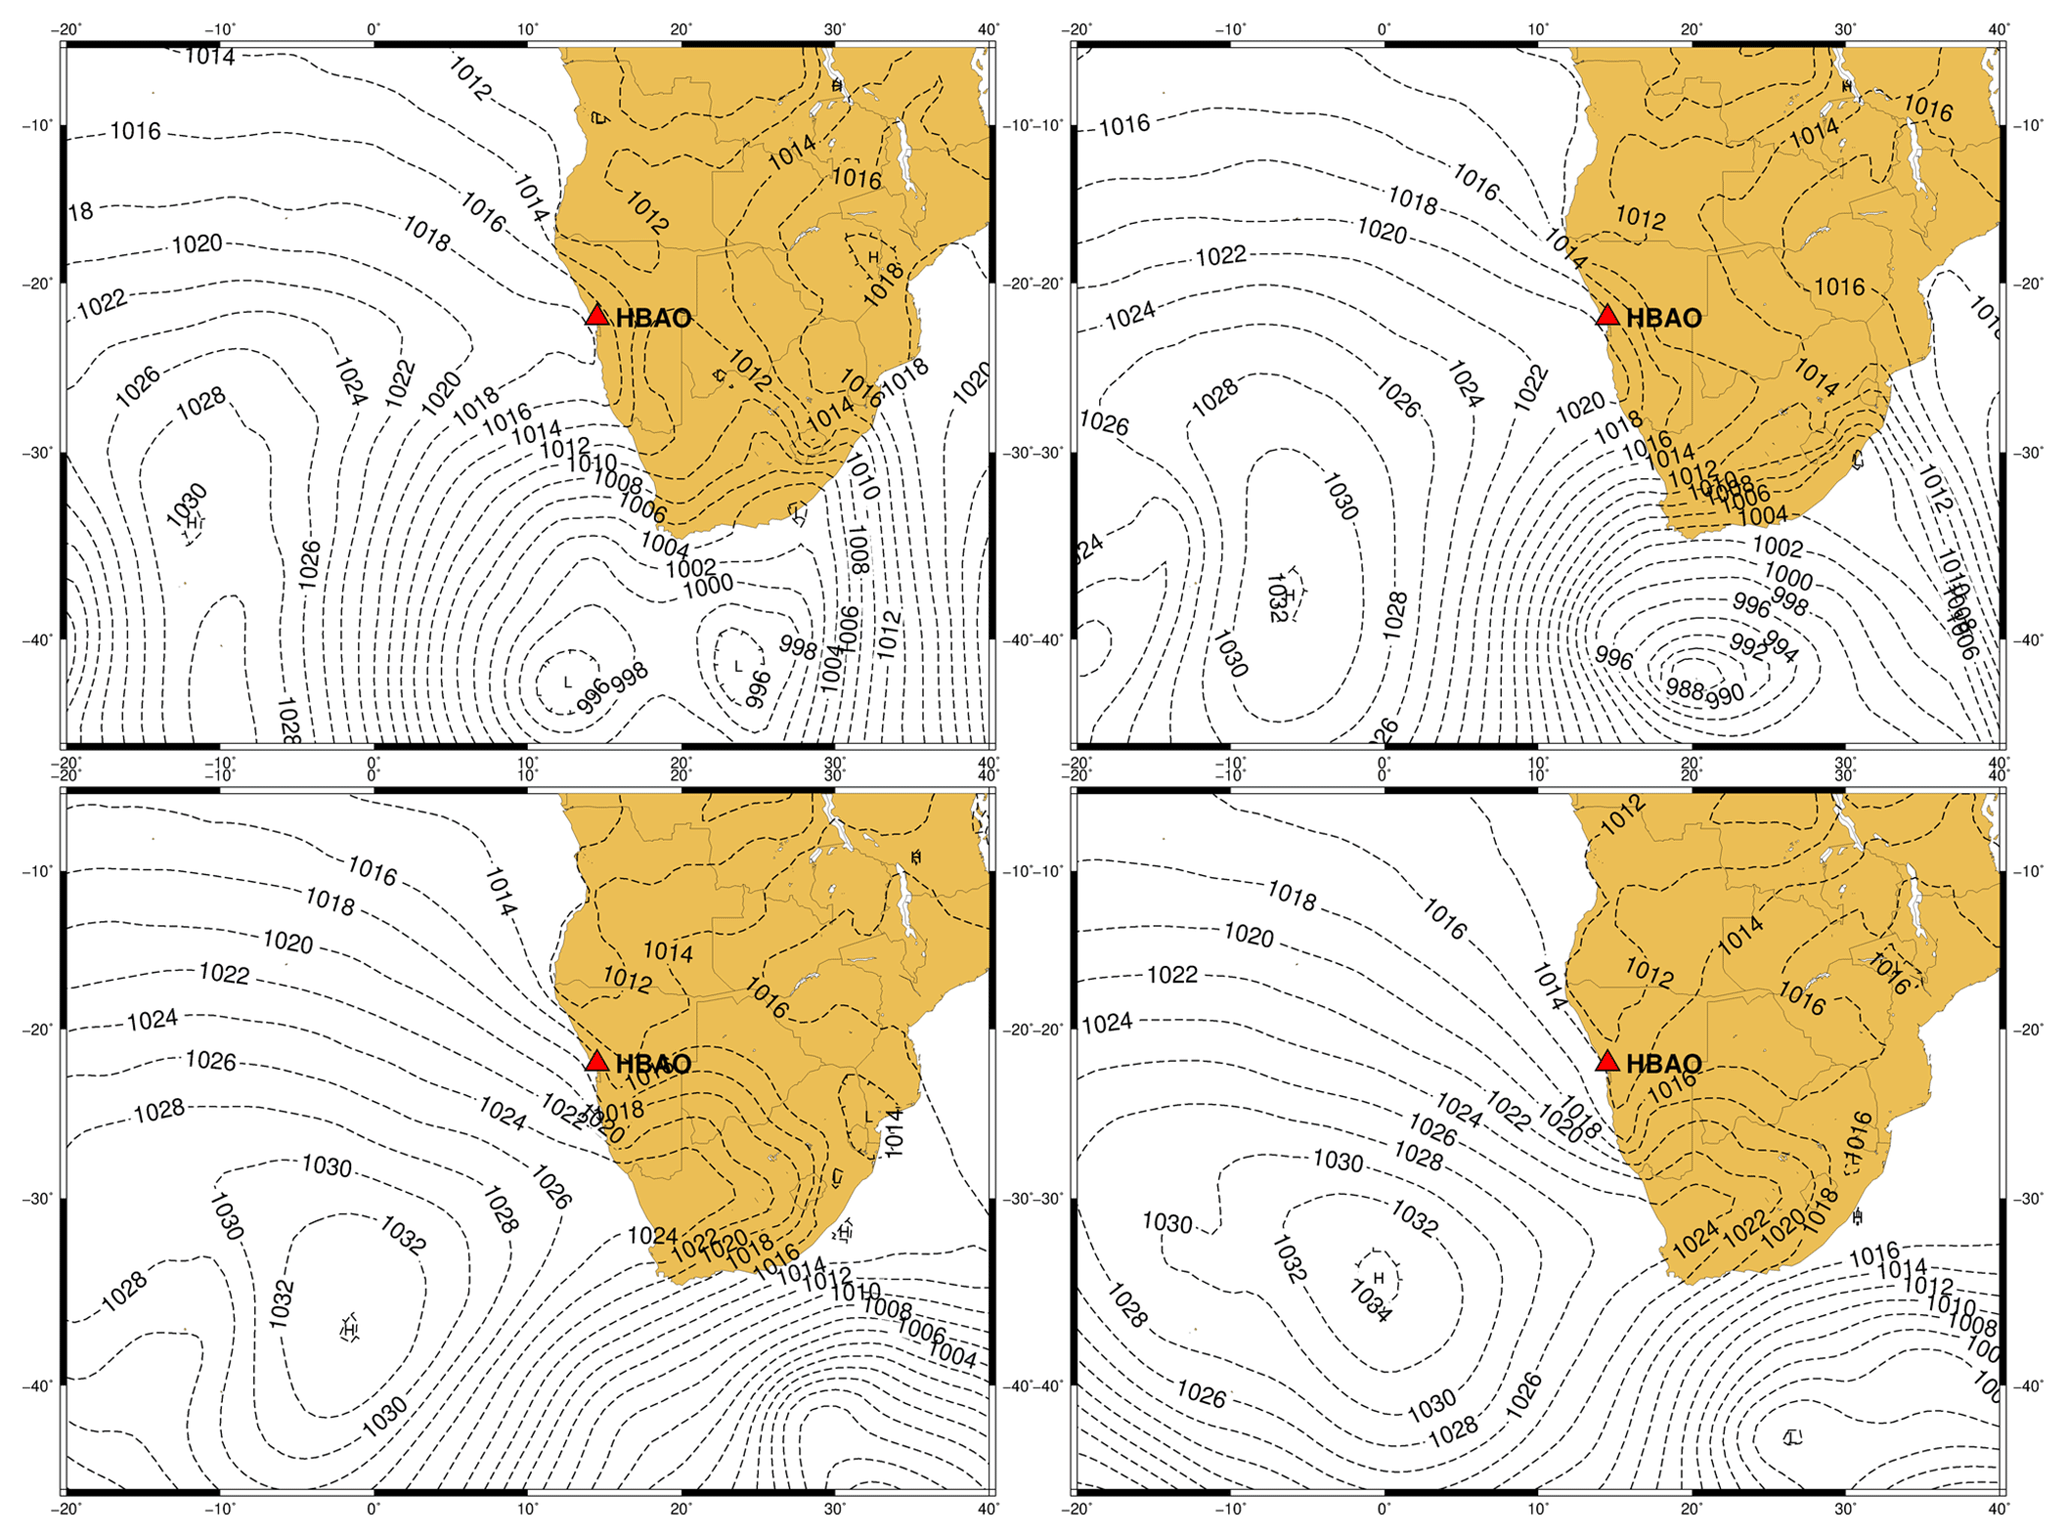
Figure 7Case study of mean sea level pressure over the subcontinent and adjacent South Atlantic Ocean for 1–4 June 2013 illustrating the synoptic circulation that results in the transport of air masses from sector G2.
The Lambert–Beer law relates the temporal variation in the measured light attenuation (ATN) due to aerosol particles collected on a quartz fibre tape to the mass concentration of eBC (in µg m−3). This is based on the fact that BC is the strongest light absorber in the near-infrared (Kirchstetter et al., 2004; Caponi et al., 2017).
The operational equation linking eBC to the attenuation (ATN) measured by the aethalometer is
where A represents the area of the aerosol deposited on the filter, V the volumetric flow rate and ΔATN∕Δt is the variation rate of attenuation with time. The terms C and R(ATN) account for measurement artefacts that artificially increase absorption estimated from attenuation measurements. The term C takes into account the multiple scattering effects on the filter due to both the filter fibres and the aerosol particles embedded in it. The factor R(ATN) accounts for the shadowing effect occurring with time as high concentrations of absorbing particles are collected on the filter. Published values of the C parameter at 660 and 880 nm range between 1.75 and 6.3 depending on the nature of the light-absorbing aerosols, the measurement environment and finally on the parameterisation of the corrections (Weingartner et al., 2003; Arnott et al., 2005; Schmid et al., 2006; Collaud-Coen et al., 2010; Segura et al., 2014; Saturno et al., 2017; Di Biagio et al., 2017). These authors show that, regardless of location, values below 3.5 are appropriate for moderately absorbing aerosols whose single scattering albedo (ω0) is above 0.8 at 660 nm. For Mace Head, a coastal site with prevailing marine North Atlantic air masses, Collaud-Coen et al. (2010) reported a mean C value of 3.44 (±0.21), which we used for HBAO, neglecting any possible wavelength dependence. The parameterisation of the shadowing effect R(ATN) depends on ω0; henceforth, on the availability of concurrent measurements of the scattering coefficient. This is the case at HBAO, where scattering is measured on the PM10 and not on the PM1 fraction as attenuation is preventing a meaningful estimate of ω0. In this case, Collaud-Coen et al. (2010) recommended the Weingartner et al. (2003) correction, leading to a mean value of the R parameter of 0.93, which we assumed for the further analysis.

Figure 8Case study of mean sea level pressure over the subcontinent and adjacent south Atlantic Ocean for (a) summer (10–13 December 2013) and (b) winter (6–10 July 2013) illustrating the synoptic circulation that results in the transport of air masses from sectors G5 to G7.
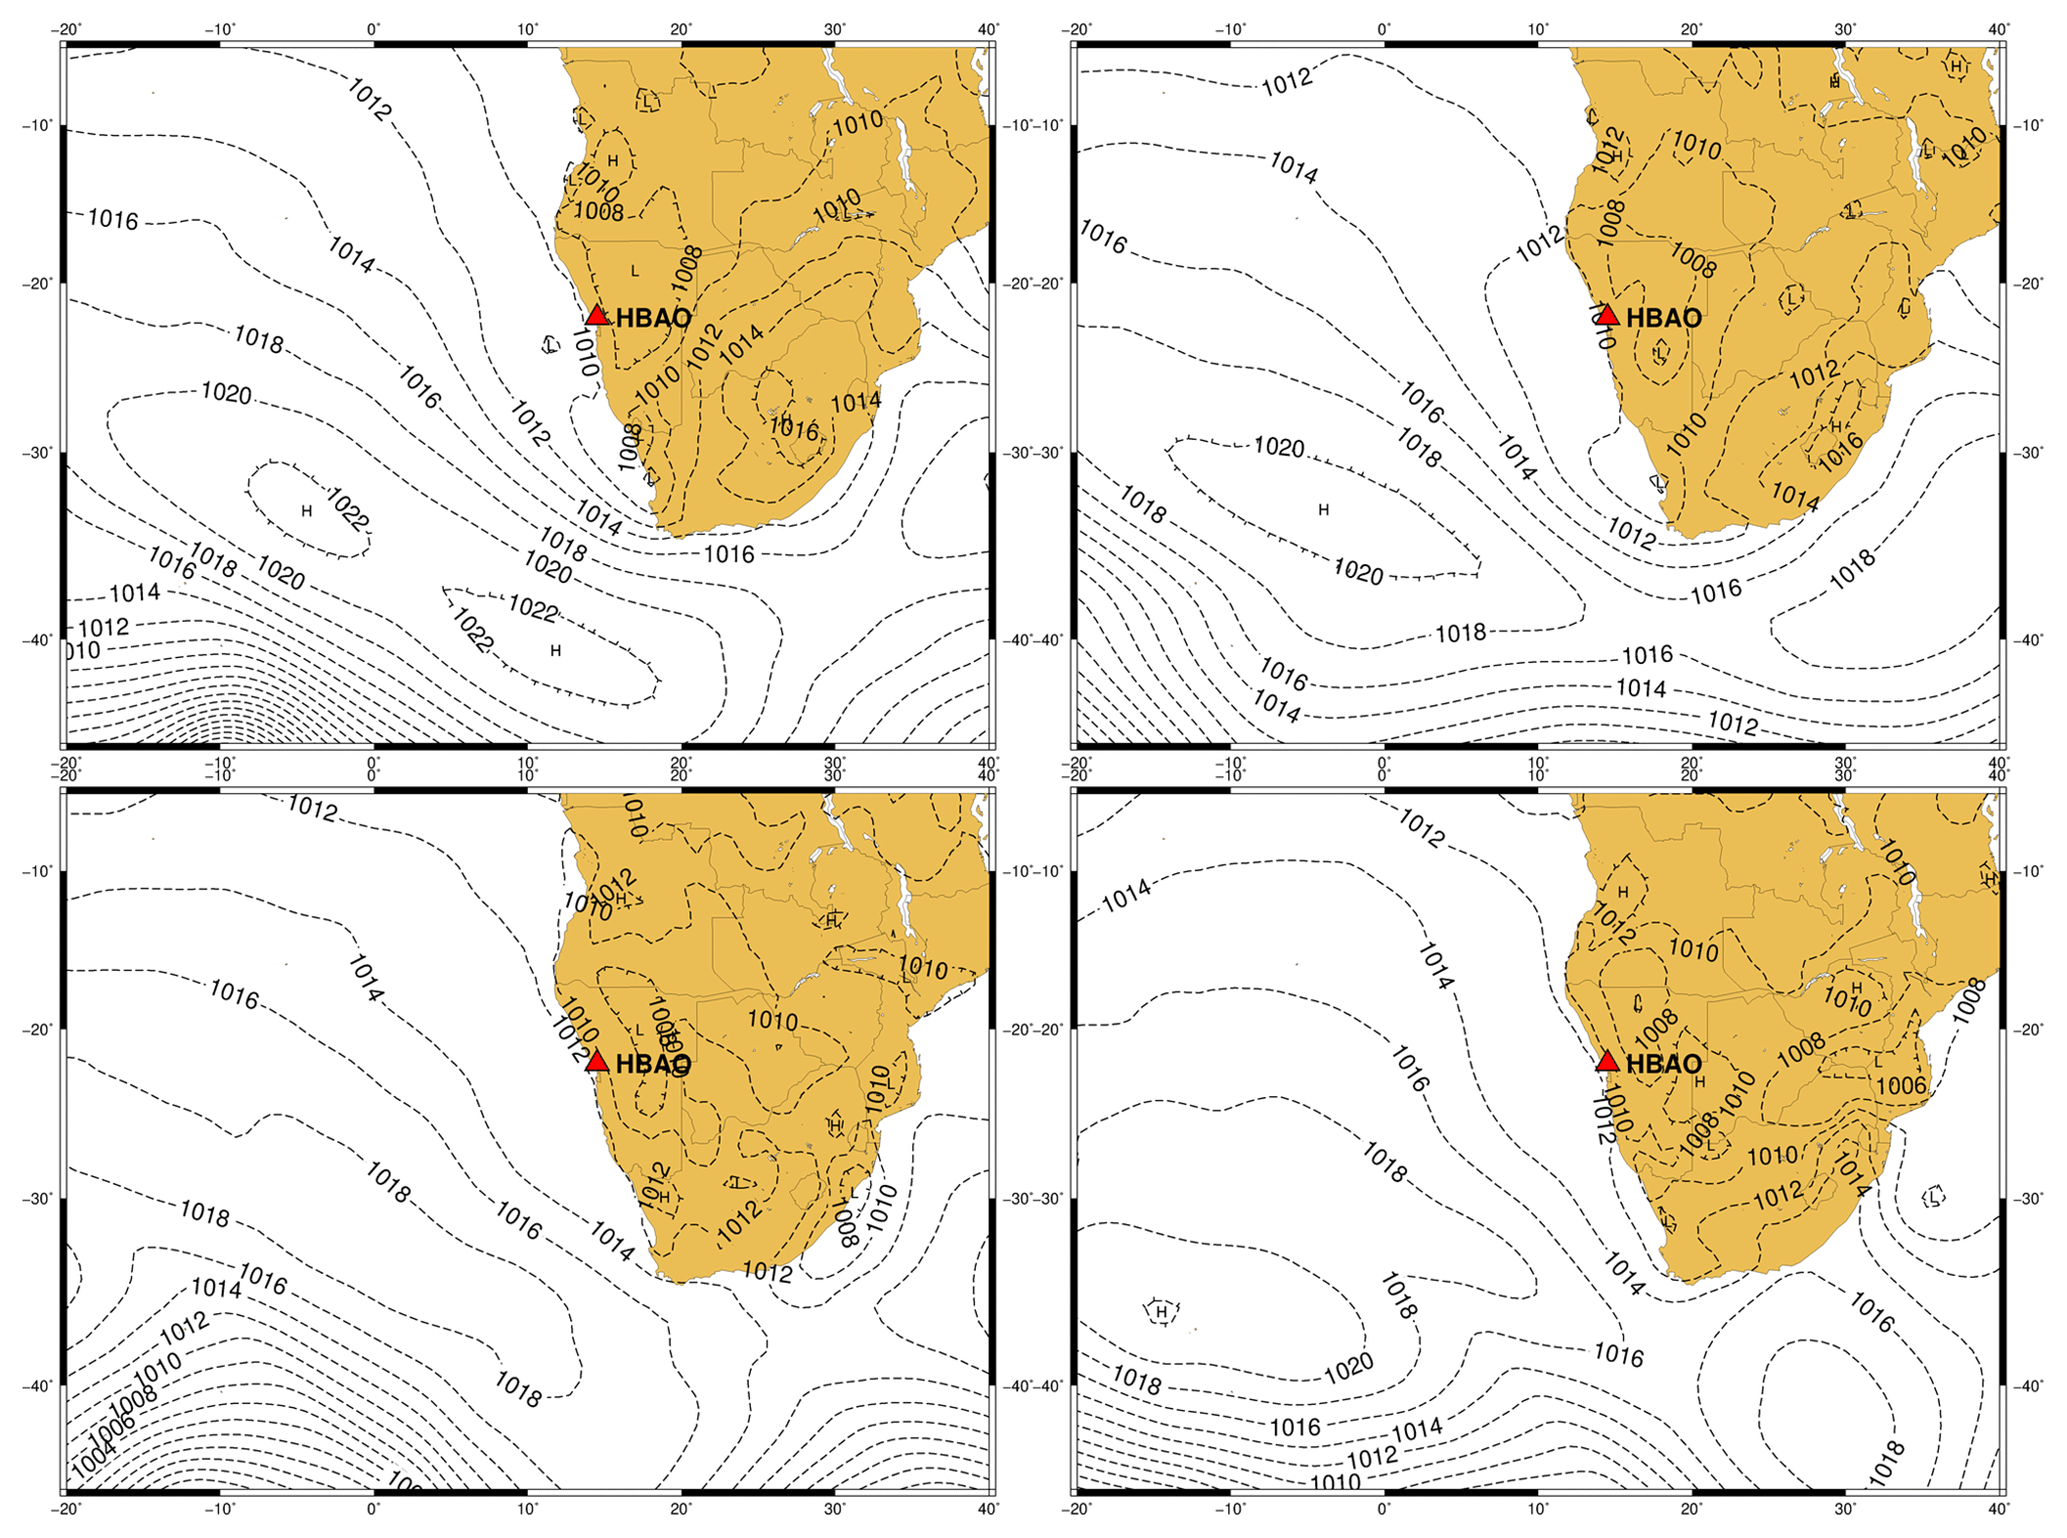
Figure 9Case study of mean sea level pressure over the subcontinent and adjacent south Atlantic Ocean for 13–16 December 2012 illustrating the synoptic circulation that results in the transport of air masses from sector G8.
The other crucial parameter in Eq. (1) is the mass absorption efficiency of eBC (MACBC, units of m2 g−1). Many authors have reported values in the range 5–20 m2 g−1 at wavelengths between 550 and 870 nm, and related this variability to the chemical state and age of BC aerosols (Liousse et al., 1993; Petzold et al., 1997; Martins et al., 1998; Kirchstetter et al., 2003; Hansen, 2005; Bond and Bergstrom, 2006; Knox et al., 2009; Subramanian et al., 2010; Bond et al., 2013; Zanatta et al., 2016). More recently, Zuidema et al. (2018) reported that the MACBC at 648 nm at Ascension Island, farther west than HBAO, and at times in its outflow, varied between 14.1 m2 g−1 in June and 10.7 m2 g−1 in July to October. When extrapolated, these values result in a MACBC at 870 nm between 7.9 and 10 m2 g−1. Their average and standard deviation (9.0±1.5 m2 g−1) was retained in our analysis.
2.2 Supporting data
In 2013, the mass concentration of particles of diameters smaller than 2.5 µm in equivalent aerodynamic diameter (PM2.5) was sampled by a tapering element oscillating microbalance (TEOM, model 1400a, Rupprecht and Patashnick, Albany, NY, USA) operating from a certified PM2.5 inlet (also from Rupprecht and Patashnick). The total flow rate at the inlet was 16.7 L min−1 to ensure the correct functioning of the inlet, and the sampling flow rate driving the aerosol-laden air to the microbalance was 3 L min−1. The temperature of the sample stream was kept constant at 50 ∘C.
Three-dimensional air mass back-trajectories are calculated using the NOAA HYbrid Single-Particle Lagrangian Integrated Trajectory Model (HYSPLIT; Draxler and Rolph, 2015). The model uses the latitude–longitude grid reanalysis meteorological database. The 6 h reanalysis archive data are generated by the NCEP's GDAS (NCEP: National Centers for Environmental Prediction; GDAS: Global Data Assimilation System) wind field reanalysis. Further information can be found at https://rda.ucar.edu/datasets/ds083.2/ (last access: 12 November 2018).
ERA-Interim reanalysis data (Dee et al., 2011) from the European Center for Medium Range Weather Forecasts (ECMWF) are used in the analysis of synoptic scale circulation patterns associated with the identified dominant air mass transport to Henties Bay. The 6-hourly (00:00, 06:00, 12:00, 18:00 UTC) analysis data () at mean sea level pressure (MSLP – variable 151.128) and the 500 hPa geopotential height (ZG500 – variable 129.128) are used for this study. Datasets were normalised (MSLP/100 and ZG500/100) using Climate Data Operators (CDO) (Schulzweida et al., 2006) and plotted with 2 and 10 hPa isobaric intervals for MSLP and the 500 hPa level, respectively.
Surface BC concentrations predicted by the Modern-Era Retrospective analysis for Research and Applications, Version 2 (MERRA-2; Gelaro et al., 2017) sampled at HBAO and at a number of other sites (Zuidema et al., 2016) are used for comparison.
The HTAP_V2 dataset is used for gridded emission of anthropogenic BC for the year 2010 (Janssens-Maenhout et al., 2015). It consists of grid maps. HTAP_V2 uses nationally reported emissions combined with regional scientific inventories in the format of sector-specific grid maps. The grid maps are complemented with EDGARv4.3 data for those regions where data are absent. Anthropogenic activities producing BC aerosols comprise aviation, transportation, energy production, industries, ship traffic, residential and agricultural burning.
3.1 Temporal variability in eBC concentrations
Figure 2 shows daily and monthly averages of the eBC concentrations measured at HBAO between July 2012 and December 2015. Daily averages excluded spikes and peak values occurring on short timescales, less than 1–2 h, resulting from contamination of local activities (episodic traffic and occasional open fires for barbecuing meat).
The daily mean average of 53 (±55) ng m−3 is in accordance with previous observations in remote locations of the world shown in Table 1 (Bodhaine, 1995; Andreae et al., 1995; Derwent et al., 2001; von Schneidemesser et al., 2009; Marinoni et al., 2010; Sheridan et al., 2016). Andreae et al. (1995) found eBC mass concentrations lower than 50 ng m−3 along a cruise transect at 19∘ S over the south-east Atlantic between Brazil and Angola, except when approaching the African continent, when concentrations increased in the range 50–150 ng m−3, indicating a strong continental influence in this otherwise pristine environment. Additional published research, also in Table 1, reports absorption coefficients that would lead to comparable eBC concentrations (Bodhaine, 1995; Clarke, 1989; Quinn et al., 1998). For contrast, eBC mass concentrations in lofted layers above the marine boundary layer in the range 0.1–6 µg m−3 were reported for aged biomass burning haze (Kirchstetter et al., 2003; Formenti et al., 2003; Eatough et al., 2003), and up to 5–40 µg m−3 for fresh biomass smoke plumes (Kirchstetter et al., 2003).
Table 1Values of mass concentrations of equivalent black carbon (eBC) from measurements published in the literature for remote regions worldwide. When available, the specific attenuation σBC used to convert the measured attenuation to eBC is also reported.
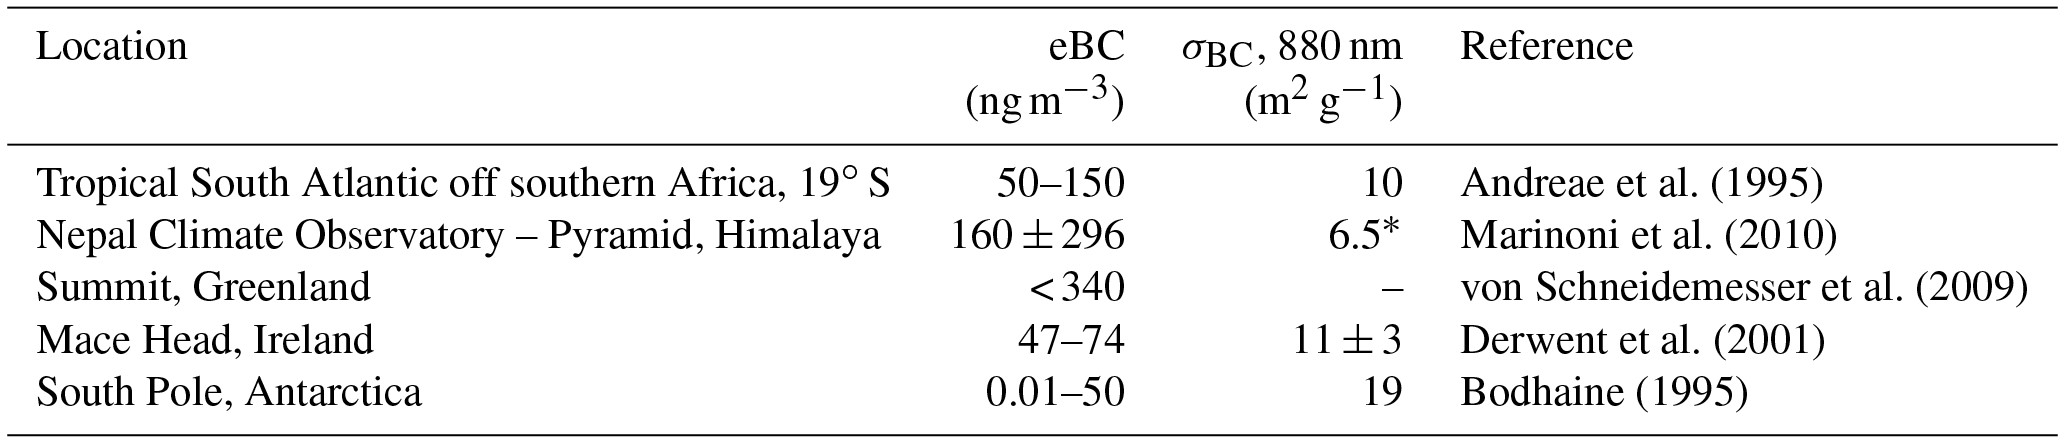
* At 635 nm – measurements were conducted with a Multi-Angle Absorption Photometer (MAAP 5012, Thermo Electron Corporation).
Figure 2 also shows an apparent seasonal variability in eBC, further highlighted by the monthly means and by the comparison with PM2.5 mass concentration measurements performed at the site during 2013, which, conversely, did not display any particular seasonal cycle (Fig. S1 in the Supplement), likely because they were dominated by sea salt. Concentrations increase in the austral winter from May to July, and decrease from August to April. The increase from May to July is well captured by the MERRA-2 reanalysis (also shown in Fig. 2), according to which, however, concentrations only start decreasing after September. The observed seasonality is somewhat surprising in that it precedes the seasonal maximum of the biomass burning fire season in southern Africa, peaking in the austral dry season from August to October (Swap et al., 2002). As previously stated in this paragraph, data constituting the time series have been screened to exclude short-term variability (less than 1–2 h time intervals) to exclude isolated and episodic sources. Peaks of eBC driving the seasonal increase in the May-to-August period are long-lasting, extending between 6 and 11 h, and occurring during both daytime and night-time. This suggests that transport is the cause of the seasonal peaks. The following section explores this hypothesis and attempts the quantification of attribution of eBC peaks to specific transport patterns.
3.2 General atmospheric circulation driving air mass transport
Transport to the west coast of Namibia is influenced by four general circulation patterns: baroclinic westerly waves, barotropic easterly waves, the semi-permanent south Atlantic high pressure and a continental high pressure circulation. The relative influence of each circulation pattern is highly seasonal and driven by the meridional migration towards the north in austral winter and to the south in summer. The origin of the air parcel over the southern ocean is linked to the passage of a westerly wave and front that propagates towards the subcontinent form the south-west. These are Rossby waves that form as a result of the extratropical temperature gradient with a maximum impact on the weather over southern Africa in winter. The easterly waves are trade winds that are associated with the position of the Inter-Tropical Convergence Zone (ITCZ) that reaches a maximum over the subcontinent during summer (Tyson and Preston-Whyte, 2014; Taljaard, 1994). The semi-permanent high pressure system (anticyclone) results from the descending limb of the Hadley circulation that interacts with the aforementioned waves. The south Atlantic high-pressure system will ridge behind a passing westerly wave in the direction of maximum cold air advection. Conversely, a strengthening anticyclone will block propagations of these waves and induce a strong persistent continental high pressure. Air masses reaching the sampling station have been found to originate from the adjacent Atlantic Ocean and various locations over the continental subcontinent. Coastal lows are induced along the west coast of Namibia and result in offshore flow ahead of westerly waves. This low-pressure system forms localised cyclonic circulation that includes onshore flow in the north and offshore flow in the south of the low-pressure cell (Tlhalerwa et al., 2005; Tyson and Preston-Whyte, 2014).
3.3 Identification of air mass transport pathways impacting HBAO
Three-day back-trajectories calculated daily between July 2012 and December 2015 are grouped according to the progression of the general synoptic circulation patterns and assigned to eight geographical sectors according to the position of their end point (shown in Fig. 3). Four sectors (G1 to G4) correspond to oceanic air masses and sectors G5 to G7 to transport from the continent. The last sector (G8) describes air masses recirculating around the sampling site for most of the 3-day period. Figure 3 also shows the 2010 BC aerosol regional emission HTAP_V2 inventory grid map from anthropogenic activities. Emissions are low in Namibia and neighbouring regions such as Botswana and west-central South Africa. Areas of higher emissions are Angola (with a hotspot in correspondence with the capital city Luanda); costal South Africa, particularly to the east; but also to the south in the Cape Town greater area, but mostly in the South African Highveld (27∘ S, 28∘ W) where energy production is concentrated. The open-ocean and coastal ship tracks are also evident.
The monthly distribution of fire counts from 2012 to 2015 provided by MODIS/Aqua is shown in Fig. 4. Although some interannual variability exists, the image record is consistent in showing that the fire season in southern African starts towards April and extends until October. The major source areas are north of Namibia (Angola, Zambia), in South Africa (to the east and along the south coast) and in Mozambique. In Namibia, fire counts are seen towards the north, around the Etosha pan desert.
The seasonal contribution of these air mass transport pathways is shown in Fig. 5. Sectors G1 to G4 represent the most common air flow pathway (73 % out of 1279 calculated back-trajectories). The southern Atlantic Ocean transport (G1 and G2) is the dominant surface circulation along the west coast, resulting from the northward-moving limb of the surface south Atlantic high pressure. Air masses originate over the southern Atlantic Ocean, as far south as 55∘ S (sector G2, representing approximately 66 % of the air mass occurrences). During summer this is predominantly a function of the most southerly location of the centre of the South Atlantic High (Fig. 6). In winter transport results from a complex interaction between the westerly waves propagating from the south-west over the subcontinent and the re-establishment of the South Atlantic High in the westerly waves wake. Initially, air transport is towards the east and is then directed northwards along the west coast to Namibia (Fig. 7). The distance covered by these air masses is several thousand kilometres due to the high wind speeds associated with the initial transport in the cyclonic circulation.
Sectors G3 and G4 describe transport from the tropical regions of the Atlantic Ocean. The onshore flow towards the sampling site forms as a westerly wave advances. A shallow, localised cell of low pressure (cyclonic circulation) is induced along the west coast with a diameter of approximately 200 km. Towards the north of the cell onshore flow occurs, while in the southern portion of the cell the flow is offshore. This circulation has also been shown to induce the dust plumes that blow off the Namibian coast over the Atlantic Ocean from ephemeral river beds along the west coast of Namibia (Tlhalerwa et al., 2005). The low pressure, referred to as a coastal low, then propagates southwards behind the surface front. It is possible for air that is moved offshore in the easterly wave over Angola to be caught up in this more near-shore circulation.
Transport to HBAO from the continent (sectors G5–G7) occurred on 19 % of the total days (sectors G5, G6 and G7). These transport pathways are directly linked to the position of the easterly wave over the subcontinent as well as the position of the trough line associated with the wave. As pointed out earlier, the position of the easterly wave is highly seasonal. In general, air is transported across the subcontinent and exits to the Atlantic Ocean in the westerly transport. The low-pressure trough moves across the subcontinent. The position of the trough also determines the exact pathway of transport as well as the sector in which air masses originate. If the trough is situated along the west coast it forms a west coast trough that facilitates flow along and close to the west coast. During summer the easterly wave reaches to the southern tip of southern Africa. This leads to transport of air from areas of South Africa, including the highly industrialised South African Highveld region (Fig. 8a). In winter the easterly wave seldom reaches south of 25∘ S. Air masses during this season are more likely to originate over the central portion of southern Africa (Fig. 8b).
Finally, sector G8 is associated with air masses originating within 100 km of HBAO (Fig. 9), either from land or from the ocean, and representing about 8 % of the air mass occurrences (Fig. 5). This circulation, only occurring in the second half of each year (Fig. 5), is linked to the formation of a low-pressure heat cell close to the west coast of Namibia centred at about the latitude of Henties Bay. Despite this being cyclonic flow the circulation is closed (Fig. 9) and therefore represents transport from close to the sampling site. The heat low is always embedded in an easterly wave or west coast trough. Centres of low pressure form along the west coast producing local and mesoscale circulation from the interior of Namibia to the coast. This flow pattern is distinguishable from a coastal low as it is centred on the subcontinent, whereas the coastal low is always centred on the coast just offshore.
3.4 Contribution of air transport patterns to the measured eBC
Figure 10 illustrates the contribution of the air mass sectors G1–G8 to the eBC mass concentrations measured at HBAO and those estimated by the MERRA-2 reanalysis. This has been done by calculating the distribution of eBC values per group.
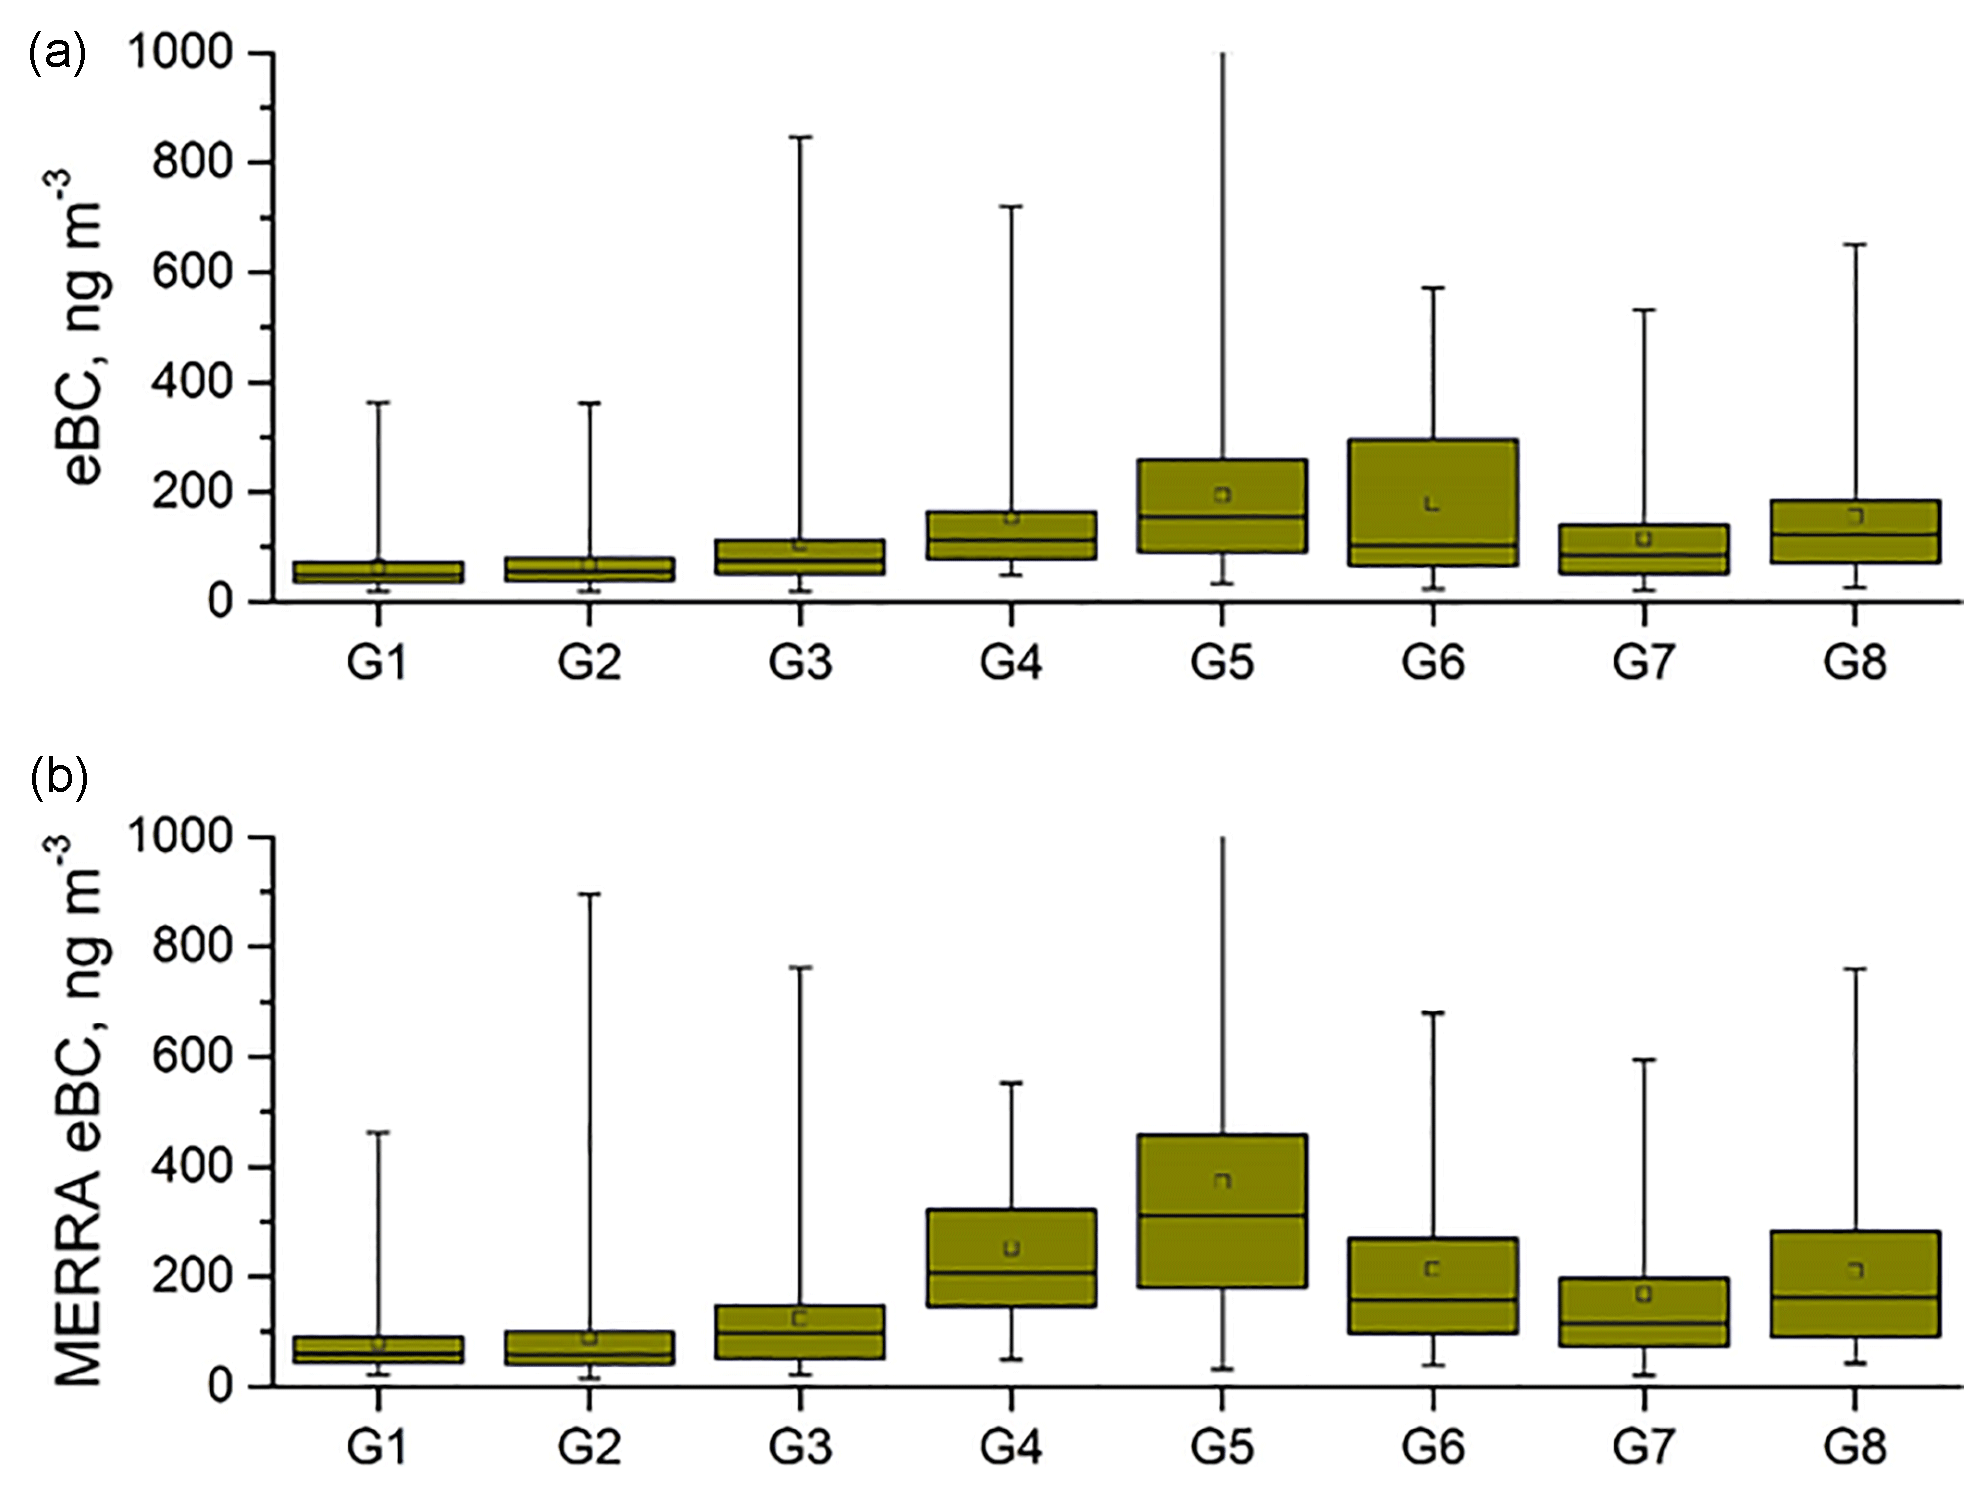
Figure 10Contribution of air mass sectors to the eBC concentrations at HBAO from (a) our measurements and (b) MERRA-2 reanalysis.
Although the absolute values differ by a factor of 2–3, measurements and reanalysis show some consistent temporal features. Episodic high values of eBC concentrations occur independently of the origin of the air mass. The southern Atlantic oceanic air masses (sectors G1, G2 and G3) and the continental G7 sector, corresponding to the low population density semi-arid region of the Karoo, in South Africa, display the lowest concentrations. In particular, the oceanic sectors are characterised by a south-to-north gradient, the highest mean concentrations being from sectors G4, offshore northern Namibia and Angola, comparable to those from the continental sectors G5 and G6, as well as G8, representing recirculating air masses. Measurements at HBAO indicate that the contributions of sectors G5 and G6 are equivalent, while sector G5 is the largest contributor according to the MERRA-2 reanalysis.
This paper presents the first long-term time series of equivalent black carbon (eBC) concentrations in the marine boundary layer on the south-east Atlantic coast offshore southern Africa. Observations were conducted at the Henties Bay Aerosol Observatory (HBAO), in Namibia, between July 2012 and December 2015.
Higher concentrations of eBC on the western coast of southern Africa are observed from April to July within continental and marine air masses north of 30∘ S (sectors G4, G5 and G6). Daily eBC peak concentrations at HBAO do not exceed 800 ng m−3, and are seldom larger than 200 ng m−3, lower than measured at Ascension Island, approximately 1500 km downwind of coastal Namibia and located along the main outflow pathway from southern Africa to the Atlantic Ocean (Swap et al., 1996, 2002; Adebiyi and Zuidema, 2016; Zuidema et al., 2018). The seasonality of the eBC concentrations observed at HBAO corresponds to the seasonal shift from southern to northern circulation at the surface, and is in phase with the April onset of the fire season in southern Africa (Fig. 5). The seasonal increase at HBAO is also well captured by the MERRA-2 reanalysis model, but it occurs earlier than reported by Zuidema et al. (2018) at Ascension Island (June to August). This seems to indicate that HBAO is on a minor branch of the transport pathway of the continental biomass burning smoke plume from continental southern Africa compared with the biomass burning plumes that reach Ascension Island. The MERRA-2 reanalysis shows higher concentrations than measured at HBAO and suggests that the period of high concentrations should persist until September rather than August as in the HBAO measurements. This points to the inherent degree of uncertainty in our estimates. The correction factors (filter loading and multiple scattering corrections) needed to convert the measured attenuation into a eBC concentration value are assumed and not evaluated from concurrent measurements, and set to fixed values as the aerosol at HBAO would derive from a single source type. We do not deal with potential changes in the aerosol properties due to ageing. Differences could also be due to the representation of the timing and extent of a southward shift of the easterly wind during summer. Although these issues cannot be resolved with the present dataset, they question the representation of the transport of smoke plumes at the subcontinental scale of southern Africa.
There is no doubt that the transport of wildfire smoke is the major regional source of the eBC aerosols for the western coast of Namibia. However, the presence of episodic outliers and the relatively elevated concentrations observed for oceanic air masses originating south of HBAO (sectors G1 to G3 in Fig. 7) suggests that additional sources could contribute to the load of light-absorbing aerosols in the marine boundary layer. In particular, the contribution of the coastal and open-ocean maritime shipping routes in the South Atlantic Ocean (Tournadre, 2014; Fraser et al., 2016; Johannson et al., 2017) and that of long-range continental anti-cyclonic transport from the industrial areas of the South African Highveld, shown in Fig. 3 (Piketh et al., 2002), should be further explored.
By the very rough assumption of the mass fraction of black carbon (BC) to the total fine aerosol (10 %; Bond et al., 2013), we estimate that the mean fine mass of aerosols containing eBC would be 0.5 (±0.5) µ g m−3. For comparison, the mean PM2.5 mass concentration at HBAO was 14 (±11) µ g m−3 in 2013 (Fig. S1).
These aerosols below clouds would have a negligible direct radiative effect. There are almost no AERONET measurements of the aerosol optical depth (AOD) at HBAO concurrent to the eBC data series. However, Fig. S2 shows the time series of the AERONET level 2.0 AOD of the fine and coarse mode aerosols (AODF and AODC) evaluated by the O'Neill et al. (2003) algorithm between December 2011 and May 2012, and then from May to December 2015. Figure S2 shows that the AODF varies significantly from background values in the December 2011–May 2012 period (average 0.05±0.03) to peak values of 0.4 and higher during August, September and October 2015, when the transport of biomass burning occurs in the free troposphere (Swap et al., 2003). The AODC, essentially contributed by sea salt, is relatively invariant with time. There is no process other than biomass burning that would inject aerosols above the marine boundary layer, henceforth we can consider the mean value for December 2011–May 2012 as a reasonable evaluation of the optical depth of the fine mode of aerosols below clouds, including eBC.
The eBC aerosols might act on the microphysical properties of the local stratocumulus clouds. At Ascension Island, Zuidema et al. (2018) demonstrated the good correlation between the concentrations of refractory BC and cloud condensation nuclei (CCN) at supersaturations exceeding 0.2 %. A similar effect should be expected at HBAO and could be important, outside but also during the biomass burning season as the entrainment of biomass burning aerosols from the free troposphere may be inhibited by the thermal inversions clear air slots separating the elevated plumes and the marine boundary layer (Keil and Haywood, 2003; Haywood et al., 2003; Hobbs et al., 2003). Finally, by deposition, these low-level aerosols could act on the biological activity for the oligotrophic South Atlantic Gyre in summer, providing soluble nutrient species, such as dissolved nitrogen, phosphorous and iron (Guieu et al., 2005; Luo et al., 2008; Paris et al., 2010).
In conclusion, the chemical apportionment of the AODF below cloud and the hygroscopic properties of the eBC aerosols at HBAO deserves exploration by future refined experiments.
Original data for measured light-attenuation at HBAO are distributed by the French national AERIS data centre (https://www.aeris-data.fr/direct-access-icare-2/, last access: 12 November 2018). Treated data can be obtained by email request to the first author of this paper.
The supplement related to this article is available online at: https://doi.org/10.5194/acp-18-17003-2018-supplement.
PF, SJP, AN, SM, EO, WY and WM designed the experiments and the sampling site. PF, SJP, AN, MC, AF, CG, SB, NW, KD and MH performed the experiments. PF and SJP performed the full data analysis with contributions by DK, GS and RB. PF, SJP, DK and RB wrote the paper with comments from all co-authors.
The authors declare that they have no conflict of interest.
This work received funding by the French Centre National de la Recherche
Scientifique (CNRS) and the South African National Research Foundation (NRF)
through the “Groupement de Recherche Internationale Atmospheric Research in
southern Africa and the Indian Ocean” (GDRI-ARSAIO) and the Projet
International de Coopération Scientifique (PICS) “Long-term observations
of aerosol properties in Southern Africa” (contract no. 260888) as well as
by the Partenariats Hubert Curien (PHC) PROTEA of the French Ministry of
Foreigns Affairs and International Development (contract numbers 33913SF and
38255ZE). We acknowledge the use of the HYSPLIT model from the NOAA Air
Resources Laboratory (ARL), the use of FIRMS data and imagery from the Land
Atmosphere Near-real time Capability for EOS (LANCE) system operated by the
NASA/GSFC/Earth Science Data and Information System (ESDIS) with funding
provided by NASA/HQ, the archiving and distribution of the HTAPv2 grid map by
the Emissions of atmospheric Compounds and Compilation of Ancillary Data
(ECCAD) database. The global grid maps are a joint effort from US-EPA, the
MICS-Asia group, EMEP/TNO, the REAS and the EDGAR group to serve in the first
place the scientific community for hemispheric transport of air pollution.
The static version is available on this EDGAR website, but also the GEIA data
portal and the ECCAD server. ECCAD is the GEIA Global Emission InitiAtive
database (http://www.geiacenter.org/, last access: 12 November 2018)
and is part of AERIS, the French data service for Atmosphere
(http://www.aeris-data.fr/, last access: 12 November 2018). MERRA-2
data are available at MDISC, managed by the NASA Goddard Earth Sciences (GES)
Data and Information Services Center (DISC). Thanks are due to A. Da Silva
(NASA/Goddard Space Flight Center, Global Modeling and Assimilation Office,
Greenbelt, MD, USA) for making the extractions at HBAO
available.
Edited by: Andreas
Petzold
Reviewed by: three anonymous referees
Adebiyi, A., and Zuidema, P.: The role of the southern African easterly jet in modifying the southeast Atlantic aerosol and cloud environments, Q. J. Roy. Meteor. Soc., 142, 1574–1589, https://doi.org/10.1002/qj.2765, 2016.
Andreae, M. O., Elbert, W., and de Mora, S. J.: Biogenic sulfur emissions and aerosols over the tropical South Atlantic: 3. Atmospheric dimethylsulfide, aerosols and cloud condensation nuclei, J. Geophys. Res.-Atmos., 100, 11335–11356, 1995.
Andreae, M. O., Fishman, J., and Lindesay, J.: The Southern Tropical Atlantic Region Experiment (STARE): Transport and Atmospheric Chemistry near the Equator-Atlantic (TRACE A) and Southern African Fire-Atmosphere Research Initiative (SAFARI): An introduction, J. Geophys. Res., 101, 23519–23520, https://doi.org/10.1029/96JD01786, 1996.
Arnott, W., Hamasha, K., Moosmüller, H., Sheridan, P. J., and Ogren, J. A.: Towards aerosol light-absorption measurements with a 7-wavelength aethalometer: Evaluation with a photoacoustic instrument and 3-wavelength nephelometer, Aerosol Sci. Tech., 39, 17–29, 2005.
Bodhaine, B. A.: Aerosol absorption measurements at Barrow, Mauna Loa, and South Pole, J. Geophys. Res., 100, 8967–8975, 1995.
Bond, T. and Bergstrom, R. W.: Light Absorption by Carbonaceous Particles: An Investigative Review, Aerosol Sci. Technol., 39, 1–41, https://doi.org/10.1080/02786820500421521, 2006.
Bond, T. C., Doherty, S. J., Fahey, D. W., Forster, P. M., Berntsen, T., DeAngelo, B. J., Flanner, M. G., Ghan, S., Kärcher, B., Koch, D., Kinne, S., Kondo, Y., Quinn, P. K., Sarofim, M. C., Schultz, M. G., Schulz, M., Venkataraman, C., Zhang, H., Zhang, S., Bellouin, N., Guttikunda, S. K., Hopke, P. K., Jacobson, M. Z. , Kaiser, J. W., Klimont, Z., Lohmann, U., Schwarz, J. P., Shindell, D., Storelvmo, T., Warren, S. G., and Zender C. S.: Bounding the role of black carbon in the climate system: A scientific assessment, J. Geophys. Res.-Atmos., 118, 5380–5552, https://doi.org/10.1002/jgrd.50171, 2013.
Boucher, O., Randall, D., Artaxo, P., Bretherton, C., Feingold, G., Forster, P., Kerminen, V.-M., Kondo, Y., Liao, H., Lohmann, U., Rasch, P., Satheesh, S. K., Sherwood, S., Stevens, B. and Zhang, X. Y.: Clouds and Aerosols, in: Climate Change, The Physical Science Basis. Contribution of Working Group I to the Fifth Assessment Report of the Intergovernmental Panel on Climate Change, edited by: Stocker, T. F., Qin, D., Plattner, G.-K., Tignor, M., Allen, S. K., Boschung, J., Nauels, A., Xia, Y., Bex, V. and Midgley, P. M., Cambridge University Press, Cambridge, United Kingdom and New York, NY, USA, 571–658, https://doi.org/10.1017/CBO9781107415324.016, 2013.
Caponi, L., Formenti, P., Massabó, D., Di Biagio, C., Cazaunau, M., Pangui, E., Chevaillier, S., Landrot, G., Andreae, M. O., Kandler, K., Piketh, S., Saeed, T., Seibert, D., Williams, E., Balkanski, Y., Prati, P., and Doussin, J.-F.: Spectral- and size-resolved mass absorption efficiency of mineral dust aerosols in the shortwave spectrum: a simulation chamber study, Atmos. Chem. Phys., 17, 7175–7191, https://doi.org/10.5194/acp-17-7175-2017, 2017.
Chung, S. H. and Seinfeld J. H.: Global distribution and climate forcing of carbonaceous aerosols, J. Geophys. Res.-Atmos., 107, 4407, https://doi.org/10.1029/2001JD001397, 2002.
Clarke, A. D.: Aerosol Light Absorption by Soot in Remote Environments, Aerosol Sci. Technol., 10, 161–171, https://doi.org/10.1080/02786828908959231, 1989.
Collaud Coen, M., Weingartner, E., Apituley, A., Ceburnis, D., Fierz-Schmidhauser, R., Flentje, H., Henzing, J. S., Jennings, S. G., Moerman, M., Petzold, A., Schmid, O., and Baltensperger, U.: Minimizing light absorption measurement artifacts of the Aethalometer: evaluation of five correction algorithms, Atmos. Meas. Tech., 3, 457–474, https://doi.org/10.5194/amt-3-457-2010, 2010.
Cook, C., Reason, C. J. C., and Hewitson, B.C.: Wet and dry spells within particularly wet and dry summers in the South African summer rainfall region, Climate Res., 26, 17–31, 2004.
Dee, D. P., Uppala, S. M., Simmons, A. J., Berrisford, P., Poli, P., Kobayashi, S., Andrae, U., Balmaseda, M. A., Balsamo, G., Bauer, D. P., and Bechtold, P.: The ERA-Interim reanalysis: Configuration and performance of the data assimilation system, Q. J. Roy. Meteor. Soc., 137, 553–597, 2011.
Derwent, R. G., Ryall, D. B., Jennings, S. G., Spain, T. G., and Simmonds, P. G.: Black carbon aerosol and carbon monoxide in European regionally polluted air masses at Mace Head, Ireland during 1995–1998, Atmos. Environ., 35, 6371–6378, 2001.
Di Biagio, C., Formenti, P., Cazaunau, M., Pangui, E., Marchand, N., and Doussin, J. F.: Aethalometer multiple scattering correction Cref for mineral dust aerosols, Atmos. Meas. Tech., 10, 2923–2939, https://doi.org/10.5194/amt-10-2923-2017, 2017.
Draxler, R. R. and Rolph, G. D.: HYSPLIT (HYbrid Single-Particle Lagrangian Integrated Trajectory), available at: http://ready.arl.noaa.gov/HYSPLIT.php (last access: 12 November 2018), NOAA Air Resources Laboratory, Silver Spring, MD, 2015.
Eatough, D. J., Eatough, N. L., Pang, Y., Sizemore, S., Kirchstetter, T. W., Novakov, T., and Hobbs, P. V.: Semivolatile particulate organic material in southern Africa during SAFARI 2000, J. Geophys. Res., 108, 8479, https://doi.org/10.1029/2002JD002296, 2003.
Flato, G., Marotzke, J., Abiodun, B., Braconnot, P., Chou, S. C., Collins, W., Cox, P., Driouech, F., Emori, S., Eyring, V., Forest, C., Gleckler, Guilyardi, P. E., Jakob, C., Kattsov, V., Reason, C., and Rummukainen, M.: Evaluation of climate models, in Climate Change: The Physical Science Basis, Contribution of Working Group I to the Fifth Assessment Report of the Intergovernmental Panel on Climate Change, edited by: Stocker, T. F. et al., 741–866, Cambridge Univ. Press, Cambridge, https://doi.org/10.1017/CBO9781107415324.020, 2013.
Formenti, P., Piketh, S. J. and Annegarn, H. J.: Detection of non-sea salt sulphate aerosol at a remote coastal site in South Africa: A PIXE study, Nucl. Instrum. Meth. B, 150, 332–338, https://doi.org/10.1016/S0168-583X(98)01041-6, 1999.
Formenti, P., Elbert, W., Maenhaut, W., Haywood, J., Osborne, S., and Andreae, M. O.: Inorganic and carbonaceous aerosols during the Southern African Regional Science Initiative (SAFARI 2000) experiment: Chemical characteristics, physical properties, and emission data for smoke from African biomass burning, J. Geophys. Res., 108, 8488, https://doi.org/10.1029/2002JD002408, 2003.
Fraser, D. R., Notteboom, T., and Ducruet, C.: Peripherality in the global container shipping network: the case of the Southern African container port system, GeoJournal, 81, 139, https://doi.org/10.1007/s10708-014-9610-6, 2016.
Gelaro, R., McCarty, W., Suárez, M. J., Todling, R., Molod, A., Takacs, L., Randles, C. A., Darmenov, A., Bosilovich, M. G., Reichle, R., Wargan, K., Coy, L., Cullather, R., Draper, C., Akella, S., Buchard, V., Conaty, A., da Silva, A. M., Gu, W., Kim, G., Koster, R., Lucchesi, R., Merkova, D., Nielsen, J. E., Partyka, G., Pawson, S., Putman, W., Rienecker, M., Schubert, S. D., Sienkiewicz, M., and Zhao, B.: The Modern-Era Retrospective Analysis for Research and Applications, Version 2 (MERRA-2), J. Climate, 30, 5419–5454, https://doi.org/10.1175/JCLI-D-16-0758.1, 2017.
Guieu, C., Bonnet, S., Wagener, T. and Loye-Pilot, M. D.: Biomass burning as a source of dissolved iron to the open ocean?, Geophys. Res. Lett., 32, L19608, https://doi.org/10.1029/2005GL022962, 2005.
Hansen, A. D. A.: The aethalometer, technical guide, available at: http://mageesci.com/images/stories/docs/Aethalometer_book_2005.07.03.pdf (last access: 12 November 2018), 2005.
Hansen, A. D. A., Rosen, H. and Novakov, T.: The aethalometer – an instrument for the real-time measurement of optical absorption by aerosol particles, Sci. Total Environ., 36, 191–196, https://doi.org/10.1016/0048-9697(84)90265-1, 1984.
Hansen, J. E., Sato, M., and Ruedy, R.: Radiative forcing and climate response, J. Geophys. Res., 102, 6831–6864, 1997.
Haywood, J. and Shine, K.: The effect of anthropogenic sulfate and soot aerosol on the clear sky planetary radiation budget, Geophys. Res. Lett., 22, 603–606, 1995.
Haywood, J. M., Osborne, S. R., Francis, P. N., Keil, A., Formenti, P., Andreae, M. O., and Kaye, P. H.: The mean physical and optical properties of regional haze dominated by biomass burning aerosol measured from the C-130 aircraft during SAFARI 2000, J. Geophys. Res., 108, 8473, https://doi.org/10.1029/2002JD002226, 2003.
Hobbs, P. V.: Clean air slots and dense atmospheric pollution in southern Africa, J. Geophys. Res., 108, 8490, https://doi.org/10.1029/2002JD002156, 2003.
Jacobson, M.: Strong radiative heating due to the mixing state of black carbon in atmospheric aerosols, Nature, 409, 695–697, 2001.
Janssens-Maenhout, G., Crippa, M., Guizzardi, D., Dentener, F., Muntean, M., Pouliot, G., Keating, T., Zhang, Q., Kurokawa, J., Wankmüller, R., Denier van der Gon, H., Kuenen, J. J. P., Klimont, Z., Frost, G., Darras, S., Koffi, B., and Li, M.: HTAP_v2.2: a mosaic of regional and global emission grid maps for 2008 and 2010 to study hemispheric transport of air pollution, Atmos. Chem. Phys., 15, 11411–11432, https://doi.org/10.5194/acp-15-11411-2015, 2015.
Johansson, L., Jalkanen, J.-P., and Kukkonen, J.: Global assessment of shipping emissions in 2015 on a high spatial and temporal resolution, Atmos. Environ., 167, 403–415, https://doi.org/10.1016/j.atmosenv.2017.08.042, 2017.
Keil, A. and Haywood, J. M.: Solar radiative forcing by biomass burning aerosol particles during SAFARI 2000: A case study based on measured aerosol and cloud properties, J. Geophys. Res., 108, 8467, https://doi.org/10.1029/2002JD002315, 2003.
Kirchstetter, T. W., Novakov, T., Hobbs, P. V., and Magi, B.: Airborne measurements of carbonaceous aerosols in southern Africa during the dry biomass burning season, J. Geophys. Res., 108, 8476, https://doi.org/10.1029/2002JD002171, 2003.
Kirchstetter, T. W., Novakov,, T. and Hobbs, P. V.: Evidence that the spectral dependence of light absorption by aerosols is affected by organic carbon, J. Geophys. Res., 109, D21208, https://doi.org/10.1029/2004JD004999, 2004.
Knox, A., Evans, G. J., Brook, J. R., Yao, X., Jeong, C. H., Godri, K. J., Sabaliauskas, K., and Slowik, J. G.: Mass Absorption Cross-Section of Ambient Black Carbon Aerosol in Relation to Chemical Age, Aerosol Sci. Technol., 43, 522–532, 2009.
Koch, D. and Del Genio, A. D.: Black carbon semi-direct effects on cloud cover: review and synthesis, Atmos. Chem. Phys., 10, 7685–7696, https://doi.org/10.5194/acp-10-7685-2010, 2010.
Liousse, C., Cachier, H. and Jennings, S. G.: Optical and thermal measurements of black carbon aerosol content in different environments: Variations of the specific attenuation cross-section, sigma (σ). Atmos. Environ., 27, 1203–1211, https://doi.org/10.1016/0960-1686(93)90246-U, 1993.
Luo, C., Mahowald, N., Bond, T., Chuang, P. Y., Artaxo, P., Siefert, R., Chen, Y., and Schauer, J.: Combustion iron distribution and deposition, Global Biogeochem. Cy., 22, GB1012, doi10.1029/2007GB002964, 2008
Marinoni, A., Cristofanelli, P., Laj, P., Duchi, R., Calzolari, F., Decesari, S., Sellegri, K., Vuillermoz, E., Verza, G. P., Villani, P., and Bonasoni, P.: Aerosol mass and black carbon concentrations, a two year record at NCO-P (5079 m, Southern Himalayas), Atmos. Chem. Phys., 10, 8551–8562, https://doi.org/10.5194/acp-10-8551-2010, 2010.
Martins, J. V., Artaxo, P., Liousse, C., Reid, J. S., Hobbs, P. V., Kaufman, Y. J.: Effects of black carbon content, particle size and mixing on light absorption by aerosol particles from biomass burning in Brazil, J. Geophys. Res., 103, 32041–32050, 1998.
Maúre, G., Pinto, I., Ndebele-Murisa, M., Muthige, M., Lennard, C., Nikulin, G., Dosio, A., and Meque, A.: The southern African climate under 1.5 ∘ C and 2 ∘C of global warming as simulated by CORDEX regional climate models, Environ. Res. Lett., 13, 065002, https://doi.org/10.1088/1748-9326/aab19, 2018.
Myhre, G., Samset, B. H., Schulz, M., Balkanski, Y., Bauer, S., Berntsen, T. K., Bian, H., Bellouin, N., Chin, M., Diehl, T., Easter, R. C., Feichter, J., Ghan, S. J., Hauglustaine, D., Iversen, T., Kinne, S., Kirkevåg, A., Lamarque, J.-F., Lin, G., Liu, X., Lund, M. T., Luo, G., Ma, X., van Noije, T., Penner, J. E., Rasch, P. J., Ruiz, A., Seland, Ø., Skeie, R. B., Stier, P., Takemura, T., Tsigaridis, K., Wang, P., Wang, Z., Xu, L., Yu, H., Yu, F., Yoon, J.-H., Zhang, K., Zhang, H., and Zhou, C.: Radiative forcing of the direct aerosol effect from AeroCom Phase II simulations, Atmos. Chem. Phys., 13, 1853–1877, https://doi.org/10.5194/acp-13-1853-2013, 2013.
O'Neill, N. T., Eck, T. F., Smirnov, A., Holben, B. N., and Thulasiraman, S.: Spectral discrimination of coarse and fine mode optical depth, 108, J. Geophys. Res., D17, 4559–4573, https://doi.org/10.1029/2002JD002975, 2003.
Paris, R., Desboeufs, K. V., Formenti, P., Nava, S., and Chou, C.: Chemical characterisation of iron in dust and biomass burning aerosols during AMMA-SOP0/DABEX: implication for iron solubility, Atmos. Chem. Phys., 10, 4273–4282, https://doi.org/10.5194/acp-10-4273-2010, 2010.
Petzold, A., Kopp, C., and Niessner, R.: The dependence of the specific attenuation cross-section on black carbon mass fraction and particle size, Atmos. Environ., 31, 661–672, 1997.
Piketh, S. J., Annegarn, H. J. and Tyson, P. D.: Lower tropospheric aerosol loadings over South Africa: The relative contribution of aeolian dust, industrial emissions, and biomass burning, J. Geophys. Res., 104, 1597, https://doi.org/10.1029/1998JD100014, 1999.
Piketh, S. J., Swap, R. J., Maenhaut, W., Annegarn, H. J., and Formenti, P.: Chemical evidence of long-range atmospheric transport over southern Africa, J. Geophys. Res., 107, 4817, https://doi.org/10.1029/2002JD002056, 2002.
Quinn, P. K., Coffman, D. J., Kapustin, V. N., Bates, T. S., and Covert, D. S.: Aerosol optical properties in the marine boundary layer during the First Aerosol Characterization Experiment (ACE 1) and the underlying chemical and physical aerosol properties, J. Geophys. Res.-Atmos., 103, 16547–16563, https://doi.org/10.1029/97JD02345, 1998.
Saturno, J., Pöhlker, C., Massabò, D., Brito, J., Carbone, S., Cheng, Y., Chi, X., Ditas, F., Hrabe de Angelis, I., Morán-Zuloaga, D., Pöhlker, M. L., Rizzo, L. V., Walter, D., Wang, Q., Artaxo, P., Prati, P., and Andreae, M. O.: Comparison of different Aethalometer correction schemes and a reference multi-wavelength absorption technique for ambient aerosol data, Atmos. Meas. Tech., 10, 2837–2850, https://doi.org/10.5194/amt-10-2837-2017, 2017.
Schmid, O., Artaxo, P., Arnott, W. P., Chand, D., Gatti, L. V., Frank, G. P., Hoffer, A., Schnaiter, M., and Andreae, M. O.: Spectral light absorption by ambient aerosols influenced by biomass burning in the Amazon Basin, I: Comparison and field calibration of absorption measurement techniques, Atmos. Chem. Phys., 6, 3443–3462, https://doi.org/10.5194/acp-6-3443-2006, 2006.
Schulzweida, U., Kornblueh, L., and Quast, R.: CDO user's guide, Climate Data Operators, Version, 1(6), 2006.
Segura, S., Estellés, V., Titos, G., Lyamani, H., Utrillas, M. P., Zotter, P., Prévôt, A. S. H., Mocnik, G., Alados-Arboledas, L., and Martínez-Lozano, J. A.: Determination and analysis of in situ spectral aerosol optical properties by a multi-instrumental approach, Atmos. Meas. Tech., 7, 2373–2387, https://doi.org/10.5194/amt-7-2373-2014, 2014.
Seinfeld, J. H. and Pandis, S. N. (Eds.): Atmospheric chemistry and physics: From air pollution to climate change, John Wiley and Sons Inc., New York, 1997.
Sheridan, P., Andrews, E., Schmeisser, L., Vasel, B., and Ogren, J.: Aerosol Measurements at South Pole: Climatology and Impact of Local Contamination, Aerosol Air. Qual. Res., 16, 855–872, https://doi.org/10.4209/aaqr.2015.05.0358, 2016.
Subramanian, R., Kok, G. L., Baumgardner, D., Clarke, A., Shinozuka, Y., Campos, T. L., Heizer, C. G., Stephens, B. B., de Foy, B., Voss, P. B., and Zaveri, R. A.: Black carbon over Mexico: the effect of atmospheric transport on mixing state, mass absorption cross-section, and BC/CO ratios, Atmos. Chem. Phys., 10, 219–237, https://doi.org/10.5194/acp-10-219-2010, 2010.
Swap, R., Garstang, M., Macko, S. A., Tyson, P. D., Maenhaut, W., Artaxo, P., Kållberg, P., and Talbot, R.: The long-range transport of southern African aerosols to the tropical South Atlantic, J. Geophys. Res., 101, 23777–23791, https://doi.org/10.1029/95JD01049, 1996.
Swap, R. J., Annegarn, H. J., Suttles, J. T., Haywood, J., Helmlinger, M. C., Hely, C., Hobbs, P. V., Holben, B. N., Ji, J., King, M. D., Landmann, T., Maenhaut, W., Otter, L., Pak, B., Piketh, S. J., Platnick, S., Privette, J., Roy, D., Thompson, A. M., Ward, D., and Yokelson, R.: The Southern African Regional Science Initiative (SAFARI 2000): overview of the dry season field campaign, S. African J. Sci., 98, 125–130, 2002.
Swap, R. J., Annegarn, H. J., Suttles, J. T., King, M. D., Platnick, S., Privette, J. L., and Scholes, R. J.: Africa burning: A thematic analysis of the Southern African Regional Science Initiative (SAFARI 2000), J. Geophys. Res., 108, 8465, https://doi.org/10.1029/2003JD003747, 2003.
Taljaard, J. J.: Atmospheric circulation systems, synoptic climatology and weather phenomena of South Africa, Part 1: controls of the weather and climate of South Africa, Technical Paper No. 27, Weather Bureau, Pretoria, (available from South African Weather Bureau, Private Bag X097, Pretoria 0001), 1994.
Tlhalerwa, K., Freiman, M. T. and Piketh, S. J.: Aerosol Deposition off the Southern African West Coats by Berg Winds, S. African J. Sci., 87, 152–161, 2005.
Tournadre, J.: Anthropogenic pressure on the open ocean: The growth of ship traffic revealed by altimeter data analysis, Geophys. Res. Lett., 41, 7924–7932, 2014.
Tyson, P. D. and Preston-Whyte, R. A.: The Weather and Climate of Southern Africa, 2nd edn., Oxford University Press Southern Africa, Cape Town, 2014.
von Schneidemesser, E., Schauer, J. J., Hagler, G. W., and Bergin, M. H.: Concentrations and Sources of Carbonaceous Aerosol in the Atmosphere of Summit, Greenland, Atmos. Environ., 43, 4155–4162, 2009.
Weingartner, E., Saathoff, H., Schnaiter, M., Streit, N., Bitnar, B., and Baltensperger, U.: Absorption of light by soot particles: determination of the absorption coefficient by means of aethalometers, J. Aerosol Sci., 34, 1445–1463, 2003.
Zanatta, M., Gysel, M., Bukowiecki, N., Müller, T., Weingartner, E., Areskoug, H., Fiebig, M., Yttri, K. E., Mihalopoulos, N., Kouvarakis, G., Beddows, D., Harrison, R. M., Cavalli, F., Putaud, J. P., Spindler, G., Wiedensohler, A., Alastuey, A., Pandolfi, M., Sellegri, K., Swietlicki, E., Jaffrezo, J. L., Baltensperger, U., and Laj, P.: A European aerosol phenomenology-5: Climatology of black carbon optical properties at 9 regional background sites across Europe, Atmos. Environ, 145, 346–364, https://doi.org/10.1016/j.atmosenv.2016.09.035, 2016.
Zuidema, P., Redemann, J., Haywood, J., Wood, R., Piketh, S., Hipondoka, M., and Formenti, P.: Smoke and Clouds above the Southeast Atlantic: Upcoming Field Campaigns Probe Absorbing Aerosol's Impact on Climate, B. Am. Meteorol. Soc., 97, 1131–1135, https://doi.org/10.1175/BAMS-D-15-00082.1, 2016.
Zuidema, P., Sedlacek, A. J., Flynn, C., Springston, S., Delgadillo, R., Zhang, J., Aiken, A. C., Koontz, A., and Muradyan, P.: The Ascension Island boundary layer in the remote Southeast Atlantic is often smoky, Geophys. Res. Lett., 45, 4456–4465, https://doi.org/10.1002/2017GL076926, 2018.