the Creative Commons Attribution 4.0 License.
the Creative Commons Attribution 4.0 License.
 | 19 Nov 2018
The vertical variability of ammonia in urban Beijing, China
Yangyang Zhang
Aohan Tang
Dandan Wang
Qingqing Wang
Katie Benedict
Lin Zhang
Duanyang Liu
Jeffrey L. Collett Jr.
Xuejun Liu
Weekly vertical profiles of ammonia (NH3) were measured at 16 heights on the Beijing 325 m meteorological tower for 1 year from March 2016 to March 2017. The average NH3 concentrations exceeded 4 µg m−3 at all heights with an overall average (±1σ) value of 13.3 (±4.8) µg m−3. The highest NH3 concentrations along the vertical profiles mostly occurred from 32 to 63 m, decreasing both towards the surface and at higher altitudes. Significant decreases in NH3 concentrations were only found at the top two heights (280 and 320 m). These results suggest an NH3 rich atmosphere during all seasons in urban Beijing, from the ground to at least 320 m. The highest seasonal NH3 concentrations across the profile were observed in summer (18.2 µg m−3) with high temperature, followed by spring (13.4 µg m−3), autumn (12.1 µg m−3) and winter (8.3 µg m−3). A significant vertical variation in the NH3 concentration was only found in summer. Source region analyses suggest that air masses from intensive agricultural regions to the south contribute most to the high NH3 concentrations in Beijing. Local sources such as traffic emissions also appear to be important contributors to atmospheric NH3 in this urban environment.
- Article
(5318 KB) - Full-text XML
-
Supplement
(5302 KB) - BibTeX
- EndNote


Ammonia (NH3) has long been recognized as an important form of reactive nitrogen (Nr) in the atmospheric environment, playing a key role in biogeochemical cycles from atmospheric chemical processes to deposition and in subsequent environmental impacts (e.g., air pollution, reduced biodiversity, acidification and eutrophication) (Fowler et al., 2009; Sutton et al., 2008). NH3 reacts with nitric and sulfuric acids in air, forming secondary inorganic aerosols (e.g., NH4NO3, (NH4)2SO4) with long atmospheric lifetimes that can transport these species far from sources and contribute 40 %–57 % of the fine particle matter in megacities (Fowler et al., 2009; Huang et al., 2014; Yang et al., 2011). Therefore, NH3 has received increasing attention in air pollution research (Wang et al., 2015). In addition to agriculture, which is considered the largest global NH3 source, emissions from biomass burning, industry, vehicles and other sources (Galloway et al., 2003; Sutton et al., 2008; Erisman et al., 2008; Sun et al., 2016, 2017) can also be significant.
In China, annual NH3 emissions were approximately 2 and 3 times higher than European and US emissions, respectively, over the period from 1990 to 2005 (Reis et al., 2009; Kang et al., 2016; Zhao and Wang, 1994; Klimont, 2001; EMEP, 2018; USEPA, 2018), and were estimated to be 14.6 Tg N yr−1 in 2010 (Liu et al., 2013) and 15.6 Tg N yr−1 in 2015 (Zhang et al., 2017). Such high emissions, in addition to the important role NH3 plays in degrading air quality, makes NH3 a key target to curb serious air pollution in Chinese urban areas (Fu et al., 2017; Chang et al., 2016; Ye et al., 2011; Wang et al., 2011). Some studies have indicated that reducing NH3 concentrations could be an effective method for alleviating secondary inorganic PM2.5 pollution in China (Gu et al., 2014; Wang et al., 2015; Wu et al., 2016; Xu et al., 2017). However, NH3 has received less attention from the government than SO2 and NOx, which have been controlled since 2005 and were effectively reduced during the 12th Five-Year Plan period (2011–2015) (Fu et al., 2017). Currently there are strong arguments regarding the role of regional transport in contributing to haze pollution in China (Guo et al., 2014; Li et al., 2015), especially for severe haze episodes occurring during stagnant meteorological conditions with a shallow boundary layer (Sun et al., 2014; Zheng et al., 2015; Quan et al., 2013). The vertical characterization of air pollutant concentration profiles may be helpful for elucidating factors contributing to the formation and transport of regional haze events (Quan et al., 2013; Tang et al., 2015; Wiegner et al., 2006). Many studies have been conducted to improve our understanding of temporal and spatial concentration dynamics of atmospheric NH3 and how they relate to underlying factors (e.g., emission intensity and meteorological conditions) and air quality (Yamamoto et al., 1988, 1995; Bari et al., 2003; Vogt et al., 2005; Lee et al., 1999). However, such studies in China have generally focused on the spatial distribution of NH3 near the ground (Ianniello et al., 2010; Wu et al., 2009; Meng et al., 2011; Xu et al., 2015), whereas the vertical characterization of NH3 concentrations has been very limited.
NH3 mixing ratios may vary significantly as a function of height, as NH3 is a trace gas with both point and non-point sources, and it also has a tendency to deposit rapidly to surfaces. In urban locations, like Beijing, where NH3 is a key contributor to fine particle formation, local sources (e.g., traffic) emit at the surface and are then mixed through the boundary layer, while NH3 transported from agricultural sources outside the city is presumably already mixed through the boundary layer. The influence of these behaviors may be reflected in the vertical NH3 concentration gradients measured within the city. For example, dominant local surface traffic emissions might give rise to a profile that peaks near the surface, while NH3 transported into the urban area may be uniformly mixed in the vertical or even decline near the surface due to loss by dry deposition. Of course these patterns are expected to be further affected by sinks, including surface deposition as well as by the fine particle formation of ammonium salts. NH3 vertical distribution measurements are also useful for advancing satellite retrievals, which offer a great potential for understanding the global distribution of gaseous NH3 (Shephard and Cady-Pereira, 2015; Sun et al., 2015; Van Damme et al., 2015).
To our knowledge there are few studies reporting long-term observations of the vertical distributions of NH3 in the lowest few hundred meters of the atmosphere, including measurements at the BAO tower in the USA (Li et al., 2017; Tevlin et al., 2017) and the CESAR site in the Netherlands (Dammers et al., 2017). Li et al. (2017) analyzed vertical NH3 concentration profiles at the BAO tower in Colorado, USA, reporting the minimum concentration at the top of the tower, which slowly increased towards a peak concentration at ∼10 m before a large reduction in concentration was found at 1 m. The site was influenced by the transport of high NH3 concentrations from large animal feeding operations to the northeast. Using higher time resolution measurements at the BAO tower, Tevlin et al. (2017) pointed out that the surface can act as an occasional NH3 sink as well as a source. The CESAR study in the Netherlands showed that vertical profile differences were mainly due to local and regional transport influences (Dammers et al., 2017). Because the BAO and CESAR tower sites are both located in suburban areas with low aerosol mass loadings, observed vertical profiles of aerosol and gas species (Öztürk et al., 2013; VandenBoer et al., 2013; Riedel et al., 2013) could be substantially different from those in megacities in China. Zhou et al. (2017) measured vertical concentration profiles of NH3 and 7 other air pollutants at 10 heights (8, 15, 47, 80, 120, 160, 200, 240, 280 and 320 m) in urban Beijing, finding that NH3 concentrations peaked at 160 m. However, only one vertical profile was measured and may not adequately represent typical conditions. Until now, long-term monitoring of vertical NH3 concentration profiles has not been carried out in China.
Here, we report a 1-year field campaign on the Beijing 325 m meteorological tower to investigate vertical NH3 concentration profiles and consider how temporal variations may relate to urban emission sources, meteorological factors and air transport from more distant sources. Study findings are relevant for our understanding of precursor NH3 distributions and the role of NH3 in the formation of severe aerosol pollution in China; furthermore, they will provide benchmarks to assist in meeting air quality goals and policy needs in future.
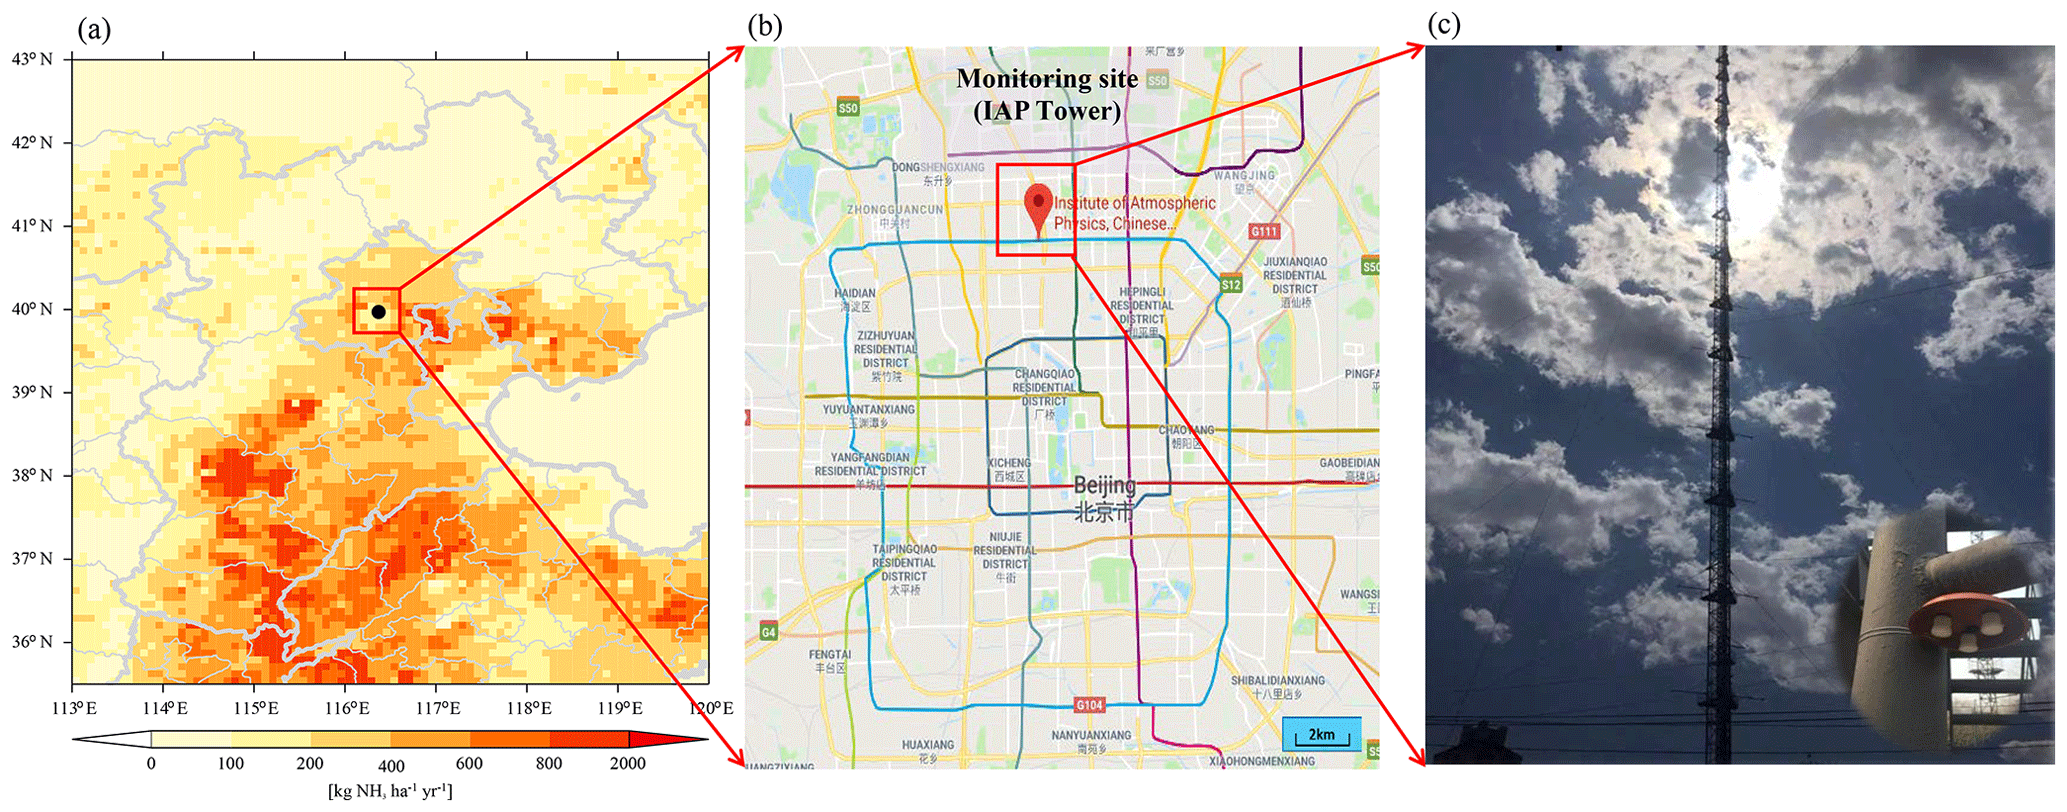
Figure 1(a) Modeled NH3 emissions distribution (0.1∘, ∼10 km) over the North China Plain in 2015 including the location of the monitoring site shown as a black dot. NH3 emission estimates are from the inventory of Zhang et al. (2018) at a 0.1∘ horizontal resolution. (b) Map of Beijing showing the location of the monitoring tower. (c) The 325 m meteorological tower and ALPHA passive samplers.
2.1 Site description
The sampling site is located at the State Key Laboratory of Atmospheric Boundary Layer Physics and Atmospheric Chemistry (LAPC), Institute of Atmospheric Physics (IAP), Chinese Academy of Sciences (CAS) in urban Beijing (39∘58′ N, 116∘22′ E; Fig. 1). The site is approximately 0.8 km north of the Third Ring Road, 1.3 km south of the Fourth Ring Road and 0.2 km west of the Beijing–Tibet expressway, which are three transport arteries encircling Beijing, each with average traffic volumes of over 200 000 vehicles day per day in 2016 (Beijing Transport Institute, 2017); therefore, this site represents a typical urban site that is mainly surrounded by residential areas.
2.2 NH3 measurement
From 16 March 2016 to 16 March 2017, weekly atmospheric NH3 samples were collected at 16 heights on the 325 m meteorological tower using ALPHA passive samplers (adapted low-cost high absorption, Centre for Ecology and Hydrology, Edinburgh, UK) except for a few samples with slightly different durations due to tower maintenance schedules. The samplers operate on the principle of diffusion using an acid-coated filter to capture the NH3. A PTFE (Teflon) membrane is placed directly at the mouth of the sampler, forming a quiescent boundary layer in front of the sample membrane. A stable, turbulent-free diffusion path length is achieved behind the membrane, whilst allowing gaseous NH3 to diffuse through for capture and minimizing the sampling of aerosol (Tang et al., 2014). NH3 was sampled at 2, 8, 15, 32, 47, 63, 80, 102, 120, 140, 160, 180, 200, 240, 280 and 320 m a.g.l. (above ground level). At each height, three ALPHA samplers were deployed under a PVC shelter to protect the samplers from rain and direct sunlight (shown in Fig. 1). NH3 samples were extracted with 10 mL high-purity water (18.2 MΩ-cm) and analyzed using a continuous-flow analyzer (Seal AA3, Germany). Three field (travel) blanks were prepared for each batch of samples, which were analyzed together with the abovementioned samples, and used to blank correct sample results and determine the method detection limit (MDL) values. MDL was calculated using the following equation: MDL , where the t value is given at the 95 % confidence level for the appropriate of degrees of freedom, Sb is the blank standard deviation, N1 and N2 are the number of sample measurements (single measurement, N1=1) and the number of analyzed blanks, respectively. From the field blanks, the MDL was calculated to be 0.31 µg m−3 for a 1-week ALPHA passive NH3 sample. All lab measurements were conducted in the Key Laboratory of Plant-Soil Interactions, Chinese Ministry of Education, China Agricultural University. More details regarding the passive samplers and the related laboratory preparation and analysis can be found in Xu et al. (2015).
2.3 Meteorological data
Meteorological parameters, including wind speed (WS), wind direction (WD), relative humidity (RH) and temperature (T), were obtained at all sampling heights except 2 m; the temperature was also not available at 8 m. WS and WD were measured using four-cup anemometers (model O1OC, Met One Instruments), and RH and T were measured using a T/RH sensor (model HC2-S3, ROTRONIC).
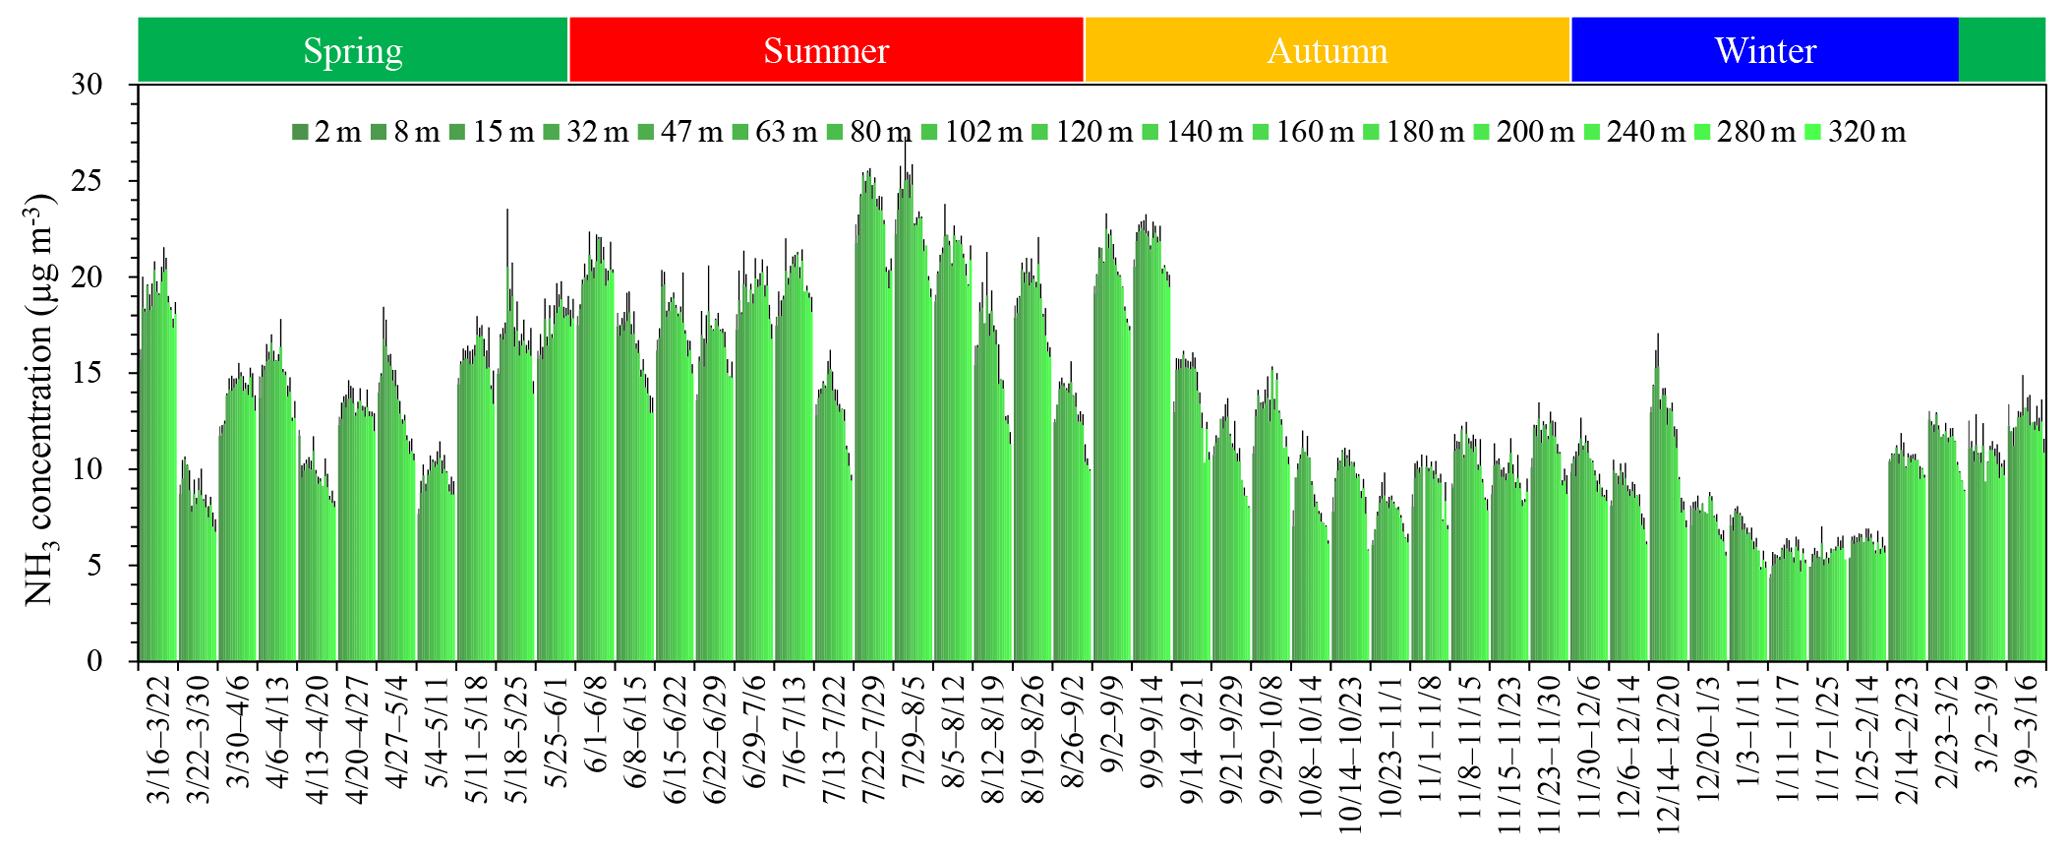
Figure 2Time series of the vertical distribution of weekly atmospheric NH3 concentrations (±1σ) in Beijing urban (16 March 2016–16 March 2017).
2.4 Data analysis
Repeated-measures analysis of variance (ANOVA) was used to test changes in the NH3 concentration along vertical profiles. When the ANOVA results were significant, the Tukey's honest significant difference (HSD) test was used to determine the significance of the difference between means with a significance level of P<0.05. The coefficient of determination was used to test the linear correlations with a significance level of P<0.05. All of the statistical analyses were conducted using SPSS version 23.0 (IBM Corp., Armonk, NY, USA).
Potential source contribution function analysis (PSCF) (Ashbaugh et al., 1985) of atmospheric NH3 was performed using MeteoInfo (TrajStat package) (Wang, 2014), where 72 h back trajectories arriving at the monitoring site (IAP tower) at each height were calculated every 3 h for the entire study period. The average NH3 concentration for each cluster was computed using the cluster statistics function. NH3 pathways could then be associated with the high concentration clusters. The number of trajectory segment endpoints falling in a grid cell (i, j) is nij. The number of trajectory endpoints associated with the data with NH3 concentrations higher than an arbitrarily set criterion for each height during the four seasons (75th percentile for NH3 was set here) is mij (Table S1 in the Supplement). The PSCF value for the ijth cell is then calculated as mij∕nij. A weighting function Wij was applied to reduce the uncertainties of small values of nij (Polissar et al., 1999). Weighted PSCF values (WPSCF) were calculated by multiplying a particular Wij (≤1.00) if the total number of the endpoints for one grid cell was lower than 3 times the average of the endpoints per each cell. Higher WPSCF values indicate higher potential contributions of NH3 to the receptor site (IAP tower).
3.1 Vertical profiles of NH3 concentrations
The time series of weekly averages of NH3 concentrations from 16 March 2016 to 16 March 2017 are shown in Fig. 2. The weekly NH3 concentration across all heights averaged 13.3±4.8 µg m−3 during the year-long study period. Individual weekly concentrations ranged from 4.4 µg m−3 at 2 m to 25.3 µg m−3 at 32 m. Nearly all (99.6 %) of the weekly NH3 concentrations along the profile exceeded 5 µg m−3. Summer concentrations were generally the highest. Maximum NH3 concentrations mostly occurred between 32 and 63 m, decreasing both towards the surface and the top of the tower. Minimum concentrations mostly occurred at 2 and 320 m (Fig. S1 in the Supplement). Significant differences of annual average NH3 concentrations across the vertical profile were only found between the “maximum concentration” height and the top two heights, i.e., 280 and 320 m (Fig. 3i). Even at 320 m, the annual average NH3 concentration was still relatively high at 11.3 µg m−3 (Fig. 3i). During the whole observation period, the daily average boundary layer height was generally above 320 m, indicating that a good portion of the sampling occurred within a well-mixed boundary layer (Fig. S2).
Seasonal vertical concentration profiles exhibited fairly similar shapes to the annual average profile, although there were some important differences in absolute concentration values and the magnitude of vertical gradients within the profiles (Fig. 3). The average NH3 concentration across the profile from high to low was observed in summer (18.2 µg m−3), spring (13.4 µg m−3), autumn (12.1 µg m−3) and winter (8.3 µg m−3). Proportional declines of the NH3 concentration from the peak to higher and lower elevations differed between seasons: the greatest proportional decline was seen in autumn (28.1 % decrease from 63 to 320 m), followed by winter (23.8 %), summer (20.5 %) and spring (15.8 %) (Fig. S3).
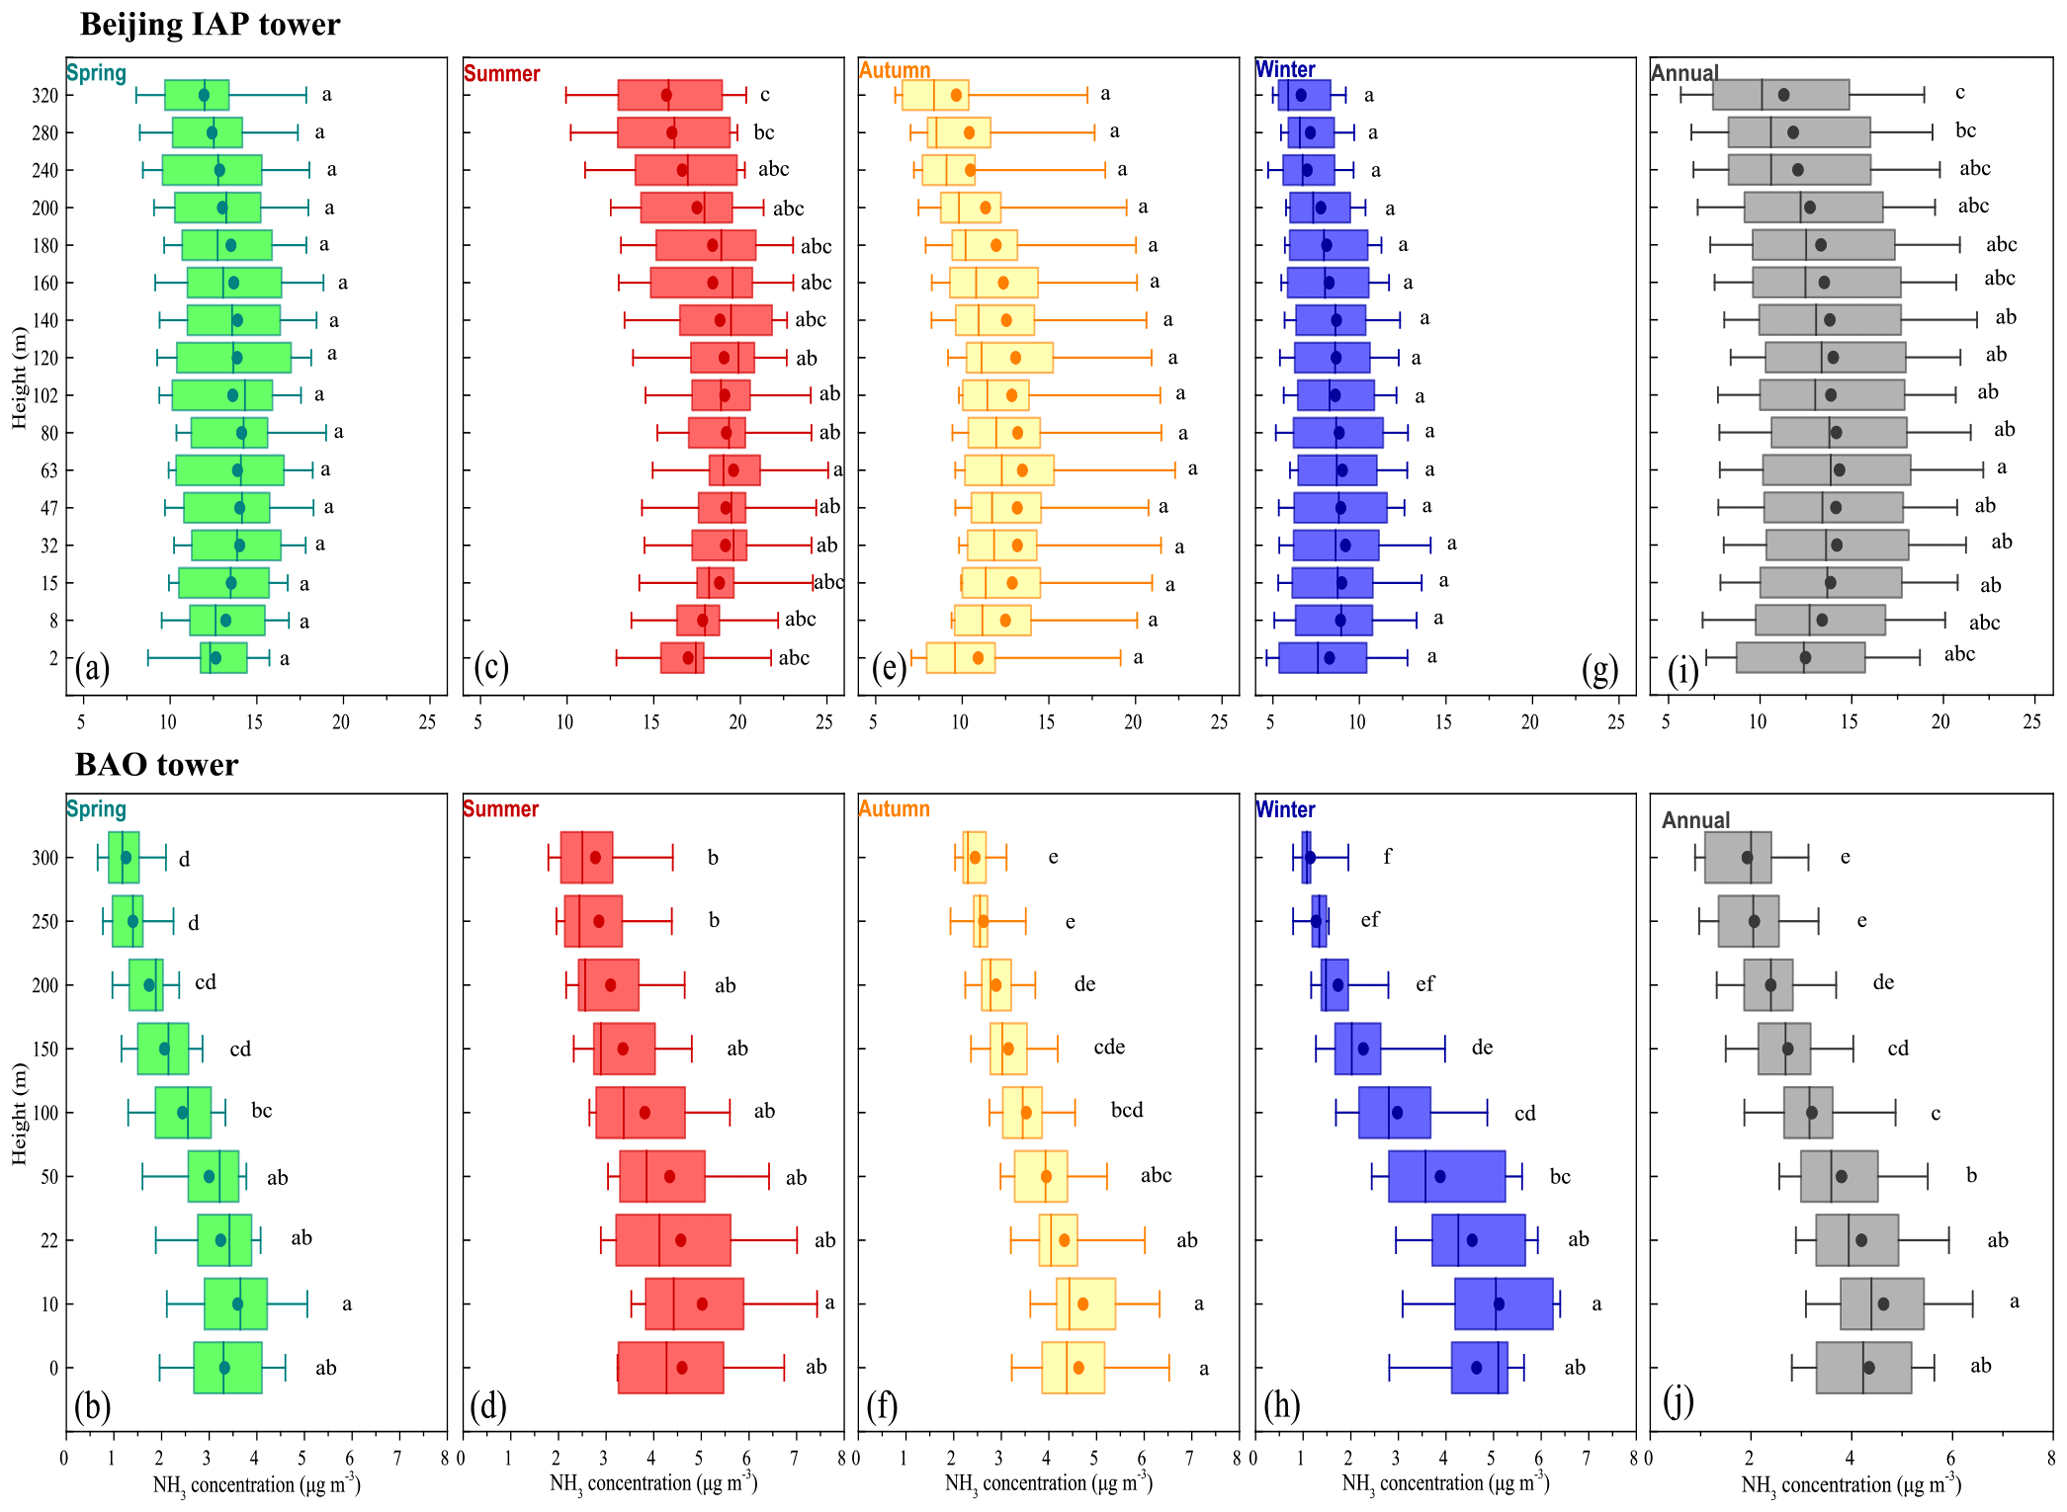
Figure 3Comparison of seasonal vertical NH3 concentrations with the mean (dots), median, 10th, 25th, 75th and 90th percentiles of the NH3 concentrations of each height for the IAP tower (Beijing, this study; a, c, e, g, i) and BAO tower (USA, Li et al., 2017; b, d, f, h, j). The lowercase letters next to the boxes denote the statistical difference in the NH3 concentration between all heights, where a one-way ANOVA was used, at the p<0.05 level.
3.2 Meteorological variability
Vertical NH3 concentration profiles varied substantially during the sampling period, along with vertical changes in meteorological parameters. Bivariate polar plots (Fig. 4) show that high NH3 concentrations below 47 m were mostly observed during periods with low wind speeds (<4 m s−1). As heights and associated wind speeds increased, the relationship between NH3 concentrations and wind speed weakened. For example, at 280 m, the highest concentration was observed when the wind speed was also high (up to an average of ∼15 m s−1).
Wind direction also plays an important role in air pollution transport. Transport from the northwest was typically associated with low NH3 concentrations at all heights, consistent with the absence of large emissions sources in the mountains northwest of Beijing. It is noteworthy that high NH3 concentrations at near-surface heights (8 and 15 m) always coincide with winds from the south, including the southeast and southwest directions. High NH3 concentrations appear to be associated with winds from the northeast from 32 m to 80 m. Above 80 m, winds from the south contribute more to high NH3 concentrations. Major regions of agricultural NH3 emissions are located south and east of Beijing.
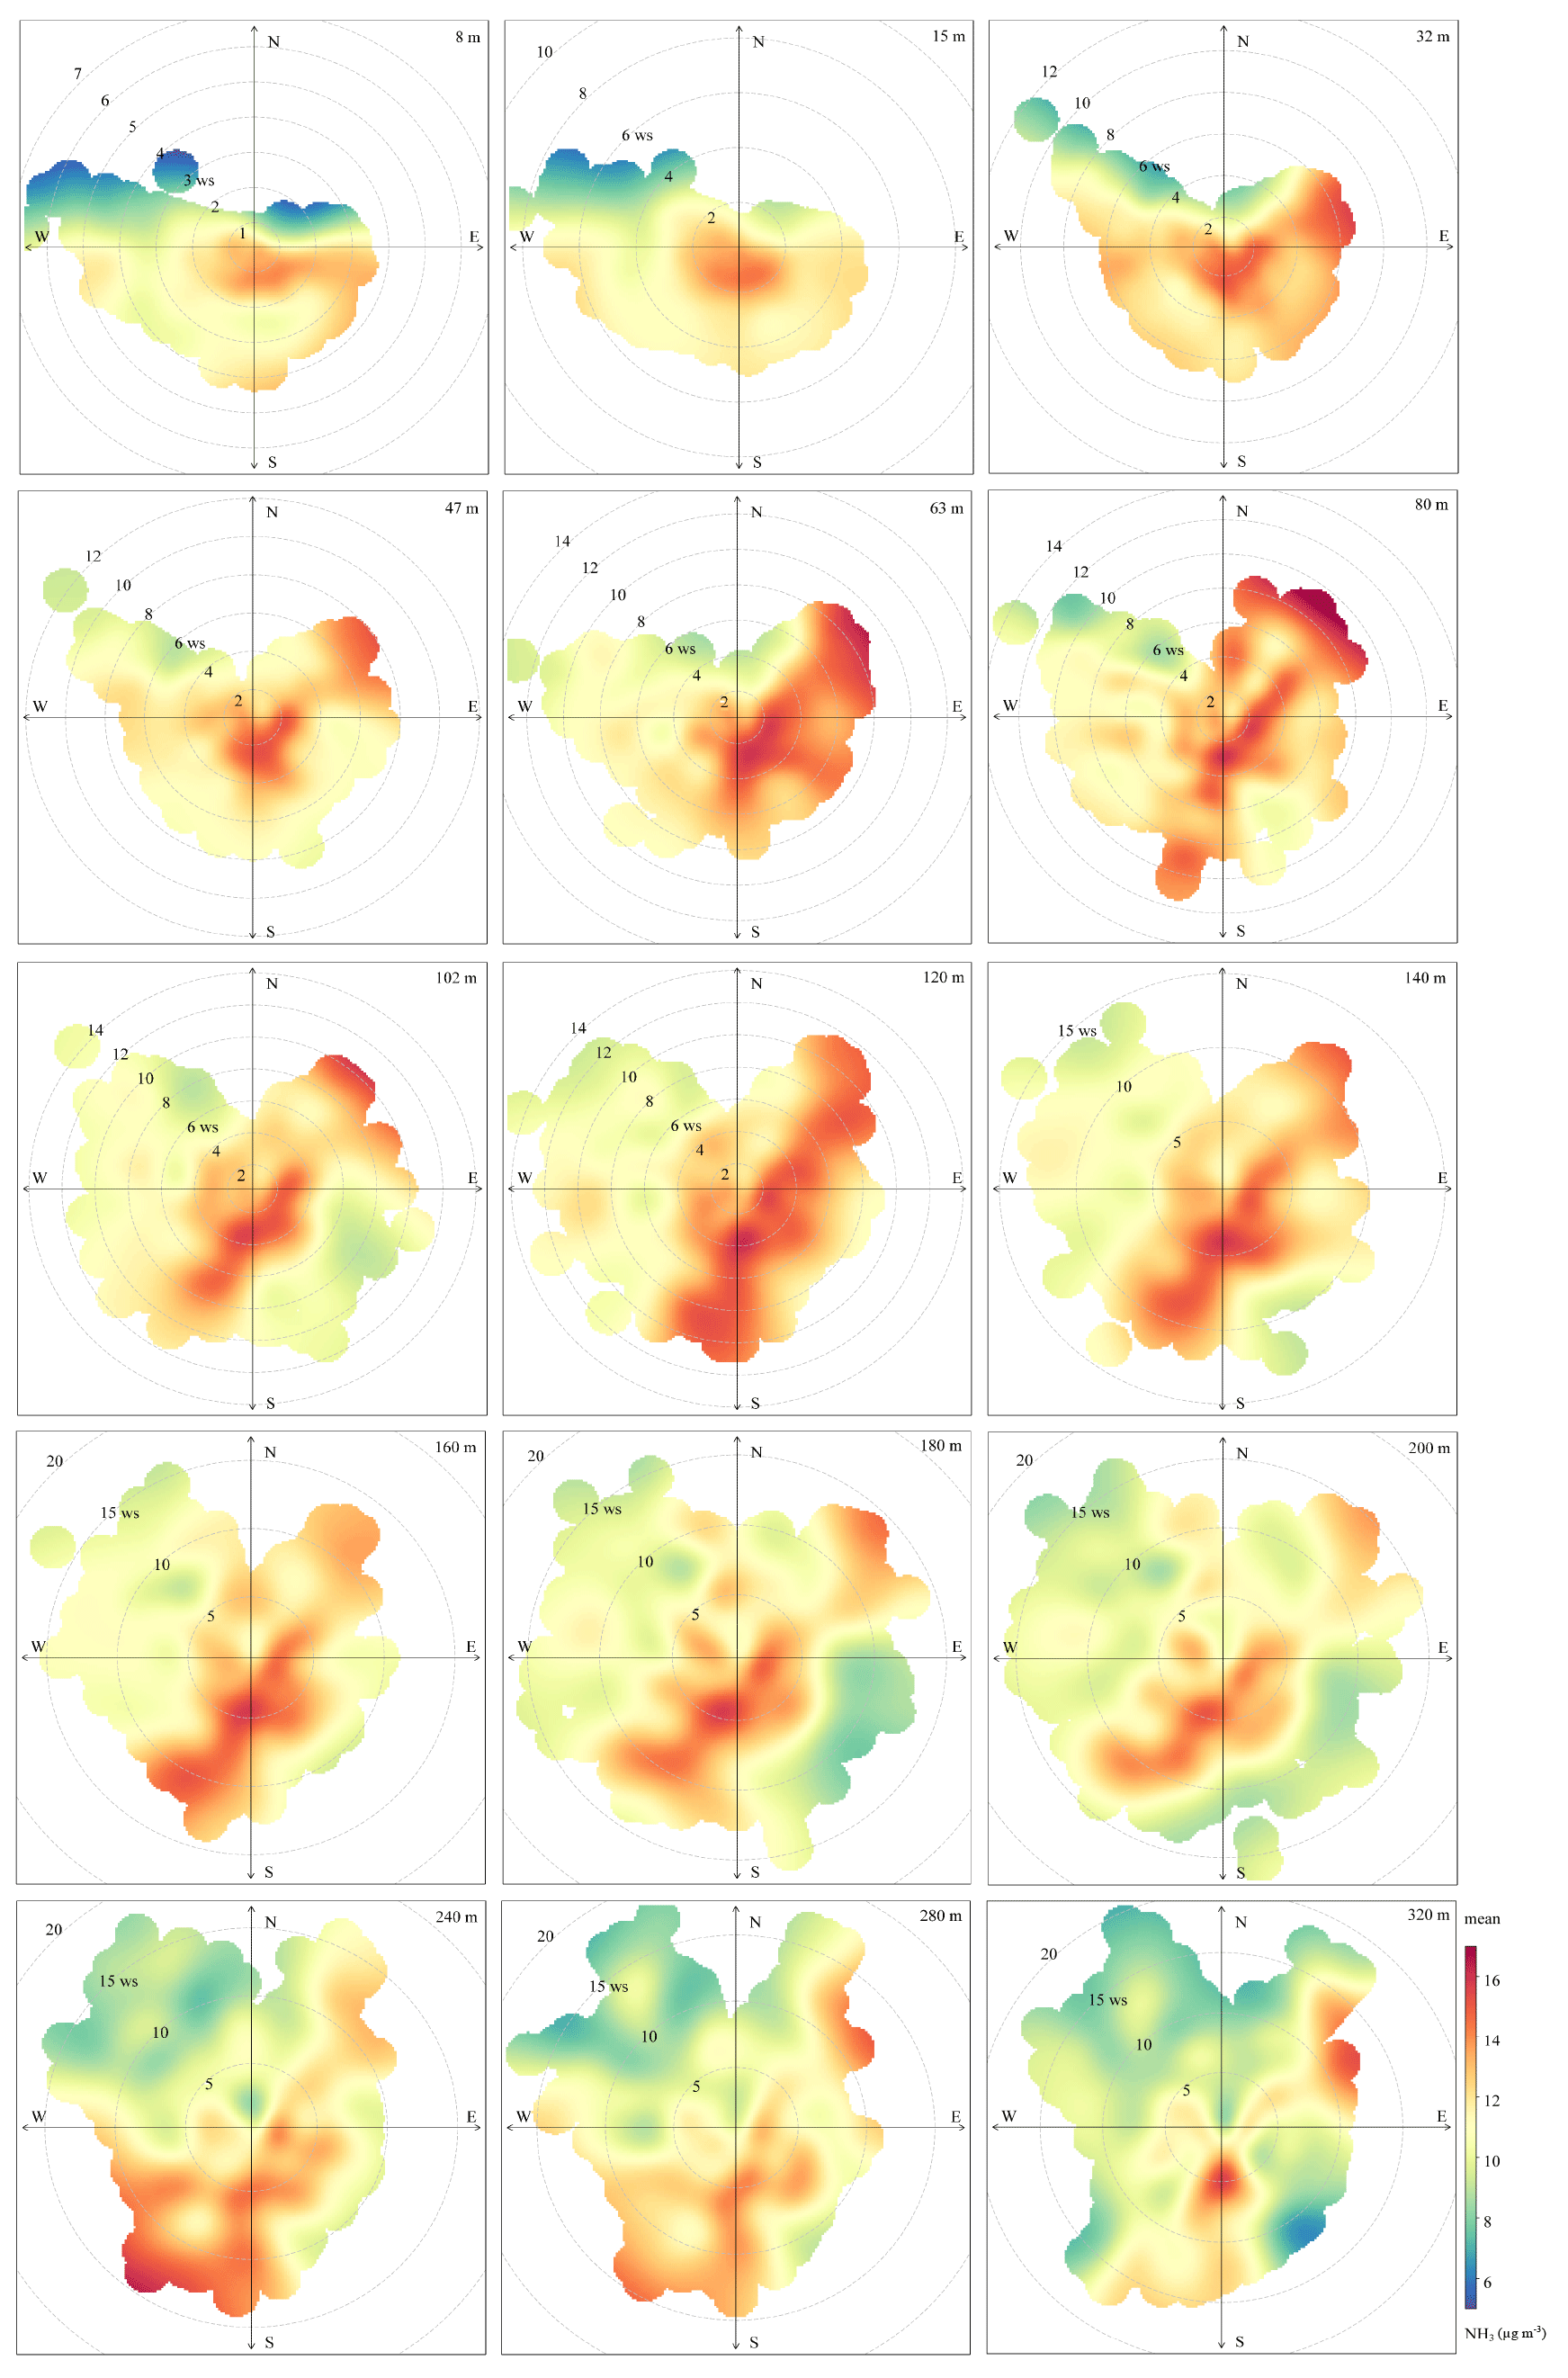
Figure 4The frequency distributions of wind directions and NH3 concentration for all height during the observation period. Radial data are WS (m s−1) as a function of WD (∘). The colors denote the NH3 concentrations (µg m−3).
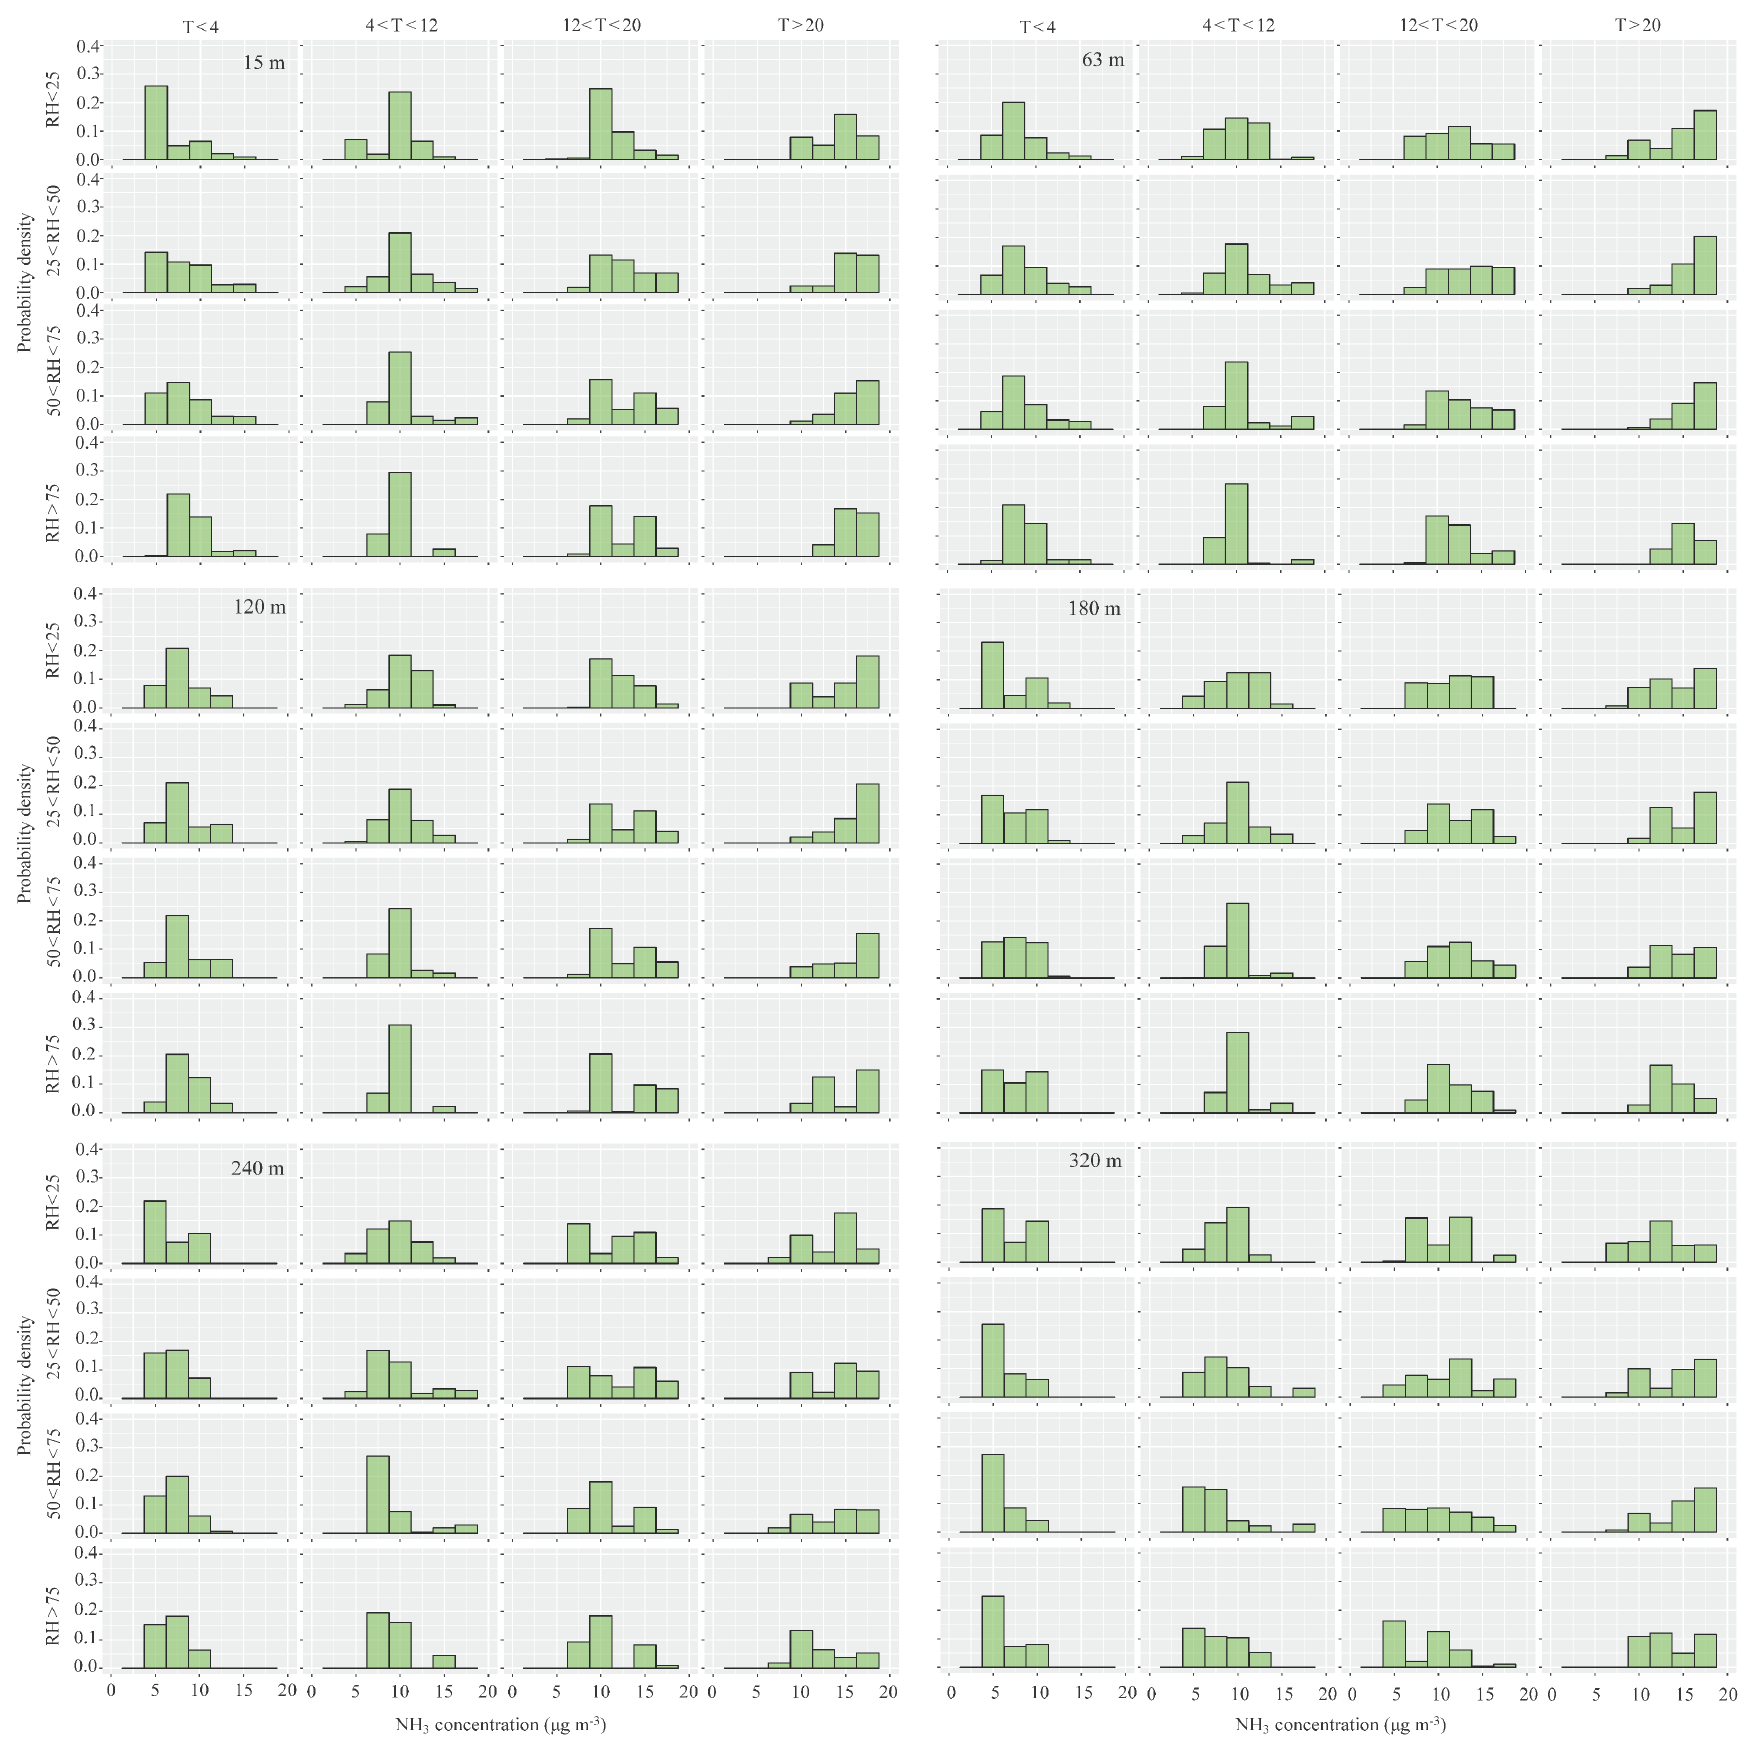
Figure 5Probability density of NH3 concentrations (µg m−3) at different ranges of temperature1 (∘C) and relative humidity2 (%) for 14 heights. 1 Temperature includes four subsets: <4, 4–12, 12–20 and >20∘C; 2 relative humidity includes four subsets: <25 %, 25–50 %, 50–75 % and >75 %.
To further investigate observed variability, we show the probability density function of NH3 concentrations in relation to the relative humidity (RH) and temperature (T) (Fig. 5). Clear positive relationships between T and NH3 concentrations were found at all heights from low RH to high RH. When T was low (T<12 ∘C), the NH3 concentration mostly fell below 10 µg m−3 under all RH conditions. The occurrence of high NH3 concentrations increased with T>12 ∘C, which is not surprising given that agricultural NH3 emissions increase with T; furthermore, higher T and lower RH also shift the equilibrium of the NH3(gas) + HNO3(gas) ↔ NH4NO3(particulate) system toward the gas phase. Statistically, a strong positive relationship was found between NH3 and T at all heights from the surface to the top of the tower (R2∼0.6; Fig. S4); both the slope and the correlation coefficients were similar across all heights. Although, a positive correlation between NH3 and RH and a negative correlation between NH3 and WS were found, the correlation coefficients were quite low.
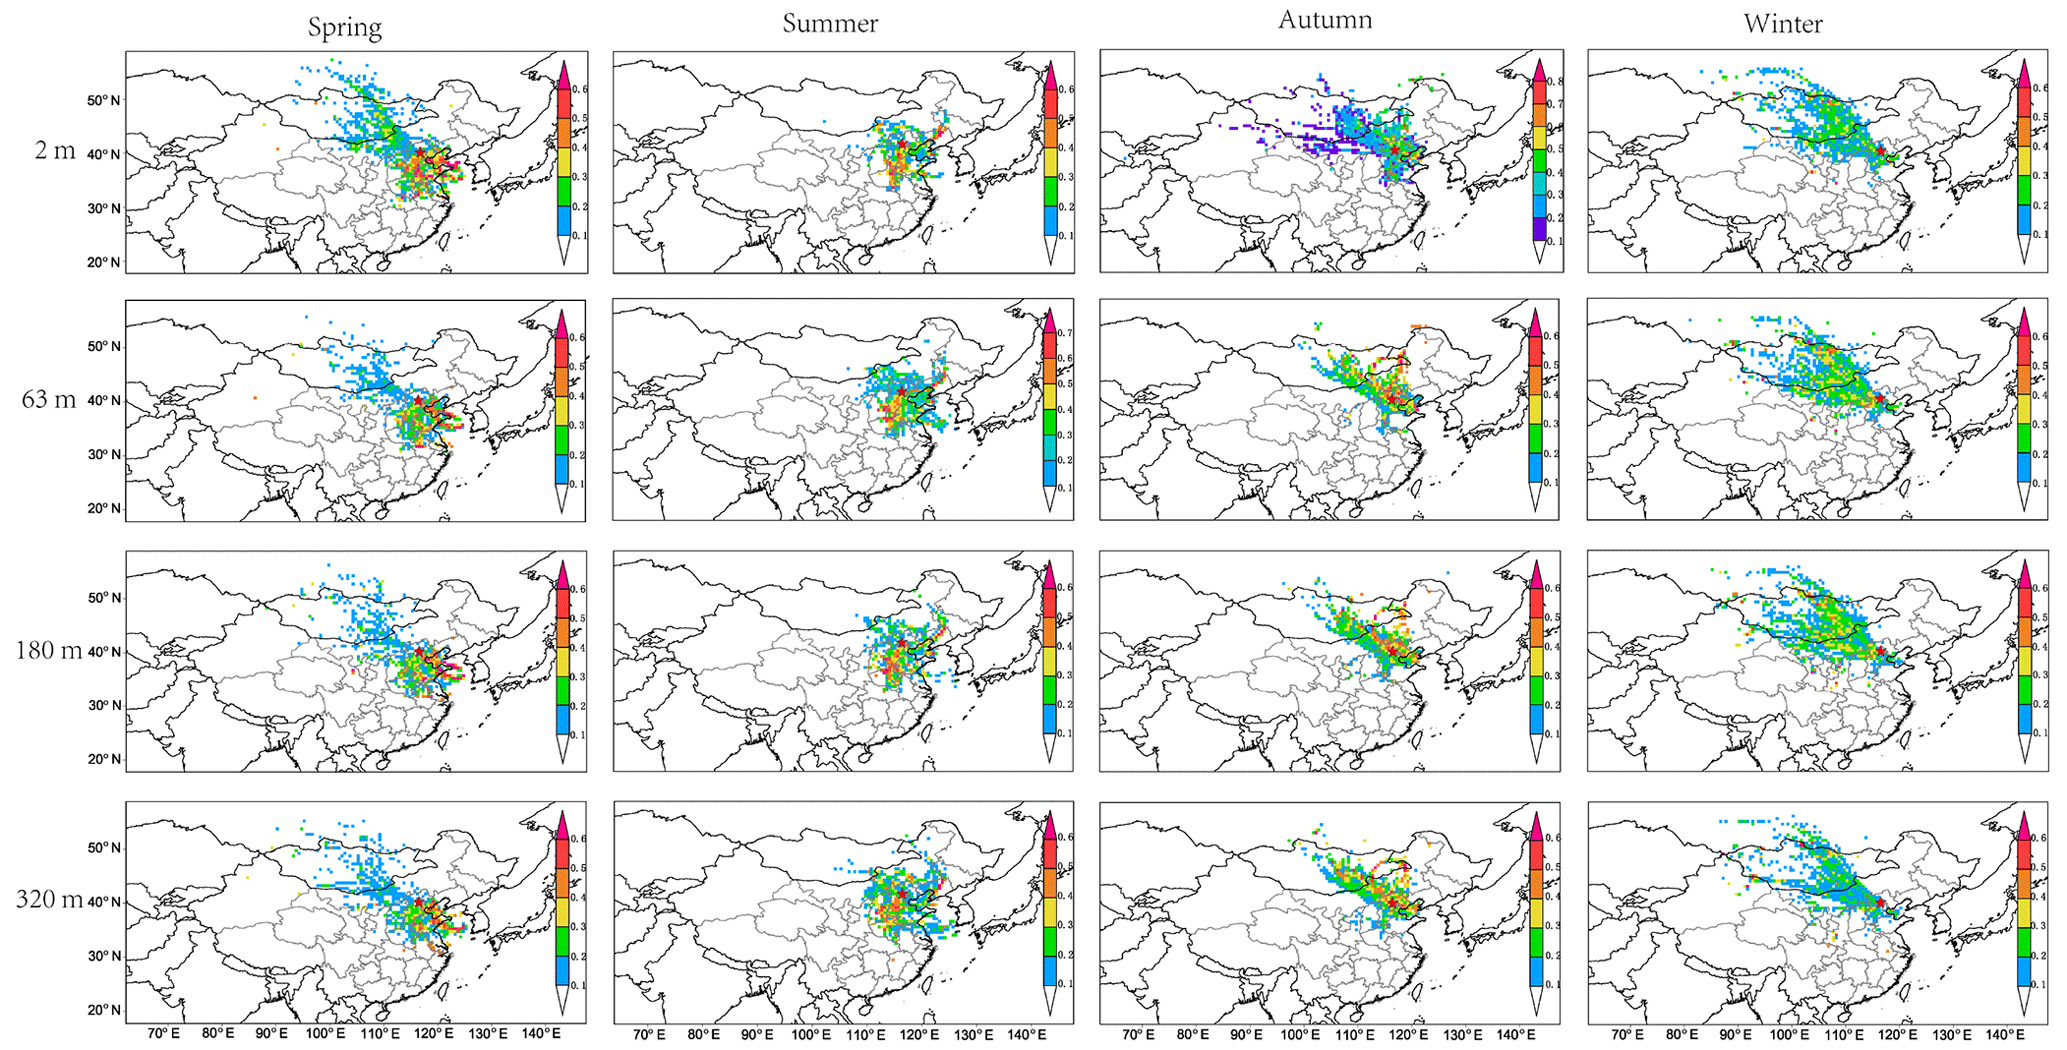
Figure 6Weighted potential source contribution analysis (WPSCF) of atmospheric NH3 in Beijing from 16 March 2016 to 16 March 2017.
3.3 Potential source analysis
Analysis of the relationship between local wind direction and NH3 concentrations does not fully clarify the potential source regions contributing to observed NH3 at the sampling site (Fig. S6). Some seasonal variations were observed, i.e., the frequency of high NH3 concentrations were greater under southerly winds than northwesterly winds in the spring, the increased frequency of high NH3 concentrations were associated with southerly and easterly winds in the summer and autumn, and NH3 concentrations still exceeded 5 µg m−3 during winter with relatively frequent winds from the northwest.
To examine the relationship between air transport and NH3 concentrations more rigorously, weighted PSCF (WPSCF) during the four seasons were calculated for several measurement heights (2, 63, 180 and 320 m) (Fig. 6). In summer, from the surface to the tower top, a strong influence from source areas to the south of Beijing was seen, coinciding with regions (e.g., Tianjin, Henan, Hebei and Shandong provinces) characterized by elevated anthropogenic emissions of NH3 (Fig. 1), largely from agricultural activities (Zhang et al., 2009; Gu et al., 2012). During summer, regions to the north and west of the monitoring site had low WPSCF values, whereas high WPSCF values to the south and southeast were common during spring. High WPSCF values were mainly located northwest and southeast of Beijing in autumn, while their WPSCF values were typically lower in winter than during other seasons.
It is important to remember that aerosol–gas partitioning can also strongly influence measured NH3 concentrations. To investigate seasonal phase changes between NH3 and , we define the NH3 gas fraction ( = the gaseous NH3 concentration divided by the sum of the gaseous NH3 and fine particulate concentrations), where the concentrations are expressed in molar units. Monthly average partitioning for these reduced inorganic nitrogen forms from a nearby urban monitoring site, 10 km from the IAP tower, is plotted in Fig. S8. The NH3 gas fraction () was found to be the highest in summer (0.83 in August) and the lowest in winter (0.36 in February). As expected, gas phase NH3 is favored in the warmer months, while particle phase is favored in the cooler months, with a gradual transition. Weekly concentrations at the tower were estimated using weekly NH3 concentrations divided by monthly , and WPSCF analysis of the sum of NH3 + was then performed (see results in Fig. S9). Results of this total WPSCF (NH3 + ) analysis yielded similar patterns to the NH3 WPSCF analysis for all heights and seasons, indicating the importance of the identified source regions for both the gaseous and particulate atmospheric forms of emitted NH3.
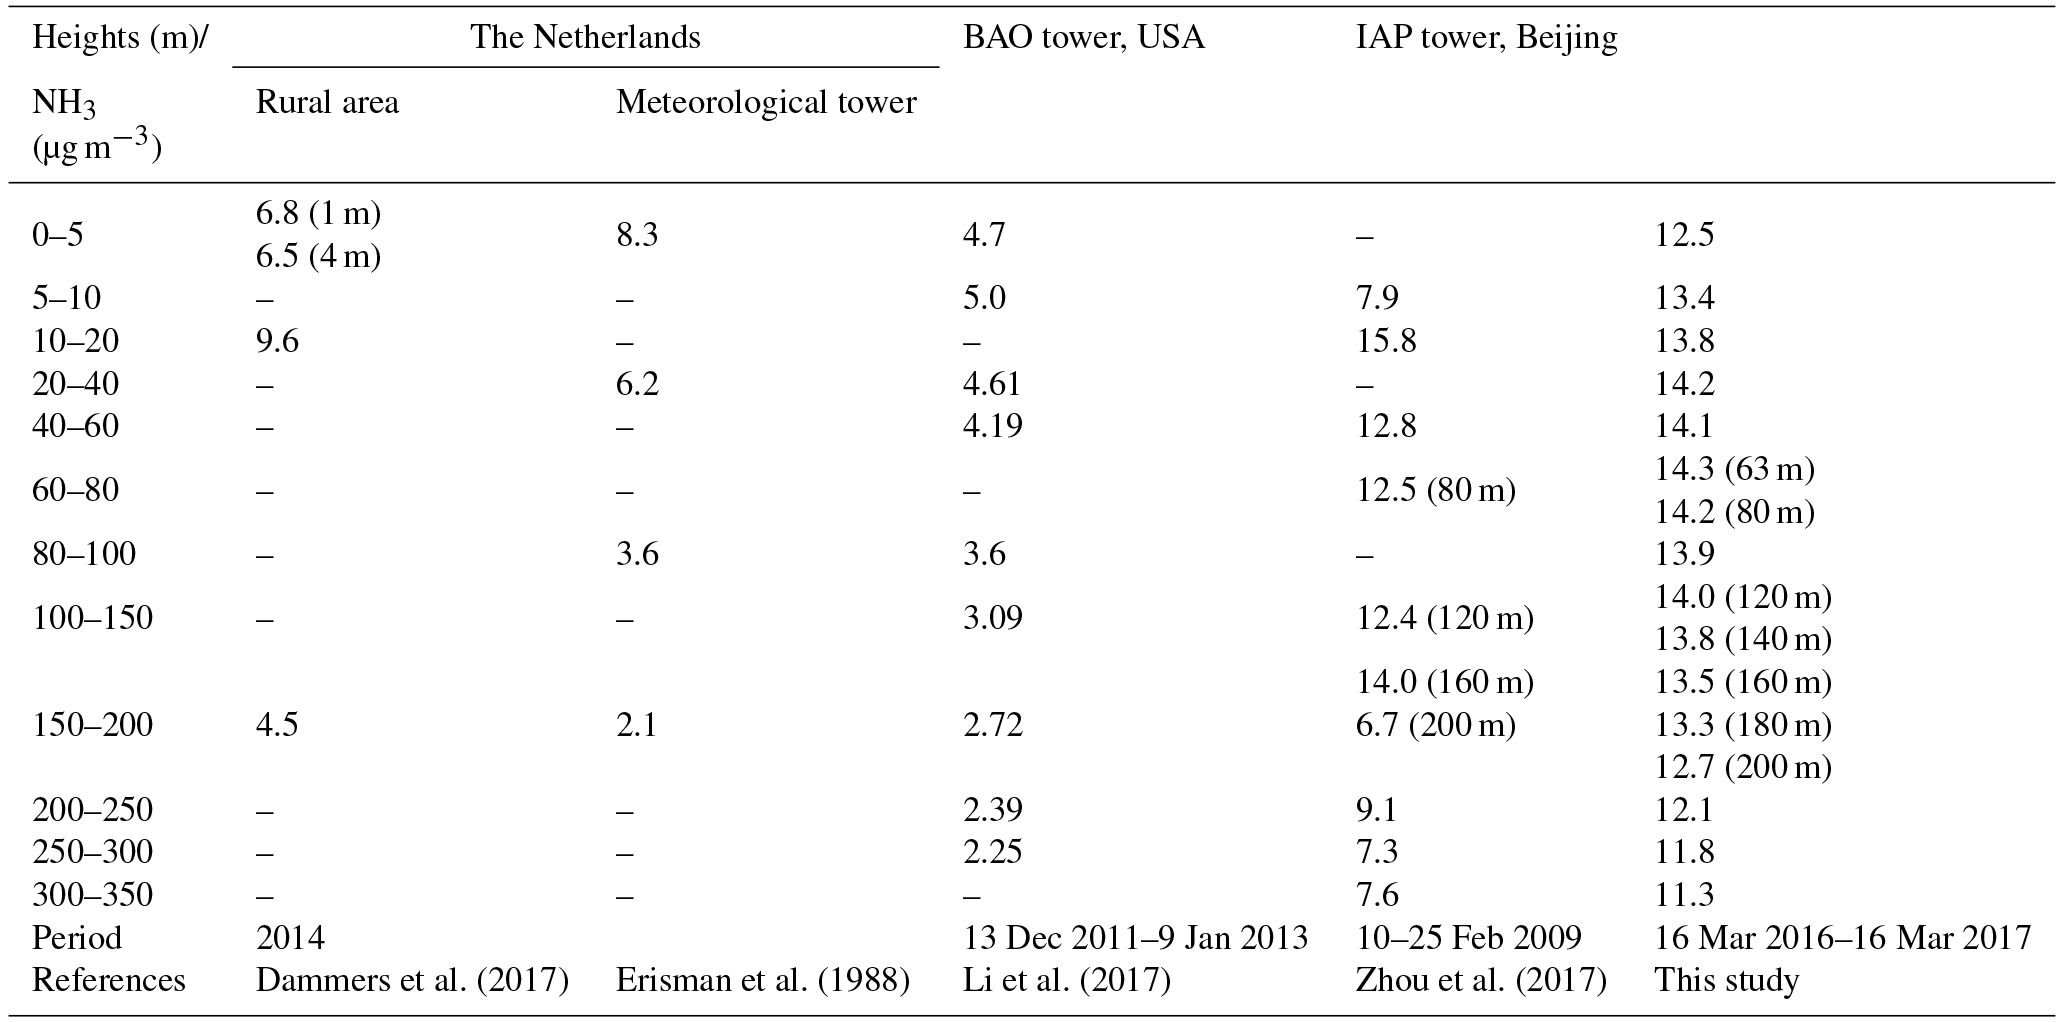
Table 1Overview of measured vertical NH3 concentrations (µg m−3) in previous studies and in this study.
4.1 Vertical NH3 concentration profiles
The North China Plain is a well-known “hotspot” for NH3 emissions due to the rapid development of industrialization, urbanization and intensive agriculture (Kang et al., 2016; Y. Zhang et al., 2010). In our study, high atmospheric NH3 concentrations (13.3±4.8 µg m−3) were found up to 320 m a.g.l. in urban Beijing (16 March 2016–16 March 2017), and were much higher than the average annual NH3 concentration (3.3±1.4 µg m−3) observed across a vertical profile at the 300 m rural BAO tower, USA (Li et al., 2017). Some studies of NH3 vertical distribution found that the NH3 concentration decreased significantly with height. For example, Tevlin et al. (2017) reported an overall increase in summertime NH3 mixing ratios toward the surface of 6.7 ppb or 5.1 µg m−3 (89 %) during the day and 3.9 ppb or 3.0 µg m−3 (141 %) at night. In the BAO tower study (Li et al., 2017), which also measured concentrations using passive (Radiello) samplers deployed for 1- to 2-week sample periods, the concentration profiles showed a similar overall vertical distribution: the minimum NH3 concentration was observed at the top of the tower, it slowly increased towards a peak concentration at ∼10 m, and a sharp reduction was then seen near the surface. By contrast, our results showed much smaller decreases in NH3 concentrations in the upper air in urban Beijing (Table 1), with only a 1.18 µg m−3 (9.5 %) average decrease from the surface to the top of the tower (Fig. 3i). The flatter shape of the Beijing vertical profile may reflect a combination of strong local (e.g., vehicle) and regional (e.g., industrial and agricultural emissions) sources (Figs. 2 and 6) in our study, the fact that deep mixing layers regularly enveloped the full height of the tower within the surface boundary layer so that all sources influencing the tower measurements were vertically well mixed (Fig. S2), and/or the averaging of more distinct profiles over the week-long sample periods. In contrast to the “rural” boundary layer above the fields surrounding the BAO tower, the mixing in the Beijing urban area could be greatly enhanced by larger surface roughness (e.g., the average urban building height is ∼50 m) and surface heating (Baklanov and Kuchin, 2004). Higher time resolution vertical profile measurements are needed in the future to untangle the influence of these potential factors.
Distinct seasonal variations in NH3 concentrations were found (Fig. 2), which were statistically most strongly associated with temperature rather than relative humidity or wind speed (Fig. S4). High temperatures enhance NH3 emissions from soil, applied fertilizers, animal waste, vertical mixing and increase volatilization of NH3 from NH4NO3 particulate matter (Bari et al., 2003; Ianniello et al., 2010; Li et al., 2014; Lin et al., 2006; Meng et al., 2011; Plessow et al., 2005; Walker et al., 2004; Zbieranowski and Aherne, 2012). While high (low) mixed-layer heights in spring and summer (autumn and winter) could dilute (concentrate) NH3 in the surface boundary layer (Fig. S3), average NH3 concentrations across the profile were actually high in summer/spring and low in winter/autumn, consistent with the strong temperature-driven seasonal variation of the NH3 concentration and the greater NH4NO3 particle formation during cold periods in autumn and winter. Conducting simultaneous measurements of fine particle composition at different heights in future studies would be valuable for more closely evaluating the influence of changes in phase-partitioning.
Li et al. (2017) found a vertical difference of approximately 75 % from the concentration peak near the surface to the top of the BAO tower in winter (Fig. 3j), and attributed this strong vertical gradient to the occurrence of low level temperature inversions which trapped emissions closer to the surface during this period. During our study in Beijing, the vertical gradient was only 28 % in winter (maximum concentration found at 32 m), consistent with a deeper average boundary layer. However, inversions did limit the vertical mixing of NH3 during some periods in Beijing. Examination of the thermal inversion layer probability at 06:00 and 15:00 LT (Fig. S7b and c) revealed that T inversions (0.22±0.26 ∘C) frequently occurred between 102 and 160 m. Consequently, persistent higher NH3 concentrations begin at a lower altitude (Fig. S7a) as also observed by Tevlin et al. (2017). Because the time resolution of our Beijing study was one sample per week, we could not catch the changes between the daytime and nighttime NH3 vertical mixing. Compared to NH3 monitoring in real time (Tevlin et al., 2017), weekly sampling smooths diurnal vertical distributions and makes it harder to identify the influence of local surface sources or sinks.
Surfaces can act either as sources or sinks of NH3, depending on the surface NH3 content, ambient NH3 concentrations, and local meteorology and surface type (Tevlin et al., 2017; L. Zhang et al., 2010 ). The maximum NH3 concentration occurrence at 2 m in Beijing and the concentration decrease with increased height may reflect an important surface source of NH3, although our limited time resolution makes such conclusions tentative. The influence of the evaporation of dew/precipitation may also be important. Some studies found that dew is both a significant nighttime reservoir/sink and strong morning source of NH3 (Wentworth et al., 2016; Teng et al., 2017).
4.2 Potential source analysis
Areas south of Beijing with high WPSCF values appear to be important NH3 source regions (Fig. 6), suggesting regional transport from high agricultural NH3 emission areas (e.g., Hebei, Henan, Shandong provinces) contributed significantly to atmospheric NH3 in the Beijing urban region. Consistently higher NH3 concentrations were observed during periods with winds from the southeast, south and southwest at all heights, especially in summer (Fig. S6). Although NH3 has a limited atmospheric lifetime with respect to dry deposition, concentrations in these agricultural NH3 source regions can be extremely high (Shen et al., 2011) while significant NH3 can be tied up in longer-lived ammonium nitrate particles that partially dissociate to release NH3 back to the gas phase in response to NH3 loss by dry deposition (Ianniello et al., 2011; Kang et al., 2016; Xu et al., 2017). The WPSCF (Fig. 6) and NH3 emissions distribution (Fig. 1a) both suggest the importance not only of regional transport from nearby areas, but also the potential for local emissions to play an important role in sustaining the high NH3 level in Beijing, e.g., vehicular traffic (Chang et al., 2016; Pan et al., 2018a). As discussed above, stagnant meteorological conditions with low WS and T inversions allow local emissions, such as those from urban traffic, to accumulate. Additionally, the topography of the mountains to the west and north of Beijing effectively traps polluted air over Beijing during southerly airflow, an effect reported in many Beijing particulate matter studies (Xia et al., 2016; Wu et al., 2009; Zhao et al., 2009).
Generally, NH3 source regions identified in the WPSCF analysis (Fig. 6) suggest that regional transport from the south exerts an important influence on Beijing NH3 concentrations throughout the year. The area south of Beijing (e.g., Hebei, Henan and Shandong provinces) is a hotspot of NH3 emission (Zhang et al., 2018), and half of NH3 emissions have been estimated to deposit as NH3 at urban sites in the North China Plain (Pan et al., 2018b). In addition, seasonal patterns of NH3 potential sources (Fig. 6) matched well with the seasonal surface NH3 concentrations in China (Zhang et al., 2018). In detail, NH3 concentrations were typically highest in summer, and south winds produced higher NH3 concentrations than other wind directions (Fig. S6). Spring and summer had a similar wind direction distribution (Fig. S6) and wind speeds (Fig. S5), but corresponding NH3 concentrations were lower in spring. This may reflect decreased emissions in regions to the south during cooler spring temperatures and the increased partitioning of NH3 into fine particles during this cooler season. As shown above aerosol–gas partitioning strongly influences NH3 concentrations; high during warm periods, especially summer, favored greater NH3 gas concentrations due to the thermodynamic tendency for NH4NO3 to dissociate to NH3 and HNO3 at high temperatures. Although was low in winter, indicating that is the dominant NHx form in this cold season, winter NH3 concentrations across all heights still averaged 8.3±2.6 µg m−3, with a similar wind direction distribution as other seasons, except at high altitudes (i.e., 240 and 320 m; Fig. S6).
Our study is the first to continually monitor the vertical concentration profile of NH3 in urban Beijing. Weekly concentrations were measured for 1 year at 16 heights on the Beijing 325 m meteorological tower. The NH3 concentration averaged 13.3±4.8 µg m−3. The highest NH3 concentrations were always observed between heights of 32 and 63 m, decreasing toward the surface and toward higher altitudes.
NH3 concentrations at all heights increased during warmer periods, consistent with increased NH3 emissions under warm conditions and the tendency for semivolatile ammonium nitrate to release NH3 to the gas phase. An analysis of the relationship between NH3 concentrations and local wind direction showed a tendency for higher concentrations during transport from regions to the south of Beijing; this was consistent with findings from the WPSCF analysis which showed that important source areas were mainly located to the south of Beijing: an area comprised of large agricultural regions and high NH3 emissions in the North China Plain. Local NH3 sources, such as urban traffic emissions, may also help account for the elevated NH3 concentrations (>5 µg m−3) observed even in periods when transport mostly came from the low NH3 mountainous regions to Beijing's north/northwest.
High NH3 concentrations in urban Beijing, from the surface up to 320 m, the important role that NH3 plays in PM2.5 and haze formation, and the importance of regional transport of NH3 emissions from agricultural regions in neighboring provinces, suggest that future air quality improvement efforts should consider NH3 emission reductions and that the pollution controls should be jointly practiced at regional scales (e.g., the whole North China Plain) rather than only controlling local Beijing sources.
Data used in this study are available from the corresponding author upon request (liu310@cau.edu.cn).
The supplement related to this article is available online at: https://doi.org/10.5194/acp-18-16385-2018-supplement.
AT, YS and XL contributed to the conception and design of the experiments. YZ, DW and QW performed the experiments. YZ, AT, YS, XL, KB and JLCJ carried out the analysis of the data and wrote the paper. LZ, DL and YL discussed and offered the related supporting data for the paper.
The authors declare that they have no conflict of interest.
This work was supported by the State Key Research & Development Programme
(project nos. 2016YFC0207906, 2017YFC0210100, DQGG0208), the National Natural Science
Foundation of China (project nos. 41425007, 91744207) and the National Postdoctoral Program
for Innovative Talents (grant no. BX201600157).
Edited by: John Liggio
Reviewed by: two anonymous referees
Ashbaugh, L. L., Malm, W. C., and Sadeh, W. Z.: A residence time probability analysis of sulfur concentrations at Grand Canyon National Park, Atmos. Environ., 19, 1263–1270, https://doi.org/10.1016/0004-6981(85)90256-2, 1985.
Baklanov, A. and Kuchin, A.: The mixing height in urban areas: comparative study for Copenhagen, Atmos. Chem. Phys. Discuss., 4, 2839–2866, https://doi.org/10.5194/acpd-4-2839-2004, 2004.
Bari, A., Ferraro, V., Wilson, L. R., Luttinger, D., and Husain, L.: Measurements of gaseous HONO, HNO3, SO2, HCl, NH3, particulate sulfate and PM2.5 in New York, NY, Atmos. Environ., 37, 2825–2835, https://doi.org/10.1016/S1352-2310(03)00199-7, 2003.
Beijing Transport Institute: Annual report of Beijing traffic development in http://www.bjtrc.org.cn/JGJS.aspx?id=5.2&Menu=GZCG (last access: 14 November 2018), 2017.
Chang, Y., Liu, X., Deng, C., Dore, A. J., and Zhuang, G.: Source apportionment of atmospheric ammonia before, during, and after the 2014 APEC summit in Beijing using stable nitrogen isotope signatures, Atmos. Chem. Phys., 16, 11635–11647, https://doi.org/10.5194/acp-16-11635-2016, 2016.
Dammers, E., Schaap, M., Haaima, M., Palm, M., Kruit, R. W., Volten, H., Hensen, A., Swart, D., and Erisman, J.: Measuring atmospheric ammonia with remote sensing campaign: Part 1 – Characterisation of vertical ammonia concentration profile in the centre of The Netherlands, Atmos. Environ., 169, 97–112, https://doi.org/10.1016/j.atmosenv.2017.08.067, 2017.
EMEP Webdab emission data hosted by the Centre on Emission Inventories and Projections (CEIP): http://www.ceip.at, last access: 20 August 2018.
Erisman, J. W., Vermetten, A. W., Asman, W. A., Waijers-Ijpelaan, A., and Slanina, J.: Vertical distribution of gases and aerosols: the behaviour of ammonia and related components in the lower atmosphere, Atmos. Environ., 22, 1153–1160, https://doi.org/10.1016/0004-6981(88)90345-9, 1988.
Erisman, J. W., Sutton, M. A., Galloway, J., Klimont, Z., and Winiwarter, W.: How a century of ammonia synthesis changed the world, Nat. Geosci., 1, 636–639, https://doi.org/10.1038/ngeo325, 2008.
Fowler, D., Pilegaard, K., Sutton, M., Ambus, P., Raivonen, M., Duyzer, J., Simpson, D., Fagerli, H., Fuzzi, S., and Schjørring, J. K.: Atmospheric composition change: ecosystems–atmosphere interactions, Atmos. Environ., 43, 5193–5267, https://doi.org/10.1016/j.atmosenv.2009.07.068, 2009.
Fu, X., Wang, S., Xing, J., Zhang, X., Wang, T., and Hao, J.: Increasing Ammonia Concentrations Reduce the Effectiveness of Particle Pollution Control Achieved via SO2 and NOx Emissions Reduction in East China, Environ. Sci. Technol. Lett., 4, 221–227, https://doi.org/10.1021/acs.estlett.7b00143, 2017.
Galloway, J. N., Aber, J. D., Erisman, J. W., Seitzinger, S. P., Howarth, R. W., Cowling, E. B., and Cosby, B. J.: The nitrogen cascade, AIBS Bulletin, 53, 341–356, https://doi.org/10.1641/0006-3568(2003)053[0341:TNC]2.0.CO;2, 2003.
Gu, B., Ge, Y., Ren, Y., Xu, B., Luo, W., Jiang, H., Gu, B., and Chang, J.: Atmospheric reactive nitrogen in China: Sources, recent trends, and damage costs, Environ. Sci. Technol., 46, 9420–9427, https://doi.org/10.1021/es301446g, 2012.
Gu, B., Sutton, M. A., Chang, S. X., Ge, Y., and Chang, J.: Agricultural ammonia emissions contribute to China's urban air pollution, Front. Ecol. Environ., 12, 265–266, https://doi.org/10.1890/14.WB.007, 2014.
Guo, S., Hu, M., Zamora, M. L., Peng, J., Shang, D., Zheng, J., Du, Z., Wu, Z., Shao, M., and Zeng, L.: Elucidating severe urban haze formation in China, P. Natl. Acad. Sci. USA, 111, 17373–17378, https://doi.org/10.1073/pnas.1419604111, 2014.
Huang, R., Zhang, Y., Bozzetti, C., Ho, K., Cao, J., Han, Y., Daellenbach, K. R., Slowik, J. G., Platt, S. M., and Canonaco, F.: High secondary aerosol contribution to particulate pollution during haze events in China, Nature, 514, 218–222, https://doi.org/10.1038/nature13774, 2014.
Ianniello, A., Spataro, F., Esposito, G., Allegrini, I., Rantica, E., Ancora, M., Hu, M., and Zhu, T.: Occurrence of gas phase ammonia in the area of Beijing (China), Atmos. Chem. Phys., 10, 9487–9503, https://doi.org/10.5194/acp-10-9487-2010, 2010.
Ianniello, A., Spataro, F., Esposito, G., Allegrini, I., Hu, M., and Zhu, T.: Chemical characteristics of inorganic ammonium salts in PM2.5 in the atmosphere of Beijing (China), Atmos. Chem. Phys., 11, 10803–10822, https://doi.org/10.5194/acp-11-10803-2011, 2011.
Kang, Y., Liu, M., Song, Y., Huang, X., Yao, H., Cai, X., Zhang, H., Kang, L., Liu, X., and Yan, X.: High-resolution ammonia emissions inventories in China from 1980 to 2012, Atmos. Chem. Phys., 16, 2043–2058, https://doi.org/10.5194/acp-16-2043-2016, 2016.
Klimont, Z.: Current and Future Emissions of Ammonia in China, 10th annual emission inventory conference: one atmosphere, One inventory, many challenges, 1–3 May 2001, Denver, CO, 2001.
Lee, D., Dollard, G., Derwent, R., and Pepler, S.: Observations on gaseous and aerosols components of the atmosphere and their relationships, Water Air Soil Pollut., 113, 175–202, https://doi.org/10.1023/A:1005024410887, 1999.
Li, P., Yan, R., Yu, S., Wang, S., Liu, W., and Bao, H.: Reinstate regional transport of PM2.5 as a major cause of severe haze in Beijing, P. Natl. Acad. Sci. USA, 112, E2739–E2740, https://doi.org/10.1073/pnas.1502596112, 2015.
Li, Y., Schwandner, F. M., Sewell, H. J., Zivkovich, A., Tigges, M., Raja, S., Holcomb, S., Molenar, J. V., Sherman, L., and Archuleta, C.: Observations of ammonia, nitric acid, and fine particles in a rural gas production region, Atmos. Environ., 83, 80–89, https://doi.org/10.1016/j.atmosenv.2013.10.007, 2014.
Li, Y., Thompson, T. M., Damme, M. V., Chen, X., Benedict, K. B., Shao, Y., Day, D., Boris, A., Sullivan, A. P., and Ham, J.: Temporal and spatial variability of ammonia in urban and agricultural regions of northern Colorado, United States, Atmos. Chem. Phys., 17, 6197–6213, https://doi.org/10.5194/acp-17-6197-2017, 2017.
Lin, Y., Cheng, M., Ting, W., and Yeh, C.: Characteristics of gaseous HNO2, HNO3, NH3 and particulate ammonium nitrate in an urban city of Central Taiwan, Atmos. Environ., 40, 4725–4733, https://doi.org/10.1016/j.atmosenv.2006.04.037, 2006.
Liu, X., Zhang, Y., Han, W., Tang, A., Shen, J., Cui, Z., Vitousek, P., Erisman, J. W., Goulding K., Christie, P., Fangmeier, A., and Zhang, F.: Enhanced nitrogen deposition over China, Nature, 494, 459–462, https://doi.org/10.1038/nature11917, 2013.
Meng, Z., Lin, W., Jiang, X., Yan, P., Wang, Y., Zhang, Y., Jia, X., and Yu, X.: Characteristics of atmospheric ammonia over Beijing, China, Atmos. Chem. Phys. , 11, 6139–6151, https://doi.org/10.5194/acp-11-6139-2011, 2011.
Öztürk, F., Bahreini, R., Wagner, N., Dubé, W., Young, C., Brown, S., Brock, C., Ulbrich, I., Jimenez, J., and Cooper, O.: Vertically resolved chemical characteristics and sources of submicron aerosols measured on a Tall Tower in a suburban area near Denver, Colorado in winter, J. Geophys. Res.-Atmos., 118, 13591–13605, https://doi.org/10.1002/2013JD019923, 2013.
Pan, Y., Tian, S., Liu, D., Fang, Y., Zhu, X., Gao, M., Gao, J., Michalski, G., and Wang, Y.: Isotopic evidence for enhanced fossil fuel sources of aerosol ammonium in the urban atmosphere, Environ. Pollut., 238, 942–947, https://doi.org/10.1016/j.envpol.2018.03.038, 2018a.
Pan, Y., Tian, S., Zhao, Y., Zhang, L., Zhu, X., Gao, J., Huang, W., Zhou, Y., Song, Y., and Zhang, Q.: Identifying ammonia hotspots in China using a national observation network, Environ. Sci. Technol., 52, 3926–3934, https://doi.org/10.1021/acs.est.7b05235, 2018b.
Plessow, K., Spindler, G., Zimmermann, F., and Matschullat, J.: Seasonal variations and interactions of N-containing gases and particles over a coniferous forest, Saxony, Germany, Atmos. Environ., 39, 6995–7007, https://doi.org/10.1016/j.atmosenv.2005.07.046, 2005.
Polissar, A., Hopke, P., Paatero, P., Kaufmann, Y., Hall, D., Bodhaine, B., Dutton, E., and Harris, J.: The aerosol at Barrow, Alaska: long-term trends and source locations, Atmos. Environ., 33, 2441–2458, https://doi.org/10.1016/S1352-2310(98)00423-3, 1999.
Quan, J., Gao, Y., Zhang, Q., Tie, X., Cao, J., Han, S., Meng, J., Chen, P., and Zhao, D.: Evolution of planetary boundary layer under different weather conditions, and its impact on aerosol concentrations, Particuology, 11, 34–40, https://doi.org/10.1016/j.partic.2012.04.005, 2013.
Reis, S., Pinder, R., Zhang, M., Lijie, G., and Sutton, M.: Reactive nitrogen in atmospheric emission inventories, Atmos. Chem. Phys., 9, 7657–7677, https://doi.org/10.5194/acp-9-7657-2009, 2009.
Riedel, T. P., Wagner, N. L., Dubé, W. P., Middlebrook, A. M., Young, C. J., Öztürk, F., Bahreini, R., VandenBoer, T. C., Wolfe, D. E., and Williams, E. J.: Chlorine activation within urban or power plant plumes: Vertically resolved ClNO2 and Cl2 measurements from a tall tower in a polluted continental setting, J. Geophys. Res.-Atmos., 118, 8702–8715, https://doi.org/10.1002/jgrd.50637, 2013.
Shen, J., Liu, X., Zhang, Y., Fangmeier, A., Goulding, K., and Zhang, F.: Atmospheric ammonia and particulate ammonium from agricultural sources in the North China Plain, Atmos. Environ., 45, 5033–5041, https://doi.org/10.1016/j.atmosenv.2011.02.031, 2011.
Shephard, M. and Cady-Pereira, K.: Cross-track Infrared Sounder (CrIS) satellite observations of tropospheric ammonia, Atmos. Meas. Tech., 8, 1323–1336, https://doi.org/10.5194/amt-8-1323-2015, 2015.
Sun, K., Tao, L., Miller, D. J., Zondlo, M. A., Shonkwiler, K. B., Nash, C., and Ham, J. M.: Open-path eddy covariance measurements of ammonia fluxes from a beef cattle feedlot, Agr. Forest Meteorol., 213, 193–202, https://doi.org/10.1016/j.agrformet.2015.06.007, 2015.
Sun, K., Tao, L., Miller, D. J., Pan, D., Golston, L. M., Zondlo, M. A., Griffin, R. J., Wallace, H. W., Leong, Y. J., and Yang, M. M.: Vehicle emissions as an important urban ammonia source in the United States and China, Environ. Sci. Technol., 51, 2472–2481, https://doi.org/10.1021/acs.est.6b02805, 2017.
Sun, Y., Jiang, Q., Wang, Z., Fu, P., Li, J., Yang, T., and Yin, Y.: Investigation of the sources and evolution processes of severe haze pollution in Beijing in January 2013, J. Geophys. Res.-Atmos., 119, 4380–4398, https://doi.org/10.1002/2014JD021641, 2014.
Sun, Y., Du, W., Fu, P., Wang, Q., Li, J., Ge, X., Zhang, Q., Zhu, C., Ren, L., and Xu, W.: Primary and secondary aerosols in Beijing in winter: sources, variations and processes, Atmos. Chem. Phys., 16, 8309–8329, https://doi.org/10.5194/acp-16-8309-2016, 2016.
Sutton, M. A., Erisman, J. W., Dentener, F., and Möller, D.: Ammonia in the environment: from ancient times to the present, Environ. Pollut., 156, 583–604, https://doi.org/10.1016/j.envpol.2008.03.013, 2008.
Tang, G., Zhu, X., Hu, B., Xin, J., Wang, L., Münkel, C., Mao, G., and Wang, Y.: Impact of emission controls on air quality in Beijing during APEC 2014: lidar ceilometer observations, Atmos. Chem. Phys., 15, 12667–12680, https://doi.org/10.5194/acp-15-12667-2015, 2015.
Tang, Y. S., Cape, J. N., and Sutton, M. A.: Development and types of passive samplers for monitoring atmospheric NO2 and NH3 concentrations, Scient. World J., 1, 513–529, https://doi.org/10.1100/tsw.2001.82, 2014.
Teng, X., Hu, Q., Zhang, L., Qi, J., Shi, J., Xie, H., Gao, H., and Yao, X.: Identification of major sources of atmospheric NH3 in an urban environment in northern China during wintertime, Environ. Sci. Technol., 51, 6839–6848, https://doi.org/10.1021/acs.est.7b00328, 2017.
Tevlin, A., Li, Y., Collett, J., McDuffie, E., Fischer, E., and Murphy, J.: Tall tower vertical profiles and diurnal trends of ammonia in the Colorado Front Range, J. Geophys. Res.-Atmos., 122, 12468–12487, https://doi.org/10.1002/2017JD026534, 2017.
USEPA: Air Pollutant Emissions Trends Data, https://www.epa.gov/air-emissions-inventories/air-pollutant-emissions-trends-data, last access: 15 October 2018.
Van Damme, M., Clarisse, L., Dammers, E., Liu, X., Nowak, J., Clerbaux, C., Flechard, C., Galy-Lacaux, C., Xu, W., and Neuman, J.: Towards validation of ammonia (NH3) measurements from the IASI satellite, Atmos. Meas. Tech., 8, 1575–1591, https://doi.org/10.5194/amt-8-1575-2015, 2015.
VandenBoer, T. C., Brown, S. S., Murphy, J. G., Keene, W. C., Young, C. J., Pszenny, A., Kim, S., Warneke, C., Gouw, J. A., and Maben, J. R.: Understanding the role of the ground surface in HONO vertical structure: High resolution vertical profiles during NACHTT-11, J. Geophys. Res.-Atmos., 118, 10155–10171, https://doi.org/10.1002/jgrd.50721, 2013.
Vogt, E., Held, A., and Klemm, O.: Sources and concentrations of gaseous and particulate reduced nitrogen in the city of Münster (Germany), Atmos. Environ., 39, 7393–7402, https://doi.org/10.1016/j.atmosenv.2005.09.012, 2005.
Walker, J., Whitall, D. R., Robarge, W., and Paerl, H. W.: Ambient ammonia and ammonium aerosol across a region of variable ammonia emission density, Atmos. Environ., 38, 1235–1246, https://doi.org/10.1016/j.atmosenv.2003.11.027, 2004.
Wang, S., Xing, J., Jang, C., Zhu, Y., Fu, J. S., and Hao, J.: Impact assessment of ammonia emissions on inorganic aerosols in East China using response surface modeling technique, Environ. Sci. Technol., 45, 9293–9300, https://doi.org/10.1021/es2022347, 2011.
Wang, S., Nan, J., Shi, C., Fu, Q., Gao, S., Wang, D., Cui, H., Saiz-Lopez, A., and Zhou, B.: Atmospheric ammonia and its impacts on regional air quality over the megacity of Shanghai, China, Sci. Rep., 5, 15842, https://doi.org/10.1038/srep15842, 2015.
Wang, Y.: MeteoInfo: GIS software for meteorological data visualization and analysis, Meteorol. Appl., 21, 360–368, https://doi.org/10.1002/met.1345, 2014.
Wentworth, G. R., Murphy, J. G., Benedict, K. B., Bangs, E. J., and Collett Jr., J. L.: The role of dew as a night-time reservoir and morning source for atmospheric ammonia, Atmos. Chem. Phys., 16, 7435–7449, https://doi.org/10.5194/acp-16-7435-2016, 2016.
Wiegner, M., Emeis, S., Freudenthaler, V., Heese, B., Junkermann, W., Münkel, C., Schäfer, K., Seefeldner, M., and Vogt, S.: Mixing layer height over Munich, Germany: Variability and comparisons of different methodologies, J. Geophys. Res.-Atmos., 111, D13201, https://doi.org/10.1029/2005JD006593, 2006.
Wu, Y., Gu, B., Erisman, J. W., Reis, S., Fang, Y., Lu, X., and Zhang, X.: PM2.5 pollution is substantially affected by ammonia emissions in China, Environ. Pollut., 218, 86–94, https://doi.org/10.1016/j.envpol.2016.08.027, 2016.
Wu, Z., Hu, M., Shao, K., and Slanina, J.: Acidic gases, NH3 and secondary inorganic ions in PM10 during summertime in Beijing, China and their relation to air mass history, Chemosphere, 76, 1028–1035, https://doi.org/10.1016/j.chemosphere.2009.04.066, 2009.
Xia, Y., Zhao, Y., and Nielsen, C. P.: Benefits of China's efforts in gaseous pollutant control indicated by the bottom-up emissions and satellite observations 2000–2014, Atmos. Environ., 136, 43–53, https://doi.org/10.1016/j.atmosenv.2016.04.013, 2016.
Xu, W., Luo, X., Pan, Y. , Zhang, L., Tang, A., Shen, J., Zhang, Y., Li, K., Wu, Q., Yang, D., Zhang, Y., Xue, J., Li, W., Li, Q., Tang, L., Lu, S., Liang, T., Tong, Y., Liu, P., Zhang, Q., Xiong, Z., Shi, X., Wu, L., Shi, W., Tian, K., Zhong, X., Shi, K., Tang, Q., Zhang, L., Huang, J., He, C., Kuang, F., Zhu, B., Liu, H., Jin, X., Xin, Y., Shi, X., Du, E., Dore, A. J., Tang, S., Collett Jr., J. L., Goulding, K., Sun, Y., Ren, J., Zhang, F., and Liu, X.: Quantifying atmospheric nitrogen deposition through a nationwide monitoring network across China, Atmos. Chem. Phys., 15, 12345–12360, https://doi.org/10.5194/acp-15-12345-2015, 2015.
Xu, W., Song, W., Zhang, Y., Liu, X., Zhang, L., Zhao, Y., Liu, D., Tang, A., Yang, D., Wang, D., Wen, Z., Pan, Y., Fowler, D., Collett Jr., J. L., Erisman, J. W., Goulding, K., Li, Y., and Zhang, F.: Air quality improvement in a megacity: implications from 2015 Beijing Parade Blue pollution control actions, Atmos. Chem. Phys., 17, 31–46, https://doi.org/10.5194/acp-17-31-2017, 2017.
Yamamoto, N., Kabeya, N., Onodera, M., Takahahi, S., Komori, Y., Nakazuka, E., and Shirai, T.: Seasonal variation of atmospheric ammonia and particulate ammonium concentrations in the urban atmosphere of Yokohama over a 5-year period, Atmos. Environ., 22, 2621–2623, https://doi.org/10.1016/0004-6981(88)90498-2, 1988.
Yamamoto, N., Nishiura, H., Honjo, T., Ishikawa, Y., and Suzuki, K.: A long-term study of atmospheric ammonia and particulate ammonium concentrations in Yokohama, Japan, Atmos. Environ., 29, 97–103, https://doi.org/10.1016/1352-2310(94)00226-B, 1995.
Yang, F., Tan, J., Zhao, Q., Du, Z., He, K., Ma, Y., Duan, F., Chen, G., and Zhao, Q.: Characteristics of PM2.5 speciation in representative megacities and across China, Atmos. Chem. Phys., 11, 5207–5219, https://doi.org/10.5194/acp-11-5207-2011, 2011.
Ye, X., Ma, Z., Zhang, J., Du, H., Chen, J., Chen, H., Yang, X., Gao, W., and Geng, F.: Important role of ammonia on haze formation in Shanghai, Environ. Res. Lett., 6, 024019, https://doi.org/10.1088/1748-9326/6/2/024019, 2011.
Zbieranowski, A. L. and Aherne, J.: Spatial and temporal concentration of ambient atmospheric ammonia in southern Ontario, Canada, Atmos. Environ., 62, 441–450, https://doi.org/10.1016/j.atmosenv.2012.08.041, 2012.
Zhang, L., Wright, L., and Asman, W.: Bi-directional air-surface exchange of atmospheric ammonia: A review of measurements and a development of a big-leaf model for applications in regional-scale air-quality models, J. Geophys. Res.-Atmos., 115, D20310, https://doi.org/10.1029/2009JD013589, 2010.
Zhang, L., Chen, Y., Zhao, Y., Henze, D. K., Zhu, L., Song, Y., Paulot, F., Liu, X., Pan, Y., and Lin, Y.: Agricultural ammonia emissions in China: reconciling bottom-up and top-down estimates, Atmos. Chem. Phys., 18, 339–355, https://doi.org/10.5194/acp-18-339-2018, 2018.
Zhang, Q., Streets, D. G., Carmichael, G. R., He, K., Huo, H., Kannari, A., Klimont, Z., Park, I. S., Reddy, S., Fu, J., Chen, D., Duan, L., Lei, Y., Wang, L., and Yao, Z.: Asian emissions in 2006 for the NASA INTEX-B mission, Atmos. Chem. Phys., 9, 5131–5153, https://doi.org/10.5194/acp-9-5131-2009, 2009.
Zhang, X., Wu, Y., Liu, X., Reis, S., Jin, J., Dragosits, U., Damme, M. V., Clarisse, L., Whitburn, S., Coheur, P. F., and Gu, B.: Ammonia emissions may be substantially underestimated in China, Environ. Sci. Technol., 51, 12089–12096, https://doi.org/10.1021/acs.est.7b02171, 2017.
Zhang, Y., Dore, A. J., Ma, L., Liu, X., Ma, W., Cape, J. N., and Zhang, F.: Agricultural ammonia emissions inventory and spatial distribution in the North China Plain, Environ. Pollut., 158, 490–501, https://doi.org/10.1016/j.envpol.2009.08.033, 2010.
Zhao, D. and Wang, A.: Estimation of anthropogenic ammonia emissions in Asia, Atmos. Environ., 28, 689–694, https://doi.org/10.1016/1352-2310(94)90045-0, 1994.
Zhao, X., Zhang, X., Xu, X., Xu, J., Meng, W., and Pu, W.: Seasonal and diurnal variations of ambient PM2.5 concentration in urban and rural environments in Beijing, Atmos. Environ., 43, 2893–2900, https://doi.org/10.1016/j.atmosenv.2009.03.009, 2009.
Zheng, G., Duan, F., Su, H., Ma, Y., Cheng, Y., Zheng, B., Zhang, Q., Huang, T., Kimoto, T., Chang, D., Pöschl, U., Cheng, Y., and He, K.: Exploring the severe winter haze in Beijing: the impact of synoptic weather, regional transport and heterogeneous reactions, Atmos. Chem. Phys., 15, 2969–2983, https://doi.org/10.5194/acp-15-2969-2015, 2015.
Zhou, Y., Zhu, X., Pan, Y., Tian, S., Liu, Q., Sun, Y., An, J., and Wang, Y.: Vertical distribution of gaseous pollutants in the lower atmospheric boundary layer in urban Beijing, Environ. Chem., 36, 1752–1759, 2017.