the Creative Commons Attribution 4.0 License.
the Creative Commons Attribution 4.0 License.
 | 15 Nov 2018
An important mechanism of regional O3 transport for summer smog over the Yangtze River Delta in eastern China
Yichen Li
Tianliang Zhao
Xiao-Ming Hu
Duanyang Liu
Yongcheng Jiang
Jianming Xu
Luyu Chang
Severe ozone (O3) pollution episodes plague a few regions in eastern China at certain times of the year, e.g., the Yangtze River Delta (YRD). However, the formation mechanisms, including meteorological factors, contributing to these severe pollution events remain elusive. A severe summer smog stretched over the YRD region from 22 to 25 August 2016. This event displayed hourly surface O3 concentrations that exceeded 300 µg m−3 on 25 August in Nanjing, an urban area in the western YRD. The weather pattern during this period was characterized by near-surface prevailing easterly winds and continuous high air temperatures. The formation mechanism responsible for this O3 pollution episode over the YRD region, particularly the extreme values over the western YRD, was investigated using observation data and by running simulations with the Weather Research and Forecasting model with Chemistry (WRF-Chem). The results showed that the extremely high surface O3 concentration in the western YRD area on 25 August was largely due to regional O3 transport in the nocturnal residual layer (RL) and the diurnal change in the atmospheric boundary layer. On 24 August, high O3 levels, with peak values of 220 µg m−3, occurred in the daytime mixing layer over the eastern YRD region. During nighttime from 24 to 25 August, a shallow stable boundary layer formed near the surface which decoupled the RL above it from the surface. Ozone in the decoupled RL remained quite constant, which resulted in an O3-rich “reservoir” forming in this layer. This reservoir persisted due to the absence of O3 consumption from nitrogen oxide (NO) titration or dry deposition during nighttime. The prevailing easterly winds in the lower troposphere governed the regional transport of this O3-rich air mass in the nocturnal RL from the eastern to the western YRD. As the regional O3 transport reached the RL over the western YRD, O3 concentrations in the RL accumulated and rose to 200 µg m−3 over the western Nanjing site during the sunrise hours on 25 August. The development of the daytime convective boundary layer after sunrise resulted in the disappearance of the RL, as the vertical mixing in the convective boundary layer uniformly redistributed O3 from the upper levels via the entrainment of O3-rich RL air down to the O3-poor air at the ground. This net downward transport flux reached up to 35 µg m−3 h−1, and contributed a considerable surface O3 accumulation, resulting in severe daytime O3 pollution during the summer smog event on 25 August in the western YRD region. The mechanism of regional O3 transport through the nocturnal RL revealed in this study has great implications regarding understanding O3 pollution and air quality change.
- Article
(5516 KB) - Full-text XML
- BibTeX
- EndNote


Tropospheric ozone (O3) is an important atmospheric component and influences climate change and air quality in different ways. According to the Intergovernmental Panel on Climate Change (Bréon et al., 2013), tropospheric O3 is one of the most important greenhouse gases affecting global warming. It is also a health hazard for sensitive individuals, reducing lung function and contributing to the exacerbation of asthma symptoms (Bell et al., 2006). Tropospheric O3 can also alter atmospheric chemistry because its photolysis in the presence of water vapor is the primary source of the hydroxyl radical (OH), which is responsible for the removal of many important trace gases. (Thompson, 1992; Logan et al., 1981).
The spatiotemporal variations of tropospheric O3 are substantial at global and regional scales. In addition to photochemical reactions associated with O3 precursor emissions and solar radiation, the atmospheric transport of O3 and its precursors, including horizontal transport (Wolff et al., 1977; Yienger et al., 2000; Wild and Akimoto, 2001; Lelieveld et al., 2002; Duncan et al., 2008; Liu et al., 2011; Zhu et al., 2017; Han et al., 2018) and vertical transport, e.g., exchange between stratosphere and troposphere (Hu et al., 2010; Jiang et al., 2015), plays an important role in determining the spatiotemporal distribution of this species in the troposphere.
Ambient O3 levels are strongly influenced by the diurnal variation of the atmospheric boundary layer (BL) structure. The daytime BL, also known as the convective boundary layer (CBL), is directly affected by the solar heating of the Earth's surface. In the major part of the CBL, known as the mixing layer (ML), air pollutant concentrations are almost uniformly distributed due to convective turbulent mixing. The nocturnal BL is often characterized by a stable layer (SL) near the surface and an overlying residual layer (RL). The SL develops due to radiative cooling after sunset. Above the SL, the remnants of the daytime ML form the RL, which initially constitutes uniformly mixed air pollutants remaining from the preceding day (Stull, 1988); O3 is one of these representative remnant air pollutants in the RL due to the lack of O3 consumption from NO titration and dry deposition during the night (Sillman, 1999; Xie et al., 2016).
Therefore, nocturnal O3 in the RL can exert an impact on the ambient O3 variation the following day (Aneja et al., 2000; Hu et al., 2012; Morris et al., 2010; Neu et al., 1994; Tong et al., 2011; Yorks et al., 2009; Hu et al., 2013; Klein et al., 2014). Locally, O3 from the RL can potentially contribute to the maximum surface O3 concentrations the following day and enhance surface O3 by as much as 10–30 ppb (Hu et al., 2012). A few studies (Zhang et al., 1998; Zhang and Rao, 1999) have investigated O3 episodes in the BL over the northeastern US based on measurements and 1-D model simulations. These studies suggested that O3 in the nocturnal RL can be transported to downwind areas by low-level jets over the eastern coast of the US. Lee et al. (2003) found that the daytime upslope flows transported O3 precursors up into the mountains, while the nocturnal downslope flow transported the O3-rich RL air mass downwards into the Phoenix Valley; therefore, it was concluded that the transport, distribution and storage of O3 are highly impacted by background meteorological conditions. Zhang et al. (2015) found that regional transport within the RL from surrounding urban areas led to a nighttime O3 peak on a mountaintop in eastern China. However, the regional transport of O3 in the RL with respect to air pollution is poorly understood, especially for plain regions.
In recent years, ambient O3 levels have increased over the Yangtze River Delta (YRD) in eastern China, with more frequent photochemical pollution events or summer smog from late May to July (Tang et al., 2013). From 1990 to 2013, the hourly O3 peaks varied from 140 to 167 ppbv (about 294–350 µg m−3) in the YRD region, from 160 to 180 ppbv (about 336–378 µg m−3) in the Beijing–Tianjin–Hebei area over the North China Plain and from 200 to 220 ppbv (about 420–462 µg m−3) in the Pearl River Delta in southern China (Wang et al., 2017). Coupled with the increases in nitrogen oxide (NOx) and volatile organic compound (VOC) emissions, O3 distribution in the lower troposphere is significantly influenced by winds, air temperature, cloud cover and downward shortwave radiation, which all affect the regional transport and chemical formation of O3 (An et al., 2015; Gao et al., 2016; Xu et al., 2008; Li et al., 2018). O3 levels have been found to increase at a rate of 4–5 ppb K−1 when temperatures are between 28 and 38 ∘C (Pu et al., 2017). The prevailing winds driving the transport of air pollutants from the YRD industrialized areas may also contribute to O3 enhancement (Tang et al., 2013). Heat waves with a maximum temperature of ≥32 ∘C for 3 consecutive days in the YRD, a region with a sunny and strong solar radiation environment, can significantly strengthen photochemical reactions and potentially lead to substantially elevated O3 in a warmer climate (Tie et al., 2009; Li et al., 2012; Wang et al., 2017; Xie et al., 2016; Pu et al., 2017). In addition, the ambient O3 level can be affected by the diurnal variation of the atmospheric BL structure over the YRD, with the nighttime stable BL height dropping to 200 m and the daytime BL height reaching up to about 1200 m (Chang et al., 2016). Therefore, it is important to understand the formation mechanisms of O3 pollution including the meteorological factors influencing O3 pollution for summer smog over the YRD region.
This study focused on the formation of O3 pollution during a summer smog episode observed over the YRD in August 2016. We aimed to explore the underlying mechanism of regional O3 transport over the YRD using observational data and WRF-Chem modeling simulations. The rest of this paper is organized as follows: Section 2 describes the observational data and the O3 pollution episode. Section 3 presents the WRF-Chem modeling methodology and validation. In Sect. 4, a O3 pollution formation mechanism is revealed involving regional O3 transport in the RL from the eastern to the western YRD. The conclusions are then summarized in Sect. 5.
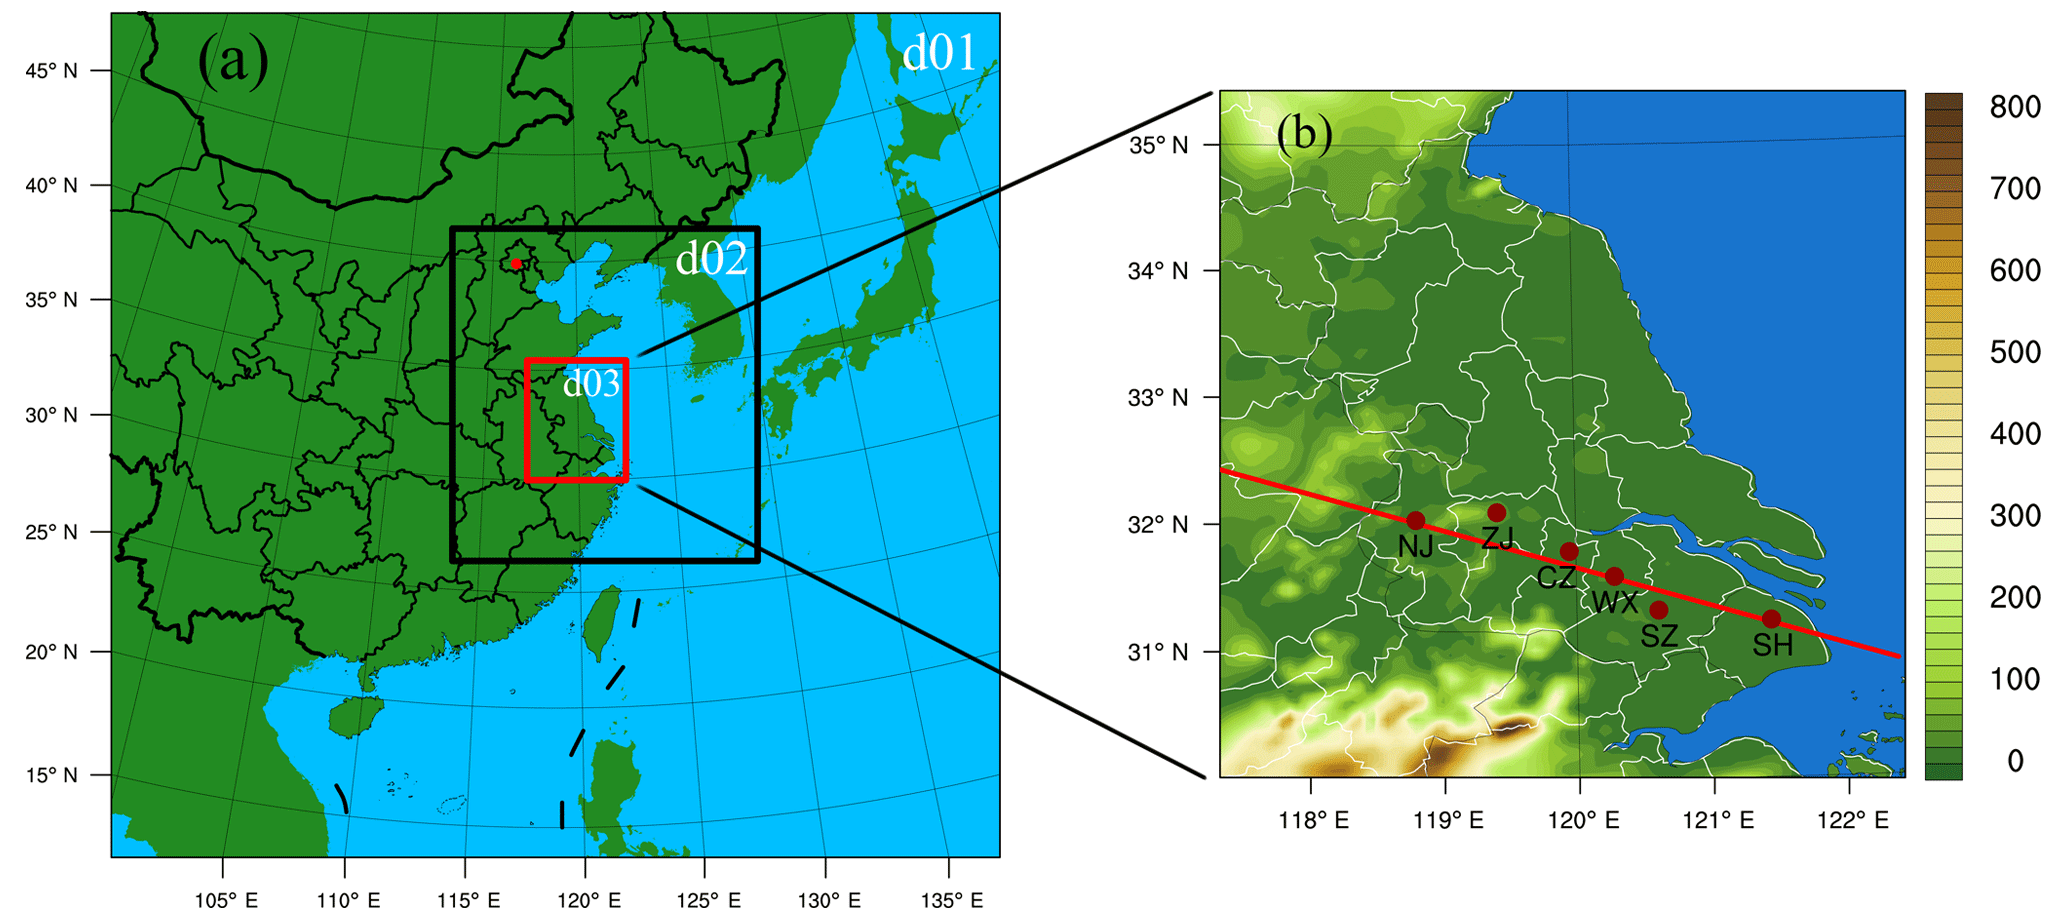
Figure 1(a) The three nesting domains for the WRF-Chem simulation, (b) the topography with respect to altitude (m) and the locations of the six observation sites over the YRD region in the innermost domain, d03.
2.1 Observation sites and data
Observation data from the YRD urban sites of Nanjing (NJ), Zhenjiang (ZJ), Changzhou (CZ), Wuxi (WX), Suzhou (SZ) and Shanghai (SH) (Fig. 1) were used to study O3 pollution during the August 2016 summer smog episode. The meteorological data were collected from the China Meteorological Administration (http://www.cma.gov.cn, last access: 11 November 2018), whereas the air quality monitoring data were sourced from Ministry of Ecology and Environment of China (http://www.mee.gov.cn, last access: 11 November 2018). The meteorological data included wind speed (m s−1) and direction (∘) at 10 m above ground level, air temperature (∘C) and relative humidity (%) at 2 m above ground level with a temporal resolution of 3 h, and total radiation irradiance with a time resolution of 1 h. The air quality monitoring data included O3 and NO2 concentrations with a temporal resolution of 1 h. The air pollutant concentrations were averaged from measurements from multiple sites for each city, whereas the meteorological variables were only from one site for each city.
2.2 Summer smog in a heat wave episode over the YRD
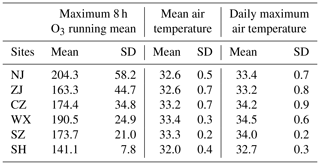
With the western Pacific subtropical high being located over the YRD area, heat wave events with high surface air temperature always occur over this region in summer. The average daily temperature and daily maximum temperature in the YRD were 27.1 and 39.5 ∘C, respectively, in summer during the 2013–2016 period, whilst the average summer daily temperature was 28.5 ∘C in NJ. It is generally accepted that high O3 concentrations are accompanied by high air temperatures and strong photochemical reactions (Filleul et al., 2006; Pu et al., 2017; Seinfeld and Pandis, 1986). During the heat wave episode from 22 to 25 August 2016, a summer smog accompanied by severe O3 pollution occurred over the YRD region (Table 1); high surface O3 concentrations with average maximum 8 h running mean values from 141.1 to 204.3 µg m−3 were measured at all six urban sites (NJ, ZJ, CZ, WX, SZ and SH; Table 1). During this summer smog episode, on mostly sunny days controlled by the westward stretching subtropical anticyclone of the Western Pacific, the daily maximum air temperature ranged from 32.8 to 34.0 ∘C over the YRD region, and the mean air temperature during the periods of the maximum 8 h running mean surface O3 concentrations exceeded 32.0 ∘C. It is worth noting that the O3 concentrations over the western YRD (NJ site) were 10–63 µg m−3 higher than those averaged over the eastern YRD region (CZ, WX, SZ and SH sites) during this period.
Table 1Averages (mean) of maximum 8 h running mean surface O3 concentrations (µg m−3), mean air temperature (∘C) over the periods of maximum 8 h running mean surface O3 concentrations and daily maximum air temperature (∘C) with their standard deviations (SD) over the 22–25 August 2016 period observed at the NJ site in the western YRD.
2.3 A potential role of regional O3 transport
Surface air temperature and solar radiation deeply affect photochemical production. Therefore, high O3 concentrations are generally associated with high air temperatures (Rao et al., 1992; Council, 1991). The hourly maximum O3 concentrations at the NJ site were 256.8 and 317.2 µg m−3 at 16:00 on 24 August and 15:00 on 25 August (all times mentioned in this paper are local times), respectively, with a lag of a few hours being observed between the time of maximum total radiation irradiances and maximum air temperature and the maximum O3 concentrations (Fig. 2). However, we found from the observation of this particular summer smog episode that the air temperature and the O3 levels exhibited opposite overall changes in the western YRD area from 24 to 25 August (Fig. 2 and Table 2). The maximum 8 h running mean O3 concentrations and the maximum hourly O3 concentrations increased from 230.1 and 256.8 µg m−3 on 24 August to 284.8 and 317.2 µg m−3, on 25 August 2016, respectively, presenting an obvious daily O3 enhancement in the western YRD area. In contrast, the surface maximum total radiation irradiance and maximum air temperature decreased from 896 W m−2 and 34.1 ∘C to 872 W m−2 and 33.9 ∘C, respectively, during this 2-day period. This is noteworthy observational evidence, as the surface O3 concentrations in the ambient air increased while the daytime air temperature and total radiation irradiance decreased from 24 to 25 August in the western YRD area (Figs. 1b–2, Table 2); these results could be difficult to interpreted in relation to the photochemical production.
Table 2Meteorological and environmental elements observed at the NJ site in the western YRD from 24 to 25 August 2016 and their daily differences (δx).
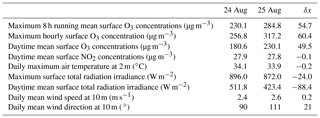
Both strong local photochemical production and atmospheric transport lead to high surface O3 concentrations (Jacob, 1999; Carnero et al., 2010; Corsmeier et al., 1997; Gangoiti et al., 2002; Godowitch et al., 2011; Tang et al., 2017; Shu et al., 2016). Based on the available observations of gaseous species, it is estimated that the daytime mean surface nitrogen dioxide (NO2) concentrations varied slightly during the 24–25 August period (Table 2), reflecting the lower impact from local photochemical production on the daily enhancement of O3. The near-surface 90 ∘ and 111 ∘ easterly winds prevailed with daily averaged wind speeds of 2.4 and 2.6 m s−1 on 24 and 25 August, respectively, at NJ (Table 2); this indicated fewer changes in both wind speed and direction over NJ during these 2 days. Excluding the impact of photochemical production and the changes in horizontal winds, the potential role of regional O3 transport in association with vertical exchange over the YRD becomes an important mechanism in ambient O3 pollution for summer smog in the western YRD on 25 August 2016. This is explored using a modeling study in the following sections.
3.1 Simulation settings
To investigate regional O3 transport over the YRD and the underlying mechanism involved, the Weather Research and Forecasting model with Chemistry (WRF-Chem) version 3.8.1 (Grell et al., 2005) was employed in this study. Three nested domains with respective horizontal resolutions of 45, 15 and 5 km cover East Asia, eastern China and the YRD region (Fig. 1) with 32 vertical layers extending from the surface to 100 hPa. The simulation period spans from 21 to 25 August 2016 with 1-hourly model outputs, and the spin-up time is the first 24 h. The physical parameterizations include the Noah land surface model (Tewari et al., 2004), the Mesoscale Model (MM5) similarity surface layer, the Yonsei University (YSU) boundary layer scheme (Hong et al., 2006), the Rapid Radiative Transfer Model (RRTM) longwave scheme (Mlawer et al., 1997), the Goddard shortwave scheme (Chou et al., 1998), the Morrison double-moment microphysics scheme (Morrison et al., 2009) and the Kain–Fritsch cumulus parameterization (Kain, 2004). The gas-phase chemical mechanism is selected using the Regional Acid Deposition Model, version 2 (RADM2) (Chang et al., 1990; Stockwell et al., 1984) and includes 158 chemical reactions among 36 species. The NCEP Final Global Forecast System Operational Analysis (FNL) data are used to provide the initial and boundary conditions of the meteorological variables for the WRF-Chem simulation. The chemical initial and lateral boundary conditions are extracted from the global chemical transport Model for Ozone And Related Tracers (MOZART) (Emmons et al., 2010; Horowitz et al., 2003). The Multi-resolution Emission Inventory for China (MEIC) (http://www.meicmodel.org/, last access: 11 November 2018) from 2016 is applied for the anthropocentric pollutant emissions, and the biogenic emissions are generated by the Model of Emissions of Gas and Aerosols from Nature (MEGAN) (Guenther et al., 2006).
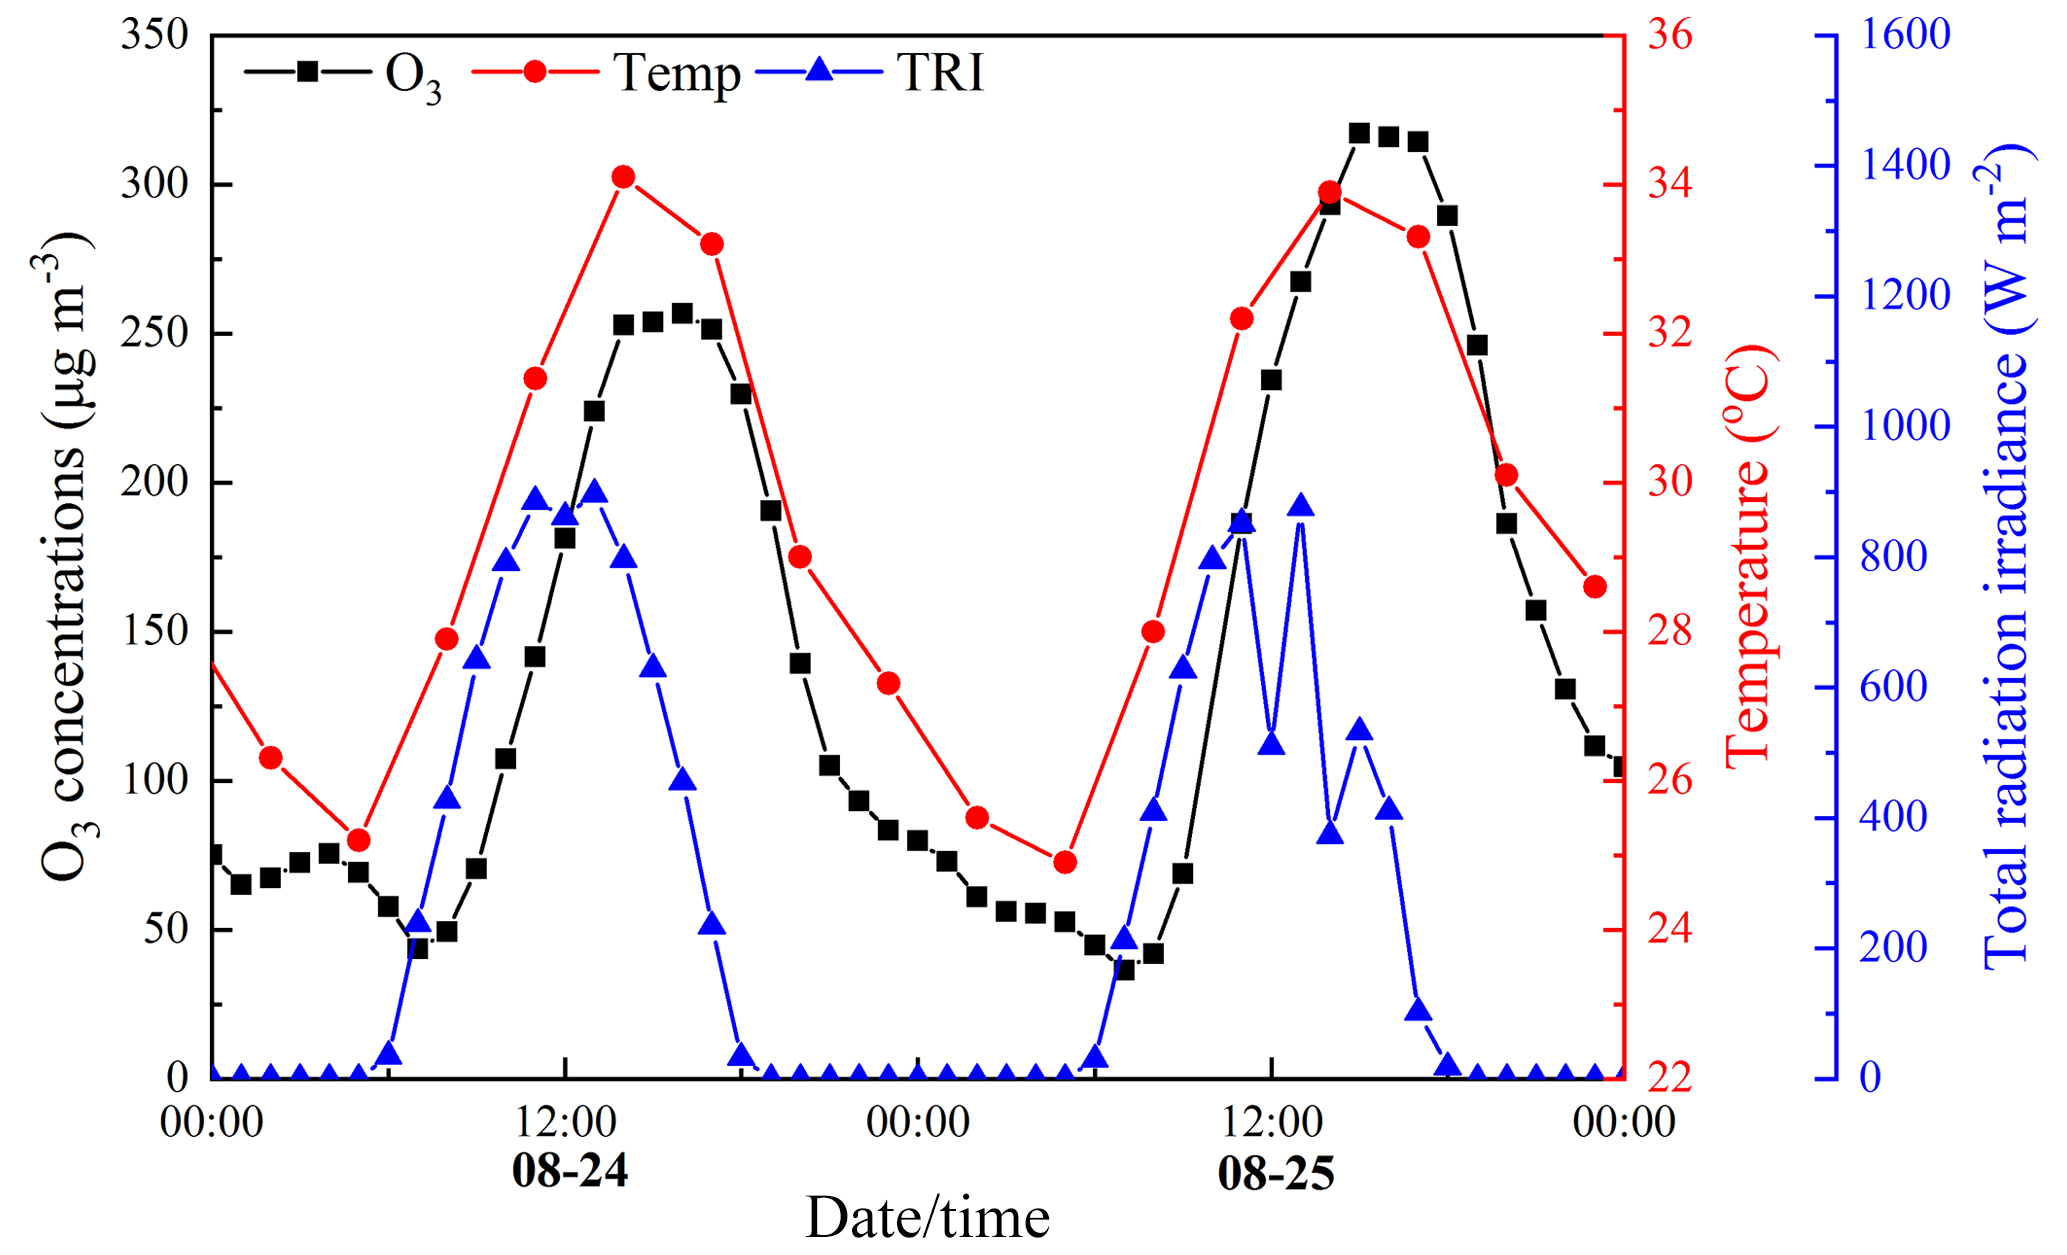
Figure 2Time series of surface O3 concentrations (O3), 2 m air temperature (Temp) and surface total radiation irradiance (TRI) observed at the NJ site.
3.2 Modeling validation
Simulated wind speed, air temperature, relative humidity and O3 concentrations are compared with the observations from six sites in the YRD (Fig. 1b) during the period from 22 to 25 August 2016 for the previously mentioned O3 pollution episode (Fig. 3). The correlation coefficients for the near-surface air temperature and relative humidity reach up to about 0.9, with only a slight overestimation of relative humidity. Over the NJ, CZ, WX, SZ and SH sites, the correlation coefficients between the observed and simulated wind speeds exceed 0.6. The high correlation coefficients between the observed and simulated O3 concentrations range between 0.8 and 0.9 with small standard deviations, and their normalized root-mean-square (NRMS) errors are lower than 0.6. All of the O3 and meteorological correlations between simulations and observations are significant at a 0.001 level (except for the wind speed over ZJ, which is significant at a 0.05 level). The validation of the vertical structures of O3 is very important in the analysis of the O3 budget; however, it was not possible for us to evaluate the vertical structure of O3 from the simulation. If there were observational data available for the O3 vertical profiles, the validation of the O3 vertical profiles could be carried out in a future study of the O3 budget. In general, the WRF-Chem simulated O3, air temperature, relative humidity and wind speed in the YRD show good agreement with the observations. The simulation also captures the observed changes of O3 and meteorology during the summer smog episode over the YRD reasonably well. Therefore, simulation data could be used to investigate the regional O3 transport and the underlying mechanism over the YRD during the summer smog period, as presented in the following sections.

Figure 3Modeling validations in Taylor plots displaying the standard deviations and correlation coefficients of the simulated and observed meteorological elements and surface O3 concentrations at the six YRD sites (Fig. 1). The azimuthal angle represents the correlation coefficient, the radial distance denotes the ratio of standard deviation between simulations and observations, and the semicircles centered at the “REF” marker represents the normalized root-mean-square (NRMS) error (Taylor, 2001).
4.1 O3 “reservoir” in the RL
In order to analyze the development and evolution of the O3 “reservoir” in the RL during the summer smog event, the time–altitude cross sections of the O3 concentrations and potential temperature over the western (NJ site) and eastern (CZ, WX, SZ and SH sites) YRD regions are chosen to present the temporal changes in the vertical structures of the O3 concentrations and atmospheric boundary layer from 24 to 25 August 2016 based on the WRF-Chem simulation (Fig. 4).
Figure 4a presents the hourly changes in the vertical O3 profiles from afternoon to midnight on 24 August over the eastern YRD region. On the afternoon of 24 August, especially around 16:00, surface O3 reached peak concentrations of about 220 µg m−3 in association with the maximum air temperature during the heat wave. The weak vertical gradients of potential temperature represented the well-developed mixing layer up to a height of about 1.5 km above the surface, which resulted in strong O3 vertical mixing over the eastern YRD area (Fig. 4a). After sunset on 24 August, the near-surface O3 concentrations decreased sharply in the absence of photochemical production, the near-surface O3 consumption from nitrogen oxide (NO) titration and dry deposition. This resulted in the formation of a typical O3-poor stable boundary layer and an overlying O3-rich “reservoir” in the nocturnal RL over the eastern YRD region (Fig. 4a).

Figure 4Time–altitude cross sections of O3 concentrations and potential temperature over (a) the eastern YRD area covering the CZ, WX, SZ and SH sites from 14:00 on 24 August to 00:00 on 25 August, and (b) the western YRD NJ site from 00:00 to 12:00 on 25 August 2016.
Figure 4b displays the hourly changes in the vertical profiles of O3 and potential temperature over the western YRD region on the morning of 25 August 2016. Reflected by the strong vertical gradients of potential temperature, the existence of the stable boundary layer up a height of 0.1 km over the surface at nighttime prevented the O3-rich air mass in the RL from being vertically transported to the surface. This resulted in the accumulation of an O3-rich “reservoir” in the RL at altitudes from 0.1 to 1 km over the western YRD area (Fig. 4b). After sunrise on 25 August, the stable boundary layer and the RL vanished due to the development of the CBL, which triggered the vertical mixing of the O3-rich air mass in the RL and the near-surface O3-poor air mass; this redistributed the O3 concentrations in the daytime CBL and enhanced the surface O3 level during the morning (Fig. 4b).
We compare the temporal changes of the O3 “reservoir” in the nocturnal RL over the eastern and western YRD areas in Fig. 4a and b. It is interesting to note that the O3 concentrations in the eastern O3 “reservoir” obviously decreased (“leaked”) overnight on 24 August (Fig. 4a), while the western O3 “reservoir” was gradually strengthened and formed a high O3 center that exceeded 200 µg m−3 over the western NJ site at around 06:00 (at sunrise) on 25 August (Fig. 4b). Considering the prevailing easterly winds in the lower troposphere over the YRD region during the summer smog period, we speculate that the regional O3 transport in the nocturnal RL could connect the eastern decreases and western increases in the overnight O3 “reservoir” within the RL (Fig. 4a and b). Therefore, we further investigate the regional O3 transport in the nocturnal RL over this area to interpret the observational evidence regarding the exacerbated O3 pollution and weakened photochemical production on 25 August in the western YRD (Figs. 1b–2, Table 2).

Figure 5The spatial distribution of O3 concentrations and wind streamlines at a height of about 900 m at (a) 00:00, (b) 03:00, (c) 06:00 and (d) 09:00 on 25 August 2016. The blue thick lines with arrows represent the major regional O3 transport routes from the eastern to the western YRD.
4.2 O3 transport in the RL
It is worth discussing why the nocturnal O3 concentrations in the RL increased by about 40 µg m−3 over the western YRD region from 03:00 to 06:00 on 25 August (Fig. 4b). To investigate the regional O3 transport over the YRD that contributed to the O3 enhancement in the nocturnal RL over the western YRD area, Figure 5 presents the variations in the O3 concentrations and wind streamlines at an altitude of about 900 m in the RL on the morning of 25 August. It is clearly seen from Figure 5 that the prevailing easterly winds drove the O3 transport from the eastern to the western YRD region during the night from 24 to 25 August. This confirms our speculation that O3 transport in the nocturnal RL over the YRD connects the overnight changes in the O3 levels between the eastern and the western YRD sites (Fig. 4a and b). It is noteworthy that the regional O3 transport in the nocturnal RL reached westward over the western urban NJ site before sunrise (around 06:00) on 25 August; this was also associated with the stagnation of cyclone circulation over NJ from 03:00 to 10:00, which prevented high O3 concentrations from moving further west and converged O3 into the RL over the western YRD region (the NJ and ZJ sites) after sunrise (around 09:00) on 25 August 2016 (Fig. 5).
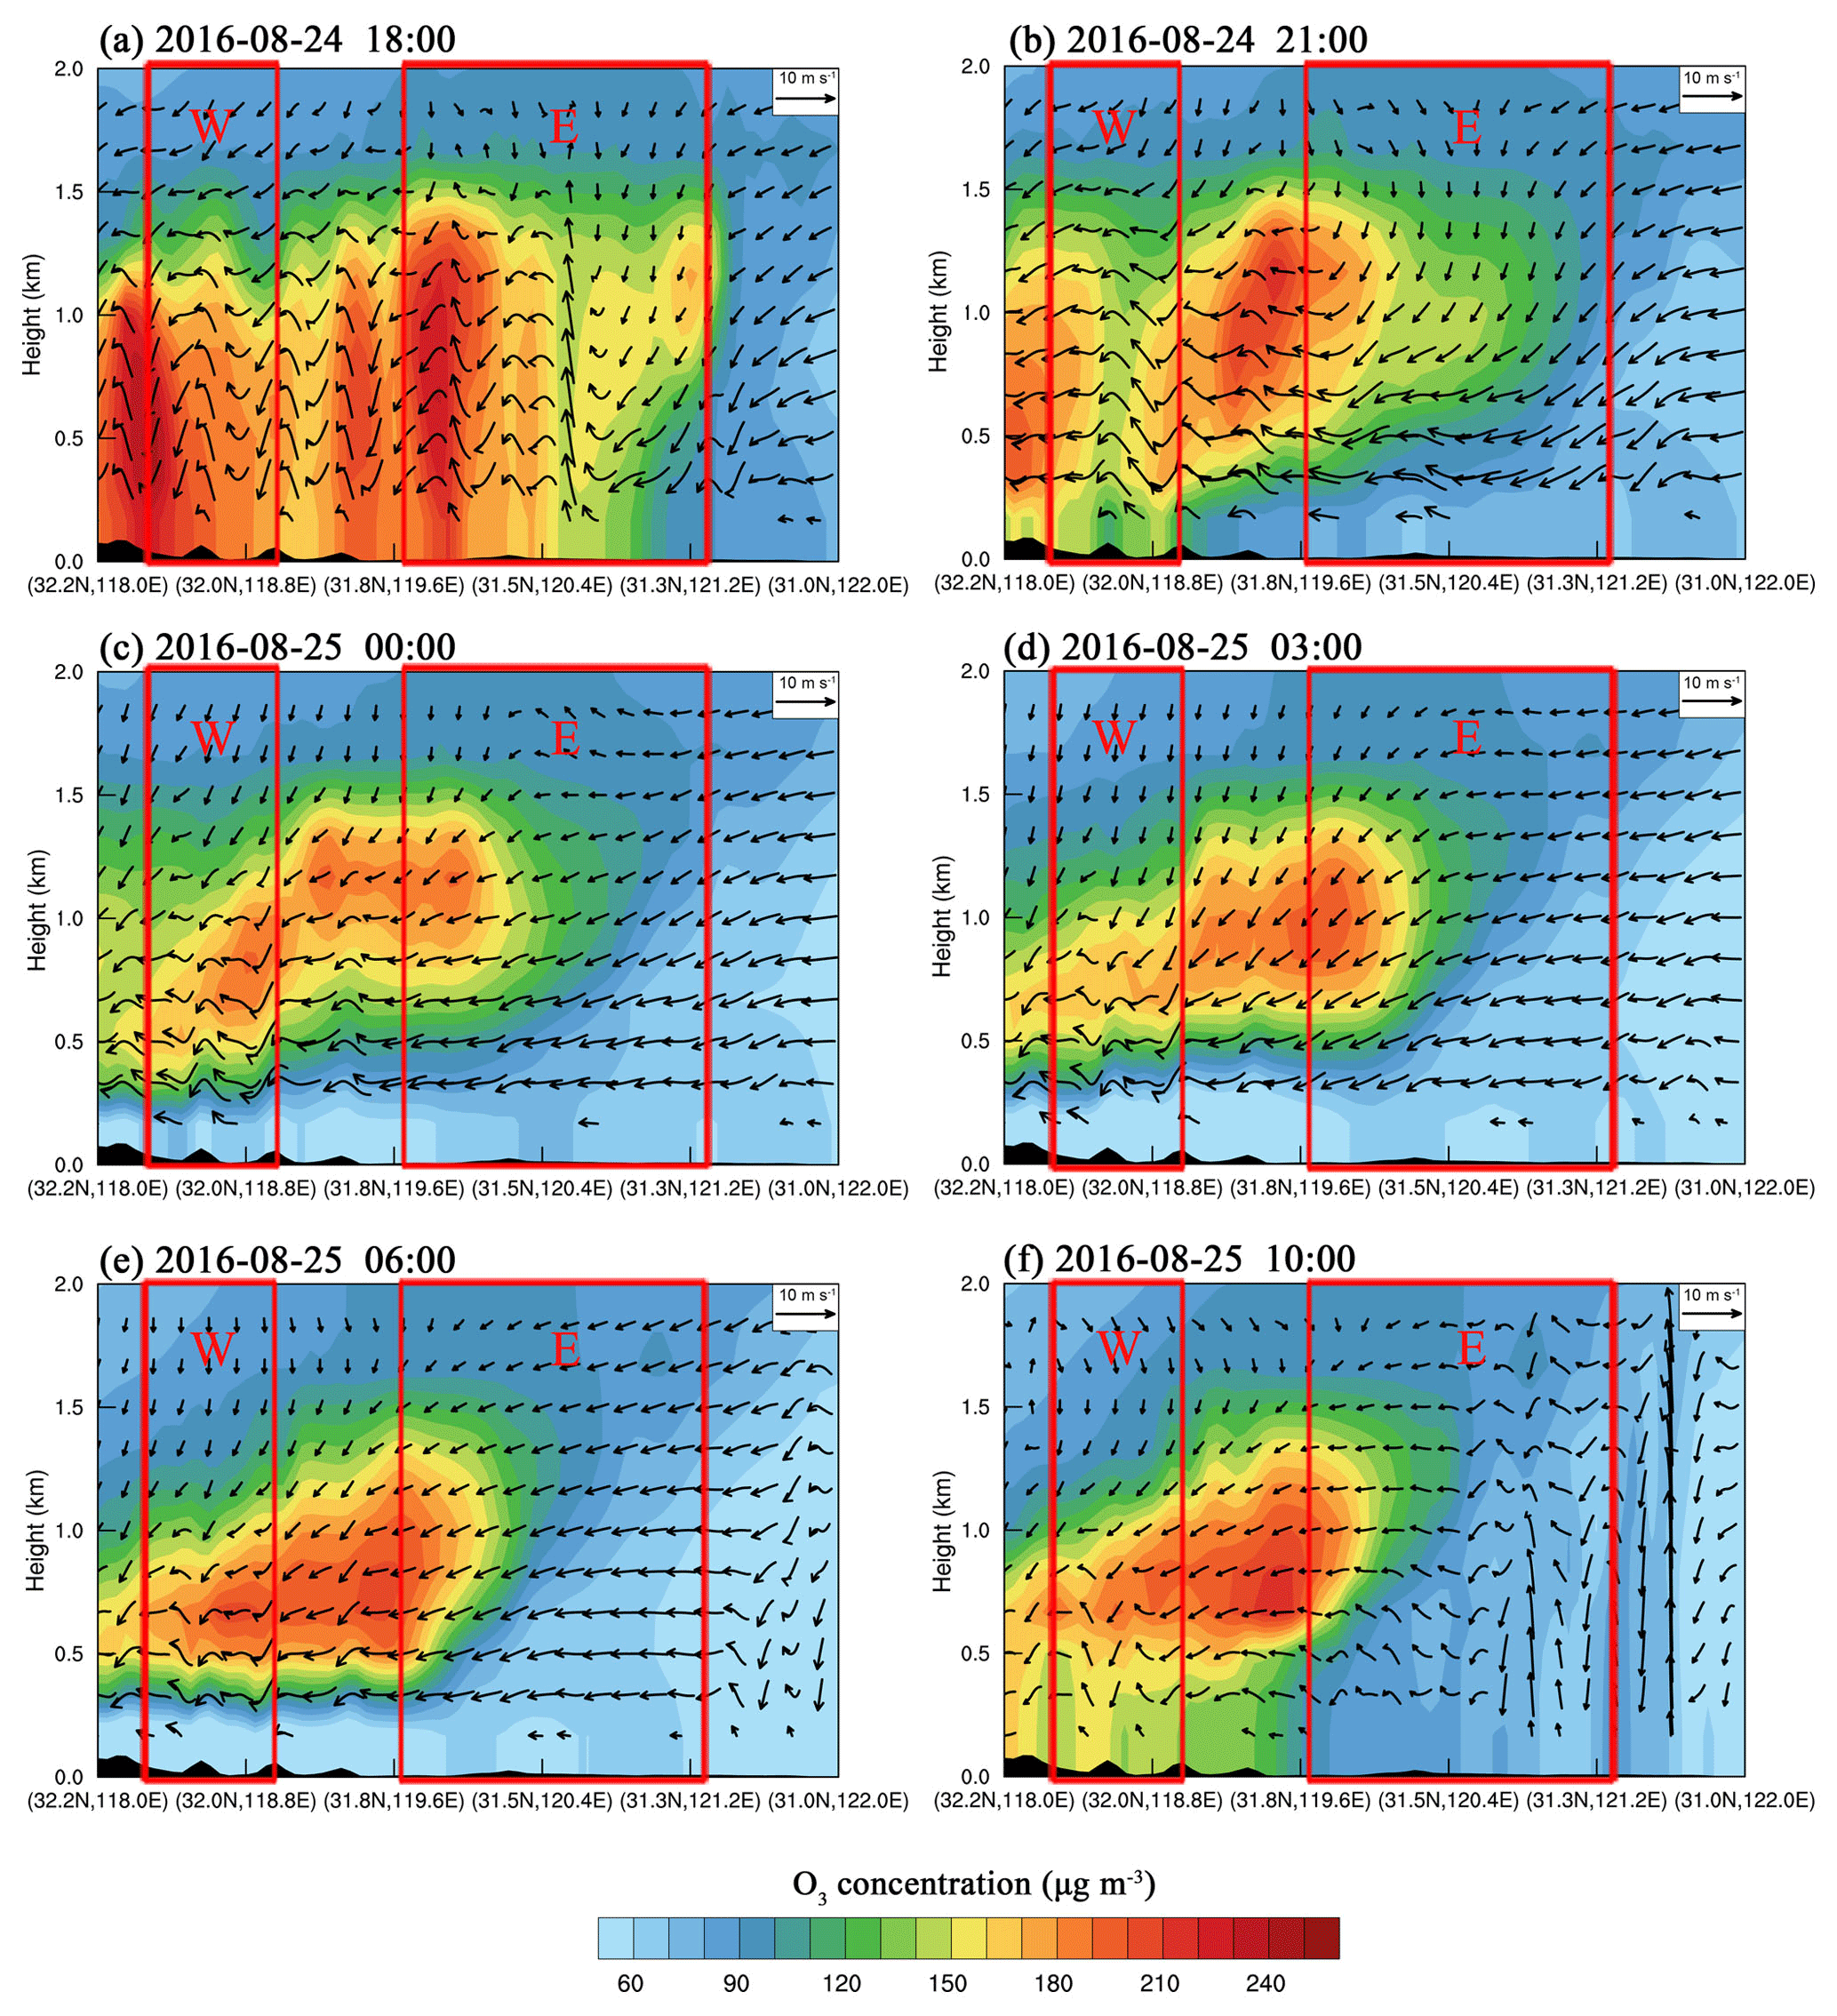
Figure 6Vertical sections of O3 concentrations (contours) and atmospheric circulation (wind vectors) along the regional O3 transport route (red solid line in Fig. 1b) from east to west over the YRD region. The W and E box columns mark the western YRD area surrounding NJ and the eastern YRD area covering CZ, WX, SZ and SH, respectively, from 24 to 25 August 2016. The vertical wind velocities are multiplied by 50 for the illustration of vertical circulations.
Figure 6 presents the temporal evolution of vertical sections of the O3 concentrations and atmospheric circulation along the regional O3 transport route over the YRD region in order to further explore the mechanism of regional O3 transport during summer smog in this area. The vertical O3 concentration distributions were strongly controlled by the diurnal change of the BL structure. The daytime O3 concentrations were vertically and uniformly distributed in the mixing layer (ML), the major part of the CBL over the YRD (Fig. 6a), which forms the O3-rich RL after sunset. Under the guidance of the prevailing easterly winds, the O3 transport from the eastern to the western YRD region persisted during the night from 24 to 25 August (Fig. 6b–e); this further confirmed our speculation regarding regional O3 transport in the nocturnal RL over the YRD region. The regional O3 transport in the RL from the eastern YRD to the western YRD NJ site increased the O3 concentrations to 200 µg m−3 within the RL over the western NJ site during the sunrise hours on 25 August (Fig. 4b). The O3 horizontal transport flux in the RL averaged over the nighttime from 20:00 on 24 August to 08:00 on 25 August was 541 µg m−2 s−1 at the western NJ site which was 119 µg m−2 s−1 stronger than the flux during the preceding night. This reflects the large contribution of O3 horizontal transport in RL to the O3 pollution on 25 August over the western YRD. The RL containing the O3-rich air mass over the western area, which was contributed by nocturnal O3 transport over the YRD, was destroyed during the development of the daytime CBL due to strong vertical mixing after sunrise on 25 August (Fig. 6f). The large daily contribution of vertical mixing to the surface O3 level occurred around 10:00 in the morning and comprised downwards vertical mixing from the upper levels which caused the entrainment of O3-rich RL air to the O3-poor air mass at the ground (Figs. 6f and 7).
4.3 Contribution of O3 vertical mixing from the RL
As discussed in Sect. 4.1 and 4.2, an O3-rich air mass can be transported from east to west in the nocturnal RL over the YRD. Following the establishment of the CBL after sunrise, the O3-rich air mass can be entrained downwards to the surface (Mcelroy and Smith, 1993; Venkatram, 1977) and can contribute to the surface O3 concentrations in the morning (Fig. 6f).
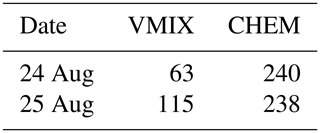
Based on the WRF-Chem simulation, Fig. 7 presents the hourly changes in the contribution rates of vertical mixing and local chemical reactions to surface O3 in the western urban NJ site from 24 to 25 August. Vertical mixing is initiated by convective and turbulent processes during the development of the daytime convective boundary layer, and chemical reactions constitute the net output of all O3 chemical reactions (Gao et al., 2016). The positive and negative contribution rates indicate the respective gain and loss of surface O3 via vertical mixing and local chemical reactions. The daily totals of the positive contribution of vertical mixing and local chemical reactions on 24 and 25 August are given in Table 3. Relative to 24 August, the positive contribution of O3 vertical mixing was significantly enhanced on 25 August with the largest contribution of O3, about 35 µg m−3 h−1, being twice as high as on 24 August (Fig. 7). Tropospheric O3 mainly results from photochemical reactions during the day (Seinfeld and Pandis, 1986); although the largest O3 contributions from chemical reactions reached up to 38 and 44 µg m−3 h−1 in the western YRD area on the afternoon of 24 and 25 August, respectively (Fig. 7), the daily totals of the positive contributions of chemical reactions were estimated to be lower on 25 August (238 µg m−3) than during the day on 24 August (240 µg m−3). The daily totals of the positive O3 contribution from vertical mixing rose sharply to 115 µg m−3 on 25 August, which was a large increase of 52 µg m−3 compared with 24 August (Table 3). The high O3 levels in ambient air for summer smog in the western YRD on 25 August comprised a significant contribution from the downward vertical mixing of the O3-rich RL air mass, which was transported in the nocturnal RL from the eastern to the western YRD. Therefore, regional O3 transport in the nocturnal RL in combination with the diurnal changes of the boundary layer are revealed to be an important mechanism of regional O3 transport in eastern China.
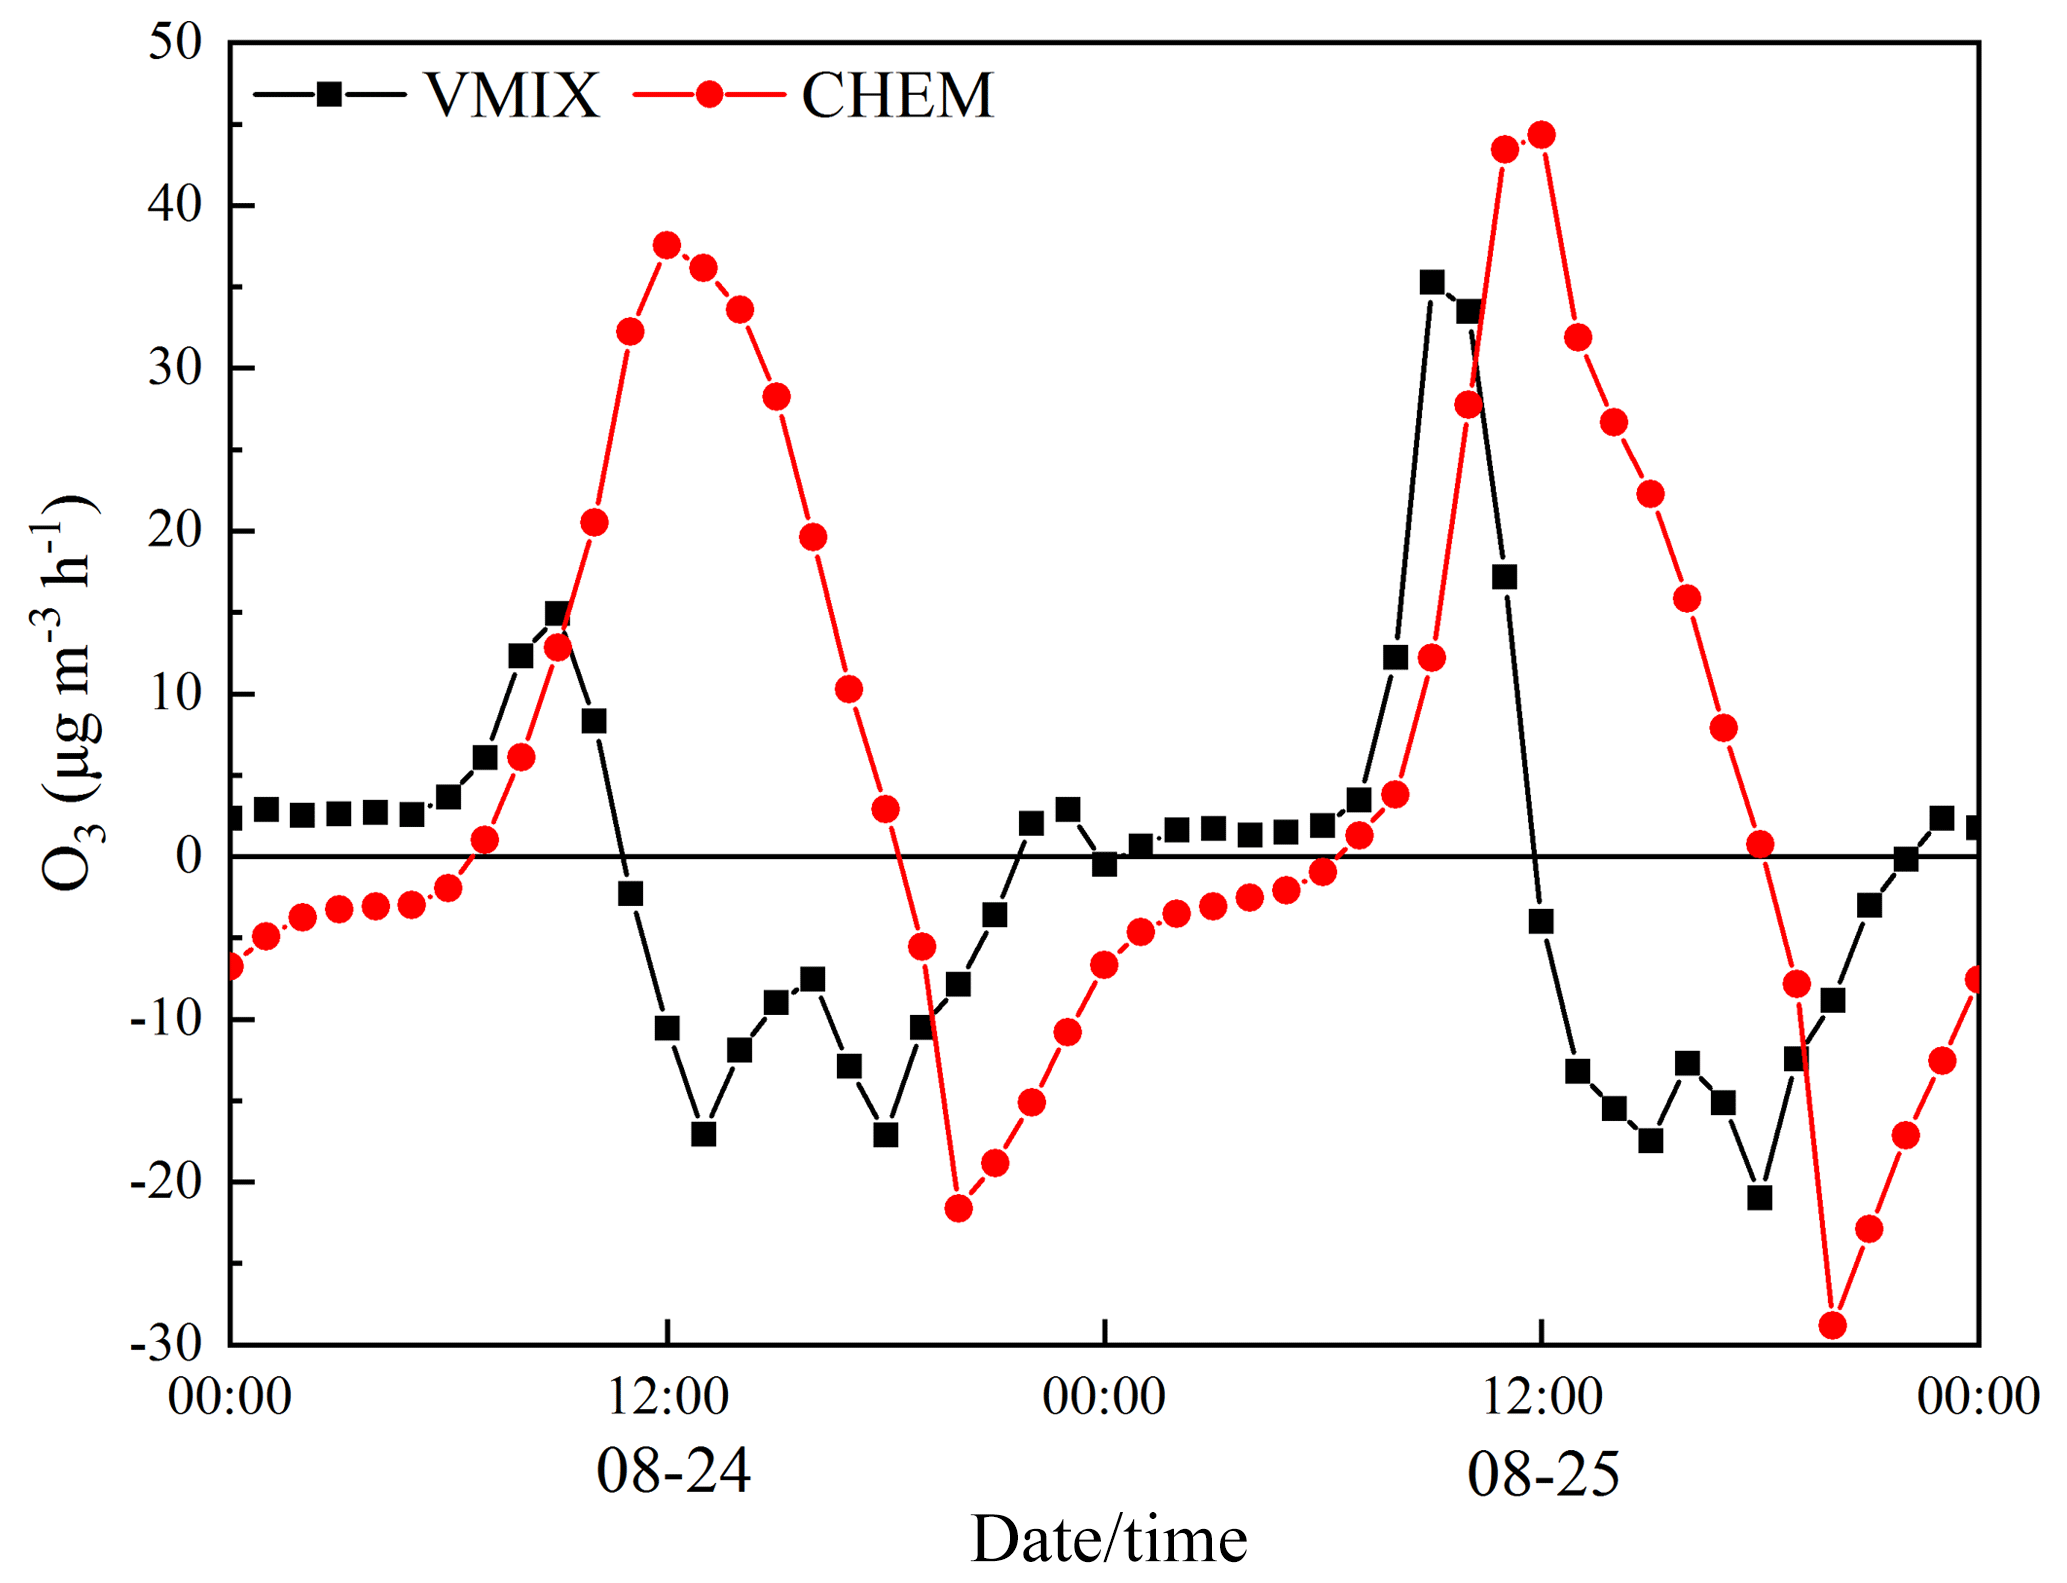
Figure 7The contribution rates of vertical mixing (VMIX) and chemical reactions (CHEM) to surface O3 concentrations at the NJ site during the 24–25 August 2016 period.
Based on the simulated dry deposition, we calculated hourly changes in O3 dry deposition and estimated daily average dry deposition rates of about 0.42 and 0.49 µg m−2 s−1 for 24 and 25 August, respectively. The dry depositions of O3 varied little over these 2 days, with only a slight enhancement on 25 August. This reflects the fact that O3 dry deposition exerted little impact on surface O3 changes during the 24–25 August period. Furthermore, the contribution of O3 dry deposition to tropospheric O3 changes was trivial compared to vertical mixing and chemical reactions (Wang et al., 1998; Fowler et al., 1999; Zaveri et al., 2003).
Table 3Comparisons of the daily totals of the positive contribution (µg m−3) of vertical mixing (VMIX) and chemical reactions (CHEM) to surface O3 concentrations in the western YRD area from 24 to 25 August 2016.

Considering weak changes in local emissions over short periods of time, the WRF-Chem simulation, run with hourly emissions of chemical species, over the YRD remained unchanged from 24 to 25 August. To analyze the impact of photochemical production, we used the observed surface NO2 concentrations and the total radiation irradiance (TRI) to examine the change in photochemical production rates. There were no apparent changes in NO2 or TRI from 24 to 25 August, which indicated that photochemical production exerted little impact on the high O3 level on 25 August compared with regional O3 transport in the nocturnal RL. The analysis of simulation results revealed that vertical mixing of the upper O3-rich RL with the daytime surface layer was a large contributor to O3 enhancement for summer smog in the western YRD on 25 August 2016 (Fig. 7).
By analyzing observational data of gaseous species and meteorological variables during severe summer smog over the YRD in eastern China in August 2016, we found noteworthy observational evidence of increasing daytime surface O3 levels. However, even though daytime temperatures were lower, and photochemical production and solar radiation were weaker on 25 August, daytime O3 still increased from 24 to 25 August in the western YRD. Therefore, regional O3 transport over the YRD is believed to play a pivotal role in the ambient O3 pollution on 25 August in the western YRD.
By combining environmental and meteorological observation data with air quality modeling, the formation mechanism of the O3 pollution episode over the YRD area, particularly the severe pollution over western YRD, was investigated. On 24 August, (high) O3 levels peaked at about 220 µg m−3 in the daytime mixing layer over the eastern YRD area. During nighttime, a shallow stable boundary layer formed near the surface, which decoupled the RL above it from the surface and resulted in the development of an O3-rich “reservoir”. Governed by prevailing easterly winds in the lower troposphere, the O3-rich air mass in the nocturnal RL shifted from the eastern to the western YRD with a horizontal transport flux of 541 µg m−2 s−1. Consequently, the O3 concentrations in the RL over the western YRD area increased to 200 µg m−3 around sunrise on 25 August 2016. The disappearance of the RL after sunrise was accompanied by vertical mixing, which was initiated by convective and turbulent processes during the establishment of daytime CBL. The vertical mixing in the CBL occurred from the upper levels to the ground, with the net downward transport flux reaching up to 35 µg m−3 h−1 during daytime on 25 August. This flux contributed considerably to the surface O3 accumulation in summer smog over the western YRD region on 25 August 2016, which is of great importance with respect to the formation of severe O3 pollution in the western YRD region.
This study revealed regional O3 transport through the nocturnal RL (from upstream to downstream areas driven by the prevailing winds in the lower troposphere in close association with the diurnal change in the atmospheric boundary layer) to be an important mechanism, which can be depicted using a conceptual model (Fig. 8). This regional O3 transport mechanism has substantial implications regarding understanding urban O3 pollution and air quality change.
Regional O3 transport in the atmospheric boundary layer during this particular case of summer smog in the YRD, eastern China is to be further studied using more comprehensive observations of meteorology and environment, including the impact of changes in biogenic VOCs on O3 concentrations and better modeling of the atmospheric boundary layer.
Data used in this paper can be provided upon request from Jun Hu (hujun9416@foxmail.com) or Tianliang Zhao (tlzhao@nuist.edu.cn).
TZ and JH conceived the study. DL, XJ and LC provided the observation data. JH and YJ performed the WRF-Chem model runs and data analysis. JH and YL designed the graphics and wrote the manuscript with help from TZ. XH and JL were involved in the scientific discussion. All authors commented on the paper.
The authors declare that they have no conflict of interest.
This article is part of the special issue “Regional transport and transformation of air pollution in eastern China”. It is not associated with a conference.
This study was jointly funded by the National Key R & D Program of China
(project no. 2016YFC0203304), the National Natural Science Foundation of China ( project no.
91744209 and 91644223), the National Key Basic Research Development Program of China
(project no. 2014CB441203), the Program of Shanghai's committee of Science and Technology
(project no. 16DZ1204607) and Postgraduate Research & Practice Innovation Program of
Jiangsu Province (project no. KYCX18_1003).
Edited by: Jianmin Chen
Reviewed by: four anonymous referees
An, J., Zou, J., Wang, J., Lin, X., and Zhu, B.: Differences in ozone photochemical characteristics between the megacity Nanjing and its suburban surroundings, Yangtze River Delta, China, Environ. Sci. Pollut. R., 22, 19607, 2015.
Aneja, V. P., Mathur, R., Arya, S. P., Li, Y., Murray, G. C., and Manuszak, T. L.: Coupling the Vertical Distribution of Ozone in the Atmospheric Boundary Layer, Environ. Sci. Technol., 34, 15–28, 2000.
Bell, M. L., Peng, R. D., and Dominici, F.: The Exposure-Response Curve for Ozone and Risk of Mortality and the Adequacy of Current Ozone Regulations, Environ. Health Persp., 114, 532–536, 2006.
Bréon, F.-M., Collins, W., Fuglestvedt, J., Huang, J., Koch, D., Lamarque, J.-F., Lee, D., Mendoza, B., Nakajima, T., Robock, A., Stephens, G., Takemura, T., and Zhang, H.: IPCC 2013: Chapter 8: Anthropogenic and Natural Radiative Forcing, in: Climate Change 2013: The Physical Science Basis, Contribution of Working Group I to the Fifth Assessment Report of the Intergovernmental Panel on Climate Change, edited by: Stocker, T. F., Qin, D., Plattner, G.-K., Tignor, M., Allen, S. K., Boschung, J., Nauels, A., Xia, Y., Bex, V., and Midgley, P. M., Cambridge University Press, Cambridge, UK and New York, NY, USA, 659–740, 2013.
Carnero, J. A., Bolívar, J. P., and Ba, D. L. M.: Surface ozone measurements in the southwest of the Iberian Peninsula (Huelva, Spain), Environ. Sci. Pollut. R., 17, 355–368, 2010.
Chang, J. S., Middleton, P. B., Stockwell, W. R., Binkowski, F. S., and Byun, D.: Acidic deposition: State of science and technology. Report 4. The regional acid deposition model and engineering model. Final report, J. Mater. Sci. Lett., 9, 772–773, 1990.
Chang, Y., Zou, Z., Deng, C., Huang, K., Collett, J. L., Lin, J., and Zhuang, G.: The importance of vehicle emissions as a source of atmospheric ammonia in the megacity of Shanghai, Atmos. Chem. Phys., 16, 3577–3594, https://doi.org/10.5194/acp-16-3577-2016, 2016.
Chou, M. D., Suarez, M. J., Ho, C. H., Yan, M. M. H., and Lee, K. T.: Parameterizations for Cloud Overlapping and Shortwave Single-Scattering Properties for Use in General Circulation and Cloud Ensemble Models, J. Climate, 11, 202–214, 1998.
Corsmeier, U., Kalthoff, N., Kolle, O., Kotzian, M., and Fiedler, F.: Ozone concentration jump in the stable nocturnal boundary layer during a LLJ-event, Atmos. Environ., 31, 1977–1989, 1997.
Council, N. R.: Rethinking the ozone problem in urban and regional air pollution, National Academy Press, 1991.
Duncan, B. N., West, J. J., Yoshida, Y., Fiore, A. M., and Ziemke, J. R.: The influence of European pollution on ozone in the Near East and northern Africa, Atmos. Chem. Phys., 8, 2267–2283, https://doi.org/10.5194/acp-8-2267-2008, 2008.
Emmons, L. K., Walters, S., Hess, P. G., Lamarque, J.-F., Pfister, G. G., Fillmore, D., Granier, C., Guenther, A., Kinnison, D., Laepple, T., Orlando, J., Tie, X., Tyndall, G., Wiedinmyer, C., Baughcum, S. L., and Kloster, S.: Description and evaluation of the Model for Ozone and Related chemical Tracers, version 4 (MOZART-4), Geosci. Model Dev., 3, 43–67, https://doi.org/10.5194/gmd-3-43-2010, 2010.
Filleul, L., Cassadou, S., Médina, S., Fabres, P., Lefranc, A., Eilstein, D., Tertre, A. L., Pascal, L., Chardon, B., and Blanchard, M.: The Relation between Temperature, Ozone, and Mortality in Nine French Cities during the Heat Wave of 2003, Environ. Health Persp., 114, 1344, https://doi.org/10.1289/ehp.8328, 2006.
Fowler, D., Cape, J., Coyle, M., Smith, R., Hjellbrekke, A.-G., Simpson, D., Derwent, R., and Johnson, C.: Modelling photochemical oxidant formation, transport, deposition and exposure of terrestrial ecosystems, Environ. Pollut., 100, 43–55, 1999.
Gangoiti, G., Alonso, L., Navazo, M., Albizuri, A., Perez-Landa, G., Matabuena, M., Valdenebro, V., Maruri, M., García, J. A., and Millán, M. M.: Regional transport of pollutants over the Bay of Biscay: analysis of an ozone episode under a blocking anticyclone in west-central Europe, Atmos. Environ., 36, 1349–1361, 2002.
Gao, J., Zhu, B., Xiao, H., Kang, H., Hou, X., and Shao, P.: A case study of surface ozone source apportionment during a high concentration episode, under frequent shifting wind conditions over the Yangtze River Delta, China, Sci. Total Environ., 544, 853, https://doi.org/10.1016/j.scitotenv.2015.12.039, 2016.
Godowitch, J. M., Gilliam, R. C., and Rao, S. T.: Diagnostic evaluation of ozone production and horizontal transport in a regional photochemical air quality modeling system, Atmos. Environ., 45, 3977–3987, 2011.
Grell, G. A., Peckham, S. E., Schmitz, R., McKeen, S. A., Frost, G., Skamarock, W. C., and Eder, B.: Fully coupled “online” chemistry within the WRF model, Atmos. Environ., 39, 6957–6975, 2005.
Guenther, A., Karl, T., Harley, P., Wiedinmyer, C., Palmer, P. I., and Geron, C.: Estimates of global terrestrial isoprene emissions using MEGAN (Model of Emissions of Gases and Aerosols from Nature), Atmos. Chem. Phys., 6, 3181–3210, https://doi.org/10.5194/acp-6-3181-2006, 2006.
Han, H., Liu, J., Yuan, H., Zhuang, B., Zhu, Y., Wu, Y., Yan, Y., and Ding, A.: Characteristics of intercontinental transport of tropospheric ozone from Africa to Asia, Atmos. Chem. Phys., 18, 4251–4276, https://doi.org/10.5194/acp-18-4251-2018, 2018.
Hong, S.-Y., Noh, Y., and Dudhia, J.: A New Vertical Diffusion Package with an Explicit Treatment of Entrainment Processes, Mon. Weather Rev., 134, 2318–2341, https://doi.org/10.1175/mwr3199.1, 2006.
Horowitz, L. W., Walters, S., Mauzerall, D. L., Emmons, L. K., Rasch, P. J., Granier, C., Tie, X., Lamarque, J. F., Schultz, M. G., and Tyndall, G. S.: A global simulation of tropospheric ozone and related tracers: Description and evaluation of MOZART, version 2, J. Geophys. Res.-Atmos., 108, ACH 16-11, https://doi.org/10.1029/2002JD002853, 2003.
Hu, X.-M., Fuentes, J. D., and Zhang, F.: Downward transport and modification of tropospheric ozone through moist convection, J. Atmos. Chem., 65, 13–35, 2010.
Hu, X.-M., Klein, P. M., Xue, M., Zhang, F., Doughty, D. C., Forkel, R., Joseph, E., and Fuentes, J. D.: Impact of the vertical mixing induced by low-level jets on boundary layer ozone concentration, Atmos. Environ., 70, 123–130, 2013.
Hu, X. M., Doughty, D. C., Sanchez, K. J., Joseph, E., and Fuentes, J. D.: Ozone variability in the atmospheric boundary layer in Maryland and its implications for vertical transport model, Atmos. Environ., 46, 354–364, 2012.
Jacob, D.: Introduction to atmospheric chemistry, Princeton University Press, 1999.
Jiang, Y. C., Zhao, T. L., Liu, J., Xu, X. D., Tan, C. H., Cheng, X. H., Bi, X. Y., Gan, J. B., You, J. F., and Zhao, S. Z.: Why does surface ozone peak before a typhoon landing in southeast China?, Atmos. Chem. Phys., 15, 13331–13338, https://doi.org/10.5194/acp-15-13331-2015, 2015.
Kain, J. S.: The Kain–Fritsch Convective Parameterization: An Update, J. Appl. Meteorol., 43, 170–181, https://doi.org/10.1175/1520-0450(2004)043<0170:tkcpau>2.0.co;2, 2004.
Klein, P. M., Hu, X.-M., and Xue, M.: Impacts of mixing processes in nocturnal atmospheric boundary layer on urban ozone concentrations, Bound.-Lay. Meteorol., 150, 107–130, 2014.
Lee, S. M., Fernando, H. J. S., Princevac, M., Zajic, D., Sinesi, M., Mcculley, J. L., and Anderson, J.: Transport and diffusion of ozone in the nocturnal and morning planetary boundary layer of the Phoenix Valley, Environ. Fluid Mech., 3, 331–362, 2003.
Lelieveld, J., Berresheim, H., Borrmann, S., Crutzen, P. J., Dentener, F. J., Fischer, H., Feichter, J., Flatau, P. J., Heland, J., and Holzinger, R.: Global air pollution crossroads over the Mediterranean, Science, 298, 794–799, 2002.
Li, L., Chen, C. H., Huang, C., Huang, H. Y., Zhang, G. F., Wang, Y. J., Wang, H. L., Lou, S. R., Qiao, L. P., Zhou, M., Chen, M. H., Chen, Y. R., Streets, D. G., Fu, J. S., and Jang, C. J.: Process analysis of regional ozone formation over the Yangtze River Delta, China using the Community Multi-scale Air Quality modeling system, Atmos. Chem. Phys., 12, 10971–10987, https://doi.org/10.5194/acp-12-10971-2012, 2012.
Li, S., Wang, T., Huang, X., Pu, X., Li, M., Chen, P., Yang, X. Q., and Wang, M.: Impact of East Asian summer monsoon on surface ozone pattern in China, J. Geophys. Res.-Atmos., 123, 1401–1411, 2018.
Liu, J. J., Jones, D. B. A., Zhang, S., and Kar, J.: Influence of interannual variations in transport on summertime abundances of ozone over the Middle East, J. Geophys. Res.-Atmos., 116, 999–1010, 2011.
Logan, J. A., Prather, M. J., Wofsy, S. C., and Mcelroy, M. B.: Tropospheric chemistry: A global perspective, J. Geophys. Res.-Oceans, 86, 7210–7254, 1981.
Mcelroy, J. L. and Smith, T. B.: Creation and fate of ozone layers aloft in Southern California, Atmos. Environ. A-Gen., 27, 1917–1929, 1993.
Mlawer, E. J., Taubman, S. J., Brown, P. D., Iacono, M. J., and Clough, S. A.: Radiative transfer for inhomogeneous atmospheres: RRTM, a validated correlated-k model for the longwave, J. Geophys. Res.-Atmos., 102, 16663–16682, https://doi.org/10.1029/97JD00237, 1997.
Morris, G. A., Ford, B., Rappenglück, B., Thompson, A. M., Mefferd, A., Ngan, F., and Lefer, B.: An evaluation of the interaction of morning residual layer and afternoon mixed layer ozone in Houston using ozonesonde data, Atmos. Environ., 44, 4024–4034, 2010.
Morrison, H., Thompson, G., and Tatarskii, V.: Impact of Cloud Microphysics on the Development of Trailing Stratiform Precipitation in a Simulated Squall Line: Comparison of One- and Two-Moment Schemes, Mon. Weather Rev., 137, 991–1007, https://doi.org/10.1175/2008mwr2556.1, 2009.
Neu, U., Künzle, T., and Wanner, H.: On the relation between ozone storage in the residual layer and daily variation in near-surface ozone concentration – A case study, Bound.-Lay. Meteorol., 69, 221–247, 1994.
Pu, X., Wang, T., Huang, X., Melas, D., Zanis, P., Papanastasiou, D., and Poupkou, A.: Enhanced surface ozone during the heat wave of 2013 in Yangtze River Delta region, China, Sci. Total Environ., 603, 807–816, 2017.
Rao, S. T., Sistla, G., and Henry, R.: Statistical analysis of trends in urban ozone air quality, J. Air Waste Manage. Assoc., 42, 1204–1211, 1992.
Seinfeld, J. H. and Pandis, S. N.: Atmospheric chemistry and physics: From air pollution to climate change (Second Edition), Wiley, 1595–1595, 1986.
Shu, L., Xie, M., Wang, T., Gao, D., Chen, P., Han, Y., Li, S., Zhuang, B., and Li, M.: Integrated studies of a regional ozone pollution synthetically affected by subtropical high and typhoon system in the Yangtze River Delta region, China, Atmos. Chem. Phys., 16, 15801–15819, https://doi.org/10.5194/acp-16-15801-2016, 2016.
Sillman, S.: The relation between ozone, NOx and hydrocarbons in urban and polluted rural environments, Atmos. Environ., 33, 1821–1845, 1999.
Stockwell, W. R., Middleton, P., Chang, J. S., and Tang, X.: The second generation regional acid deposition model chemical mechanism for regional air quality modeling, J. Geophys. Res.-Atmos., 95, 16343–16367, https://doi.org/10.1029/JD095iD10p16343 1984.
Stull, R. B.: An introduction to boundary layer meteorology, Atmospheric Sciences Library, 8, 499–543, 1988.
Tang, G., Zhu, X., Xin, J., Hu, B., Song, T., Sun, Y., Zhang, J., Wang, L., Cheng, M., and Chao, N.: Modelling study of boundary-layer ozone over northern China-Part I: Ozone budget in summer, Atmos. Res., 187, 128–137, 2017.
Tang, H., Liu, G., Zhu, J., Han, Y., and Kobayashi, K.: Seasonal variations in surface ozone as influenced by Asian summer monsoon and biomass burning in agricultural fields of the northern Yangtze River Delta, Atmos. Res., 122, 67–76, 2013.
Taylor, K. E.: Summarizing multiple aspects of model performance in a single diagram, J. Geophys. Res.-Atmos., 106, 7183–7192, https://doi.org/10.1029/2000JD900719, 2001.
Tewari, M., Chen, F., Wang, W., Dudhia, J., Lemone, M. A., Mitchell, K., Ek, M., Gayno, G., Wegiel, J., and Cuenca, R. H.: Implementation and verification of the unified NOAH land surface model in the WRF model, Conference on Weather Analysis and Forecasting/Conference on Numerical Weather Prediction, 11–15, 2004.
Thompson, A. M.: The oxidizing capacity of the earth's atmosphere: probable past and future changes, Science, 256, 1157–1165, 1992.
Tie, X., Geng, F., Peng, L., Gao, W., and Zhao, C.: Measurement and modeling of O3 variability in Shanghai, China: Application of the WRF-Chem model, Atmos. Environ., 43, 4289–4302, 2009.
Tong, N. Y. O., Leung, D. Y. C., and Liu, C. H.: A Review on Ozone Evolution and Its Relationship with Boundary Layer Characteristics in Urban Environments, Water Air Soil Pollut., 214, 13–36, 2011.
Venkatram, A.: Internal boundary layer development and fumigation, Atmos. Environ., 11, 479–482, 1977.
Wang, T., Xue, L., Brimblecombe, P., Lam, Y. F., Li, L., and Zhang, L.: Ozone pollution in China: A review of concentrations, meteorological influences, chemical precursors, and effects, Sci. Total Environ., 575, 1582–1596, 2017.
Wang, Y., Logan, J. A., and Jacob, D. J.: Global simulation of tropospheric O3-NOx-hydrocarbon chemistry: 2. Model evaluation and global ozone budget, J. Geophys. Res.-Atmos., 103, 10713–10725, 1998.
Wild, O. and Akimoto, H.: Intercontinental transport of ozone and its precursors in a three-dimensional global CTM, J. Geophys. Res.-Atmos., 106, 27729–27744, 2001.
Wolff, G. T., Lioy, P. J., Wight, G. D., Meyers, R. E., and Cederwall, R. T.: An investigation of long-range transport of ozone across the midwestern and eastern united states, Atmos. Environ., 11, 797–802, 1977.
Xie, M., Zhu, K., Wang, T., Chen, P., Han, Y., Li, S., Zhuang, B., and Shu, L.: Temporal characterization and regional contribution to O3 and NOx at an urban and a suburban site in Nanjing, China, Sci. Total Environ., 551, 533–545, 2016.
Xu, X., Lin, W., Wang, T., Yan, P., Tang, J., Meng, Z., and Wang, Y.: Long-term trend of surface ozone at a regional background station in eastern China 1991–2006: enhanced variability, Atmos. Chem. Phys., 8, 2595–2607, https://doi.org/10.5194/acp-8-2595-2008, 2008.
Yienger, J. J., Galanter, M., Holloway, T. A., Phadnis, M. J., Guttikunda, S. K., Carmichael, G. R., Moxim, W. J., and Hiram Levy, I. I.: The Episodic Nature of Air Pollution Transport From Asia to North America, J. Geophys. Res.-Atmos., 105, 26931–26946, 2000.
Yorks, J. E., Thompson, A. M., Joseph, E., and Miller, S. K.: The variability of free tropospheric ozone over Beltsville, Maryland (39N, 77W) in the summers 2004–2007, Atmos. Environ., 43, 1827–1838, 2009.
Zaveri, R. A., Berkowitz, C. M., Kleinman, L. I., Springston, S. R., Doskey, P. V., Lonneman, W. A., and Spicer, C. W.: Ozone production efficiency and NOx depletion in an urban plume: Interpretation of field observations and implications for evaluating O3-NOx-VOC sensitivity, J. Geophys. Res.-Atmos., 108, https://doi.org/10.1029/2002JD003144, 2003.
Zhang, J. and Rao, S. T.: The role of vertical mixing in the temporal evolution of ground-level ozone concentrations, J. Appl. Meteorol., 38, 1674–1691, 1999.
Zhang, J., Rao, S. T., and Daggupaty, S. M.: Meteorological processes and ozone exceedances in the northeastern United States during the 12–16 July 1995 Episode, J. Appl. Meteorol., 37, 776–789, 1998.
Zhang, L., Jin, L., Zhao, T., Yan, Y., Zhu, B., Shan, Y., Guo, X., Tan, C., Gao, J., and Wang, H.: Diurnal variation of surface ozone in mountainous areas: Case study of Mt. Huang, East China, Sci. Total Environ., 538, 583–590, 2015.
Zhu, Y., Liu, J., Wang, T., Zhuang, B., Han, H., Wang, H., Chang, Y., and Ding, K.: The Impacts of Meteorology on the Seasonal and Interannual Variabilities of Ozone Transport from North America to East Asia, J. Geophys. Res.-Atmos., 122, https://doi.org/10.1002/2017JD026761, 2017.