the Creative Commons Attribution 4.0 License.
the Creative Commons Attribution 4.0 License.
 | 09 Nov 2018
Non-methane hydrocarbon variability in Athens during wintertime: the role of traffic and heating
Anastasia Panopoulou
Eleni Liakakou
Valérie Gros
Stéphane Sauvage
Nadine Locoge
Bernard Bonsang
Basil E. Psiloglou
Evangelos Gerasopoulos
Nikolaos Mihalopoulos
Non-methane hydrocarbons (NMHCs) play an important role in atmospheric chemistry, contributing to ozone and secondary organic aerosol formation. They can also serve as tracers for various emission sources such as traffic, solvents, heating and vegetation. The current work presents, for the first time to our knowledge, time-resolved data of NMHCs, from two to six carbon atoms, for a period of 5 months (mid-October 2015 to mid-February 2016) in the “greater Athens area” (GAA), Greece. The measured NMHC levels are among the highest reported in the literature for the Mediterranean area during winter months, and the majority of the compounds demonstrate a remarkable day-to-day variability. Their levels increase by up to factor of 4 from autumn (October–November) to winter (December–February). Microscale meteorological conditions, especially wind speed in combination with the planetary boundary layer (PBL) height, seem to contribute significantly to the variability of NMHC levels, with an increase of up to a factor of 10 under low wind speed (<3 m s−1) conditions; this reflects the impact of local sources rather than long-range transport. All NMHCs demonstrated a pronounced bimodal, diurnal pattern with a morning peak followed by a second peak before midnight. The amplitude of both peaks gradually increased towards winter, in comparison to autumn, by a factor of 3 to 6 and closely followed that of carbon monoxide (CO), which indicates a contribution from sources other than traffic, e.g., domestic heating (fuel or wood burning). By comparing the NMHC diurnal variability with that of black carbon (BC), its fractions associated with wood burning (BCwb) and fossil fuel combustion (BCff), and with source profiles we conclude that the morning peak is attributed to traffic while the night peak is mainly attributed to heating. With respect to the night peak, the selected tracers and source profiles clearly indicate a contribution from both traffic and domestic heating (fossil fuel and wood burning). NMHCs slopes versus BCwb are similar when compared with those versus BCff (slight difference for ethylene), which indicates that NMHCs are most likely equally produced by wood and oil fossil fuel burning.
- Article
(3447 KB) - Full-text XML
-
Supplement
(856 KB) - BibTeX
- EndNote


Non-methane hydrocarbons (NMHCs) are key atmospheric constituents for atmospheric chemistry. In the presence of NOx, their oxidation leads to the formation of tropospheric ozone and other species, such as peroxy radicals (RO2) and peroxy acetyl nitrate (PAN), which affect the oxidative capacity of the atmosphere (Atkinson, 2000 and references therein). NMHC oxidation contributes to the formation of secondary organic aerosols (SOA), which in turn affect light scattering, visibility and cloud condensation nuclei formation (Tsigaridis and Kanakidou, 2003; Seinfeld and Pandis, 2016 and references therein). In urban areas NMHCs mainly originate from anthropogenic sources such as traffic, solvent use, residential heating, natural gas use and industrial activity, but they can also be emitted from natural sources such as vegetation (Guenther et al., 1995; Barletta et al., 2005; Kansal, 2009; Sauvage et al., 2009; Salameh et al., 2015; Baudic et al., 2016; Jaimes-Palomera et al., 2016). Besides their key role as a precursor for secondary pollutants, NMHCs are of interest due to their association with human health issues (EEA report no. 28/2016, 2016). Since 2013, atmospheric substances have been classified into four major groups by the International Agency for Research on Cancer (WHO-IARC, 2013) with respect to their carcinogenicity to humans, with benzene and 1,3-butadiene among those NMHCs classified as potential carcinogens (IARC, 2012).
Athens, the capital of Greece with almost 5 million inhabitants, is frequently subject to intense air pollution episodes, which lead to exceedances of the EU air quality limits. The driving processes and atmospheric dynamics of these episodes have been scrutinized over the last few decades (Cvitas et al., 1985; Lalas et al., 1982, 1983, 1987; Mantis et al., 1992; Nester, 1995; Melas et al., 1998; Ziomas et al., 1995; Kanakidou et al., 2011). However, measurements of pollution precursors are mostly limited to ozone and nitrogen oxides. The few existing, non-continuous NMHC measurements in Athens were carried out using canisters or sorbent tubes and were only performed over short periods of time (days) during summer or autumn (Moschonas and Glavas, 1996; Klemm et al., 1998; Moschonas et al., 2001; Giakoumi et al., 2009). Continuous measurements of NMHCs in Athens were carried out for a period of 1 month during summer 20 years ago at three locations, two suburban and one urban, and reported almost 50 C4–C12 compounds (Rappenglück et al., 1998, 1999). More recently continuous measurements of NMHCs were carried out by Kaltsonoudis et al. (2016), for 1 month in winter 2013 at an urban location (Thissio) and 1 month in summer 2012 at a suburban location (A. Paraskevi), and reported 11 oxygenated organic gaseous compounds and C5–C8 NMHCs. Meanwhile, significant changes in pollutant sources have occurred in Athens over the last 20 years, which have led to significant decreases in the annual concentrations of major pollutants such as CO, SO2 and NOx (Gratsea et al., 2017; Kalabokas et al., 1999). As this trend has been attributed to the car fleet renewal, fuel improvement, the metro line extension and industrial emission controls, a related decrease in NMHC levels originating from traffic and industrial emissions is also expected. However, since 2012, a new wintertime source of pollution has emerged in Greece in the form of uncontrolled wood burning for domestic heating (Saffari et al., 2013; Paraskevopoulou et al., 2015; Kaltsonoudis et al., 2016; Fourtziou et al., 2017; Gratsea et al., 2017). This is an important source of various pollutants such as particulate matter (PM), polycyclic aromatic hydrocarbons (PAHs), black carbon (BC) and CO (Gratsea et al., 2017; Hellén et al., 2008; Paraskevopoulou et al., 2015; Schauer et al., 2001, and references therein), and it can represent up to 50 % of the mass of volatile organic compounds (VOCs) during winter as found in Paris by Baudic et al. (2016). Studies regarding the characterization of VOC emissions from domestic wood burning based on emissions close to sources, in ambient air or in chambers have been published; however, differences have been observed in the emission rates or the emission profiles, which are attributed to the type of wood, stove, fire lighting material and the burning stages (Barrefors and Petersson, 1995; Baudic et al., 2016; Evtyugina et al., 2014; Gaeggeler et al., 2008; Gustafson et al., 2007; Hellén et al., 2008; Liu et al., 2008; Schauer et al., 2001 and references therein). Moreover, very few studies report light NMHC measurements from domestic wood burning (Barrefors and Petersson, 1995; Baudic et al., 2016; Liu et al., 2008; Schauer et al., 2001), and the studies that do exist present significant discrepancies. For example, the higher contribution of benzene relative to acetylene in the residential wood burning profile reported by Baudic et al. (2016) was different to the profile presented by Liu et al. (2008). In addition, in their recent work, Kaltsonoudis et al. (2016) reported the important contribution of wood burning to the winter nighttime concentrations of aromatics and oxygenated VOCs. The above clearly demonstrates the increasing need for intensive measurements of NMHCs in Athens, which in turn will allow for the impact of future changes (fuel composition changes or other control strategies) on atmospheric composition to be assessed. In other words, there is the need to establish a “current baseline” for the atmospheric composition in Athens in terms of NMHC levels.
The current study presents, time-resolved data of 11 selected (from 15 determined) C2–C6 NMHCs, over a time span of several months (October 2015 to mid-February 2016) in the greater Athens area (GAA). In addition, time-resolved data of toluene, ethylbenzene, m-/p-xylenes and o-xylene are used, which were simultaneously monitored from mid-January to mid-February 2016. The emphasis of this work is on (1) the determination of the ambient levels of C2–C6 NMHCs during autumn and winter, 20 years after the first summertime measurements were carried out – these are the first ever known continuous measurements of NMHCs (especially C2–C3 NMHCs) in Athens; (2) the study of the NMHC temporal characteristics and the determination of the factors controlling their variability; and (3) the investigation of the impact of traffic and residential heating on NMHC levels which are among the most important sources of air pollution in Athens, especially during the “economic crisis” period that was characterized by an important decline of industrial activity (Vrekoussis et al., 2013).
2.1 Sampling site
Measurements were conducted from 16 October 2015 to 15 February 2016, at the urban background station of the National Observatory of Athens (NOA, 37.97∘ N, 23.72∘ E, 105 m a.s.l and about 50 m above the mean city level) at Thissio; this site is considered to be a receptor of pollution plumes of different origins (Paraskevopoulou et al., 2015). The station is located in the historical center of Athens, on top of a hill (Lofos Nimfon), and is surrounded by a pedestrian zone, a residential area and the Filopappou (108 m a.s.l) and Acropolis hills (150 m a.s.l), which are located 500 and 800 m away, respectively (Fig. 1). More information about the morphology, meteorology and dominant transport patterns in Athens can be found in Kanakidou et al. (2011), Melas et al. (1998) and references therein.
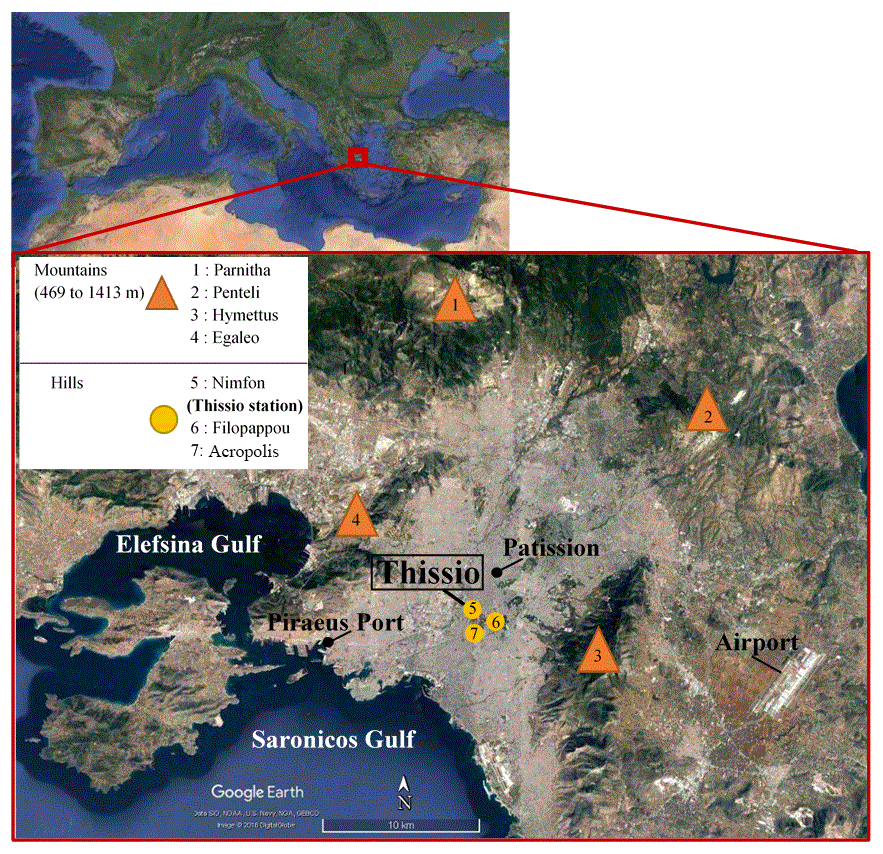
Figure 1Map of the greater Athens area. The four mountains listed in the legend define the borders of the study area.
2.2 Online NMHC measurements
Two portable gas chromatographs equipped with respective flame ionization detectors (GC-FID; Chromatotec, Saint Antoine, France) were used for NMHC measurements in Athens. Specifically, airmoVOC C2–C6 (during the whole period, from October 2015 to February 2016) and airmoVOC C6–C12 Chromatrap GC (from mid-January until mid-February 2016) analyzers were used for the determination of C2–C6 and C6–C12 NMHCs, respectively. These instruments collected ambient air through collocated inlets on the rooftop of the station, 4 m above ground. The C2–C6 NMHC analyzer was set to sample ambient air on a 10 min basis followed by an analysis time of 20 min, while the C6–C12 NMHC analyzer sampled on a 20 min basis with an analysis time of 20 min and a total cycle time of 30 min (sampling and analysis). Therefore, the synchronized monitoring was performed with an overall 30 min time resolution, for both analyzers.
For the airmoVOC C2–C6 analyzer, 189 mL of air was drawn through a 0.315 cm diameter, 6 m-long stainless-steel line with a filter pore size of 4 µm at the sampling inlet, and a flow rate of 18.9 mL min−1. Once sampled, ambient air was passed through a Nafion dryer (activated by gas nitrogen) to reduce the water content. Hydrocarbons were then pre-concentrated at −9 ∘C (Peltier cooling system) on a 2.25 mm internal diameter, 8 cm-long glass trap containing the following adsorbents: Carboxen 1000 (50 mg), Carbopack B (10 mg) and Carbotrap C (10 mg) all from Supelco Analytical, Bellefonte, PA, USA. Next, the trap was heated rapidly to 220 ∘C for 4 min and the pre-concentrated VOCs were thermally desorbed onto a PLOT column (Restek Corp., Bellefonte, PA, USA, Al2O3∕Na2SO4; 25 m×0.53 mm, 10 mm film thickness). One minute prior to the analysis, the oven temperature was raised from 36 to 38 ∘C, followed by a constant heating rate of 15 ∘C min−1 that reached 200 ∘C by the end of the analysis. Details regarding the equipment technique and performance, as well as the estimation of the uncertainty, are provided by Gros et al. (2011). The detection limit is in the range of 0.02 ppb (propene, n-pentane) to 0.05 ppb (propane), while for ethane and ethylene it is 0.1 ppb.
The airmoVOC C6–C12 analyzer collected 900 mL of air through a 0.315 cm diameter, 6 m-long stainless-steel line with a filter pore size of 4 µm at the sampling inlet, and a flow rate of 45 mL min−1. The hydrocarbons were pre-concentrated at ambient temperature on a glass trap containing the adsorbent Carbotrap C. The trap was then heated to 380 ∘C over 2 min to desorb the pre-concentrated VOCs into a separation column (MXT30CE; 30 m×0.28 mm, 1 mm film thickness). With 1 min delay, the oven temperature was raised from 36 to 50 ∘C at a rate of 2 ∘C min−1, followed by a second heating of 10 ∘C min−1 up to 80 ∘C. Finally, at a constant heating rate of 15 ∘C min−1 the temperature reached 200 ∘C and remained there until the end of the analysis. In the present work, toluene, ethylbenzene, m-/p-xylenes and o-xylene (TEX) will be used from the GC C6–C12 data series. The uncertainty of the instrument is less than 20 %, and the detection limit of the BTEX is 0.03 ppb.
Simultaneous calibrations and identification of the compounds were performed by a certified National Physical Laboratory (NPL) standard NMHC mixture (∼4 ppb) containing ethane, ethylene, propane, propene, i-butane, n-butane, acetylene, i-pentane, n-pentane, isoprene, benzene and 15 additional hydrocarbons.
2.3 Auxiliary measurements
Real-time monitoring of carbon monoxide (CO), black carbon (BC) and nitrogen oxides (NOx = NO and NO2) was also conducted during the study period. For CO and NOx measurements, Horiba 360 series gas analyzers with a 1 min resolution were used and were calibrated with certified standards. A seven-wavelength AE33 Aethalometer (1 min resolution; Magee Scientific) was operated for the measurement of BC, and its fractions associated with fossil fuel and wood burning (BCff and BCwb, respectively) were derived automatically by the instrument software. Meteorological data were provided by the NOA meteorological station at Thissio.
2.4 Street canyon measurements
To identify the NMHC fingerprint of traffic emissions, NMHC measurements were conducted at a monitoring station belonging to the air quality agency of Athens from the 22 to 24 February 2017. The station is located in a street canyon in downtown Athens which is subject to heavy traffic and frequent traffic jams (Patission street; 37.99∘ N, 23.73∘ E). Samples were collected every hour during the morning rush hour from 06:55 to 10:15 LT (LT = UTC+2), in 6 L stainless steel–silonite canisters. The sampling method for ambient air is described in detail elsewhere (Sauvage et al., 2009). Before the analysis, the cylinders were pressurized by adding a known amount of zero air which resulted in the sample being diluted by a factor of 2. Afterwards each canister was connected to the GC-FID system using a Teflon polytetrafluoroethylene sampling line and analyzed using the method described in Sect. 2.2. Before sampling, the canisters were cleaned by filling them up with zero air and re-evacuating them, which was done at least three times. The content of the cylinders was then analyzed using the GC-FID system to verify the efficiency of the cleaning procedure. The canisters were evacuated a few days prior to the analysis and were analyzed a maximum of 1 day after sampling.
3.1 Temporal variability of NMHCs
Figure 2 presents the temporal variability of selected NMHCs for five major groups of compounds: ethane and n-butane (for saturated hydrocarbons), propene and ethylene (for alkenes), acetylene (for alkynes), benzene and toluene (for aromatics) and isoprene (for potential biogenic compounds). Other measured NMHCs are presented in Fig. S1 in the Supplement. During the study period, the data availability (in comparison with the maximum potential data availability) for all C2–C6 NMHCs was higher than 87 %. Most of the data for isoprene were below the limit of detection due to the low vegetation activity during this period of the year (Fuentes et al., 2000; Guenther et al., 1995). Moreover, the significant nighttime levels (above 300 ppt in some cases) could be indicative of non-vegetation sources, like traffic or domestic wood burning (Borbon et al., 2001, 2003; Gaeggeler et al., 2008; Kaltsonoudis et al., 2016). However, due to the low data coverage it is not possible to determine an accurate diurnal variability for this compound.
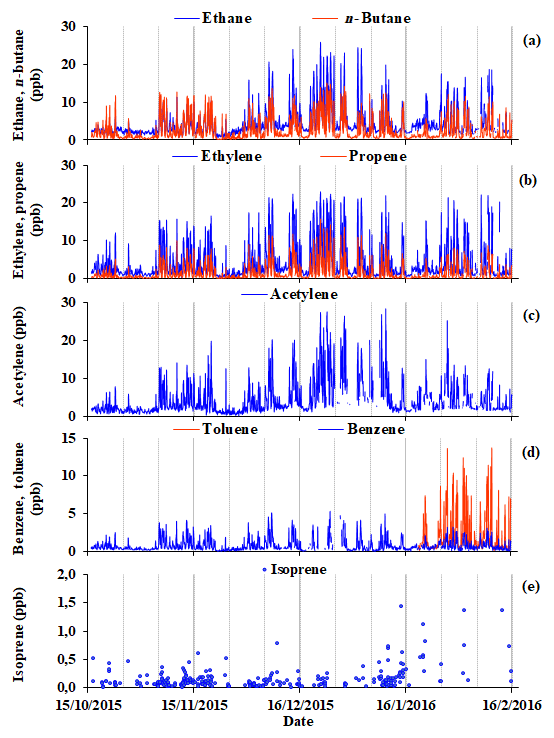
Figure 2Temporal variability of (a) ethane and n-butane, (b) ethylene and propene, (c) acetylene, (d) benzene and toluene and (e) isoprene, based on hourly averaged levels for the period from 16 October 2015 to 15 February 2016, at the NOA urban background site in Thissio, downtown Athens.
The majority of the compounds showed a remarkable day-to-day variability throughout the study period with levels increasing by up to factor of 4, from autumn (October–November) towards winter (December–February; Figs. 2 and S1). The highest values observed for ethane and ethylene mostly ranged between 26 and 23 ppb, and were encountered in wintertime. For these compounds, the lowest values were above 0.3 ppb for the whole period. During the intensive 4-month measurement period, toluene exceeded 10 ppb, while benzene was below 6 ppb. Benzene is the only NMHC included in the European air quality standards due to its possible adverse human health effects (IARC, 2012).
In Table 1, the mean values of the measurements of this study are compared with those reported in the existing literature for Athens and other selected areas. The comparison with published data for the GAA, indicates an apparent decrease by a factor of 2 to 6 for the majority of the species lying above C4 (taking the case of “Ancient Agora” urban area in the close vicinity of the Thissio station as a reference). This decreasing trend is in agreement with the decrease in primary pollutants, such as CO, SO2, already reported by Kalabokas et al. (1999) and Gratsea et al. (2017), due to the air quality measures taken by the Greek government and the economic recession (since 2012). Apart from changes in emission sources and source strength over the last 20 years, differences in sampling period (summer versus winter) and analytical resolution (samples collected in the morning compared to continuously averaged levels) should be considered, which renders the direct comparison between present and past measurements quite difficult regarding the overall evaluation of the NMHC decrease. However, in order to better investigate this observed decreasing trend and compare these results with past measurements, enhancement ratios (ppb∕ppb) have been calculated for i-pentane, benzene, toluene, ethylbenzene and o-xylene to NOx (sum of NO and NO2), following the approach of Kourtidis et al. (1999); this was undertaken using the measurements performed in the street canyon (Patission) and presented in Table 2. In short, the enhancement ratios are the slopes of the x–y plots of the selected NMHC (in ppb) to NOx (or CO, both in ppb), for which morning concentrations (07:00 to 10:00 LT) at wind speeds lower than 2 m s−1 from the SSW–SW (206 to 237∘) were used. The NOx and CO data for the Patission site are provided by the Hellenic Ministry of Environment & Energy, Department of Air Quality. Additionally, the same enhancement ratios were calculated for Thissio station for concentrations associated with wind speeds lower than 2 m s−1 (no distinction regarding wind direction), which maximized the local influence. Since the enhancement ratios are calculated during the traffic rush hours, it is assumed that they are only representative of traffic emissions. Both Thissio station and Patission street canyon demonstrate similar enhancement ratios with differences in the order of 15 %–30 % and 20 %–35 % relative to NOx and CO, respectively, and large differences compared to previously reported values. Enhancement ratios for i-pentane, toluene, ethylbenzene and o-xylene to NOx for the same station (Patission) show values which are lower by a factor of 6±1 compared to those reported in Kourtidis et al. (1999), whereas a factor of 12 decrease is observed for benzene. The same stands for the present enhancement ratios of the selected NMHCs to CO with a decrease of 2 to 5 times compared to previously reported values. The lower enhancement ratios reveal the strong impact of the air quality measures regarding VOC emissions, while the high difference in the benzene enhancement ratio is a direct outcome of Directive 2000/69/CE (now Directive 2008/50/EC) of the European Union for the reduction of this compound, especially in fuels.
Table 1Comparison of mean NMHC levels between this study and previously published works in Athens, Greece, and other Mediterranean or European sites. Information regarding the analysis or sampling techniques and data resolution are included when available. The number of measurementsa made for each compound determined in the current samples is included below the table.
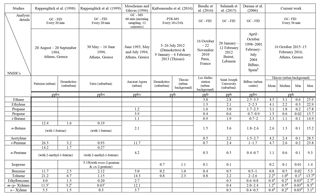
a ethane N=2848, ethylene N=2859, propane N=2861, propene N=2842, i-Butane N=2876, n-butane N=2879, acetylene N=2565, i-pentane N=2874, n-pentane N=2859, isoprene N=264, benzene N=2683, toluene N=637. b Range estimated from Fig. 1, included in Durana et al. (2006). c Sum of the reported mean value for m-xylene and p-xylene. d Only from 21 January to 15 February 2016.
Beirut, located in the eastern Mediterranean Basin (approximately 200 km SE of Greece, 230 m a.s.l.), has a population of 2 million inhabitants and a typical Mediterranean climate with mild winters and hot summers (Salameh et al., 2015). Bilbao, in comparison, is an urban and industrial city with 400 000 inhabitants in northern Spain, located along a river delta in a SE–NW direction, with two mountain ranges in parallel to the river (Ibarra-Berastegi et al., 2008). Due to their location, both cities experience intense sea breeze cycles. The NMHC levels observed in Athens are higher by a factor of approximately 2 for ethylene, propene, acetylene and pentanes compared to these two cities and up to 3.5 for isopentane in comparison to Bilbao. Exceptions to this trend are propane, butanes and toluene for Beirut and n-butane, benzene and toluene for Bilbao, which are comparable to Athens. NMHC levels are also compared with those obtained in Paris, a European megacity with more than 10 million inhabitants that experiences relatively mild winters and warm summers. Again, the observed levels in Athens are significantly higher (almost 2 to 8 times) compared to those reported for Paris (Baudic et al., 2016), with the most important differences concerning acetylene and i-pentane (which are factors of 8.4 and 6.7 higher in Athens, respectively, Table 1).
Table 2Enhancement ratios of NMHC to NOx (ppb∕ppb) and to CO (ppb∕ppb), calculated from the present dataset for Thissio station and the street canyon measurements (Patission station) for the traffic rush hour periods. The enhancement ratios presented in the third and sixth column are reported in Kourtidis et al. (1999) and were calculated for the same station in the street canyon.
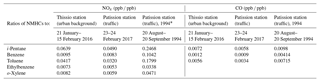
* The NMHC-to-NOx enhancement ratios of Kourtidis et al. (1999) given in w∕w (weight/weight) were converted into ppb∕ppb by dividing them by the ratio of the molecular weight of the NMHC to the molecular weight of NOx (equal to 31.6 according to Kourtidis et al., 1999).
According to Fig. 2, a common pattern for all NMHC concentrations is their gradual increase from October to December, which reflects the transition from a warmer period to a colder one. This is better illustrated in Fig. 3, which depicts the monthly median concentration for every NMHC presented in Fig. 2. The increase in NMHC levels during the cold period could be explained by the respective increase in their lifetime due to less photochemistry and the contributions from additional sources, such as heating. However, the role of atmospheric dynamics should not be neglected, as the decrease in the height of the planetary boundary layer (PBL) could also trigger the observed wintertime enhancement of NMHC levels. Nevertheless, according to Alexiou et al. (2018) the mean wintertime decrease of the PBL compared to autumn is in the range of 20 % for both day and night periods; thus, the PBL height is likely not the only factor determining the enhancement of the NMHC levels observed during wintertime. Furthermore, according to Kassomenos et al. (1995) the day–night difference of the PBL is more pronounced during summer. Thus, the nighttime accumulation of pollutants during winter relative to summer essentially highlights the impact of additional emission sources. Meteorological conditions such as wind speed and direction also have to be considered, and their respective role will be discussed in the following.
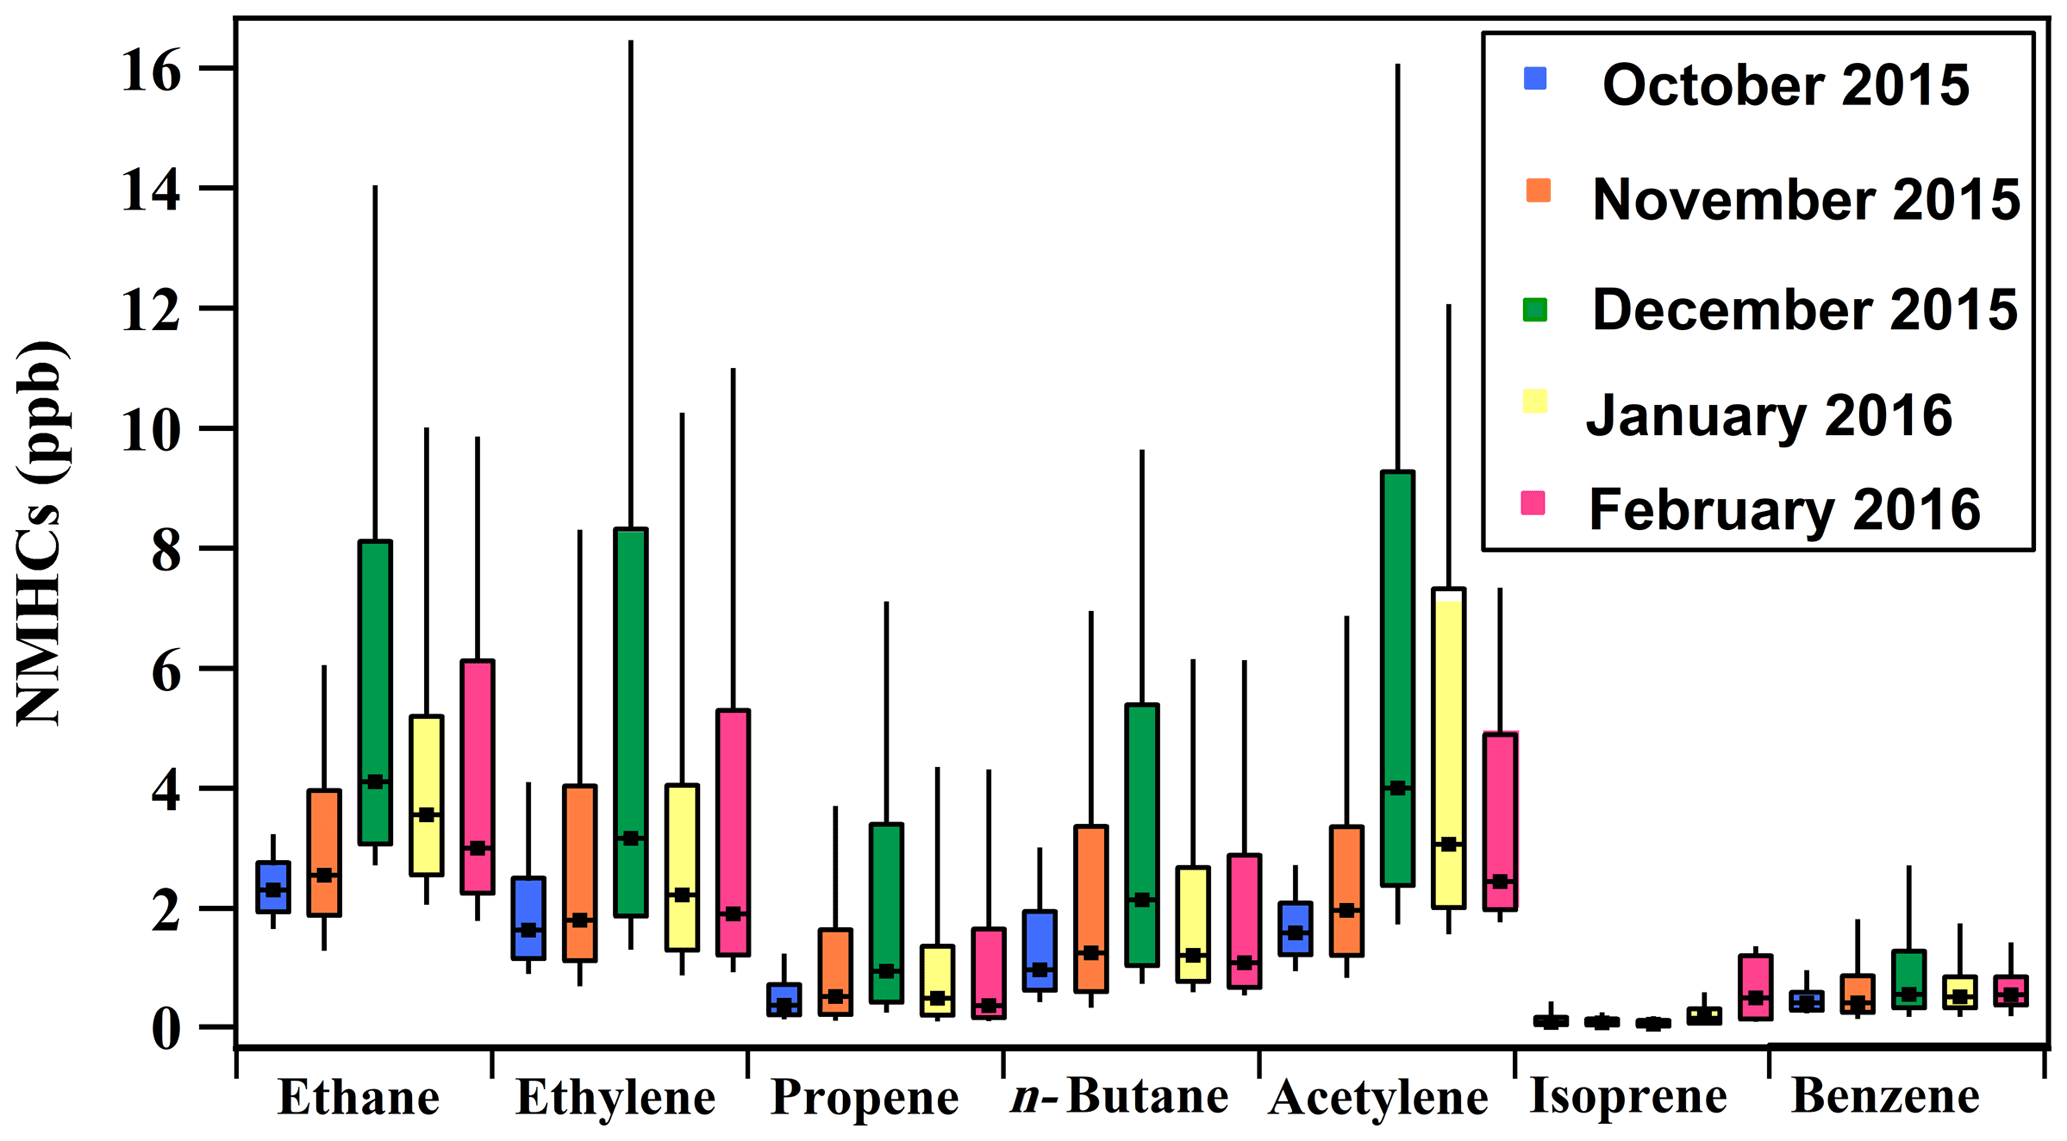
Figure 3Monthly box plots for ethane, ethylene, propene, n-butane, acetylene, isoprene and benzene. The black dots represent the median values and the boxes shows the interquartile range. The bottom and the top of the boxes depict the first and third quartiles (i.e., Q1 and Q3). The whiskers correspond to the first and the ninth deciles (i.e., D1 and D9).
3.2 Diurnal variability of NMHCs
During the whole monitoring period, all hydrocarbons demonstrated a pronounced bimodal diurnal pattern (Figs. 4 and S2). A morning peak was observed that lasted from 07:00 to 10:00 LT, followed by a second peak before midnight. The amplitude of both peaks gradually increases from October to wintertime by a factor of 3 to 6 and closely follows that of carbon monoxide (CO), BC and its fractions associated with wood burning (BCwb) and fossil fuel combustion (BCff) (Fig. 4). As was noted in Gratsea et al. (2017), the morning maximum of CO is attributed to morning traffic, while the winter nighttime increase is attributed to additional sources such as domestic heating (fossil fuel or wood burning). Although the amplitude of both CO peaks (morning and night) is similar (with the exception of December), the duration of the night peak is at least a factor of 2 larger, which could imply that heating impacts the air quality during wintertime. Moreover, nighttime emissions occur in a shallower boundary layer relative to midday emissions, resulting in the accumulation of pollutants (Alexiou et al., 2018). These observations are indicative of the contribution of traffic and heating to NMHC levels. By comparing the NMHC diurnal variability with that of BC, as well as its fractions associated with wood burning (BCwb) and fossil fuel combustion (BCff), it is deduced that the morning peak can mainly be attributed to traffic, and the late evening peak to traffic and heating from the combined use of heavy oil and wood burning.
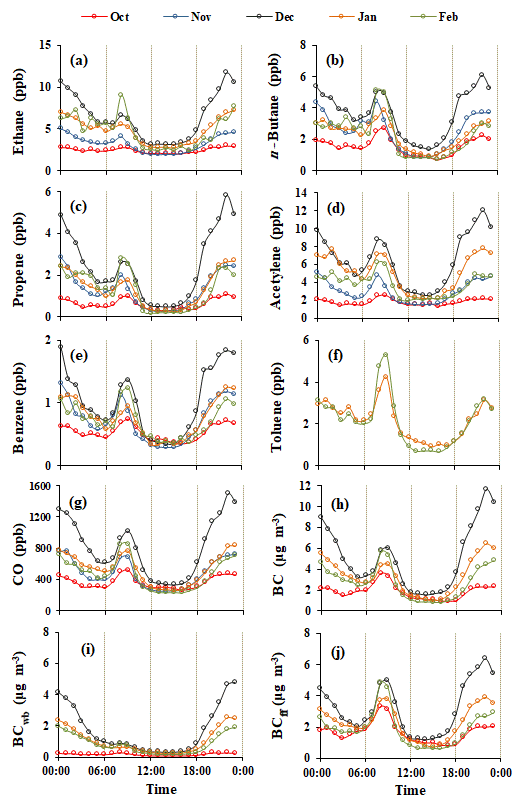
Figure 4Monthly diurnal variability of (a) ethane, (b) n-butane, (c) propene, (d) acetylene, (e) benzene, (f) toluene, (g) CO, (h) BC, (i) BCwb and (j) BCff based on hourly averaged values.
3.3 The role of meteorology on NMHC levels
Once emitted in the atmosphere, NMHCs mainly react with OH and NO3 radicals during daytime and nighttime, respectively, and with ozone throughout the day (Crutzen, 1995; Atkinson, 2000); the role of Cl can also not be omitted, especially for coastal areas (Arsene et al., 2007). Still, in addition to chemistry, many other factors, such as the strength of the emission sources and the atmospheric dynamics (meteorology and boundary layer evolution), determine NMHC abundance and diurnal variability. To investigate the role of wind speed and wind direction, the dependence of n-butane, acetylene and benzene, selected as representative of alkanes, alkynes and aromatics, against wind speed and direction, is depicted in Figs. 5 and 6 respectively (Fig. S3 and S4 include the rest of the compounds). For all of the NMHCs studied, the highest concentration occurred at low wind speed conditions (<3 m s−1) which reflects the critical role of local sources versus long-range transport. On a monthly basis, the NMHC dependence on wind speed remained the same for the total period examined (Fig. S5).
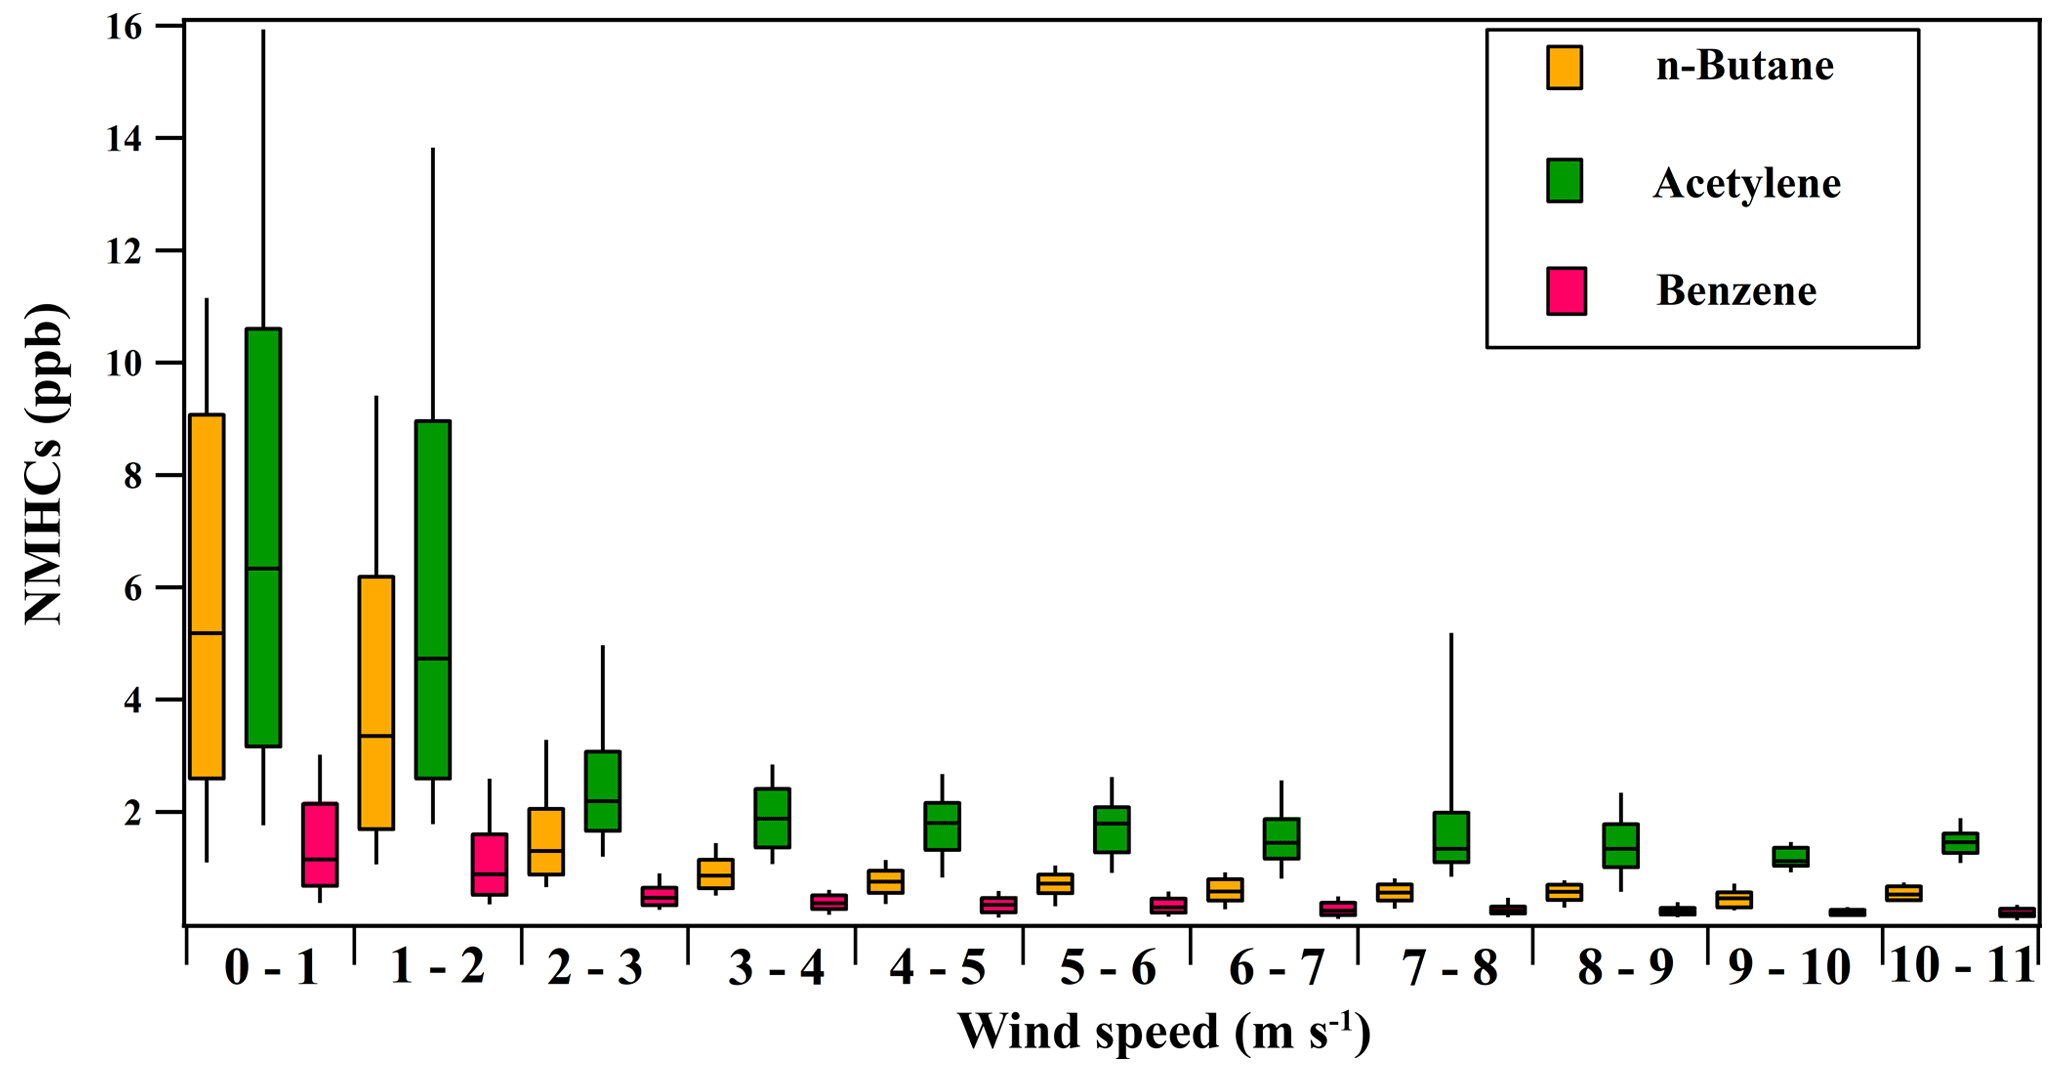
Figure 5Box plots for (a) n-butane, (b) acetylene and (c) benzene relative to wind speed for the period from 16 October 2015 to 15 February 2016. The black lines represent the median value and the boxes show the interquartile range. The bottoms and the tops of the boxes depict the respective first and third quartiles (i.e., Q1 and Q3). The whiskers correspond to the first and the ninth deciles (i.e., D1 and D9). The range of each wind speed bin is depicted on the x axis.
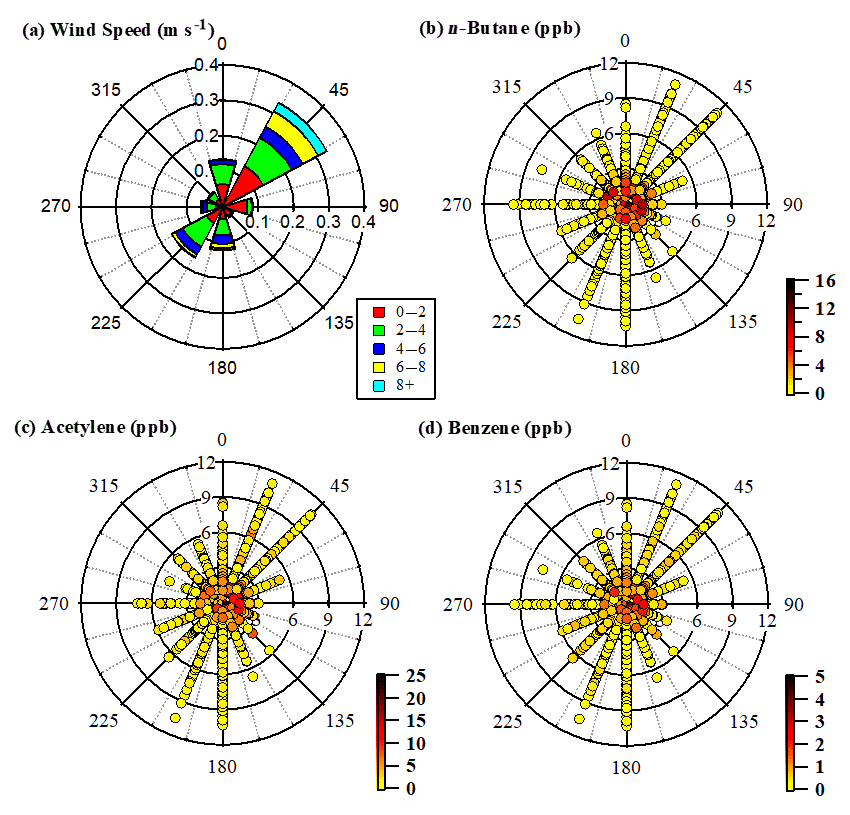
Figure 6Wind rose (a) and concentration roses of (b) n-butane, (c) acetylene and (d) benzene for the period from 16 October 2015 to 15 February 2016.
To investigate the impact of wind direction on NMHC levels, Fig. 6 presents the distribution of the wind sector frequency of occurrence during the sampling period and that of wind speed per sector. In addition, the variability of n-butane, acetylene and benzene levels as a function of wind direction is also depicted. Enhanced levels of NMHCs are found under the influence of air masses from all directions, especially at low wind speeds. During the sampling period, the NE sector, associated with relative strong winds (), was the most frequent sector, resulting in moderate levels of NMHCs. Overall, a similar distribution was found for all NMHCs, indicating moderate to higher values in the N–NE–E–SE sector, and lower levels in the NW–W–SW sector, the latter associated with high wind speeds. The influence of the N–SE sector on the enhanced NMHCs levels is probably related to the northern suburbs of the GAA, which are characterized by an increased number of fireplaces and higher living standards that allow for the combined use of heating oil in central heating systems and wood in fireplaces and/or woodstoves. The impact of the N–ESE sector on NMHC levels can be also seen when comparing the concentrations of the morning (07:00–09:00) and night (21:00–23:00) peaks in October and December (Fig. S6). The probability of wind from the N–ESE is similar for both months, but significantly higher concentrations are observed at nighttime in December due to low wind speeds (<2 m s−1) from the N–NE sector.
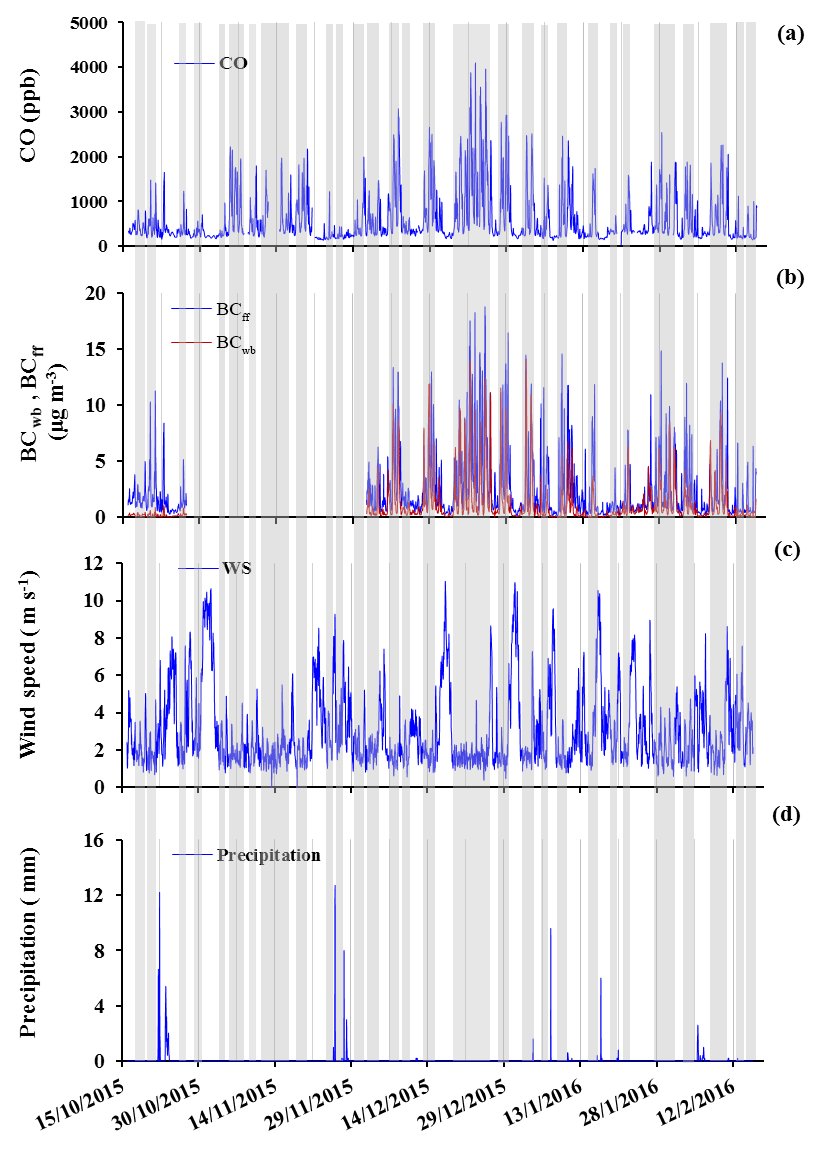
Figure 7Temporal variability of (a) CO, (b) BCwb and BCff fractions, (c) wind speed and (d) precipitation for the experimental period. Grey frames correspond to smog periods (SPs), while the remaining frames represent non-smog periods (nSPs).
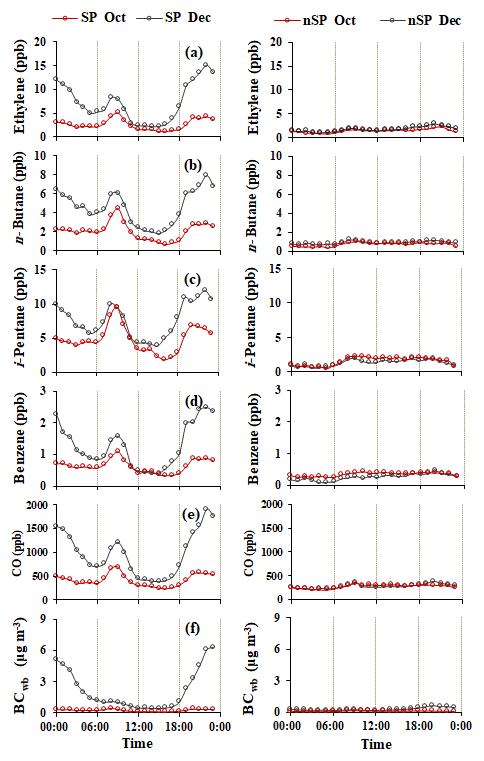
Figure 8Diurnal patterns of (a) ethylene, (b) n-butane, (c) i-pentane, (d) benzene, (e) CO and (f) BCwb during the SPs (left column) and nSPs (right column) identified during October 2015 (red) and December 2015 (black), respectively. Note: SP are defined by wind speeds lower than 3 m s−1 and the absence of rainfall, while nSP are defined by winds speeds higher than 3 m s−1.
The ambient temperature is another parameter which can influence NMHC levels, as high temperatures favor the evaporation of low volatility hydrocarbons and also trigger the production of biogenic compounds, whereas lower temperatures can potentially trigger the emission of NMHCs from increased heating demand, in addition to other tracers (Athanasopoulou et al., 2017). The average monthly temperatures varied from 18 ∘C in October and November to 10–13 ∘C in December and late winter. By examining NMHCs against temperature (Fig. S7), a clear tendency is not evident, although the highest levels are observed at lower temperatures.
3.4 Identification of NMHC emission sources with emphasis on traffic and heating
3.4.1 Interspecies correlation
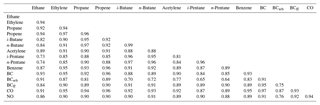
Table 3 shows the interspecies correlation of NMHCs for the total measurement period. All NMHCs were well correlated (R2>0.81), with the exception of isoprene which as previously noted, only had few data above the limit of detection and was therefore excluded from Table 3. The excellent correlation of toluene with ethylbenzene, m-/p-xylenes and o-xylene (R2 from 0.92 to 0.93) during the common measurement period (from mid-January until mid-February 2016) should also be noted, as it highlights their common origin. The strong correlation of NMHCs with combustion tracers, such as CO, NO and BC, could also indicate common emission sources and variability. The deconvolution of BC into its fossil fuel and biomass burning fractions enables further classification of NMHCs into groups that could possibly be emitted by these two distinct sources. The stronger correlation (R2>0.84) of the hydrocarbons with BCff compared to BCwb (R2>0.64) could imply stronger emission of NMHCs from fossil fuel combustion processes relative to wood burning. Finally, no change in the correlation coefficients is observed when datasets are separated into daytime (06:00–18:00) and nighttime (18:00–06:00) intervals. However, the above analysis could only give a rough idea regarding the sources impacting NMHCs levels. A more precise picture could emerge via a comparison with source profiles, and a discussion on this topic follows in the paragraph below.
Table 3Correlation coefficients (R2) of NMHCs and major gaseous pollutants for the total period of measurements (all significant at p<0.01).
3.4.2 Impact of various sources on NMHC levels
To identify periods with differentiated impacts from different pollution sources (with an emphasis on traffic and heating), the methodology described by Fourtziou et al. (2017) was applied. The criteria for this separation were that the wind speed did / did not exceed a threshold value of 3 m s−1 (light breeze conditions) and precipitation was present / absent (on / off criterion). The role of wind speed was clearly visible in Sect. 3.3 (Fig. 5). Based on these criteria, the first group (non-shaded in Fig. 7) which corresponded to higher wind speeds and thus the more efficient dispersion of emitted pollutants (ventilation) as well as incidents of rain was denominated non-smog periods (nSPs). The second group (shaded area in Fig. 7) referred to lower wind speeds, favoring the accumulation of high pollution loads within the mixing layer, and is henceforth referred to as smog periods (SPs). The frequency of SPs and nSPs was 65 % and 35 %, respectively. Note that the word “smog” is used as a synonym to highlight cases of relatively high air pollution, as also indicated by the high levels of CO and BC encountered during the SPs (Fig. 7).

Figure 9% Mass contribution of the measured NMHCs during the morning peak (07:00–10:00 LT), median values in Thissio and mean values at Patission monitoring station.
The diurnal variability of all compounds was investigated separately for two distinct months, October and December, representative periods of non-heating and heating activities, respectively (Figs. 8 and S8). Note that SPs represent 55 % of the time considered in October and 73 % in December. According to previous findings (Paraskevopoulou et al., 2015; Kaltsonoudis et al., 2016; Fourtziou et al., 2017; Gratsea et al., 2017) wood burning for domestic heating has gained a marked role as a wintertime emission source in Greece over the last few years. Since wood burning is reported as emission source of specific organic compounds such as ethane, ethylene, acetylene, benzene, methanol, acetaldehyde and acetonitrile (Baudic et al., 2016; Gaeggeler et al., 2008; Gustafson et al., 2007; Hellén et al., 2008; Kaltsonoudis et al., 2016), it can be safely considered as a possible factor contributing to the wintertime increase of NMHC levels in the GAA. Thus, the two selected months are expected to have different source profiles. October, without or very limited heating demand, was used as a reference period, while December in south-central Greece is traditionally the beginning of the heating period. The low values of BCwb recorded in October, even during the SPs, support the methodology chosen for the separation (Fig. 8).
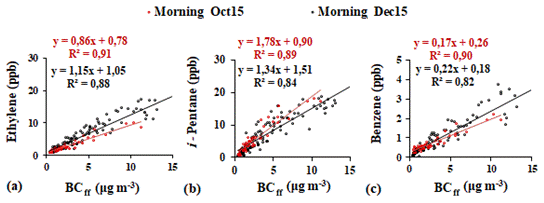
Figure 10Regressions between ethylene, i-pentane and benzene versus BCff (a)–(c) for the morning periods (07:00–10:00 LT) in October and December 2015.
The levels of all measured NMHCs were significantly higher in December than in October for the SPs (Figs. 8 and S8). The most striking difference is related to the nighttime peak, while during the midday period the difference is minimal. For all compounds examined in this work, the nighttime peak in December (SP) was 2 to 6 times higher compared with that in October (SP) with the highest differences found for ethane, ethylene, propene and acetylene. Conversely, the December to October ratio during the midday period ranged between 2.6 (for propene and acetylene) and 0.9 (for benzene). It is worth noting the levels of NMHCs during the traffic related morning peak. Although higher mean levels were observed in December, the amplitude of the morning peak is similar in both of the months examined, representing no important change in the traffic source between the heating and non-heating periods. In contrast, during the nSPs in October and December NMHC levels were equal (Figs. 8 and S8). Furthermore, the concentrations of all compounds during nSPs were very low – even lower than the minimum values observed at midday during the SPs of the same months. Accordingly, the diurnal variability of all investigated NMHCs was less pronounced compared to the SPs with a slight increase during the night in December, which could be attributed to a background contribution from heating sources. In Sect. 3.4.3 the origin of the morning and nighttime peaks related to NMHCs will be further investigated.
3.4.3 Impact of sources on morning and night peaks of NMHCs
Morning peak
As discussed in Sect. 3.2, the morning NMHC peak (07:00–10:00 LT) was mainly attributed to traffic. Fig. 9 presents the profile of this peak (percent mass contribution of the measured NMHCs), during January and February SP days when toluene, ethylbenzene, m-/p-xylenes and o-xylene data were also available. Additionally, in the same figure the morning profile obtained during the 2-day measurement campaign conducted in the street canyon in central Athens (Patission monitoring station) is also reported. Details regarding the calculations of the morning profile for the two sites are provided in Sect. S2. The Patission profile reflects all types of traffic-related emissions due to the combination of the high number of vehicles and buses driving on this street, the frequent traffic jam conditions, the variety of fuel types (gas, oil, diesel, natural gas), vehicles ages, maintenance etc.
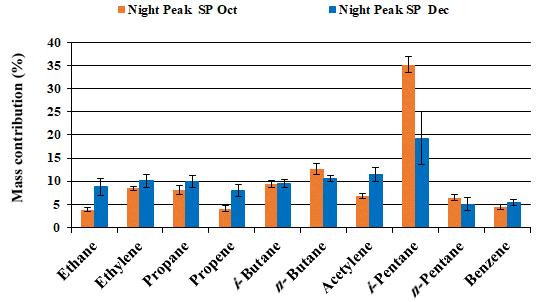
Figure 11The percent mass contribution of the measured NMHCs during the nighttime enhancement period (18:00–05:00 LT) for the SP in October (orange) and the SP in December (black).
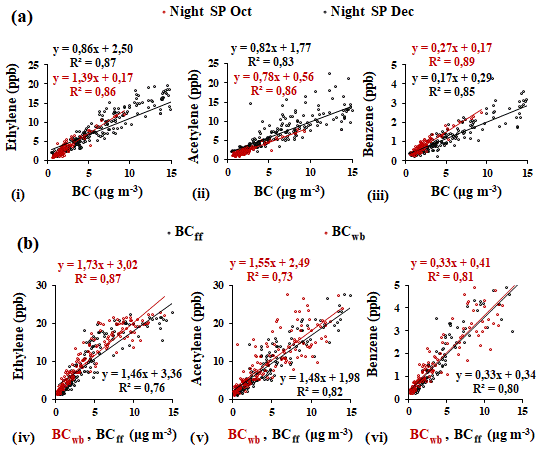
Figure 12Regressions between ethylene, acetylene and benzene (a) against BC (i–iii) for the nighttime (18:00–05:00 LT) SPs in October and December 2015 and (b) against BCwb (red) and BCff (black) for the nighttime (22:00–04:00 LT) SP in December 2015.
The two morning profiles, although performed at sites with different traffic impacts, agree quite well (R2>0.98). Iso-pentane, toluene and m-/p-xylenes are the three main compounds that contribute to the morning profiles, accounting for about 50 % of the total measured NMHCs at both locations, followed by n- and i-butane and ethylene, which account for almost 21 %. Differences between the two morning profiles regarding these five main species are weak (less than a factor of 1.2). However, the morning profile at Thissio is the mean of a whole month compared to the 2-day campaign at Patission which could explain the small differences between the two profiles. In addition, a comparison with a tunnel study in Athens is made in the Supplement (Sect. S2a.), in which similarities are seen for most of the main compounds (i-pentane, m-/p-xylenes, ethylbenzene, o-xylene, benzene, n-pentane, i-butane, propene and ethane), with the exception of acetylene and toluene that are a factor of 4 and 1.5 lower, respectively. The similarity between the Thissio and Patission morning profiles and their difference from the Athens tunnel profile probably indicates the importance of the fuel type used. The latter is also observed in recent works (Ait-Helal et al., 2015; Q. Zhang et al., 2018; Y. Zhang et al., 2018), where important differences have been reported between tunnel measurements, and have been attributed to various car-fleet typologies (type of vehicles and fuels). In our case there is a possibility that the car fleet in the tunnel is not representative of the GAA, as the existing tolls reduce the use of the tunnel due to financial constrictions. Furthermore, measurements are performed during the noon period when the traffic density is relatively low compared to the morning peak. In any case, the prevalence of i-pentane and toluene in all profiles indicates the continuing dominance of gasoline powered cars and evaporative losses. The importance of evaporative losses can be seen in Figs. S11 and S12 where the ratios of butanes and pentanes-to-(C2–C5) alkanes (percent) versus the temperature are examined, respectively. Taking the positive dependence of the two ratios into account, especially that of pentanes, to temperature, we can assume that fuel evaporative losses are also an important source of NMHCs. These observations are in agreement with the general behavior of the temperature dependency reported in Kourtidis et al. (1999) (Fig. S13 and Sect. S3), who performed an investigation on the dependence of the fractionation of NMHCs in evaporative emissions on temperature in Athens. Although the periods examined differ regarding ambient temperature (winter is colder than autumn), the exponential curve fitting of both datasets was similar. In addition, the abovementioned results could indicate why the Athens tunnel results from May differ from Patission and Thissio winter morning profiles. Moreover, the higher values of propane and butanes that are depicted in the morning peaks at the urban sites relative to the tunnel measurement, reflect the increased number of LPG powered vehicles in Athens in addition to natural gas-powered buses (Fameli and Assimakopoulos, 2016). This is further highlighted when the monthly variation of i-butane relative to n-butane is examined (Fig. S14). The two compounds have a linear relationship with no significant temporal differences in the slopes between the various months. Furthermore, the regression is similar to that derived from the Patission measurements, which enhances our assumption that butanes emissions are traffic related. Moreover, the relation between the high levels of C2–C4 alkanes and the number of LPG-powered cars has also been highlighted in other tunnel studies (Ait-Helal et al., 2015; Q. Zhang et al., 2018).
To obtain a better idea of the variability of the traffic source during the study period, the variability of selected NMHCs (ethylene, i-pentane and benzene) relative to BCff (the latter used as traffic source tracer) was also plotted for October and December (Fig. 10). Significant correlations were revealed with slopes remaining almost stable (within 30 %) during both months. This indicates similar emission ratios throughout the study period, and most likely an equal contribution from traffic.
Nighttime enhancement period
During nighttime both BCff and BCwb were maximized (e.g., Figs. 4 and 8), denoting a significant contribution from both fossil fuel and wood burning (the contribution of the latter was more evident during winter). Figure 11 presents the NMHC profile of the nighttime enhancement period for October and December SP nights (details for the calculations are given in Sect. S4 in the Supplement). As previously discussed, traffic is expected to be the main source of NMHCs during nighttime in October, whereas heating competes with traffic during December. When these two profiles are compared (Fig. 11), a statistically significant difference at p<0.01 confidence is obvious, with a smaller contribution from i-pentane (traffic source contributor) during December. In addition, enhanced contributions from C2 NMHCs (ethane, ethylene and acetylene) are apparent in December compared with October. These C2 hydrocarbons were reported as important contributors to the wood burning source profile by Baudic et al. (2016) in Paris. Preliminary data from a fireplace experiment (not part of this work) also confirm these findings; these data are also in line with our results reported in Fig. 8 that indicate an impact from wood burning during nighttime in the winter months.
Figure 12a (i–iii) presents the relation of ethylene, acetylene and benzene, the main contributors of the wood burning profile (Baudic et al., 2016), to BC during the nighttime (18:00–05:00 LT) SPs in October and December. During both months, significant correlations were revealed for all examined NMHCs and the slopes remained relatively stable, indicating almost equivalent emission ratios from both traffic and heating sources. To better tackle a possible difference in NMHC emissions from traffic and residential heating, these NMHCs were also plotted against BCwb and BCff during the SPs in December, from 22:00 to 04:00 LT, i.e., the time frame when traffic is quite limited (Fig. 12b, iv–vi). The NMHC slopes versus BCwb are similar when compared to those versus BCff (slight difference for ethylene), with a contribution of BCwb and BCff to BC of 43 % (±10 %) and 55 % (±11 %), respectively, indicating that the NMHCs studied are probably equally produced by wood and fossil fuel burning.
For the first time to our knowledge, time-resolved measurements of 11 non-methane hydrocarbons with two to six carbon atoms (C2–C6 NMHCs) were conducted for several months (mid-October 2015 to mid-February 2016) in the greater Athens area (GAA) by means of an automatic chromatograph, in parallel with the monitoring of major pollutants and meteorological parameters. The temporal variability of the NMHCs presented an increasing trend from October to December, due to changes in the type and strength of sources, and atmospheric dynamics. In comparison with other works, higher concentrations are reported for the majority of the NMHCs, which indicates an air quality issue in Athens. With the exception of isoprene, all NMHCs presented a bimodal diurnal pattern with a morning and a broader nighttime maxima, whereas lower concentrations were observed early in the afternoon. Typical indicators of combustion processes such as CO and BC, with the latter further deconvoluted into BCff and BCwb, presented similar seasonal and diurnal variability relative to the NMHCs, providing the opportunity to investigate their possible emission sources. Thus, the morning maximum, which follows the BCff tendency, was attributed to traffic, while the second peak during nighttime which reached a maximum in December and coincided with those of BCwb and BCff was mainly attributed to heating by both fossil fuel and wood burning.
For a better understanding of the impact of sources on NMHC levels, the study period was further separated into smog periods (SPs) and non-smog periods (nSPs), based on the absence of rainfall and low wind speeds. October and December were chosen for further comparison due to the different temperature conditions and possible sources, taking the previously reported increased wintertime heating demand into account (Athanasopoulou et al., 2017). The comparison of the morning maximum of the NMHC profile during SP days with those obtained in a street canyon in Athens (Patission) further confirms the role of traffic regarding the observed morning NMHC peak. The October and December NMHC SP nighttime profiles depicted differences that are mainly attributed to heating. However, NMHC slopes versus BCwb are similar when compared with those versus BCff (slight difference for ethylene), indicating that NMHCs are probably equally produced by wood and oil fossil fuel burning. An extended dataset of NMHCs and other organic tracers (future long-term measurements) is needed to apportion different sources types on a seasonal basis and quantify their impact on the NMHC levels.
All the data presented in this paper are available upon request. For further information, please contact Eleni Liakakou (liakakou@noa.gr).
The supplement related to this article is available online at: https://doi.org/10.5194/acp-18-16139-2018-supplement.
AP operated the instrument, collected and analyzed samples, processed the dataset and drafted the article. EL contributed to sample collection and provided auxilliary data. BEP provided data for the variables presented in this work. SS, VG, BB, NL, EL, NM and EG designed the study and performed critical revisions of the article including the final approval of the version to be published.
The authors declare that they have no conflict of interest.
This article is part of the special issue “CHemistry and AeRosols Mediterranean EXperiments (ChArMEx) (ACP/AMT inter-journal SI)”. It is not associated with a conference.
Support from CEA, CNRS and the Charmex program is acknowledged.
This study also received financial support from the European community through
the Aerosols, Clouds, and Trace gases Research InfraStructure Network (ACTRIS)
Research Infrastructure Action under the 7th Framework Programme (grant agreement no. 262254). We thank
François Dulac and Eric Hamonou for the successful management of the Charmex program, Dominique Baisnée
and Thierry Leonardis for technical support with the gas chromatographs, and the editor
and the two anonymous reviewers for their comments which greatly improved the
submitted version of the paper. The authors also acknowledge the Hellenic Ministry of
Environment & Energy, Department of Air Quality for access at Patission
station and the use of their database for the purposes of the short intensive
campaign. Attiki Odos is also acknowledged for providing access to the tunnel.
Edited by: Matthias Beekmann
Reviewed by: two anonymous referees
Ait-Helal, W., Beeldens, A., Boonen, E., Borbon, A., Boréave, A., Cazaunau, M., Chen, H., Daële, V., Dupart, Y., Gaimoz, C., Gallus, M., George, C., Grand, N., Grosselin, B., Herrmann, H., Ifang, S., Kurtenbach, R., Maille, M., Marjanovic, I., Mellouki, A., Miet, K., Mothes, F., Poulain, L., Rabe, R., Zapf, P., Kleffmann, J., and Doussin, J.-F.: On-road measurements of NMVOCs and NOx: Determination of light-duty vehicles emission factors from tunnel studies in Brussels city center, Atmos. Environ., 122, 799–807, https://doi.org/10.1016/j.atmosenv.2015.09.066, 2015.
Alexiou, D., Kokkalis, P., Papayannis, A., Rocadenbosch, F., Argyrouli, A., Tsaknakis, G., and Tzanis, C. G.: Planetary boundary layer height variability over Athens, Greece, based on the synergy of Raman and Radiosonde data: Application of the Kalman filter and other techniques, EPJ Web of Conferences, 176, 06007, https://doi.org/10.1051/epjconf/201817606007, 2018.
Arsene, C., Bougiatioti, A., Kanakidou, M., Bonsang, B., and Mihalopoulos, N.: Tropospheric OH and Cl levels deduced from non-methane hydrocarbon measurements in a marine site, Atmos. Chem. Phys., 7, 4661–4673, https://doi.org/10.5194/acp-7-4661-2007, 2007.
Athanasopoulou, E., Speyer, O., Brunner, D., Vogel, H., Vogel, B., Mihalopoulos, N., and Gerasopoulos, E.: Changes in domestic heating fuel use in Greece: effects on atmospheric chemistry and radiation, Atmos. Chem. Phys., 17, 10597–10618, https://doi.org/10.5194/acp-17-10597-2017, 2017.
Atkinson, R.: Atmospheric chemistry of VOCs and NOx, Atmos. Environ., 34, 2063–2101, https://doi.org/10.1016/S1352-2310(99)00460-4, 2000.
Barrefors, G. and Petersson, G.: Volatile hydrocarbons from domestic wood burning, Chemosphere, 30, 1551–1556, https://doi.org/10.1016/0045-6535(95)00048-D, 1995.
Barletta, B., Meinardi, S., Sherwood Rowland, F., Chan, C.-Y., Wang, X., Zou, S., Yin Chan, L., and Blake, D. R.: Volatile organic compounds in 43 Chinese cities, Atmos. Environ., 39, 5979–5990, https://doi.org/10.1016/j.atmosenv.2005.06.029, 2005.
Baudic, A., Gros, V., Sauvage, S., Locoge, N., Sanchez, O., Sarda-Estève, R., Kalogridis, C., Petit, J.-E., Bonnaire, N., Baisnée, D., Favez, O., Albinet, A., Sciare, J., and Bonsang, B.: Seasonal variability and source apportionment of volatile organic compounds (VOCs) in the Paris megacity (France), Atmos. Chem. Phys., 16, 11961–11989, https://doi.org/10.5194/acp-16-11961-2016, 2016.
Borbon, A., Fontaine, H., Veillerot, M., Locoge, N., Galloo, J. C., and Guillermo, R.: An investigation into the traffic-related fraction of isoprene at an urban location, Atmos. Environ., 35, 3749–3760, https://doi.org/10.1016/S1352-2310(01)00170-4, 2001.
Borbon, A., Fontaine, H., Locoge, N., Veillerot, M., and Galloo, J. C.: Developing receptor-oriented methods for non-methane hydrocarbon characterisation in urban air – Part I: source identification, Atmos. Environ., 37, 4051–4064, https://doi.org/10.1016/S1352-2310(03)00525-9, 2003.
Crutzen, P. J.: Ozone in the troposphere, Composition, chemistry, and climate of the atmosphere, in: Composition, Chemistry, and Climate of the Atmosphere, edited by: Singh, H. B., Van Nostrand Reinhold Publ., New York, 349–393, 1995.
Cvitas, T., Gusten, H., Heinrich, G., Klasinc, L., Lalas, D., and Petrakis, M.: Characteristics of summer air pollution during the summer in Athens, Greece, Staub Reinhalt Luft, 45, 297–301, 1985.
Directive 2000/69/EC of 16 November relating to limit values for benzene and carbon monoxide in ambient air, 2000.
Directive 2008/50/EC of the European Parliament and of the Council of 21 May on ambient air quality and cleaner air for Europe, 2008.
Durana, N., Navazo, M., Gómez, M. C., Alonso, L., García, J. A., Ilardia, J. L., Gangoiti, G., and Iza, J.: Long term hourly measurement of 62 non-methane hydrocarbons in an urban area: Main results and contribution of non-traffic sources, Atmos. Environ., 40, 2860–2872, https://doi.org/10.1016/j.atmosenv.2006.01.005, 2006.
European Environmental Agency (EEA): Air quality in Europe – 2016 report (No. 28), available at: https://www.eea.europa.eu/publications/air-quality-in-europe-2016 (last access: 2 October 2017), 2016.
Evtyugina, M., Alves, C., Calvo, A., Nunes, T., Tarelho, L., Duarte, M., Prozil, S. O., Evtuguin, D. V., and Pio, C.: VOC emissions from residential combustion of Southern and mid-European woods, Atmos. Environ., 83, 90–98, https://doi.org/10.1016/j.atmosenv.2013.10.050, 2014.
Fameli, K.-M. and Assimakopoulos, V. D.: The new open Flexible Emission Inventory for Greece and the Greater Athens Area (FEI-GREGAA): Account of pollutant sources and their importance from 2006 to 2012, Atmos. Environ., 137, 17–37, 2016.
Fourtziou, L., Liakakou, E., Stavroulas, I., Theodosi, C., Zarmpas, P., Psiloglou, B., Sciare, J., Maggos, T., Bairachtari, K., Bougiatioti, A., Gerasopoulos, E., Sarda-Estève, R., Bonnaire, N., and Mihalopoulos, N.: Multi-tracer approach to characterize domestic wood burning in Athens (Greece) during wintertime, Atmos. Environ., 148, 89–101, https://doi.org/10.1016/j.atmosenv.2016.10.011, 2017.
Fuentes, J. D., Gu, L., Lerdau, M., Atkinson, R., Baldocchi, D., Bottenheim, J., Ciccioli, P., Lamb, B., Geron, C., and Guenther, A.: Biogenic hydrocarbons in the atmospheric boundary layer: a review, B. Am. Meteorol. Soc., 81, 1537–1575, 2000.
Gaeggeler, K., Prevot, A. S. H., Dommen, J., Legreid, G., Reimann, S., and Baltensperger, U.: Residential wood burning in an Alpine valley as a source for oxygenated volatile organic compounds, hydrocarbons and organic acids, Atmos. Environ., 42, 8278–8287, https://doi.org/10.1016/j.atmosenv.2008.07.038, 2008.
Giakoumi, A., Maggos, T., Michopoulos, J., Helmis, C., and Vasilakos, C.: PM2.5 and volatile organic compounds (VOCs) in ambient air: a focus on the effect of meteorology, Environ. Monit. Assess., 152, 83, https://doi.org/10.1007/s10661-008-0298-2, 2009.
Gratsea, M., Liakakou, E., Mihalopoulos, N., Adamopoulos, A., Tsilibari, E., and Gerasopoulos, E.: The combined effect of reduced fossil fuel consumption and increasing biomass combustion on Athens' air quality, as inferred from long term CO measurements, Sci. Total Environ., 592, 115–123, https://doi.org/10.1016/j.scitotenv.2017.03.045, 2017.
Gros, V., Gaimoz, C., Herrmann, F., Custer, T., Williams, J., Bonsang, B., Sauvage, S., Locoge, N., d'Argouges, O., Sarda-Estève, R., and Sciare, J.: Volatile organic compounds sources in Paris in spring 2007, Part I: qualitative analysis, Environ. Chem., 8, 74–90, https://doi.org/10.1071/EN10068, 2011.
Guenther, A., Hewitt, C. N., Erickson, D., Fall, R., Geron, C., Graedel, T., Harley, P., Klinger, L., Lerdau, M., Mckay, W. A., Pierce, T., Scholes, B., Steinbrecher, R., Tallamraju, R., Taylor, J., and Zimmerman, P.: A global model of natural volatile organic compound emissions, J. Geophys. Res.-Atmos., 100, 8873–8892, https://doi.org/10.1029/94JD02950, 1995.
Gustafson, P., Barregard, L., Strandberg, B., and Sällsten, G.: The impact of domestic wood burning on personal, indoor and outdoor levels of 1,3-butadiene, benzene, formaldehyde and acetaldehyde, J. Environ. Monit., 9, 23–32, https://doi.org/10.1039/B614142K, 2007.
Hellén, H., Hakola, H., Haaparanta, S., Pietarila, H., and Kauhaniemi, M.: Influence of residential wood combustion on local air quality, Sci. Total Environ., 393, 283–290, https://doi.org/10.1016/j.scitotenv.2008.01.019, 2008.
IARC: Chemical Agents and Related Occupations, Monographs on the Evaluation of Carcinogenic Risks to Humans, 100, 249–285, 309–333, available at: http://monographs.iarc.fr/ENG/Monographs/vol100F/mono100F.pdf (last access: 5 October 2017), 2012.
Ibarra-Berastegi, G., Elias, A., Barona, A., Saenz, J., Ezcurra, A., and Diaz de Argandoña, J.: From diagnosis to prognosis for forecasting air pollution using neural networks: Air pollution monitoring in Bilbao, Environ. Model. Softw., 23, 622–637, https://doi.org/10.1016/j.envsoft.2007.09.003, 2008.
Jaimes-Palomera, M., Retama, A., Elias-Castro, G., Neria-Hernández, A., Rivera-Hernández, O., and Velasco, E.: Non-methane hydrocarbons in the atmosphere of Mexico City: Results of the 2012 ozone-season campaign, Atmos. Environ., 132, 258–275, https://doi.org/10.1016/j.atmosenv.2016.02.047, 2016.
Kalabokas, P., Viras, L., and Repapis, C.: Analysis of the 11-year record (1987–1997) of air pollution measurements in Athens, Greece, Part I: Primary air pollutants, Glob. Nest Int. J., 1, 157–168, 1999.
Kaltsonoudis, C., Kostenidou, E., Florou, K., Psichoudaki, M., and Pandis, S. N.: Temporal variability and sources of VOCs in urban areas of the eastern Mediterranean, Atmos. Chem. Phys., 16, 14825–14842, https://doi.org/10.5194/acp-16-14825-2016, 2016.
Kanakidou, M., Mihalopoulos, N., Kindap, T., Im, U., Vrekoussis, M., Gerasopoulos, E., Dermitzaki, E., Unal, A., Koçak, M., Markakis, K., Melas, D., Kouvarakis, G., Youssef, A. F., Richter, A., Hatzianastassiou, N., Hilboll, A., Ebojie, F., Wittrock, F., von Savigny, C., Burrows, J. P., Ladstaetter-Weissenmayer, A., and Moubasher, H.: Megacities as hot spots of air pollution in the East Mediterranean, Atmos. Environ., 45, 1223–1235, https://doi.org/10.1016/j.atmosenv.2010.11.048, 2011.
Kansal, A.: Sources and reactivity of NMHCs and VOCs in the atmosphere: A review, J. Hazard. Mater., 166, 17–26, https://doi.org/10.1016/j.jhazmat.2008.11.048, 2009.
Kassomenos, P., Kotroni, V., and Kallos, G.: Analysis of climatological 710 and air quality observations from Greater Athens Area, Atmos. Environ., 29, 3671–3688, https://doi.org/10.1016/1352-2310(94)00358-R, 1995.
Klemm, O., Ziomas, I. C., Balis, D., Suppan, P., Slemr, J., Romero, R., and Vyras, L. G.: A summer air-pollution study in Athens, Greece, Atmos. Environ., 32, 2071–2087, https://doi.org/10.1016/S1352-2310(97)00424-X, 1998.
Kourtidis, K. A., Ziomas, I. C., Rappenglueck, B., Proyou, A., and Balis, D.: Evaporative traffic hydrocarbon emissions, traffic CO and speciated HC traffic emissions from the city of Athens, Atmos. Environ., 33, 3831–3842, https://doi.org/10.1016/S1352-2310(98)00395-1, 1999.
Lalas, D. P., Veirs, V. R., Karras, G., and Kallos, G.: An analysis of the SO2 concentration levels in Athens, Greece, Atmos. Environ., 16, 531–544, https://doi.org/10.1016/0004-6981(82)90162-7, 1982.
Lalas, D. P., Asimakopoulos, D. N., Deligiorgi, D. G., and Helmis, C. G.: Sea-breeze circulation and photochemical pollution in Athens, Greece, Atmos. Environ., 17, 1621–1632, https://doi.org/10.1016/0004-6981(83)90171-3, 1983.
Lalas, D. P., Tombrou-Tsella, M., Petrakis, M., Asimakopoulos, D. N., and Helmis, C.: An experimental study of the horizontal and vertical distribution of ozone over Athens, Atmos/ Environ., 21, 2681–2693, https://doi.org/10.1016/0004-6981(87)90200-9, 1987.
Liu, Y., Shao, M., Lu, S., Chang, C.-C., Wang, J.-L., and Chen, G.: Volatile Organic Compound (VOC) measurements in the Pearl River Delta (PRD) region, China, Atmos. Chem. Phys., 8, 1531–1545, https://doi.org/10.5194/acp-8-1531-2008, 2008.
Mantis, H. T., Repapis, C. C., Zerefos, C. S., and Ziomas, J. C.: Assessment of the Potential for Photochemical Air Pollution in Athens: A Comparison of Emissions and Air-Pollutant Levels in Athens with Those in Los Angeles, J. Appl. Meteorol., 31, 1467–1476, https://doi.org/10.1175/1520-0450(1992)031<1467:AOTPFP>2.0.CO;2, 1992.
Melas, D., Ziomas, I., Klemm, O., and Zerefos, C. S.: Anatomy of the sea-breeze circulation in Athens area under weak large-scale ambient winds, Atmos. Environ., 32, 2223–2237, https://doi.org/10.1016/S1352-2310(97)00420-2, 1998.
Moschonas, N. and Glavas, S.: C3-C10 hydrocarbons in the atmosphere of Athens, Greece, Atmos. Environ., 30, 2769–2772, https://doi.org/10.1016/1352-2310(95)00488-2, 1996.
Moschonas, N., Glavas, S., and Kouimtzis, T.: C3 to C9 hydrocarbon measurements in the two largest cities of Greece, Athens and Thessaloniki, Calculation of hydrocarbon emissions by species, Derivation of hydroxyl radical concentrations, Sci. Total Environ., 271, 117–133, https://doi.org/10.1016/S0048-9697(00)00838-X, 2001.
Nester, K.: Influence of sea breeze flows on air pollution over the attica peninsula, Atmos. Environ., 29, 3655–3670, https://doi.org/10.1016/1352-2310(95)98468-N, 1995.
Paraskevopoulou, D., Liakakou, E., Gerasopoulos, E., and Mihalopoulos, N.: Sources of atmospheric aerosol from long-term measurements (5 years) of chemical composition in Athens, Greece, Sci. Total Environ., 527 (Supplement C), 165–178, https://doi.org/10.1016/j.scitotenv.2015.04.022, 2015.
Rappenglück, B., Fabian, P., Kalabokas, P., Viras, L. G., and Ziomas, I. C.: Quasi-continuous measurements of non-methane hydrocarbons (NMHC) in the Greater Athens area during medcaphot-trace, Atmos. Environ., 32, 2103–2121, https://doi.org/10.1016/S1352-2310(97)00430-5, 1998.
Rappenglück, B., Kourtidis, K., Melas, D., and Fabian, P.: Observations of biogenic and anthropogenic NMHC in the greater Athens area during the PAUR campaign, Phys. Chem. Earth Pt. B, 24, 717–724, https://doi.org/10.1016/S1464-1909(99)00071-4, 1999.
Saffari, A., Daher, N., Samara, C., Voutsa, D., Kouras, A., Manoli, E., Karagkiozidou, O., Vlachokostas, C., Moussiopoulos, N., Shafer, M. M., Schauer, J. J., and Sioutas, C.: Increased Biomass Burning Due to the Economic Crisis in Greece and Its Adverse Impact on Wintertime Air Quality in Thessaloniki, Environ. Sci. Technol., 47, 13313–13320, https://doi.org/10.1021/es403847h, 2013.
Salameh, T., Sauvage, S., Afif, C., Borbon, A., Léonardis, T., Brioude, J., Waked, A., and Locoge, N.: Exploring the seasonal NMHC distribution in an urban area of the Middle East during ECOCEM campaigns: very high loadings dominated by local emissions and dynamics, Environ. Chem., 12, 316–328, https://doi.org/10.1071/EN14154, 2015.
Sauvage, S., Plaisance, H., Locoge, N., Wroblewski, A., Coddeville, P., and Galloo, J. C.: Long term measurement and source apportionment of non-methane hydrocarbons in three French rural areas, Atmos. Environ., 43, 2430–2441, https://doi.org/10.1016/j.atmosenv.2009.02.001, 2009.
Schauer, J. J., Kleeman, M. J., Cass, G. R., and Simoneit, B. R. T.: Measurement of Emissions from Air Pollution Sources. 3. C1−C29 Organic Compounds from Fireplace Combustion of Wood, Environ. Sci. Technol., 35, 1716–1728, https://doi.org/10.1021/es001331e, 2001.
Seinfeld, J. H. and Pandis, S. N.: Atmospheric Chemistry and Physics: From Air Pollution to Climate Change, John Wiley & Sons, Hoboken, New Jersey, 2016.
Tsigaridis, K. and Kanakidou, M.: Global modelling of secondary organic aerosol in the troposphere: a sensitivity analysis, Atmos. Chem. Phys., 3, 1849–1869, https://doi.org/10.5194/acp-3-1849-2003, 2003.
Vrekoussis, M., Richter, A., Hilboll, A., Burrows, J. P., Gerasopoulos, E., Lelieveld, J., Barrie, L., Zerefos, C., and Mihalopoulos, N.: Economic crisis detected from space: Air quality observations over Athens/Greece, Geophys. Res. Lett., 40, 458–463, https://doi.org/10.1002/grl.50118, 2013.
WHO-IARC: Outdoor air pollution a leading environmental cause of cancer deaths, Press Release no221, 2013.
Zhang, Q., Wu, L., Fang, X., Liu, M., Zhang, J., Shao, M., Lu, S., and Mao, H.: Emission factors of volatile organic compounds (VOCs) based on the detailed vehicle classification in a tunnel study, Sci. Total Environ., 624, 878–886, https://doi.org/10.1016/j.scitotenv.2017.12.171, 2018.
Zhang, Y., Yang, W., Simpson, I., Huang, X., Yu, J., Huang, Z., Wang, Z., Zhang, Z., Liu, D., Huang, Z., Wang, Y., Pei, C., Shao, M., Blake, D. R., Zheng, J., Huang, Z., and Wang, X.: Decadal changes in emissions of volatile organic compounds (VOCs) from on-road vehicles with intensified automobile pollution control: Case study in a busy urban tunnel in south China, Environ. Pollut., 233, 806–819, https://doi.org/10.1016/j.envpol.2017.10.133, 2018.
Ziomas, I. C., Suppan, P., Rappengluck, B., Balis, D., Tzoumaka, P., Melas, D., Papayiannis, D., Fabian, P., and Zerefos, C. S.: A contribution to the study of photochemical smog in the greater Athens area, Beitr. Phys. Atmosph., 68, 191–204, 1995.