the Creative Commons Attribution 4.0 License.
the Creative Commons Attribution 4.0 License.
 | 26 Oct 2018
Tropospheric NO2, SO2, and HCHO over the East China Sea, using ship-based MAX-DOAS observations and comparison with OMI and OMPS satellite data
Wei Tan
Shanshan Wang
Chengzhi Xing
Wenjing Su
Chengxin Zhang
Congzi Xia
Haoran Liu
Zhaonan Cai
Jianguo Liu
In this study, ship-based multi-axis differential optical absorption spectroscopy (MAX-DOAS) measurements were performed in the East China Sea (ECS) area in June 2017. The tropospheric slant column densities (SCDs) of nitrogen dioxide (NO2), sulfur dioxide (SO2), and formaldehyde (HCHO) were retrieved from the measured spectra using the differential optical absorption spectroscopy (DOAS) technique. Using the simple geometric approach, the SCDs of different trace gases observed at a 15∘ elevation angle were adopted to convert into tropospheric vertical column densities (VCDs). During this campaign, the averaged VCDs of NO2, SO2, and HCHO in the marine environment over the ECS area are 6.50×10¹⁵, 4.28×10¹⁵, and 7.39×10¹⁵ molec cm−2, respectively. In addition, the ship-based MAX-DOAS trace gas VCDs were compared with satellite observations of the Ozone Monitoring Instrument (OMI) and Ozone Mapping and Profiler Suite (OMPS). The daily OMI NO2 VCDs agreed well with ship-based MAX-DOAS measurements showing the correlation coefficient R of 0.83. In addition, the good agreements of SO2 and HCHO VCDs between the OMPS satellite and ship-based MAX-DOAS observations were also found, with correlation coefficients R of 0.76 and 0.69. The vertical profiles of these trace gases are achieved from the measured differential slant column densities (DSCDs) at different elevation angles using the optimal estimation method. The retrieved profiles displayed the typical vertical distribution characteristics, which exhibit low concentrations of <3, <3, and <2 ppbv for NO2, SO2, and HCHO in a clean area of the marine boundary layer far from coast of the Yangtze River Delta (YRD) continental region. Interestingly, elevated SO2 concentrations can be observed intermittently along the ship routes, which is mainly attributed to the vicinal ship emissions in the view of the MAX-DOAS measurements. Combined with the on-board ozone lidar measurements, the ozone (O3) formation was discussed with the vertical profile of the HCHO∕NO2 ratio, which is sensitive to increases in NO2 concentration. This study provided further understanding of the main air pollutants in the marine boundary layer of the ECS area and also benefited the formulation of policies regulating the shipping emissions in such costal areas like the YRD region.
- Article
(9533 KB) - Full-text XML
- BibTeX
- EndNote


Nitrogen dioxide (NO2), sulfur dioxide (SO2), and formaldehyde (HCHO) are important atmospheric trace gases that play a major role in atmospheric chemical processes. NO2 participates in the formation of ozone (O3) and reacts with hydroxyl radicals (OH), the strongest oxidizing agents in the atmosphere, to produce aerosols and acid rain, which are harmful to both buildings and human health (Seinfeld and Pandis, 2006; Lelieveld and Dentener, 2000; Lelieveld et al., 2002). NO2 may also have important impacts on the greenhouse effect (Solomon et al., 1999). In addition to natural sources, high-temperature combustion processes, e.g., fossil fuel burning and accidental and intentional biomass burning, are estimated to contribute major emissions of nitrogen oxides () (Lee et al., 1997). SO2 contributes to the formation of sulfate aerosols and acid rain, both of which have negative effects on the climate and human health and lead to building acid corrosion (Hutchinson and Whitby, 1977; Pope and Dockery, 2006; Longo et al., 2010). The dominant anthropogenic emissions of SO2 are the burning of fossil fuels, smelters, and oil refineries, whereas the discharge of active volcanoes is the major natural source. HCHO is the predominant product of the oxidation of many volatile organic compounds (VOCs) by OH radicals and is abundant throughout the atmosphere. Therefore, elevated HCHO levels can be related to the emission of reactive non-methane volatile organic compounds (NMVOCs) originating from biogenic, pyrogenic, or anthropogenic sources (Fu et al., 2007; Millet et al., 2008; Stavrakou et al., 2009a, b).
The differential optical absorption spectroscopy (DOAS) technique is widely used to identify and quantify different kinds of atmospheric trace gases. The DOAS principle makes use of the fact that narrow trace gas absorption structures can be separated from broad band absorption and atmospheric scattering (Platt and Stutz, 2008). The multi-axis differential optical absorption spectroscopy (MAX-DOAS) instrument is designed to observe scattered sunlight under different viewing angles closed to the horizontal and the zenith directions, which can provide high sensitivity to tropospheric aerosols and trace gases (Hönninger et al., 2004). In the past decades, the MAX-DOAS method has been successfully used for observations of many atmospheric trace gases, such as NO2, SO2, HCHO, HONO, and others, on different platforms. The most common application is ground-based measurement (e.g., Irie et al., 2011; Pinardi et al., 2013; Wang et al., 2014; Chan et al., 2015; Xing et al., 2017). Meanwhile, mobile platform observations have been developed rapidly, e.g., car-based observations (Johansson et al., 2008; Shaiganfar et al., 2011, 2017; Wang et al., 2012), aircraft observations (Baidar et al., 2013; Dix et al., 2016), and ship-based observations (Sinreich et al., 2010; Takashima et al., 2012; Peters et al., 2012; Schreier et al., 2015; Hong et al., 2018).
Usually, the trace gas concentrations are very low in remote marine environments, considering there are no emission sources except the ship traffic and some other natural sources. Previous ship-based MAX-DOAS studies reported that NO2 vertical column densities (VCDs) were basically low ( molec cm−2) due to the absence of obvious NOx emission sources nearby, and the NO2 concentrations in the marine boundary layer extracted from profile retrieval are <30 pptv in the open and clean tropical sea area of the South China and Sulu seas (Schreier et al., 2015). Time series of SO2 magnitudes were found to be consistent with tropospheric NO2 in this area and occasionally increased if the measurements were taken in a busy shipping lane. Over the western Pacific and Indian oceans, the background value of NO2 concentration was less than ∼0.2 ppbv over the remote ocean (Takashima et al., 2012). Peters et al. (2012) found that HCHO VCDs over the remote ocean exhibit a diurnal pattern with maximum values of 4×10¹⁵ molec cm−2 at noontime over the western Pacific Ocean, and corresponding retrieved peak concentrations were up to 1.1 ppbv at higher altitudes around 400 m. However, these pollutant concentrations increased to a high value when the measurements were taken close to the shore, busy ports, or vessels (Takashima et al., 2012; Peters et al., 2012; Schreier et al., 2015). So far, the air quality of the marine boundary layer along the Chinese coast has rarely been reported on.
In this study, we used ship-based MAX-DOAS measurements to report the column densities and temporal–spatial distributions of NO2, SO2, and HCHO in marine environments over the East China Sea (ECS) area in June 2017. During this campaign, the cruise ship mainly navigated the sea area surrounding the Yangtze River Delta (YRD) region, which is the confluence of the coastal shipping routes and inland water transportation on the Yangtze River. It is the busiest waterway of the ECS area and also one of the three key Ship Emission Control Zones (ECZs) of China. The YRD coastal port cluster is composed of more than 15 ports, of which Shanghai and Ningbo–Zhoushan have served as the two largest container ports in the world since 2013. With the flourishing shipping industry, the throughput of YRD ports continuously strikes new highs and causes considerable ship emissions of SO2, NOx, and PM2.5, which has significant impacts on local and regional air pollution in both offshore and inland areas of the YRD region (Fan et al., 2016; Zhang et al., 2017). Due to rapid urbanization and industrialization, as well as an expanding population, the continental YRD region also suffers from ecological degradation and environmental problems at the same time, e.g., atmospheric fine-particle and O3 pollution (Chen et al., 2017; Song et al., 2017).
In this paper, both VCDs and vertical distributions of NO2, SO2, and HCHO from ship-based MAX-DOAS measurements, as well as the ozone profiles from onboard lidar, have been reported for the ECS area covering the Yangtze River estuary and surrounding YRD region waters for the first time. The spatial distributions of these gaseous pollutants by ship-based measurements were compared to satellite observations and further used to discuss air pollutant transport between continental and sea areas. Moreover, ozone formation over the sea was investigated. These observed data sets are vital for better understanding of the air quality in the marine boundary layer along the coastline of China and helpful for regulating air pollution in coastal areas.
2.1 The measurement cruise
The ship-based measurement campaign was implemented over the offshore marine area of the ECS covering the Yangtze River estuary and YRD region coast in summer from 2 to 29 June 2017 (Fig. 1a). Before departure, measurement instruments were installed and debugged at Gongqing port (point A in Fig. 1b, 31.33∘ N, 121.55∘ E) of Shanghai on 1 June 2017. As indicated in Fig. 1b, the ship set sail on 2 June 2017 from Gongqing port by way of Yangshan port (B, 30.62∘ N, 122.09∘ E) and the Daishan islands (C, 30.25∘ N, 122.16∘ E) and Hangzhou Bay. After encircling the Zhoushan Islands (29.99∘ N, 122.20∘ E), the ship moved forward to the Shengsi Islands (D, 30.71∘ N, 122.45∘ E) and Huaniao Island (E, 30.85∘ N, 122.68∘ E). Then, the ship was headed to Lianxing port in Jiangsu Province (F, 31.72∘ N, 121.87∘ E) and passed around Huaniao Island before sailing back to Gongqing port on 29 June 2017. As shown in Fig. 1 the ship cruise routes not only covered the busy waters of the YRD region but also passed though some clean marine areas 100 km away from the continental coast.
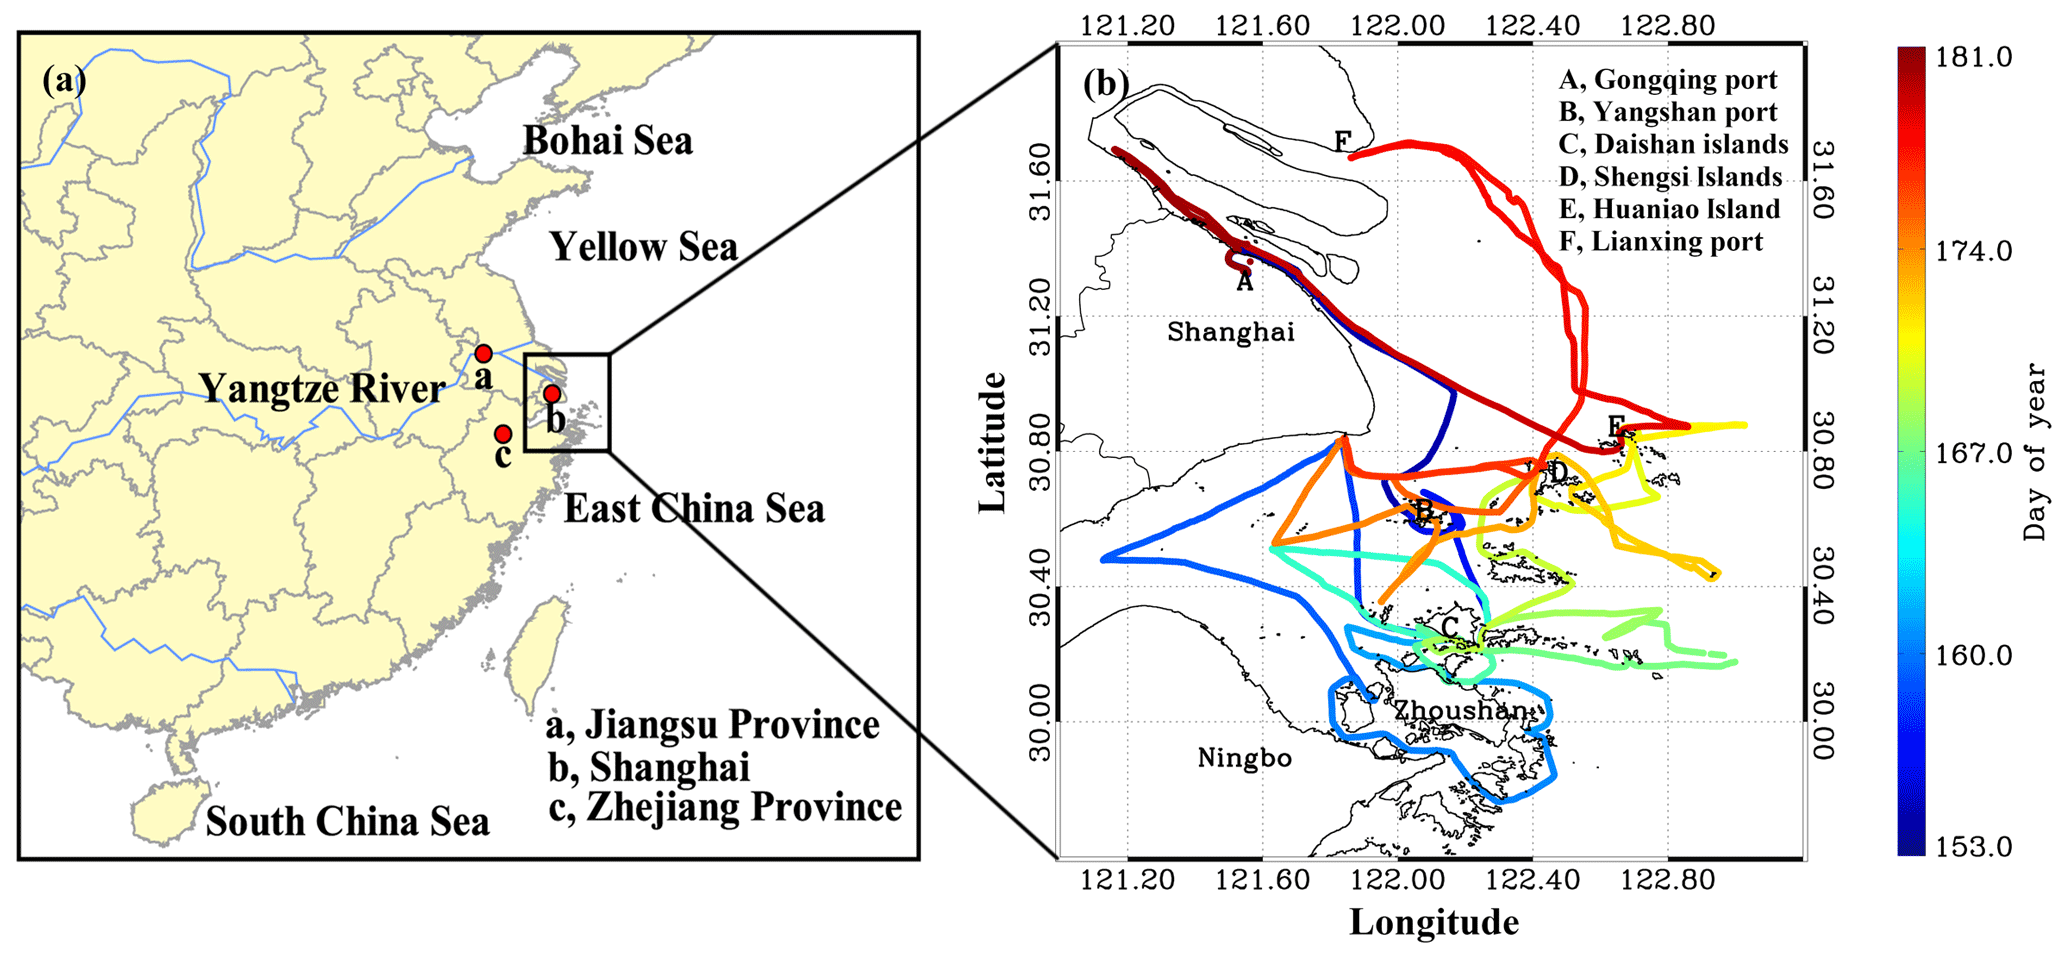
Figure 1Location (a) and cruise routes (b) of the ship-based campaign from 2 to 29 June 2017 (DOY 153 to 181).
2.2 Ship-based MAX-DOAS measurements
2.2.1 Instrument setup
An integrated and fully automated MAX-DOAS instrument was fixed on a 1.5 m high tripod top on the stern deck of the ship. This compact instrument consists of an ultraviolet spectrometer (AvaSpec-ULS2048L-USB2) covering the spectral range of 300–460 nm with a spectral resolution of 0.6 nm, a one-dimensional charge-coupled device detector (Sony ILX511, 2048 individual pixels), and a stepper motor driving the telescope to collect scattered sunlight from different elevation angles (angle between the horizontal and the viewing directions, α). In addition, the controlling electronic devices, connecting fiber, and other necessary devices are mounted inside too. To avoid the impact of emission plumes from the ship itself, the azimuthal angle of the telescope unit was kept at 130∘ relative to the heading direction of the observation ship. The telescope scanned in the sequence of elevation angles of 3, 5, 7, 10, 15, 30, and 90∘. The duration of an individual spectrum measurement was about 30 s and each scanning sequence took about 4 min. The daily measurements were automatically controlled by a built-in computer combined with a spectral collection software when the solar zenith angle (SZA) was less than 75∘. Moreover, a high-precision Global Position System (GPS) data receiver was configured to record the real-time coordinate positions and the track of the ship cruise.
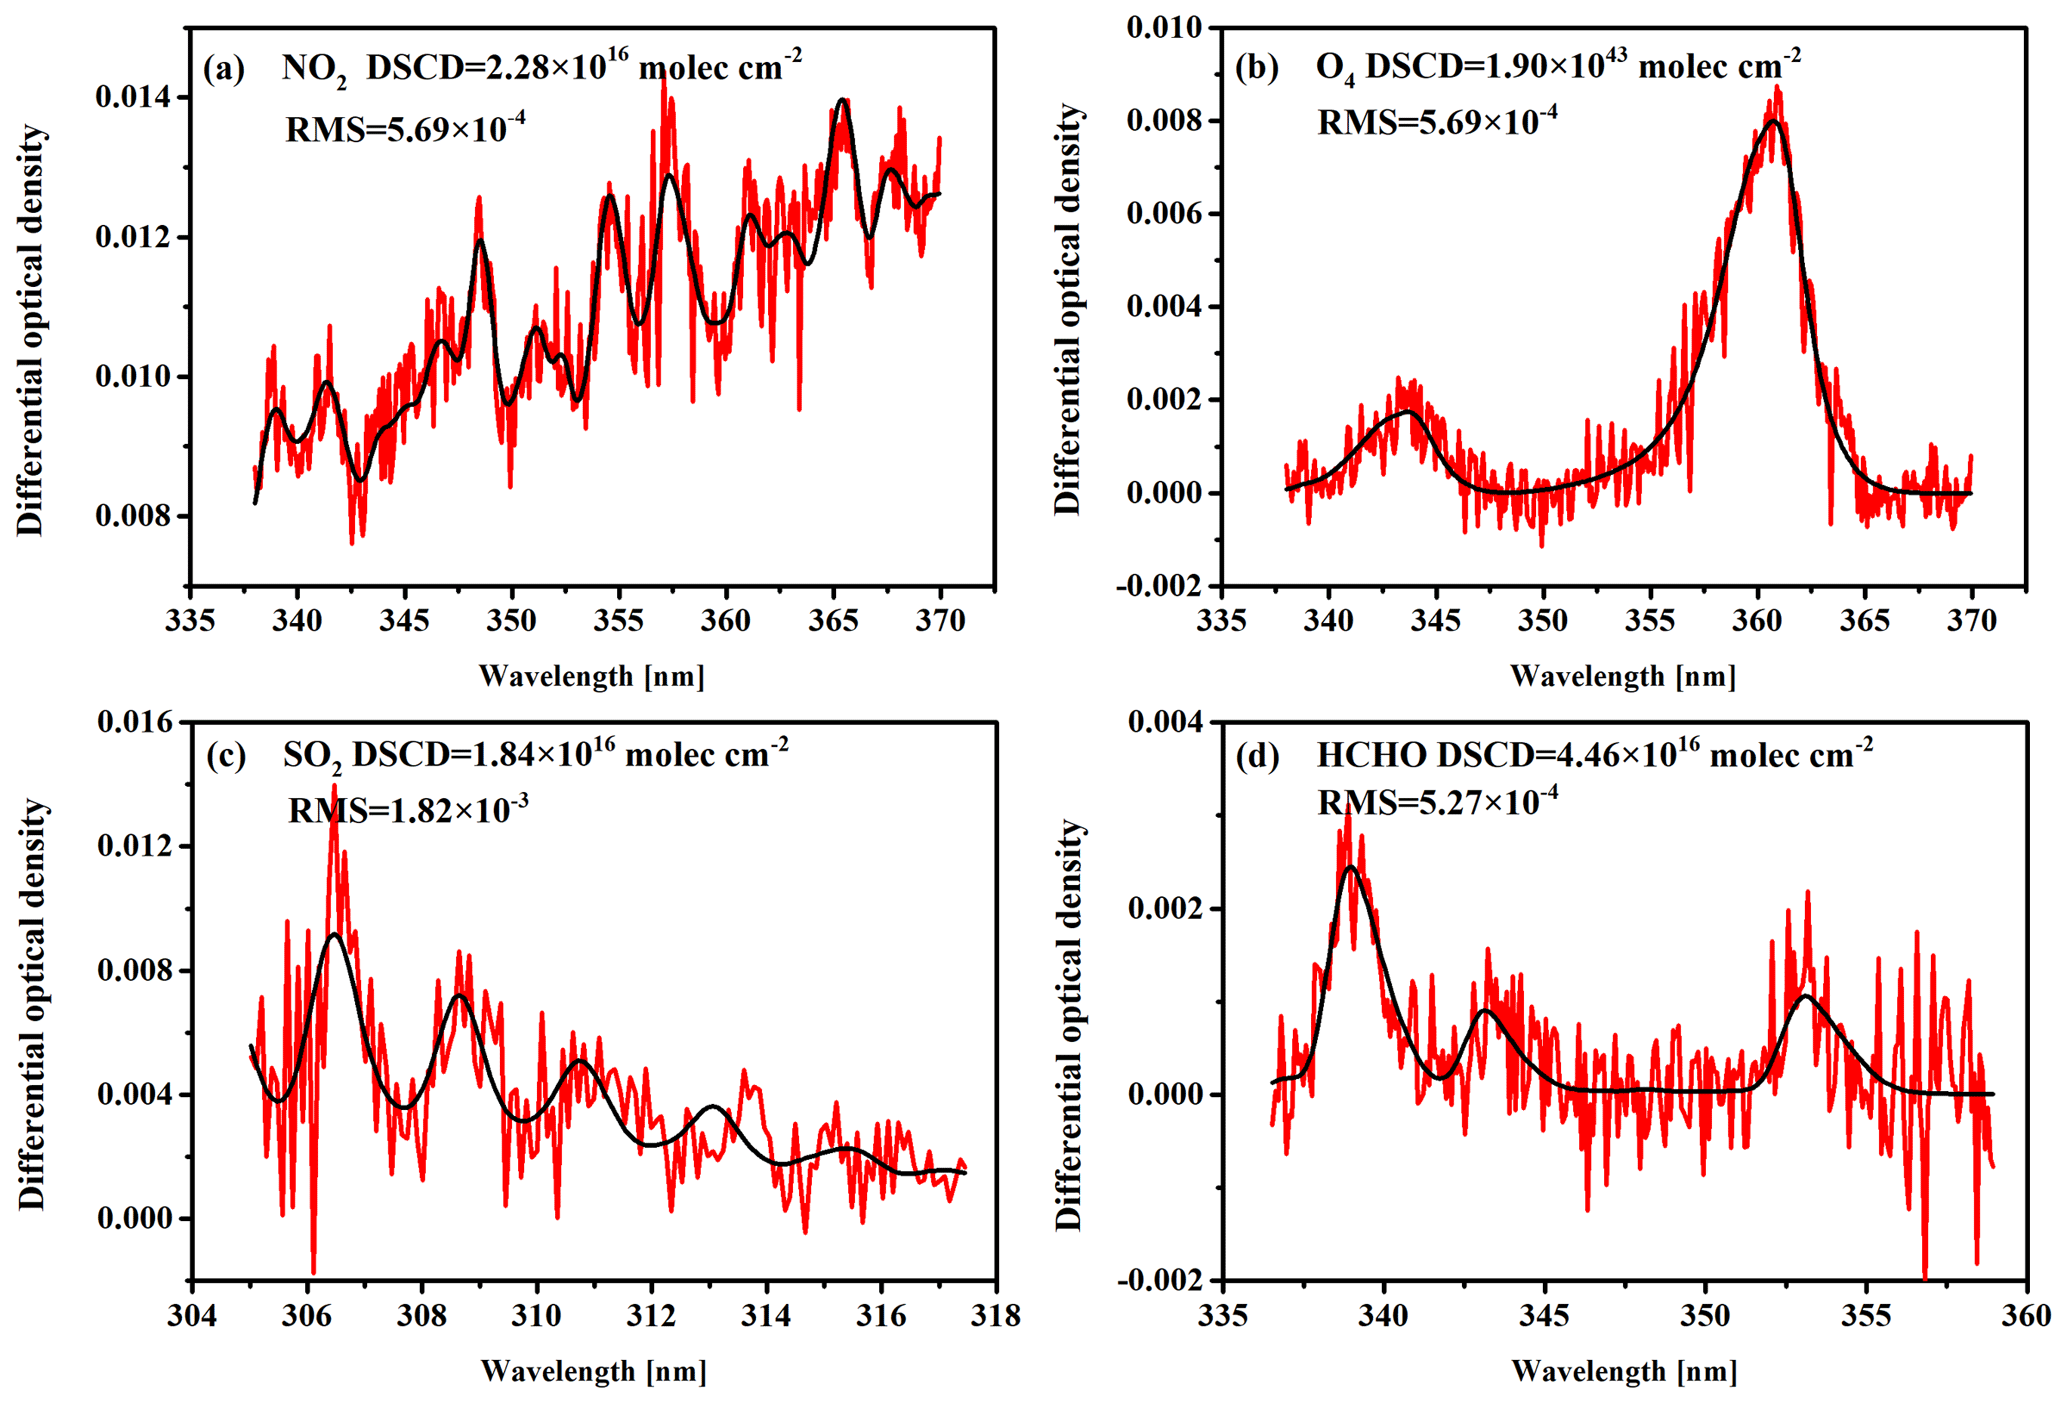
Figure 2Typical DOAS spectral fittings for (a) NO2, (b) O4, (c) SO2, and (d) HCHO. The spectrum was collected at an elevation of 15∘ at 10:13 LT on 7 June 2017. The black curves show the reference absorption cross section scaled to the measured atmospheric spectrum (red curves) by DOAS fitting.

Figure 3The spatial distributions of the trace gas VCDs of (a) NO2, (b) SO2, and (c) HCHO along the cruise route of the ship-based campaign in June 2017.
2.2.2 Spectral analysis
Based on the DOAS principle, the measured scattered sun-light spectra are analyzed using the QDOAS spectral fitting software suite developed by BIRA-IASB (http://uv-vis.aeronomie.be/software/QDOAS/, last access: 23 October 2018). The detailed configuration of the spectral fitting is listed in Table 1. The fitting wavelength intervals of NO2, O4, SO2, and HCHO are 338–370, 338–370, 305–317.5, and 336.5–359 nm, respectively. Trace gas absorption cross sections of NO2 at 220 and 298 K (Vandaele et al., 1998), SO2 at 298 K (Vandaele et al., 2009), HCHO at 297 K (Meller and Moortgat, 2000), O3 at 223 and 243 K (Serdyuchenko et al., 2014), O4 at 293 K (Thalman and Volkamer, 2013), BrO at 223 K (Fleischmann and Hartmann, 2004), the Ring spectrum, a Fraunhofer reference spectrum, and a low-order polynomial are included in the DOAS fitting. The wavelength calibration was performed using a high-resolution solar spectrum (Chance and Kurucz, 2010). The dark current spectrum and electronic offset spectrum were used to correct measured spectra before the spectra analysis.
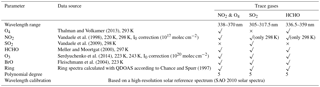
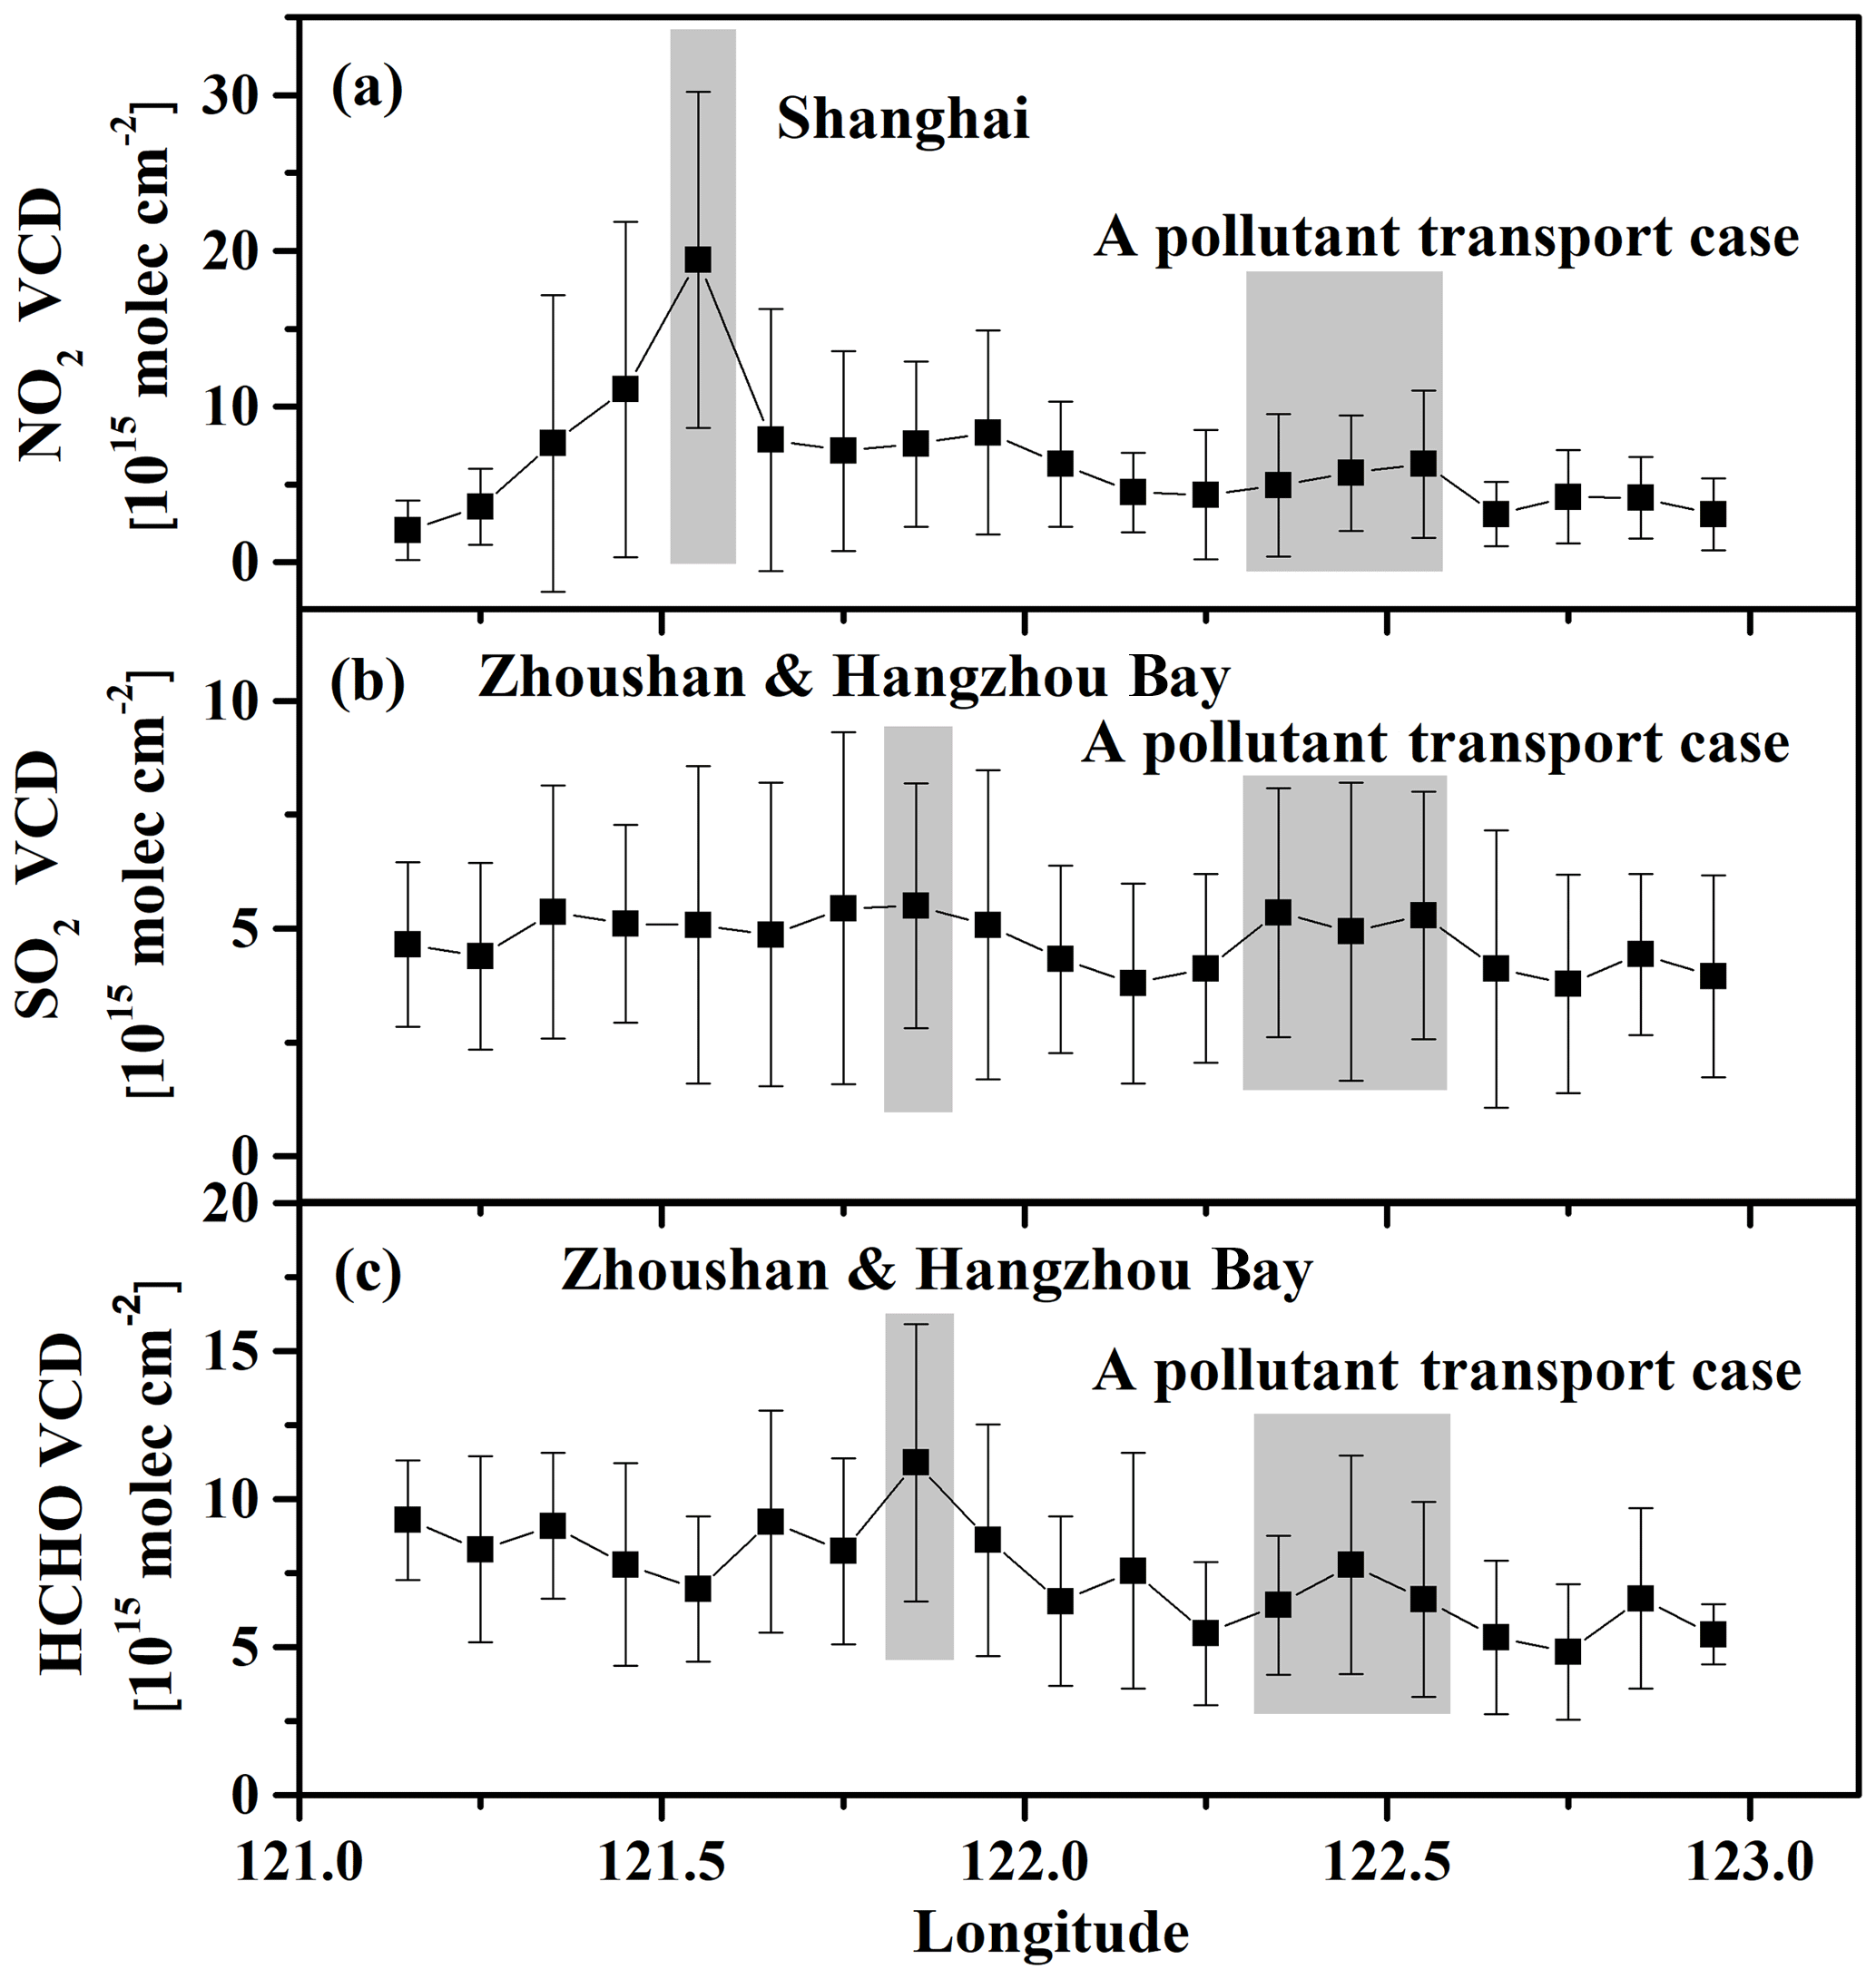
Figure 4The variations in trace gas tropospheric VCDs with longitude: (a) NO2, (b) SO2, and (c) HCHO.
The spectral analysis yields the measured slant column densities (SCDs), the integrated trace gas concentration along the light path through the atmosphere. For MAX-DOAS spectral analysis, the measured spectrum at 90∘ was selected as the Fraunhofer reference spectrum for the DOAS fitting of the measured spectra at other elevation angles in each scan sequence. Thus the generated results are the difference of the SCDs between the measured spectrum and that of the Fraunhofer reference spectrum, usually referred to as differential slant column densities (DSCDs). Figure 2 shows a typical DOAS spectral fitting of the measured spectrum collected at an elevation of 15∘ at 10:13 local time (LT) on 7 June 2017. The retrieved DSCDs of NO2, O4, SO2, and HCHO are 2.28×10¹⁶, 1.90×1043, 1.84×10¹⁶, and 4.46×10¹⁶ molec cm−2, respectively. All these fittings displayed the evident absorption structures of the trace gases and fairly low residuals, which demonstrates the good performance of the spectral fitting. In this study, a threshold of residual is used to filter the unsatisfied fitting results of NO2, O4, and HCHO. Afterwards, the qualified DSCD results remain 99.37 %, 99.37 %, and 99.79 %, respectively. Considering the weak scattered sunlight signals and low signal-to-noise ratio around 300 nm, where the SO2 has strongly structured absorption, the threshold of residual for SO2 is set to , and 70.05 % of the fitting results match this criterion.
2.2.3 Retrieval of the trace gas VCDs and profiles
To obtain the tropospheric VCD of trace gas, the DSCDs have to be converted using tropospheric differential air mass factors (DAMFs) by Eq. (1) (Wagner et al., 2010):
The air mass factor (AMF) calculation is solved using the geometric approximation method (Hönninger et al., 2004; Wagner et al., 2010), which is simple and convenient and is simultaneously also validated by radiative transfer simulations (Solomon et al., 1987; Shaiganfar et al., 2011).
Using Eqs. (1) and (2), the tropospheric DAMF was estimated to be 2.86 and 1 for elevation angles of 15 and 30∘, respectively. Previous ground-based MAX-DOAS studies show that the most appropriate choice for the elevation angle would probably be 30∘ for the geometric approximation approach (Halla et al., 2011; Brinksma et al., 2008). Nevertheless, an elevation of 15∘ also works well for the conversion of DSCDs into VCDs in a ship-based MAX-DOAS campaign since the last scattering point is generally above the trace gas layer for an elevation angle of 15∘ in the lower boundary layer over the sea (Schreier et al., 2015). In addition, due to the longer light path through the boundary layer, the observations at a 15∘ elevation angle are more sensitive compared to at a 30∘ elevation angle. Consequently, the VCDs of NO2, SO2, and HCHO were attained from DSCDs of a 15∘ elevation angle by the geometric approximation method in this study.
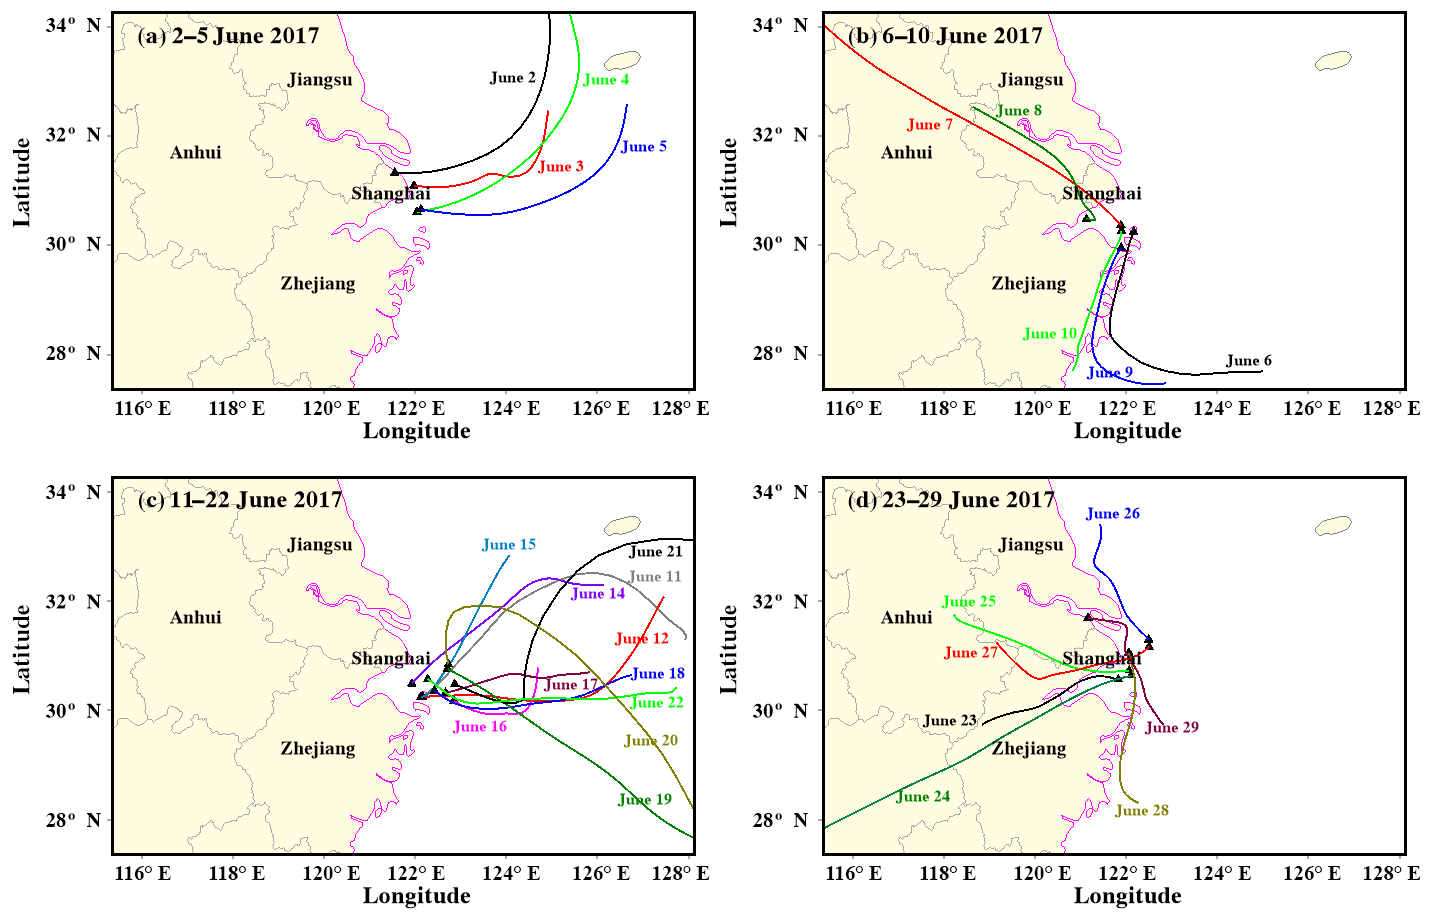
Figure 5Daily 24 h backward trajectories of air masses at 300 m in altitude for (a) 2 to 5 June, (b) 6 to 10 June, (c) 11 to 22 June, and (d) 23 to 29 June 2017.
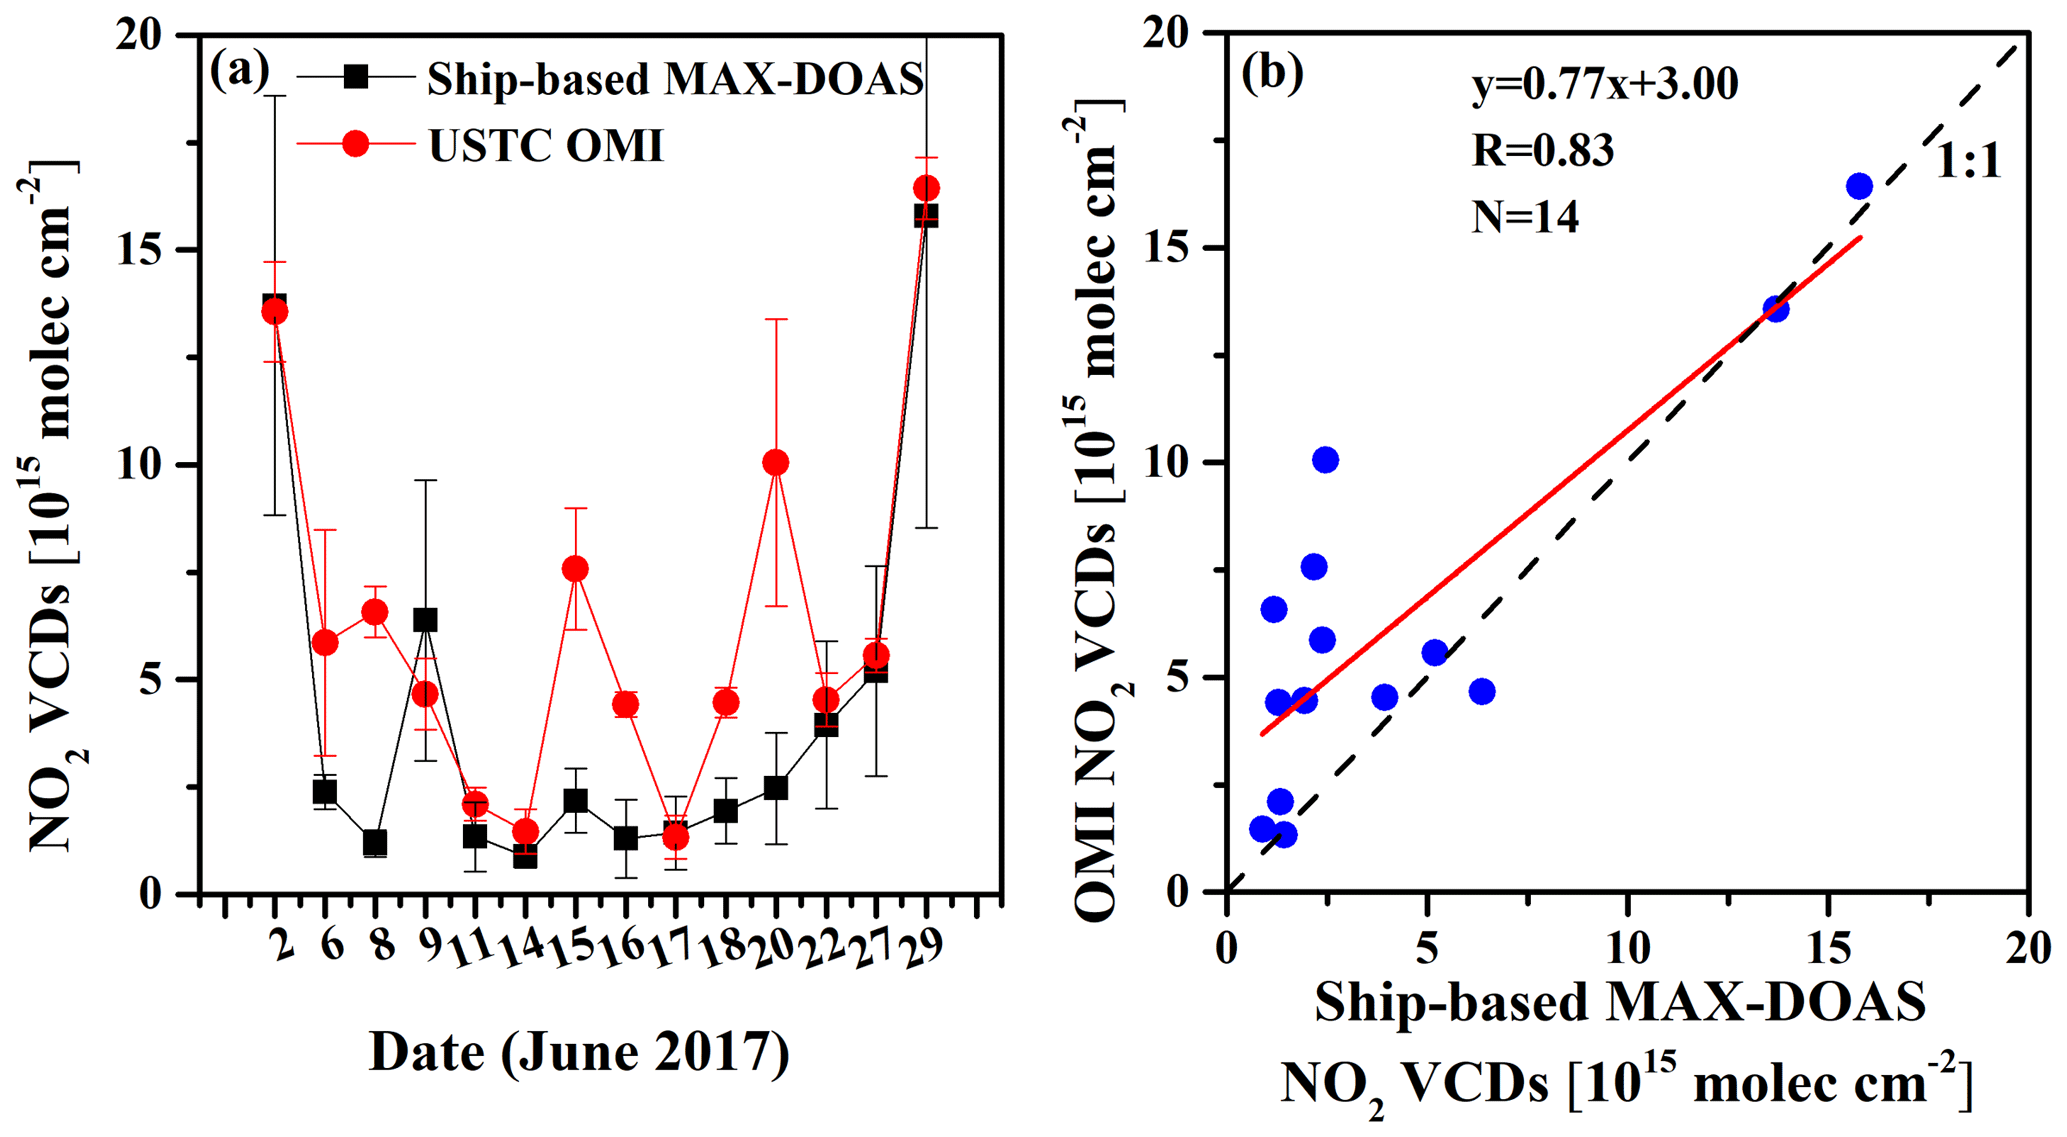
Figure 6Time series (a) and correlation analysis (b) of the tropospheric NO2 VCDs measured by ship-based MAX-DOAS and the OMI satellite during this campaign.

Figure 7Time series (a) and correlation analysis (b) of the tropospheric SO2 VCDs measured by ship-based MAX-DOAS and the OMPS satellite during this campaign.
To obtain the vertical distribution of trace gases, we used the HEIPRO algorithm (HEIdelberg PROfile, developed by IUP Heidelberg) for MAX-DOAS profile retrieval (Frieß et al., 2006, 2011, 2016). The HEIPRO retrieval algorithm is based on the optimal estimation method (OEM; Rodgers, 2000) and coupled with the radiative transfer model SCIATRAN (Rozanov et al., 2005) as the forward model. Because the existence of aerosol has strong impacts on the scattered light path in the atmosphere, the retrieval algorithm takes into account the aerosol profile retrieval first and then adopts the retrieved aerosol scenario to profile the trace gases. In this study, an a priori exponential decay profile with a scale height of 1.0 km is used as the initial profile for both the aerosol and trace gas retrievals. The total aerosol optical depth and trace gas VCD of the a priori profile are 0.2 and 7.27×10¹⁵ molec cm−2, respectively. The uncertainty of the a priori aerosol and trace gas profiles is set to 100 % and correlation length is set to 0.5 km. In the radiative transfer model, the parameters of single-scattering albedo, asymmetry parameter, and ground albedo are assumed to be 0.92, 0.68, and 0.06 for the marine environment. The retrieved profile of aerosol extinction and trace gas concentration has the resolution of a fixed grid of 200 m from the sea surface to 3 km in altitude. The criteria that the relative error of profile retrieval is larger than 50 % and degree of freedom of signal is smaller than 1.0 are used to filter the profile results. Afterwards, about 1.1 %, 23.4 %, and 7.2 % of all measurements were discarded for NO2 SO2, and HCHO profile retrievals, respectively.
2.3 OMI and OMPS satellite data
The Ozone Monitoring Instrument (OMI) was launched on July 2004 onboard the NASA Aura satellite (Levelt et al., 2006). It is an imaging spectrometer covering the wavelength range from 270 to 500 nm, which receives the light signal of scattered light in the Earth's atmosphere and reflected by the Earth's surface. OMI aims to monitor ozone, NO2, and other minor trace gas distributions with high spatial resolution (about 13×24 km2) and global daily coverage. OMI is operated on a sun-synchronous orbit, and the overpass time is about 13:45 LT. However, OMI has suffered from a so-called “row anomaly” and lost several cross-track position data (Boersma et al., 2011). In this study, we use USTC OMI tropospheric NO2 products (Liu et al., 2016; Su et al., 2017). To generate the USTC OMI products, the NO2 SCDs are retrieved from the OMI Level 1B VIS global radiances data (OML1BRVG) based on the DOAS method. To convert into NO2 VCDs more accurately, AMFs are calculated with the input of the localized NO2 and atmospheric temperature and pressure profiles derived from WRF-Chem chemistry transport model simulations. The WRF-Chem simulations have used the National Centers for Environmental Prediction (NCEP) Final Operational Global Analysis (FNL) meteorological data.
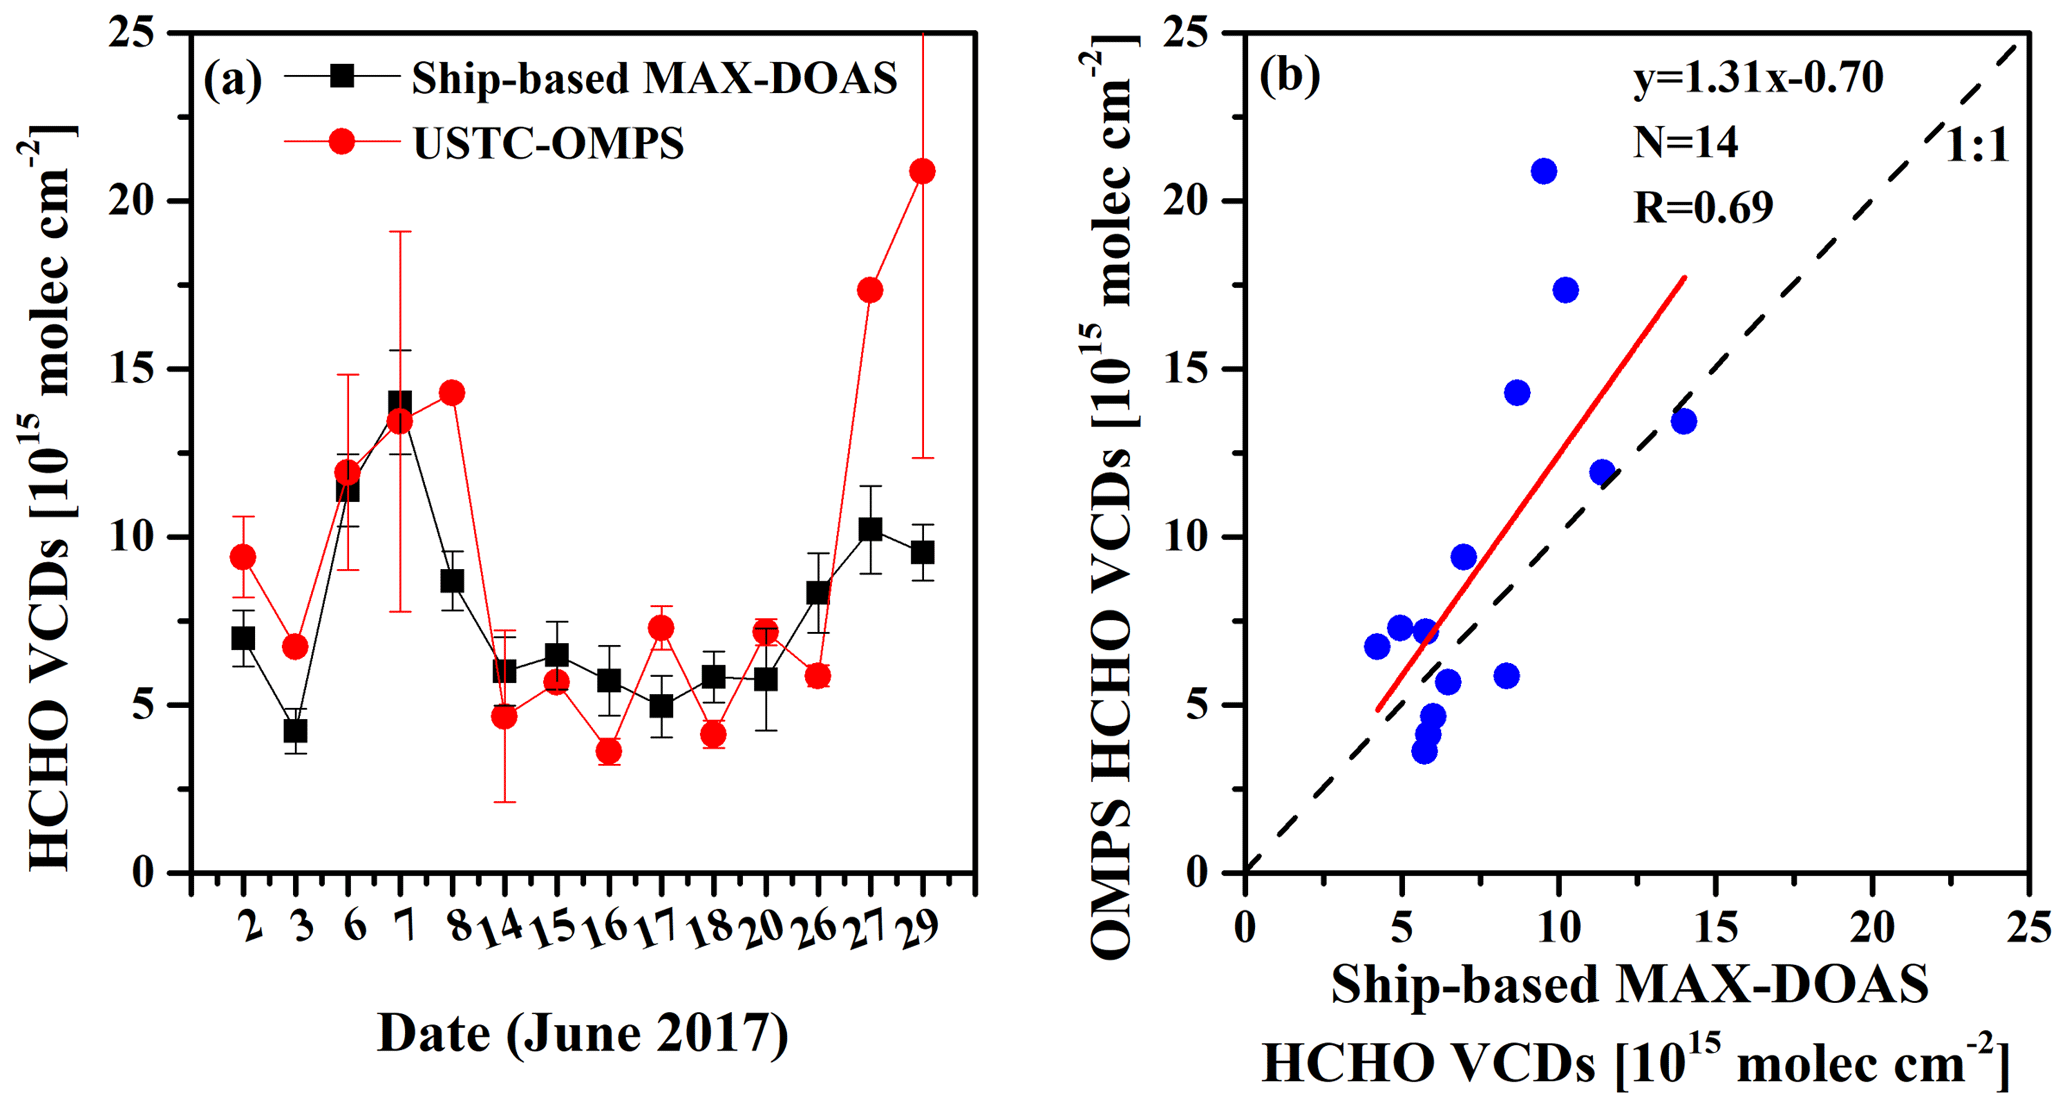
Figure 8Time series (a) and correlation analysis (b) of the tropospheric HCHO VCDs measured by ship-based MAX-DOAS and the OMPS satellite during this campaign.
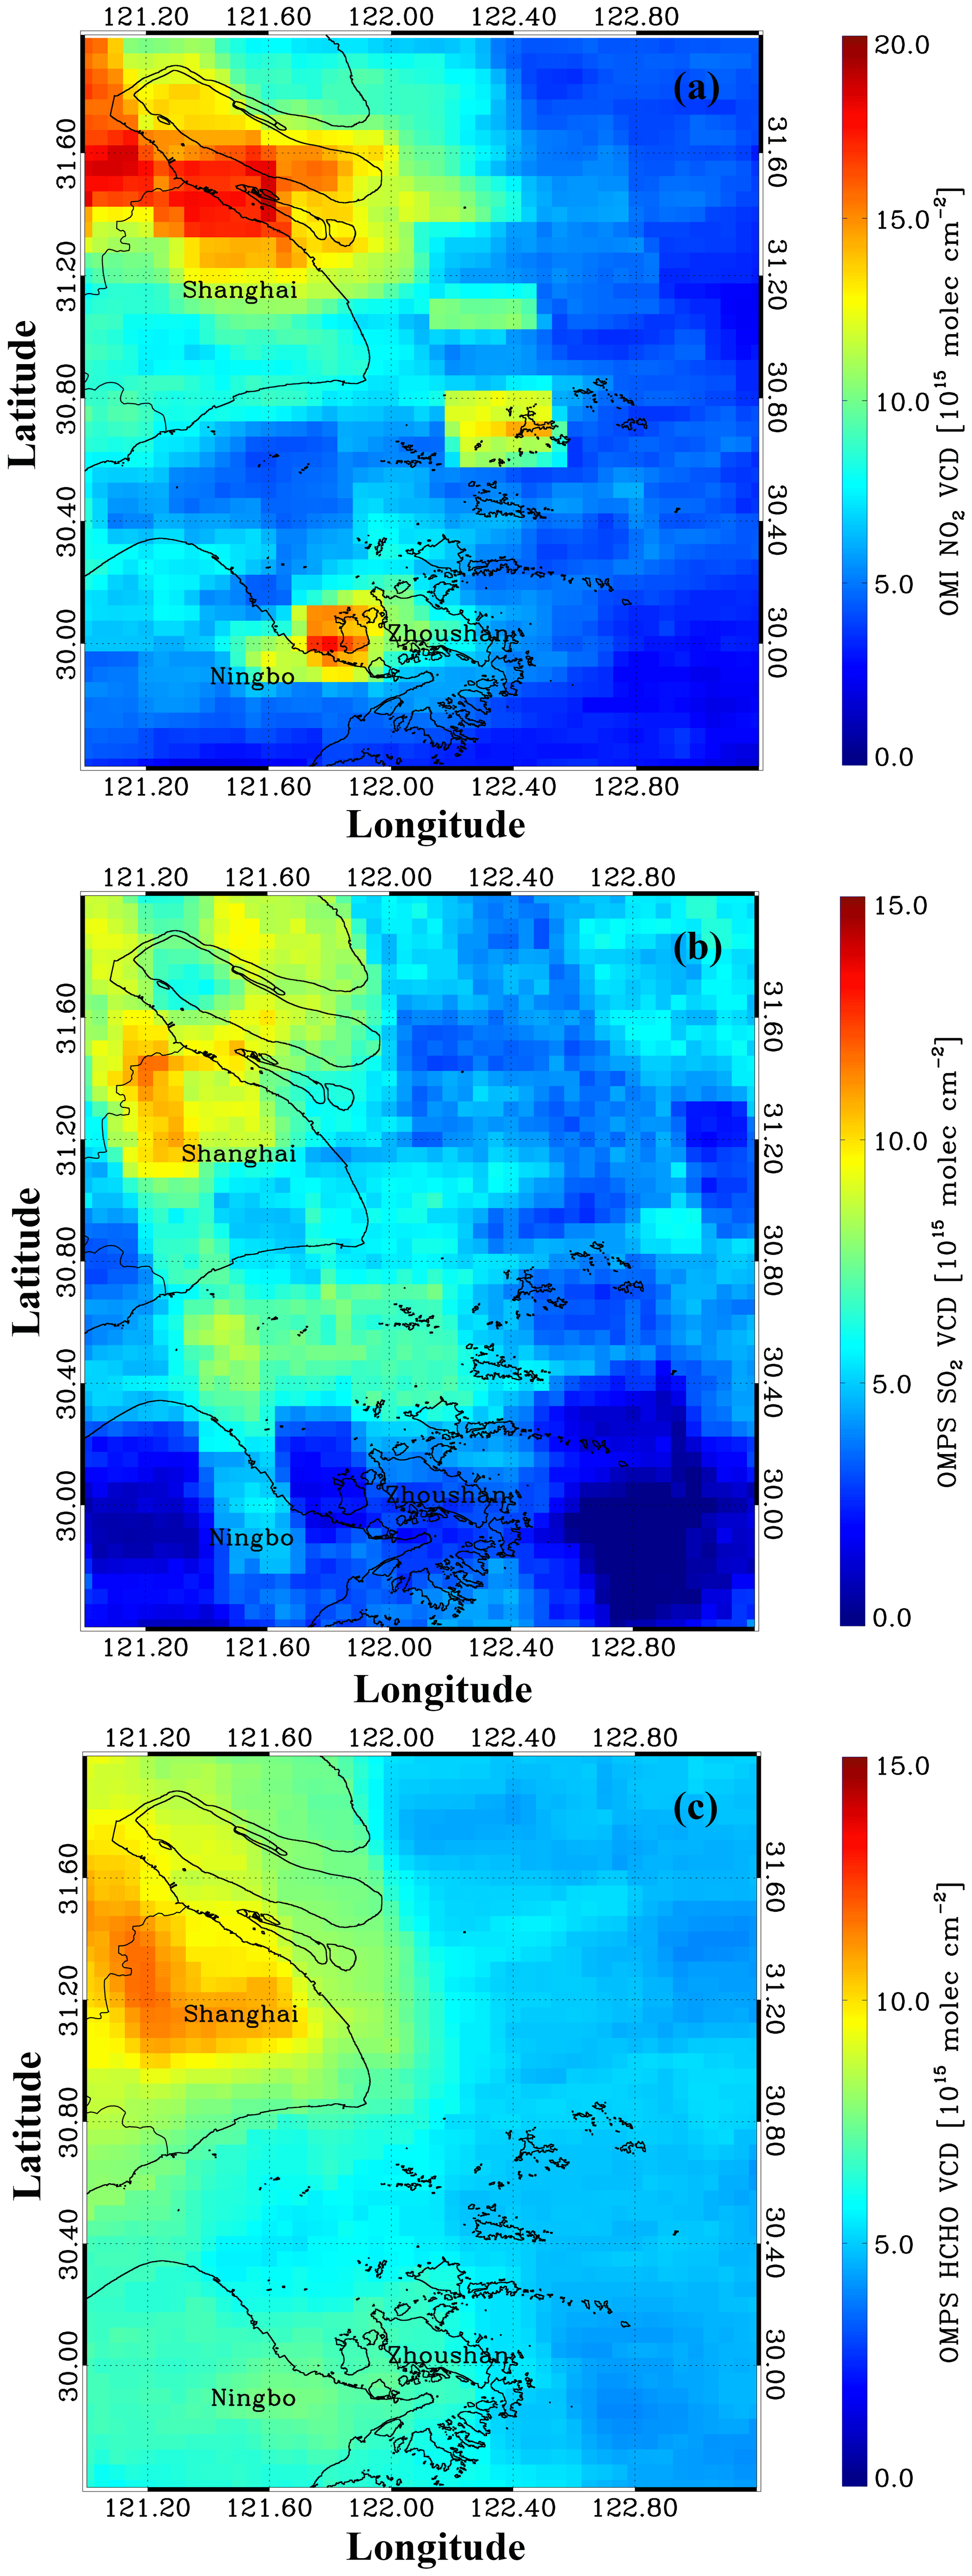
Figure 9The monthly averaged spatial distributions of the trace gas VCDs of (a) NO2, (b) SO2, and (c) HCHO of the OMI and OMPS satellite observations in June 2017.
The Ozone Mapping and Profiler Suite (OMPS) instrument was launched on 28 October 2011 onboard the Suomi National Polar-orbiting Partnership (Suomi NPP) satellite. The OMPS nadir mapper (OMPS NM) is one of three sensors of the OMPS suite of instruments. It contains a UV spectrometer covering the wavelength range between 300 and 380 nm with a full width at half maximum (FWHM) of 1 nm. It has a high spatial resolution of 50×50 km2 and high time resolution of daily global coverage (Dittman et al., 2002; Seftor et al., 2014; González Abad et al., 2016). Its Equator crossing time in the ascending node is 13:30 LT. In this study, the OMPS satellite observation data were used to retrieve the USTC OMPS tropospheric SO2 and HCHO products. Similar to the USTC OMI tropospheric NO2 VCDs, the SO2 and HCHO VCDs are produced with a two-step approach too; i.e., first the SCDs of SO2 and HCHO are retrieved from the measured scattered sunlight spectra and are then converted to the SO2 and HCHO VCDs by applying the calculated AMFs based on the WRF-Chem chemistry transport model simulation results.
2.4 Ozone lidar
During this campaign, an O3 lidar, co-located with the MAX-DOAS instrument, was also onboard and was developed by the Anhui Institute of Optics and Fine Mechanics (AIOFM) using differential absorption lidar (DIAL) technology. The laser pulse of the lidar is at 316 nm, usually with the energy of about 90 mJ and a repetition frequency of 10 Hz. The laser beam is emitted with a divergence of 0.3 milliradian (mrad) and the receiving telescope has a field of view (FOV) of 0.5 mrad, resulting in an overlap height of approximately 300 m. The O3 profiles in the lower troposphere were obtained using DIAL retrieval algorithms. The lidar observation has a high vertical resolution of 7.5 m and a temporal resolution of about 12 min. In order to improve the signal-to-noise ratio, the retrieved vertical distribution O3 concentrations were averaged on a 100 m grid. Additionally, the O3 concentration profiles with relative errors above 20 % were removed from the further discussion.
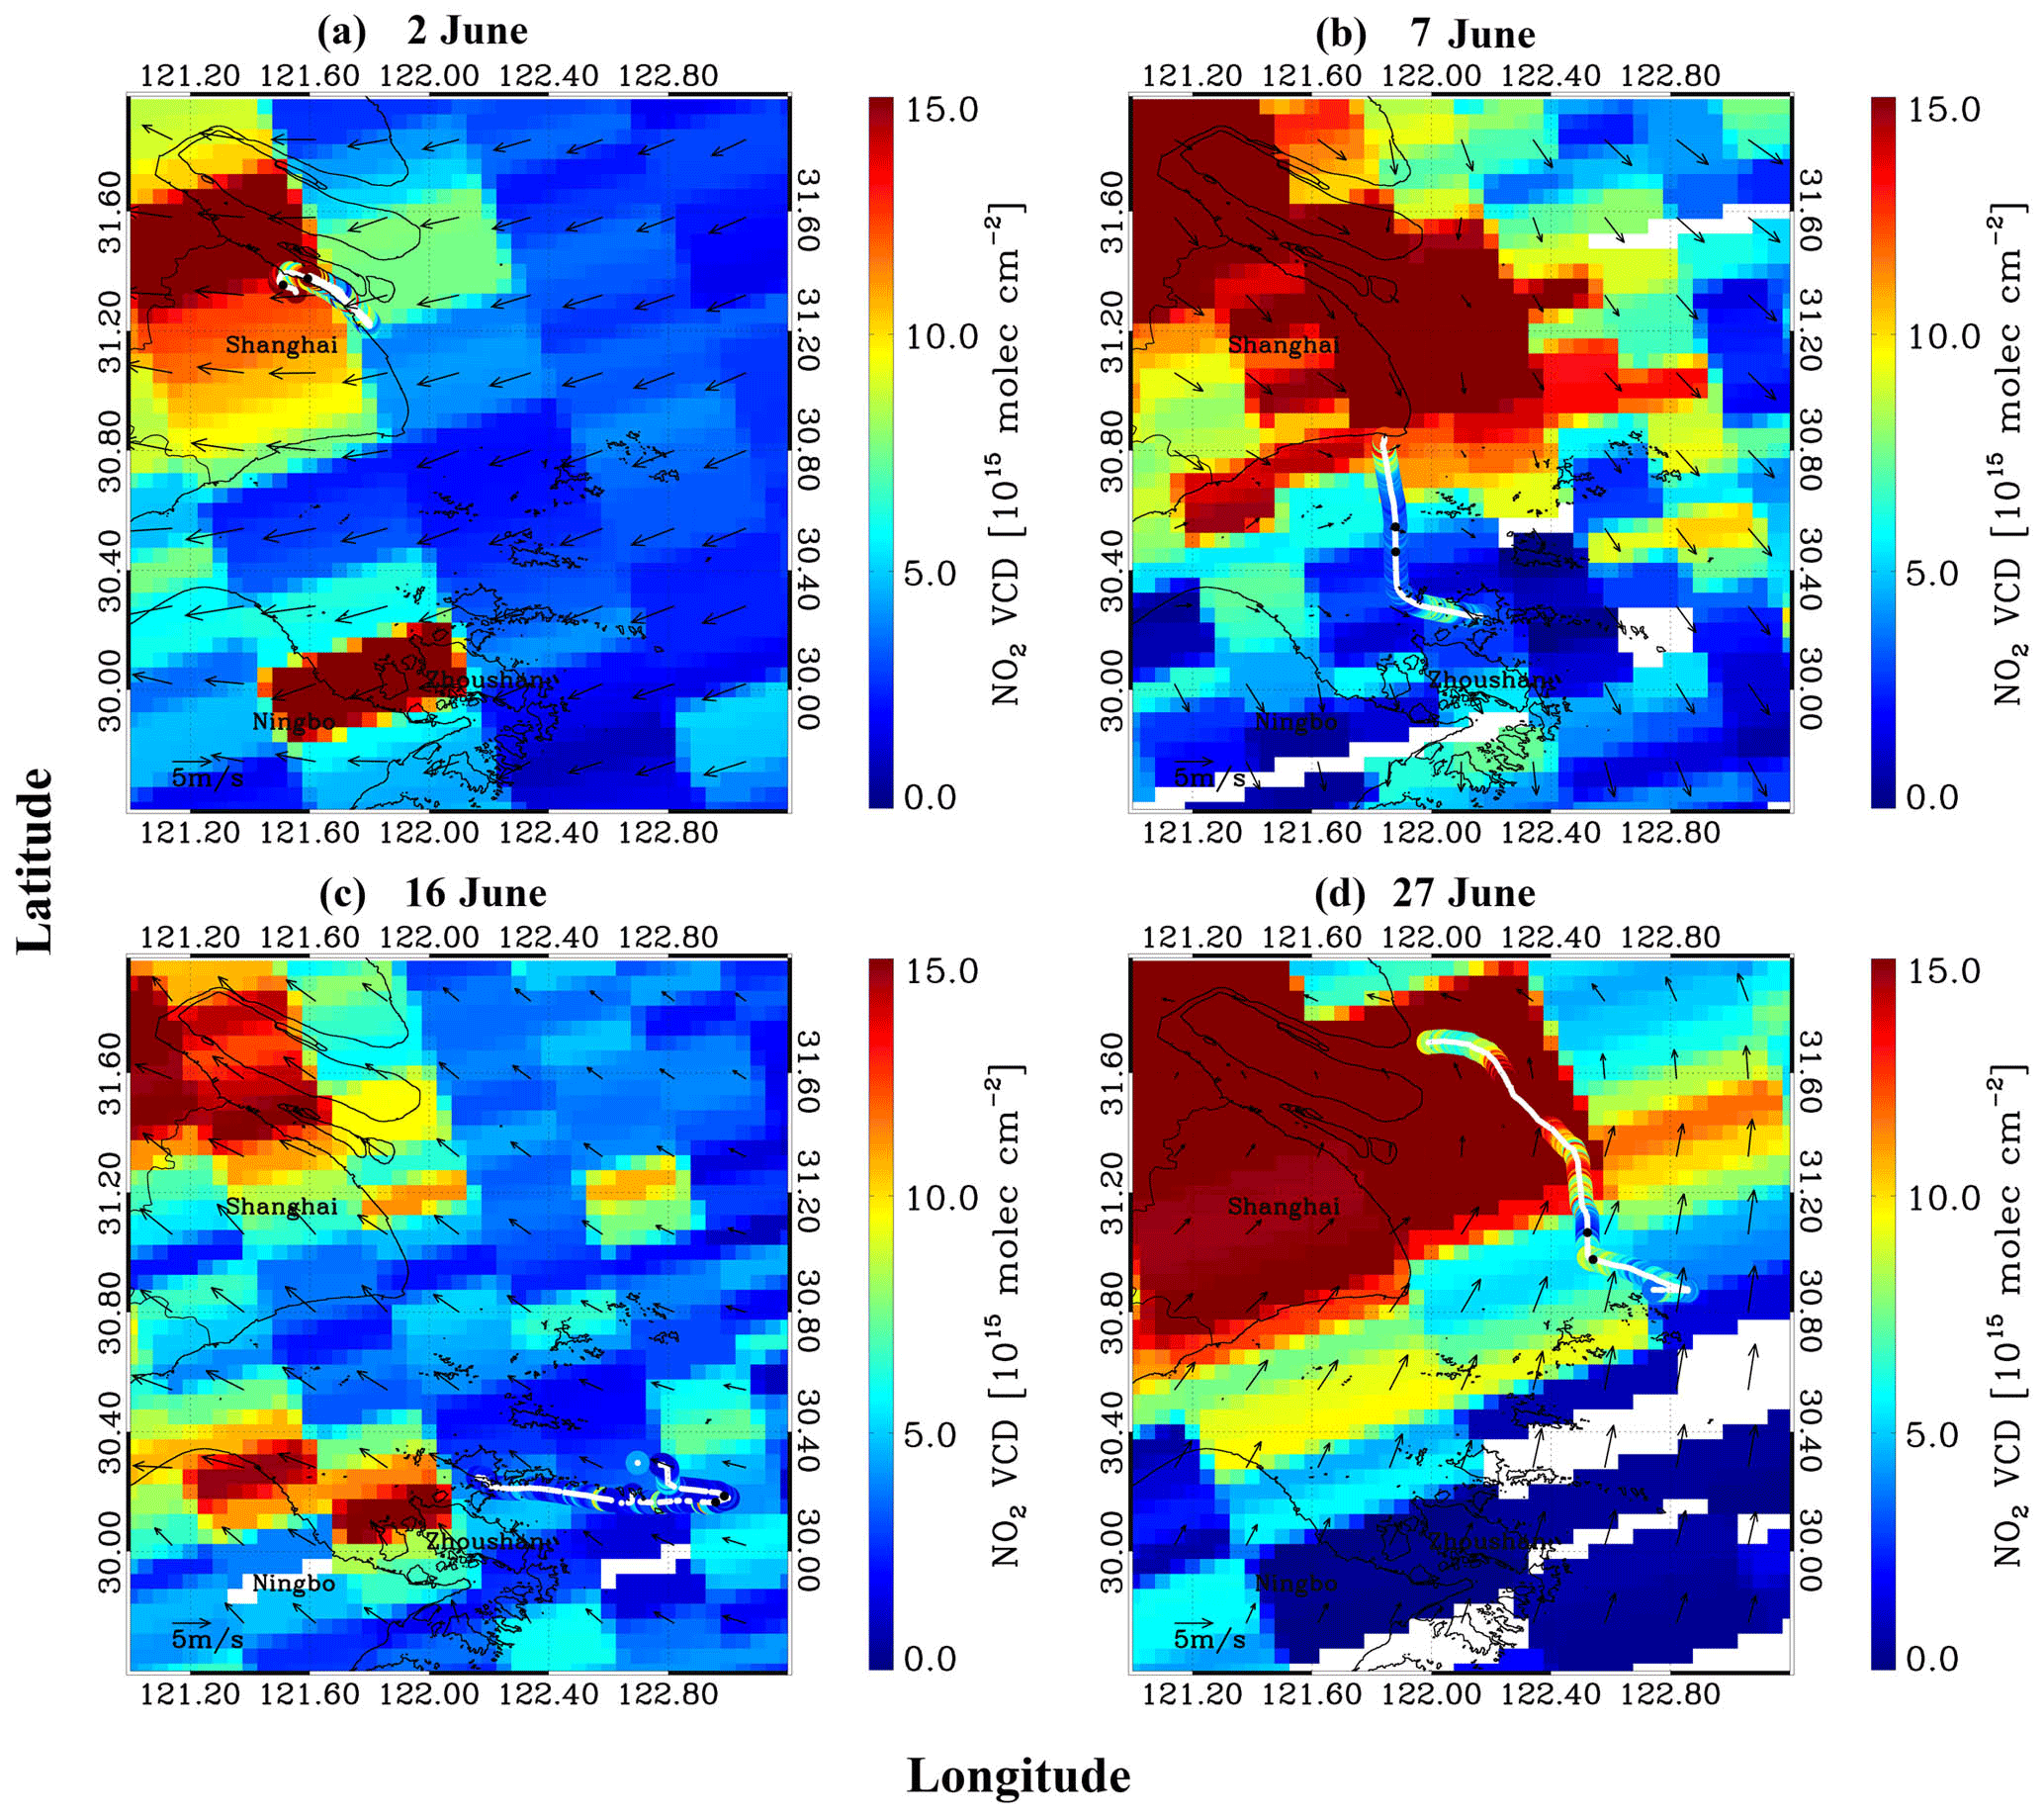
Figure 10Comparison of OMI and ship-based measurements of NO2 VCDs on (a) 2, (b) 7, (c) 16, and (d) 27 June. The ship-based measurements were plotted overlapping the base map of OMI products, and the wind field is indicated with black arrows.
3.1 Trace gas tropospheric VCDs
Based on the spectral analysis and the geometric AMF approach, we obtained the VCDs of different trace gases along the ship cruise combined with the GPS-received geo-position data. Figure 3 shows the spatial distributions of NO2, SO2, and HCHO VCDs along the route over the ECS area. The missing data are due to power failure and instrumental malfunction during the campaign as well as measurements taken under bad weather conditions (e.g., heavy rain). During the campaign, the NO2 VCDs varied from 1.00×10¹⁵ to 5.52×10¹⁶ molec cm−2 with a mean value of 6.50×10¹⁵ molec cm−2. As shown in Fig. 3a, high NO2 VCDs, almost three times the average of the whole cruise, were observed at the ship lanes of the south channel of the Yangtze River estuary and along the route to Lianxing port (located in Qidong of Jiangsu Province), as well as the busy port of Ningbo–Zhoushan. The SO2 VCDs ranged from 1.00×10¹⁵ to 1.77×10¹⁶ molec cm−2 with an average of 4.28×10¹⁵ molec cm−2. Figure 3b shows the elevated SO2 value (i.e., molec cm−2, about the 95th percentile value, ∼2.02 times mean value) are appeared in the same places as NO2, such as the ship lanes close to the Gongqing port, Ningbo–Zhoushan port. For HCHO, the averaged VCD is 7.39×10¹⁵ molec cm−2 in the range of 1.02×10¹⁵ to 3.16×10¹⁶ molec cm−2. As in Fig. 3c, the enhanced HCHO columns were found in the section of the cruise in Hangzhou Bay, which is different than NO2 and SO2 spatial distribution. Moreover, high HCHO VCDs molec cm−2 were also appeared over the same hot spots as NO2 and SO2.
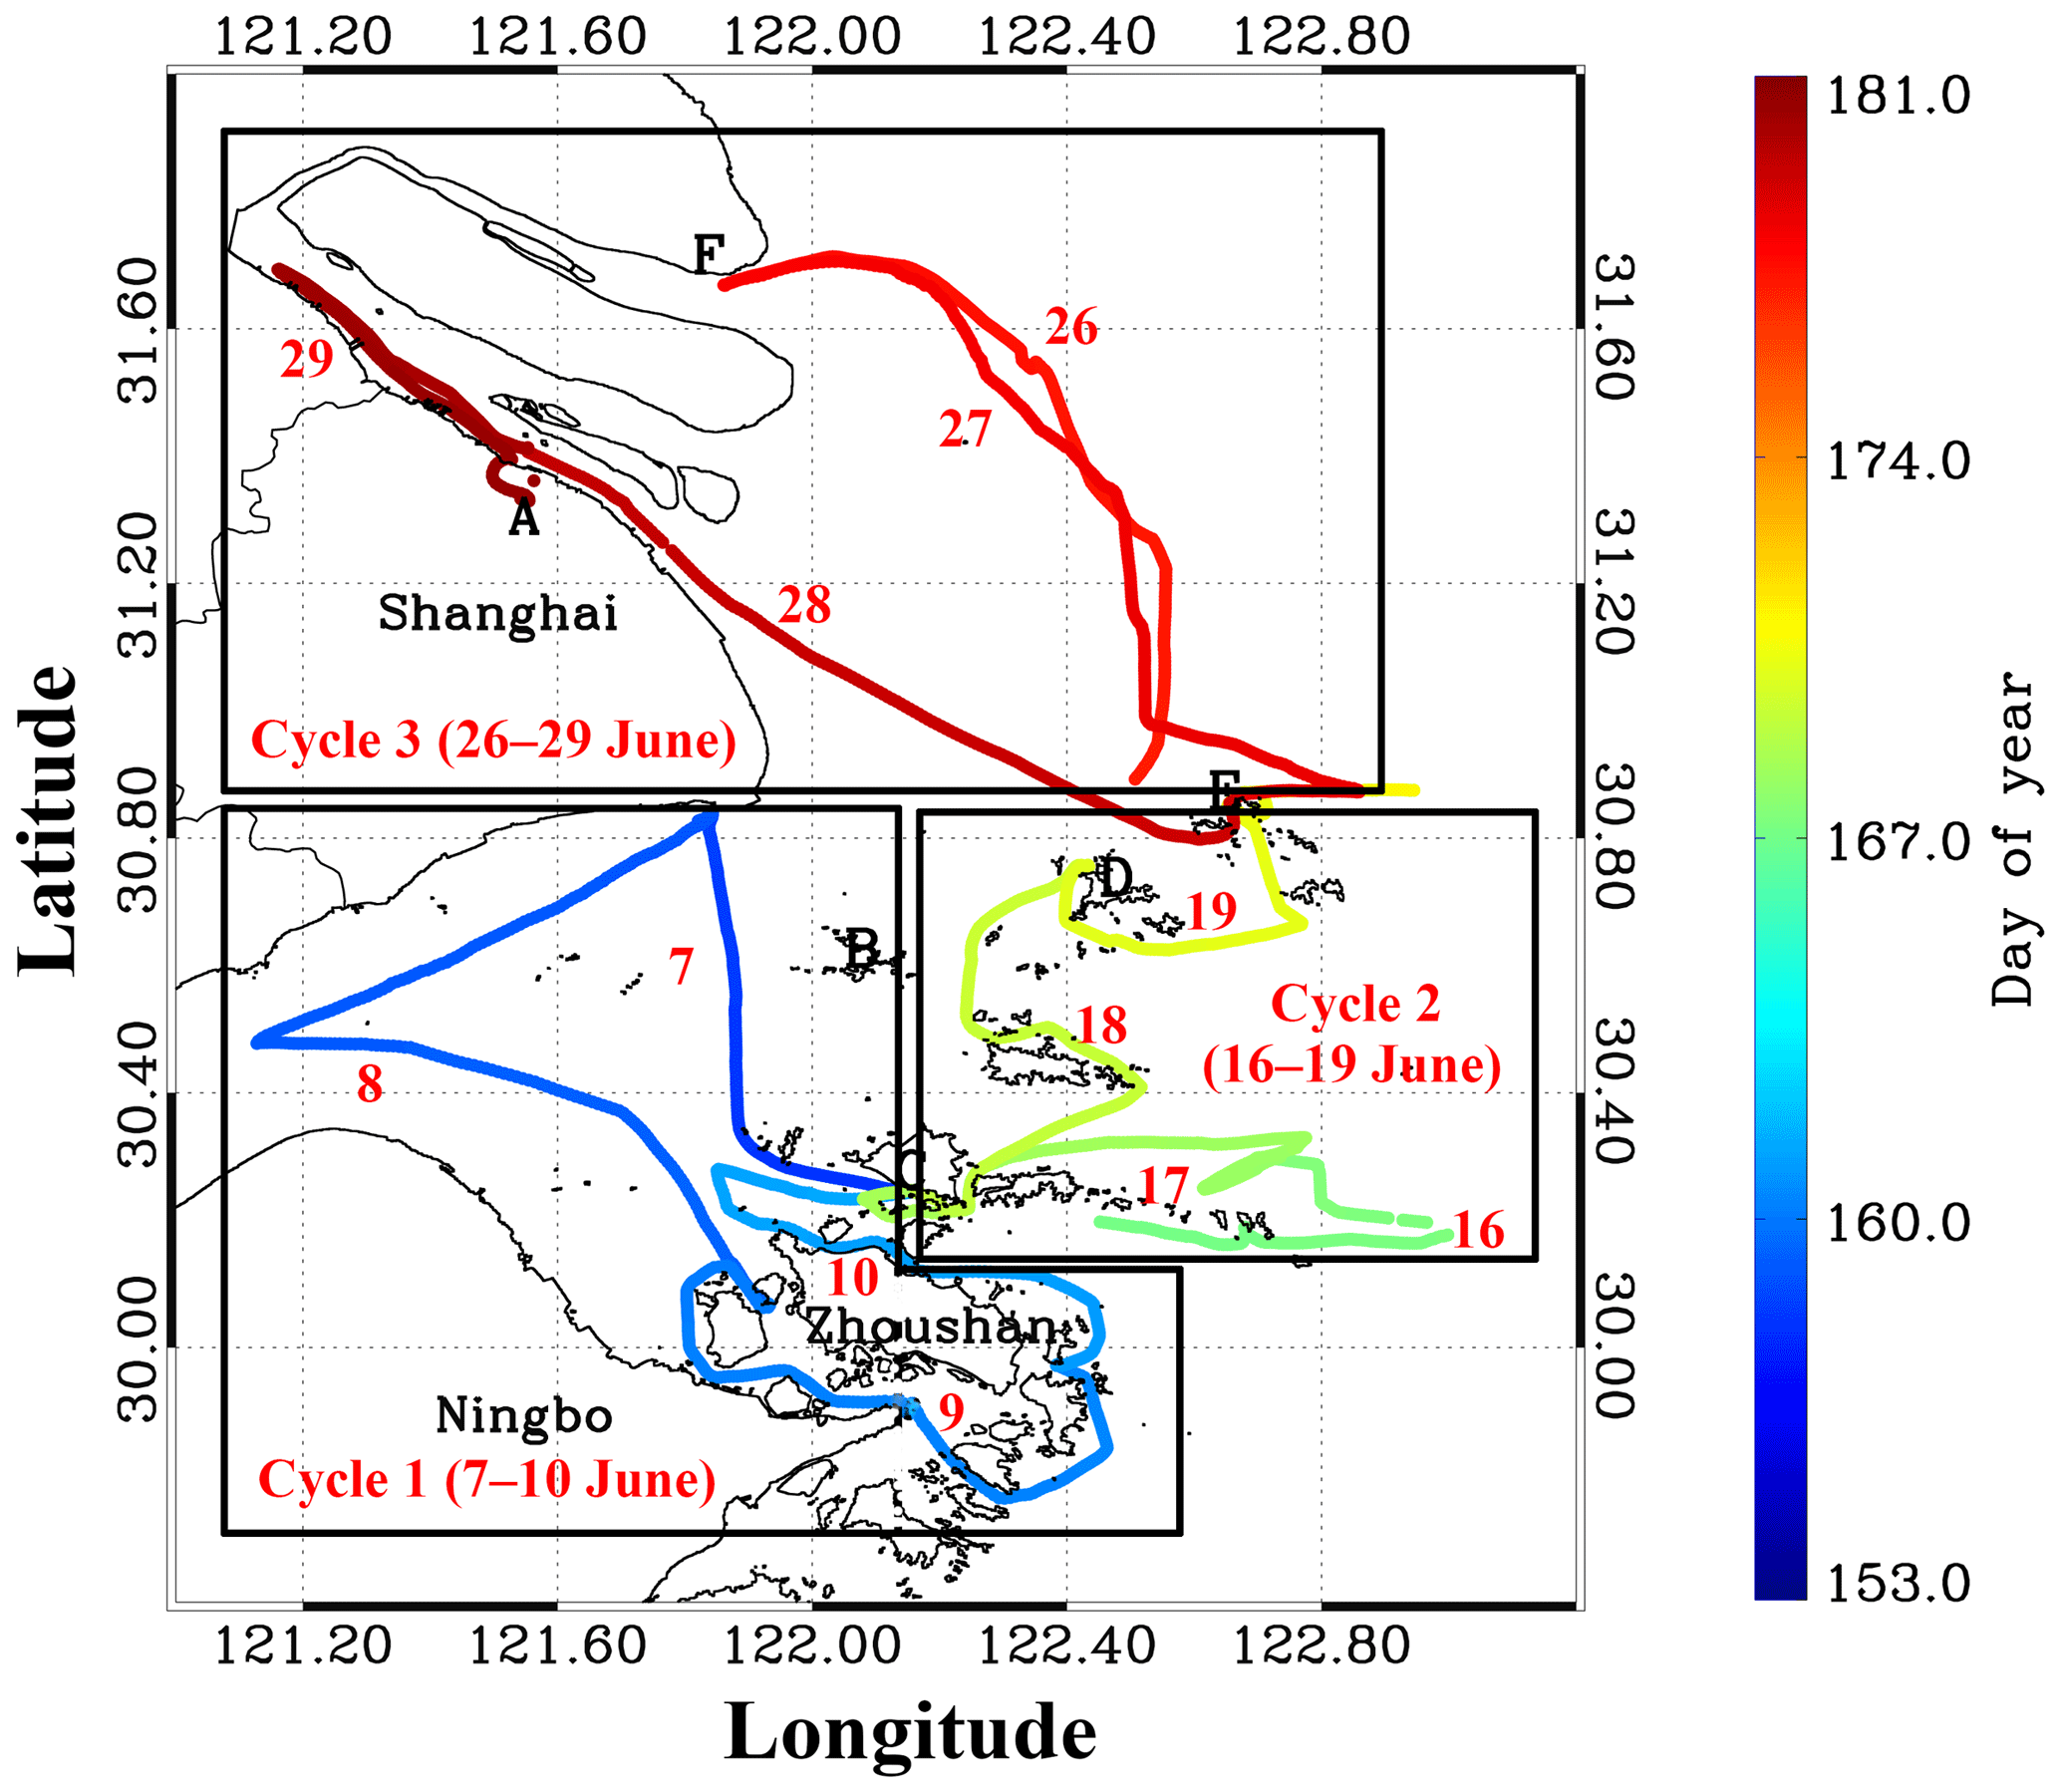

Figure 12Vertical profiles of NO2, SO2, and HCHO concentrations during the three typical observation periods: (a) measurements taken at Hangzhou Bay and the Zhoushan Islands from 7 to 10 June, (b) measurements carried out at a relatively clean area from 16 to 19 June, and (c) measurements implemented in the area of the Yangtze River estuary on 26 to 29 June.
The coastal waters of the YRD region, including Jiangsu, Shanghai, and Zhejiang, are the busiest sea area of the ECS, and the continental YRD region is also one of the most developed industrial city clusters of China or even the world. Therefore, previous studies found that the air quality in coastal sea and inland areas was affected by ship-emitted pollutants under cruising and maneuvering conditions together with continental anthropogenic pollutants (e.g., Zhao et al., 2013; Fu et al., 2014). In order to investigate impacts of ship emissions, we obtained the dependence of NO2, SO2, and HCHO VCDs on longitude in Fig. 4. It can be found that most of the peaks of trace gases occurred at the geo-locations of busy ports and ship lanes, whereas lower values are observed at remote oceanic areas (Fan et al., 2016). The spatial distribution of NO2, SO2, and HCHO over sea areas is mainly dominated by the local emission sources of ships, ports, and even coastal factories.
In addition, the spatial distribution of trace gases is also influenced significantly by meteorological conditions, especially wind speed and wind direction. Here, we calculated 24 h backward trajectories of air masses 300 m in altitude by applying the HYSPLIT (Hybrid Single-Particle Lagrangian Integrated Trajectory) model, which was developed by the National Oceanic and Atmospheric Administration Air Resource Laboratory (NOAA ARL) (http://ready.arl.noaa.gov/HYSPLIT.php, last access: 23 October 2018) (Stein et al., 2016). Global Data Assimilation System (GDAS) meteorological data with a spatial resolution of and 24 vertical levels were used in the trajectory simulation process. Figure 5 displays the daily 24 h backward trajectory results for four periods, which illustrate the origin of the air masses arriving at the endpoint (indicated by black triangle) at 04:00 UTC (12:00 LT).
In Fig. 5a and c, the air masses originated from a clean sea area from 2 to 5 and 11 to 22 June 2017. This suggests that the observed air pollutants were less impacted by airflow patterns and were instead mainly from local emission sources. For example, a high concentration of pollutants was reported on 2 and 3 June, during which the measurements were implemented on busy ship lanes in the south channel of the Yangtze River estuary. In contrast, the trace gas VCDs were much lower during most days from 11 to 22 June, when the measurements were taken over the clean sea area. Figure 5b and d show the air masses coming from inland areas from 6 to 10 and 23 to 29 June, respectively. As shown in Fig. 3, high values of NO2, SO2, and HCHO VCDs, the corresponding 95th percentiles of which are 1.81×10¹⁶, 1.05×10¹⁶, and 1.31×10¹⁶ molec cm−2 were found during the ship cruise from the Shengsi Islands to Lianxing port and back to Huaniao Island on 26 and 27 June 2017. The air mass originated from the coastal industrial zone on 26 June and the city center of Shanghai on 27 June. These pollution episodes can mainly be attributed to pollutants transported from inland cities and coastal areas combined with ship emissions in nearby waters.
3.2 Comparison with OMI and OMPS satellite products
In order to compare the ship-based MAX-DOAS and satellite data, we have to make them comparable for temporal and spatial coverage. The ship-based MAX-DOAS-measured VCDs are averaged for 13:00 to 14:00 LT according to the OMI and OMPS instrument overpass times of about 13:45 and 13:30 LT. The satellite products are averaged within a 10 km radius of the center position of the ship cruise between 13:00 and 14:00 LT considering the cruising speed at around 8–15 km h−1. Moreover, satellite data with larger error (relative error >100 %) and cloud impacts (cloud fraction >0.5) were excluded from the intercomparison. Hence, there remain 14 days of observation for NO2, SO2, and HCHO VCD comparison.
Figure 6a shows the time series of the NO2 VCD intercomparison between ship-based MAX-DOAS measurements and OMI satellite observations. These two data sets agree well with each other and have a high correlation coefficient (R) of 0.83 in Fig. 6b. However, OMI satellite observations were higher than the ship-based MAX-DOAS results on some days, which is different from the comparisons over continental areas where the satellite observations are usually much smaller than ground-based data (Liu et al., 2016). The larger discrepancies on 8, 15, and 20 June were observed in the remote ocean area, implying possible larger uncertainties of the VCD retrieval in such a clear marine environment.
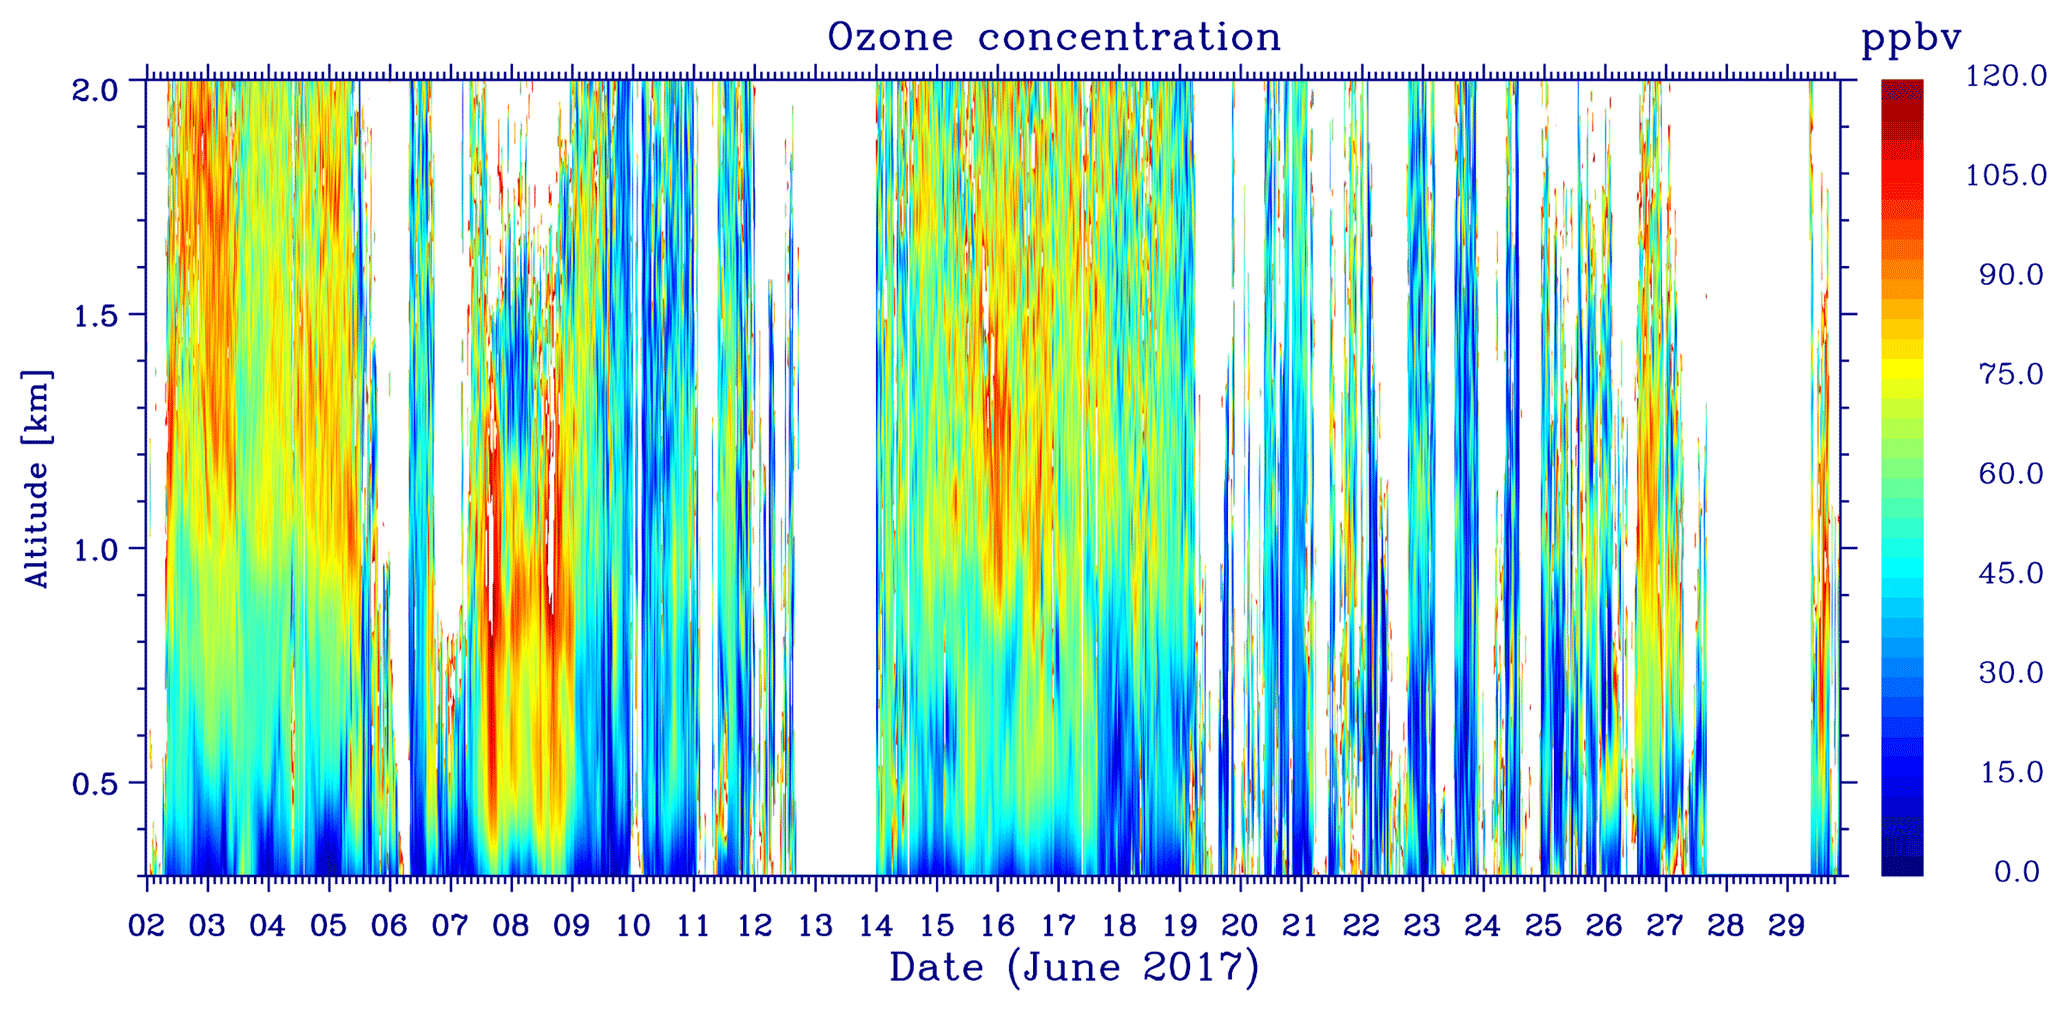
Figure 13Time series of the vertical profiles of the O3 concentrations measured by the ozone lidar in June 2017.
For the intercomparison with ship-based MAX-DOAS measurements, the space-based products of SO2 and HCHO VCDs were retrieved from the OMPS satellite. The time series of the SO2 VCDs measured by ship-based MAX-DOAS and retrieved from OMPS satellite observations are displayed in Fig. 7a. These space-based and shipborne data exhibited similar temporal trends during the campaign, showing a correlation coefficient (R) of 0.76 in Fig. 7b. Figure 8a presents the time series of the HCHO VCDs measured by ship-based MAX-DOAS together with the satellite data retrieved from OMPS observations, which also show good agreement, with a correlation coefficient (R) of 0.69 in Fig. 8b. In addition, we also found that the trace gas VCDs of NO2, SO2 and HCHO from space-based observation by the OMI and OMPS satellites are higher than ship-based MAX-DOAS measurements in a marine environment.
To characterize the spatial distribution of tropospheric NO2, SO2, and HCHO VCDs, the monthly averaged tropospheric products of OMI satellite NO2, and OMPS SO2 and HCHO in June 2017 are shown in Fig. 9. The satellite data were error (relative error >100 %) and cloud (could fraction >0.50) filtered and gridded at a high spatial resolution of . Due to the different emission sources and formation mechanisms, these three trace gases show distinct features of spatial distributions. In Fig. 9a, the hot spots of NO2 distribution were centered at the coast of the Yangtze River at Shanghai and Jiangsu Province, the Ningbo–Zhoushan port, the and Shengsi Islands. For the spatial distributions of SO2 in Fig. 9b, Qidong in Jiangsu province, the northwest part of Shanghai, and Hangzhou Bay, and even over some sea areas where there are dense waterways and ship lanes, relatively high values are expressed. In addition, the main hot spots are located at Shanghai for HCHO spatial distributions in Fig. 9c. In summary, all three trace gases have high values in some polluted continental areas, e.g., the Shanghai city center and northwest area, while hot spots over sea areas are mainly consistent with the heavy vessel and port emission areas.
Since daily satellite observations can provide a detailed regional view of the spatial distribution of gaseous pollutants, the daily distribution of NO2 VCDs was further compared between OMI data and ship-based results. Figure 10 presents the comparison for 2, 7, 16, and 27 June; the trajectories of ship-based measurements are shown in color, indicating cruise routes with the white lines, and the position of ship-based measurements at 13:00 to 14:00 LT are marked by black points. It can be observed that the color-coded ship-based measurements generally achieve a good agreement with the spatial distribution of satellite data, except for somewhere on 27 June.
To reveal some typical pollution transport process, the wind files (black arrow) were plotted overlapping each other. Combining with the wind information, the air masses came from clean sea areas on 2 and 16 June but originated from polluted inland areas on 7 and 27 June. Therefore, the observed NO2 VCDs over inland and sea areas were substantially lower on 2 and 16 June compared to measurements on 7 and 27 June. Under oceanic wind conditions, hot spots of NO2 VCDs are mainly located in the inland areas and sea areas with high shipping emission intensities, which can be attributed to the impacts of local emissions. When the wind blew from the continent on 7 and 27 June, the NO2 pollution spread from inland to the downwind water areas close to the coast and even to the sea areas far from the coast. This suggests significant influence of the pollutants transported from inland on the air quality over seawaters.
3.3 Tropospheric NO2, SO2, and HCHO profiles
In order to obtain vertical distribution of trace gases, we followed the method described in Sect. 2.2.3 to retrieve the vertical profiles of NO2, SO2, and HCHO. Daily profile results are available and three typical observation periods are presented for different characteristic areas, as indicated in Fig. 11. The measurements during cycle 1 from 7 to 10 June were located at Hangzhou Bay and the Zhoushan Islands. In cycle 2 from 16 to 19 June, the ship cruise was in the clean waters far away from the coastline. In cycle 3 from 26 to 29 June, measurement was carried out through clean to polluted areas over the waters of Shanghai, Qidong, and areas around the Yangtze River estuary.
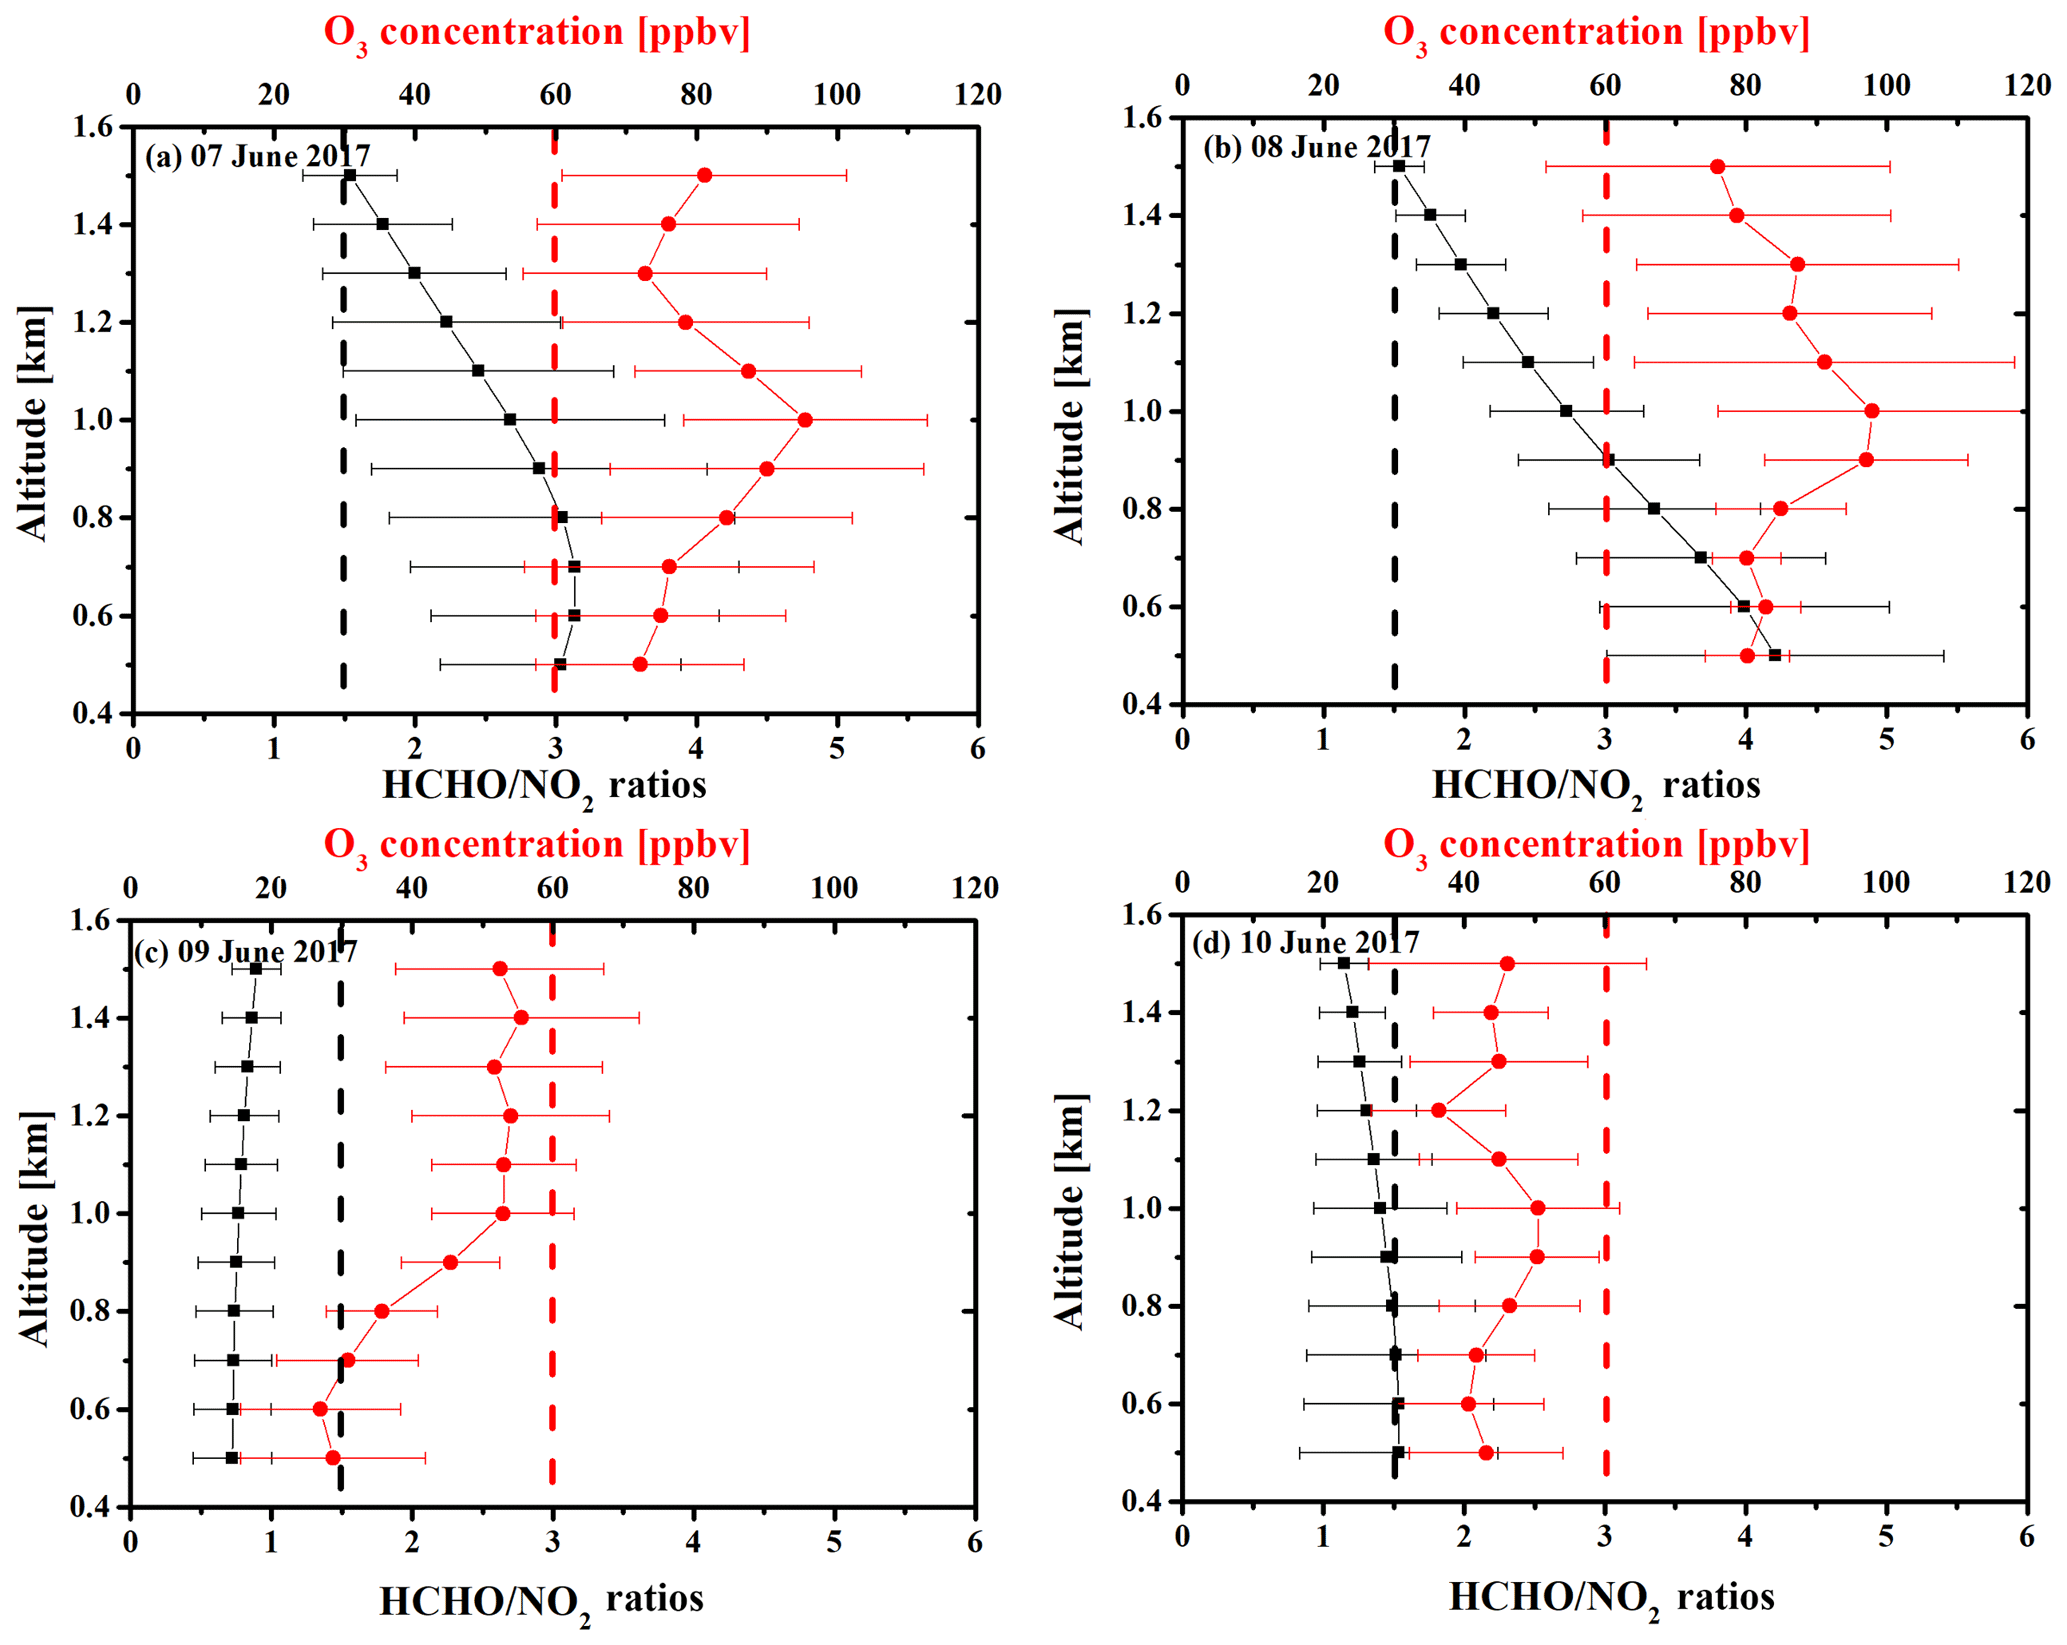
Figure 14The daily averaged vertical profiles of O3 concentrations and HCHO∕NO2 ratios at different altitudes between 09:00 and 15:00 LT on 7 to 10 June 2017.
Figure 12a–c show the diurnal variations in the vertical profiles of NO2, SO2, and HCHO concentrations during these three cycles. It is obvious that the trace gas concentrations of NO2, SO2, and HCHO in cycle 2 were lower than those of the others, which can also be confirmed by the spatial distribution of trace gas VCDs in Fig. 3. By extracting the lowest 500 m grids of the retrieved profiles, the observed concentrations of NO2, SO2, and HCHO were <3, <3, and <2 ppbv in the clean marine boundary layer. This can be explained by the fact that the measurements of cycle 2 were performed in a relatively remote sea area, which is far away from the YRD continental region and less impacted by inland emission sources and often receives clean air masses from the remote ocean (in Fig. 5c). However, higher levels of the trace gases were found during cycles 1 and 3. For example, the concentrations of NO2, SO2, and HCHO in the marine boundary layer all increased to high values on 9 and 29 June.
To track the cruise on 9 June, the ship passed through the channel between the Ningbo and Zhoushan Islands, where the Ningbo–Zhoushan port is located, the world's largest port by container throughput. The Ningbo–Zhoushan port has been reported to account for about one-third of the national port-level emissions in China (Fu et al., 2017). The hourly variation in pollutant emissions reached a peak during 09:00–14:00 LT and varied with vessel type (Yin et al., 2017). The backward trajectory on 9 June shows that the air mass originated from the coastal area. It is inferred that this pollution episode was mainly attributed to the ship emissions from coastal and oceangoing vessels, as well as cargo handling equipment in the port areas. On 29 June, observations were performed along the Yangtze River upstream until 121.15∘ E and then back to the Gongqing port of Shanghai. This waterway is the only channel going upstream of the Yangtze River and is consequently dense with inland ships. Moreover, Taicang port and some industrial zones were distributed along the coastline areas. Therefore, industrial factories and ship emissions, as well as transports from inland cities, contributed together to these elevated pollutant levels.
In addition, the vertical distributions of NO2, SO2, and HCHO in the marine boundary layer have unique features. The high NO2 concentrations were observed close to the sea surface and decreased with height. For the layer below 500 m, the lowest and highest NO2 concentrations were found to be <3 ppbv in cycle 2 and >10 ppbv during cycles 1 and 3. Almost all the measured NO2 concentrations in the marine boundary layer during this campaign are larger than the background value over the western Pacific and Indian oceans (<0.2 ppbv) (Takashima et al., 2012) and over the South China and Sulu seas (<30 pptv) (Peters et al., 2012). Due to the sulfur-containing marine fuels, ship emissions are the primary source of SO2 over the seas. Therefore, intermittent enhanced SO2 signals were detected during the whole cruise as shown in Fig. 12, even for the relatively clean area in cycle 2, where the SO2 concentrations exceeded 3 ppbv at times. It implies that the frequently observed SO2 pulses are the emissions from the kinds of vessels in the vicinity or even from the cruise ship itself.
As distinguished from NO2 and SO2 vertical profiles, the highest HCHO concentrations are located at elevated altitudes (about 500 m) during cycles 1 and 3 since there are no HCHO sources from the sea surface. A similar phenomenon was also reported in a study over the remote western Pacific Ocean, where the highest concentrations of HCHO occurred at altitudes of 400 m (Peters et al., 2012). Furthermore, extremely high HCHO concentrations of >5 ppbv appeared as the ship cruised along coastal and busy port areas in cycles 1 and 3, while the low concentration of about 1.2 ppbv was measured in cycle 2. However, the observed lowest levels of HCHO in the marine boundary layer of the ECS area were almost equal to the highest value (∼1.1 ppbv) measured in the remote western Pacific Ocean (Peters et al., 2012). The behavior of NO2, SO2, and HCHO concentrations highlighted the obvious shipping emissions along the ship lanes and close the busy ports and further significant impacts on the regional air quality over the ECS areas.
3.4 Ozone formation
Figure 13 presents the onboard DIAL-observed vertical distributions of ozone concentrations from 300 m up to 2 km above sea level (km a.s.l.) during the campaign. Except the absence on 13 and 28 June due to power failure, there were 26 days of measurement results. It is found that the ozone concentrations in the marine environment showed a characteristic vertical structure, the O3 concentrations increased with altitude from 300 m to 1.0 km a.s.l., and high values >100 ppbv were mostly distributed at altitudes higher than 1 km a.s.l. However, the high ozone concentrations were detected from 300 m and spread to 1.4 km on 7 and 8 June. For the diurnal patterns, the O3 concentrations usually began to increase in the morning with the enhancing solar radiation and accumulated to arrive at the daily peak in the afternoon, then declining with the decrease in sun illumination. Similar diurnal variations were also reported in previous studies over continental areas, e.g., measurements in nearby Hangzhou, Zhejiang Province (Su et al., 2017). The study indicated the daytime intense photochemical processes in the marine boundary layer.
In order to investigate the formation and consumption processes of ozone, we integrated the vertical profiles of O3 by lidar, NO2, and HCHO profiles from MAX-DOAS together. We averaged the daily profiles of O3 and the ratio of HCHO∕NO2 during the intense photochemical periods between 09:00 and 16:00 LT. Figure 14 shows the vertically resolved comparisons between O3 and HCHO∕NO2 ratio profiles on 7 to 10 June. Referring to Fig. 12, the NO2 concentrations were higher on 9 and 10 but lower on 7 and 8, while the HCHO concentrations remained at high levels during all of cycle 1 from 7 to 10 June. Accordingly, the ratios of HCHO to NO2 on 7 and 8 June were higher than those on 9 and 10 June. Meanwhile, the O3 concentrations ranged at different altitudes from 70 to 100 ppbv in the marine boundary layer on 7 and 8 June, however, they were below 60 ppbv on 9 and 10 June. It can be inferred that the high-O3 episodes on 7 and 8 June were controlled by the NOx regime of ozone formation because the O3 concentration dropped significantly with the increase in NOx concentration and simultaneous decrease in HCHO∕NO2 ratio. As shown in Fig. 5b, air masses on 7 and 8 June originated from northwest inland areas; however, they originated from southwest coastal areas on 9 and 10 June. Air masses transportation from different regions may also have contributed to this ozone pollution episode. Furthermore, it can be concluded that the high O3 concentrations exceeding 60 ppbv can be expected with ratios of HCHO to NO2 larger than 1.5 and vice versa during this case.
In this paper, ship-based MAX-DOAS and ozone lidar measurements were performed in the YRD region over the ECS area from 2 to 29 June 2017. During this campaign, the measured VCDs of NO2, SO2, and HCHO were first reported to be 6.50×10¹⁵, 4.28×10¹⁵, and 7.39×10¹⁵ molec cm−2, respectively, for the ECS area. In order to provide validation of space-based observation over marine areas, the ship-based measured tropospheric NO2, SO2, and HCHO VCDs were compared with satellite products. NO2, SO2, and HCHO showed good agreement between MAX-DOAS results and satellite products, with a correlation coefficient R of 0.83, 0.76, and 0.69, respectively. Furthermore, the spatial distribution of trace gases along the ship cruise demonstrated that the enhanced pollution of trace gases is usually related to the emissions from vessels in nearby waterways and busy ports. In general, the levels of trace gases decreased with distance from the coastline, whereas the exceptional case of high values observed on 26 and 27 June at a relatively remote sea area is mainly owed to the transport process from continental areas with the favor of meteorological conditions.
The daily vertical profiles of NO2, SO2, and HCHO were obtained by the retrieval from MAX-DOAS measurements using the HEIPRO algorithm. The trace gas concentrations in the bottom of the marine boundary layer are <3, <3, and <2 ppbv for NO2, SO2, and HCHO, respectively, over the relatively clean offshore areas far away from the YRD region. However, we also frequently found elevated SO2 concentration during the cruise, which is attributed to the nearby ship emissions. Combining the ratio of HCHO∕NO2 profiles from ship-based MAX-DOAS with O3 vertical profiles from the ozone lidar, typical O3 formation was identified to be related to the increase in NO2 concentration and relatively lower HCHO∕NO2 ratios. This study highlighted the strong impacts of shipping emissions on the air quality in the marine boundary layer of ECS areas, which need to be regulated urgently in the coming future, especially for the YRD region where the world's two biggest ports are located.
All measurement data used in this study can be made available for scientific purposes upon request to the corresponding authors (shanshanwang@fudan.edu.cn and chliu81@ustc.edu.cn).
WT, CL, and SSW designed and implemented the research and wrote the paper; WT, CZX, and HRL carried out the MAX-DOAS observations; WJS, CXZ, CZX, and ZNC contributed to the satellite data retrieval; JGL provided the ozone lidar data.
The authors declare that they have no conflict of interest.
This article is part of the special issue “Regional transport and transformation of air pollution in eastern China”. It is not associated with a conference.
This research was supported by grants from the National Key Research and
Development Program of China (2018YFC0213104, 2018YFC0213100,2016YFC0203302,
2017YFC0210002), National Natural Science Foundation of China (41722501,
91544212, 51778596, 41575021, 41775113), and Shanghai Pujiang Talent Program
(17PJC015). We acknowledge the NOAA Air Resources Laboratory (ARL) for making
the HYSPLIT transport and dispersion model available on the Internet
(http://ready.arl.noaa.gov/, last access: 23 October 2018). We would
like to also thank Fudan University for organizing the ship-based campaign
and Hefei Institute of Physical Science, Chinese Academy of Sciences for the
technical support of lidar measurement.
Edited
by: Yuanhang Zhang
Reviewed by: Mark Wenig and two anonymous referees
Baidar, S., Oetjen, H., Coburn, S., Dix, B., Ortega, I., Sinreich, R., and Volkamer, R.: The CU Airborne MAX-DOAS instrument: vertical profiling of aerosol extinction and trace gases, Atmos. Meas. Tech., 6, 719–739, https://doi.org/10.5194/amt-6-719-2013, 2013.
Boersma, K. F., Eskes, H. J., Dirksen, R. J., van der A, R. J., Veefkind, J. P., Stammes, P., Huijnen, V., Kleipool, Q. L., Sneep, M., Claas, J., Leitão, J., Richter, A., Zhou, Y., and Brunner, D.: An improved tropospheric NO2 column retrieval algorithm for the Ozone Monitoring Instrument, Atmos. Meas. Tech., 4, 1905–1928, https://doi.org/10.5194/amt-4-1905-2011, 2011.
Brinksma, E., Pinardi, G., Braak, R., Volten, H., Richter, A., Schonhardt, A., Van Roozendael, M., Fayt, C., Hermans, C., Dirksen, R., Vlemmix, T., Berkhout, A. J. C., Swart, D. P. J., Oetjen, H., Wittrock, F., Wagner, T., Ibrahim, O. W., de Leeuw, G., Moerman, M., Curier, R. L., Celarier, E. A., Knap, W. H., Veefkind, J. P., Eskes, H. J., Allaart, M., Rothe, R., Piters, A. J. M., and Levelt, P.: The 2005 and 2006 DANDELIONS NO2 and aerosol intercomparison campaigns, J. Geophys. Res., 113, D16S46, https://doi.org/10.1029/2007JD008808, 2008.
Chan, K. L., Hartl, A., Lam, Y. F., Xie, P. H., Liu, W. Q., Cheung, H. M., Lampel, J., Pöhler, D., Li, A., Xu, J., Zhou, H. J., Ning, Z., and Wenig, M. O.: Observations of tropospheric NO2 using ground based MAX-DOAS and OMI measurements during the Shanghai World Expo 2010, Atmos. Environ., 119, 45–58, https://doi.org/10.1016/j.atmosenv.2015.08.041, 2015.
Chance, K. V. and Spurr, R. J. D.: Ring effect studies: Rayleigh scattering, including molecular parameters for rotational Raman scattering, and the Fraunhofer spectrum, Appl. Opt., 36, 5224–5230, https://doi.org/10.1364/AO.36.005224, 1997.
Chance, K. and Kurucz, R. L.: An improved high-resolution solar reference spectrum for earth's atmosphere measurements in the ultraviolet, visible, and near infrared, J. Quant. Spectrosc. Ra., 111, 1289–1295, https://doi.org/10.1016/j.jqsrt.2010.01.036, 2010.
Chen, T., Deng, S., Gao, Y., Qu, L., Li, M., and Chen, D.:. Characterization of air pollution in urban areas of Yangtze River Delta, China, Chinese Geogr. Sci., 27, 836–846, https://doi.org/10.1007/s11769-017-0900-z, 2017.
Dittman, M. G., Ramberg, E., Chrisp, M., Rodriguez, J. V., Sparks, A. L., Zaun, N. H., Hendershot, P., Dixon, T., Philbrick, R. H., and Wasinger, D.: Nadir ultraviolet imaging spectrometer for the NPOESS Ozone Mapping and Profiler Suite (OMPS), Earth Observing Systems VII, edited by: Barnes, W. L., Proc. SPIE, 4814, 2002.
Dix, B., Koenig, T. K., and Volkamer, R.: Parameterization retrieval of trace gas volume mixing ratios from Airborne MAX-DOAS, Atmos. Meas. Tech., 9, 5655–5675, https://doi.org/10.5194/amt-9-5655-2016, 2016.
Fan, Q., Zhang, Y., Ma, W., Ma, H., Feng, J., Yu, Q., Yang, X., Ng, S. K. W., Fu, Q., and Chen, L.: Spatial and seasonal dynamics of ship emissions over the Yangtze River Delta and East China Sea and their potential environmental Influence, Environ. Sci. Technol., 50, 1322–1329, https://doi.org/10.1021/acs.est.5b03965, 2016.
Fleischmann, O. C., Hartmann, M., Burrows J. P., and Orphal, J.: New ultraviolet absorption cross-sections of BrO at atmospheric temperatures measured by time-windowing Fourier transform spectroscopy, J. Photochem. Photobiol. A, 168, 117–132, https://doi.org/10.1016/j.jphotochem.2004.03.026, 2004.
Frieß, U., Monks, P. S., Remedios, J. J., Rozanov, A., Sinreich, R., Wagner, T., and Platt, U.: MAX-DOAS O4 measurements: A new technique to derive information on atmospheric aerosols: 2. Modeling studies, J. Geophys. Res.-Atmos., 111, D14203, https://doi.org/10.1029/2005JD006618, 2006.
Frieß, U., Sihler, H., Sander, R., Pöhler, D., Yilmaz, S., and Platt, U.: The vertical distribution of BrO and aerosols in the Arctic: Measurements by active and passive differential optical absorption spectroscopy, J. Geophys. Res.-Atmos., 116, D00R04, https://doi.org/10.1029/2011JD015938, 2011.
Frieß, U., Klein Baltink, H., Beirle, S., Clémer, K., Hendrick, F., Henzing, B., Irie, H., de Leeuw, G., Li, A., Moerman, M. M., van Roozendael, M., Shaiganfar, R., Wagner, T., Wang, Y., Xie, P., Yilmaz, S., and Zieger, P.: Intercomparison of aerosol extinction profiles retrieved from MAX-DOAS measurements, Atmos. Meas. Tech., 9, 3205–3222, https://doi.org/10.5194/amt-9-3205-2016, 2016.
Fu, T. M., Jacob, D. J., Palmer, P. I., Chance, K., Wang, Y. X., Barletta, B., Blake, D. R., Stanton, J. C., and Pilling, M. J.: Space-based formaldehyde measurements as constraints on volatile organic compound emissions in east and south Asia and implications for ozone, J. Geophys. Res.-Atmos., 112, D06312, https://doi.org/10.1029/2006JD007853, 2007.
Fu, H. B., Shang, G. F., Lin, J., Hu, Y. J., Hu, Q. Q., Guo, L., Zhang, Y. C., and Chen, J. M.: Fractional iron solubility of aerosol particles enhanced by biomass burning and ship emission in Shanghai, East China, Sci. Total Environ., 481, 377–391, https://doi.org/10.1016/j.scitotenv.2014.01.118, 2014.
Fu, M., Liu, H., Jin, X., He, K.: National- to port-level inventories of shipping emissions in China, Environ. Res. Lett., 12, 114024, https://doi.org/10.1088/1748-9326/aa897a, 2017.
González Abad, G., Vasilkov, A., Seftor, C., Liu, X., and Chance, K.: Smithsonian Astrophysical Observatory Ozone Mapping and Profiler Suite (SAO OMPS) formaldehyde retrieval, Atmos. Meas. Tech., 9, 2797–2812, https://doi.org/10.5194/amt-9-2797-2016, 2016.
Halla, J. D., Wagner, T., Beirle, S., Brook, J. R., Hayden, K. L., O'Brien, J. M., Ng, A., Majonis, D., Wenig, M. O., and McLaren, R.: Determination of tropospheric vertical columns of NO2 and aerosol optical properties in a rural setting using MAX-DOAS, Atmos. Chem. Phys., 11, 12475–12498, https://doi.org/10.5194/acp-11-12475-2011, 2011.
Hong, Q., Liu, C., Chan, K. L., Hu, Q., Xie, Z., Liu, H., Si, F., and Liu, J.: Ship-based MAX-DOAS measurements of tropospheric NO2, SO2, and HCHO distribution along the Yangtze River, Atmos. Chem. Phys., 18, 5931–5951, https://doi.org/10.5194/acp-18-5931-2018, 2018.
Hönninger, G., von Friedeburg, C., and Platt, U.: Multi axis differential optical absorption spectroscopy (MAX-DOAS), Atmos. Chem. Phys., 4, 231–254, https://doi.org/10.5194/acp-4-231-2004, 2004.
Hutchinson, T. C. and Whitby, L. M.: The effects of acid rainfall and heavy metal particulates on a boreal Forest ecosystem near the sudbury smelting region of Canada, Water Air Soil Pollut., 7, 421–438, https://doi.org/10.1007/BF00285542, 1977.
Irie, H., Takashima, H., Kanaya, Y., Boersma, K. F., Gast, L., Wittrock, F., Brunner, D., Zhou, Y., and Van Roozendael, M.: Eight-component retrievals from ground-based MAX-DOAS observations, Atmos. Meas. Tech., 4, 1027–1044, https://doi.org/10.5194/amt-4-1027-2011, 2011.
Johansson, M., Galle, B., Yu, T., Tang, L., Chen, D., Li, H., Li, J. X., and Zhang, Y.: Quantification of total emission of air pollutants from Beijing using mobile mini-DOAS, Atmos. Environ., 42, 6926–6933, https://doi.org/10.1016/j.atmosenv.2008.05.025, 2008.
Lee, D. S., Köhler, I., Grobler, E., Rohrer, F., Sausen, R., Gallardo-Klenner, L., Olivier, J. G. J., Dentener, F. J., and Bouwman, A. F.: Estimations of global no, emissions and their uncertainties, Atmos. Environ., 31, 1735–1749, https://doi.org/10.1016/S1352-2310(96)00327-5, 1997.
Lelieveld, J. and Dentener, F. J.: What controls tropospheric ozone?, J. Geophys. Res.-Atmos., 105, 3531–3551, https://doi.org/10.1029/1999JD901011, 2000.
Lelieveld, J., Peters, W., Dentener, F. J., and Krol, M. C.: Stability of tropospheric hydroxyl chemistry, J. Geophys. Res.-Atmos., 107, 4715, https://doi.org/10.1029/2002JD002272, 2002.
Levelt, P. F., van den Oord, G. H. J., Dobber, M. R., Mälkki, A., Visser, H., de Vries, J., Stammes, P., Lundell, J. O. V., and Saari, H.: The Ozone Monitoring Instrument, IEEE T. Geosci. Remote, 44, 1093–1101, https://doi.org/10.1109/TGRS.2006.872333, 2006.
Liu, H., Cheng, L., Xie, Z., Ying, L., Xin, H., Wang, S., Jin, X., and Xie, P.: A paradox for air pollution controlling in China revealed by “APEC Blue” and “Parade Blue”, Sci. Rep., 6, 34408, https://doi.org/10.1038/srep34408, 2016.
Longo, B. M., Yang, W., Green, J. B., Crosby, F. L., and Crosby, V. L.: Acute health effects associated with exposure to volcanic air pollution (vog) from increased activity at Kilauea Volcano in 2008, J. Toxicol. Env. Heal. A, 73, 1370–1381, https://doi.org/10.1080/15287394.2010.497440, 2010.
Meller, R. and Moortgat, G. K.: Temperature dependence of the absorption cross sections of formaldehyde between 223 and 323 K in the wavelength range 225–375 nm, J. Geophys. Res.-Atmos., 105, 7089–7101, https://doi.org/10.1029/1999JD901074, 2000.
Millet, D. B., Jacob, D. J., Boersma, K. F., Fu, T. M., Kurosu, T. P., Chance, K., Heald, C. L., and Guenther, A.: Spatial distribution of isoprene emissions from North America derived from formaldehyde column measurements by the OMI satellite sensor, J. Geophys. Res.-Atmos., 113, D02307, https://doi.org/10.1029/2007JD008950, 2008.
Peters, E., Wittrock, F., Großmann, K., Frieß, U., Richter, A., and Burrows, J. P.: Formaldehyde and nitrogen dioxide over the remote western Pacific Ocean: SCIAMACHY and GOME-2 validation using ship-based MAX-DOAS observations, Atmos. Chem. Phys., 12, 11179–11197, https://doi.org/10.5194/acp-12-11179-2012, 2012.
Pinardi, G., Van Roozendael, M., Abuhassan, N., Adams, C., Cede, A., Clémer, K., Fayt, C., Frieß, U., Gil, M., Herman, J., Hermans, C., Hendrick, F., Irie, H., Merlaud, A., Navarro Comas, M., Peters, E., Piters, A. J. M., Puentedura, O., Richter, A., Schönhardt, A., Shaiganfar, R., Spinei, E., Strong, K., Takashima, H., Vrekoussis, M., Wagner, T., Wittrock, F., and Yilmaz, S.: MAX-DOAS formaldehyde slant column measurements during CINDI: intercomparison and analysis improvement, Atmos. Meas. Tech., 6, 167–185, https://doi.org/10.5194/amt-6-167-2013, 2013.
Platt, U. and Stutz, J.: Differential Optical Absorption Spectroscopy, ISBN 978-3-540-21193-8, Springer, Berlin-Heidelberg, 138–141, 2008.
Pope, C. A. and Dockery, D. W.: Health effects of fine particulate air pollution: lines that connect, J. Air Waste Manage. Assoc., 56, 709–742, https://doi.org/10.1080/10473289.2006.10464485, 2006.
Rodgers, C. D.: Inverse methods for atmospheric sounding: Theory and practice, World scientific, Singapore, 2000.
Rozanov, A., Vladimir, V., Rozanov, M., Buchwitz, A., Kokhanovsky, A., and Burrows, J. P.: SCIATRAN 2.0 – A new radiative transfer model for geophysical applications in the 175–2400 nm spectral region, Adv. Space Res., 36, 1015–1019, https://doi.org/10.1016/j.asr.2005.03.012, 2005.
Schreier, S. F., Peters, E., Richter, A., Lampel, J., Wittrock, F., and Burrows, J. P.: Ship-based MAX-DOAS measurements of tropospheric NO2 and SO2 in the South China and Sulu Sea, Atmos. Environ., 102, 331–343, https://doi.org/10.1016/j.atmosenv.2014.12.015, 2015.
Seftor, C. J., Jaross, G., Kowitt, M., Haken, M., Li, J., and Flynn, L. E.: Postlaunch performance of the Suomi National Polar-orbiting Partnership Ozone Mapping and Profiler Suite (OMPS) nadir sensors, J. Geophys. Res.-Atmos., 119, 4413–4428, https://doi.org/10.1002/2013JD020472, 2014.
Seinfeld, J. H. and Pandis, S. N.: Atmospheric chemistry and physics: From air pollution to climate change, 2nd Edn., John Wiley and Sons, Hoboken, NJ, 2006.
Serdyuchenko, A., Gorshelev, V., Weber, M., Chehade, W., and Burrows, J. P.: High spectral resolution ozone absorption cross-sections – Part 2: Temperature dependence, Atmos. Meas. Tech., 7, 625–636, https://doi.org/10.5194/amt-7-625-2014, 2014.
Shaiganfar, R., Beirle, S., Sharma, M., Chauhan, A., Singh, R. P., and Wagner, T.: Estimation of NOx emissions from Delhi using Car MAX-DOAS observations and comparison with OMI satellite data, Atmos. Chem. Phys., 11, 10871–10887, https://doi.org/10.5194/acp-11-10871-2011, 2011.
Shaiganfar, R., Beirle, S., Denier van der Gon, H., Jonkers, S., Kuenen, J., Petetin, H., Zhang, Q., Beekmann, M., and Wagner, T.: Estimation of the Paris NOx emissions from mobile MAX-DOAS observations and CHIMERE model simulations during the MEGAPOLI campaign using the closed integral method, Atmos. Chem. Phys., 17, 7853–7890, https://doi.org/10.5194/acp-17-7853-2017, 2017.
Sinreich, R., Coburn, S., Dix, B., and Volkamer, R.: Ship-based detection of glyoxal over the remote tropical Pacific Ocean, Atmos. Chem. Phys., 10, 11359–11371, https://doi.org/10.5194/acp-10-11359-2010, 2010
Solomon, S., Schmeltekopf, A. L., and Sanders, R. W.: On the interpretation of zenith sky absorption measurements, J. Geophys. Res.-Atmos., 92, 8311–8319, https://doi.org/10.1029/JD092iD07p08311, 1987.
Solomon, S., Portmann, R. W., Sanders, R. W., Daniel, J. S., Madsen, W., Bartram, B., and Dutton, E. G.: On the role of nitrogen dioxide in the absorption of solar radiation, J. Geophys. Res.-Atmos., 104, 12047–12058, https://doi.org/10.1029/1999JD900035, 1999.
Stavrakou, T., Müller, J.-F., De Smedt, I., Van Roozendael, M., Kanakidou, M., Vrekoussis, M., Wittrock, F., Richter, A., and Burrows, J. P.: The continental source of glyoxal estimated by the synergistic use of spaceborne measurements and inverse modelling, Atmos. Chem. Phys., 9, 8431–8446, https://doi.org/10.5194/acp-9-8431-2009, 2009a.
Stavrakou, T., Müller, J.-F., De Smedt, I., Van Roozendael, M., van der Werf, G. R., Giglio, L., and Guenther, A.: Global emissions of non-methane hydrocarbons deduced from SCIAMACHY formaldehyde columns through 2003–2006, Atmos. Chem. Phys., 9, 3663–3679, https://doi.org/10.5194/acp-9-3663-2009, 2009b.
Stein, A. F., Draxler, R. R., Rolph, G. D., Stunder, B. J. B., Cohen, M. D., and Ngan, F.: NOAA's HYSPLIT Atmospheric Transport and Dispersion Modeling System, B. Am. Meteorol. Soc., 96, 2059–2077, https://doi.org/10.1175/BAMS-D-14-00110.1, 2016.
Song, C. B., Wu, L., Xie, Y. C., He, J. J., Chen, X., Wang, T., Lin, Y. C., Jin, T. S., Wang, A. X., Liu, Y., Dai, Q. L., Liu, B. S., Wang, Y. N., and Mao, H. J.: Air pollution in China: status and spatiotemporal variations, Environ. Pollut., 227, 334–347, https://doi.org/10.1016/j.envpol.2017.04.075, 2017.
Su, W., Liu, C., Hu, Q., Fan, G., Xie, Z., Huang, X., Zhang, T., Chen, Z., Dong, Y., Ji, X., Liu, H., Wang, Z., and Liu, J.: Characterization of ozone in the lower troposphere during the 2016 G20 conference in Hangzhou, Sci. Rep., 7, 17368, https://doi.org/10.1038/s41598-017-17646-x, 2017.
Takashima, H., Irie, H., Kanaya, Y., and Syamsudin, F.: NO2 observations over the western Pacific and Indian Ocean by MAX-DOAS on Kaiyo, a Japanese research vessel, Atmos. Meas. Tech., 5, 2351–2360, https://doi.org/10.5194/amt-5-2351-2012, 2012.
Thalman, R. and Volkamer, R.: Temperature dependent absorption cross-sections of O2-O2 collision pairs between 340 and 630 nm and at atmospherically relevant pressure, Phys. Chem. Chem. Phys., 15, 15371–15381, https://doi.org/10.1039/C3CP50968K, 2013.
Vandaele, A. C., Hermans, C., Simon, P. C., Carleer, M., Colin, R., Fally, S., Mérienne, M. F., Jenouvrier, A., and Coquart, B.: Measurements of the NO2 absorption cross-section from 42 000 cm−1 to 10 000 cm−1 (238–1000 nm) at 220 K and 294 K, J. Quant. Spectrosc. Ra., 59, 171–184, https://doi.org/10.1016/S0022-4073(97)00168-4, 1998.
Vandaele, A. C., Hermans, C., and Fally, S.: Fourier transform measurements of SO2 absorption cross sections: II.: Temperature dependence in the 29 000–44 000 cm−1 (227–345 nm) region, J. Quant. Spectrosc. Ra., 110, 2115–2126, https://doi.org/10.1016/j.jqsrt.2009.05.006, 2009.
Wagner, T., Ibrahim, O., Shaiganfar, R., and Platt, U.: Mobile MAX-DOAS observations of tropospheric trace gases, Atmos. Meas. Tech., 3, 129–140, https://doi.org/10.5194/amt-3-129-2010, 2010.
Wang, S., Zhou, B., Wang, Z., Yang, S., Hao, N., Valks, P., Trautmann, T., and Chen, L.: Remote sensing of NO2 emission from the central urban area of Shanghai (China) using the mobile DOAS technique, J. Geophys. Res.-Atmos., 117, D13305, https://doi.org/10.1029/2011JD016983, 2012.
Wang, T., Hendrick, F., Wang, P., Tang, G., Clémer, K., Yu, H., Fayt, C., Hermans, C., Gielen, C., Müller, J.-F., Pinardi, G., Theys, N., Brenot, H., and Van Roozendael, M.: Evaluation of tropospheric SO2 retrieved from MAX-DOAS measurements in Xianghe, China, Atmos. Chem. Phys., 14, 11149–11164, https://doi.org/10.5194/acp-14-11149-2014, 2014.
Xing, C., Liu, C., Wang, S., Chan, K. L., Gao, Y., Huang, X., Su, W., Zhang, C., Dong, Y., Fan, G., Zhang, T., Chen, Z., Hu, Q., Su, H., Xie, Z., and Liu, J.: Observations of the vertical distributions of summertime atmospheric pollutants and the corresponding ozone production in Shanghai, China, Atmos. Chem. Phys., 17, 14275–14289, https://doi.org/10.5194/acp-17-14275-2017, 2017.
Yin, P., Huang, Z., Zheng, D., Wang, X., Tian, X., Zheng, J., and Zhang, Y.: Marine vessel emission and its temporal and spatial distribution characteristics in Ningbo-Zhoushan Port, China Environ. Sci., 37, 27–37, 2017. (in Chinese)
Zhang, Y., Yang, X., Brown, R., Yang, L. P., Morawska, L., Ristovski, Z., Fu, Q. Y., and Huang, C.: Shipping emissions and their impacts on air quality in China, Sci. Total Environ., 581, 186–198, https://doi.org/10.1016/j.scitotenv.2016.12.098, 2017.
Zhao, M., Zhang, Y., Ma, W., Fu, Q., Xin, Y., Li, C., Zhou, B., Yu, Q., and Chen, L.: Characteristics and ship traffic source identification of air pollutants in China's largest port, Atmos. Environ. 64, 277–286, https://doi.org/10.1016/j.atmosenv.2012.10.007, 2013.