the Creative Commons Attribution 4.0 License.
the Creative Commons Attribution 4.0 License.
 | 23 Oct 2018
Source contributions and potential reductions to health effects of particulate matter in India
Hao Guo
Sri Harsha Kota
Kaiyu Chen
Shovan Kumar Sahu
Jianlin Hu
Yuan Wang
Health effects of exposure to fine particulate matter (PM2.5) in India were estimated in this study based on a source-oriented version of the Community Multi-scale Air Quality (CMAQ) model. Contributions of different sources to premature mortality and years of life lost (YLL) were quantified in 2015. Premature mortality due to cerebrovascular disease (CEVD) was the highest in India (0.44 million), followed by ischaemic heart disease (IHD, 0.40 million), chronic obstructive pulmonary disease (COPD, 0.18 million), and lung cancer (LC, 0.01 million), with a total of 1.04 million deaths. The states with highest premature mortality were Uttar Pradesh (0.23 million), Bihar (0.12 million), and West Bengal (0.10 million). The highest total YLL was 2 years in Delhi, and the Indo-Gangetic plains and eastern India had higher YLL (∼1 years) than other regions. The residential sector was the largest contributor to PM2.5 concentrations (∼40 µg m−3), total premature mortality (0.58 million), and YLL (∼0.2 years). Other important sources included industry (∼20 µg m−3), agriculture (∼10 µg m−3), and energy (∼5 µg m−3) with their national averaged contributions of 0.21, 0.12, and 0.07 million to premature mortality, and 0.12, 0.1, and 0.05 years to YLL. Reducing PM2.5 concentrations would lead to a significant reduction of premature mortality and YLL. For example, premature mortality in Uttar Pradesh (including Delhi) due to PM2.5 exposures would be reduced by 79 % and YLL would be reduced by 83 % when reducing PM2.5 concentrations to 10 µg m−3.
- Article
(3032 KB) - Full-text XML
-
Supplement
(630 KB) - BibTeX
- EndNote


Due to insufficient control of emissions from a rapid increase in population, industries, urbanization, and energy consumption, health effects associated with air pollution in developing countries in Asia are severe (Cohen et al., 2005). India, the second most populous country in the world, has been experiencing extremely high concentrations of fine particulate matter (PM2.5) in recent decades. In 2015, PM2.5 concentrations in southern, eastern, northern, and western Indian cities were 6.4, 14.8, 13.2, and 9.2 times the World Health Organization (WHO) annual guideline value of 10 µg m−3 (Garaga et al., 2018). In the Global Burden of Disease Study 2016 (GBD, 2017), India accounted for 1.034 million of 4.093 million global premature mortalities from ambient PM2.5 exposure, and ambient PM2.5 exposure was the second largest risk for health in India. It is estimated that India accounted for 0.65 million out of the 3.3 million deaths resulting from air pollution caused by PM2.5 globally in 2010 (Lelieveld et al., 2015).
Efforts have been made to estimate the premature deaths associated with PM2.5 in India. For example, Sahu and Kota (2017) estimated that 41 out of 100 000 lives in Delhi could be saved by meeting the WHO suggested annual PM2.5 guideline based on time series analysis. Such studies require extensive data, which are not available in all Indian cities. Several studies have estimated the health effects using regional and global models and satellite data. Lelieveld et al. (2015) estimated the global premature mortality of chronic obstructive pulmonary disease (COPD), cerebrovascular disease (CEVD), ischaemic heart disease (IHD) and lung cancer (LC) using predicted PM2.5 concentrations from a global atmospheric model and exposure-response equations from Burnett et al. (2014). The impacts of different sources on ambient PM2.5 concentrations and the associated disease burden at global scale were also studied in Silva et al. (2016) and Lelieveld (2017). Giannadaki et al. (2016) and Conibear et al. (2018) studied the health impacts from applying different air quality standards and explored the non-linear response of health impacts to PM2.5 in India. The GBD MAPS Working Group (2018) and Venkataraman et al. (2018) focused on source contributions and potential reductions of PM2.5 in India in the present day and the future using the brute force method by removing certain sources. In addition to premature mortality, years of life lost (YLL), which accounts for the ages of those who die and age distribution of population, is also informative and meaningful for estimation of the burden of air pollution on health and environmental policy decision. Ghude et al. (2016) predicted 0.57 million premature deaths and 3.4±1.1 years of YLL associated with PM2.5 in India for 2011.
To effectively design pollution control strategies, the contributions of different emission sources to PM2.5 concentrations are crucial. Source-oriented chemical transport models (CTMs) based on a tagged tracer technique have been developed and used for source apportionment of gases (Kota et al., 2014) and PM (Zhang and Ying, 2010; Kota et al., 2015; Ying et al., 2015) in the past. Guo et al. (2017), which was the first study to use the source-oriented Community Multi-scale Air Quality (CMAQ) model in India, showed that the residential sector contributed the most (∼80 µg m−3) to total PM2.5, followed by the industrial sector (∼70 µg m−3) in 2015. Recently, Hu et al. (2017) estimated the premature mortality caused by different sources of PM2.5 in China and showed that industrial and residential sources contributed to 0.40 million (30.5 %) and 0.28 million (21.7 %) premature deaths, respectively. Although previous studies have addressed different aspects of the health impact of PM2.5 in India, a comprehensive understanding of source contributions and potential reductions to both premature mortality and YLL using a tagged tracer method with updates to better predict PM2.5 in India is missing.
The objective of this study is to estimate contributions of each emission sector to PM2.5-related mortality and YLL in India using a tagged tracer method after improving the model performance on PM2.5 in companion papers. The potential health benefits of reducing PM2.5 concentrations in different Indian states are also explored. This study should be of tremendous value to the government for channeling their resources in reducing pollution in India.
2.1 Model application for PM2.5 prediction and source apportionment
The models used in this study were based on CMAQ 5.0.1 with a modified SAPRC11 photochemical mechanism and aerosol module version 6 (AERO6). Heterogeneous formation of SO4, NO3, and secondary organic aerosol (SOA) formation from surface uptakes was incorporated to improve model performance (Ying et al., 2015; Hu et al., 2016). Source contributions of primary PM (PPM) and its chemical components were estimated using tagged non-reactive tracers. The tracers from each source sector go through all atmospheric processes similar to other species. Detailed information on this source apportionment method could be found in Guo et al. (2017) and the references therein. The source contributions to secondary inorganic aerosol (SIA) were determined by tracking SO2, NOx, and NH3 through atmospheric processing using tagged reactive tracers. Both the photochemical mechanism and aerosol module were expanded so that SO4, NO3, and NH4 and their precursors from different sources are tracked separately throughout the model calculations (Zhang et al., 2012, 2014; Qiao et al., 2015).
The default vertical distributions of concentrations that represented clean continental conditions provided by the CMAQ model were used for the 36 km domain covering the whole of India (Fig. S1 in the Supplement). Figure S2 shows the states and main cities referred in this study. The Weather Research & Forecasting (WRF) model v3.7.1 was utilized to generate meteorology inputs for CMAQ, and the Emissions Database for Global Atmospheric Research (EDGAR) version 4.3 (http://edgar.jrc.ec.europa.eu/overview.php?v=431, last acess: 14 March 2018) was used for six anthropogenic emissions: energy, industry, residential areas, on-road emissions, off-road emissions, and agriculture. The biogenic emissions were generated by the Model for Emissions of Gases and Aerosols from Nature (MEGAN) v2.1 (Guenther et al., 2012) and wildfire emissions, which is assigned as an open-burning sector, were from the Fire Inventory from NCAR (FINN), which was based on satellite observations (Wiedinmyer et al., 2011). Dust and sea salt emissions were generated in line during simulations. Model performance was validated against available observations from ground-based national ambient air quality monitoring stations in major cities. Model performance of O3 and PM2.5 meets the criteria suggested by the US Environmental Protection Agency (EPA). The performance of the model was especially good on days with high O3 and PM2.5 levels. Details of the model application and the performance in 2015 can be found in Kota et al. (2018). Also, the source apportionment results are comparable with Sharma et al. (2016) using positive matrix factorization (PMF) as Guo et al. (2017) introduced.
2.2 Estimation of premature mortality
The relative risk (RR) due to COPD-, CEVD-, IHD-, and LC-related mortality associated with long-term exposure of PM2.5 concentrations is calculated using an integrated exposure-response function estimated by Burnett et al. (2014) as described in Eqs. (1) and (2).
where Ccf is the threshold concentration below which there is no additional risk. A total of 1000 sets of α, γ, δ, and Ccf values generated using Monte Carlo simulations for each disease were obtained from the Global Health Data Exchange website (http://ghdx.healthdata.org/sites/default/files/record-attached-files/IHME_ CRCurve_parameters.csv, last acess: 14 March 2018). C is the predicted PM2.5 concentration. RR values are calculated for each set of α, γ, δ, and Ccf for all people above the age of 25 and for each grid cell in the domain. Then, the premature mortality is calculated as Eq. (3).
where yo refers to baseline mortality rate for a particular disease in India as listed in Table S1 in the Supplement, obtained based on the WHO Mortality Database and “Pop” is the population in a certain grid cell as listed in Table S2. The mean, lower (2.5 %), and upper (97.5 %) limits of premature mortality associated with each disease in a grid are estimated using the 1000 RR values. Total premature mortality is calculated by adding premature mortality for each disease in a grid. Total average premature mortality in a state is obtained by adding all average premature mortalities of all grids in the state multiplied by the fraction of the grid inside the state. A similar approach is used for calculating the upper and lower limits of premature mortality.
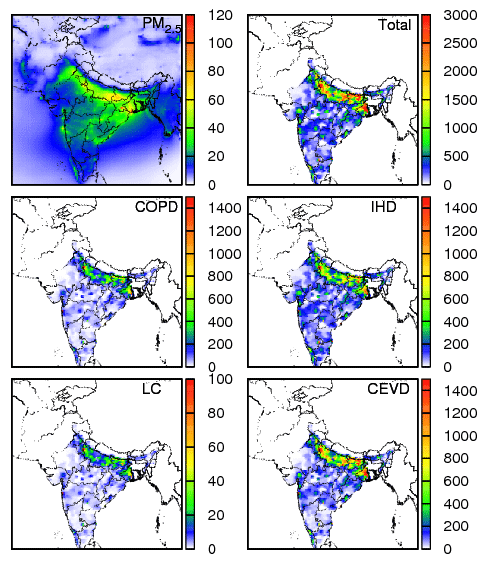
Figure 1Predicted annual PM2.5 concentrations (µg m−3), total premature mortality (death per grid of 36×36 km2), and premature mortality due to COPD, LC, IHD and CEVD in India for 2015.
2.3 Estimation of years of life lost
Years of life lost is another important index to reflect the health impact of PM2.5 concentrations (Romeder and McWhinnie, 1977; Pope III et al., 2009; Yim and Barrett, 2012; Guo et al., 2013). It is a measure of the years between the age to which a person would have lived if he or she had not died prematurely due to some specific reason and the actual death age. YLL is usually calculated as a summation of the number of deaths at each age group multiplied by the number of years remaining, as shown in Eq. (4).
where ΔMorti is the number of deaths in age group i () as shown in Table S2, ai is the remaining years of life left when death occurs in age group i, n is the life expectancy of India (male= 66.2 and female = 69.1 in 2013), and y(i) is the mean age of age group i. In this study, the overall YLL was divided by population in a certain grid cell to get life expectancy loss per person (Pope III et al., 2009).
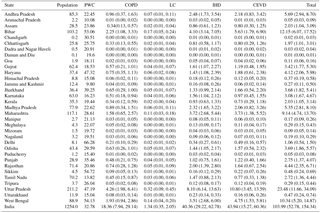
Table 1Population (×106), population-weighted concentration (PWC, µg m−3) and premature mortality (×104 deaths) due to COPD, LC, IHD, and CEVD in each state or union territory in India.
3.1 Predicted premature mortality and YLL
Figure 1 shows the predicted annual PM2.5 concentrations in India for 2015, with the highest concentration of ∼120 µg m−3 in Delhi and some states in eastern India. The spatial distribution of PM2.5 concentration shows that the Indo-Gangetic plains have a higher concentration than other regions. Eastern and parts of central India also have high PM2.5 concentrations, while western and southern India are less polluted. The population-weighted concentration (PWC) throughout the country is 32.8 µg m−3 (Table 1). This value is lower compared to 57.2 µg m−3 in Conibear et al. (2018) and 74.3 µg m−3 in GBD MAPS Working Group (2018) due to differences in model and configurations (Table 2). Eastern India is the most polluted with 47.8 µg m−3, closely followed by northern India with 43.1 µg m−3. PWC values are 31.2 µg m−3 in the south, 25.4 µg m−3 in the northeast, 23.9 µg m−3 in the west, and 23.5 µg m−3 in central India. Delhi is the state with the highest PWC of 66.3 µg m−3. The states apart from Delhi, where PWC is higher than the national average, are Sikkim (54.7 µg m−3), West Bengal (54.1 µg m−3), Bihar (53.1 µg m−3), Haryana (47.3 µg m−3), Uttar Pradesh (47.3 µg m−3), Jharkhand (39.2 µg m−3), and Punjab (35.5 µg m−3).
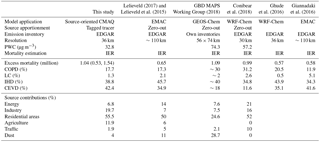
Table 2Comparison of methods and excess mortality by diseases and sources from this study with other studies in India.
The total premature mortality for adults (≥25 years old) and those due to COPD, LC, IHD, and CEVD are also shown in Fig. 1. The total premature mortality peaks at populous megacities in coastal areas, the Indo-Gangetic plains, and western India. For example, in the Indo-Gangetic plains, where the population density is more than 1 million per grid (i.e., 36 km × 36 km), premature mortality can be as high as 3000 deaths per 100 000 persons. Premature mortalities of COPD, LC, IHD, and CEVD show a similar spatial distribution with the total. CEVD is the largest contributor and has peak values in the Indo-Gangetic plains. COPD and IHD are also important with a peak of ∼1400 deaths per 100 000 persons in the Indo-Gangetic plains. LC contributes the least to total premature mortality.
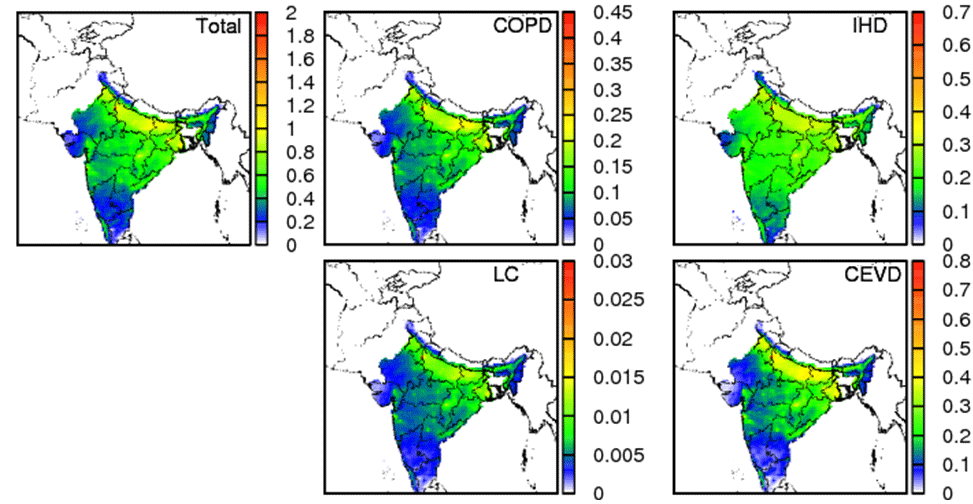
Figure 2Years of life lost (YLL) based on population (years) due to COPD, LC, IHD, and CEVD.
Table 1 also shows that the total premature mortality for adults in India for 2015 is approximately 1.04 million, with a 95 % confidence interval of 0.53–1.54 million. High premature mortality is found in the populous states such as Uttar Pradesh (0.23 million), Bihar (0.12 million), and West Bengal (0.10 million), as shown in Fig. S3. In addition, states such as Maharashtra (0.09 million) and Andhra Pradesh (0.06 million) also have high premature mortality. Generally, the states in the Indo-Gangetic plains and eastern India have a higher premature mortality than other states. Southern states have lower premature mortality. Premature mortality due to CEVD is highest in India (0.44 million), followed by IHD (0.43 million), COPD (0.18 million), and LC (0.01 million) (Table 1). States with high PWC have slightly higher CEVD premature mortality compared to IHD. IHD and CEVD constitute about 81 % of the total premature mortality over the country in 2015.

Table 2 shows the comparison of the results with other studies. This study predicted higher total premature mortality (1.04 million) compared to Lelieveld et al. (2015) (0.65 million), Ghude et al. (2016) (0.57 million), and Giannadaki et al. (2016) (0.58 million), and comparable results compared to GBD MAPS Working Group (2018) (1.09 million) and Conibear et al. (2018) (0.99 million). Considering the uncertainty range (0.53–1.54 million), this study is consistent with these studies. The difference may be caused by different models (updated CMAQ in this study vs. EMAC, GEOS-Chem, and WRF-Chem), different resolutions, and different simulation episodes. The ratios of COPD and CEVD are close for all studies except GBD MAPS Working Group (2018) and Conibear et al. (2018) predicted higher ratios for COPD but lower ratios for CEVD. Giannadaki et al. (2016) predicts higher LC ratio (5.1 %) than other studies (0.5 %–2.1 %), while IHD ratios are similar for all studies.
Figure 2 shows the total YLL and to the contributions of COPD, LC, IHD, and CEVD. The YLL for entire India is the highest for CEVD (0.8 years) and closely followed by IHD (0.7 years). LC has the least YLL (0.03 years), while COPD has a YLL of 0.45 years. YLL values for states in northern, eastern, southern, and western India are 1.2, 1.0, 0.2, and 0.4 years, respectively. The highest total YLL is ∼2 years in Delhi, indicating that PM2.5 concentrations strongly threaten the health of people living in the capital of India. The Indo-Gangetic plains and eastern India have higher YLL (∼1 years) compared to other regions. Another study conducted in India for 2011 showed that PM2.5-concentration-associated lost life expectancy is 3.4±1.1 years (Ghude et al., 2016). The difference is due to the different episodes and methods used to calculate YLL. In Ghude et al. (2016), YLL was calculated based on the linear relationship assumption that an increase of 1 µg m−3 in PM2.5 exposure decreases mean life expectancy by about 0.061±0.02 years (Pope III et al., 2009). The linearity assumption between YLL and PM2.5 concentration may introduce additional uncertainties to their result.
3.2 Source apportionment of premature mortality and YLL
Figure 3 shows the annual contributions of different sources to total PM2.5 concentration. The residential sector contributes the most to total PM2.5 with a ∼40 µg m−3 maximum, followed by the industrial sector (∼20 µg m−3). The energy and agricultural sectors contribute ∼5 and ∼8 µg m−3 maximums. In northern India, the residential sector (∼40 µg m−3) has the maximum contributions to total PM2.5. Open burning has significant high contributions (∼1 µg m−3) in northeastern India. Energy PM2.5 concentrations have a significantly high concentration point in northern (∼30 µg m−3) and eastern (∼15 µg m−3) India compared to other parts of the country as several coal-based power plants are located there (Guttikunda and Jawahar, 2014). On the contrary, industrial, residential, and agricultural sectors distribute evenly in the Indo-Gangetic plains. The residential source peaks in northern Pakistan and the dust source peaks in desert areas in other countries. In most states, residential areas are the largest contributor because residential heating during October to December is the main source of PM2.5 (Vadrevu et al., 2011). As shown in Fig. S4, biogenic-related species such as isoprene (ISOP) and monoterpenes (TERP) are the major components of SOA.
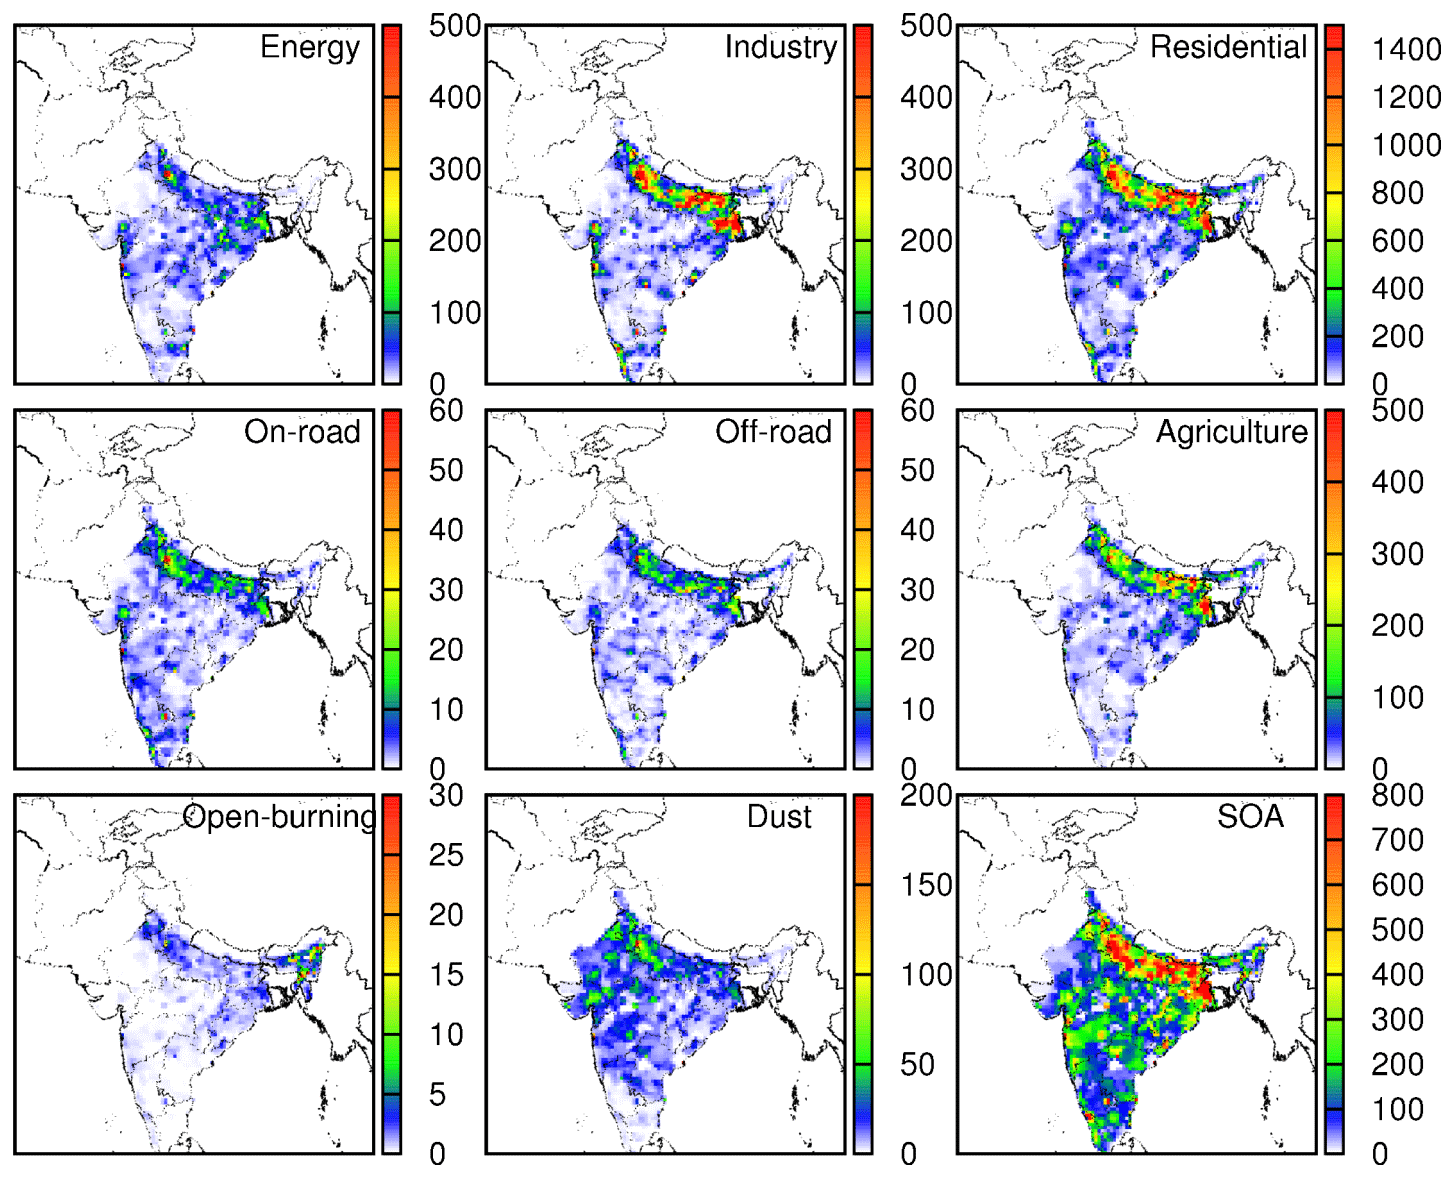
Figure 4Source contributions to total premature mortality (deaths per grid 36×36 km) due to COPD, LC, IHD, and CEVD.
The total premature mortality due the eight source sectors and SOA is shown in Fig. 4, and the proportions of the contribution of each source type of each state in India are listed in Table S3. Residential areas (55.45 %), industry (19.66 %), agriculture (11.90 %), and energy (6.80 %) are the major sources contributing to premature mortality due to PM2.5 concentrations. Contributions of residential, industrial, agricultural, and energy sectors are maximum in Bihar (62.01 %), Delhi (40 %), Assam (24.37 %), and Chhattisgarh (22.63 %), respectively. Overall premature mortality in more than 90 % of the states is dominated by residential sources. The uses of primitive methods of cooking instead of cooking gas and electric heaters could be a top factor. Burning of solid fuels for cooking and other purposes could be another important factor. The highest contributions to premature mortality from residential sources are in states in the Indo-Gangetic plains and eastern India. In southern Indian states premature mortality due to the residential sector is lower compared with other parts of India, while premature mortality due to the industrial sector is more important in western states. Delhi is affected the most among all states by industrial sources, and premature mortality due to the energy sector is higher in mineral-rich states such as Chhattisgarh. Agriculture PM2.5 contributes the most to premature mortality in Assam. Premature mortality in other northeastern states such as Meghalaya, Mizoram, Tripura, Manipur, Nagaland, and Sikkim are also contributed significantly by agricultural PM2.5. Table 2 shows the comparison of this study with previous studies. In comparison with Lelieveld et al. (2015), this study predicts higher contributions from industrial and agricultural sectors but lower from traffic and dust sectors due to the differences in emissions. The GBD MAPS Working Group (2018) shows similar results in energy and traffic sectors but predicts less from the residential sector. Conibear et al. (2018) is consistent with this study in the residential sector but predicts higher contribution in energy and traffic sectors.
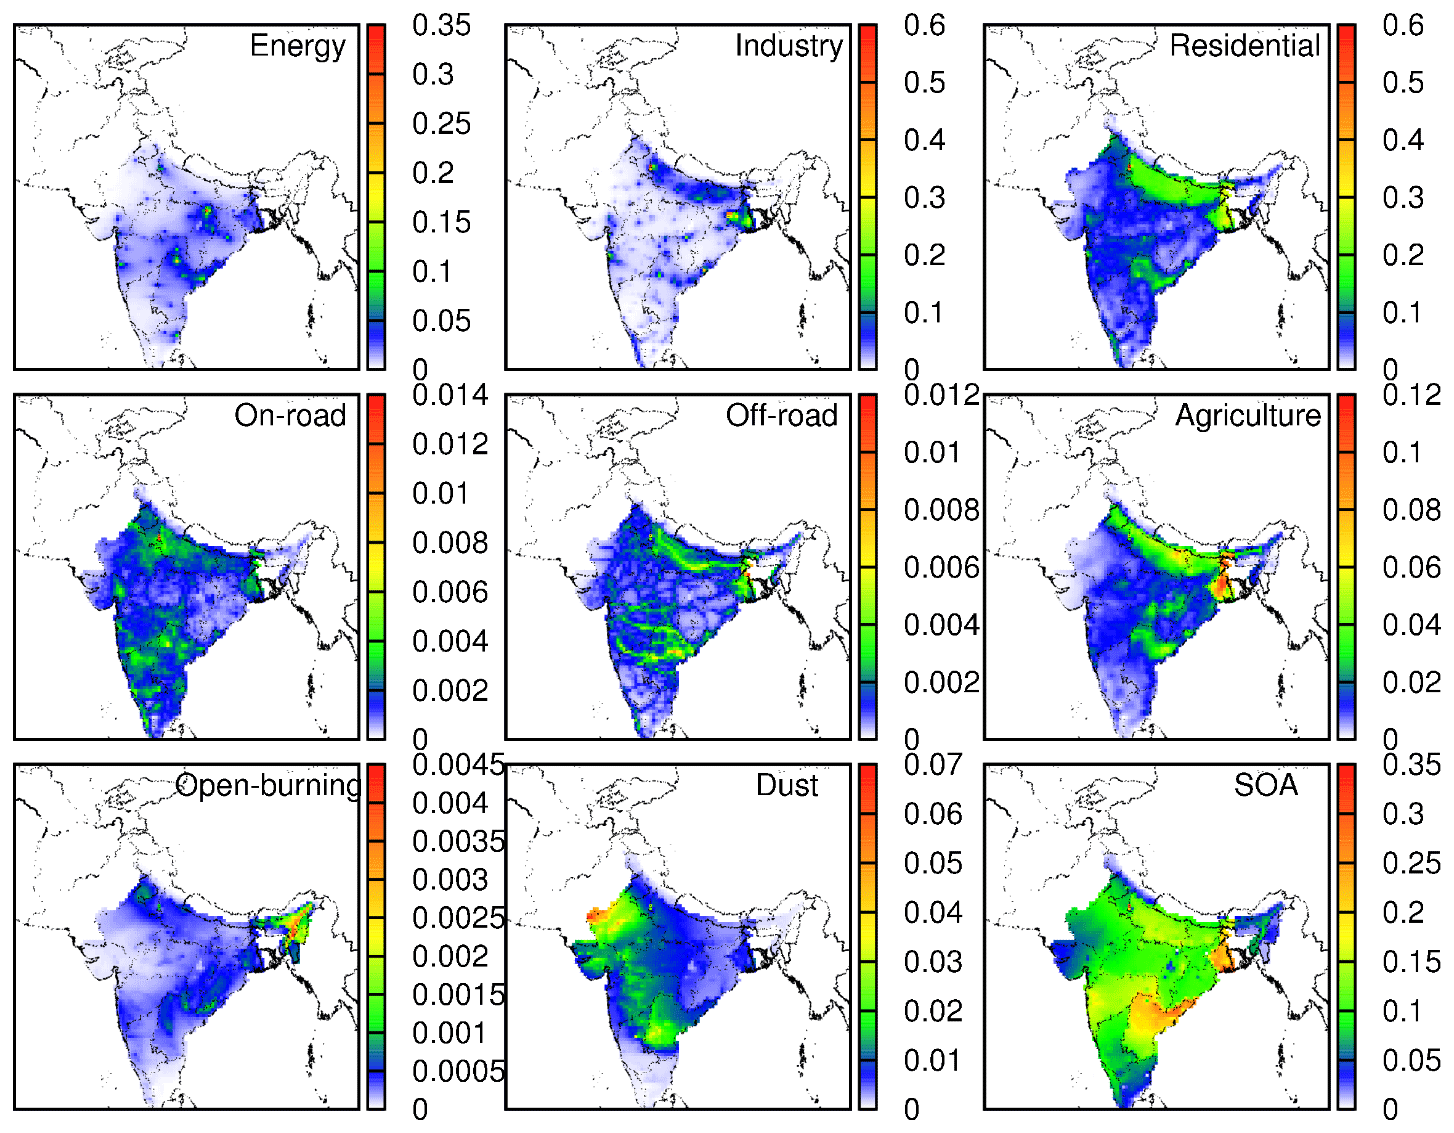
Figure 5Contributions of different sources to years of life lost (YLL) based on population (years).
Figure 5 showed YLL attributed to different source types and SOA. Similar to the pattern of premature mortality in Fig. 4, the residential sector is the top factor, which reduces life expectancy by ∼0.6 years in severe polluted and populous area like Delhi, followed by industry, energy, and SOA. A significant peak of industry YLL is in western India and high YLL occurs in the Indo-Gangetic plains. Unlike the spatial distribution of industry contributions to YLL, YLL for the energy sector shows some point sources of energy emission in central India. For SOA, YLL is ∼0.1 years for the majority of India, with a high YLL (∼0.35 year) in southeastern India. YLL for the agricultural sector is distributed evenly in the Indo-Gangetic plains and peaks in western India (∼0.12 year).
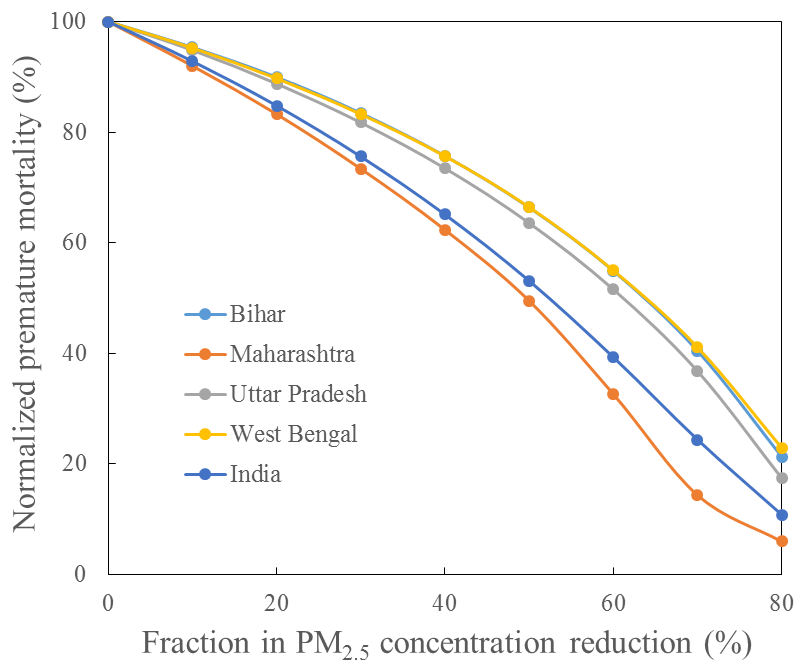
Figure 6Premature mortality (normalized to 2015 deaths) as a function of the fractional reduction in PM2.5 concentrations (relative to 2015 concentrations) for the whole of India and the top PM2.5 polluted states, Bihar, Maharashtra, Uttar Pradesh (including Delhi), and West Bengal.
3.3 Potential reduction of premature mortality with reduced PM2.5 concentrations
The reduction of PM2.5 was calculated by multiplying the original PM2.5 concentration with the reduction fraction. The mortality was then calculated using the reduced PM2.5 concentration. Figure 6 shows the normalized premature mortality with a fractional reduction in PM2.5 concentrations (relative to 2015 concentrations) for the whole of India and the top PM2.5 polluted states – Bihar, Maharashtra, Uttar Pradesh (including Delhi), and West Bengal. It shows that the decrease in premature mortality is slower in the beginning when PM2.5 concentrations are higher, and the marginal benefit of PM2.5 reduction to premature mortality increases as PM concentrations decrease. A 30 % in reduction in PM2.5 in the whole of India only leads to a 25 % reduction in mortality from the 2015 level without considering population increases, but a 90 % reduction in mortality could be achieved with an 80 % decrease in PM2.5. PM2.5 concentrations need to be reduced by 65 %, 50 %, 60 %, and 65 %, respectively, for Bihar, Maharashtra, Uttar Pradesh (including Delhi), and West Bengal to achieve a 50 % reduction in PM2.5-related premature mortality.
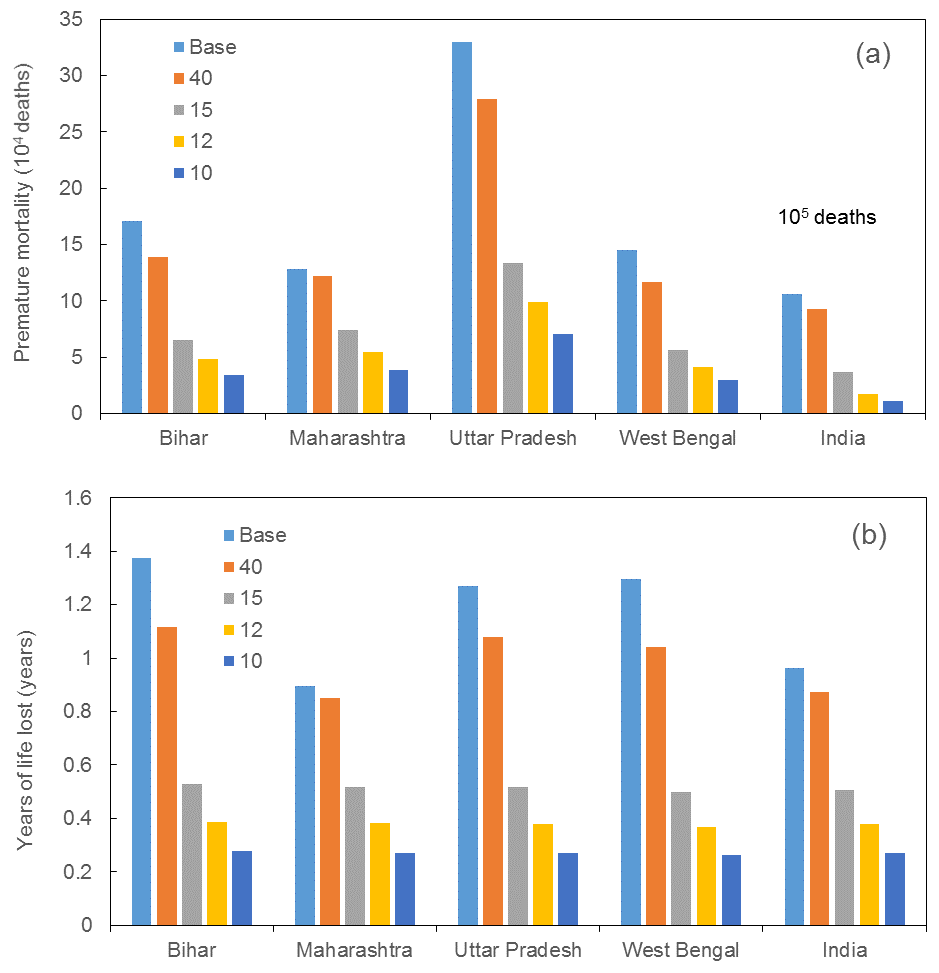
Figure 7Number of premature deaths (a) and YLL (b) in the whole of India and top PM2.5-polluted states, Bihar, Maharashtra, Uttar Pradesh (including Delhi), and West Bengal, corresponding to the cases when PM2.5 reduced to 40, 15, 12, and 10 µg m−3 (WHO guideline level). “Base” refers to PM2.5 in 2015.
Figure 7 evaluates the premature mortality and YLL benefit when PM2.5 concentrations in the whole of India and top PM2.5 polluted states, Bihar, Maharashtra, Uttar Pradesh (including Delhi), and West Bengal, are reduced to four different standards, i.e., Indian National Ambient Air Quality Standard (INAAQS) of 40 µg m−3, WHO interim target 3 (WHO IT3) of 15 µg m−3, the US Ambient Air Quality Standards (NAAQS) annual standard of 12 µg m−3, and the WHO guideline level of 10 µg m−3. The reductions in the premature mortality when PM2.5 concentrations in the highly polluted regions (annual average concentration ≥40 µg m−3) are shown in Table S4. For example, the premature mortality in Uttar Pradesh (including Delhi) due to PM2.5 exposure will be reduced by 79 % from 0.25 million to approximately 0.06 million and the YLL will be reduced by 83 % from 1.27 to 0.22 years when PM2.5 concentrations drop to 10 µg m−3. The reductions in premature mortality are also more significant in the most populous states such as Uttar Pradesh (79 %) and West Bengal (80 %). However, the decrease is not significant when PM2.5 concentrations drop to current INAAQS standards of 40 µg m−3 as it only reduces premature mortality by 13.10 % and YLL by 9.85 % for the whole of India. When PM2.5 concentrations drop to 15 µg m−3, premature mortality for India will reduce to 0.37 million and YLL will decrease to 0.56 year. In 12 µg m−3 case, premature mortality and YLL will be reduced to 0.17 million and 0.39 years respectively. This indicates that the current INAAQS standards are not sufficient to reduce the health impacts of air pollution in India.
A source-oriented CMAQ modeling system with meteorological inputs from the WRF model was used to quantify source contributions to concentrations and health effects of PM2.5 in India for 2015. The predicted annual PM2.5 concentrations in India for 2015 could reach 120 µg m−3 in Delhi, and some states in eastern India have a total mortality greater than 3000 deaths per 100 000 persons. The total premature mortality in India for adults ≥ 25 years old in 2015 was approximately 1.04 million. Uttar Pradesh (0.23 million), Bihar (0.12 million), and West Bengal (0.10 million) had higher premature mortality compared to other states. YLL peaks in Delhi with ∼2 years, and the Indo-Gangetic plains and eastern India have high YLL (∼1 years) compared to other regions in India. The residential sector is the top contributor (55.45 %) to total premature mortality and contributes ∼0.2 years to YLL with source contribution of ∼40 µg m−3 maximum to total PM2.5. Reducing the PM2.5 concentrations to the WHO guideline value of 10 µg m−3 would result in a 79 % reduction in premature mortality and 83 % reduction in YLL in Uttar Pradesh (including Delhi) due to PM2.5 exposures. The total mortality and YLL of the whole of India would also be significantly reduced by decreasing current PM2.5 level to 10 µg m−3.
Data used in this paper can be provided upon request by e-mail to the corresponding author (hlzhang@lsu.edu).
The supplement related to this article is available online at: https://doi.org/10.5194/acp-18-15219-2018-supplement.
HG and HZ designed the research, modified the health model, and conducted simulations. SK and SS offered local data and helped in modifying codes. JH, QY, YW and HZ contributed to model development and configuration. HG and KC analyzed the data. HG prepared the paper and all co-authors helped improve the paper.
The authors declare that they have no conflict of interest.
Portions of this research were conducted with high-performance computing
resources provided by Louisiana State University (http://www.hpc.lsu.edu, last access: 20 September 2018.).
The project is funded by the Competitiveness Subprogram (RCS) from Louisiana
Board of Regents (LEQSF(2016-19)-RD-A-14) and the European Climate
Foundation (G-1606-00917). Jianlin Hu would like to thank the support from the
National Natural Science Foundation of China (41675125) and Natural Science
Foundation of Jiangsu Province (BK20150904), Jiangsu Six Major Talent Peak
Project (2015-JNHB-010).
Edited by: Dominick Spracklen
Reviewed by: two anonymous referees
Burnett, R. T., Pope III, C. A., Ezzati, M., Olives, C., Lim, S. S., Mehta, S., Shin, H. H., Singh, G., Hubbell, B., and Brauer, M.: An integrated risk function for estimating the global burden of disease attributable to ambient fine particulate matter exposure, Environ. Health Persp., 122, 397–403, https://doi.org/10.1289/ehp.1307049, 2014.
Cohen, A. J., Ross Anderson, H., Ostro, B., Pandey, K. D., Krzyzanowski, M., Künzli, N., Gutschmidt, K., Pope, A., Romieu, I., and Samet, J. M.: The global burden of disease due to outdoor air pollution, J. Toxicol. Environ. Health A, 68, 1301–1307, 2005.
Conibear, L., Butt, E. W., Knote, C., Arnold, S. R., and Spracklen, D. V.: Residential energy use emissions dominate health impacts from exposure to ambient particulate matter in India, Nat. Commun., 9, 617, https://doi.org/10.1038/s41467-018-02986-7, 2018.
Garaga, R., Sahu, S. K., and Kota, S. H.: A Review of Air Quality Modeling Studies in India: Local and Regional Scale, Current Pollution Reports, 4, 59–73, https://doi.org/10.1007/s40726-018-0081-0, 2018.
GBD: Global Burden of Disease Study 2016 Cancer Incidence, Mortality, Years of Life Lost, Years Lived with Disability, and Disability-Adjusted Life Years 1990–2016, Institute for Health Metrics and Evaluation (IHME), 2018, Location: Seattle, United States, 2017.
GBD MAPS Working Group: Burden of Disease Attributable to Major Air Pollution Sources in India, Special Report 21. Boston, MA: Health Effects Institute, 2018.
Ghude, S. D., Chate, D., Jena, C., Beig, G., Kumar, R., Barth, M., Pfister, G., Fadnavis, S., and Pithani, P.: Premature mortality in India due to PM2.5 and ozone exposure, Geophys. Res. Lett., 43, 4650–4658, 2016.
Giannadaki, D., Lelieveld, J., and Pozzer, A.: Implementing the US air quality standard for PM2.5 worldwide can prevent millions of premature deaths per year, Environ. Health, 15, 88, https://doi.org/10.1186/s12940-016-0170-8, 2016.
Guenther, A. B., Jiang, X., Heald, C. L., Sakulyanontvittaya, T., Duhl, T., Emmons, L. K., and Wang, X.: The Model of Emissions of Gases and Aerosols from Nature version 2.1 (MEGAN2.1): an extended and updated framework for modeling biogenic emissions, Geosci. Model Dev., 5, 1471–1492, https://doi.org/10.5194/gmd-5-1471-2012, 2012.
Guo, H., Kota, S. H., Sahu, S. K., Hu, J., Ying, Q., Gao, A., and Zhang, H.: Source apportionment of PM2.5 in North India using source-oriented air quality models, Environ. Pollut., 231, 426–436, https://doi.org/10.1016/j.envpol.2017.08.016, 2017.
Guo, Y., Li, S., Tian, Z., Pan, X., Zhang, J., and Williams, G.: The burden of air pollution on years of life lost in Beijing, China, 2004–08: retrospective regression analysis of daily deaths, BMJ, 347, f7139, https://doi.org/10.1136/bmj.f7139, 2013.
Guttikunda, S. K. and Jawahar, P.: Atmospheric emissions and pollution from the coal-fired thermal power plants in India, Atmos. Environ., 92, 449–460, 2014.
Hu, J., Chen, J., Ying, Q., and Zhang, H.: One-year simulation of ozone and particulate matter in China using WRF/CMAQ modeling system, Atmos. Chem. Phys., 16, 10333–10350, https://doi.org/10.5194/acp-16-10333-2016, 2016.
Hu, J., Huang, L., Chen, M., Liao, H., Zhang, H., Wang, S., Zhang, Q., and Ying, Q.: Premature Mortality Attributable to Particulate Matter in China: Source Contributions and Responses to Reductions, Environ. Sci. Technol., 51, 9950–9959, https://doi.org/10.1021/acs.est.7b03193, 2017.
Kota, S. H., Zhang, H., Chen, G., Schade, G. W., and Ying, Q.: Evaluation of on-road vehicle CO and NOx National Emission Inventories using an urban-scale source-oriented air quality model, Atmos. Environ., 85, 99–108, 2014.
Kota, S. H., Schade, G., Estes, M., Boyer, D., and Ying, Q.: Evaluation of MEGAN predicted biogenic isoprene emissions at urban locations in Southeast Texas, Atmos. Environ., 110, 54–64, 2015.
Kota, S. H., Guo, H., Myllyvirta, L., Hu, J., Sahu, S. K., Garaga, R., Ying, Q., Gao, A., Dahiya, S., Wang, Y., and Zhang, H.: Year-long simulation of gaseous and particulate air pollutants in India, Atmos. Environ., 180, 244–255, https://doi.org/10.1016/j.atmosenv.2018.03.003, 2018.
Lelieveld, J.: Clean air in the Anthropocene, Faraday Discuss., 200, 693–703, 2017.
Lelieveld, J., Evans, J., Fnais, M., Giannadaki, D., and Pozzer, A.: The contribution of outdoor air pollution sources to premature mortality on a global scale, Nature, 525, 367–371, 2015.
Pope III, C. A., Ezzati, M., and Dockery, D. W.: Fine-particulate air pollution and life expectancy in the United States, New Engl. J. Med., 360, 376–386, 2009.
Qiao, X., Tang, Y., Hu, J., Zhang, S., Li, J., Kota, S. H., Wu, L., Gao, H., Zhang, H., and Ying, Q.: Modeling dry and wet deposition of sulfate, nitrate, and ammonium ions in Jiuzhaigou National Nature Reserve, China using a source-oriented CMAQ model: Part I. Base case model results, Sci. Total Environ., 532, 831–839, https://doi.org/10.1016/j.scitotenv.2015.05.108, 2015.
Romeder, J. and McWhinnie, J.: Potential years of life lost between ages 1 and 70: an indicator of premature mortality for health planning, Int. J. Epidemiol., 6, 143–151, 1977.
Sahu, S. K. and Kota, S. H.: Significance of PM2.5 air quality at the Indian capital, Aerosol Air Qual. Res., 17, 588–597, 2017.
Silva, R. A., Adelman, Z., Fry, M. M., and West, J. J.: The impact of individual anthropogenic emissions sectors on the global burden of human mortality due to ambient air pollution, Environ. Health Persp., 124, 1776–1784, https://doi.org/10.1289/EHP177, 2016.
Vadrevu, K. P., Ellicott, E., Badarinath, K., and Vermote, E.: MODIS derived fire characteristics and aerosol optical depth variations during the agricultural residue burning season, north India, Environ. Pollut., 159, 1560–1569, 2011.
Venkataraman, C., Brauer, M., Tibrewal, K., Sadavarte, P., Ma, Q., Cohen, A., Chaliyakunnel, S., Frostad, J., Klimont, Z., Martin, R. V., Millet, D. B., Philip, S., Walker, K., and Wang, S.: Source influence on emission pathways and ambient PM2.5 pollution over India (2015–2050), Atmos. Chem. Phys., 18, 8017–8039, https://doi.org/10.5194/acp-18-8017-2018, 2018.
Wiedinmyer, C., Akagi, S. K., Yokelson, R. J., Emmons, L. K., Al-Saadi, J. A., Orlando, J. J., and Soja, A. J.: The Fire INventory from NCAR (FINN): a high resolution global model to estimate the emissions from open burning, Geosci. Model Dev., 4, 625–641, https://doi.org/10.5194/gmd-4-625-2011, 2011.
Yim, S. H. and Barrett, S. R.: Public health impacts of combustion emissions in the United Kingdom, Environ. Sci. Technol., 46, 4291–4296, 2012.
Ying, Q., Li, J., and Kota, S. H.: Significant contributions of isoprene to summertime secondary organic aerosol in eastern United States, Environ. Sci. Technol., 49, 7834–7842, 2015.
Zhang, H. and Ying, Q.: Source apportionment of airborne particulate matter in Southeast Texas using a source-oriented 3D air quality model, Atmos. Environ., 44, 3547–3557, 2010.
Zhang, H., Li, J., Ying, Q., Yu, J. Z., Wu, D., Cheng, Y., He, K., and Jiang, J.: Source apportionment of PM2.5 nitrate and sulfate in China using a source-oriented chemical transport model, Atmos. Environ., 62, 228–242, https://doi.org/10.1016/j.atmosenv.2012.08.014, 2012.
Zhang, H., Hu, J., Kleeman, M., and Ying, Q.: Source apportionment of sulfate and nitrate particulate matter in the Eastern United States and effectiveness of emission control programs, Sci. Total Environ., 490, 171–181, https://doi.org/10.1016/j.scitotenv.2014.04.064, 2014.