the Creative Commons Attribution 4.0 License.
the Creative Commons Attribution 4.0 License.
 | 10 Oct 2018
Air quality in the middle and lower reaches of the Yangtze River channel: a cruise campaign
Zhong Li
Chunlin Li
Xingnan Ye
Hongbo Fu
Xinke Wang
Zhuohui Zhao
Haidong Kan
Abdelwahid Mellouki
The Yangtze River is the longest river in China; nearly one-third of the national population lives along the river. Air quality over the Yangtze River is important as it may have significant influences on the aquatic ecosystem, the health of everyone living along the Yangtze River, and regional climate change. Chemical compositions of ambient aerosol were determined during a comprehensive cruise campaign carried out along the mid–lower reaches of the Yangtze River (MLYR) in winter of 2015. The total average concentration of PM2.5 was 119.29±33.67 µg m−3, and the dominant ionic composition in PM2.5 was with an average concentration of 15.21±6.69 µg m−3, followed by (13.76±4.99 µg m−3), (9.38±4.35 µg m−3), and Ca2+ (2.23±1.24 µg m−3) in this cruise. Based on the filter samples, the concentration and chemical composition of PM2.5 were remarkably varied or fluctuated from coastal areas to inland over the MLYR region. Crustal elements (Ca, Mg, Al, and K) from floating dust showed peak concentrations in the Yangtze River Delta (YRD) region, while secondary inorganic species (, , and ) and some of the most enriched elements (Pb, As, Se, and Cd) presented high levels in central China (Wuhan region). The significant correlation between Se and suggested that coal combustion may play an important role in secondary inorganic aerosol formation. The relatively high enrichment factors (EFs) of Ca (EFs >100) suggested the crustal elements may derive from anthropogenic sources. Furthermore, the concentration of levoglucosan in PM2.5 and the CO column level from satellite observation were greatly enhanced in the rural areas (Anhui and Jiangxi), indicating that biomass burning may make a remarkable contribution to rural areas. The concentrations of typical tracer for heavy oil (V and Ni) significantly increased in the Shanghai port, which was mainly ascribed to ship emissions, based on the air mass source analysis and the relatively high ratio of V ∕ Ni as well. The results shown herein portray a good picture of air pollution along the Yangtze River.
- Article
(9528 KB) - Full-text XML
-
Supplement
(1047 KB) - BibTeX
- EndNote


The Yangtze River is the longest river in China, originating from the Qinghai–Tibetan Plateau and extending to the East China Sea, and it drains an area of 1 808 500 km2, which is China's great granary, and feeds nearly one-third of the national population (Liu et al., 2017; Jiang et al., 2008). Currently, three dense city agglomerations, including Wuhan, Nanjing, and Shanghai (WNS), which are the centers of economy, transportation, politics, and culture in central and eastern China, and all of which are home to larger petrochemical complexes and/or steel industry, have formed along both shores of the mid–lower reaches of the Yangtze River (MLYR). The MLYR region is one of the most developed and economically vibrant regions in China, accounting for 34.13 % of China's total GDP in 2015. Owing to fast economic development and industrialization, this region has become one of the most polluted areas in China (X. Xu et al., 2016).
Fine aerosol particles have become more important in recent years due to their negative effects on human health, agriculture, and climate change (Wang et al., 2012; Kang et al., 2013; Pöschl, 2005; Seaton et al., 1995; Ackerman et al., 2004; Stier et al., 2005; Chameides et al., 1999; Novakov and Penner, 1993; Jones et al., 1994). Numerous field observations related to fine particles have been conducted in the megacities in the Yangtze River Delta (YRD) region, especially in Nanjing and Shanghai. Over the past years, the variation in mass concentrations, chemical compositions, size distributions, seasonal variations, daily change, optical properties, and temporal–spatial distributions of fine particles in this region has been investigated, and the causes and impacts of aerosol pollution have also been studied (Zhou et al., 2016; Kang et al., 2013; Y. Tao et al., 2014; Shen et al., 2014; Fu et al., 2014; Huang et al., 2013, 2012b, a; A. J. Ding et al., 2013; Ding et al., 2017; Zhang et al., 2010). By analysis of several serious haze cases, Huang et al. (2012a) pointed out that secondary inorganic and dust episodes always erupted in spring, while biomass burning (BB) events were often observed in summer (harvest season for wheat). Further, the high sulfate oxidizing rate (SOR) and nitrate oxidizing rate (NOR) were also observed from long-term field measurements in Nanjing and Shanghai, indicating that photochemical reactions in the atmosphere were quite active in these areas (Zhou et al., 2016, 2017; An et al., 2015). H. L. Wang et al. (2015) also found that secondary pollutants contributed the major fraction of aerosol mass, especially in the Shanghai–Nanjing city cluster. The increasing trend in the ratios since the year 2000 suggested that vehicle sources became more important in this region (Kang et al., 2013; Huang et al., 2012a; Y. Tao et al., 2014; Sun et al., 2017). Furthermore, Cheng et al. (2014) estimated that BB contributed 37 % of PM2.5, 70 % of organic carbon (OC), and 61 % of elemental carbon (EC) in harvest. If BB was controlled and even forbidden in this season, the PM2.5 levels would decrease by 47 % in the YRD region (Cheng et al., 2014). Some typical events, including fresh combustion pollution from fireworks (Zhang et al., 2010; Kong et al., 2015) and the peak of secondary inorganic aerosol species (sulfate, nitrate, and ammonium, SNA) derived from the travel rush and re-opening of factories after the China Spring Festival (Huang et al., 2012b; Kong et al., 2015), have also been focused on and analyzed. Huang et al. (2013) also investigated the chemical composition of fine particles in Shanghai, finding that the concentrations of anthropogenic calcium drastically decreased as a result of strict monitoring and implementing control of construction activity during the Expo Shanghai 2010. Compared with normal (pre-control) periods, the levels of Ca2+ and SO2 were also reduced 55 % and 46 % during the 2014 Youth Olympic Games, respectively (Zhou et al., 2017).
The MLYR region faces the most complex anthropogenic emission sources, including a variety of power plants, large petrochemical and steel industries, and farmland distributed along both banks of the Yangtze River, as well as ship emissions. It was well documented that ship emissions displayed a significant impact on regional air quality, particularly in traffic hubs and harbors (Pandis et al., 1999; Becagli et al., 2017; Zhan et al., 2014). The contribution and effect of ship emissions to local air pollution, especially PM, have been briefly analyzed at regional to global levels (Jalkanen et al., 2016; Zhan et al., 2014; Pandis et al., 1999; Fan et al., 2016; Coggon et al., 2012). The emission factors, and properties of emitted particles and gases from ship plumes at different engine speeds, were also reported (Zhang et al., 2016; Moldanová et al., 2009; Agrawal et al., 2009). Ship-related pollutants have been identified in the YRD port cluster and surrounding area. In 2010, SO2, NOx, and PM2.5 from ship emissions in the YRD port cluster were up to 3.8×10⁵, 7.1×10⁵, and 5.1×10⁴ t yr−1, respectively. The maximum SO2 and NOx concentrations from ship emissions in harbors or traffic hubs were nearly 36 times and 17 times higher than the maximum land-based emissions, respectively (Fan et al., 2016). M. Zhao et al. (2013) pointed out that Ni and V were enriched in submicron particles in the Shanghai port. Recently, Liu et al. (2017) also reported that ship plumes contributed 2–7 µg m−3 to fine particles within the coastal area of the Shanghai port, accounting for 20 %–30 % of total PM2.5. Known as the “golden canal”, the Yangtze River was an important route for trade and travel. However, there are seldom data related to air quality and the influence of ship emissions along the Yangtze River channel. Meanwhile, related observations with the synchronous trend in aerosol in the MLYR region remain insufficient.
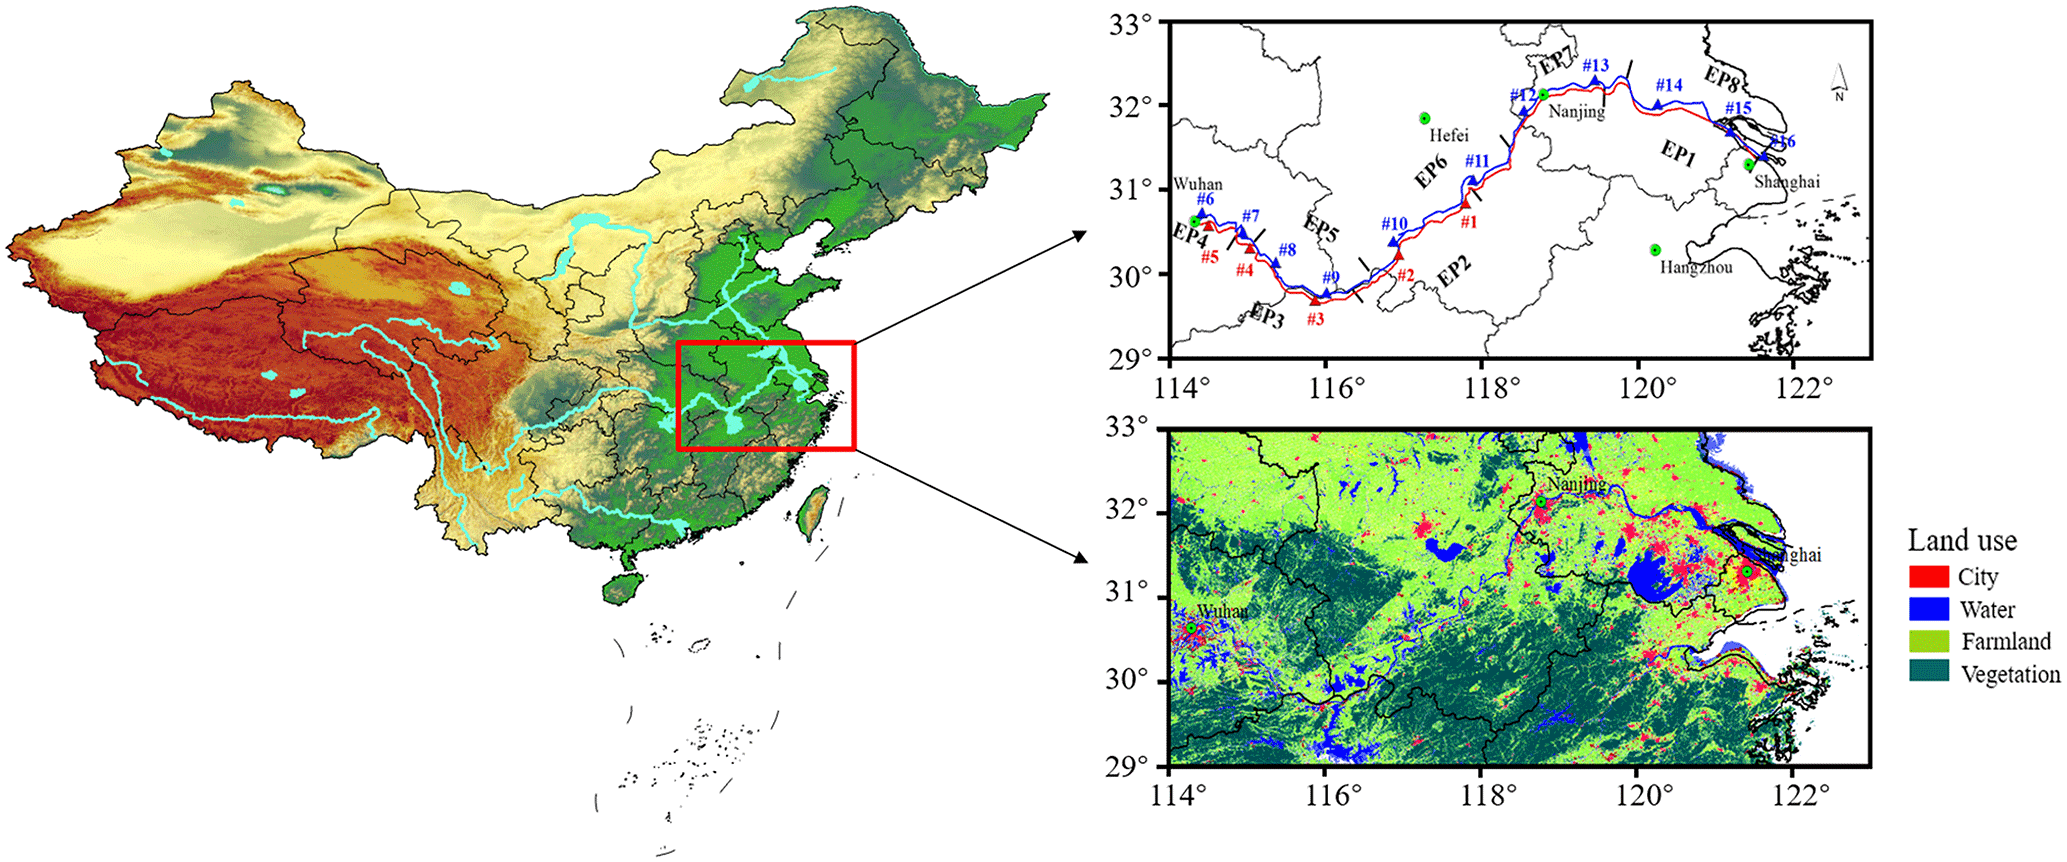
Figure 1Cruise tracks, source region limits, the sampling sites, and land use during the YRC.
To characterize air quality in this region, a round-trip field observation voyage, namely the Yangtze River Campaign (YRC), was carried out between Shanghai and Wuhan. This cruise aimed to characterize the chemical components of atmospheric pollutants, to analyze these spatial distributions, and to identify potential source contributions. To the best of our knowledge, it is the first systematic observation of air pollution along the largest and longest river in China.
2.1 Overview of the YRC
A mobile monitoring platform (a container with a length of 10.0 m, width of 4.0 m, and height of 2.5 m) was placed on a vessel (length: 20 m, width 6 m), sailing from 22 November to 5 December in 2015 along the Yangtze River channel between Shanghai and Wuhan (29.72–32.33∘ N, 114.33–121.61∘ E). This campaign route is illustrated in Fig. 1. Starting on 22 November in the Waigaoqiao port of Shanghai, the vessel then crossed Jiangsu and Anhui Province and finally arrived at the Hankou port in Wuhan, Hubei Province, on 29 November along the Yangtze River waterway. The ship shifted at an average speed of 1 m s−1 heading up the Yangtze River towards Wuhan. After berthing in the port of Wuhan one night, the vessel turned around, departed, and shifted towards Shanghai. This cruise finally ended in the Waigaoqiao port in Shanghai on 5 December. During the YRC, a wide range of data, including common meteorological parameters, trace gas concentrations (CO, NO−NOx, SO2, and O3), chemical composition of aerosol particles, and a satellite dataset over this region were acquired and analyzed.
2.2 Trace gases measurements
A series of commercial trace gas instruments, including a 43i SO2 analyzer, 48i CO analyzer, and 42i analyzer (Thermo Environmental Instruments Inc., USA C-series), were installed in an air-conditioned container to measure the concentration of gaseous pollutants. The routine procedures of QA/QC (quality assurance and quality control) were performed, according to the technical guidance of the U.S. Environmental Protection Agency (USEPA, 1998).
Trace alkanes, including toluene and benzene, were also sampled in a stainless steel canister and quantified using a gas chromatograph with a mass spectrometer and a flame ionization detector (GC-MS/FID) (Wang et al., 2014). The sampling interval of volatile organic compounds was 3 h with fluctuation. The ratio of toluene ∕ benzene (T ∕ B) was commonly regarded as an indicator of the photochemical processing (Baltrenas et al., 2011). The high ratio of T ∕ B indicated that air masses were fresh emissions, while a lower value suggested that air masses had undergone photochemical processes. In this paper, we used the same value ratio of T ∕ B in CalNex (Gaston et al., 2013). Air masses with T ∕ B ≪1 were expected to undergo photochemical aging while urban fresh air masses had a much higher T ∕ B ratio (≥2). Ship track self-emission was removed by subducting the periods when the winds blew from the stern; that is, the relative wind direction was from 130 to 220∘ to the ship direction (0∘ in the front). The real-time measurement of trace gases and aerosol data presented here was filtered out using this method.
2.3 Chemical analysis of the filter samples
Particulate samples of PM2.5 and PM1.0 were simultaneously collected on separate quartz filters (Φ 90 mm, Whatman Inc., Maidstone, UK) using a medium-volume sampler from HY-100 (Qingdao Hengyuan S.T. Development Co., Ltd., China) (model: PM2.5 ∕ PM1.0; flow rate: 100 L min−1), which was placed on the foredeck at approximately 3.0 m above sea level. The duration time of collection was generally set at 12 h (in parallel: day 07:00–19:00 Beijing standard time (BST, GMT−8), night 19:00–07:00 BST), while particulate matter was also collected for 24 h. High-purity quartz filters were preheated at 500 ∘C for 10 h to virtually eliminate the residues prior to sampling. All the samples were stored in a refrigerator kept at −20∘ for analysis. The filter sample masses were measured by an intelligent weight system (Hangzhou Wmade Intelligent Technology Co., Ltd.), which was maintained at a constant condition (temperature, T: 20∘, and relative humidity, RH: 40 %). All the procedures were well documented and supervised to avoid possible contaminations. The sample instruments were placed on the bow of the ship far away from its track. Ship self-emission in the filter samples was ignored since the most prevailing winds blew from the bow to the stern during the sampling periods.
One-eighth of each filter was extracted ultrasonically using 20 mL of deionized water (18.2 MΩ cm−1) for 40 min. After filtering, eight inorganic ions (, , Cl−, , Na+, K+, Ca2+, and Mg2+) were analyzed by ion chromatography (940 Professional IC, Metrohm, Switzerland), and a Metrosep A Supp 10 - 100/2.0 separation column coupled with pulsed electrochemical detection (945 Professional Detector Vario, Metrohm, Switzerland) was used to measure levoglucosan in the extract. Both instruments were controlled with IC software. The lower and upper limits of detection were 0.5 and 4 µg m−3, respectively. The relative standard deviation of each ion was less than or equal to 2 % from three reproducibility tests. Blank samples were analyzed with the same processes to remove potential contaminations.
One-eighth of the sample filter and the blank filter were cut into fragments and digested at 170∘ for 4 h in a high-pressure Teflon digestion vessel with 3 mL of HNO3 and 1 mL of HClO4 (Wang et al., 2006; T. Li et al., 2015). After cooling, the digested solution was filtered and diluted to 15 mL with ultrapure Milli-Q water. An inductively coupled plasma mass spectrometer (ICP-MS, Agilent 7500a) was employed to measure the concentrations of 17 elements (Al, As, Ca, Co, Cr, Cu, Fe, K, Mg, Mn, Na, Ni, Se, Tl, Pb, V, and Zn) in the filter samples. National standard material (soil, GSS-12, China) was also digested and used to calculate the element recoveries ranging from 91 % to 102 %. The detection limits of the trace elements were derived from the standard deviation (3δ) of the blank values. Details relating to ICP-MS have been described elsewhere (T. Li et al., 2015).
OC and EC in the aerosol samples were analyzed with a thermal–optical carbon analyzer (DRI model 2001). Each sample was identified as four OC fractions (OC1, OC2, OC3, and OC4 at 120, 250, 450, and 550∘, respectively, in helium air) and three EC fractions (EC1, EC2, and EC3 at 550,700, and 800∘, respectively) in the mixture air (98 % helium and 2 % oxygen) by an IMPROVE thermal–optical reflectance (TOR) protocol. Pyrolyzed organic carbon (POC) was separately detected by transmittance. IMPROVE OC was defined as OC1 + OC2 + OC3 + OC4 + POC, and EC was calculated by EC1 + EC2 + EC3 − POC.
2.4 Satellite data and ship traffic data
The satellites, including the Moderate Resolution Imaging Spectroradiometer (MODIS) with a resolution of 10×10 km, Measurement of Pollutants in the Troposphere (MOPITT), and the Ozone Monitoring Instrument (OMI) reaching a spatial resolution of 13×24 km at nadir, and the Earth Observing System (NASA EOS) Aura satellite, were applied to provide spatial distribution of aerosol particles and trace gases (Xu et al., 2011; Huang et al., 2012a). The column levels of CO, NO2, SO2, and aerosol optical depth (AOD) were retrieved over the MLYR region. In this study, all data from satellite datasets were interpolated and averaged into grid cells with a resolution.
Ship positions and numbers in the Yangtze River channel were decoded by Automatic Identification System (AIS) databases, which were obtained from the Maritime Safety Administration of Shanghai. A 15-day AIS dataset along the Yangtze River was selected with a high time resolution (about 15 min).
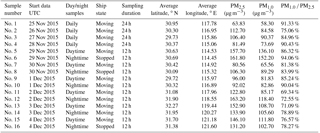
Table 1Detailed information of ambient PM2.5 and PM1.0 during the YRC.
2.5 Potential source contribution function
The potential source contribution function developed by Hopke et al. (1995) was applied to derive the potential source regions and spatial distributions. In this study, 3-day back trajectories arriving at a height of 500 m were calculated using the Hybrid Single Particle Lagrangian Integrated Trajectory (HYSPLIT-4) model from the National Oceanic and Atmospheric Administration (NOAA) (https://ready.arl.noaa.gov/HYSPLIT_hytrial.php, last access: 1 April 2017) with global meteorological data from the NCEP reanalysis (ftp://arlftp.arlhq.noaa.gov/pub/archives/reanalysis, last access: 17 December 2015) (Draxler and Hess, 1998). The contribution of the potential sources during the YRC was calculated by the potential source contribution function (PSCF) analysis with TrajStat (Wang et al., 2009). The domain sources were restricted to 25–45∘ N and 110–125∘ E, which were divided into grid cells with a resolution. The PSCF value for the ijth grid cell was defined as
where Nij is the total number of trajectory segment endpoints that fall in the ij cell, and Mij is the number of endpoints for the same cell with arrival times at the sampling site, corresponding to pollutant concentrations higher than an arbitrary criterion value. In this study, the average concentration for each trace element was set as the criteria value. To reduce the random error and uncertainty of the small value of nij, the weighting function of Wij reduced the PSCF values when the total number of the endpoints in a particular cell nij was approximately 3 times fewer than the average NAve value of the endpoints per each cell (Han et al., 2005):
3.1 Classification of the typical pollution episodes
The air pollution during the cruise was classified into eight distinct episodes, based on sampling locations, backward trajectories, and photochemical processes (T ∕ B value) (Fig. 1, Supplement Figs. S1 and S2 and Table 1). The detailed meteorological information over the MLYR region is also summarized in the Supplement. As shown in Fig. S1, the first episode (EP-1), starting from 22 to 23 November, was characterized by the sampled air masses that came from the East China Sea and was typically influenced by the local industry and Shanghai harbor pollution. The ratio of T ∕ B ranged from 0.6 to 2 with an average of 1.3, suggesting fresh air masses mixed by the aged ones. The air masses in the secondary episode (EP-2), with B ∕ T <1, originated from the rural areas (Anhui and Henan), carrying agriculture emissions (Fig. S2). Sampled air masses stagnated around Jiujiang to Wuhan from the third episode (EP-3) to the fifth episode (EP-5). However, the fourth episode (EP-4) (Wuhan region) with the low average T ∕ B ratio of 0.97 underwent significant atmospheric aging. The local air during EP-4 was in a low-pressure system with low wind speeds that did not favor the diffusion of the local pollution (Fig. S3). Air masses with T ∕ B ratio ≥2 were identified from fresh emissions. Both EP-3 and EP-5 (nearly Jiujiang) were characterized by a high T ∕ B value (Fig. S2), suggesting that these two pollution episodes were contributed to mainly by regional fresh emissions. For the sixth episode (EP-6), the wind direction shifted from southwest to northwest, and the vessel again traveled through the rural area of the middle reach of the Yangtze River, suggesting that air masses may originate from agricultural activities. Then, in the seventh episode (EP-7), a cold front arrived, and wind speeds increased significantly from the average 3.84 to 5.38 m s−1 (Table 2) with air masses transported from northern inland regions, which was further confirmed by wind fields (Fig. S3) and the sharp decreases in RH (Table 2). The last episode (EP-8) was in the YRD region where highly intensive anthropogenic activities released a large amount of pollutants. Air masses in EP-8, with the average T ∕ B value of 1.73, were expected to be a mixture of aged sources with regional fresh emissions. Overall, EP-1 and EP-8 (the YRD region) were mainly influenced by fresh local emissions mixed with aged air masses, while agriculture emissions contributed significantly during the EP-2 and EP-6 episodes. Both EP-3 and EP-5 were characterized by fresh emissions, even though the megapolis was not available in this region. The cruise started on 22 November, but the offline PM2.5 samples were collected after 25 November. Thus, the EP-1 description was ignored in the present study.
Table 2The pollutant levels and meteorological parameters in eight different episodes. Dates and times are given in YYYY/MM/DD and HH:MM.
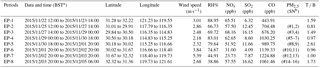
a Beijing standard time (GMT − 8); T ∕ B is the ratio of toluene to benzene. b Sample number in Table 1.
3.2 Air pollution during the YRC
3.2.1 Variability in air pollutants observed in the vessel
PM2.5 and PM1.0 were sampled from 25 November to 5 December in 2015. Detailed information is also summarized in Table 1. The average mass concentrations of PM1.0 and PM2.5 during the YRC were 96.69±22.18 and 119.29±33.67 µg m−3, respectively. The average ratio of PM1.0 ∕ PM2.5 was 0.8±0.085, implying that PM2.5 was mainly dominated by fine particles with a size of <1.0 µm. Detailed meteorological information, including T, RH, pressure, wind direction and wind speed, and trace gases in different episodes, is also summarized in Table 2. The peak concentrations of PM2.5 were observed in EP-4 and EP-7 (Table 1). However, there were obvious differences between EP-4 and EP-7 in the meteorological parameters and trace gas levels, indicating that these two pollution events were completely different. As mentioned in Sect. 3.1, sampled air masses in EP-4 mainly originated from local emissions, whereas EP-7 was influenced by long-range transport of air pollution.
As shown in Table 2, the average concentrations of CO, SO2, and NOx varied dramatically in the different pollution episodes. Average concentrations of CO and SO2 (993.96±387.34 and 9.32±4.33 ppbv, respectively) were slightly lower than those in the cities in winter, including Wuhan (1024.00 and 13.30 ppbv) (Wang et al., 2017), Nanjing (1096.00 and 13.09 ppbv) (Sun et al., 2017), Chengdu (1440.00 and 12.60 ppbv) (Liao et al., 2017), and Shanghai (1067.20 and 18.90 ppbv) (Huang et al., 2012a). CO levels continued to rise since the start of the YRC and finally peaked in EP-6 and EP-7. Meanwhile, the SO2 and NOx levels were much lower in these two episodes, which were identified as the BB event. As previously reported, biomass burning could produce large amounts of CO, while NOx and SO2 were not the major gaseous pollutants released from BB (Huang et al., 2012a; X. Ding et al., 2013). The mean CO concentration in EP-7 reached 1224.88 ppbv, which was close to the level recorded at Shanghai during the harvest season of wheat (June) (Huang et al., 2012a). The SO2 concentrations in EP-3 and EP-8 greatly increased and were close to the SO2 level in the haze event in Shanghai (Huang et al., 2012a). This was partly caused by local fresh emissions (the high T ∕ B in EP-3 and EP-8). Except for EP-6 and EP-7 (BB event), the NOx concentration almost exceeded 50 ppbv along this cruise. The average mass concentration of NOx in this cruise is 63.74±41.08 ppbv, which was much higher than the mean level in Shanghai (42.40 ppbv, 2012) (Han et al., 2015) and Guangzhou (39.14 ppbv, 2012) (Zou et al., 2015) that represented the typical urban NOx level. The NOx concentration peaked in EP-3, which was identified to mainly come from local emissions. The high NOx level during the YRC was identified to come from strong regional emissions. It could be derived that multiple sources of air pollution were distributed on both banks of the Yangtze River.
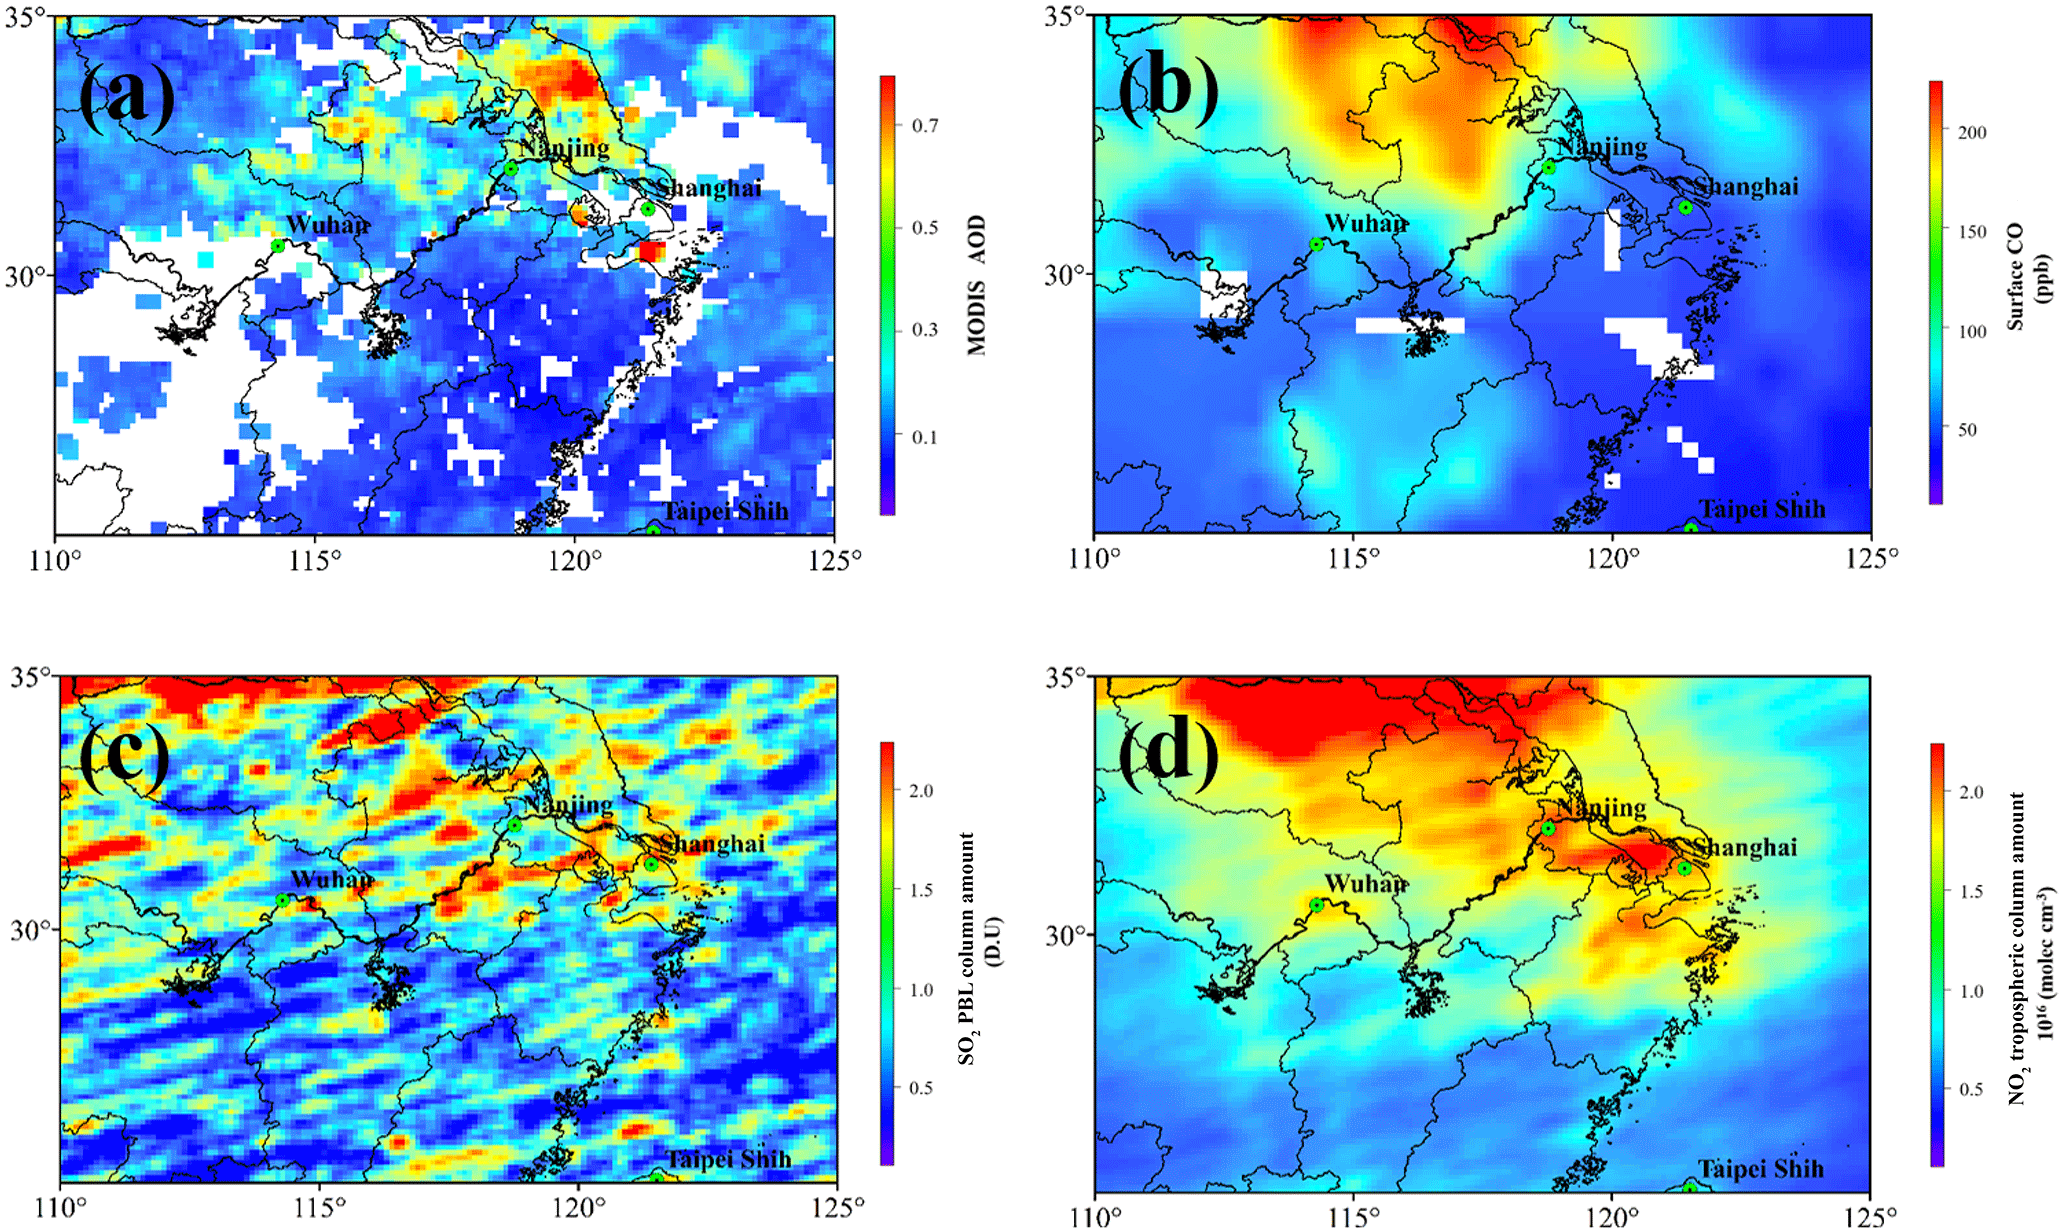
Figure 2The average distribution of (a) aerosol optical depth at 550 nm (MODIS L2); (b) CO column mixture ratio (MOPITT L2); (c) the SO2 column concentration (OMI L2); (d) the NO2 column concentration (OMI L2) over the MLYR region.
3.2.2 Regional distribution of air pollutants identified by remote sensing observation
The MLYR region is one of the most polluted areas in China, and the spatial distribution of various pollutants was apparently different from coastal to inland regions. As shown in Fig. 2a, the high average values of AOD retrieved from MODIS MOD04 were observed in eastern Jiangsu and Shanghai, etc., where human and industrial activities were concentrated, suggesting that anthropogenic emissions were dominated. However, there was much missing data for AOD in central China due to heavy clouds. As presented in Fig. S4 of the MODIS true-color imagery on 28 November, thick clouds covered central China. In addition, the average of AOD was about 0.45, which was slightly lower than that in Shanghai in winter (0.55) (He et al., 2012) and background (0.65) in the North China Plain (Xu et al., 2011). The AOD value in northern China was higher than that in southern China. As plotted in Fig. 2b, the CO surface mixing ratio calculated by MOPITT revealed that Shandong, Henan, and Anhui were exposed to elevated CO column concentrations. CO is an important tracer for incomplete combustion sources, such as BB and fossil fuel combustions (Girach et al., 2014). BB should be a major source for CO in grain-producing areas (Huang et al., 2012a; A. J. Ding et al., 2013). As mentioned in Sect. 3.2.1, the peak CO level was also observed in Anhui and the west of Jiangsu, which was characterized by agriculture emissions (EP-6 and EP-7). However, the sources of CO in northern China should be further studied in the future. The high levels of SO2 were mainly observed in the east in Anhui and stretched to the Shanghai area (Fig. 2c), suggesting high-sulfur fossil fuels were still widely utilized over the MLYR region. Conversely, SO2 levels in Nanjing urban areas were measured at background pollution levels. In general, NO2 was regarded as a tracer for the local emission source due to a short lifetime in the atmosphere (Geng et al., 2009; Xu et al., 2011). NOx emissions mainly originated from vehicles and power plants (Fu et al., 2013; Geng et al., 2009). One can see that NO2 emissions were characterized by strong local sources in north China and the YRD region (Fig. 2d), which is in good agreement with previous reports (Lin, 2012; B. Zhao et al., 2013).
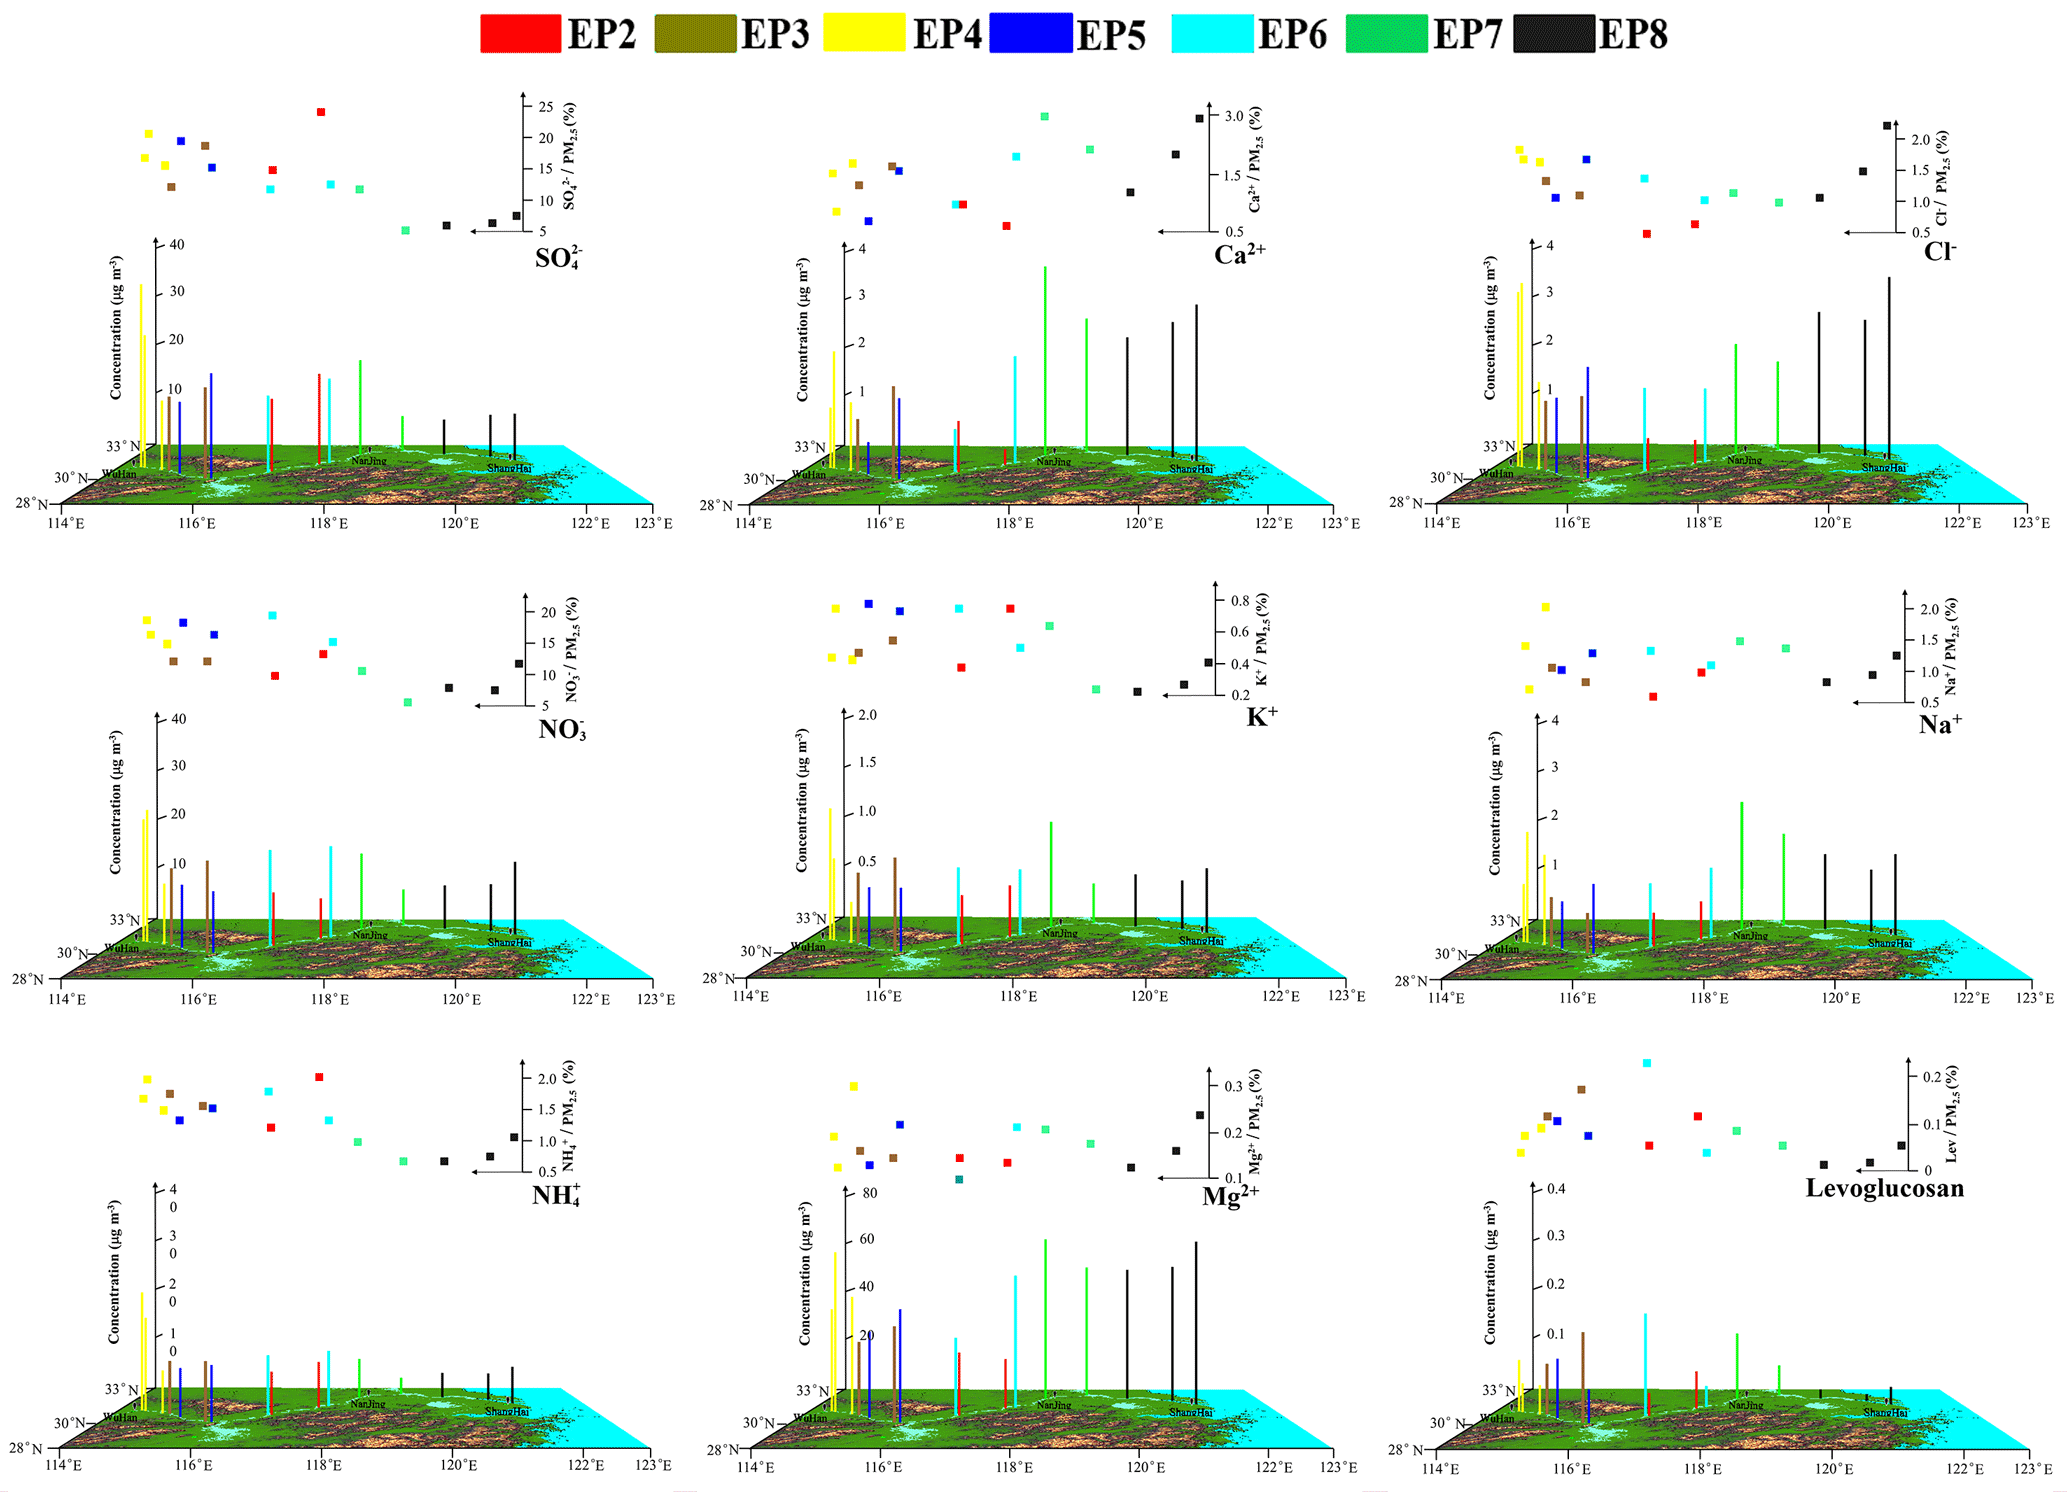
Figure 3Spatial concentration distributions of the soluble ions and levoglucosan in PM2.5 along the cruise path.
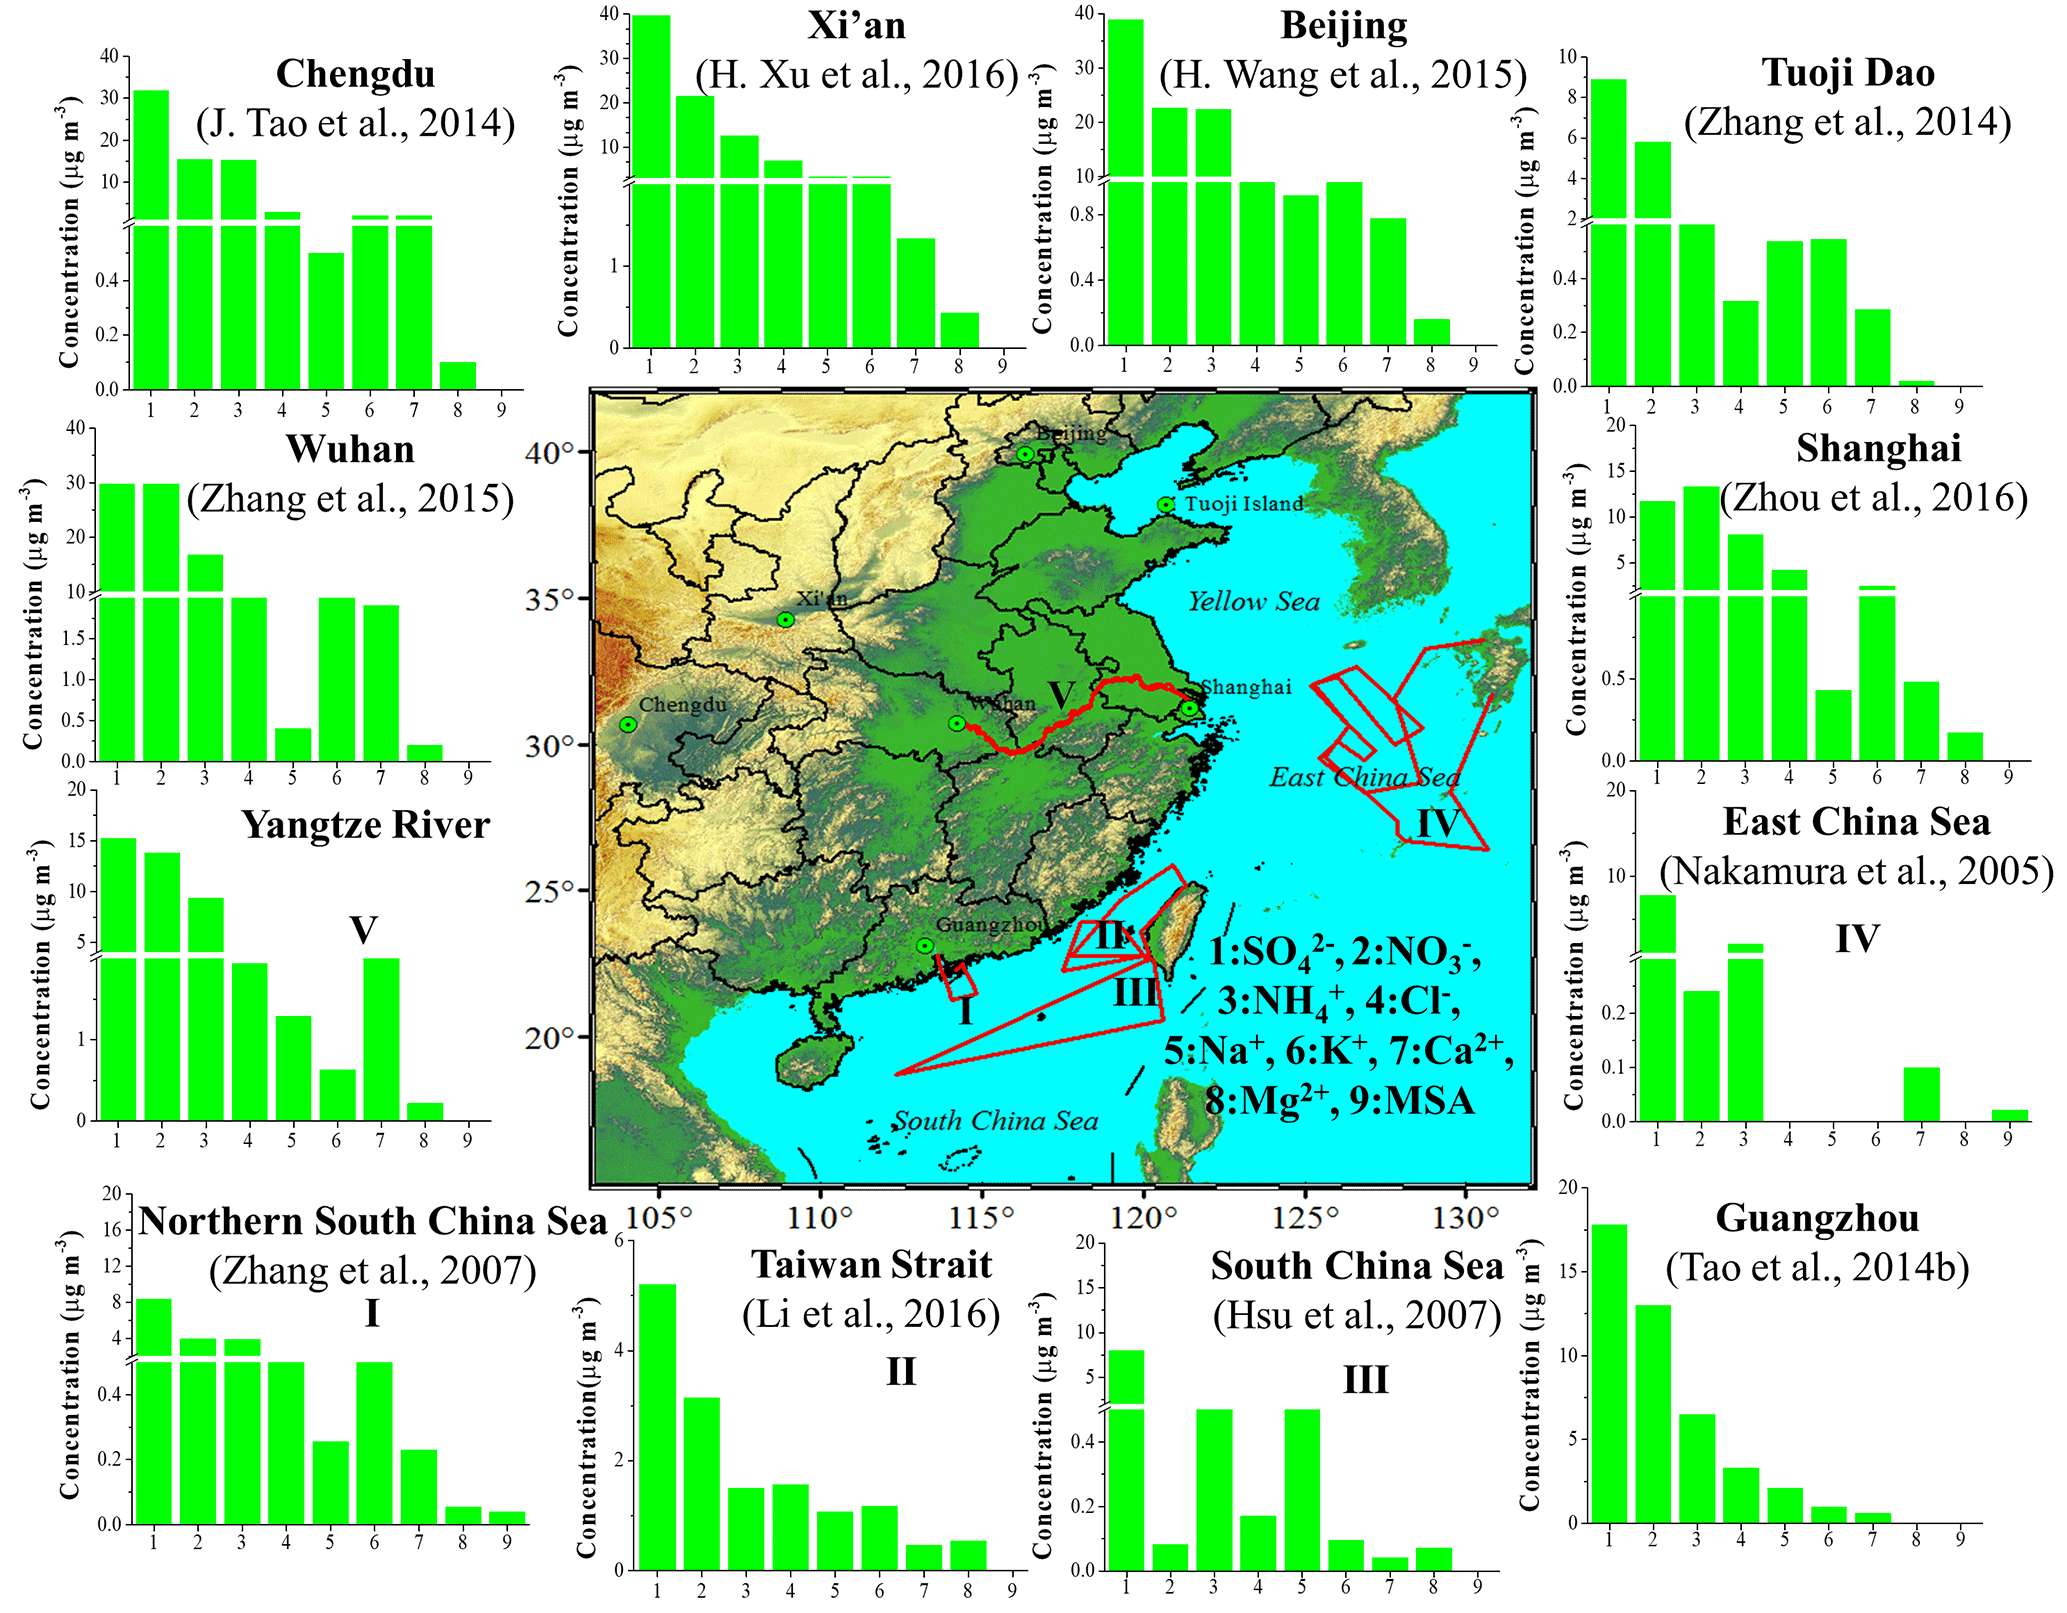
Figure 4Comparisons of major ionic species during the YRC with other regions, including Beijing, Xi'an, Chengdu, Wuhan, Guangzhou, Shanghai, northern South China Sea, Taiwan Strait, South China Sea, East China Sea, and Tuoji Dao. The red lines mark the sample routes in different cruises.
3.3 Chemical composition of fine particles during the YRC and comparisons with other published data
The concentrations and mass fractions of the major ions and levoglucosan in PM2.5 are shown in Fig. 3. The water-soluble ions constitute one of the dominant components in atmospheric aerosol and determine the aerosol acidity (Kerminen et al., 2001), accounting for 37.43 % and 40.15 % in PM2.5 and PM1.0 during the YRC, respectively. To access the data quality, ion balance gained by the major anions (, , and Cl−) and cations (Na+, , K+, Ca2+, and Mg2+) was calculated in this cruise. Both cations and anions are in units of equivalent concentration (µ eq. m−3). There is a good correlation (R2>0.99 and R2>0.98, P<0.01) between cation and anions (equivalent concentration) in PM1.0 and PM2.5, respectively, implying a high quality of data and the same source of major ions in this cruise (Fig. S5a) (Boreddy and Kawamura, 2015). Additionally, the relationship between and Ca2+ vs. and was further investigated. As plotted in Fig. S5b, the slopes of linear regression lines for [] vs. [] in PM2.5 and PM1.0 were 1.171 and 1.154, respectively, suggesting that the alkaline substance in aerosol could completely neutralize and during the YRC.
For the ionic concentration, the most abundant species of PM2.5 was with a mean of 15.21±6.69 µg m−3, followed by (13.76±4.99 µg m−3), (9.38±4.35 µg m−3), Ca2+ (2.23±1.24 µg m−3), Cl− (1.94±0.92 µg m−3), Na+ (1.29±0.48 µg m−3), K+ (0.63±0.22 µg m−3), and Mg2+ (0.22±0.07 µg m−3) (Fig. S6a). The mass concentration of SNA accounted for 85.89 % of the total water-soluble ions in PM2.5. Comparing with previous reports (Fig. 4), the SNA concentrations were much lower than those collected in the western and northern polluted cities in winter, including Beijing (38.90, 22.70, and 22.4 µg m−3) (H. Wang et al., 2015), Xi'an (39.7, 21.43, and 12.50 µg m−3) (H. Xu et al., 2016), Wuhan (29.80, 29.80, and 16.80 µg m−3) (Zhang et al., 2015), and Chengdu (31.80, 15.5, and 15.5 µg m−3) (Tao et al., 2014a). However, the concentrations of SNA were higher than those collected in the marine boundary layer, such as the East China Sea (29.80, 29.80, and 16.80 µg m−3) (Nakamura et al., 2005), northern South China Sea (7.80, 0.24, and 2.1 µg m−3) (Zhang et al., 2007), South China sea (7.99, 0.08, and 1.083 µg m−3) (Hsu et al., 2007), Taiwan Strait (5.20, 3.13, and 1.50 µg m−3) (Li et al., 2016), and Tuoji Dao in Bohai Economic Rim (8.90, 5.80, and 1.40 µg m−3) (Zhang et al., 2014). The SNA levels during the YRC were close to those in Shanghai in winter (11.7, 13.33, and 8.11 µg m−3) (Zhou et al., 2016). The mass ratio of was regarded as a marker to distinguish mobile source vs. stationary source (Huang et al., 2013). The ratio of in this campaign was also close to that of Shanghai and lower than that in other cities (Fig. 4), indicating that mobile source emissions (traffic) contributed the most to fine particles. In addition, the mass concentration of definitely exceeded the level of in the marine boundary layer (Fig. 4), indicating that marine sources were also important for (Calhoun et al., 1991). The average concentration of Ca2+ (2.23 µg m−3) in this cruise was the highest among all locations and cruises (Fig. 4), followed by Chengdu (2.10 µg m−3), Wuhan (1.90 µg m−3), and Xi'an (1.33 µg m−3). As shown in Fig. 4, Ca2+ also presented a higher concentration in the cities and decreased from inland to coastal regions, indicating that Ca2+ was mainly from terrace crustal emissions (Xiao et al., 2017). However, the concentrations of K+ and Mg2+ for the YRC were lower than those in most samples among all locations (Fig. 4). K+ may originate from BB, sea salt, and crustal dust. The average Cl− concentration during the YRC was also lower than that in most cities (Fig. 4). However, Na+ levels on this cruise were higher than most reported values (Fig. 4). The poor correlation between Na+ and Cl− also indicated that two ions may have different sources during the YRC. Furthermore, the ratio of among all locations (Fig. 4) was much higher than 1.17 (ratio of seawater), suggesting that anthropogenic sources, including BB and coal combustion, contributed to the excessive Cl− in China cities (C. Li et al., 2015; Zhang et al., 2013). The concentration of levoglucosan, a BB tracer, ranged from 0.015 to 0.18 µg m−3 with a mean value of 0.075±0.047 µg m−3, much higher than the average concentration of 0.0394 µg m−3 in Lin'an (30.3∘ N, 119.73∘ E) (a rural site in the YRD region) (Liang et al., 2017), indicating that BB was also a major contributor to PM2.5 during the YRC.
A total of 17 elements of PM1.0 and PM2.5 were measured, and the average concentrations are summarized in Table 3. For comparison, the data reported previously in megacities (in winter) and the cruises are also outlined in Table 4. Ca shows the highest concentration among all elements (Table 3) at all locations (Table 4) and shared 2.16 % on average in PM2.5, partly due to a cold front with floating dust in this campaign. The secondary highest concentration among all elements was Fe (Table 3). This concentration (1.64 µg m−3) in the campaign was higher than that at many urban sites, such as Beijing (1.55 µg m−3) (P. S. Zhao et al., 2013), Shanghai (0.56 µg m−3) (Huang et al., 2012b), and Guangzhou (0.16 µg m−3) (Lai et al., 2016), probably due to numerous steel industries and/or shipyards densely distributed on both banks of the Yangtze River. Other elements decreased from K (865.88 ng m−3) to Tl (0.32 ng m−3). Pb and Zn contributed the highest levels among heavy metals of PM2.5. Except for inland cities, such as Beijing (P. S. Zhao et al., 2013), Wuhan (Zhang et al., 2015), and Chengdu (Tao et al., 2014a), the average concentrations of Pb and Zn during the YRC were much higher than those in the other regions and cruises (Table 4). Both Pb and Zn could originate from coal combustion and/or mineral industry, which were related to energy structure and industrial layout over the MLYR region (P. S. Zhao et al., 2013; Zhao et al., 2015; Zhang et al., 2015; Tao et al., 2014a).
Table 3The average concentration of the elements in PM2.5 and PM1.0 (ng m−3) during the YRC.
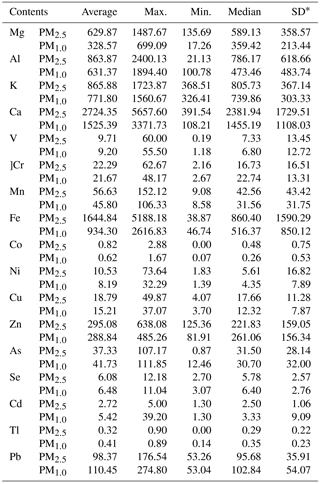
∗ SD is 1 standard deviation.
Table 4Comparisons of trace element concentrations with the reported data (µg m−3).
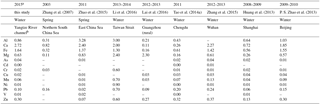
a Sampling periods. b Sampling sites.
The enrichment factors (EFs) were applied to distinguish crustal elements from the anthropogenic sources. The formula to evaluate EFs is
of which EFi is the enrichment factor of element i; Xi and XR are the concentrations of element i and reference element R in aerosol, respectively; and are the background content of elements in the MLYR soil (Wei et al., 1991). Al was determined to originate from soil. Hence, it was selected as the reference element for the calculation. The elements of EFs <10 included Al, K, Mg, and Na, all of which were regarded as coming from crustal or resuspended local soil. The species with higher EFs (10< EFs <100) were thought to be a mixture of crustal and anthropogenic sources, including Cr, Cu, Co, Ni, and V. Trace elements of EFs >100, including Ca, Zn, Se, Pb, As, Mo, Fe, and Cd, were attributed to anthropogenic sources. To further explore sources of trace elements and potential geographical distributions, principle component analysis (PCA) was used to classify the main source of trace elements of PM2.5 using the rotate component matrix and PSCF for individual elements was performed to infer the potential source and/or pathway regions. As shown in Fig. 5a, trace elements were classified into four categories (PCA), which could explain 86.73 % of the variance, indicating that the major sources of elements of PM2.5 could be considered and explained. More specifically, the first component (component 1) could account for 38.48 % of the variance, which was derived from coal combustion, including the high loadings of Cd, As, Pb, Tl, and Se. Particularly, Se was generally considered a tracer for coal combustion due to its formation in the high-temperature environment. Se produced by the rapid gas-to-particle conversion could undergo long-range transport (Nriagu, 1989; Wen and Carignan, 2007). As shown in Fig. S6b, a significant correlation (R2=0.71, P<0.01) between and Se also confirmed coal combustion. Furthermore, As and Pb mainly originated from coal combustion after phasing out of leaded gasoline in China since 1997 (Xu et al., 2012), both of which had significant correlations with Se. Component 2 had a variation of 25.45 %, contributed by the high loadings of Al, Mg, Ca, and K, all of which obviously represented crustal or soil elements, and showed low EF values (EFs <10, except Ca). Component 3, accounting for 15.14 % of the variation, was considered to be the primary source of V, Co, and Ni. Both V and Ni were usually regarded as tracers of heavy oil combustion (M. Zhao et al., 2013; Becagli et al., 2017). The fourth component (component 4) showed high loadings of Mn, Co, Zn, and Fe, all of which could explain 7.33 % of the variance. Fe exhibited high EF values, indicating that it may originate from anthropogenic sources. Anthropogenic Fe was usually deemed to originate from steel factories and/or shipyards, both of which were densely distributed along the Yangtze River (Fu et al., 2014). Their chemical processes and potential source contributions are detailed in Sect. 3.4.

Figure 5(a) Principal component analysis (PCA) of the typical elements in PM2.5; (b) time series of four typical element sources derived from PCA. All of the units are in micrograms per cubic meter.
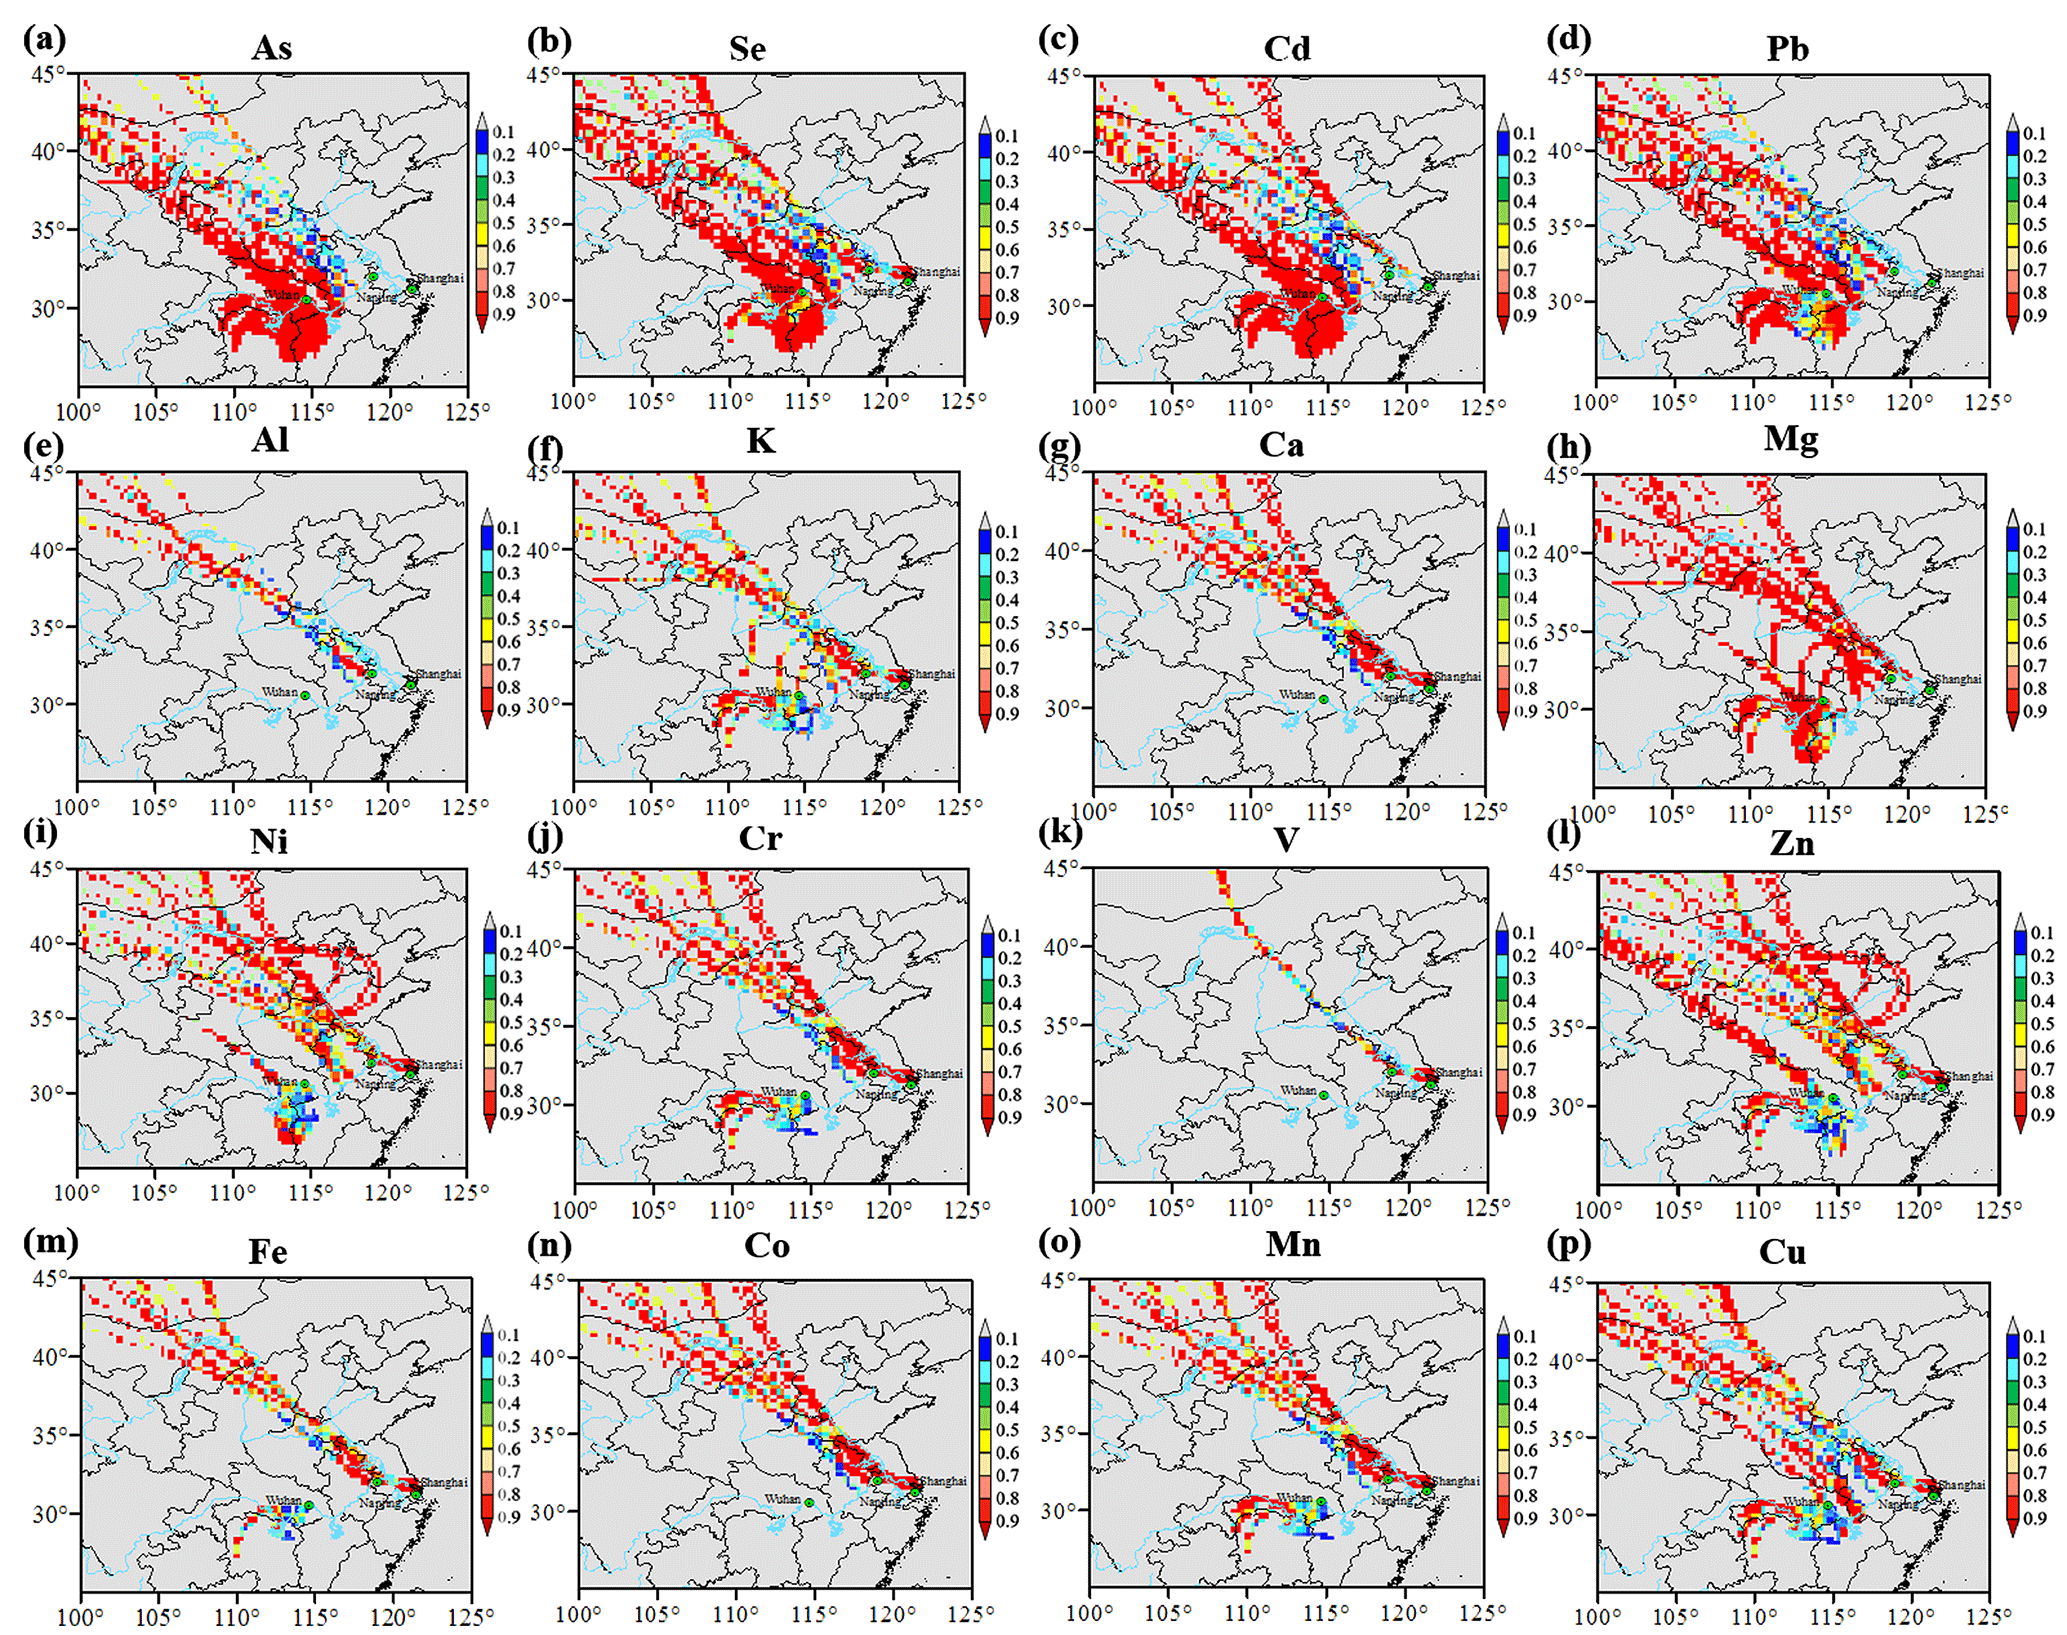
Figure 6Probable sources from PSCF for individual elements in PM2.5 during the YRC. The criteria are the mean concentration for all.
3.4 Regional difference in formation mechanisms of aerosol pollution and potential source contributions of elements in PM2.5 over the MLYR region
3.4.1 Secondary component pollution related to coal combustion in central China
As illustrated in Fig. 3, the mass concentrations of SNA with an average of 38.35±15.17 µg m−3 increased dramatically from coastal to inland cities and exhibited the highest level (no. 6, 79.06 µg m−3) in the Wuhan region (EP-4), accounting for nearly 50 % of the local PM2.5 mass loading. As mentioned above, SO2 and NOx also presented the highest concentrations in this region. Furthermore, Wuhan and the surrounding regions were controlled by a low-pressure system with low wind speed and high-RH conditions (Fig. S3), which have been verified to cause haze episodes (X. J. Zhao et al., 2013; Quan et al., 2011; Wang et al., 2010). In addition, the ratio of in the Wuhan area was close to the values of cities in northern China (relatively low) (Fig. 4), suggesting that the stationary sources (such as coal-fired power stations or stove emissions) dominated in this region. Heavy clouds and high humidity in central China suggested aqueous-phase transformation processes were probably the main reaction path of from SO2 (Wang et al., 2016; X. J. Zhao et al., 2013). In addition, the mass fractions of SNA in PM2.5 also peaked in rural regions (EP-2 and EP-6), which was in accord with the low ratio of T ∕ B in these regions, suggesting that aerosol particles in rural regions were well aged.
Meanwhile, trace elements for coal combustion (component 1) also had the highest concentrations in EP-4 and EP-5 (Fig. 5b) when the ship anchored in Wuhan and traveled through the Jiujiang area. As illustrated in Fig. 6a–d, As, Cd, Pb, and Se showed similar source distribution. The higher PSCF values in Hubei, Hunan, and Jiangxi provinces coincided well with the uneven regional distribution of residential coal consumption (Fig. S7) in central China, suggesting coal-related PM pollution was quite serious in this region during this cruise. The peak mass fraction of Cl− and in PM2.5 in Wuhan also confirmed this result Thus, we conclude that coal combustion contributed significantly to serious pollution with a high SNA loading in Wuhan and the surrounding regions during sampling.
3.4.2 Mineral dust in the YRD region
In contrast to SNA distribution, the concentration of Ca2+ along this cruise increased from the mainland to the coast of the East China Sea (Fig. 3). The peak concentration of crustal elements (component 2) and Ca2+ mass fraction of PM2.5 occurred in EP-7 when a cold front and associated northeast winds arrived, accompanied by floating dust (Figs. 3 and 5b). The dust episode was verified by the MODIS true-color image on 2 and 3 December (Fig. S4) and was further confirmed by a drastic decrease in RH with the prevailing northwest wind (Table 2 and Fig. S3). As shown in Fig. 6e–h, the YRD region and the Loess Plateau with the highest PSCF values were identified as important source regions and/or pathways for crustal elements of Al, K, Mg, and Ca. Meanwhile, central China also showed distribution of K and Mg, for which the coal combustion in this region could be primarily responsible. Furthermore, Ca showed high EFs (EFs >100), suggesting that the crustal element may not derive from a natural source but from anthropogenic resuspension of dust from road and/or construction activities along the Yangtze River. To further evaluate the impact of anthropogenic Ca, the equation below was applied:
(Ca∕Al)crust is the ratio of Ca to Al in the crust, and its value is 0.5. According to this method, the average Caanthropogenic concentration was 2.15 µg m−3, and the peak level reached 3.42 µg m−3 on 3 December. If all Caanthropogenic values in the samples of other cities and cruises (Table 4) were calculated according to the same method, the level in this cruise was much higher than those in other samples, suggesting that anthropogenic dust dominated and was distributed in the YRD region during the period.
Resembling the Ca2+ distribution pattern, the maximum concentration and mass fraction of Na+ and K+ in PM2.5 were also measured during EP-7. Significant correlation between Ca2+ and K+ suggested that dust could be the major source of K+ in PM2.5 sampled during the YRC (Fig. 3). In general, it is well known that dust particles with high alkalinity could first neutralize and in aerosol particles and then atmospheric ammonia was absorbed. The concentrations and mass fractions of SNA in PM2.5 slightly increased at the end of the cruise (EP-7 and EP-8) (Fig. 3) since carbonate in aerosol could enhance the uptake of acidic gases on particles (Huang et al., 2010). Meanwhile, the increasing mass ratio of in EP-7 and EP-8 was attributed to two main reasons (Fig. 3). The mobile sources (such as vehicle emissions) increased and released a huge amount of NOx when the vessel was close to megacities (Huang et al., 2013). Furthermore, NO2 could transform into via heterogeneous processes on the dust aerosol surface (Nie et al., 2012).
3.4.3 Heavy metals in megacities
Heavy metals have toxic effects on plants, animals, and human beings. However, there is no uniform standard concentration as a control indicator (Sharma and Agrawal, 2005). The trace elements (component 3 and component 4), with high EFs ranging from 24 to 1213, were considered to mainly come from heavy oil and industry, respectively. The high concentrations of V and Ni were observed when the ship berthed in the Waigaoqiao port region of Shanghai (EP-8) (Fig. 5b), where some field observations also identified that heavy oil combustion exerts a significant impact on the local air quality (M. Zhao et al., 2013; Fu et al., 2014; Ding et al., 2017; Liu et al., 2017). It is also reported that the transition metals of Ni and V were greatly enriched in smaller particles with a diameter of <1.0 µm (Jang et al., 2007). Fine-particle Ni (Fig. 6i) had almost the same spatial distribution as Cr (Fig. 6j), and Shanghai, Jiangsu, and the east of Anhui were identified as the major potential source regions and/or pathways, owing to ship emissions, nonferrous metal mining, and smelting industries. The Mongolian plateau was also a source region, indicating that natural dust may be another possible source for Cr and Ni. However, the high PSCF values of fine-particle V were only derived from the YRD region and Mongolian plateau (Fig. 6j). V was considered to originate from heavy oil combustion, while Ni and Cr probably have other sources (Table S1) (M. Zhao et al., 2013).
The temporal variations in component 4 nearly peaked in Wuhan and Shanghai (EP-4, EP-7, and EP-8) (Fig. 5b) where the China Baowu steel industry and numerous shipyards are located (Ivošević et al., 2016). Fine-particle Fe, Co, Mn, and Zn displayed similar regional distribution (Fig. 6l–o), and the high PSCF levels were observed in the YRD region, indicating that steel industries and/or shipyards were densely distributed in the east of Anhui, Jiangsu, and Shanghai. In addition, the high PSCF value for Zn (Fig. 6l) was also exhibited in Hubei, Henan, and Shanxi provinces, probably due to the influence of coal combustion and nonferrous metal smelting activities in these regions (T. Li et al., 2015). Overall, it should be noted that anthropogenic sources in megacities (WNS) were dominant origins for trace elements in fine particles collected during this cruise.
3.4.4 Biomass burning in rural regions
Numerous studies have also confirmed that levoglucosan mostly originates from BB (Liang et al., 2017; X. Ding et al., 2013; Wan et al., 2017; Wang et al., 2014). The distribution of levoglucosan is irregularly parabolic from inland to coastal areas in Fig. 3. The maximum value of levoglucosan (0.18 µg m−3) was observed in the rural of Anhui Province (EP-6), while its level in the YRD region (EP-8) was very low. The elevated levels of CO and low concentrations of SO2 and NOx also confirmed BB in EP-6 and EP-7 (Table 2). However, fire points could not be apparently observed in the satellite-detected fire maps (https://firms.modaps.eosdis.nasa.gov/map, last access: 1 June 2017) due to heavy cloud cover on 27 November and 1 December. During the whole observation period, there was only one sample (no. 12, Fig. S8) collected during a BB event. It was verified by MODIS fire points due to a cold front blowing heavy clouds away (Fig. S4). The slightly higher levoglucosan concentration was observed in the night and was attributed to the lower boundary layer at night and BB for heating and cooking in the rural regions.
The levoglucosan concentration and ratio of OC to levoglucosan (OC ∕ levoglucosan) were also widely applied to estimate the contribution of BB to OC in PM2.5. An empirical model was utilized as proposed by Wan et al. (2017):
The differences of the (lev ∕ OC)BB ratio among different biomass fuels and combustion conditions were taken into account. Thus, the average (lev ∕ OC)BB ratio of 8.14 % was selected to calculate the contribution of BB to OC (Wan et al., 2017). Figure S9 presents the variation in levoglucosan ∕ OC ratio along the Yangtze River. The ratio of levoglucosan ∕ OC during this cruise ranged from 0.03 % to 0.91 % with an average of 0.35±0.24 %, which was comparable to that of Lin'an in the YRD region (Liang et al., 2017). However, the ratio of levoglucosan ∕ OC during the YRC was near an order of magnitude lower than its value in New Delhi (3.1±0.8 %) (Li et al., 2014) and Lumbini (3.34±2.53 %) on the northern edge of the Indo-Gangetic Plain (Wan et al., 2017), where BB plays an important role in air quality. Figure S9 also shows the time series of contribution of BB OC to OC. The average contribution of BB OC ∕ OC was 4.26±2.89 %, while the mean mass fraction of OC to PM2.5 was slightly higher than 20 %. The peak contribution of OC derived from BB to total OC of PM2.5 nearly accounted for 11 % in EP-6, which approached that of the Pearl River region sites (13 %) (Ho et al., 2014). Here, it is emphasized that our method based on empirical formula and value is just a rough estimation. Hence, the radiocarbon measurement (14C) of carbonaceous aerosol and air quality model simulation will need to confirm this result in the future.
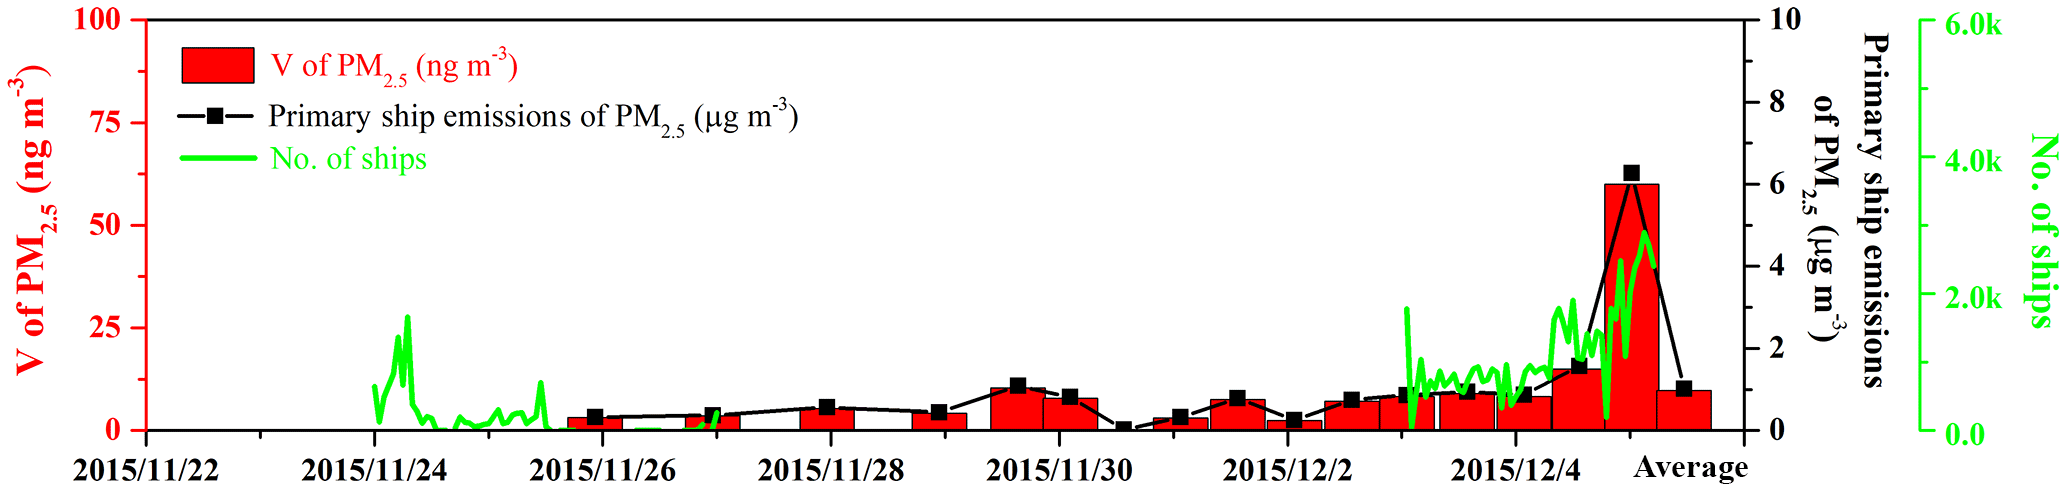
Figure 7Time series of V concentration (read column), estimates of primary PM2.5 from ship emissions, and number of ships distributed in the Yangtze River channel during the YRC.
3.5 Ship emission
3.5.1 Primary ship emissions
Over the past few decades, China's rapid economic development has led to increasingly busy shipping transportation in the Yangtze River. However, there is lack of data related to ship emissions along the Yangtze River, especially in inland areas. The ratio of V to Ni was used to judge whether ship emissions could influence air quality (Isakson et al., 2001). The average ratio of V ∕ Ni during the cruise is 1.27, which was in good agreement with previous studies (Pandolfi et al., 2011; Zhang et al., 2014). Emission factors of heavy metals from different types of fuel oil were also analyzed in our group (Table S1). Only heavy oil contained V, while the V levels emitted from other diesel and petrol sources were under the detector limits. In this study, only V was regarded as a tracer for heavy oil combustion. However, it was still difficult to distinguish V from refinery and ship emissions. Hence, the high-resolution back trajectory and high-resolution of the ship position from the AIS data were applied to investigate ship plumes during this cruise. As plotted in Fig. 7, the numbers of the ship from AIS were closely related to the V concentrations. From the inland region to the East China Sea at Shanghai, the concentration of V of PM2.5 generally increased and reached the highest level of 0.06 µg m−3 on 4 December when the vessel berthed in the anchorage of the Yangtze River estuary. Meanwhile, air masses on this evening originated from the port and anchorage (Fig. S10). Hence, V of PM2.5 sampled in the port of Shanghai could be attributable to ship emissions, especially from oceangoing vessels.
The contribution of primary ship emissions to PM2.5 could be calculated by the equation developed by Agrawal et al. (2009):
where PMa represents the primary PM2.5 concentration estimated (µg m−3); 〈a〉 is a coefficient of the fraction of V from ship emissions in fine particles in China (0.85); 〈r〉 is the average ratio of PM2.5 to normalized V emitted (ppm); Va represents the V amount of the samples (µg m−3) during the YRC and is the V content of heavy oil on average from the vessels (ppm). The value of 〈r〉 was set as 8205.8 ppm as Agrawal et al. (2009) reported. The value of 〈FV,HFO〉 was set as 65.3 ppm, which represents the average V content (M. Zhao et al., 2013). The average concentration of primary ship emissions was 1.01±1.41 µg m−3, ranging from 0.02 to 6.27 µg m−3, which is higher than that at Tuoji Dao (0.65 µg m−3) (Zhang et al., 2014). The peak level of primary ship emissions was observed in the Shanghai harbor.
3.5.2 Ship emission contribution to , , and OC
To in-depth characterize the contribution of the ship emissions to secondary fine particles, a lower limit of the ∕ V, ∕ V, EC ∕ V, and OC ∕ V ratios (equal to the average minus 1 standard deviation) was applied to estimate the particulate from heavy oil combustion along the Yangtze River (Becagli et al., 2017). As presented in Fig. S11a–b, the mass ratio of ∕ V and ∕ V decreased rapidly with increasing V concentration. According to ship traffic numbers, weather conditions, and the EFs of different types of oils (Table S1), the samples with V >15 ng m−3 were mainly considered to come from ship emissions.
The limit ratio of ∕ V, ∕ V, and OC ∕ V, and the estimation of ship emission contributions to , , OC, and PM2.5, is summarized in Table S2 in the Supplement. The minimum ratio of ∕ V in this cruise was nearly two times larger than the limit ratio for ∕ V, which was contrary to the previous results with higher from ship emissions observed in summer on the island of Lampedusa (35.5∘ N, 12.6∘ E) in the central Mediterranean. In general, and in aerosol were mainly formed through gas precursors of SO2 and NOx, respectively, both of which were completely different for lift time and chemical processes in the atmosphere. High UV radiation and humidity could accelerate the reaction rate of SO2 to (Zhou et al., 2016). However, was in gas-aerosol equilibrium with gaseous HNO3 (g). Low temperature and humidity would shift the gas-aerosol equilibrium to the particle phase () (Matthias et al., 2010; Wang et al., 2016). One reason for this discrepancy was probably meteorological and photochemical conditions, which led to lower sulfur conversion rate and particulate domination in low temperatures and moisture in winter during this cruise (Table 2). Conversely, may have other sources in the Shanghai port, whereas Lampedusa was a remote site (Becagli et al., 2017). The average estimated concentration of minimum derived from ship emissions was 1.38 µg m−3 during the YRC, which was similar to the value (1.35 µg m−3) measured in the Mediterranean (Becagli et al., 2017, 2012).
EC and OC were also estimated using the same methods for and , and the lower limit for the OC ∕ V and EC ∕ V ratios is also presented in Fig. S11c–d. In addition, significant correlation between V and EC (R2=0.71, P<0.01) suggested that V and EC have the same sources (Agrawal et al., 2009). In this cruise, organic matter (OM) of PM2.5 was estimated from OC by multiplying a conversion factor of 1.4, due to typical fresh emissions and weak light in winter (Becagli et al., 2017). The estimated lower limit for the average of ship emissions was 7.65 µg m−3, contributing 6.41 % of PM2.5 during the YRC. The peak ship contribution could reach up to 36.04 % of total PM2.5 when the vessel berthed in the Waigaoqiao port of Shanghai, which was slightly above the value (20 %–30 %) estimated by Liu et al. (2017) during ship-plume-influenced periods. It should be noted that the ship emissions decreased from the Shanghai port to the inland area. One reason for this corresponded to the density of ships in the Yangtze River channel. However, fuel oils were completely different between the ships traveling on inland waterways and oceangoing vessels. In general, light diesel with low EFs of heavy metals (such as V and Ni) was widely used by the ships on the river, whereas heavy oil with a high content of V and Ni was widely burned onboard marine vessels (Table S1). Oceangoing ship emissions were probably the major air pollution sources in the Shanghai port. Hence, it is urgent to establish emission control areas (ECAs) in Shanghai ports. However, it is worth noting that our estimation based on empirical values was also limited by meteorological conditions and sample numbers. Hence, long-term observation and high-resolution model simulations of ship emissions should be strengthened as part of the control of air quality along the Yangtze River, especially in the Shanghai harbor cluster.
In order to better characterize air quality over the region of MLYR, an intensive shipboard atmospheric observation was conducted to measure and analyze a suite of air pollutants (trace gases and fine particles) during the YRC. The average concentrations of PM1.0 and PM2.5 were 96.69±22.18 and 119.29±33.67 µg m−3 during the cruise, respectively. The most abundant ionic species in PM2.5 was with an average concentration of 15.21±6.69 µg m−3, followed by (13.76±4.99 µg m−3), (9.38±4.35 µg m−3), Ca2+ (2.23±1.24 µg m−3), Cl− (1.94±0.92 µg m−3), Na+ (1.29±0.48 µg m−3), K+ (0.63±0.22 µg m−3), and Mg2+ (0.22±0.07 µg m−3). Combined with satellite data, back trajectories, principal component analysis (PCA), and potential source contribution function (PSCF), major chemical composition of PM2.5 manifested great geographical differences and diverse anthropogenic emission sources from coastal to inland regions. Wuhan suffered secondary aerosol pollution with SNA accounting for nearly 50 % of PM2.5. The significant correlation between Se and revealed that stationary emissions may play an important role in SNA formation. The concentrations of levoglucosan of PM2.5 and CO column levels from the satellite data were significantly enhanced in the rural areas (Anhui and Jiangxi), indicating that BB from both shores of the Yangtze River may have made a remarkable contribution to air pollution in rural areas during the YRC. Further, the crustal elements of Al and Ca presented high levels in the YRD regions, and a high value of enrichment factors (EFs) of Ca (EFs >100) coupled with the PSCF results suggested the crustal elements may derive from resuspension of dust from road and/or construction activity along the banks of the Yangtze River. Ship emissions displayed a significant effect on air quality and could contribute to more than 36 % of PM2.5 in the ports of Shanghai. As far as we know, it is the first comprehensive observation of air quality over the MLYR region using a mobile vessel platform. The results herein suggest that the differentiated control measures in accordance with local pollution characteristics should be considered to tackle air pollution.
The satellite data are accessible from https://worldview.earthdata.nasa.gov/ (1 June 2017). The data for gaseous pollutant concentration and chemical composition in this article are available from the authors upon request (samllclock@126.com).
The supplement related to this article is available online at: https://doi.org/10.5194/acp-18-14445-2018-supplement.
ZL, HF and JC conceived the central idea, analyzed the data, and wrote the initial draft of the paper. The remaining authors contributed to refining the ideas and finalizing this paper.
The authors declare that they have no conflict of interest.
This article is part of the special issue “Regional transport and transformation of air pollution in eastern China”. It is not associated with a conference.
This work was supported by the Ministry of Science and Technology of China
(nos. 2016YFC0202700, 2014BAC22B00), the National Natural Science Foundation
of China (nos. 91743202, 21527814), and the Marie Skłodowska-Curie Actions
(690958-MARSU-RISE-2015).
Edited by: Yuanhang Zhang
Reviewed by: two anonymous referees
Ackerman, A. S., Kirkpatrick, M. P., Stevens, D. E., and Toon, O. B.: The impact of humidity above stratiform clouds on indirect aerosol climate forcing, Nature, 432, 1014–1017, https://doi.org/10.1038/nature03174, 2004.
Agrawal, H., Eden, R., Zhang, X., Fine, P. M., Katzenstein, A., Miller, J. W., Ospital, J., and Teffera, S.: Primary particulate matter from ocean-going engines in the Southern California Air Basin, Environ. Sci. Technol., 43, 5398–5402, 2009.
An, J., Wang, H., Shen, L., Zhu, B., Zou, J., Gao, J., and Kang, H.: Characteristics of new particle formation events in Nanjing, China: Effect of water-soluble ions, Atmos. Environ., 108, 32–40, 2015.
Baltrenas, P., Baltrenaite, E., Sereviciene, V., and Pereira, P.: Atmospheric BTEX concentrations in the vicinity of the crude oil refinery of the Baltic region, Environ. Monit. Assess., 182, 115–127, 2011.
Becagli, S., Sferlazzo, D. M., Pace, G., di Sarra, A., Bommarito, C., Calzolai, G., Ghedini, C., Lucarelli, F., Meloni, D., Monteleone, F., Severi, M., Traversi, R., and Udisti, R.: Evidence for heavy fuel oil combustion aerosols from chemical analyses at the island of Lampedusa: a possible large role of ships emissions in the Mediterranean, Atmos. Chem. Phys., 12, 3479–3492, https://doi.org/10.5194/acp-12-3479-2012, 2012.
Becagli, S., Anello, F., Bommarito, C., Cassola, F., Calzolai, G., Di Iorio, T., di Sarra, A., Gómez-Amo, J.-L., Lucarelli, F., Marconi, M., Meloni, D., Monteleone, F., Nava, S., Pace, G., Severi, M., Sferlazzo, D. M., Traversi, R., and Udisti, R.: Constraining the ship contribution to the aerosol of the central Mediterranean, Atmos. Chem. Phys., 17, 2067–2084, https://doi.org/10.5194/acp-17-2067-2017, 2017.
Boreddy, S. K. R. and Kawamura, K.: A 12-year observation of water-soluble ions in TSP aerosols collected at a remote marine location in the western North Pacific: an outflow region of Asian dust, Atmos. Chem. Phys., 15, 6437–6453, https://doi.org/10.5194/acp-15-6437-2015, 2015.
Calhoun, J. A., Bates, T. S., and Charlson, R. J.: Sulfur isotope measurements of submicrometer sulfate aerosol particles over the Pacific Ocean, Geophys. Res. Lett., 18, 1877–1880, https://doi.org/10.1029/91gl02304, 1991.
Chameides, W. L., Yu, H., Liu, S. C., Bergin, M., Zhou, X., Mearns, L., Wang, G., Kiang, C. S., Saylor, R. D., and Luo, C.: Case study of the effects of atmospheric aerosols and regional haze on agriculture: an opportunity to enhance crop yields in China through emission controls?, P. Nat. Acad. Sci. USA, 96, 13626–13633, https://doi.org/10.1073/pnas.96.24.13626,1999.
Cheng, Z., Wang, S., Fu, X., Watson, J. G., Jiang, J., Fu, Q., Chen, C., Xu, B., Yu, J., Chow, J. C., and Hao, J.: Impact of biomass burning on haze pollution in the Yangtze River delta, China: a case study in summer 2011, Atmos. Chem. Phys., 14, 4573–4585, https://doi.org/10.5194/acp-14-4573-2014, 2014.
Coggon, M. M., Sorooshian, A., Wang, Z., Metcalf, A. R., Frossard, A. A., Lin, J. J., Craven, J. S., Nenes, A., Jonsson, H. H., Russell, L. M., Flagan, R. C., and Seinfeld, J. H.: Ship impacts on the marine atmosphere: insights into the contribution of shipping emissions to the properties of marine aerosol and clouds, Atmos. Chem. Phys., 12, 8439–8458, https://doi.org/10.5194/acp-12-8439-2012, 2012.
Ding, A. J., Fu, C. B., Yang, X. Q., Sun, J. N., Petäjä, T., Kerminen, V.-M., Wang, T., Xie, Y., Herrmann, E., Zheng, L. F., Nie, W., Liu, Q., Wei, X. L., and Kulmala, M.: Intense atmospheric pollution modifies weather: a case of mixed biomass burning with fossil fuel combustion pollution in eastern China, Atmos. Chem. Phys., 13, 10545–10554, https://doi.org/10.5194/acp-13-10545-2013, 2013.
Ding, X., Wang, X., Xie, Z., Zhang, Z., and Sun, L.: Impacts of Siberian biomass burning on organic aerosols over the North Pacific Ocean and the Arctic: primary and secondary organic tracers, Environ. Sci. Technol., 47, 3149–3157, 2013.
Ding, X., Kong, L., Du, C., Zhanzakova, A., Wang, L., Fu, H., Chen, J., Yang, X., and Cheng, T.: Long-range and regional transported size-resolved atmospheric aerosols during summertime in urban Shanghai, Sci. Total Environ., 583, 334–343, https://doi.org/10.1016/j.scitotenv.2017.01.073, 2017.
Draxler, R. R. and Hess, G. D.: An overview of the HYSPLIT_4 modelling system for trajectories, Aust. Meteorol. Mag., 47, 295–308, 1998.
Fan, Q., Zhang, Y., Ma, W., Ma, H., Feng, J., Yu, Q., Yang, X., Ng, S. K., Fu, Q., and Chen, L.: Spatial and Seasonal Dynamics of Ship Emissions over the Yangtze River Delta and East China Sea and Their Potential Environmental Influence, Environ. Sci. Technol., 50, 1322–1329, 2016.
Fu, H. B., Shang, G. F., Lin, J., Hu, Y. J., Hu, Q. Q., Guo, L., Zhang, Y. C., and Chen, J. M.: Fractional iron solubility of aerosol particles enhanced by biomass burning and ship emission in Shanghai, East China, Sci. Total Environ., 481, 377–391, https://doi.org/10.1016/j.scitotenv.2014.01.118, 2014.
Fu, X., Wang, S., Zhao, B., Xing, J., Cheng, Z., Liu, H., and Hao, J.: Emission inventory of primary pollutants and chemical speciation in 2010 for the Yangtze River Delta region, China, Atmos. Environ., 70, 39–50, 2013.
Gaston, C. J., Quinn, P. K., Bates, T. S., Gilman, J. B., Bon, D. M., Kuster, W. C., and Prather, K. A.: The impact of shipping, agricultural, and urban emissions on single particle chemistry observed aboard the R/V Atlantis during CalNex, J. Geophys. Res.-Atmos., 118, 5003–5017, 2013.
Geng, F., Zhang, Q., Tie, X., Huang, M., Ma, X., Deng, Z., Yu, Q., Quan, J., and Zhao, C.: Aircraft measurements of O3, NOx, CO, VOCs, and SO2 in the Yangtze River Delta region, Atmos. Environ., 43, 584–593, 2009.
Girach, I., Nair, V. S., Babu, S. S., and Nair, P. R.: Black carbon and carbon monoxide over Bay of Bengal during W_ICARB: Source characteristics, Atmos. Environ., 94, 508–517, 2014.
Han, T., Qiao, L., Zhou, M., Qu, Y., Du, J., Liu, X., Lou, S., Chen, C., Wang, H., and Zhang, F.: Chemical and optical properties of aerosols and their interrelationship in winter in the megacity Shanghai of China, J. Environ. Sci.-China, 27, 59–69, 2015.
Han, Y.-J., Holsen, T. M., Hopke, P. K., and Yi, S.-M.: Comparison between back-trajectory based modeling and Lagrangian backward dispersion modeling for locating sources of reactive gaseous mercury, Environ. Sci. Technol., 39, 1715–1723, 2005.
He, Q., Li, C., Geng, F., Yang, H., Li, P., Li, T., Liu, D., and Pei, Z.: Aerosol optical properties retrieved from Sun photometer measurements over Shanghai, China, J. Geophys. Res.-Atmos., 117, D16204, https://doi.org/10.1029/2011JD017220, 2012.
Ho, K. F., Engling, G., Sai Hang Ho, S., Huang, R., Lai, S., Cao, J., and Lee, S. C.: Seasonal variations of anhydrosugars in PM2.5 in the Pearl River Delta Region, China, Tellus B., 66, 103–107, https://doi.org/10.3402/tellusb.v66.22577, 2014.
Hopke, P. K., Barrie, L. A., Li, S. M., Cheng, M. D., Li, C., and Xie, Y.: Possible sources and preferred pathways for biogenic and non-sea-salt sulfur for the high Arctic, J. Geophys. Res.-Atmos., 100, 16595–16603, 1995.
Hsu, S.-C., Liu, S. C., Kao, S.-J., Jeng, W.-L., Huang, Y.-T., Tseng, C.-M., Tsai, F., Tu, J.-Y., and Yang, Y.: Water-soluble species in the marine aerosol from the northern South China Sea: High chloride depletion related to air pollution, J. Geophys. Res., 112, D19304, https://doi.org/10.1029/2007jd008844, 2007.
Huang, K., Zhuang, G., Lin, Y., Fu, J. S., Wang, Q., Liu, T., Zhang, R., Jiang, Y., Deng, C., Fu, Q., Hsu, N. C., and Cao, B.: Typical types and formation mechanisms of haze in an Eastern Asia megacity, Shanghai, Atmos. Chem. Phys., 12, 105–124, https://doi.org/10.5194/acp-12-105-2012, 2012a.
Huang, K., Zhuang, G., Lin, Y., Wang, Q., Fu, J. S., Zhang, R., Li, J., Deng, C., and Fu, Q.: Impact of anthropogenic emission on air quality over a megacity – revealed from an intensive atmospheric campaign during the Chinese Spring Festival, Atmos. Chem. Phys., 12, 11631–11645, https://doi.org/10.5194/acp-12-11631-2012, 2012b.
Huang, K., Zhuang, G., Lin, Y., Wang, Q., Fu, J. S., Fu, Q., Liu, T., and Deng, C.: How to improve the air quality over megacities in China: pollution characterization and source analysis in Shanghai before, during, and after the 2010 World Expo, Atmos. Chem. Phys., 13, 5927–5942, https://doi.org/10.5194/acp-13-5927-2013, 2013.
Isakson, J., Persson, T. A., and Lindgren, E. S.: Identification and assessment of ship emissions and their effects in the harbour of Göteborg, Sweden, Atmos. Environ., 35, 3659–3666, 2001.
Ivošević, T., Stelcer, E., Orlić, I., Bogdanović Radović, I., and Cohen, D.: Characterization and source apportionment of fine particulate sources at Rijeka, Croatia from 2013 to 2015, Nucl. Instrum. Meth. A., 371, 376–380, https://doi.org/10.1016/j.nimb.2015.10.023, 2016.
Jalkanen, J.-P., Johansson, L., and Kukkonen, J.: A comprehensive inventory of ship traffic exhaust emissions in the European sea areas in 2011, Atmos. Chem. Phys., 16, 71–84, https://doi.org/10.5194/acp-16-71-2016, 2016.
Jang, H. N., Lee, S. J. H., Hwang, K. W., Yoo, J. I., Sok, C. H., and Kim, S. H.: Formation of fine particles enriched by V and Ni from heavy oil combustion: Anthropogenic sources and drop-tube furnace experiments, Atmos. Environ., 41, 1053–1063, 2007.
Jiang, T., Kundzewicz, Z. W., and Su, B.: Changes in monthly precipitation and flood hazard in the Yangtze River Basin, China, Int. J. Climatol., 28, 1471–1481, https://doi.org/10.1002/joc, 2008.
Jones, A. D. L. A., Roberts, D. L., and Slingo, A.: A climate model study of indirect radiative forcing by anthropogenic sulphate aerosols, Nature, 370, 450–453, 1994.
Kang, H., Zhu, B., Su, J., Wang, H., Zhang, Q., and Wang, F.: Analysis of a long-lasting haze episode in Nanjing, China, Atmos. Res., 120–121, 78–87, https://doi.org/10.1016/j.atmosres.2012.08.004, 2013.
Kerminen, V.-M., Hillamo, R., Teinilä, K., Pakkanen, T., Allegrini, I., and Sparapani, R.: Ion balances of size-resolved tropospheric aerosol samples: implications for the acidity and atmospheric processing of aerosols, Atmos. Environ., 35, 5255–5265, 2001.
Kong, S., Li, X., Li, L., Yin, Y., Chen, K., Yuan, L., Zhang, Y., Shan, Y., and Ji, Y.: Variation of polycyclic aromatic hydrocarbons in atmospheric PM2.5 during winter haze period around 2014 Chinese Spring Festival at Nanjing: Insights of source changes, air mass direction and firework particle injection, Sci. Total Environ., 520, 59–72, https://doi.org/10.1016/j.scitotenv.2015.03.001, 2015.
Lai, S., Zhao, Y., Ding, A., Zhang, Y., Song, T., Zheng, J., Ho, K. F., Lee, S.-C., and Zhong, L.: Characterization of PM2.5 and the major chemical components during a 1-year campaign in rural Guangzhou, Southern China, Atmos. Res., 167, 208–215, 2016.
Li, C., Ma, Z., Chen, J., Wang, X., Ye, X., Wang, L., Yang, X., Kan, H., Donaldson, D. J., and Mellouki, A.: Evolution of biomass burning smoke particles in the dark, Atmos. Environ., 120, 244–252, 2015.
Li, J., Wang, G., Aggarwal, S. G., Huang, Y., Ren, Y., Zhou, B., Singh, K., Gupta, P. K., Cao, J., and Zhang, R.: Comparison of abundances, compositions and sources of elements, inorganic ions and organic compounds in atmospheric aerosols from Xi'an and New Delhi, two megacities in China and India, Sci. Total Environ., 476–477, 485–495, https://doi.org/10.1016/j.scitotenv.2014.01.011, 2014.
Li, T., Wang, Y., Li, W. J., Chen, J. M., Wang, T., and Wang, W. X.: Concentrations and solubility of trace elements in fine particles at a mountain site, southern China: regional sources and cloud processing, Atmos. Chem. Phys., 15, 8987–9002, https://doi.org/10.5194/acp-15-8987-2015, 2015.
Li, T.-C., Yuan, C.-S., Hung, C.-H., Lin, H.-Y., Huang, H.-C., and Lee, C.-L.: Chemical Characteristics of Marine Fine Aerosols over Sea and at Offshore Islands during Three Cruise Sampling Campaigns in the Taiwan Strait – Sea Salts and Anthropogenic Particles, Atmos. Chem. Phys. Discuss., https://doi.org/10.5194/acp-2016-384, 2016.
Liang, L., Engling, G., Zhang, X., Sun, J., Zhang, Y., Xu, W., Liu, C., Zhang, G., Liu, X., and Ma, Q.: Chemical characteristics of PM2.5 during summer at a background site of the Yangtze River Delta in China, Atmos. Res., 198, 163–172, 2017.
Liao, T., Wang, S., Ai, J., Gui, K., Duan, B., Zhao, Q., Zhang, X., Jiang, W., and Sun, Y.: Heavy pollution episodes, transport pathways and potential sources of PM2.5 during the winter of 2013 in Chengdu (China), Sci. Total Environ., 584, 1056–1065, https://doi.org/10.1016/j.scitotenv.2017.01.160, 2017.
Lin, J.-T.: Satellite constraint for emissions of nitrogen oxides from anthropogenic, lightning and soil sources over East China on a high-resolution grid, Atmos. Chem. Phys., 12, 2881–2898, https://doi.org/10.5194/acp-12-2881-2012, 2012.
Liu, Z., Lu, X., Feng, J., Fan, Q., Zhang, Y., and Yang, X.: Influence of Ship Emissions on Urban Air Quality: A Comprehensive Study Using Highly Time-Resolved Online Measurements and Numerical Simulation in Shanghai, Environ. Sci. Technol., 51, 202–211, 2017.
Matthias, V., Bewersdorff, I., Aulinger, A., and Quante, M.: The contribution of ship emissions to air pollution in the North Sea regions, Environ. Pollut., 158, 2241–2250, https://doi.org/10.1016/j.envpol.2010.02.013, 2010.
Moldanová, J., Fridell, E., Popovicheva, O., Demirdjian, B., Tishkova, V., Faccinetto, A., and Focsa, C.: Characterisation of particulate matter and gaseous emissions from a large ship diesel engine, Atmos. Environ., 43, 2632–2641, 2009.
Nakamura, T., Matsumoto, K., and Uematsu, M.: Chemical characteristics of aerosols transported from Asia to the East China Sea: an evaluation of anthropogenic combined nitrogen deposition in autumn, Atmos. Environ., 39, 1749–1758, 2005.
Nie, W., Wang, T., Xue, L. K., Ding, A. J., Wang, X. F., Gao, X. M., Xu, Z., Yu, Y. C., Yuan, C., Zhou, Z. S., Gao, R., Liu, X. H., Wang, Y., Fan, S. J., Poon, S., Zhang, Q. Z., and Wang, W. X.: Asian dust storm observed at a rural mountain site in southern China: chemical evolution and heterogeneous photochemistry, Atmos. Chem. Phys., 12, 11985–11995, https://doi.org/10.5194/acp-12-11985-2012, 2012.
Novakov, T. and Penner, J. E.: Large contribution of organic aerosols to cloud-condensation-nuclei concentrations, Nature, 365, 823–826, 1993.
Nriagu, J. O.: A global assessment of natural sources of atmospheric trace metals, Nature, 338, 47–49, 1989.
Pandis, S. N., Capaldo, K., Corbett, J. J., Kasibhatla, P., and Fischbeck, P.: Effects of ship emissions on sulphur cycling and radiative climate forcing over the ocean, Nature, 400, 743–746, 1999.
Pandolfi, M., Gonzalez-Castanedo, Y., Alastuey, A., Jd, D. L. R., Mantilla, E., As, D. L. C., Querol, X., Pey, J., Amato, F., and Moreno, T.: Source apportionment of PM10 and PM2.5 at multiple sites in the strait of Gibraltar by PMF: impact of shipping emissions, Environ. Sci. Pollut. Res., 18, 260–269, https://doi.org/10.1007/s11356-010-0373-4, 2011.
Pöschl, U.: Atmospheric aerosols: composition, transformation, climate and health effects, Angew. Chem. Int. Ed., 44, 7520–7540, https://doi.org/10.1002/anie.200501122, 2005.
Quan, J., Zhang, Q., He, H., Liu, J., Huang, M., and Jin, H.: Analysis of the formation of fog and haze in North China Plain (NCP), Atmos. Chem. Phys., 11, 8205–8214, https://doi.org/10.5194/acp-11-8205-2011, 2011.
Seaton, A., Godden, D., MacNee, W., and Donaldson, K.: Particulate air pollution and acute health effects, Lancet, 345, 176–178, 1995.
Sharma, R. K. and Agrawal, M.: Biological effects of heavy metals: An overview, J. Environ. Biol., 26, 301–313, 2005.
Shen, G. F., Yuan, S. Y., Xie, Y. N., Xia, S. J., Li, L., Yao, Y. K., Qiao, Y. Z., Zhang, J., Zhao, Q. Y., and Ding, A. J.: Ambient levels and temporal variations of PM2.5 and PM10 at a residential site in the mega-city, Nanjing, in the western Yangtze River Delta, China, J. Environ. Sci. Heal. A, 49, 171–178, https://doi.org/10.1080/10934529.2013.838851, 2014.
Stier, P., Feichter, J., Kinne, S., Kloster, S., Vignati, E., Wilson, J., Ganzeveld, L., Tegen, I., Werner, M., Balkanski, Y., Schulz, M., Boucher, O., Minikin, A., and Petzold, A.: The aerosol–climate model ECHAM5-HAM, Atmos. Chem. Phys., 5, 1125–1156, https://doi.org/10.5194/acp-5-1125-2005, 2005.
Sun, X., Luo, X., Yan, C., Zhen, Z., Xu, J., Zhang, D., Suo, C., and Ding, Y.: Spatio-temporal characteristics of air pollution in Nanjing during 2013 to 2016 under the pollution control and meteorological factors, J. Environ. Earth. (China), 8, 506–515, 2017.
Tao, J., Gao, J., Zhang, L., Zhang, R., Che, H., Zhang, Z., Lin, Z., Jing, J., Cao, J., and Hsu, S.-C.: PM2.5 pollution in a megacity of southwest China: source apportionment and implication, Atmos. Chem. Phys., 14, 8679–8699, https://doi.org/10.5194/acp-14-8679-2014, 2014a.
Tao, J., Zhang, L., Ho, K., Zhang, R., Lin, Z., Zhang, Z., Lin, M., Cao, J., Liu, S., and Wang, G.: Impact of PM2.5 chemical compositions on aerosol light scattering in Guangzhou – the largest megacity in South China, Atmos. Res., 135, 48–58, https://doi.org/10.1016/j.atmosres.2013.08.015, 2014b.
Tao, Y., Yin, Z., Ye, X., Ma, Z., and Chen, J.: Size distribution of water-soluble inorganic ions in urban aerosols in Shanghai, Atmos. Pollut. Res., 5, 639–647, https://doi.org/10.5094/APR.2014.073, 2014.
US Environmental Protection Agency (USEPA): Environmental Technology Verification Report: Photoacoustic Infrared Monitor, Innova AirTech Instruments Type 1312 Multi-Gas Monitor, EPA #600-R-98-143, USEPA, Washington, DC, USA, 1998.
Wan, X., Kang, S., Li, Q., Rupakheti, D., Zhang, Q., Guo, J., Chen, P., Tripathee, L., Rupakheti, M., Panday, A. K., Wang, W., Kawamura, K., Gao, S., Wu, G., and Cong, Z.: Organic molecular tracers in the atmospheric aerosols from Lumbini, Nepal, in the northern Indo-Gangetic Plain: influence of biomass burning, Atmos. Chem. Phys., 17, 8867–8885, https://doi.org/10.5194/acp-17-8867-2017, 2017.
Wang, G., Zhang, R., Gomez, M. E., Yang, L., Levy Zamora, M., Hu, M., Lin, Y., Peng, J., Guo, S., Meng, J., Li, J., Cheng, C., Hu, T., Ren, Y., Wang, Y., Gao, J., Cao, J., An, Z., Zhou, W., Li, G., Wang, J., Tian, P., Marrero-Ortiz, W., Secrest, J., Du, Z., Zheng, J., Shang, D., Zeng, L., Shao, M., Wang, W., Huang, Y., Wang, Y., Zhu, Y., Li, Y., Hu, J., Pan, B., Cai, L., Cheng, Y., Ji, Y., Zhang, F., Rosenfeld, D., Liss, P. S., Duce, R. A., Kolb, C. E., and Molina, M. J.: Persistent sulfate formation from London Fog to Chinese haze, P. Natl. Acad. Sci. USA, 113, 13630–13635, https://doi.org/10.1073/pnas.1616540113, 2016.
Wang, H., Lou, S., Huang, C., Qiao, L., Tang, X., Chen, C., Zeng, L., Wang, Q., Zhou, M., and Lu, S.: Source Profiles of Volatile Organic Compounds from Biomass Burning in Yangtze River Delta, China, Aerosol Air Qual. Res., 14, 818–828, https://doi.org/10.4209/aaqr.2013.05.0174, 2014.
Wang, H., Tian, M., Li, X., Chang, Q., Cao, J., Yang, F., Ma, Y., and He, K.: Chemical Composition and Light Extinction Contribution of PM2.5 in Urban Beijing for a 1-Year Period, Aerosol Air Qual. Res, 15, 2200–2211, https://doi.org/10.4209/aaqr.2015.04.0257, 2015.
Wang, H. L., Qiao, L. P., Lou, S. R., Zhou, M., Chen, J. M., Wang, Q., Tao, S. K., Chen, C. H., Huang, H. Y., Li, L., and Huang, C.: PM2.5 pollution episode and its contributors from 2011 to 2013 in urban Shanghai, China, Atmos. Environ., 123, 298–305, 2015.
Wang, S., Yu, S., Yan, R., Zhang, Q., Li, P., Wang, L., Liu, W., and Zheng, X.: Characteristics and origins of air pollutants in Wuhan, China, based on observations and hybrid receptor models, J. Air Waste Manage., 67, 739–753, https://doi.org/10.1080/10962247.2016.1240724, 2017.
Wang, T., Nie, W., Gao, J., Xue, L. K., Gao, X. M., Wang, X. F., Qiu, J., Poon, C. N., Meinardi, S., Blake, D., Wang, S. L., Ding, A. J., Chai, F. H., Zhang, Q. Z., and Wang, W. X.: Air quality during the 2008 Beijing Olympics: secondary pollutants and regional impact, Atmos. Chem. Phys., 10, 7603–7615, https://doi.org/10.5194/acp-10-7603-2010, 2010.
Wang, X., Bi, X., Sheng, G., and Fu, J.: Hospital indoor PM10 ∕ PM2.5 and associated trace elements in Guangzhou, China, Sci. Total Environ., 366, 124–135, https://doi.org/10.1016/j.scitotenv.2005.09.004, 2006.
Wang, X., Miao, Y., Zhang, Y., Li, Y., Wu, M., and Yu, G.: Primary sources and secondary formation of organic aerosols in Beijing, China, Environ. Sci. Technol., 46, 9846–9853, 2012.
Wang, Y. Q., Zhang, X. Y., and Draxler, R. R.: TrajStat: GIS-based software that uses various trajectory statistical analysis methods to identify potential sources from long-term air pollution measurement data, Environ. Modell. Softw., 24, 938–939, https://doi.org/10.1016/j.envsoft.2009.01.004, 2009.
Wei, F., Chen, J., Wu, Y., and Zheng, C.: Study of the background contents of 61 elements of soils in China, Environm. Sci. (China), 12, 12–19, 1991.
Wen, H. and Carignan, J.: Reviews on atmospheric selenium: Emissions, speciation and fate, Atmos. Environ., 41, 7151–7165, 2007.
Xiao, H.-W., Xiao, H.-Y., Luo, L., Shen, C.-Y., Long, A.-M., Chen, L., Long, Z.-H., and Li, D.-N.: Atmospheric aerosol compositions over the South China Sea: temporal variability and source apportionment, Atmos. Chem. Phys., 17, 3199–3214, https://doi.org/10.5194/acp-17-3199-2017, 2017.
Xu, H., Cao, J., Chow, J. C., Huang, R.-J., Shen, Z., Chen, L. A., Ho, K. F., and Watson, J. G.: Inter-annual variability of wintertime PM2.5 chemical composition in Xi'an, China: Evidences of changing source emissions, Sci. Total Environ., 545, 546–555, https://doi.org/10.1016/j.scitotenv.2015.12.070, 2016.
Xu, H. M., Cao, J. J., Ho, K. F., Ding, H., Han, Y. M., Wang, G. H., Chow, J. C., Watson, J. G., Khol, S. D., Qiang, J., and Li, W. T.: Lead concentrations in fine particulate matter after the phasing out of leaded gasoline in Xi'an, China, Atmos. Environ., 46, 217–224, 2012.
Xu, W. Y., Zhao, C. S., Ran, L., Deng, Z. Z., Liu, P. F., Ma, N., Lin, W. L., Xu, X. B., Yan, P., He, X., Yu, J., Liang, W. D., and Chen, L. L.: Characteristics of pollutants and their correlation to meteorological conditions at a suburban site in the North China Plain, Atmos. Chem. Phys., 11, 4353–4369, https://doi.org/10.5194/acp-11-4353-2011, 2011.
Xu, X., Zhao, T., Liu, F., Gong, S. L., Kristovich, D., Lu, C., Guo, Y., Cheng, X., Wang, Y., and Ding, G.: Climate modulation of the Tibetan Plateau on haze in China, Atmos. Chem. Phys., 16, 1365–1375, https://doi.org/10.5194/acp-16-1365-2016, 2016.
Zhan, J., Gao, Y., Li, W., Chen, L., Lin, H., and Lin, Q.: Effects of ship emissions on summertime aerosols at Ny-Alesund in the Arctic, Atmos. Pollut. Res., 5, 500–510, https://doi.org/10.5094/APR.2014.059, 2014.
Zhang, F., Chen, Y., Tian, C., Wang, X., Huang, G., Fang, Y., and Zong, Z.: Identification and quantification of shipping emissions in Bohai Rim, China, Sci. Total Environ., 497, 570–577, https://doi.org/10.1016/j.scitotenv.2014.08.016, 2014.
Zhang, F., Wang, Z., Cheng, H., Lv, X., Gong, W., Wang, X., and Zhang, G.: Seasonal variations and chemical characteristics of PM2.5 in Wuhan, central China, Sci. Total Environ., 518, 97–105, https://doi.org/10.1016/j.scitotenv.2015.02.054, 2015.
Zhang, F., Chen, Y., Tian, C., Lou, D., Li, J., Zhang, G., and Matthias, V.: Emission factors for gaseous and particulate pollutants from offshore diesel engine vessels in China, Atmos. Chem. Phys., 16, 6319–6334, https://doi.org/10.5194/acp-16-6319-2016, 2016.
Zhang, M., Wang, X., Chen, J., Cheng, T., Wang, T., Yang, X., Gong, Y., Geng, F., and Chen, C.: Physical characterization of aerosol particles during the Chinese New Year's firework events, Atmos. Environ., 44, 5191–5198, 2010.
Zhang, R., Jing, J., Tao, J., Hsu, S.-C., Wang, G., Cao, J., Lee, C. S. L., Zhu, L., Chen, Z., Zhao, Y., and Shen, Z.: Chemical characterization and source apportionment of PM2.5 in Beijing: seasonal perspective, Atmos. Chem. Phys., 13, 7053–7074, https://doi.org/10.5194/acp-13-7053-2013, 2013.
Zhang, X., Zhuang, G., Guo, J., Yin, K., and Zhang, P.: Characterization of aerosol over the Northern South China Sea during two cruises in 2003, Atmos. Environ., 41, 7821–7836, 2007.
Zhao, B., Wang, S. X., Liu, H., Xu, J. Y., Fu, K., Klimont, Z., Hao, J. M., He, K. B., Cofala, J., and Amann, M.: NOx emissions in China: historical trends and future perspectives, Atmos. Chem. Phys., 13, 9869–9897, https://doi.org/10.5194/acp-13-9869-2013, 2013.
Zhao, M., Zhang, Y., Ma, W., Fu, Q., Yang, X., Li, C., Zhou, B., Yu, Q., and Chen, L.: Characteristics and ship traffic source identification of air pollutants in China's largest port, Atmos. Environ., 64, 277–286, 2013.
Zhao, P. S., Dong, F., He, D., Zhao, X. J., Zhang, X. L., Zhang, W. Z., Yao, Q., and Liu, H. Y.: Characteristics of concentrations and chemical compositions for PM2.5 in the region of Beijing, Tianjin, and Hebei, China, Atmos. Chem. Phys., 13, 4631–4644, https://doi.org/10.5194/acp-13-4631-2013, 2013.
Zhao, R., Han, B., Lu, B., Zhang, N., Zhu, L., and Bai, Z.: Element composition and source apportionment of atmospheric aerosols over the China Sea, Atmos. Pollut. Res., 6, 191–201, https://doi.org/10.5094/APR.2015.023, 2015.
Zhao, X. J., Zhao, P. S., Xu, J., Meng,, W., Pu, W. W., Dong, F., He, D., and Shi, Q. F.: Analysis of a winter regional haze event and its formation mechanism in the North China Plain, Atmos. Chem. Phys., 13, 5685–5696, https://doi.org/10.5194/acp-13-5685-2013, 2013.
Zhou, D., Li, B., Huang, X., Virkkula, A., Wu, H., Zhao, Q., Qiao, Y., Shen, G., Ding, A., Zhang, J., Liu, Q., Li, L., Li, C., Chen, F., and Yuan, S.: The Impacts of Emission Control and Regional Transport on PM2.5 Ions and Carbon Components in Nanjing during the 2014 Nanjing Youth Olympic Games, Aerosol Air Qual. Res., 17, 730–740, https://doi.org/10.4209/aaqr.2016.03.0131, 2017.
Zhou, M., Qiao, L., Zhu, S., Li, L., Lou, S., Wang, H., Wang, Q., Tao, S., Huang, C., and Chen, C.: Chemical characteristics of fine particles and their impact on visibility impairment in Shanghai based on a 1-year period observation, J. Environ. Sci.-China, 48, 151–160, 2016.
Zou, Y., Deng, X. J., Zhu, D., Gong, D. C., Wang, H., Li, F., Tan, H. B., Deng, T., Mai, B. R., Liu, X. T., and Wang, B. G.: Characteristics of 1 year of observational data of VOCs, NOx and O3 at a suburban site in Guangzhou, China, Atmos. Chem. Phys., 15, 6625–6636, https://doi.org/10.5194/acp-15-6625-2015, 2015.