the Creative Commons Attribution 4.0 License.
the Creative Commons Attribution 4.0 License.
 | 09 Oct 2018
Aerosol liquid water content in the moist southern West African monsoon layer and its radiative impact
Konrad Deetz
Heike Vogel
Sophie Haslett
Peter Knippertz
Bernhard Vogel
Water uptake can significantly increase the size and therefore alters the optical properties of aerosols. In this study, the regional-scale model framework COSMO-ART is applied to southern West Africa (SWA) for a summer monsoon process study on 2–3 and 6–7 July 2016. The high moisture and aerosol burden in the monsoon layer makes SWA favorable to quantify properties that determine the aerosol liquid water content and its impact on radiative transfer. Given the marked diurnal cycle in SWA, the analysis is separated into three characteristic phases: (a) the Atlantic inflow progression phase (15:00–02:00 UTC), when winds from the Gulf of Guinea accelerate in the less turbulent evening and nighttime boundary layer, (b) the moist morning phase (03:00–08:00 UTC), when the passage of the Atlantic inflow front leads to overall cool and moist conditions over land, and (c) the daytime drying phase (09:00–15:00 UTC), in which the Atlantic inflow front reestablishes with the inland heating initiated after sunrise. This diurnal cycle also impacts, via relative humidity, the aerosol liquid water content. We analyzed the impact of relative humidity and clouds on the aerosol liquid water content. As shown by other studies, accumulation-mode particles are the dominant contributor of aerosol liquid water. We find aerosol growth factors of 2 (4) for submicron (coarse-mode) particles, leading to a substantial increase in mean aerosol optical depth from 0.2 to 0.7. Considering the aerosol liquid water content leads to a decrease in shortwave radiation of about 20 W m−2, while longwave effects appear to be insignificant, especially during nighttime. The estimated relationships between total column aerosol liquid water and radiation are W g−1 (shortwave in-cloud), W g−1 (shortwave off-cloud) and about −10 W g−1 (longwave). The results highlight the need to consider the relative humidity dependency of aerosol optical depth in atmospheric models, particularly in moist tropical environments where their effect on radiation can be very large.
- Article
(8705 KB) - Full-text XML
- Companion paper
- BibTeX
- EndNote


Water can significantly contribute to the total aerosol mass. While at low relative humidities (RHs) the inorganic salts of an aerosol particle are solid, the particle spontaneously starts taking up water when exceeding a composition-specific RH, the deliquescence relative humidity (DRE) (Seinfeld and Pandis, 2006). The aerosol liquid water content (ALWC) thereby affects the aerosol physicochemical and optical properties, which have the potential for significant impacts on the aerosol direct effect (ADE) (e.g., Jung et al., 2009).
The hygroscopic growth factor GF is a frequently used measure to describe aerosol hygroscopicity via the ratio between the wet aerosol diameter at a specific RH dp,wet (RH) and the dry aerosol diameter dp,dry (e.g., Chen et al., 2012). Furthermore, the relative ALWC is defined as the ratio between ALWC and the dry aerosol volume Vdry to assess the mass of water that is taken up by a unit volume of dry aerosol (e.g., Bian et al., 2014). The relative ALWC can be seen as a proxy for the hygroscopicity of an aerosol species.
In terms of ALWC, the understanding of aerosol effects on clouds and radiation is hindered by (a) the complexity in the reproduction of ALWC in observations and modeling under high RH (e.g., Bian et al., 2014) and (b) the covariance of cloud properties and aerosol water uptake with similar meteorological variables (e.g., RH; Andersen and Cermak, 2015). In atmospheric aerosol modeling the thermodynamic equilibrium model ISORROPIA II (Fountoukis and Nenes, 2007) is widely used (e.g., COSMO-ART, GEOS-Chem and LOTOS-EUROS), describing the chemical equilibrium between the gas, liquid and solid phases for the aerosol system containing the inorganic ions potassium, magnesium, sodium, sulfate, nitrate, chloride and water. The ALWC is derived by using the Zdanovskii, Stokes and Robinson (ZSR) mixing rule (Stokes and Robinson, 1966). Hygroscopicity measurements can be obtained, e.g., via the high-humidity tandem differential mobility analyzer (HH-TDMA; Hennig et al., 2005) for 90–98.5 % RH. Estimations of aerosol hygroscopicity are also possible via the combination of observed aerosol number size distributions and aerosol compositions from aerosol mass spectrometers. Using the ZSR mixing rule the GF can be derived (e.g., Aklilu et al., 2006).
Several measurement campaigns and modeling efforts have addressed the ALWC and its impact on aerosol chemistry, visibility and radiative transfer. Zieger et al. (2017) assess the effect of the hygroscopicity of sea salt on AOD with a global model approach. They modeled latitudinally averaged reductions in AOD of up to 14 % when reducing the hygroscopicity of sea salt from 1.5 to 1.1. Several studies analyzed the implication of ALWC for AOD (e.g., Brock et al., 2016; Beyersdorf et al., 2016). Brock et al. (2016) combine aircraft observations with a simple model to analyze the sensitivity of the AOD towards meteorological and aerosol properties in the southeastern United States. The results indicate the highest (lowest) sensitivities towards RH (dry and wet aerosol refractive index).
The most comprehensive project to date in the research field of ALWC is the Haze in China (HaChi) campaign in 2009. The scientific results can be found in the ACP special issue “Haze in China (HaChi 2009–2010)” (https://www.atmos-chem-phys.net/special_issue226.html). HaChi focused on the North China Plain between the megacities Beijing and Tianjin. The results indicate significant diurnal variations in aerosol physicochemical properties, including the aerosol scattering and absorption coefficient (high in the morning, low in the evening; Ma et al., 2011) and aerosol hygroscopicity (high during daytime, low during nighttime; Liu et al., 2011), both due to planetary boundary layer (PBL) evolution and direct particle emissions. Chen et al. (2012) identify two haze regimes: below 90 % RH the haze is caused by high aerosol volume concentrations and above 90 % RH ALWC dominates the haze. Based on the HaChi observations, Kuang et al. (2015) conclude that the diurnal cycles of the optical properties single-scattering albedo and the asymmetry parameter differ when considering ambient or dry aerosol. For ambient aerosol, maximum (minimum) values are reached after sunrise (in late afternoon), correlated with the RH, whereas for dry aerosol, maximum values are detected at noon and minimum values in the morning and evening. Kuang et al. (2015) emphasize the fact that diurnal variations in the optical properties can significantly alter the ADE. Bian et al. (2014) estimate the maximum (average) value of ALWC in HaChi to be 971 (169) µg m−3, related to a diurnal cycle with minimum values during the day and maximum values during the night. Due to the high aerosol number and their hygroscopicity from aging and cloud processing, the ALWC contribution from the accumulation mode is dominant. For RH above 60 % the ALWC observations are in good agreement with the values derived from the ISORROPIA II model. Liu et al. (2011) assess the hygroscopic properties of aerosol particles at high relative humidities and their diurnal variations in the North China Plain. They find average growth factors of 1.57–1.89 regarding dry diameters of 50–250 nm in a 95 % RH environment. For the highly hygroscopic particles a size increase by a factor of 2.1–2.8 (98.5 % RH) compared to the dry diameter is reached. Liu et al. (2011) highlight the fact that this behavior can significantly increase light scattering.
Aside from HaChi the Program of Regional Integrated Experiments of Air Quality over the Pearl River Delta (PRIDE-PRD) also focused on the air pollution in China including aerosol hygroscopicity. The ALWC effect on the total light-extinction coefficient is estimated to be 34.2 %, with contributions from ammonium sulfate (25.8 %), ammonium nitrate (5.1 %) and sea salt (3.3 %) (Jung et al., 2009). Jung et al. (2009) highlight the sensitivity of the scattering and extinction coefficients as well as the mass-scattering efficiency and single-scattering albedo towards the ALWC. The modeling study of Cheng et al. (2008) for the same region reveals an aerosol-related cooling in the lower PBL, in which 40 % of the cooling effect is related to ALWC at 80 % RH.
The western Canadian aerosol study of Aklilu et al. (2006) reveals that particle hygroscopicity is dominated by the availability of sulfate, since sulfate and GF show significant correlations. Low GFs are detected for air masses affected by urban pollution. Aklilu et al. (2006) suggest that this is related to the primary organics that are less oxidized than secondary organics (e.g., Alfarra et al., 2004). Furthermore, Aklilu et al. (2006) underline the failing of the ZSR mixing rule for particulate nitrate that is subject to a considerably smaller water uptake than ammonium nitrate.
Eastern China's tremendous air pollution makes it favorable for the study of ALWC, but a rapid growth of population and economy has also led to a significant increase in atmospheric pollutants in southern West Africa (SWA). Although SWA shows aerosol loadings similar to what is observed in East China (e.g., Hsu et al., 2017), the ALWC and its impacts on visibility and radiative transfer have not been explored until now. SWA frequently shows a hazy milky sky even without the presence of clouds or the occurrence of a mineral dust event (personal observations by the authors), raising questions about the “haze in SWA”. First insights into West African ALWC characteristics are provided by observations obtained during the African Monsoon Multidisciplinary Analysis (AMMA; Redelsperger et al., 2006). Matsuki et al. (2010) conclude that freshly emitted biomass burning aerosol is rather hydrophobic, whereas aging processes transform them into more hygroscopic particles. The aged biomass burning plumes, transported from Central to West Africa over the Atlantic Ocean (Mari et al., 2008), consist of highly hygroscopic particles with GF>1.2 (Maßling et al., 2003). Crumeyrolle et al. (2008) even see evidence for the coating of dust particles with soluble elements in mesoscale convective systems enhancing their hygroscopicity and making them favorable as cloud condensation nuclei (CCN). However, the spatial focus of AMMA was on the Sahelian region and it is expected that the conditions farther south, over the coastal region of the Gulf of Guinea with its large urbanized areas and generally higher RH, differ substantially.
Furthermore, SWA is characterized by frequent nocturnal low-level stratus (NLLS) and stratocumulus (e.g., Schrage and Fink, 2012; Schuster et al., 2013; van der Linden et al., 2015; Adler et al., 2017) that have a significant influence on the radiation budget (e.g., Hill et al., 2018). This study builds on the work of Deetz et al. (2018) that analyzes the impact of aerosol on the properties of the Atlantic inflow (AI) and stratus-to-cumulus transition (SCT) by focusing on the Ivory Coast. Deetz et al. (2018) highlight the dominance of the ADE and Twomey effect in the observed changes. The present study extends the aerosol impact analysis to the effects of ALWC on aerosol properties and radiative transfer because the model results analyzed in Deetz et al. (2018) reveal significantly enhanced aerosol optical depth (AOD) in high RH regimes over SWA.
The goals of this study are (1) to quantify the diurnal evolution of ALWC-related properties and to assess whether diurnal recurring structures can be observed, which allow for generalizing the results, (2) to evaluate the ALWC impact on radiative transfer, also in terms of relevance to atmospheric modeling, and (3) to derive robust relationships between ALWC and the change in radiative transfer.
HaChi and DACCIWA both focus on the northern hemispheric monsoon season, capture coastal areas that are frequently covered by clouds, and have similar temperature and relative humidity conditions (Liu et al., 2011; Kalthoff et al., 2018) as well as similar aerosol loadings (Bian et al., 2014; Deetz, 2018), allowing for a qualitative comparison of modeled ALWC with measurements during HaChi. This also contributes to broadening the view of ALWC–radiation interactions to a highly polluted area other than Eastern China, an area that is additionally affected by the West African monsoon (WAM) and its intense onshore moisture transport.
This study is structured as follows: in Sect. 2 the model framework and the research area are introduced. The results comprise an analysis of atmospheric dynamics and thermodynamics affecting the ALWC (Sect. 3) and a detailed assessment of the radiative impact from ALWC (Sect. 4). The study concludes with a summary and evaluation of the findings (Sect. 5).
For this study, the regional-scale model framework COSMO-ART (Consortium for Small-scale Modeling – Aerosols and Reactive Trace gases; Vogel et al., 2009) is used. COSMO-ART is based on the operational weather forecast model COSMO (Baldauf et al., 2011) of the German Weather Service (DWD). The ART extensions allow for an online treatment of aerosol dynamics and atmospheric chemistry. This study accompanies the analysis of Deetz et al. (2018) using the same basic model setup, time period and spatial focus. The SWA model domain (2.5 km grid mesh size) comprises the Ivory Coast, Ghana, Togo, Benin and the Gulf of Guinea (red rectangles in Fig. 1).

Figure 1(a) Modeling domain SWA (red rectangle, 2.5 km grid mesh size) together with its coarse domain (blue, 5 km grid mesh size). (b) Map of the research area SWA. The color shading denotes topography (meters above sea level; m a.s.l.). Topographic features are named in bold, coastal cities are shown as blue dots and the three DACCIWA supersites as red dots. Lamto (magenta dot), together with Abidjan, is used for evaluations of relative humidity profiles. The modeling domain SWA is again denoted as a red rectangle. The orange rectangle highlights the domain over the Ivory Coast, which is used for subsequent analyses. Figure adopted from Deetz et al. (2018).
The SWA domain is nested into a coarse domain (blue rectangle in Fig. 1a) with a grid mesh size of 5 km to capture pollutants of mineral and biomass burning origin. The subsequent study will focus on the results of the red domain. The coarse domain uses ICON operational forecasts (approximately 13 km grid spacing) as meteorological boundary conditions. These cover the time period 25 June to 3 July to allow for an aerosol–chemistry spin-up. The meteorological state is initialized every day at 00:00 UTC. COSMO-ART considers 12 lognormal aerosol modes: (1) Aitken mode, (2) Aitken mode containing a soot core, (3) accumulation mode, (4) accumulation mode containing a soot core, (5) pure (fresh) soot, (6) coarse mode of anthropogenic origin, (7–9) coarse modes of marine origin (3 modes) and (10–12) coarse modes of mineral origin (3 modes). In the following, three aggregated modes are considered: AIT (Aitken mode, (1)+(2)), ACC (accumulation mode, (3)+(4)) and COARSE (coarse mode of marine origin, ). Pure soot as well as the coarse mode of anthropogenic and mineral origin are not considered, since their contribution to ALWC is either not considered in COSMO-ART or the contribution is negligible. Secondary organic aerosol (SOA), formed from the gas phase and being a source for AIT, is treated by the volatility basic set (VBS) approach (Athanasopoulou et al., 2013). The model setup is summarized in Table A1 of Appendix A.
In COSMO/COSMO-ART the radiation scheme general radiative algorithm adapted to linear-type solutions radiation scheme (GRAALS; Ritter and Geleyn, 1992) is used. Without the ART extensions, GRAALS considers aerosol climatologies (Tegen et al., 1997) instead of prognostic aerosol. In this case the aerosol is treated as dry and all effects emerging from the ALWC are neglected (Bodo Ritter, personal communication, 2018). In contrast, COSMO-ART is able to derive the ALWC and its impact on radiative transfer. With respect to anthropogenic aerosol the ALWC is calculated by ISORROPIA II (Fountoukis and Nenes, 2007). Fresh soot is treated separately but is also related to an uptake of water, namely via the condensation of sulfuric acid on the particle. Nevertheless, this contribution is negligibly small, since a soot particle with a mass fraction of sulfuric acid that exceeds 5 % is shifted from the fresh soot mode to aged (internally mixed) aerosol treated by ISORROPIA II. Therefore, we will not address to the ALWC from fresh soot in the subsequent analysis. In terms of sea salt, the ALWC is parameterized via Lundgren (2010). The coarse-mode aerosols of anthropogenic and mineral origin are not related to ALWC in COSMO-ART and are therefore also neglected in the following.
It has to be considered that activated aerosol particles are not removed from the aerosol distribution, which could lead to potential double counts in the radiative transfer calculations. Prior approaches to remove the activated aerosol leads to a rapid and unrealistic cleaning of the atmosphere. With the model configuration denoted in Table A1, two realizations are performed: the reference considers ALWC in the calculation of the radiative transfer, whereas No-ALWC neglects this component. The difference between the two realizations allows for a quantification of the changes in aerosol properties and their radiative effects in the monsoon layer.
The time period 2–3 July 2016 was selected due to the intense and persistent NLLS as observed at the Savè supersite (Kalthoff et al., 2018). Furthermore, 3 July is the center of the monsoon post-onset phase (22 June–20 July; Knippertz et al., 2017) and it is expected that the undisturbed monsoon conditions favor process studies. Since the meteorological conditions show less variation from day to day, it is assumed that, even with a focus on a very short time period, insight can be achieved that can be generalized at least qualitatively to the length of the post-onset phase. Nevertheless, we added results from the time period 6–7 July to assess the robustness of our findings.
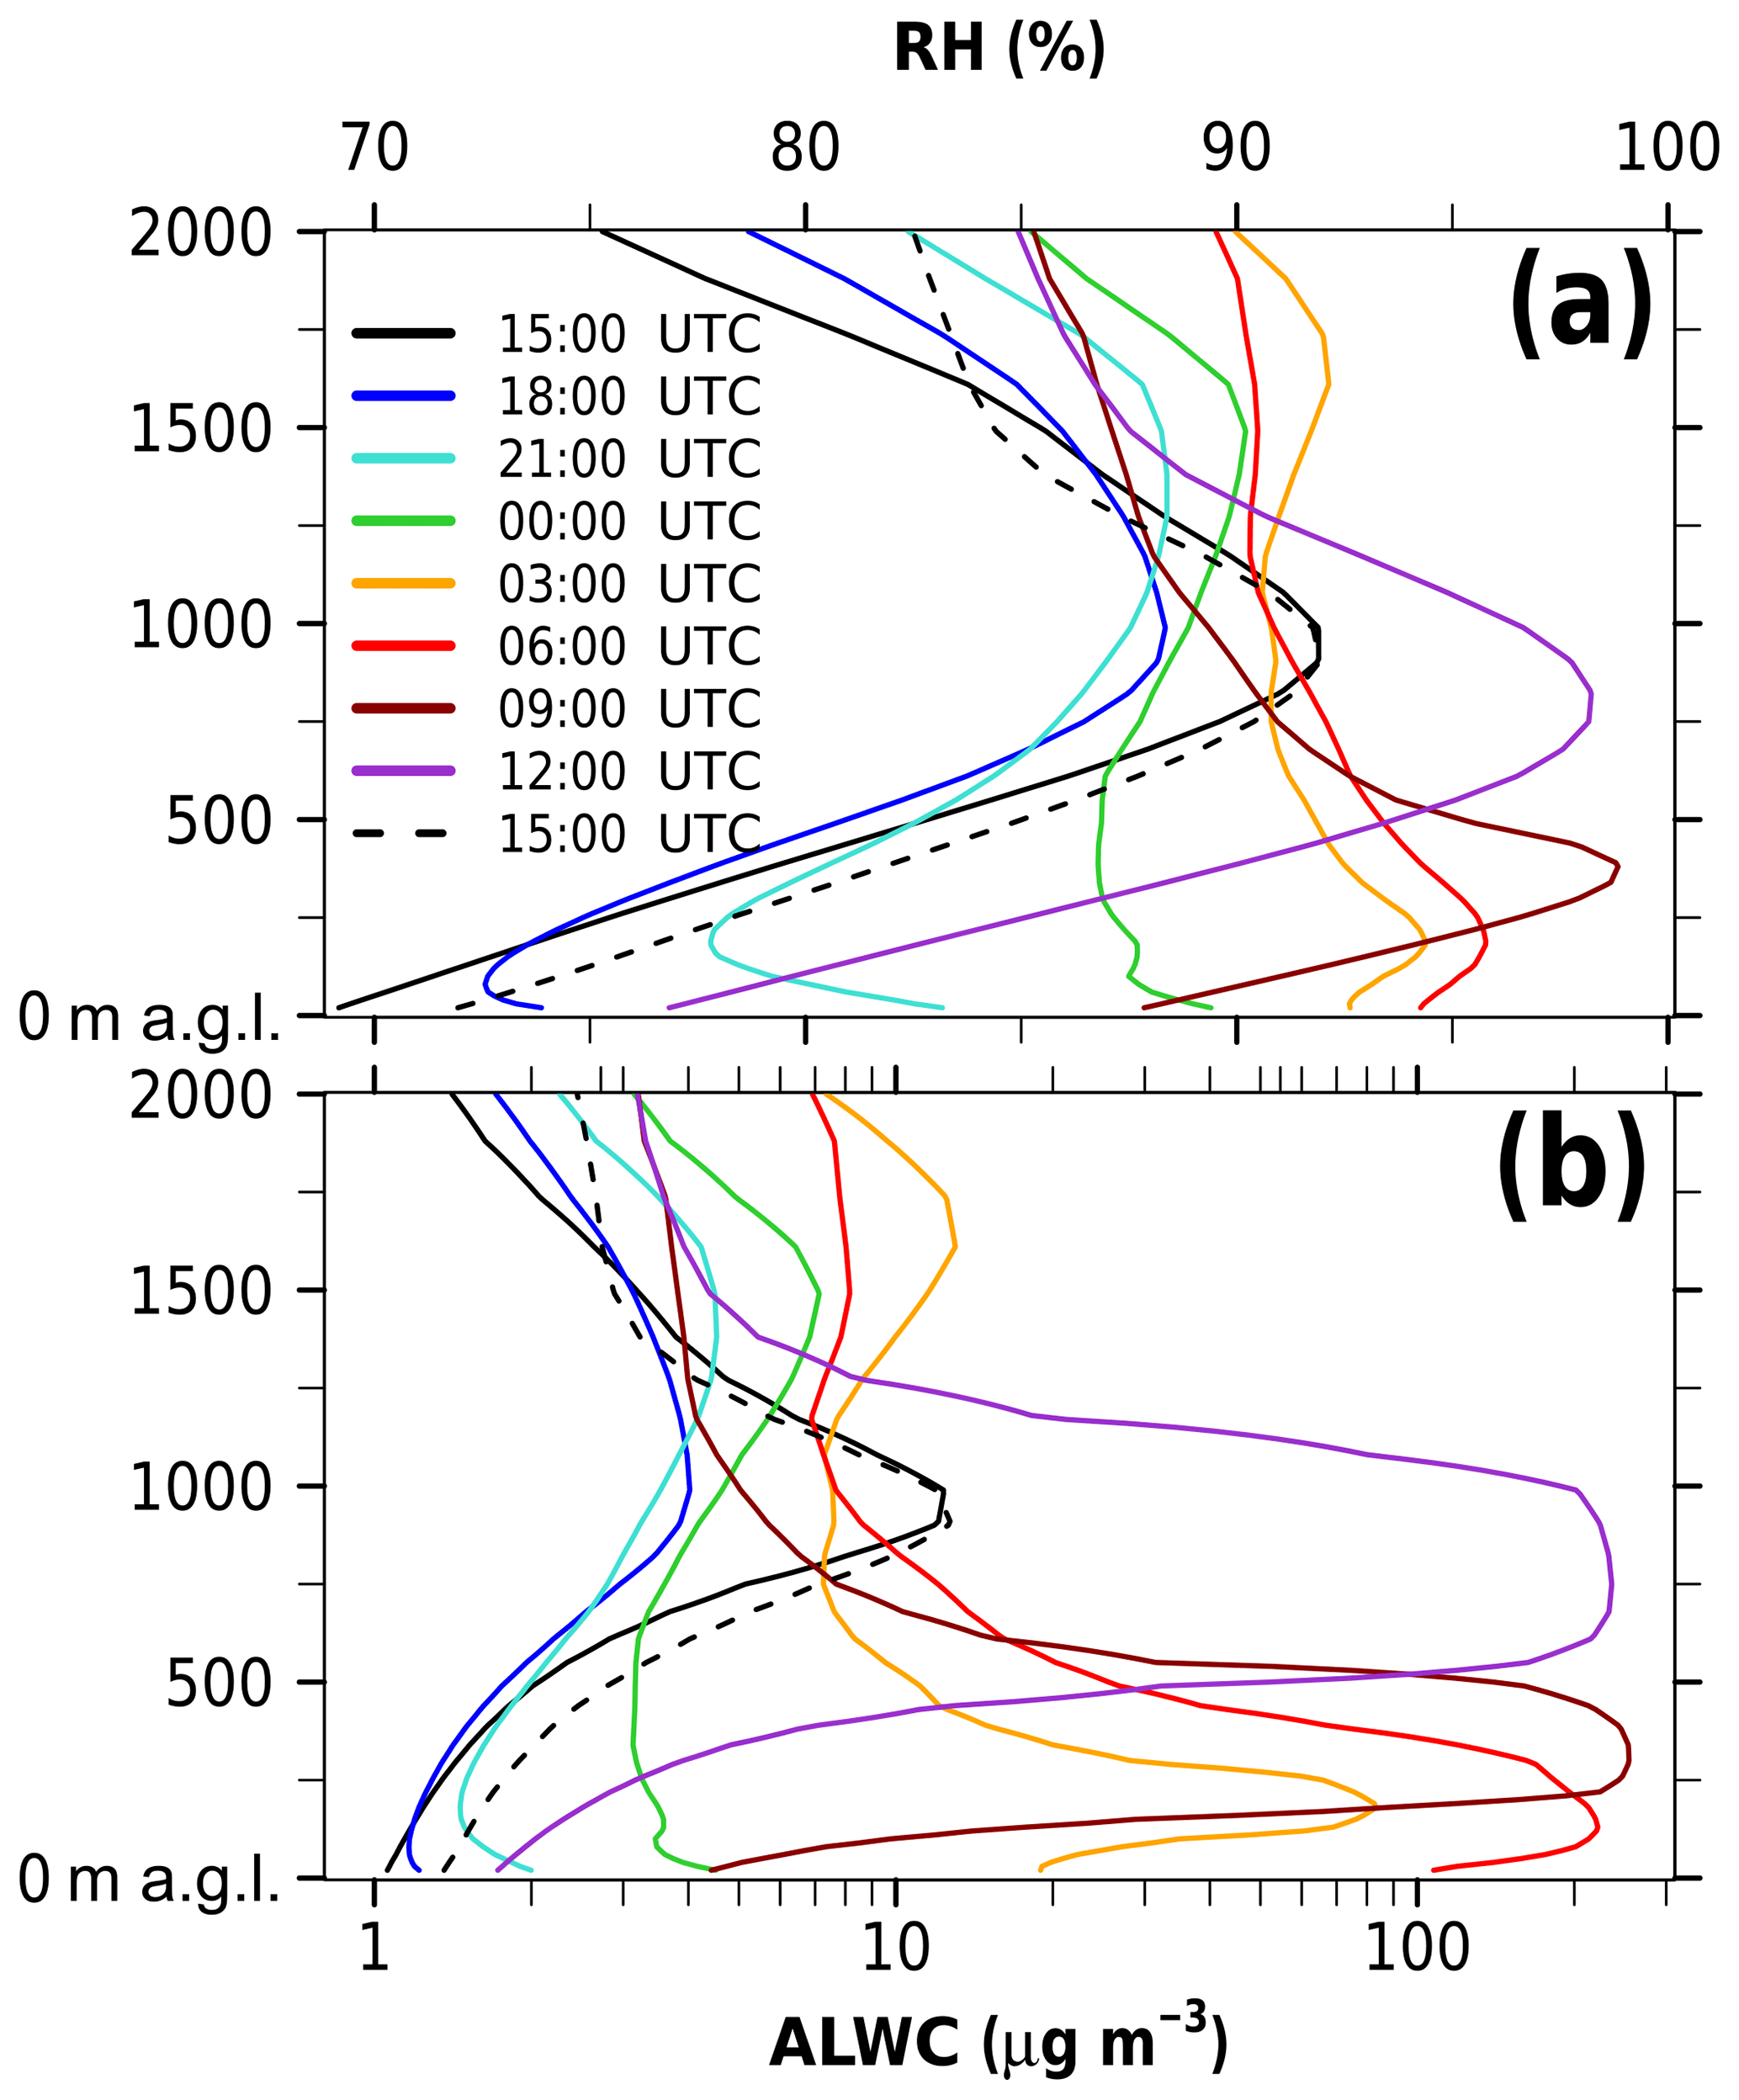
Figure 2Vertical profiles (m a.g.l.) of (a) RH (%) and (b) ALWC (µg m−3) for the median over the Ivory Coast (7.5–3∘ W, 4–10∘ N) between 2 July 15:00 UTC (black solid) and 3 July 15:00 UTC (black dashed). Consider the logarithmic abscissa of (b).
3.1 Impact of Atlantic inflow (AI)
The studies of Adler et al. (2017) and Deetz et al. (2018) reveal a regular occurrence of the phenomenon Atlantic inflow (AI) over SWA. AI involves a coastal front that develops during daytime and propagates inland in the evening. The two counteracting effects “pressure difference” and “turbulence difference” determine the AI front and its propagation. During the day the land is subject to stronger heating than the Gulf of Guinea, leading to stronger turbulence over land. The turbulence mixes the horizontal momentum of the monsoon flow vertically, impeding the monsoon flow and establishing a frontal structure near the coast. In the evening, the turbulence over land decreases, allowing the pressure difference (land–sea pressure gradient) to overcome the effects from turbulence. The front starts to penetrate inland, transporting the postfrontal air inland. Therefore, during the night the monsoon flow (directed from ocean to land) overcompensates for the land breeze that we would expect in the classical land–sea breeze concept.
The AI front marks the location of the strongest horizontal gradients, with significantly higher wind speeds and lower potential temperatures postfrontally. The postfrontal area is affected by the nocturnal low-level jet (NLLJ) with a jet axis around 250 m above ground layer (m a.g.l.). Furthermore, the postfrontal air mass is characterized by higher RH than the prefrontal area. Therefore, the AI frontal passage is characterized by a decrease in temperature and an increase in RH and wind speed. By adapting the method proposed by Grams et al. (2010), Deetz et al. (2018) identify the front in the model output by the location at which a specific isentrope of potential temperature θs (302 K) crosses a specific height hs (250 m a.g.l.). Especially over the flat terrain in the Ivory Coast a coherent coast-parallel frontal pattern can be observed. Therefore, in the following the spatial focus is set to the Ivory Coast.

Figure 3Hovmöller diagram of the median (a, c) RH (%) and (b, d) total ALWC (µg m−3) in the lowest 1500 m a.g.l. as a zonal mean over the Ivory Coast (7.5–3∘ W, 4–10∘ N) (left) between 2 July 15:00 UTC and 3 July 15:00 UTC and (right) between 6 July 15:00 UTC and 7 July 15:00 UTC. The horizontal bars denote the zonal mean location of the 302 K isentrope at 250 m a.g.l., the horizontal solid line the zonal mean coastline and the vertical dashed lines separate the three phases: the AI progression phase (Phase 1), the moist morning phase (Phase 2) and the daytime drying phase (Phase 3).
AI is the underlying meteorological process affecting all measures relevant for ALWC, such as RH and the meridional transport of specific aerosol types in the levels below 1 km a.g.l. It will be shown that the diurnal cycle of RH is not only thermodynamically (radiative cooling) but also dynamically driven (cold air advection via AI). In fact, it is a superposition of both effects, which are hard to disentangle. The AI impact will be included in the following analysis by taking into account the AI front locations. A detailed assessment of the spatiotemporal properties of AI and its aerosol sensitivity is presented in Deetz et al. (2018) based on the same model setup and time period as used for this study. Subsequently, we focus on the time period 15:00 UTC to 15:00 UTC of the following day to capture a full diurnal cycle starting with the time of the inland propagation of the AI front. As described in Deetz et al. (2018), a decrease in surface heating leads to a deceleration of the inland propagation of the AI front. Although this mechanism is assessed in detail in Deetz et al. (2018) and will therefore not be the focus of this study, we need to be aware of similar effects that could arise from changing the representation of ALWC in the radiative calculations. An analysis of the frontal position reveals that consideration of the ALWC leads to an AI front ahead of the No-ALWC front by about 6–7 km on 2–3 July between 15:00 UTC and 22:00 UTC (similar for 6–7 July). It is hypothesized that including the ALWC leads to a daytime inland cooling that reduces the turbulence over land and favors the earlier onshore propagation of the AI front. Possibly, reduced nighttime longwave cooling due to ALWC can also favor the persistence of the local heat low inland that accelerates the front. With respect to 2 July 22:00 UTC and by comparing with the findings of Deetz et al. (2018), the displacement amplitude is 2.5 times smaller than the displacement from reducing the aerosol amount by a factor of 10. Since the frontal displacement is small and virtually constant in time, the following study will not further assess this aspect.
3.2 Impact of relative humidity (RH)
COSMO-ART shows reasonable results in numerous comparisons with other DACCIWA observations (e.g., Deetz, 2018; Deetz et al., 2018). Unfortunately, no aircraft observations were obtained on 3 and 4 July over the Ivory Coast during the DACCIWA campaign and the aircraft payload did not include devices to directly measure ALWC. RH is the predominant factor for ALWC. However, the evaluation of modeled RH with observations is impeded by the lack of horizontal fields of observed RH and sparse radiosounding sites over the Ivory Coast. Nevertheless, radiosounding is one of the most accurate measurement techniques for quantifying RH and therefore we used the available radiosounding stations (Lamto and Abidjan; Maranan and Fink, 2016) and suitable dates to evaluate the vertical RH profiles of COSMO-ART. The intercomparison is presented in Appendix B. Generally, better agreement is achieved at the inland station Lamto (Fig. B1) than at the coastal station Abidjan (Figs. B2 and B3), likely due to the more complex boundary layer structure near the coast. The intercomparison show times with very good agreement, especially during the night on 3 July (Fig. B2g, h) and on 6 July at Lamto (Fig. B1a, b). Interestingly, these times with good agreement simultaneously denote an agreement in the AI-related low-level moisture increase during the night. Significant underestimations frequently occur approximately above 1000 m a.g.l., e.g., on 6 July 23:00 UTC at Abidjan (Fig. B3d). In general, COSMO-ART is able to reasonably reproduce the RH vertical profile over the Ivory Coast. The tendency of the model to underestimate RH (no systematic bias) implies that the model-derived ALWC is a lower limit that can actually be higher in the field. This is a source of uncertainty for the calculation of ALWC and radiative transfer and the question can be raised of how this potential RH underestimation compares with the double counting of aerosol in the aerosol activation. It has to be considered that the increase in water uptake is most sensitive to RH in the narrow range of RH>95 % and less sensitive for RH below 95 %. Therefore, potential deviations should not be overrated. The concept in COSMO-ART of not removing activated aerosol from the aerosol population is done for a reason. Model tests in the past that removed the aerosol after activation led to an efficient and unrealistic cleaning of the atmosphere. But the concept of not removing activated aerosol from the aerosol population does not lead to an overestimation of the ALWC. Instead, it is the consideration of two different aspects: (a) aerosol that takes up water and (b) a cloud droplet or ice crystal that has an aerosol particle inside. The activated aerosol particle is a cloud droplet (or ice crystal) and the radiative interaction is only related to its quality of being a cloud droplet (the negligibly small aerosol particle and its ALWC are not considered when we talk about the interaction between cloud droplet and radiation). On the other hand, we have aerosol in the aerosol population that can take up water when it is hygroscopic. In this case, there is an interaction between the aerosol particle (combination of aerosol and ALWC) and the radiation. Therefore, we expect that we do not per se overestimate the ALWC with our model concept. But of course, we see uncertainties in the corresponding radiative transfer calculations. With our existing model system and the model realizations we have conducted for this study it is not possible to quantify these uncertainties or to set them in relation to the uncertainty that comes from deviations in RH.
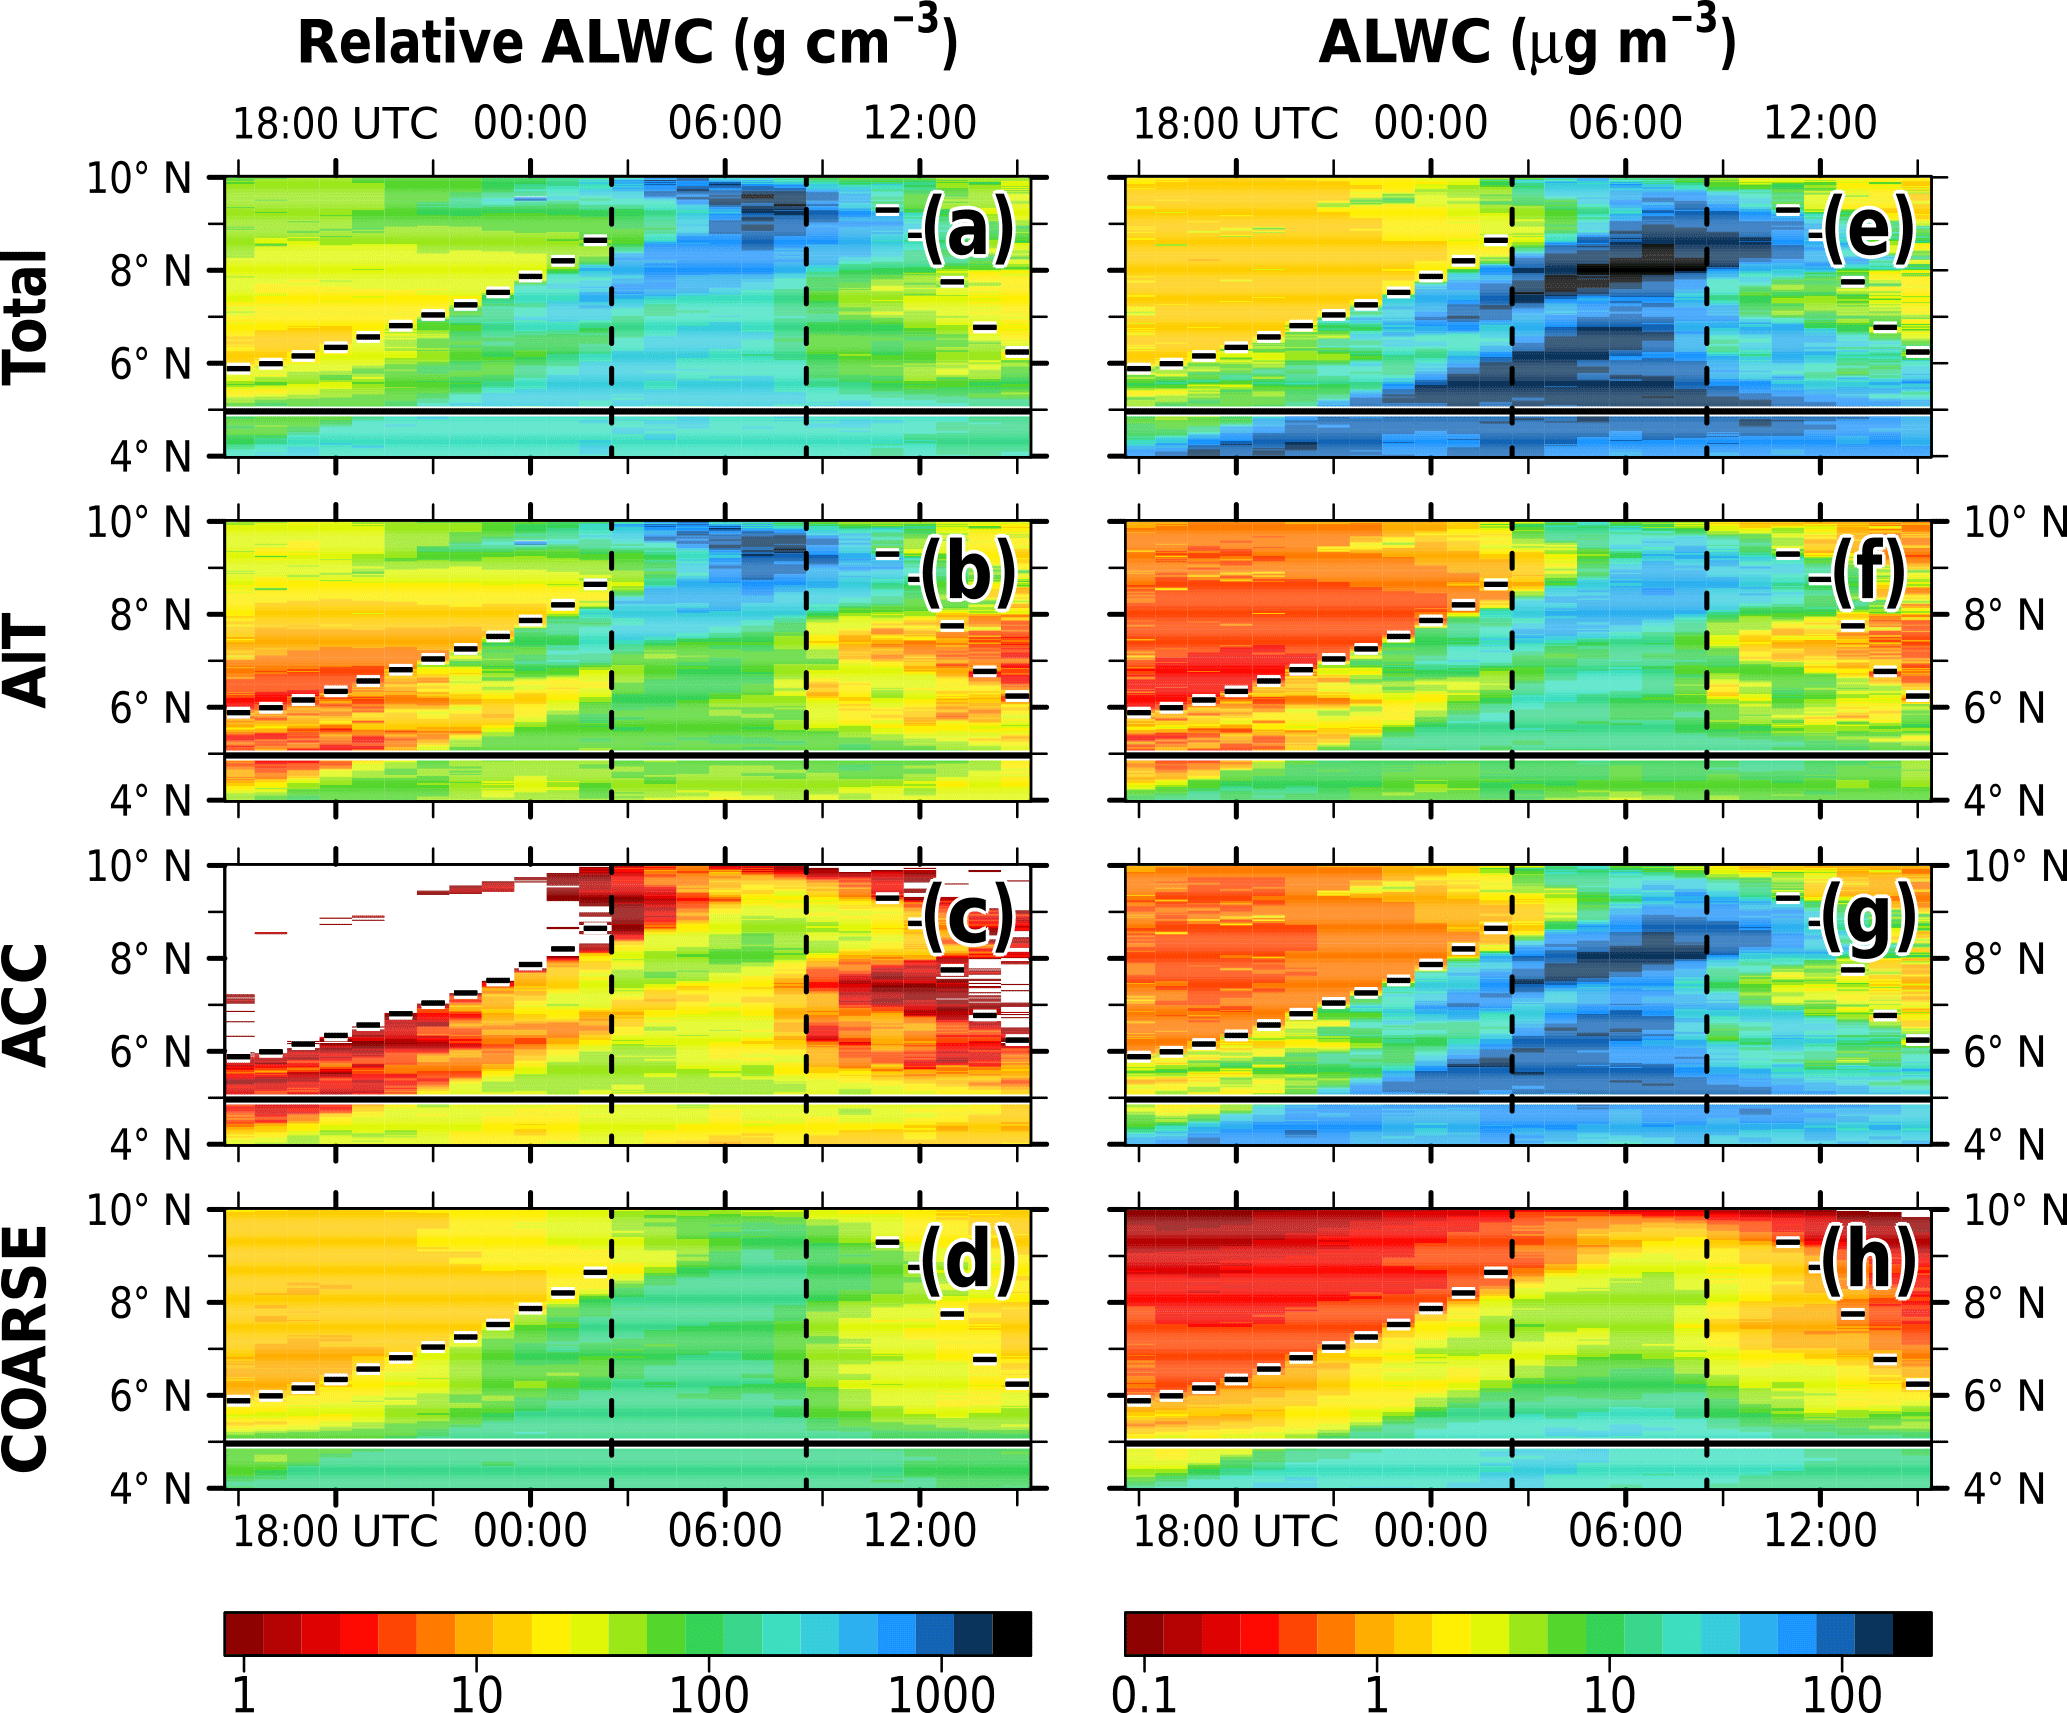
Figure 4Same as Fig. 3 but for (left) relative ALWC (g ALWC cm−3 dry aerosol) with respect to (a) total relative ALWC, (b) relative ALWCAIT, (c) relative ALWCACC and (d) relative ALWCCOARSE; (right) absolute ALWC (µg ALWC m−3 air) with respect to (e) total ALWC, (f) ALWCAIT, (g) ALWCACC and (h) ALWCCOARSE.
Figure 2 presents a first insight into the diurnal cycle of RH (Fig. 2a) and ALWC (Fig. 2b) via spatial mean vertical profiles in the monsoon layer over the Ivory Coast. Generally moist conditions (RH>70 %) can be observed over the area of interest (Fig. 2a). From 15:00 UTC to about 00:00 UTC the maximum RH is located at or above 1000 m a.g.l. For the layer below 750 m a.g.l. a significant increase in RH is visible from 15:00 UTC (below 75 %) to 09:00 UTC on the next day (above 95 %). In the following, it will be shown that this is related to the onshore advection of air with higher RH (colder air) within the AI. The highest RHs of the order of 95 % are reached between 03:00 UTC and 12:00 UTC in the lowest 1500 m a.g.l. This is reflected in the vertical profile of ALWC, showing highest values consistent with RH (Fig. 2b), with remarkable diurnal variations encompassing 2 orders of magnitude. Therefore, it can be deduced that ALWC is most sensitive to the morning hours (sunrise in Abidjan is around 06:00 UTC). Based on Fig. 2 we focus on the lowest 1500 m a.g.l. in the following, capturing the monsoon layer. The DACCIWA measurement campaign reveals that the monsoon layer over SWA shows typical heights of about 1900 m a.g.l. (Kalthoff et al., 2018).
As explained in Sect. 2, the ALWC calculation for secondary inorganic particles in COSMO-ART is treated using ISORROPIA II. Bian et al. (2014) showed that robust results for the ALWC can be expected from ISORROPIA II for RH>60 %. As presented in Fig. 2, the average conditions over the Ivory Coast reveal RH above 70 %. Therefore, principally we also can expect robust results for SWA. Figure 3 shows a Hovmöller diagram for the median RH (Fig. 3a) and total ALWC (Fig. 3b) in the lowest 1500 m a.g.l. as zonal means over the Ivory Coast (7.5–3∘ W, 4–10∘ N) between 2 July 15:00 UTC and 3 July 15:00 UTC. The black bars denote the location of the 302 K isentrope at 250 m a.g.l. that is used for frontal detection between 15:00 UTC and 22:00 UTC (Deetz, 2018).

Figure 5Same as Fig. 3 but for the GF (dp,wet ) with respect to (a) mean GF, (b) GFAIT, (c) GFACC and (d) GFCOARSE.
In the first half of the presented time period a clear separation between the prefrontal inland area (north of the black bars in Fig. 3a) with relatively low RH and the postfrontal area (south of the black bars in Fig. 3a) with relatively high RH can be observed. The inland propagation of the front after 2 July 15:00 UTC is related to the advection of cooler postfrontal air. In the following, this time period is denoted as Phase 1 (AI progression phase, 15:00–02:00 UTC). After the front has passed the area, the conditions are overall moist, revealing RH generally above 90 % (Phase 2, moist morning phase, 03:00–08:00 UTC). After sunrise (06:00 UTC) the RH decreases again due to temperature increase and lifting of the stratus layer. Until 15:00 UTC the AI front reestablishes. This time period is denoted as Phase 3 (daytime drying phase, 09:00–15:00 UTC). The comparison of Fig. 3a and b underlines the fact that RH governs the spatiotemporal pattern of ALWC. The highest ALWC values are reached in Phase 2, especially in the hilly terrain north of 7.5∘ N (Fig. 3b). The AI front denotes a clear border of a non-negligible ALWC regime postfrontally and negligible ALWC prefrontally. The study of Bian et al. (2014) found average ALWC values of about 170 g m−3 for the North China Plain, which is of the same order of magnitude as presented in Fig. 3b.
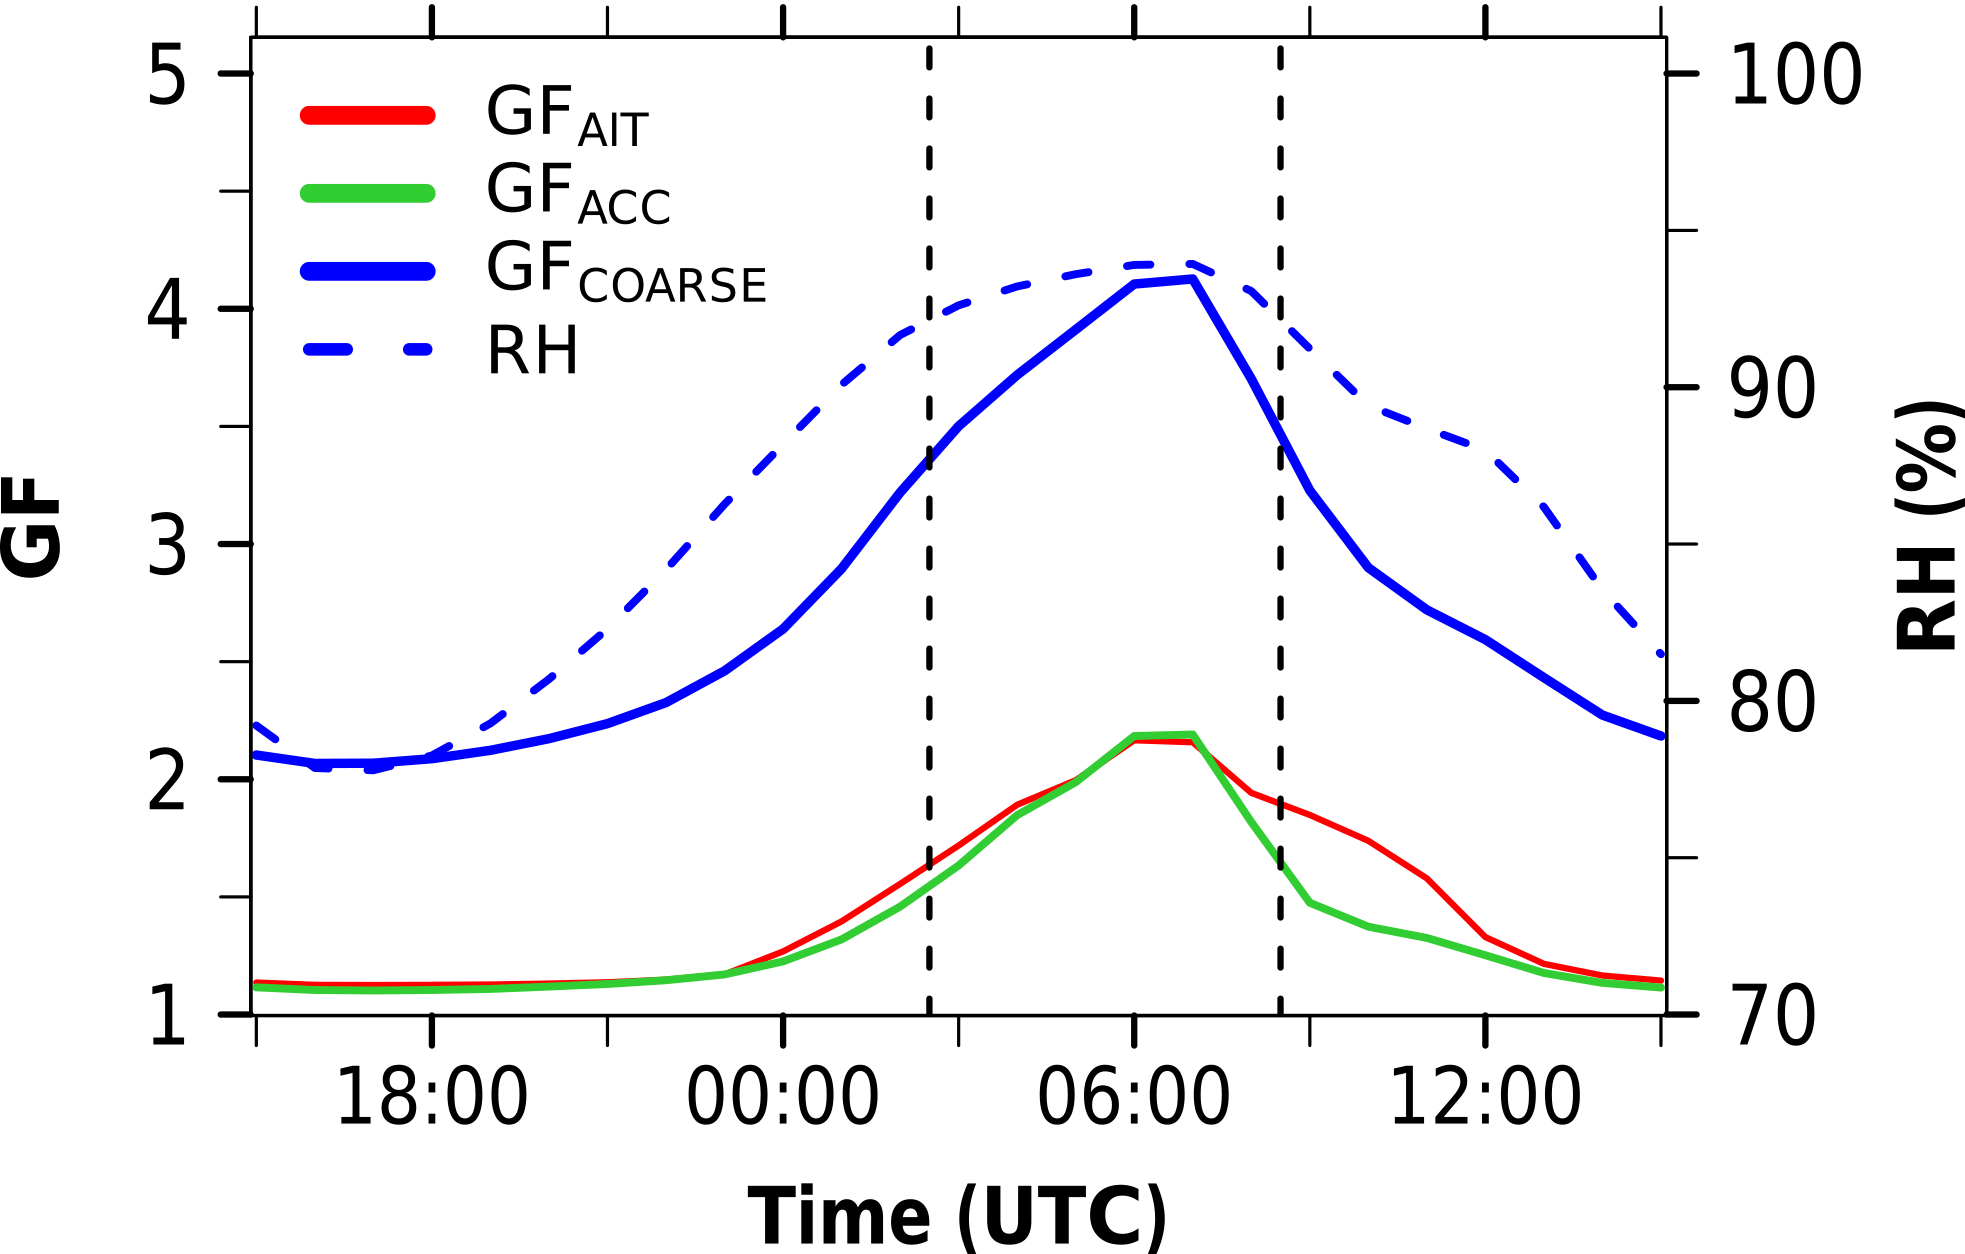
Figure 6Diurnal cycle of the median GF (%) of GFAIT (red), GFACC (green), GFCOARSE (blue) and RH (%) (blue dashed) in the lowest 1500 m a.g.l. over the Ivory Coast (7.5–3∘ W, 4–10∘ N) from 2 July 15:00 UTC to 3 July 15:00 UTC. The vertical dashed lines denote the three phases introduced in Fig. 3.
In Phase 1 a cloud band develops behind the front that intensifies north of 7.5∘ N due to orographic lifting as visible in the high RH in the Hovmöller diagram after 00:00 UTC. After 21:00 UTC, further clouds originating from the Gulf of Guinea propagate inland. This is reflected in the high RH after 21:00 UTC south of approximately 6.5∘ N. Figure 3 reveals the strong impact of atmospheric dynamics, in particular AI, on the spatiotemporal evolution of RH. This is most pronounced in Phase 1. Without AI and the land–sea contrast, a zonally more homogeneous pattern would be expected for the diurnal cycle. In fact, this can only be observed in Phase 2. In this time period the zonal differences that developed during daytime have been removed by the progressing AI. However, the nighttime radiative cooling also contributes to the increase in RH in addition to the cold air advection. When considering 6–7 July 2016 (see Fig. 3c, d), Phase 2 appears to be moister and the area south of the coast is drier, but nevertheless the general evolution of RH and the three phases agree with the findings obtained for 2–3 July 2016, including the double-peak structure in Phase 2 with one peak near the coast and one peak in the hilly terrain to the north. The subsequent sections assess whether distinct differences in the ALWC and its impact on radiation can be identified between the proposed phases.
3.3 Impact of aerosol modes
Figure C1 in Appendix C shows spatiotemporal mean vertical profiles of aerosol mass concentrations over the Ivory Coast. The highest contributions of about three-quarters come from organic aerosol as the sum of primary organics (POA) and secondary organics (SOA). The spatiotemporal mean reveals aerosol profiles that are rather constant with height in the lowest 2000 m a.g.l.; only for organic aerosol is an increase with height visible. The DACCIWA aircraft observations also reveal a general dominance of organic aerosol (e.g., Haslett et al., 2018). Biomass burning is an important source of organic aerosol and is likely responsible for the dominance of organic aerosol over the Ivory Coast. Based on the experience we obtained with COSMO-ART during our 2 months of forecasting the atmospheric composition (June–July 2016, 28 km grid mesh size), we observed that the biomass burning plumes over the Gulf of Guinea (coming from Central Africa) frequently swash into the DACCIWA domain. For 6–7 July 2016 the organic aerosol is also dominant (not shown).
Figure 4 shows the relative ALWC (Fig. 4a–d) and absolute ALWC (Fig. 4e–h) for the different aerosol modes. The relative ALWC is related to the water mass absorbed by 1 cm−3 of dry aerosol and the absolute ALWC to the water mass in an air volume of 1 m−3. As described above, the ALWC dominates in the postfrontal area, especially in Phase 2 (Fig. 4e). This pattern is also visible for the relative ALWC (Fig. 4a). The main contribution comes from ACC (Fig. 4g). With respect to the relative ALWC, COARSE shows the highest water uptake per unit volume (Fig. 4d) south of approximately 8∘ N. The peak in the relative ALWC of AIT in Phase 2 (Fig. 4b) might be related to high aerosol concentrations coming from the east. When focusing on the relative ALWC, AIT particles show a higher water uptake per unit volume than ACC particles (compare Fig. 4b and c). Nevertheless, due to their small size, ACC particles contribute the largest absolute ALWC (compare Fig. 4f and g). In fact, ACC is dominant in the ALWC contribution because a sufficient number is available and the particles are not too small. In contrast, AIT particles are lacking in size and COARSE particles are lacking in number. Accumulation-mode particles over the Gulf of Guinea emerging to a large extent from the long-range transport of biomass burning aerosols from Central Africa (e.g., Mari et al., 2008) but there are also contributions from shipping emissions. Therefore, it is expected that these particles are comparably old and therefore highly hygroscopic. Over land, emissions from cities contribute to the total aerosol amount. The spatial mean diurnal cycle of the particle number concentration reveals a decrease from about 5500 on 2 July 15:00 UTC to 4000 on 3 July 07:00 UTC with the inland advection of postfrontal air coming from the Gulf of Guinea. After sunrise the particle number concentration increases again with the evolution of the convective PBL (not shown).
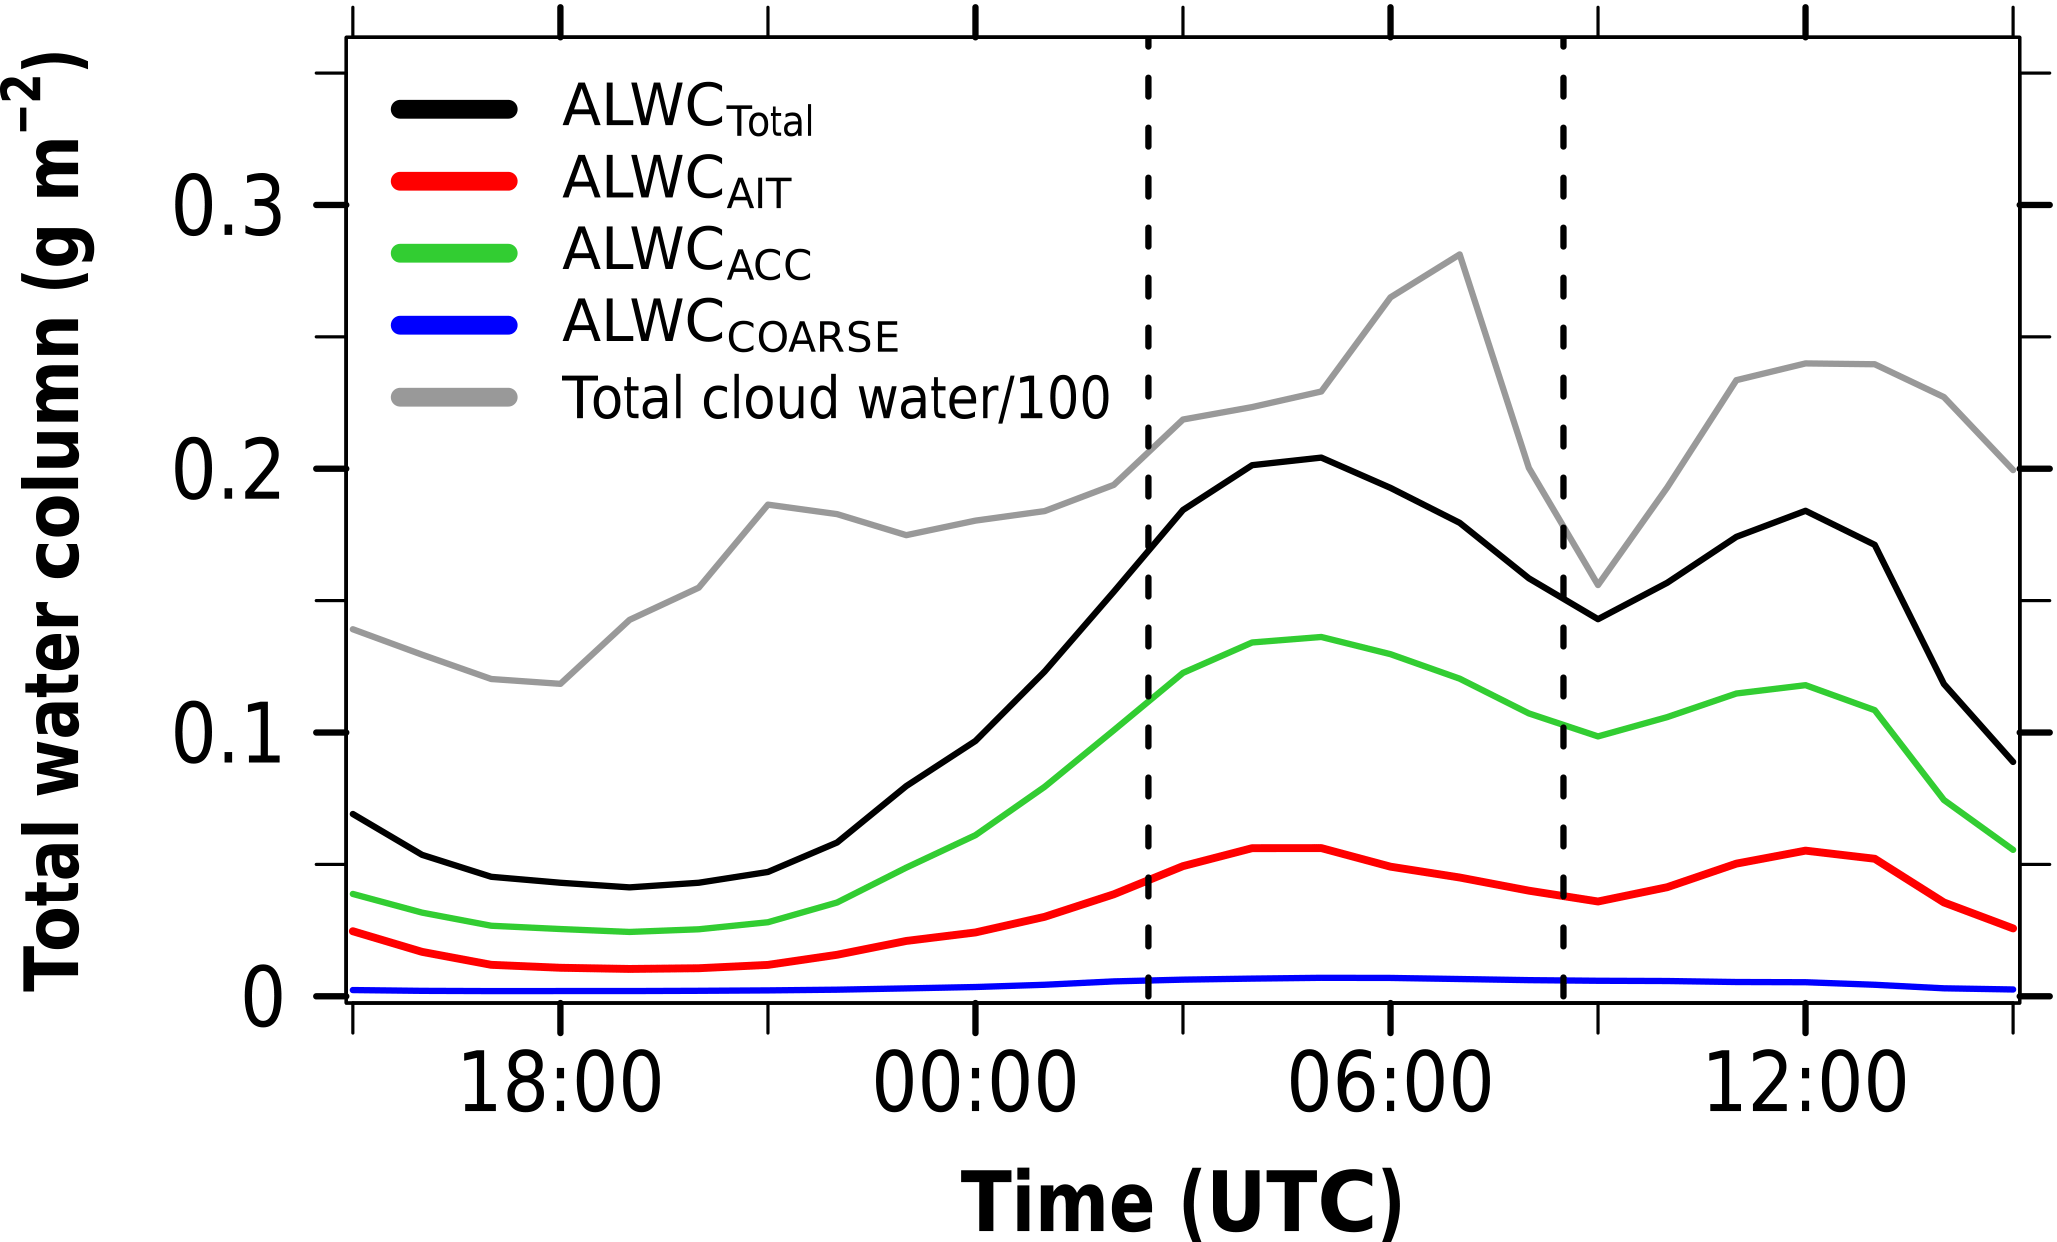
Figure 7Diurnal cycle of the total cloud water column (g m−2) as a median over the Ivory Coast (7.5–3∘ W, 4–10∘ N) from 2 July 15:00 UTC to 3 July 15:00 UTC with respect to ALWCTotal (black), ALWCAIT (red), ALWCACC (green) and ALWCCOARSE (blue) as well as the median total cloud water (gray, divided by 100). Values below 10−3 g m−2 are not considered. The vertical dashed lines denote the three phases introduced in Fig. 3.
Figure 5 shows the mean GF (Fig. 5a) and the GF of the single aerosol modes (Fig. 5b–d). On average, GF of about 3–3.5 can be found in the high ALWC areas of Phase 2 (Fig. 5a). The GFs for AIT and ACC (Fig. 5a, b) are similar at around 2.5, which is of the same order of magnitude as the findings of Chen et al. (2012), indicating GF of 1–3.25 for the North China Plain. As expected, the highest aerosol growth due to ALWC is observed for COARSE with values up to 4.5 (Fig. 5d).
Sea salt particles are initially large and also highly hygroscopic, but the number density is low (not shown). The spatial median of the GF is shown in Fig. 6, revealing that AIT and ACC particles can be assumed comparably dry during Phase 1. During Phase 2 a doubling of the size can be observed. The comparably dry COARSE particles, already twice as big in Phase 1, double their diameter again within Phase 2. The absolute values of aerosol number density as well as aerosol dry and wet diameters on 3 July 06:00 UTC (denoting the maximum GF in Fig. 6) are presented in Fig. D1 of Appendix D, indicating a substantial aerosol increase with water uptake. However, except for the largest sea salt mode (COARSE3 in Fig. D1), which is related to very low median number concentrations below 1.3 m−3, all aerosol particles are below the typical size of a cloud droplet, which is of the order of 10 µm.
As expected, the highest GF can be found around sunrise related to the lowest temperatures and highest RH. When focusing on ACC and COARSE particles, the slope before 06:00 UTC is flatter than after 06:00 UTC, indicating that the GF enhancement from AI-induced RH increase is slower than the heating-induced RH decrease after sunrise. This is likely due to the combination of near-surface heating and lifting of the moist layer to greater heights. The aerosol growth, quantified in Figs. 5 and 6, suggests substantial effects on radiative transfer. This will be assessed in Sect. 4.
3.4 Impact of clouds
A further aspect that might affect the ALWC are clouds, as a special case of the RH dependency described in Sect. , with a focus on regimes that are saturated or virtually saturated with water vapor. It is an open question how much the ALWC in cloudy areas contributes to the total ALWC. In this section the total vertical column is considered. Figure 7 shows the total water column (full integration of model layer, 30 km). The respective value of the clouds is added to allow for a comparison. As identified in Fig. 3b, the largest ALWC values are reached in Phase 2. However, Phase 3 also shows remarkable contributions that are not visible when focusing on the layer below 1500 m a.g.l.
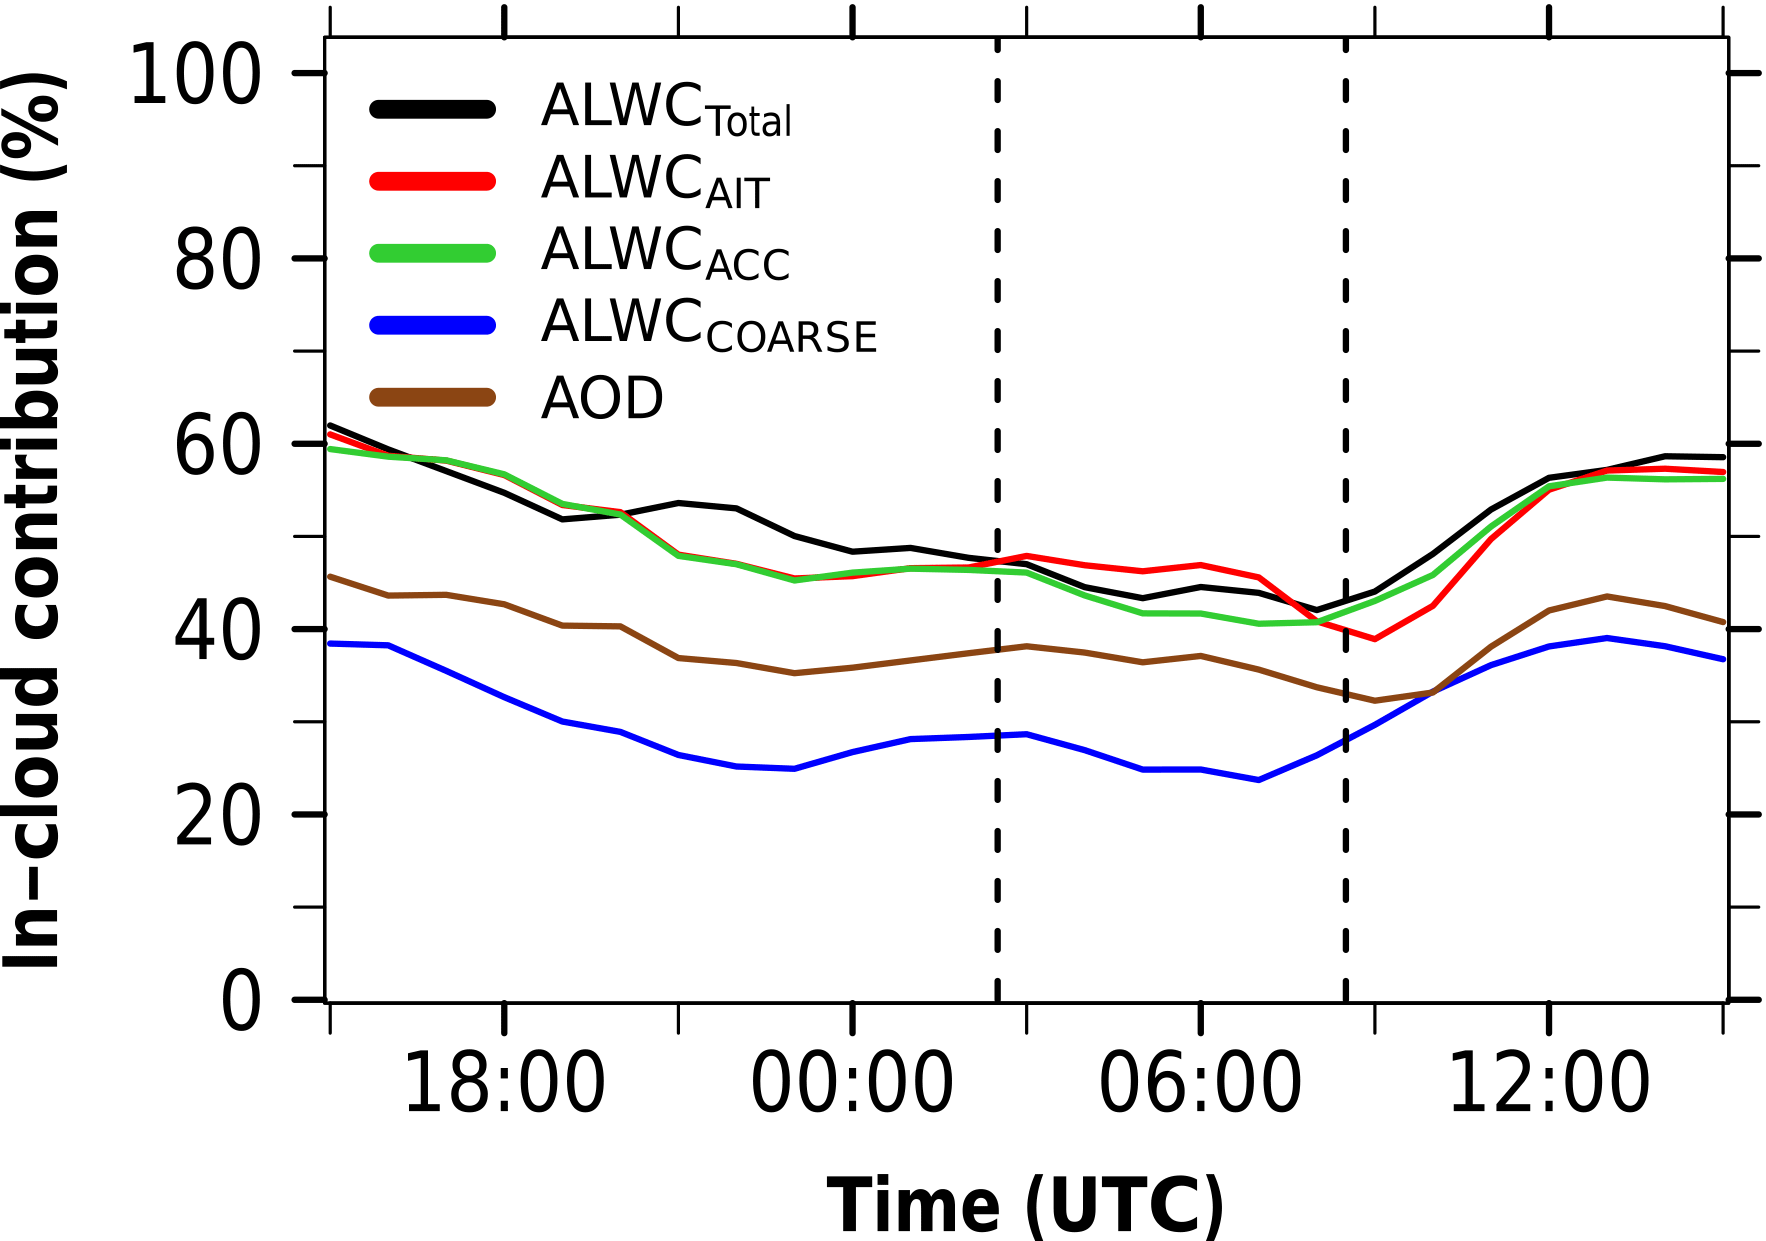
Figure 8Diurnal cycle of the median contribution from in-cloud areas (%) with respect to ALWCTotal (black), ALWCAIT (red), ALWCACC (green), ALWCCOARSE (blue) and the contribution of in-cloud AOD to the total AOD (brown) in the total vertical column over the Ivory Coast (7.5–3∘ W, 4–10∘ N) from 2 July 15:00 UTC to 3 July 15:00 UTC. The vertical dashed lines denote the three phases introduced in Fig. 3.
The median cloud water is about 2–3 orders of magnitude larger (gray curve in Fig. 7), but due to the large standard deviation, ALWC and cloud water can differ by 4 orders of magnitude (10th percentile). ALWC and cloud water correlate in the diurnal evolution (Fig. 7) with one peak in Phase 2 (NLLS) and one peak in Phase 3 (convective clouds). Interestingly, the cloud water and also the ALWC show a local minimum in the transition between Phase 2 and Phase 3 during the SCT.
Figure 8 quantifies the contribution of ALWC that comes from cloudy grid volumes. The in-cloud contribution from ALWCTotal is between 40 % and 60 %, clearly dominated by ALWCAIT and ALWCACC. The in-cloud contribution of ALWCCOARSE is smaller with a constant diurnal offset of about 20 % compared to the other aerosol modes.
Although the strong contribution of in-cloud areas to the ALWC is not surprising, since here the highest RH can be expected, it is nevertheless remarkable. Between 3 % and 9 % of the model grid boxes in the lowest 10 km are related to clouds during the day and this small fraction captures more than half of the total ALWC. To highlight the importance of this finding, the contribution of in-cloud AOD to the total AOD is added in Fig. 8, which shows the same diurnal evolution as the ALWC. Approximately 40 % of the total AOD is related to cloud areas.
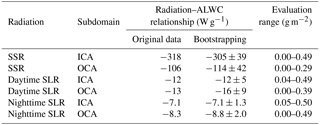
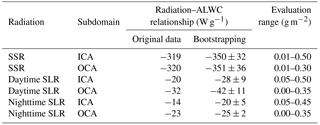
Table 2Radiation–ALWC relationship (W g−1) based on linear fits as presented in Fig. 14a–f, including the time period 2 July 15:00 UTC to 3 July 15:00 UTC. The subdomain denotes whether the captured area is simultaneously cloudy (ICA) or cloud free (OCA) in both realizations. Original data denote the slopes derived from Fig. 14a–f, whereas bootstrapping refers to the median slopes of the 10 000 resamples. The confidence intervals are derived by using the Gaussian approximation and α=0.05, and the evaluation range provides the ALWC interval, which is used for the linear fitting.
4.1 Definition of subdomains
After assessing the quantities affecting the ALWC (Sect. 3), this section focuses on the impact the ALWC has on radiative transfer when comparing No-ALWC with the reference. No-ALWC denotes a sensitivity study neglecting the ALWC in the radiative transfer calculations. To evaluate the differences in net downward shortwave radiation at the surface (SSR) and net downward longwave radiation at the surface (SLR) between the two realizations, it is necessary to consider side effects that have the potential to affect the differences apart from the consideration of the ALWC, in particular spatiotemporal differences in cloud pattern (displacement of clouds). Therefore, in the following two domain subsets are considered: (1) areas that are simultaneously cloudy in both realizations (in-cloud area, ICA) and (2) areas that are simultaneously cloud free in both realizations (off-cloud area, OCA). Areas that differ in the cloud status are omitted. Even if a grid box is related to clouds in both realizations, cloud properties may differ. Statistics of the difference in cloud properties are summarized in Table E1 of Appendix E including the full time period 2 July 15:00 UTC to 3 July 15:00 UTC. Table E1 includes the total cloud water, cloud droplet number concentration (CDNC) and effective radius. The spatiotemporal median over the Ivory Coast reveals negligible differences in cloud properties. However, for spatial analyses substantial differences can occur due to a displacement of clouds and different properties. Therefore, it is not possible to fully disentangle the radiative effects of ALWC from the cloud displacement in ICA. This is especially problematic since ICA is related to the highest ALWC amounts as shown in Sect. 3.4. In the following, we sharpen the condition for ICA by considering only the areas in which the total cloud water differences between the two realizations are below 0.1 g m−2 (approximately 1 % of the reference median). Consider that the sharpened condition substantially decreases the selected area (on average only 7.6 % of the cloudy area can be considered) and therefore makes the results less representative for the cloudy area. OCA is expected to provide more robust results since the properties of clouds are not relevant in this area. For the reference on 3 July 06:00 UTC, Fig. D2 shows the wet diameter separated into ICA and OCA for the lowest 1500 m a.g.l. over the Ivory Coast, highlighting the fact that submicron particles (Fig. D2a) need an RH near 100 % to significantly grow, whereas sea salt (Fig. D2b) already shows a growth due to ALWC at lower RH values. The median temperature for ICA (OCA) is 20.9 ∘C (21.7 ∘C) and the median RH for ICA (OCA) is 99.9 % (93.2 %).
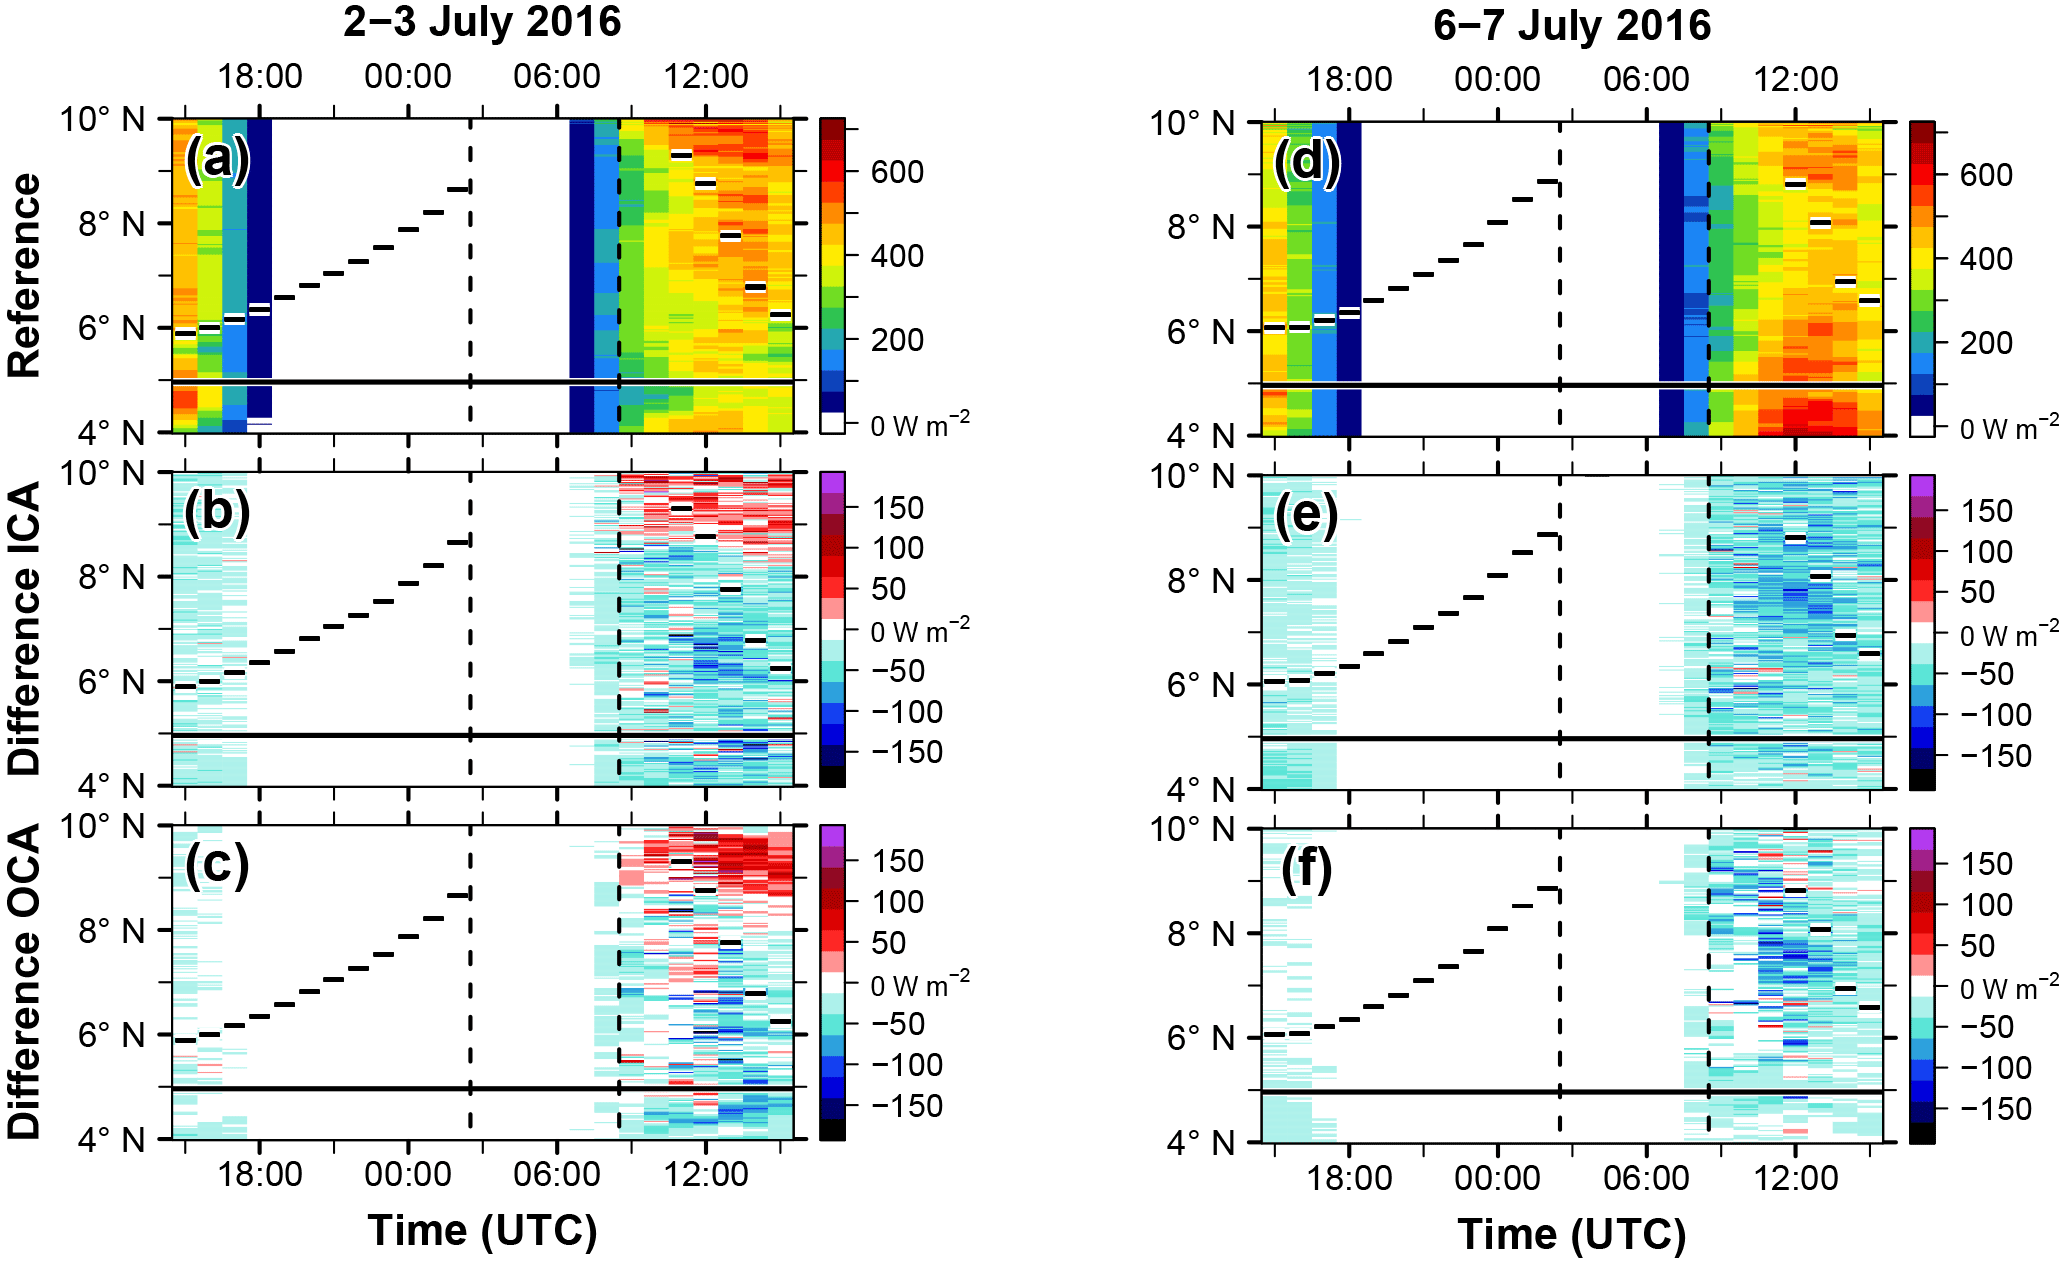
Figure 9Hovmöller diagram of SSR and SSR difference (W m−2) for (a, d) the reference, (b, e) reference minus No-ALWC for ICA and (c, f) reference minus No-ALWC for OCA as a zonal mean over the Ivory Coast (7.5–3∘ W, 4–10∘ N) (left) between 2 July 15:00 UTC and 3 July 15:00 UTC and (right) between 6 July 15:00 UTC and 7 July 15:00 UTC. The horizontal bars denote the zonal mean location of the 302 K isentrope at 250 m a.g.l. of the reference, the horizontal solid line the zonal mean coastline and the vertical dashed lines the three phases introduced in Fig. 3.
4.2 Spatiotemporal differences in near-surface atmospheric properties
Figure 9 shows SSR in terms of the reference absolute values (Fig. 9a) and the difference between the reference and No-ALWC (Fig. 9b) as a Hovmöller diagram. The following values in brackets indicate the median and the 99th∕1st percentile of the differences considering the area south of 8∘ N. Since Phases 1 and 2 are related to the evening and night, the ALWC-SSR impact is restricted to Phase 3 and the early hours of Phase 1. When focusing on the area south of 8∘ N generally a decrease in SSR can be observed when considering ALWC in the radiation for ICA (−28 W m−2, −111 W m−2; Fig. 9b) and OCA (−15 W m−2, −107 W m−2; Fig. 9c). The question may arise of why the reduction of SSR for ICA with its higher RH is not substantially larger than for OCA. As expected, the SSR decreases when we consider ALWC in the radiative transfer and the reduction is higher in clouds because the RH there is higher; therefore, the ALWC increases compared to areas outside of clouds. For ICA the reduction is twice as high as for OCA. It has to be considered that radiative transfer is a two-stream model (downward and upward). The intensity of an incoming beam that passes a certain column is reduced in the case of ICA by the ALWC in clouds but also by the ALWC below and above the clouds. In the case of OCA the light intensity is reduced only by ALWC outside of clouds in the total column. The following has to be considered.
- (I)
Even in OCA the RH can reach very high values near 100 %.
- (II)
In ICA the clouds will mostly span only a very small fraction of the total vertical column.
- (III)
Most of the path in OCA and ICA will be cloud free.
The aspects (I–III) lead to the conclusion that the ALWC surplus from cloudy regions can be high, but nevertheless the difference in SSR between ICA and OCA will not be extraordinary high.
The positive values north of 8∘ N in Phase 3 are related to a change in cloud cover (more clouds in the reference), which is not a general feature. On 6–7 July the entire domain is related to a reduction in SSR (Fig. 9e, f).
In Figure 10 the SLR is shown with respect to the reference absolute value (Fig. 10a) and the difference between the reference and No-ALWC (Fig. 10b). For SLR the differences are less coherent than for SSR and the values are much smaller. Areas with positive and negative differences occur. For the postfrontal area, especially in the late Phase 1 and in Phase 2, negative values prevail, which indicates more outgoing longwave radiation in No-ALWC. Without the ALWC, less SLR can be absorbed and reemitted in the atmosphere. During Phase 3 SLR is reduced due to the reduced shortwave input (compare Fig. 9b, c). The SLR differences are small in ICA (−0.6 W m−2, −10 W m−2; Fig. 10b) and OCA (−0.5 W m−2, −13 W m−2; Fig. 10c) in agreement with the findings on 6–7 July (Fig. 10e, f). Especially the nighttime SLR differences appear insignificant. Only during daytime, with changes in SSR, does the SLR show relevant differences when considering the ALWC.
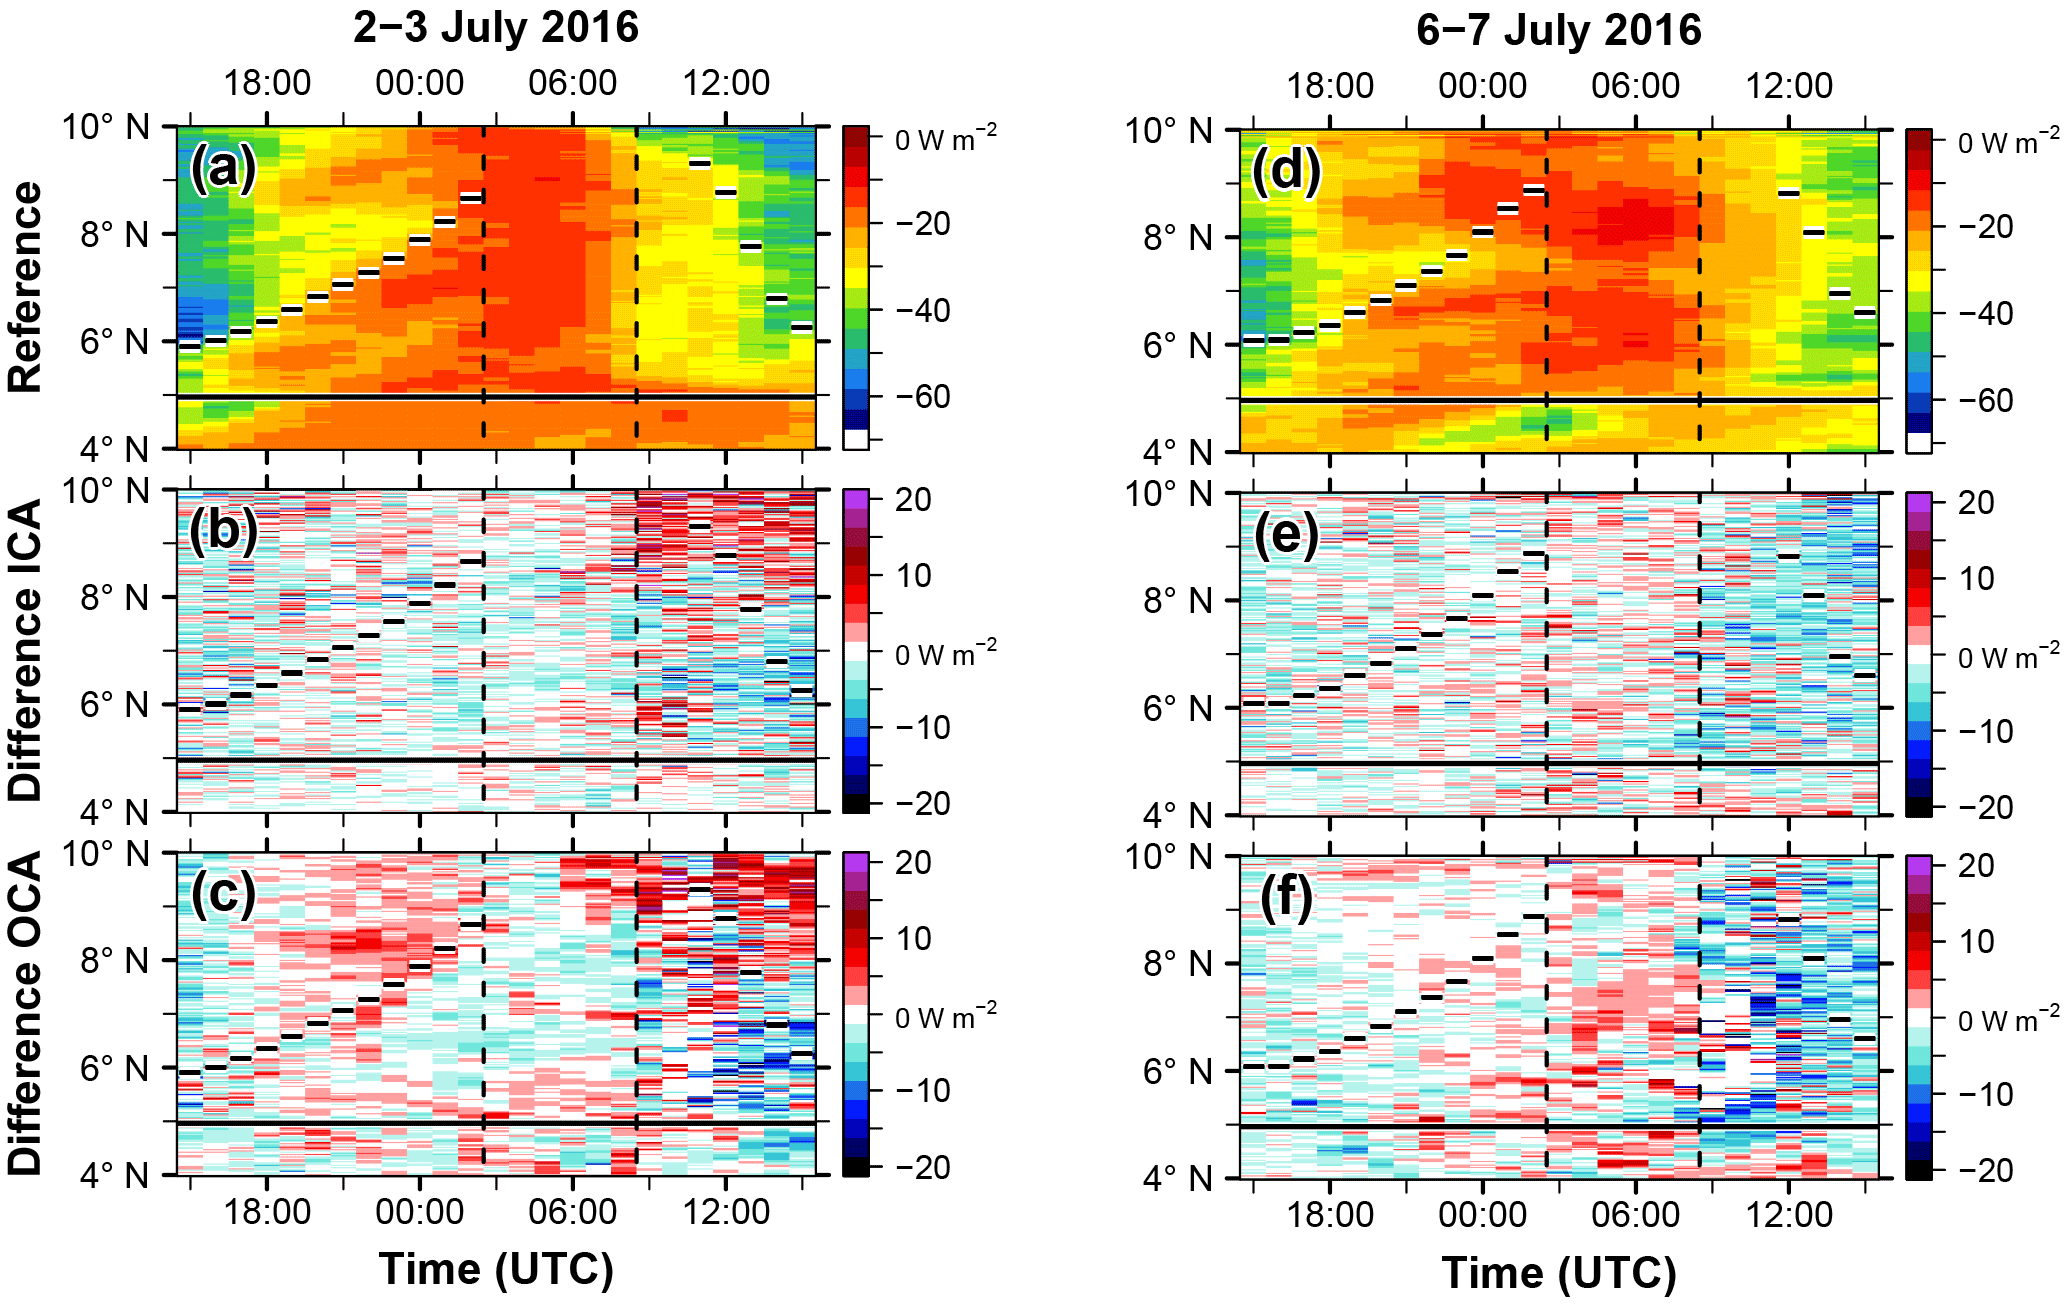
Figure 10Same as Fig. 9 but for SLR and SLR difference (W m−2): (a, c) reference, (b, d) reference minus No-ALWC for ICA and (c, f) reference minus No-ALWC for OCA. Positive (negative) values in (b), (c), (e) and (f) denote more outgoing longwave radiation in the reference (No-ALWC).
The radiative impact on 2 m temperature is presented in Fig. 11a. When focusing on the absolute values (Fig. 11), a diurnal cycle of about 8 K can be observed inland. Due to the fixed sea surface temperature (SST) in COSMO-ART, the air temperature over the Gulf of Guinea is virtually constant. The fixed SST is coming from the driving model ICON. For ICON, the SST fields are derived daily at 00:00 UTC based on observations. A detailed description of the SST handling in COSMO can be found in Schraff and Hess (2012). The definition of the three phases (Fig. 3) agrees well with the diurnal cycle of the temperature. In Phase 2 the lowest temperatures over the entire Ivory Coast can be observed. Generally, the daytime heating inland (prefrontal in Phases 1 and 3) is stronger in No-ALWC than in the reference due to additional SSR input (Fig. 9b, c).
As expected from the small nighttime difference in SLR, no relevant temperature differences occur during the night (Fig. 11b, c). The postfrontal area (Phase 1 and 2), which is related to air masses from the ocean with fixed SST, eliminates the differences developing during the day.
The temperature differences during Phases 1 and 3 are negative for ICA (−0.04 K, −1.2 K; Fig. 11b) and OCA (−0.04 K, −1.3 K; Fig. 11c). The differences in SSR, SLR and 2 m temperature on 6–7 July, which are given in Figs. 9d–f, 10d–f and 11d–f, are of the same order of magnitude as on 2–3 July. The comparison between the results for ICA and OCA also reveals no significant differences.
4.3 ALWC impact on aerosol optical depth (AOD)
The observed changes in radiative transfer due to ALWC are caused by the ALWC impact on the AOD. Figure 12a presents the empirical cumulative distribution function (ECDF) for the modeled AOD using the entire 25 h time period separated into ICA (blue) and OCA (red) AOD. With this the authors want to highlight the fact that the focus is on aerosols and AOD and not on the effects of the cloud optical thickness. When neglecting ALWC in the radiation, the AOD distribution is virtually equal for ICA and OCA (dashed lines in Fig. 12a) with median values around 0.2 (circles). In contrast, the AOD distribution significantly differs when considering ALWC (solid lines in Fig. 12a) with median values of 0.7 (ICA, blue dot) and 0.3 (OCA, red dot). We conclude that ALWC generally increases the AOD and also causes AOD sensitivities with respect to RH (ICA and OCA). Despite the substantial differences in AOD between the two realizations with respect to ICA, the differences in SSR, SLR and 2 m temperature are not significantly higher than for OCA in the zonal mean as shown above. Most likely, clouds dominate the radiative transfer in ICA and therefore the AOD has less impact in these areas.
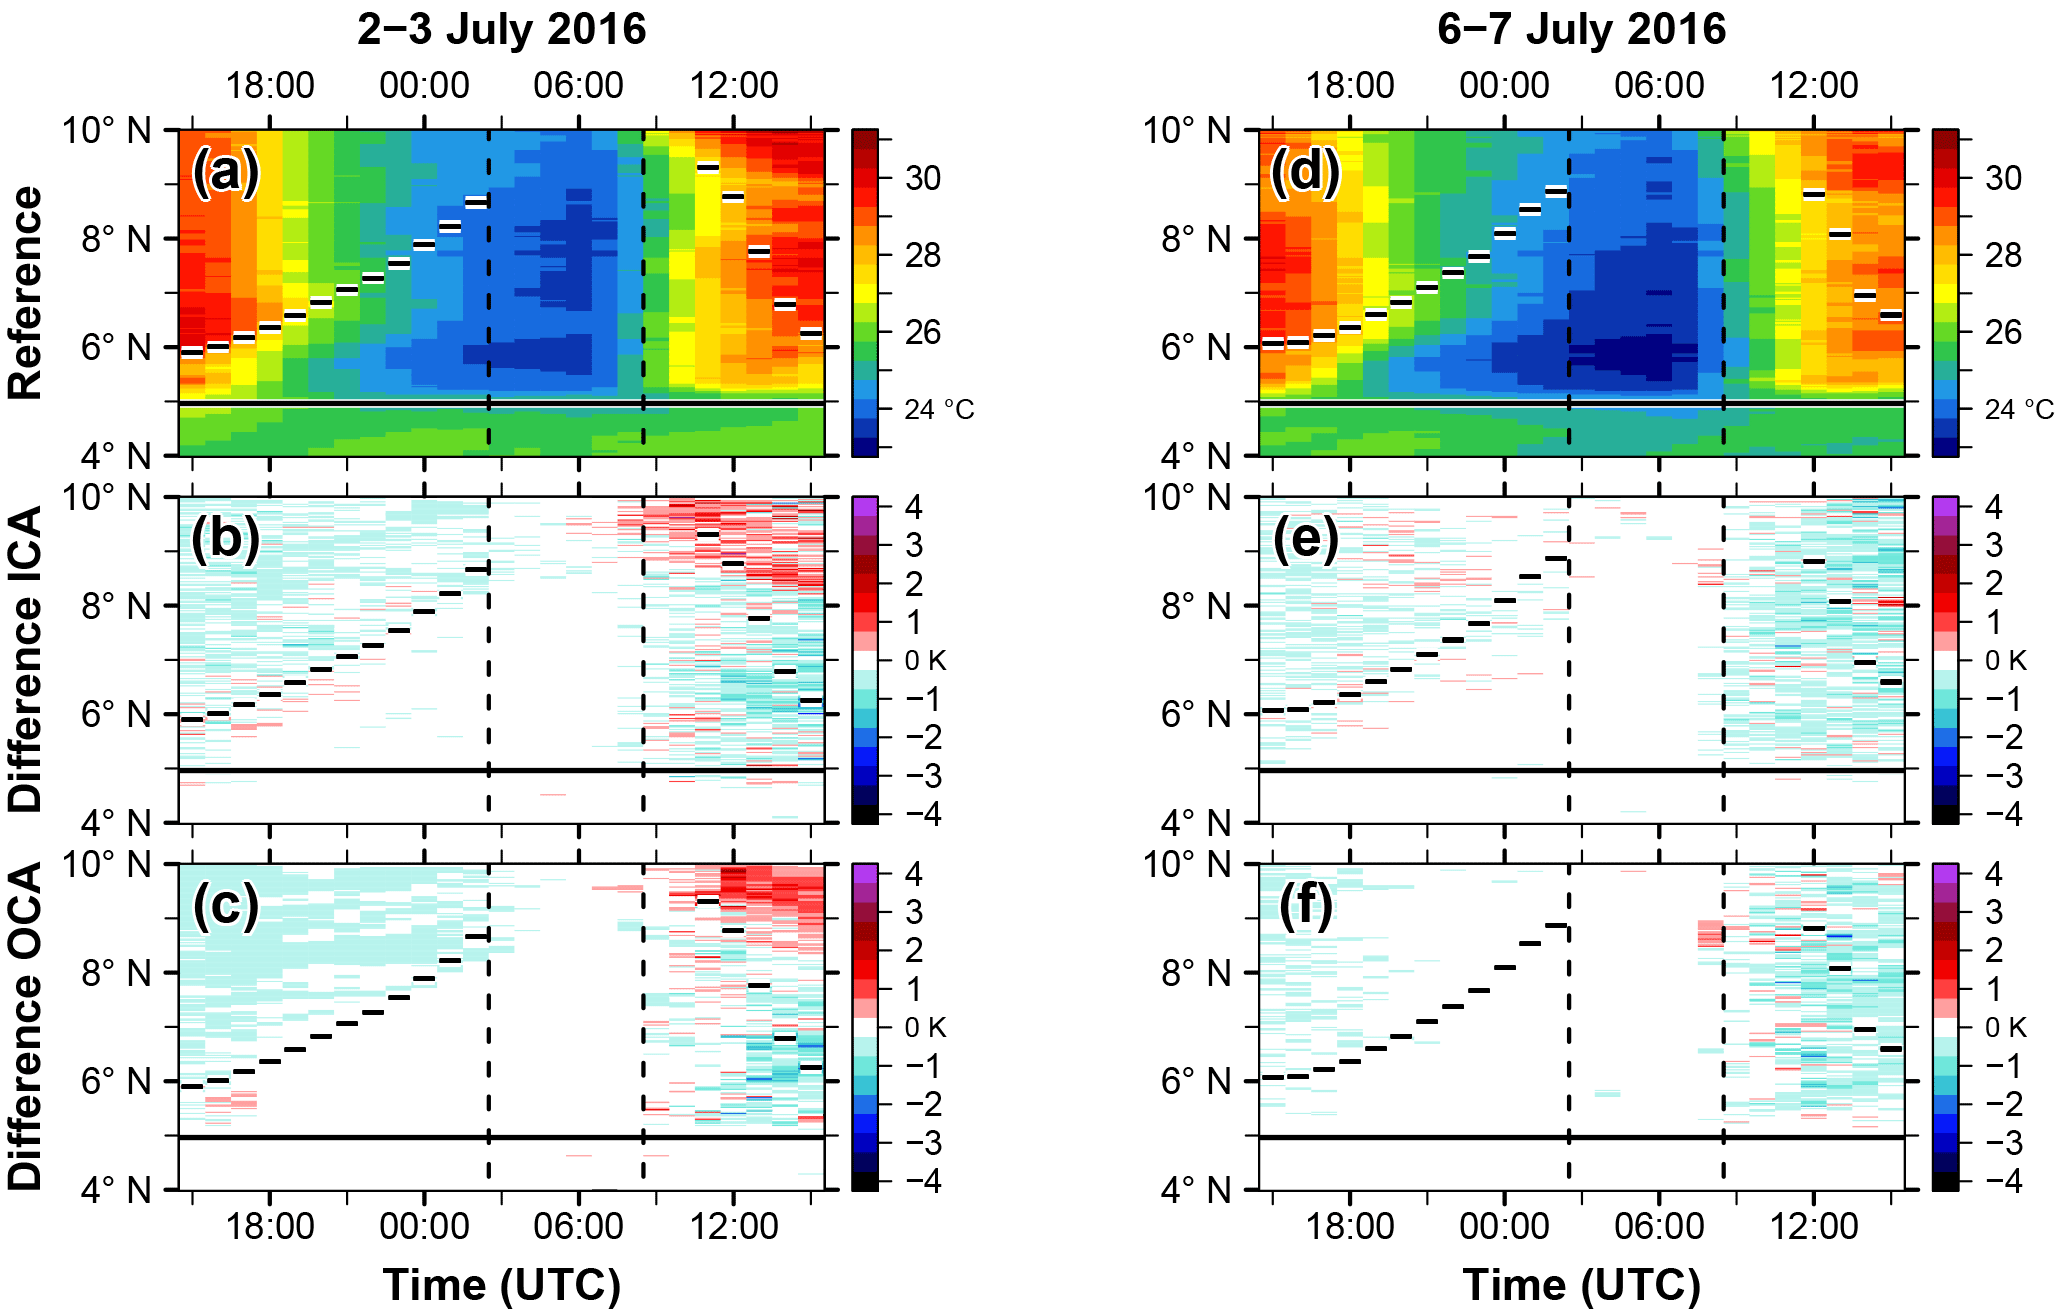
Figure 11Same as Fig. 9 but for 2 m temperature (∘C) and 2 m temperature difference (K): (a, c) reference, (b, d) reference minus No-ALWC for ICA and (c, f) reference minus No-ALWC for OCA.
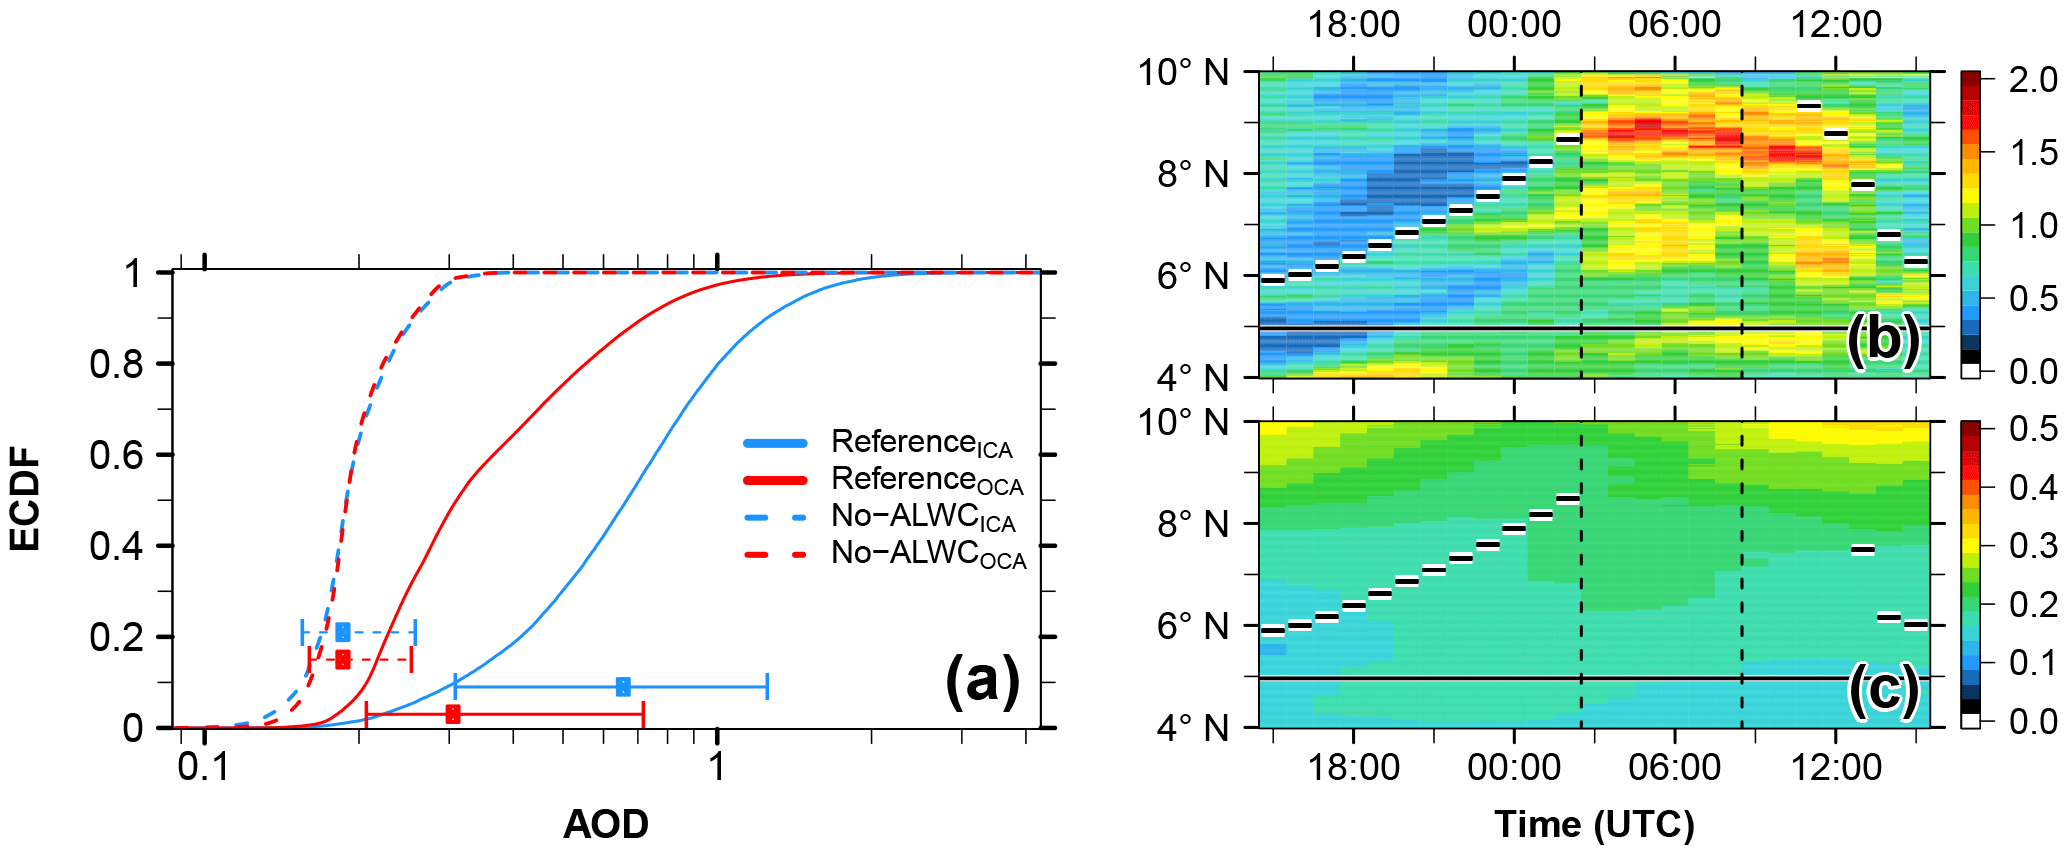
Figure 12(a) ECDF of the total AOD of ICA (blue) and OCA (red) for the reference (solid lines) and No-ALWC (dashed lines) over the Ivory Coast (7.5–3∘ W, 4–10∘ N) including the time period from 2 July 15:00 UTC to 3 July 15:00 UTC. The dots (circles) highlight the median with respect to the reference (No-ALWC) and the whiskers the 10th and 90th percentiles; Hovmöller diagrams of AOD for (b) the reference and (c) No-ALWC as a zonal mean over the respective area. The horizontal bars denote the zonal mean location of the 302 K isentrope at 250 m a.g.l., the horizontal solid line the zonal mean coastline and the vertical dashed lines the three phases introduced in Fig. 3. Note the different color scales in (b) and (c).
The diurnal cycles of the AOD for the reference and No-ALWC are shown in Fig. 12b and c, respectively. Without ALWC, the AOD is rather zonally symmetrical without a remarkable diurnal evolution (Fig. 12c), but by including ALWC, a clear diurnal cycle emerges (Fig. 12b). The dry areas, in particular the prefrontal area in Phase 1, show AOD minima, whereas the wetter Phases 2 and 3 reveal a significant AOD increase. Figure 13 summarizes the ALWC effects on SSR, SLR and AOD by presenting the differences between the reference and No-ALWC for the entire Ivory Coast. The strongest signals are visible for SSR during Phases 1 and 3. Differences in the SLR are likely related to cloud fraction variations (note the anticorrelation of SSR and cloud fraction differences). The fluctuations in SSR (red solid line) after sunrise are related to differences in the cloud cover (blue line). The difference of the AOD is higher in the wet Phases 2 and 3 than during the comparably dry Phase 1.
4.4 ALWC–radiation relationship
Sections 4.2 and provided insight into the ALWC effects on radiation and AOD. Based on these findings the pivotal question is the following: can we observe a robust relationship between ALWC and SSR as well as SLR? To answer this question we used the full 25 h period of 2 July 15:00 UTC to 3 July 15:00 UTC and clustered it according to clouds (ICA and OCA) and time of day (daytime: 2 July 15:00–18:00 UTC and 3 July 07:00–15:00 UTC; nighttime: 2 July 19:00 UTC to 3 July 06:00 UTC).
The clusters are sorted according to the total column ALWC (bin size 0.01 g m−2). For all grid points, which are assigned to a certain bin, the median of the radiation differences for the reference minus No-ALWC is calculated and plotted (blue lines in Fig. 14) together with the 25th and 75th percentile (blue shading). Linear fits are added to an empirically selected subset of the total ALWC range to quantify the ALWC–radiation relationship. The fitting omits bins with large ALWC (fewer data and large spread). A detailed analysis revealed that not more than 0.5 % of the data are omitted. Figure 14b and c show nonlinear behavior for low ALWC. Therefore, these parts are also omitted in the linear fitting. This affects 3.5–23.3 % of the data. The slopes (W g−1), which are derived from the linear fitting, are summarized in Table 2. Furthermore, we applied a bootstrapping technique for the six ALWC–radiation datasets of Table 2. For 10 000 resamples the corresponding slopes are calculated to estimate the uncertainty of the slope (Table 2). Nevertheless, the informative value of this approach is limited to the fact that the ALWC–radiation relationship is not only defined by the ALWC itself but also by the distribution of the ALWC on aerosol particles. It can be expected that with the same total ALWC, many small particles with small ALWC values are more effective in altering the radiation than a few big particles with high ALWC values. Therefore, it might by problematic to compare these results to other regions with different aerosol distributions.
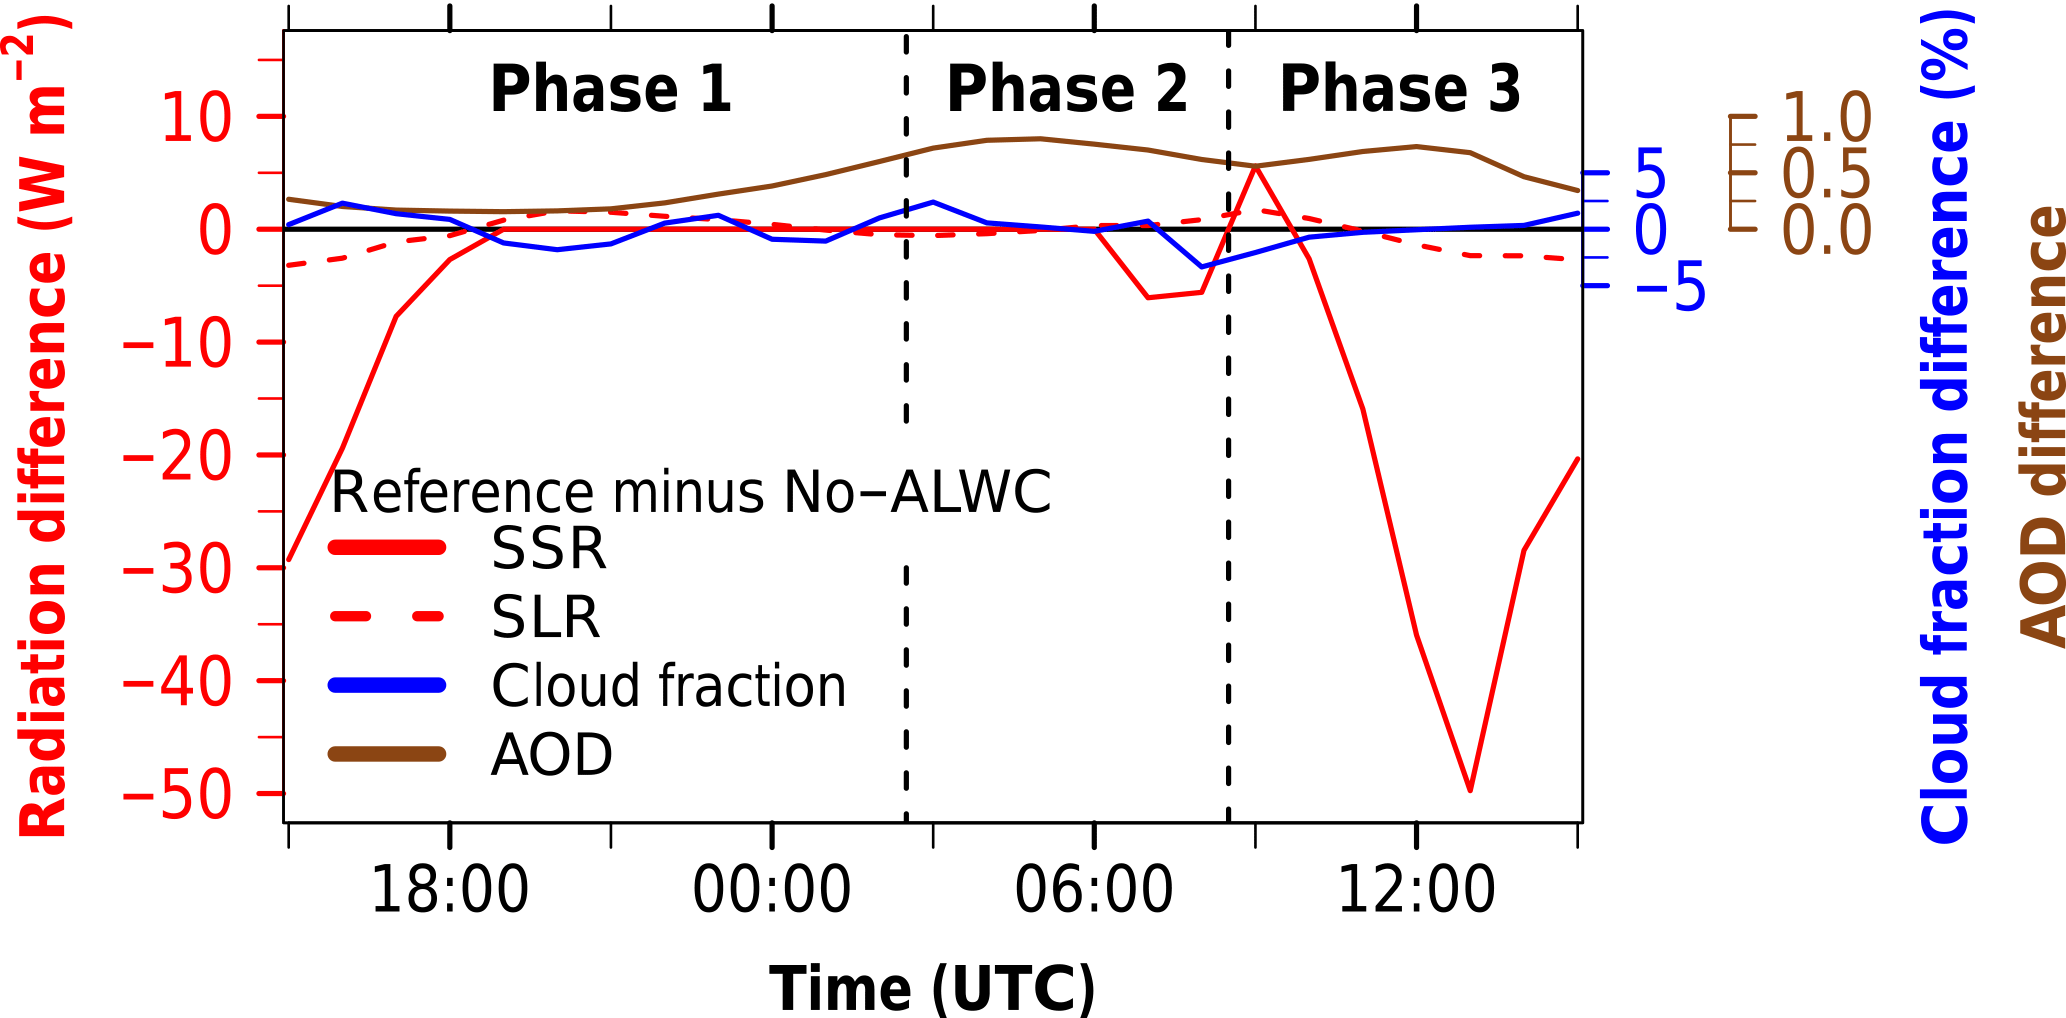
Figure 13Diurnal cycle of the difference between the reference and No-ALWC with respect to SSR (red solid, W m−2), SLR (red dashed, W m−2), domain-wide cloud fraction (blue, %) and AOD (brown) as a median over the Ivory Coast (7.5–3∘ W, 4–10∘ N) between 2 July 15:00 UTC and 3 July 15:00 UTC. The vertical dashed lines indicate the three phases introduced in Fig. 3. Note the color code of the different ordinates.
Generally, the increase in ALWC leads to a decrease in SSR and SLR in the reference compared to No-ALWC (Fig. 14a–f), which is more pronounced for ICA (Fig. 14a–c) than for OCA (Fig. 14d–f). Since ICA covers a wider ALWC interval than OCA, the linear fit is also more robust. In Sect. 4.1 ICA is defined as an area affected by clouds in both realizations and the differences in total cloud water are below 0.1 g m−2 to minimize effects from displaced clouds. This cloud water threshold value is generally smaller than the observed values of ALWC, suggesting that effects from cloud water differences are smaller than effects from ALWC. The highest ALWC–radiation sensitivities can be observed for SSR in ICA with about −300 W g−1. For OCA the decrease is about −100 W g−1. With respect to SLR, a separation in daytime and nighttime is done, with the former referring to the time period used for the SSR analysis. Negative SLR differences denote more outgoing longwave radiation in No-ALWC. This indicates that the ALWC contributes to the absorption and re-emission of SLR in the atmosphere. What we learn from the bootstrapping is that there are no statistically significant differences between the SLR decrease in ICA and OCA or during daytime and nighttime (Table 2). The decrease is of the order of −10 W g−1. Interestingly, for ALWC values below 0.05 g m−2 positive differences occur (more outgoing longwave radiation in the reference) and the relationship is nonlinear (Fig. 14b, c). Therefore, the linear fit omits this part of the curve. The reason for this behavior is not clear. This analysis is repeated for 6–7 July (Fig. 14g–l and Table F1), confirming the general relationship of decreasing radiation with increasing ALWC values. For SSR ICA, similar results are found, whereas the other subsets tend to have stronger radiation declines with ALWC than on 2–3 July 2016. On the one hand, this is related to the sensitivity of the interval selection for the fitting and, on the other hand, 6–7 July shows higher RH (Fig. 3c) and lower temperatures (Fig. 11d) than 2–3 July and therefore a higher potential for altering the radiation.
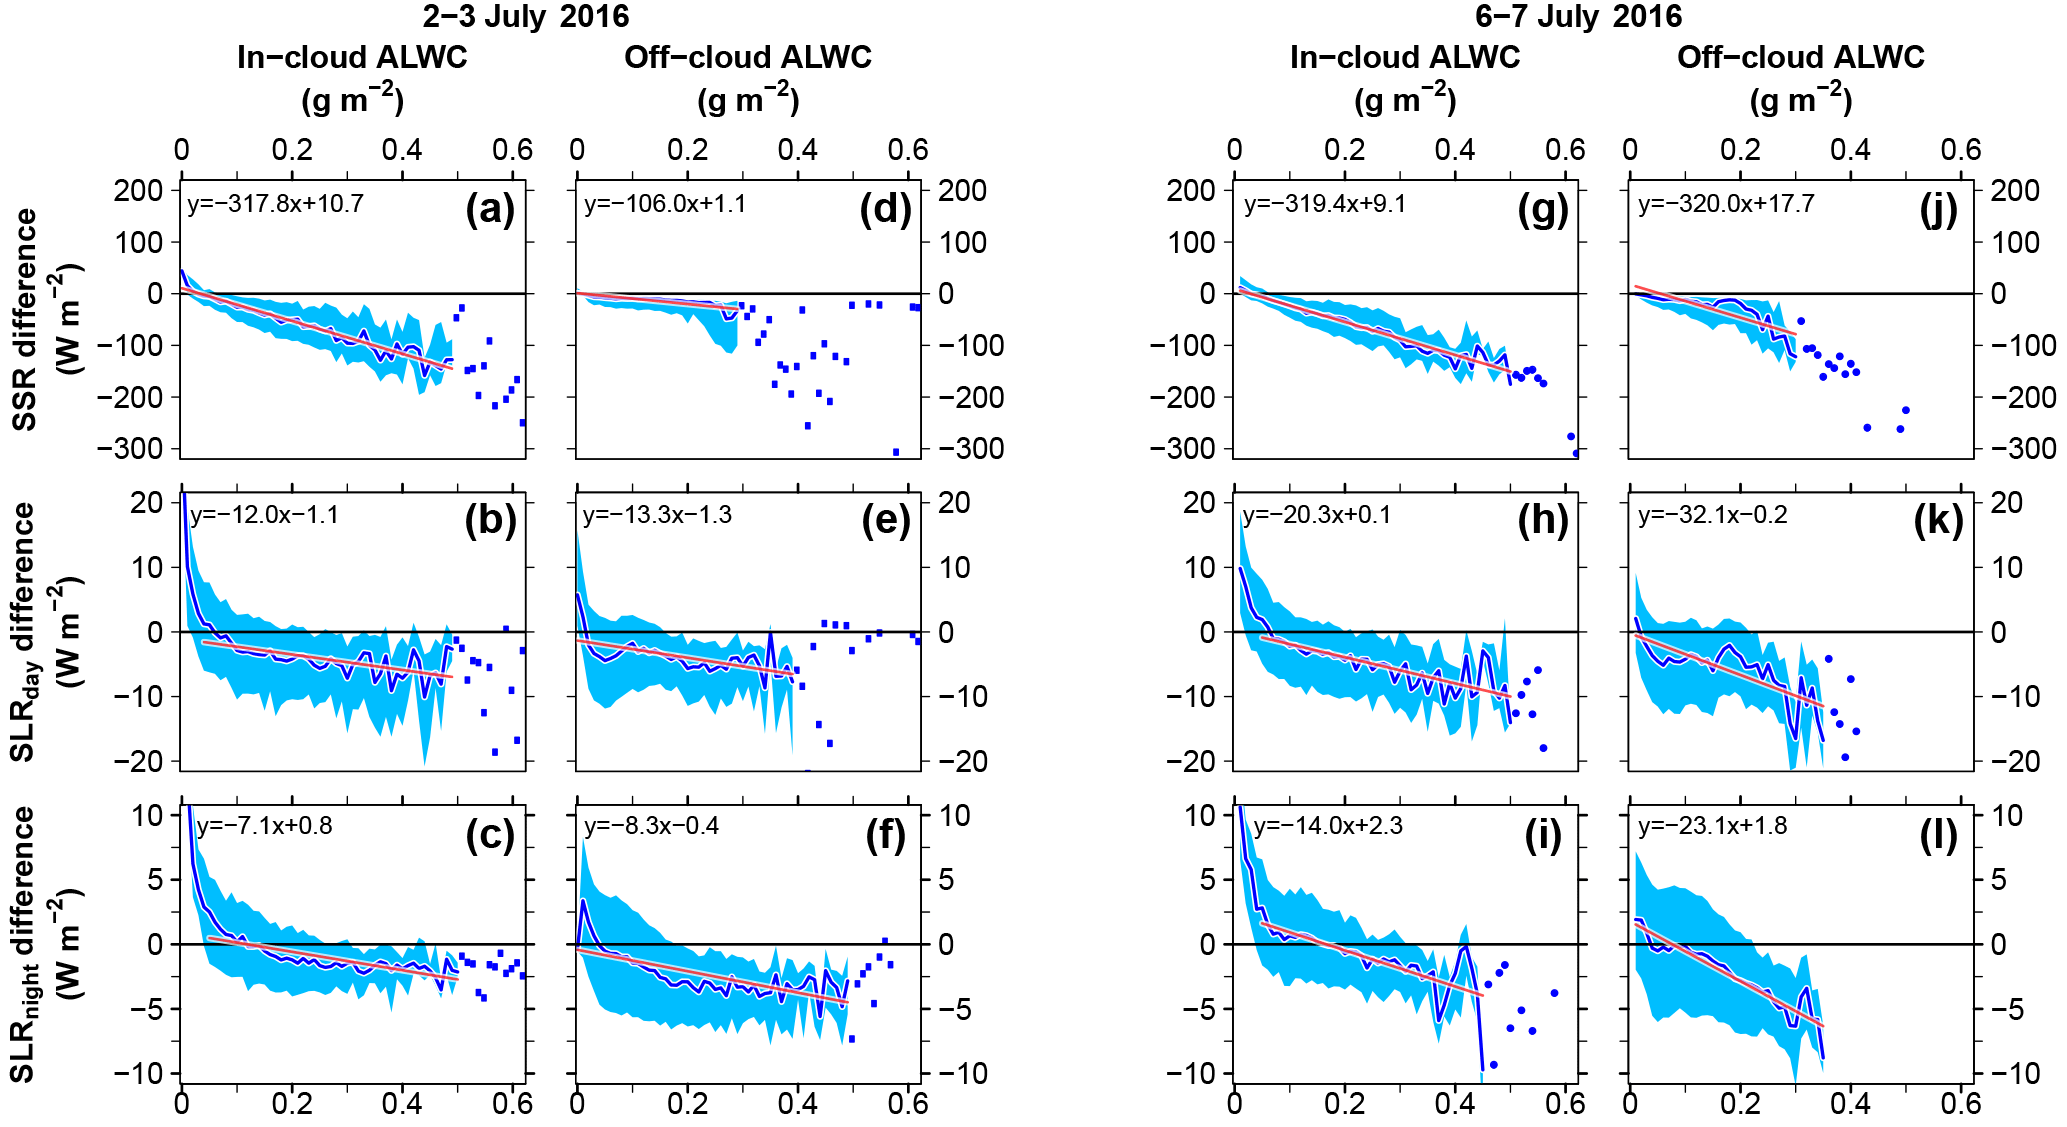
Figure 14Relationship between the total column ALWC (g m−2) and the radiation difference between the reference and No-ALWC (W m−2) capturing the Ivory Coast (7.5–3∘ W, 4–8∘ N) and the time period (two left columns) 2–3 July and (two right columns) 6–7 July. The data are clustered in areas that are simultaneously cloudy (in-cloud ALWC) or cloud free (off-cloud ALWC) in both realizations. The top panels show the daytime SSR difference: (a, d) 2 July 15:00–18:00 UTC and 3 July 07:00–15:00 UTC; (g, j) 6 July 15:00–18:00 UTC and 7 July 07:00–15:00 UTC. The middle panels show the SLR daytime difference (same time period as SSR) and the bottom panels present the nighttime SLR difference: (c, f) 2 July 19:00 UTC to 3 July 06:00 UTC; (i, l) 6 July 19:00 UTC to 7 July 06:00 UTC. The ALWC values are clustered in bins with an increment of 0.01 g m−2. For every bin the spatial median of the radiation difference is calculated (blue line). The envelope, spanned by the 25th and 75th percentile of the radiation difference, is shown as blue shading. For greater ALWC values the spread significantly increases. For this area (empirically selected) the median radiation difference is shown as blue dots instead of a blue line. A linear fit is calculated for the first part of the curves (red line). The fitted equations are shown in the top left corner of the panels.
This modeling study set the focus on the impact of aerosol liquid water content (ALWC) on the radiative transfer over southern West Africa (SWA). It provides a complementary study to Deetz et al. (2018), which focuses on the implication of aerosols for clouds and the atmospheric dynamics over SWA. The results are obtained via a process study with the regional model COSMO-ART on 2–3 and 6–7 July 2016, a time period in the well-established West African monsoon (WAM) and few impacts from mesoscale convective systems. With our study we aimed at (1) the quantification of the diurnal evolution of ALWC-related properties, (2) the evaluation of the ALWC impact on radiative transfer, and (3) the derivation of robust relationships between ALWC and the change in radiative transfer.
Deetz et al. (2018) identify Atlantic inflow (AI) as an atmospheric phenomenon, which affects the entirety of SWA through changes in temperature, relative humidity (RH) and wind speed with an especially coherent pattern over the Ivory Coast. Therefore, the spatial focus in Deetz et al. (2018) and this analysis is on this area. It turns out that AI, as an underlying meteorological process, affects all measures relevant for ALWC, in particular RH, clouds and aerosol properties. AI affects the monsoon layer (lowest 1900 m a.g.l.) by advecting air masses with comparably low temperatures and high RH onshore. The highest RHs are reached in the postfrontal area of AI. We have shown that AI decisively shapes the diurnal evolution of the RH and propose three phases: Phase 1 (15:00–02:00 UTC) denotes the progression of the AI, inducing an inland contrast between the comparably dry and warm air prefrontally and the comparably moist and cold are postfrontally. Phase 2 (03:00–08:00 UTC) refers to the moist morning. The AI front has passed the area, providing homogeneously moist and cool conditions. Phase 3 (09:00–15:00 UTC) is the daytime drying phase. After sunrise the land area warms and dries again, leading to the reestablishment of the AI front. Due to AI the diurnal cycle is not primarily thermodynamically driven (nighttime radiative cooling) but dynamically driven. Since several studies (e.g., Adler et al., 2017) have shown that AI is a common phenomenon during the West African monsoon (WAM), we suggest that the proposed phase definition can be generalized to this time period. This is supported by additional simulations for 6–7 July that show similar patterns. The spatiotemporal pattern of ALWC is clearly dominated by that of the RH. On average 60–80 % of the ALWC is related to RH regimes>95 %. With respect to aerosol size, the accumulation mode is the dominant ALWC contributor in agreement with the findings of Bian et al. (2014). These particles are adequate in number and size and are also highly hygroscopic. Around sunrise (06:00 UTC, Phase 2) the highest RH and therefore the ALWC maximum is reached over SWA. This is related to aerosol growth factors of about 2 for Aitken and accumulation mode and about 4 for coarse-mode particles. The study of Haslett et al. (2018), which is currently under review and derives the ALWC solely based on measurements by using aircraft observations, radiosonde data and the ZSR mixing rule, comes to similar conclusions with respect to the aerosol properties and the ALWC-related AOD increase.
The radiative impact of ALWC is assessed by an additional model realization that neglects the ALWC impact on radiative transfer. Including the ALWC leads to a significant increase in aerosol optical depth (AOD), especially for cloud areas (from about 0.2 to 0.7 on average). Therefore, ALWC introduces an RH dependency into the AOD. However, the effects from the AOD increase in cloudy areas on shortwave radiation and temperature are not significantly stronger than for the areas off clouds, likely because clouds dominate the radiative transfer and the AOD has less impact. Generally, a decrease in incoming shortwave radiation can be observed when considering ALWC of the order of −20 W m−2 (spatiotemporal average). Longwave effects appear insignificant. Since the effects are small during the night, 2 m temperature differences are also restricted to daytime. The temperature decrease is usually not greater than −1 K but this is already significant in moist tropical climates.
To derive a relationship between ALWC and radiation (W per g ALWC), we calculated linear fits to the radiation decrease with increasing total column ALWC and estimated the uncertainty by using a bootstrapping technique. For shortwave radiation in-cloud (off-cloud), a relationship of W g−1 ( W g−1) is found. For longwave radiation the relationship is about −10 W g−1 with insignificant differences between day and night as well as in-cloud and off-cloud. However, these relationships do not include effects arising from the aerosol optical properties (many small particles versus a few large particles). The findings indicate the general need to consider ALWC or the RH dependency of the AOD in the COSMO radiation calculation. This is especially of relevance in SWA with its moist and polluted monsoon layer. Although the additional period 6–7 July is used to evaluate the robustness of the results, revealing similar evolutions of AI and the radiation differences, simulations on longer timescales are necessary to increase the reliability of the ALWC–radiation relationship. A drawback in this study is that activated aerosol is not removed from the aerosol distribution, leading to potential double counts in the radiative transfer calculations. A simulation with radiatively fully transparent clouds can provide further insight into the ALWC radiative impact by disentangling from the cloud properties but it is expected that the surplus incoming solar radiation would significantly alter the atmospheric dynamics and therefore make it less realistic. It is expected that the radiative effect of the ALWC is determined by a combination of aerosol size increase and the corresponding change in the refractive index. Although it would be interesting to assess the contribution of each process, this is beyond the scope of this work and has to be left for future studies.
The non-negligible radiative impact of ALWC motivates post-DACCIWA measurement efforts in which the SWA haze could be targeted. In this regard the time of sunrise will be of special interest, since at this time the ALWC maximum is reached and the humidity-related AOD increase is also highest. However, the strongest effects on temperature occur later in the morning. The quantification of aerosol hygroscopicity with aircraft on clear and hazy days might allow us to derive observationally based relationships between ALWC and radiative transfer or visibility in general. Especially nocturnal research flights can provide added value complementary to DACCIWA. An interesting time of year to further study this effect is boreal spring (e.g., March), which is characterized by pre-monsoon conditions with high aerosol and humidity but less cloud and precipitation than in summer.
The underlying research data are available upon request from the corresponding author.
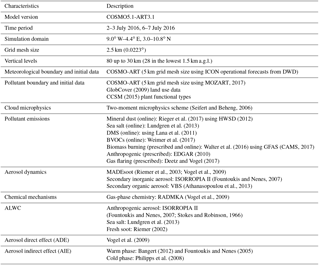
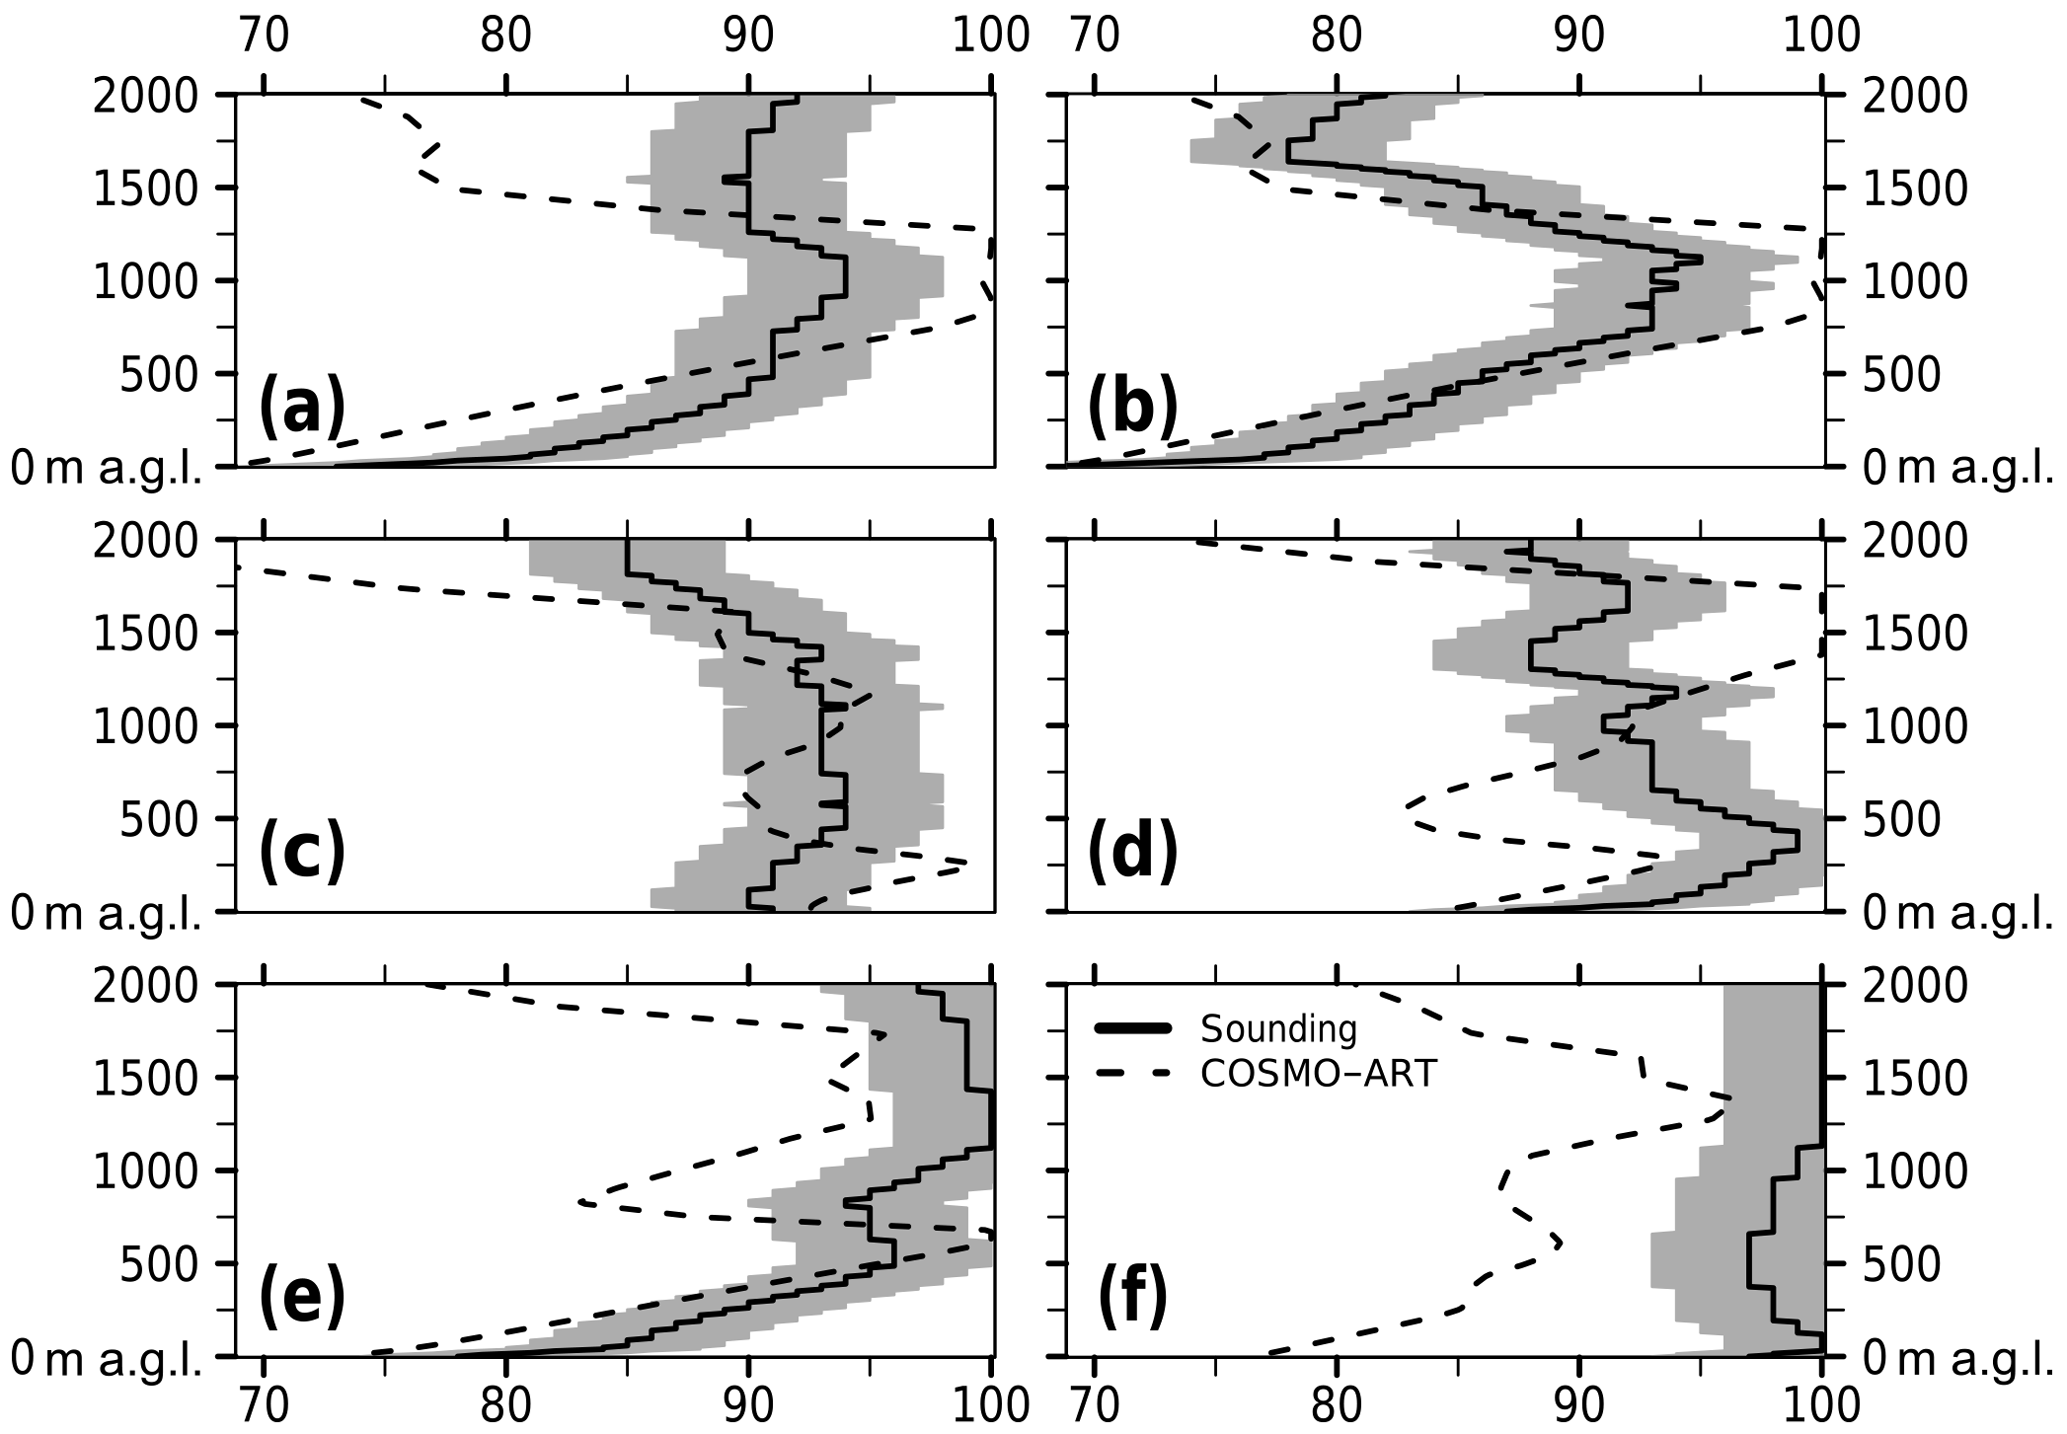
Figure B1RH vertical profiles at Lamto (Ivory Coast) with respect to radiosoundings (black solid) and COSMO-ART (black dashed) on (a) 6 July 12:00 UTC, (b) 6 July 18:00 UTC, (c) 7 July 06:00 UTC, (d) 7 July 09:00 UTC, (e) 7 July 12:00 UTC and (f) 7 July 18:00 UTC. For the GRAW radiosondes an uncertainty of ±4 % is assumed (gray shading). The Lamto soundings are related to problems with reaching 100 % RH (Andreas Fink, personal communication, 2018).
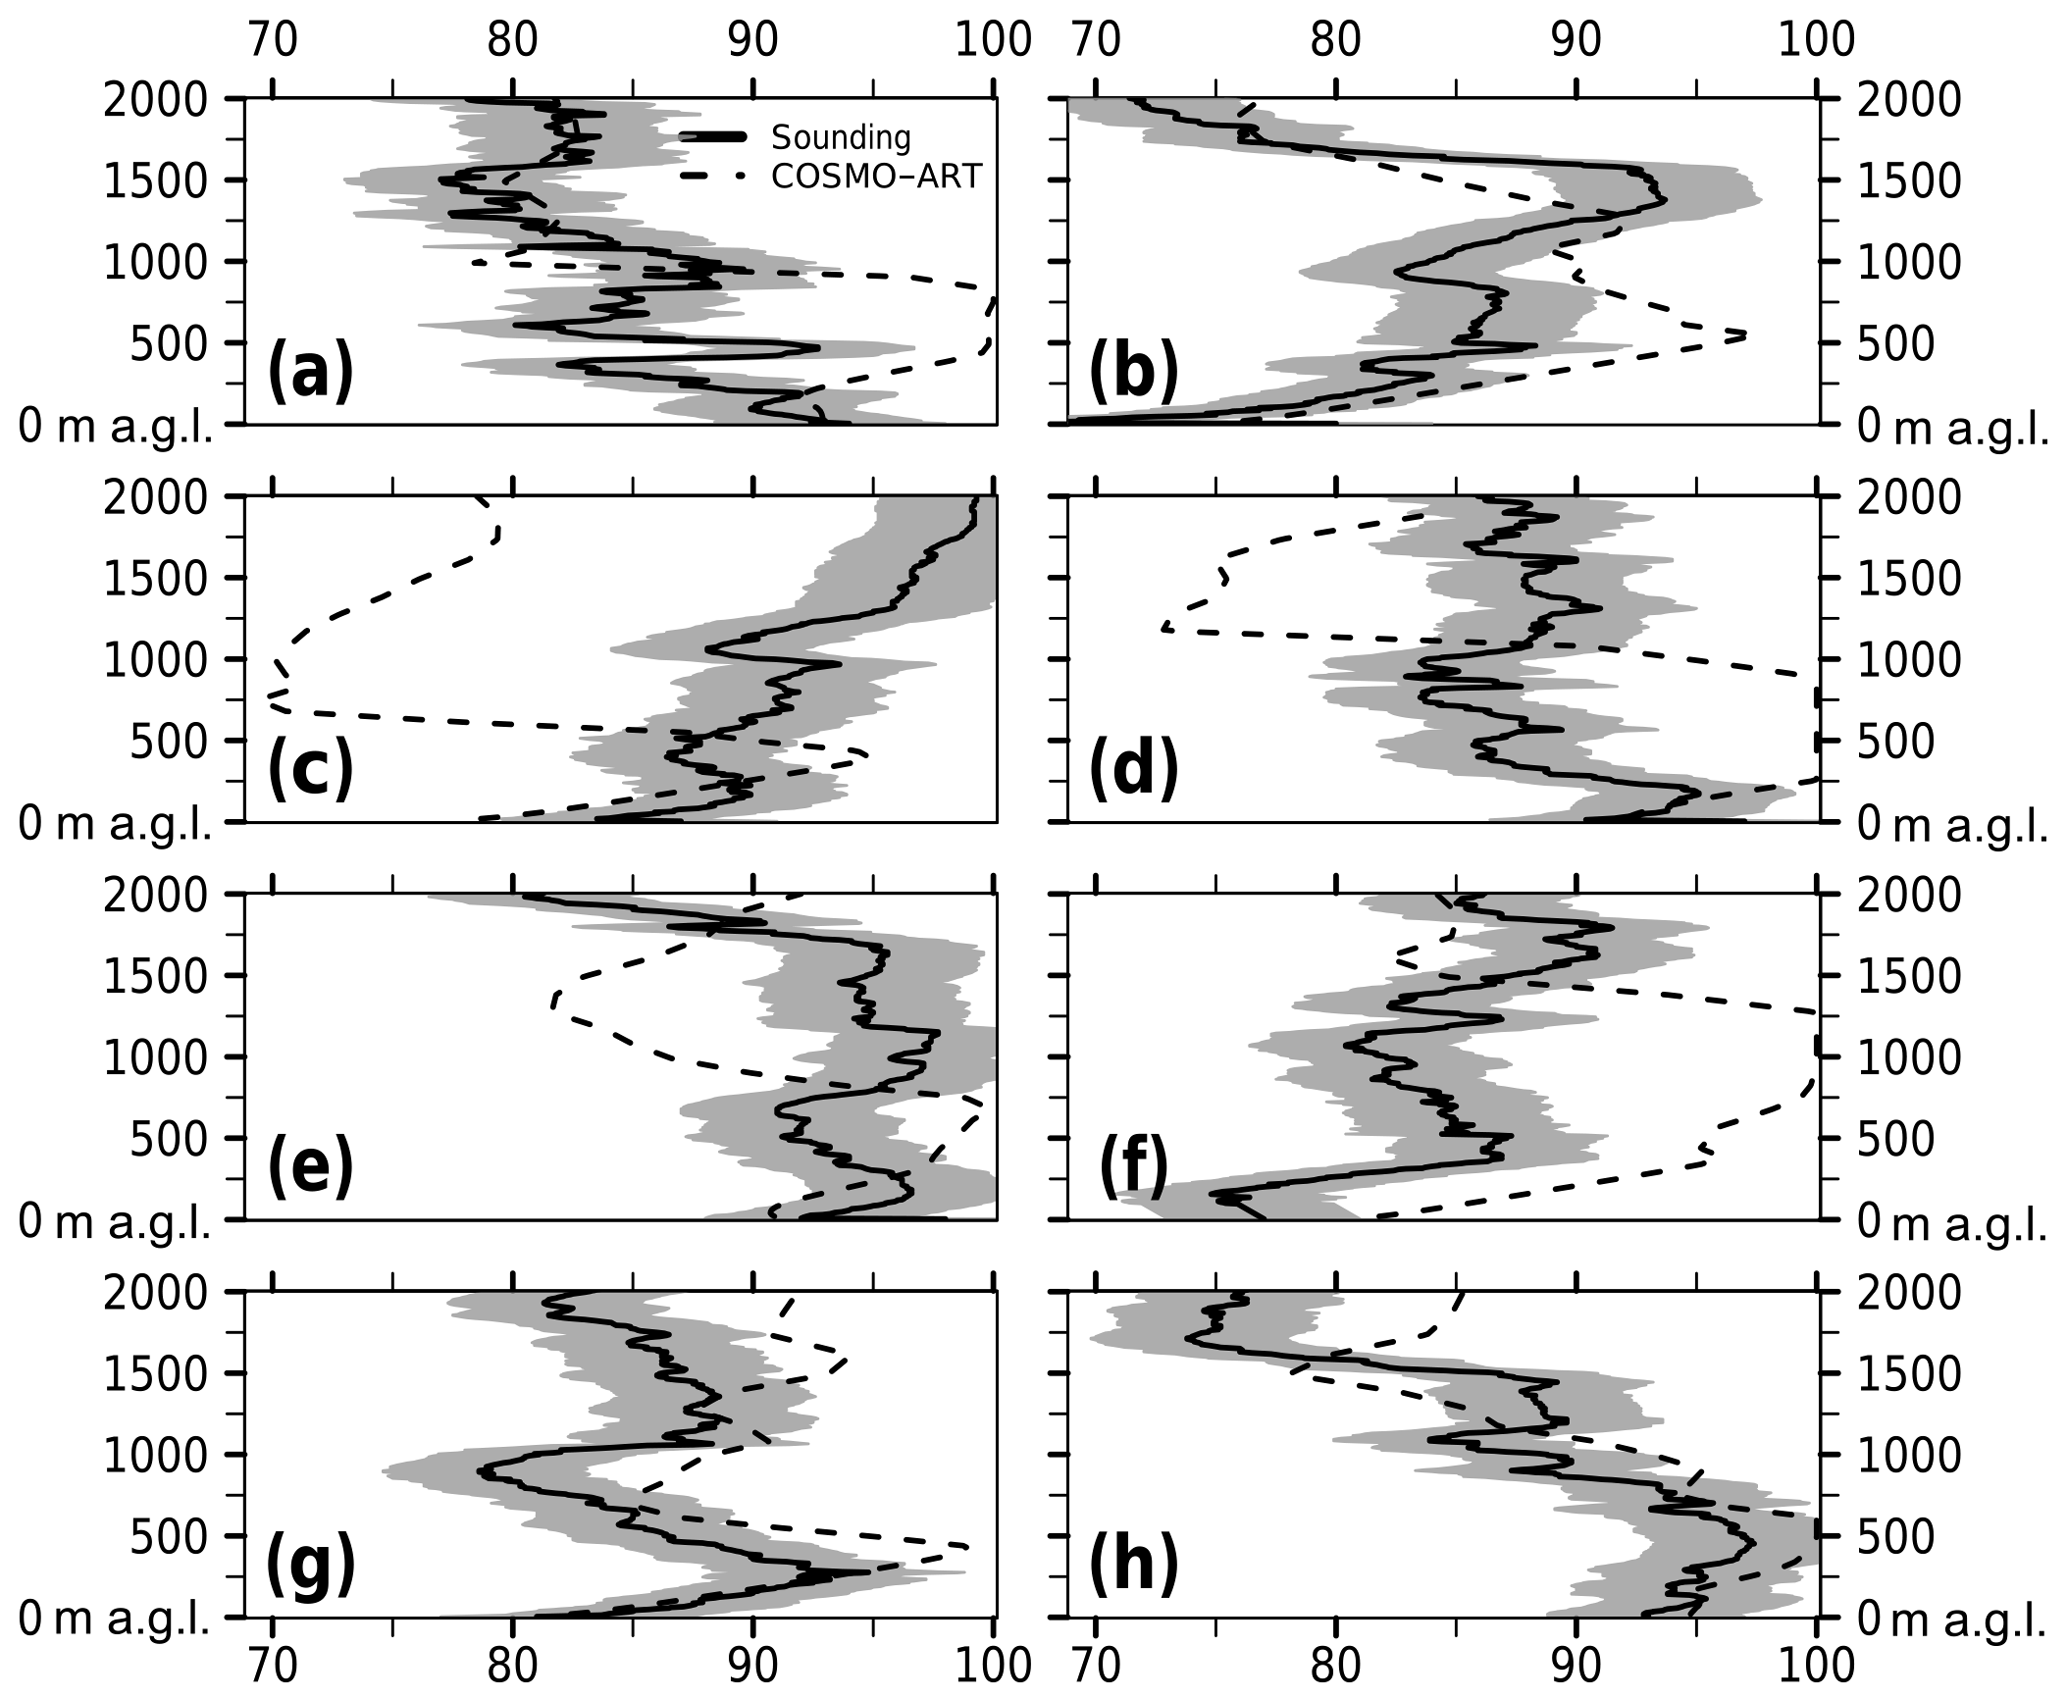
Figure B2RH vertical profiles at Abidjan (Ivory Coast) with respect to radiosoundings (black solid) and COSMO-ART (black dashed) on (a) 2 July 04:00 UTC, (b) 2 July 10:00 UTC, (c) 2 July 16:00 UTC, (d) 2 July 23:00 UTC, (e) 3 July 04:00 UTC, (f) 3 July 10:00 UTC, (g) 3 July 16:00 UTC and (h) 3 July 23:00 UTC. For the Meteomodem radiosondes an uncertainty of ±4 % is assumed (gray shading).
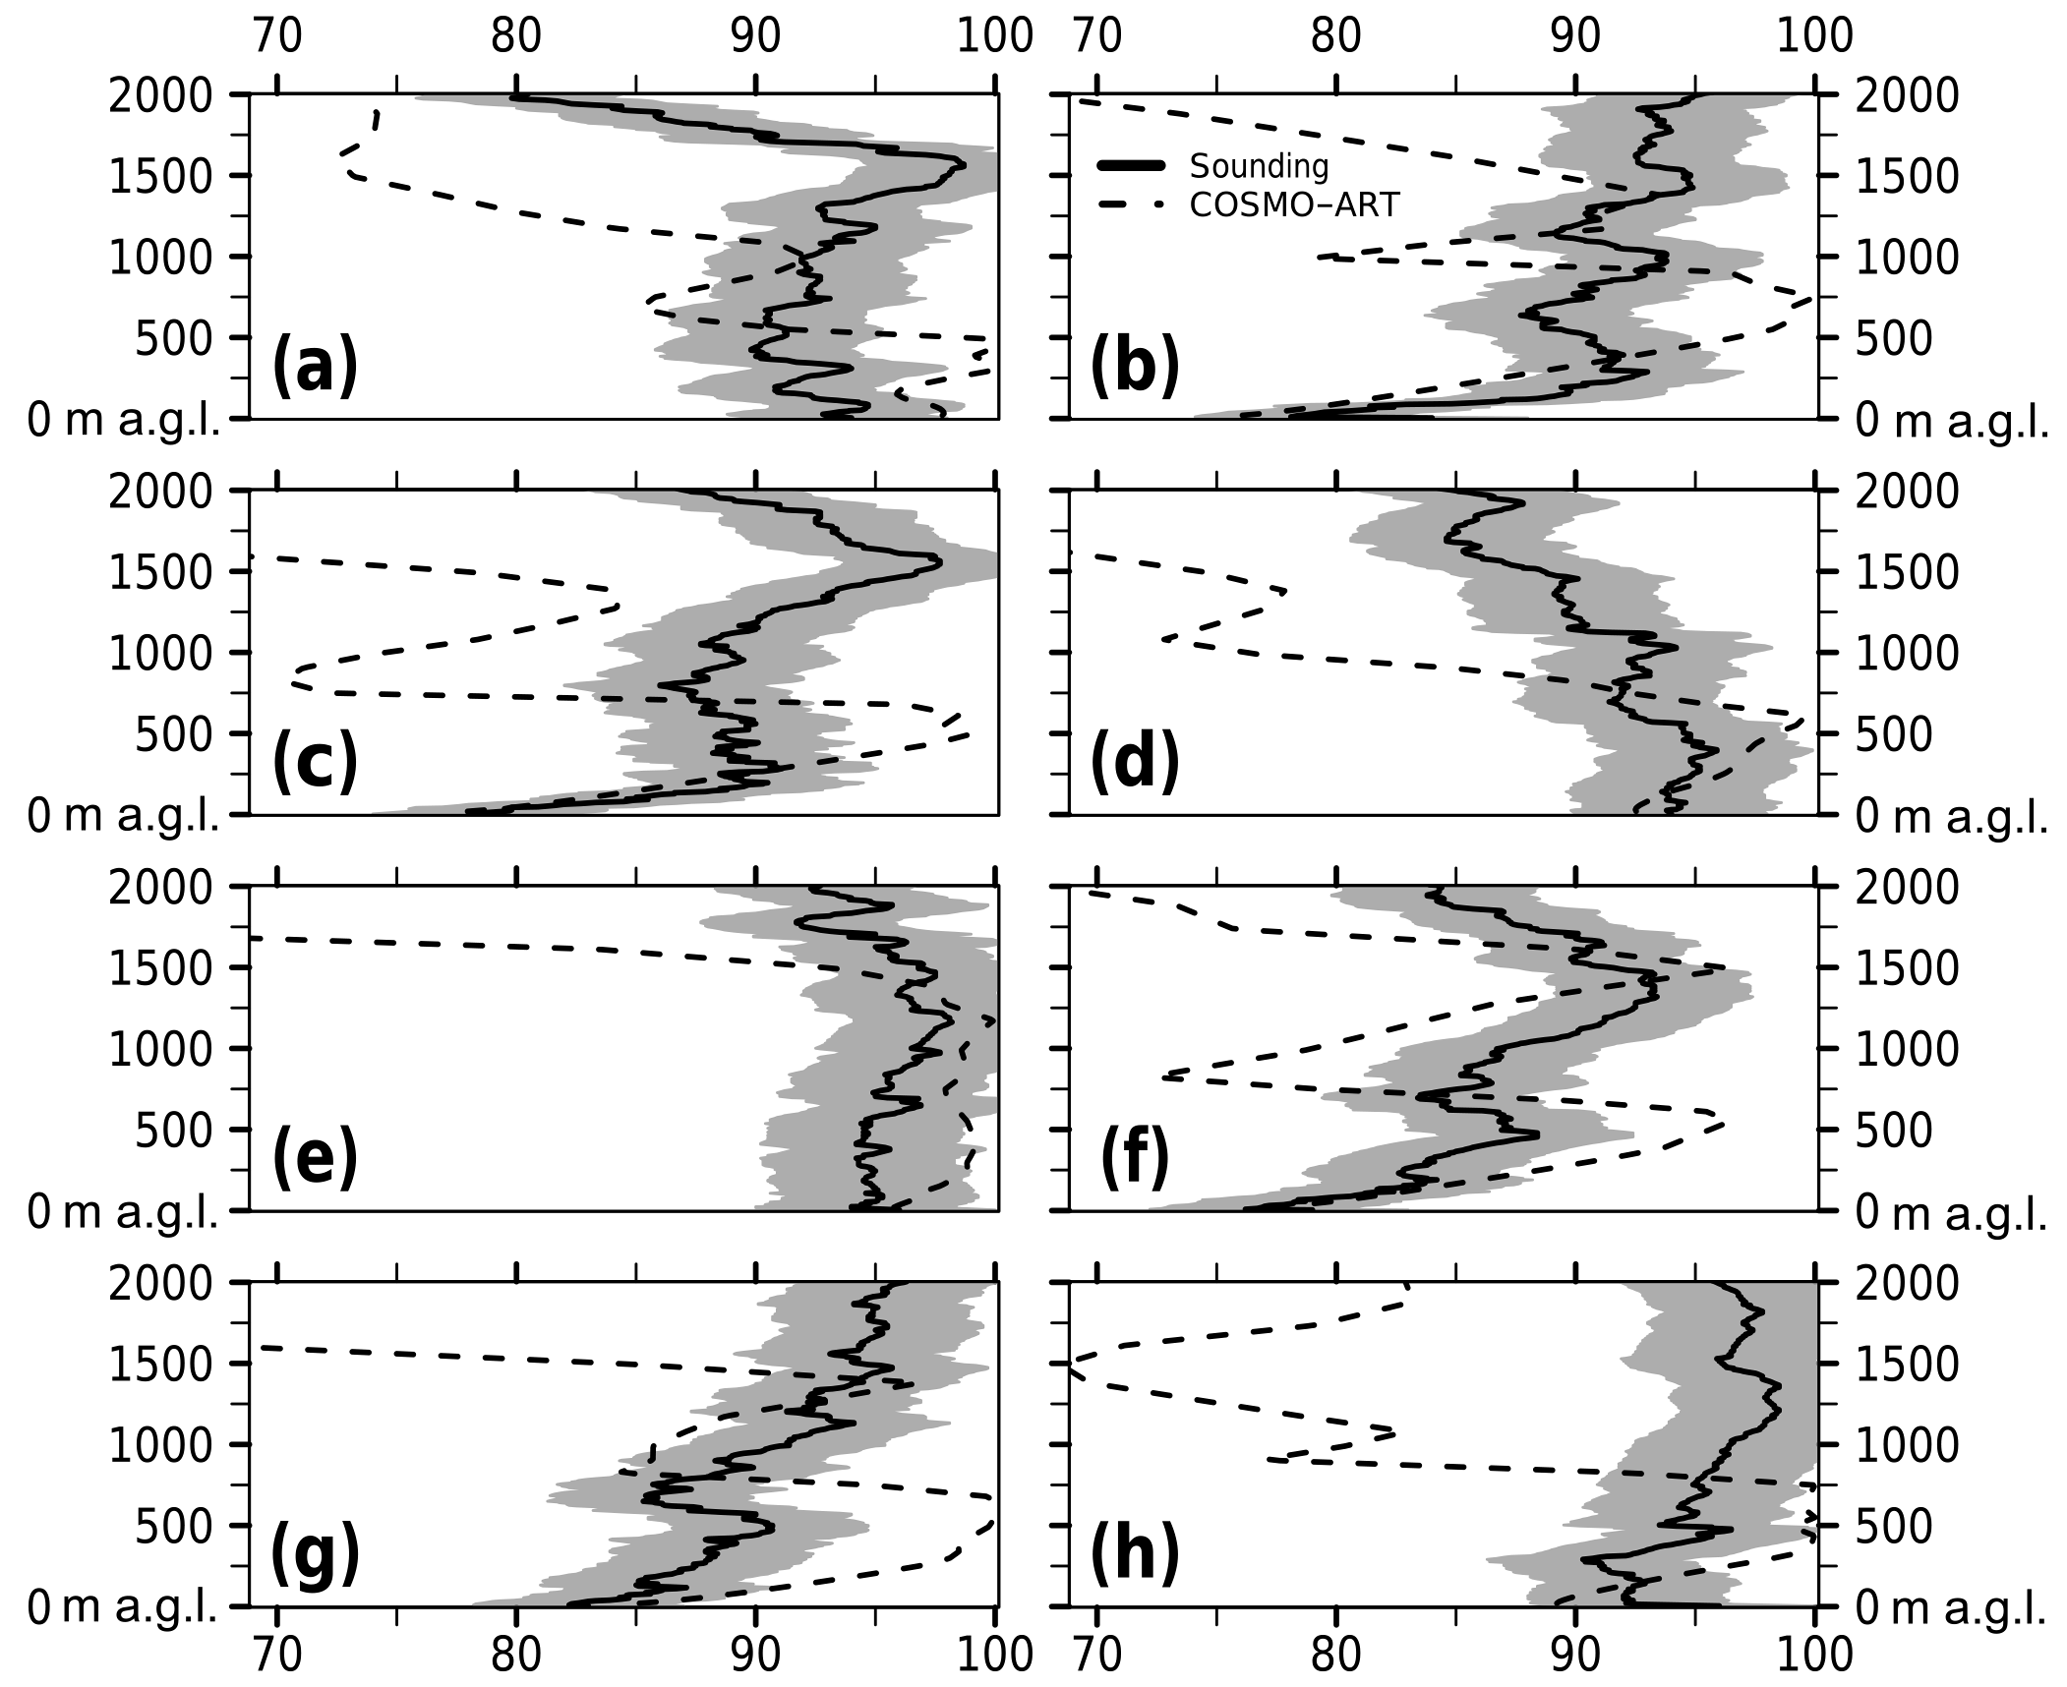
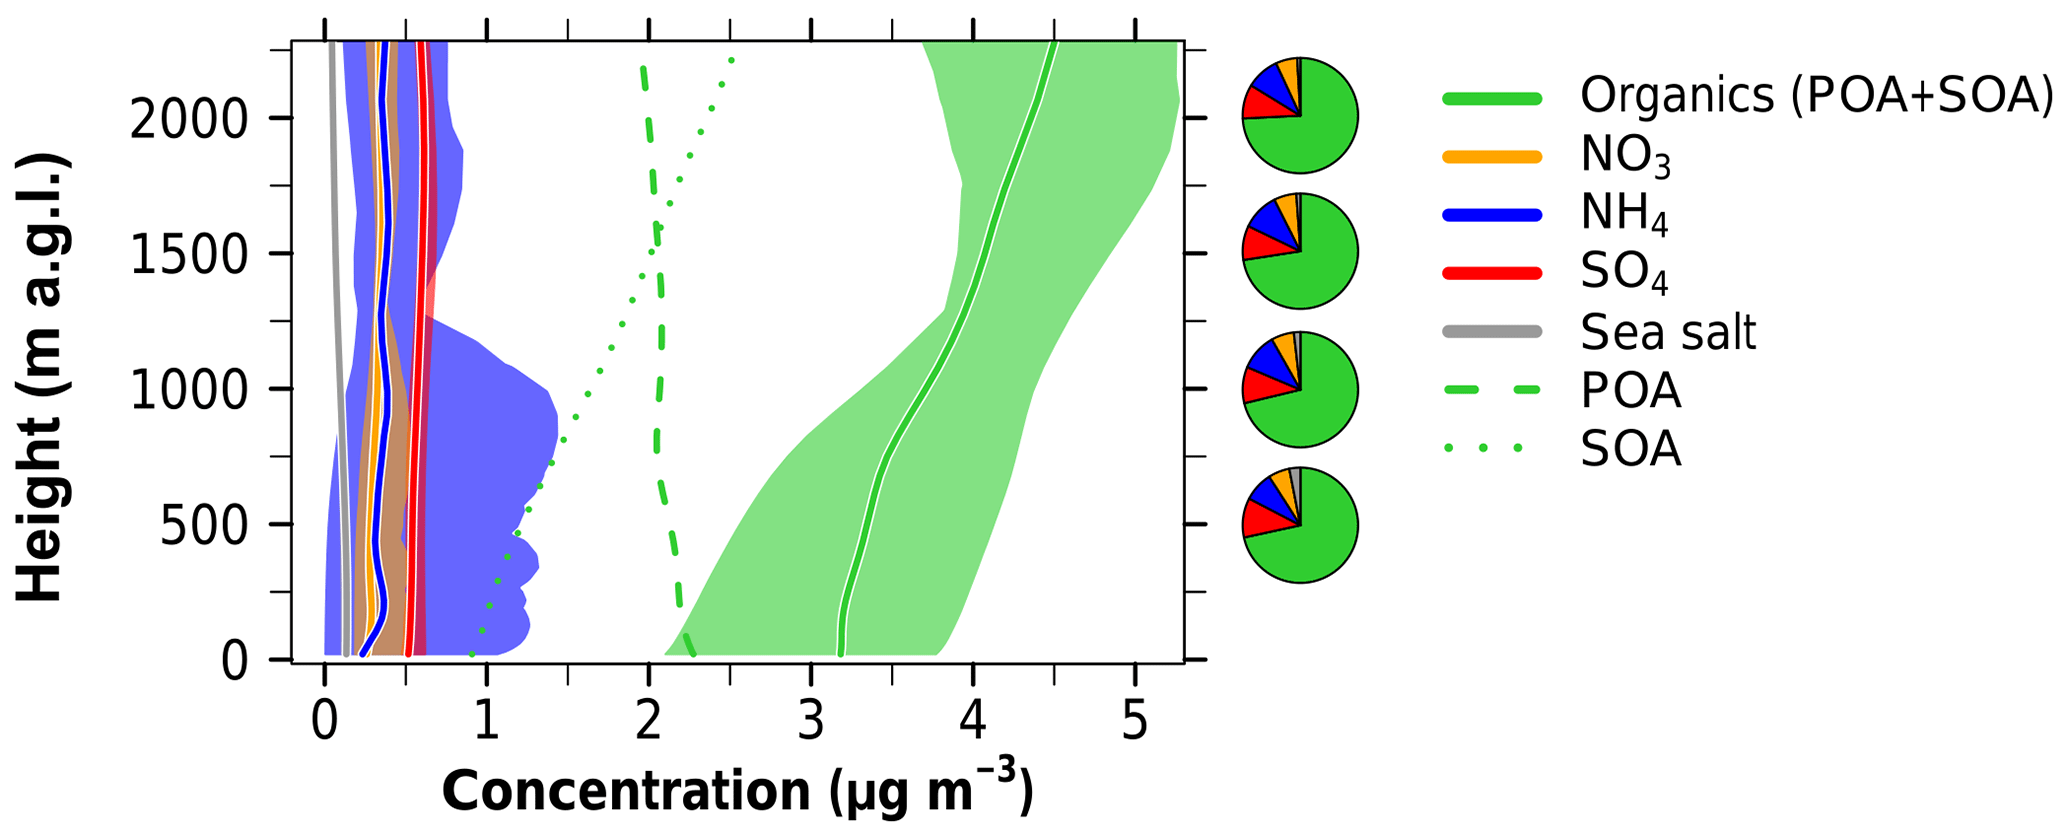
Figure C1Vertical profiles (m a.g.l.) of aerosol concentrations (µg m−3) for the median over the Ivory Coast (7.5–3∘ W, 4–10∘ N) with respect to the time period 2 July 15:00 UTC and 3 July 15:00 UTC. The colors refer to organics (POA + SOA; green solid line), NO3 (orange solid line), NH4 (blue solid line), SO4 (red solid line) and sea salt (gray solid line). Additionally, POA and SOA are shown as dashed and dotted green lines, respectively. The shadings denote minima and maxima in the diurnal cycle mean profile and the pie charts on the right-hand side highlight the mean contribution of the single species to the total aerosol composition at 500, 1000, 1500 and 2000 m a.g.l.
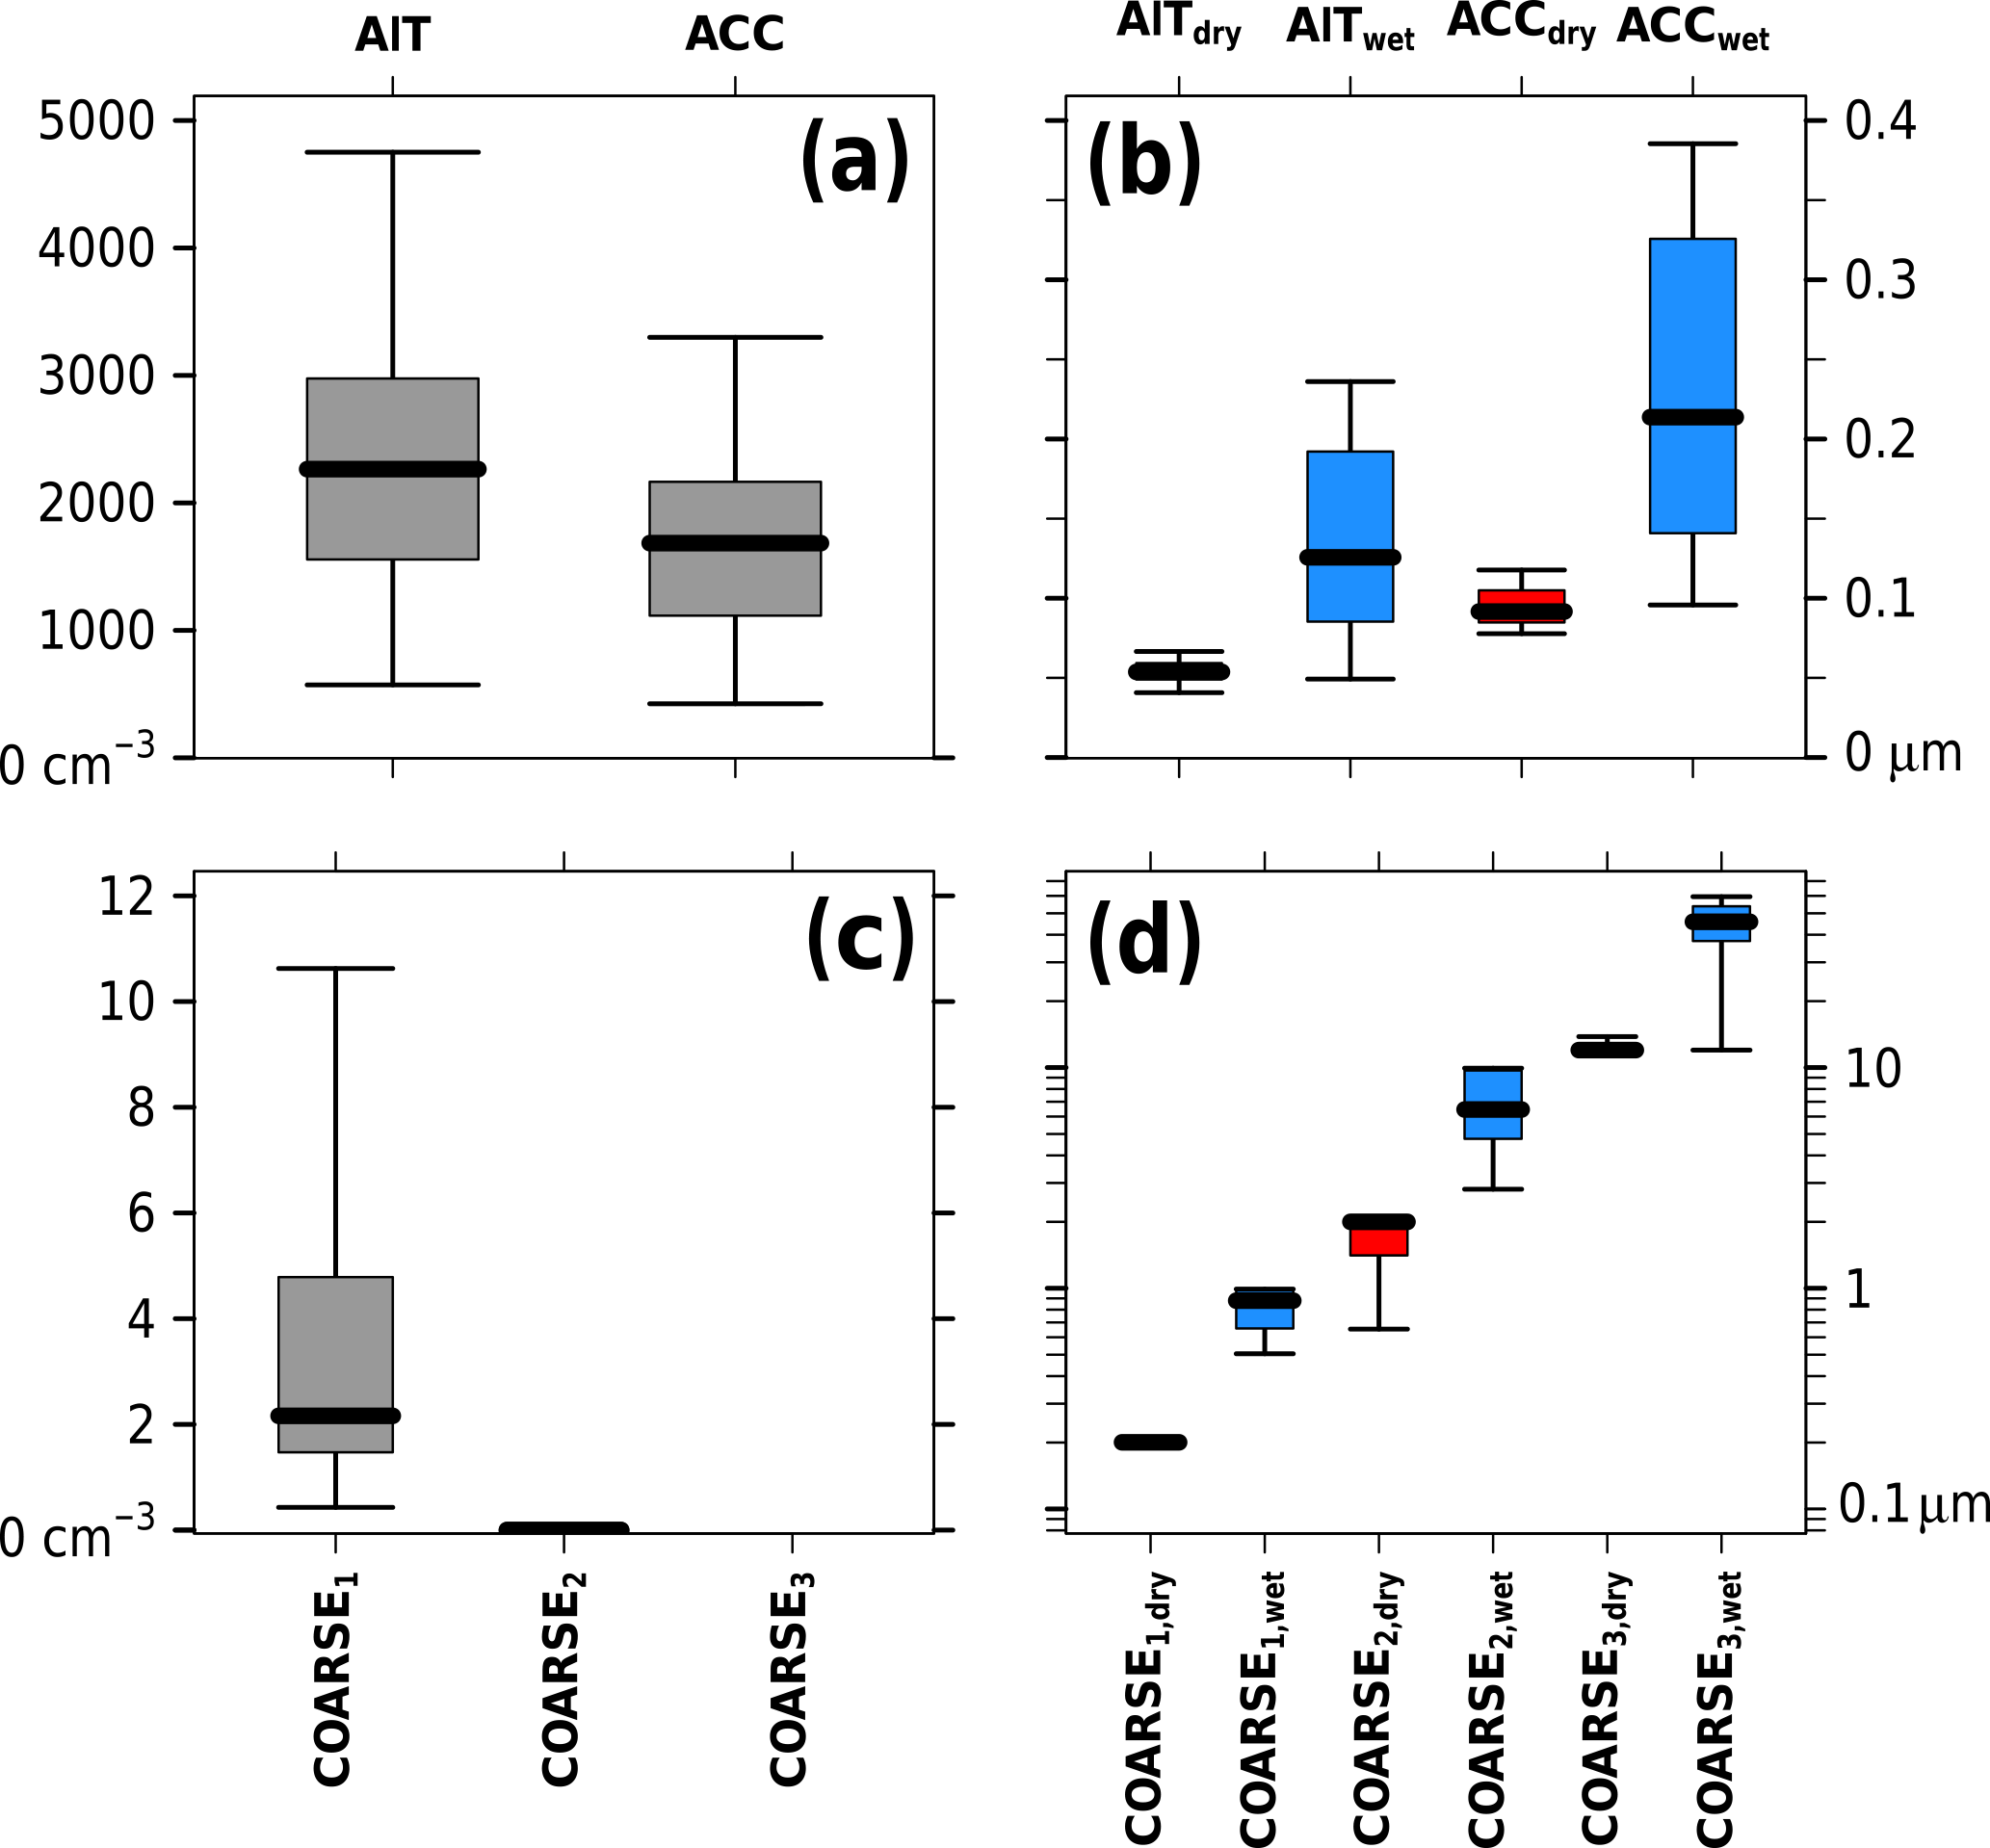
Figure D1Box plots of (a) aerosol number density (cm−3) and (b) dry (red) and wet (blue) aerosol diameters (µm) for AIT and ACC; box plots of (c) aerosol number density (cm−3) and (d) dry (red) and wet (blue) aerosol diameters (µm) for COARSE split into the three COSMO-ART sea salt modes as median in the lowest 1500 m a.g.l. over the Ivory Coast (7.5–3∘ W, 4–10∘ N) on 3 July, 06:00 UTC. The whiskers span the data from percentile 2.5 to 97.5 (95 % of the data). Data outside of this range are not shown. Note the different unit in (c) (conversion factor is 106) and the logarithmic scale in (d). The absolute value of the number density of COARSE3 is below 1.3 m−3 and is therefore not shown in (c).
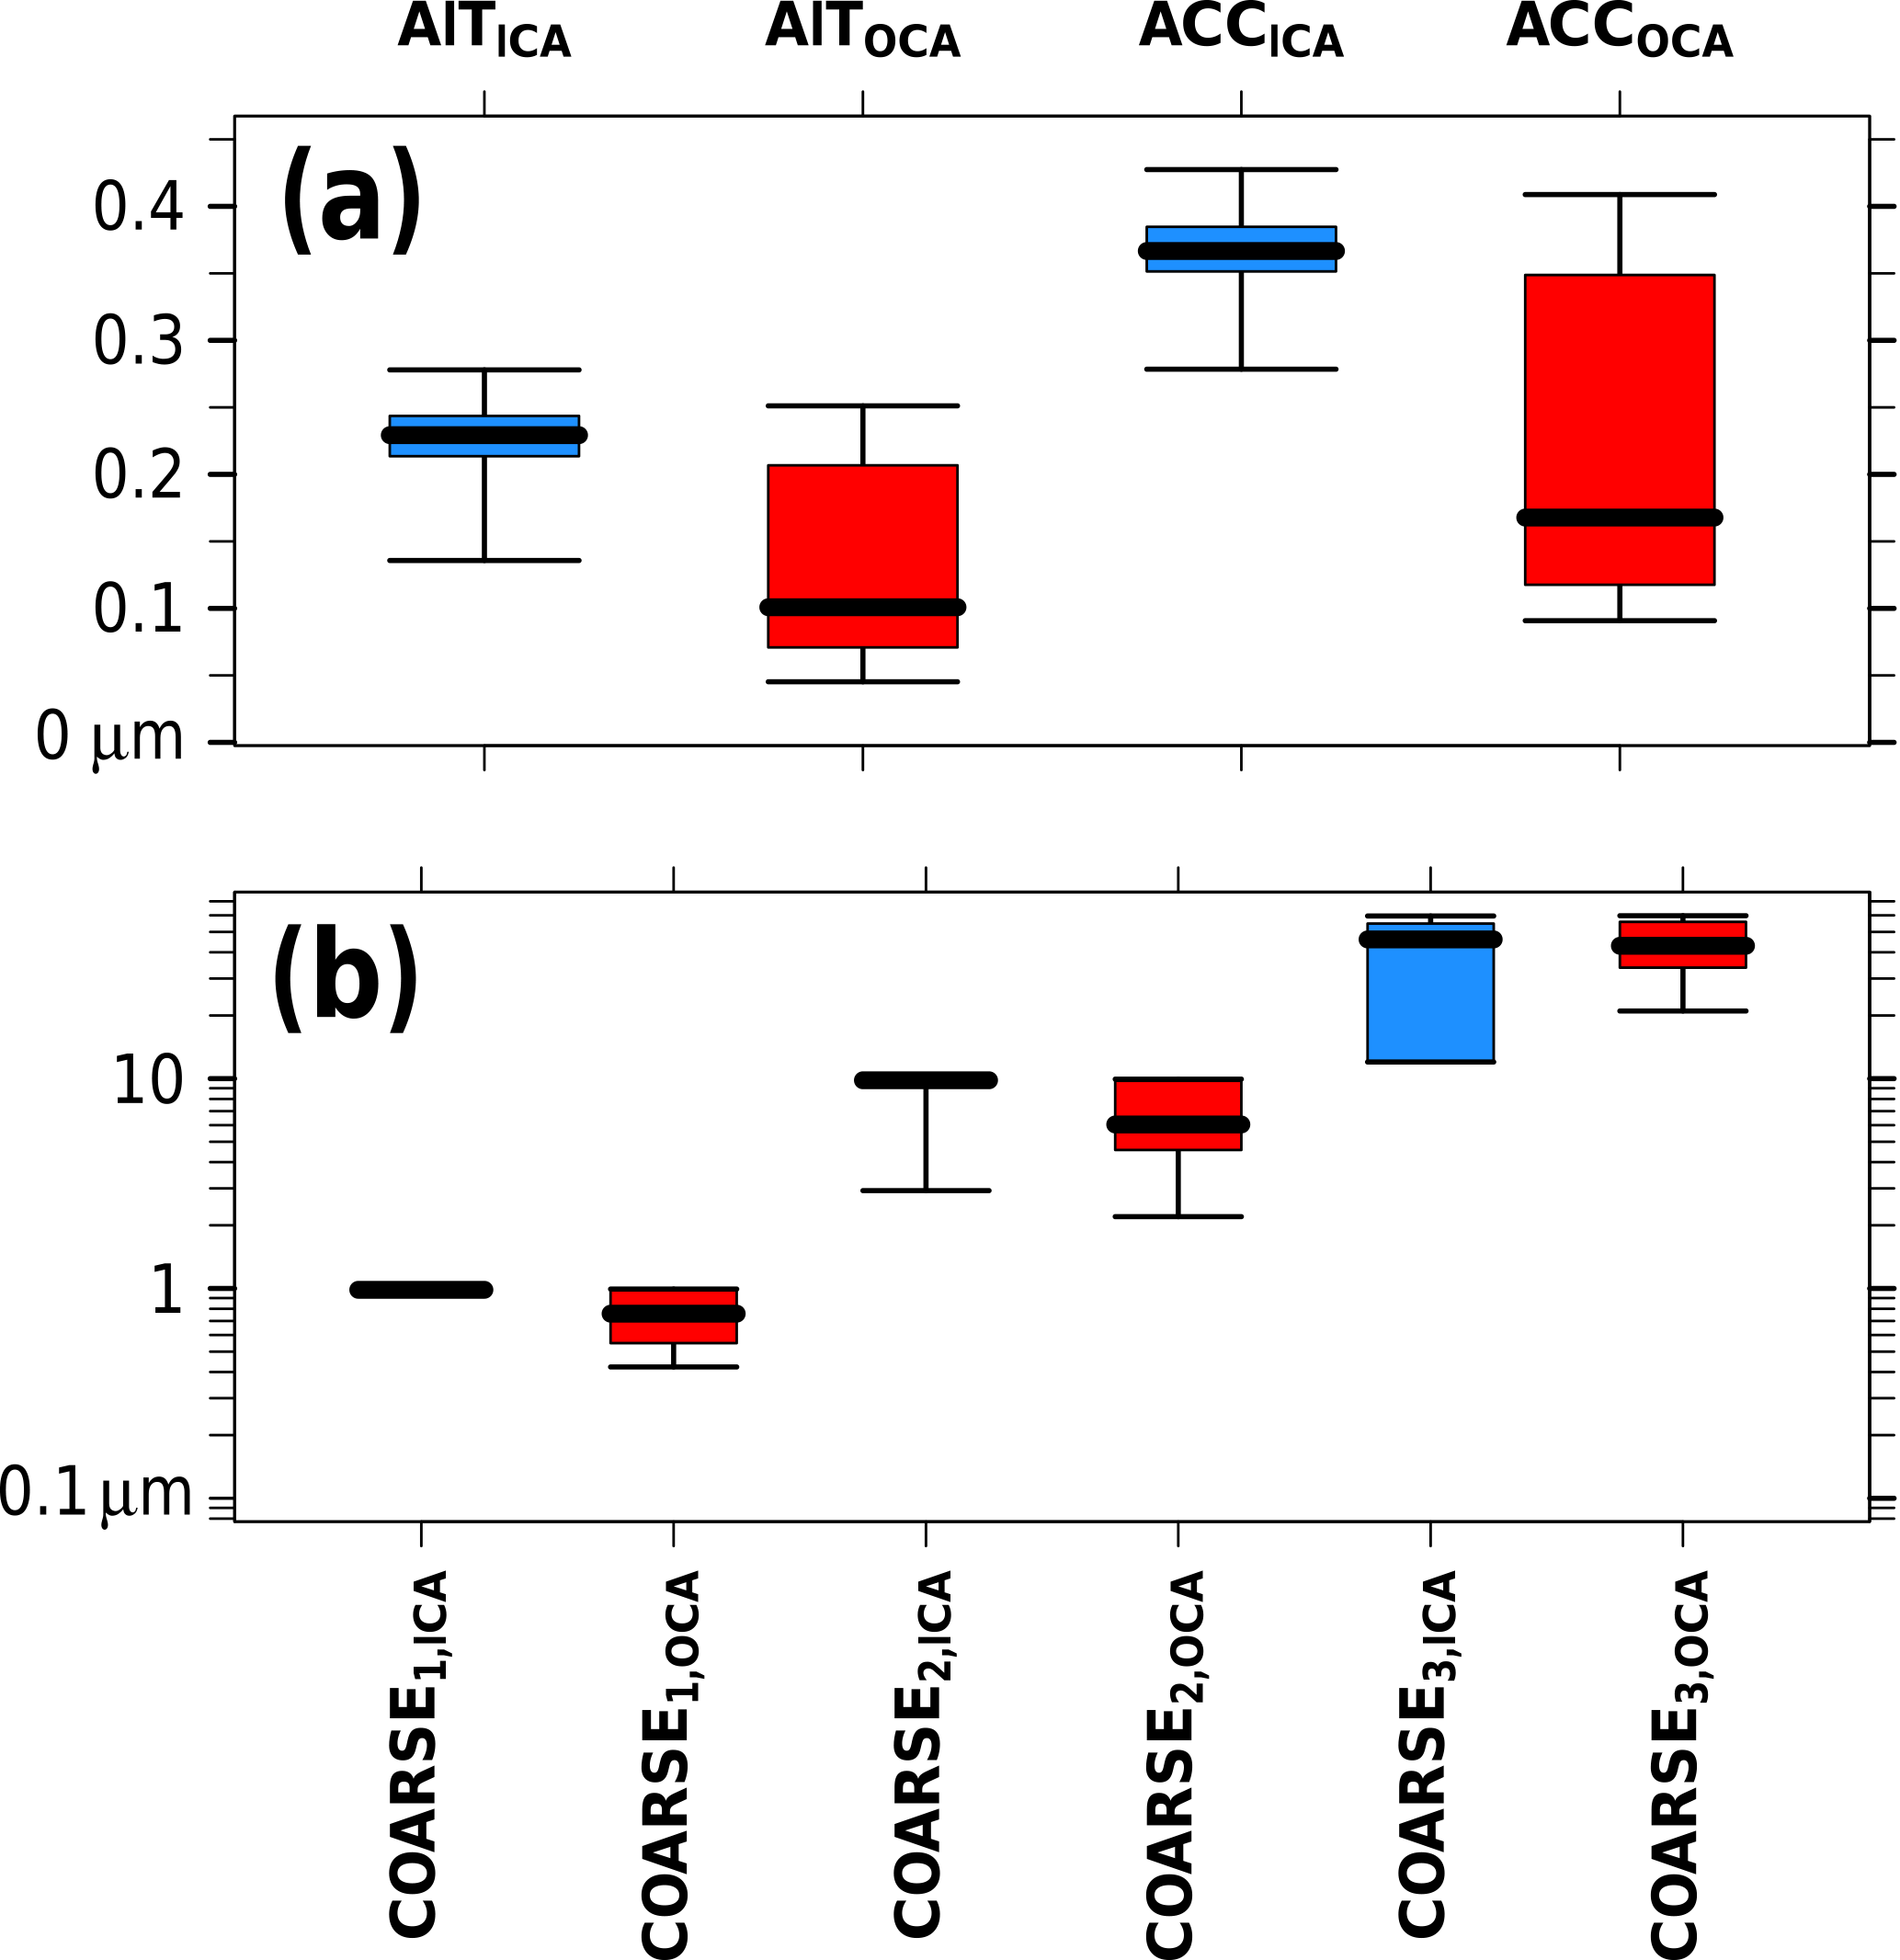
Figure D2Box plots of aerosol wet diameters (µm) for (a) AIT and ACC and (b) COARSE split into the three COSMO-ART sea salt modes as a median in the lowest 1500 m a.g.l. over the Ivory Coast (7.5–3∘ W, 4–10∘ N) on 3 July, 06:00 UTC by separating into ICA (areas with nonzero cloud water, blue) and OCA (areas with zero cloud water, red). The whiskers span the data from percentile 2.5 to 97.5 (95 % of the data). Data outside of this range are not shown.
Table E1Statistics of the cloud property differences (reference minus No-ALWC, ICA) over the Ivory Coast (7.5–3∘ W, 4–10∘ N) with respect to the time period 2 July 15:00 UTC to 3 July 15:00 UTC, including the median difference, the 25th and 75th percentile of the differences, and the ratio of the 75th percentile to the reference average. The CDNC and the effective radius refer to the median in the lowest 1500 m a.g.l.
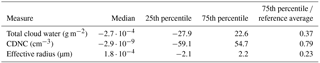
Table F1Radiation–ALWC relationship (W g−1) based on the linear fits of Fig. 14g–l including the time period 6 July 15:00 UTC to 7 July 15:00 UTC. The subdomain denotes whether the captured area is simultaneously cloudy (ICA) or cloud free (OCA) in both realizations. Original data denote the slopes derived from Fig. 14g–l, whereas bootstrapping refers to the median slopes of the 10 000 resamples. The confidence intervals are derived by using the Gaussian approximation and α=0.05, and the evaluation range provides the ALWC interval, which is used for the linear fitting.
KD and BV designed the experiments and KD carried them out, including the realization of the simulations. KD prepared the paper with contributions from all coauthors.
The authors declare that they have no conflict of interest.
This article is part of the special issue “Results of the project “Dynamics–aerosol–chemistry–cloud interactions in West Africa” (DACCIWA) (ACP/AMT inter-journal SI)”. It is not associated with a conference.
The research leading to these results has received funding from the European
Union 7th Framework Programme (FP7/2007-2013) under grant agreement no. 603502
(EU project DACCIWA: Dynamics–aerosol–chemistry–cloud interactions in West Africa).
Thanks to the German Weather Service (DWD) for providing access to the ICON forecast
data and to the Steinbuch Centre for Computing (SCC) for providing the computational
resources for the model realizations. The data analysis was done by using the software
R (2013).
The article processing charges for this open-access
publication were covered by a Research
Centre of the Helmholtz Association.
Edited by: Susan van den Heever
Reviewed by: two anonymous referees
Adler, B., Kalthoff, N., and Gantner, L.: Nocturnal low-level clouds over southern West Africa analysed using high-resolution simulations, Atmos. Chem. Phys., 17, 899–910, https://doi.org/10.5194/acp-17-899-2017, 2017. a, b, c
Aklilu, Y., Mozurkewich, M., Prenni, A. J., Kreidenweis, S. M., Alfarra, M. R., Allan, J. D., Anlauf, K., Brooks, J., Leaitch, W. R., Sharma, S., Boudries, H., and Worsnop, D. R.: Hygroscopicity of particles at two rural, urban influenced sites during Pacific 2001: Comparison with estimates of water uptake from particle composition, Atmos. Environ., 40, 2650–2661, 2006. a, b, c, d
Alfarra, M. R., Coe, H., Allan, J. D., Bower, K. N., Boudries, H., Canagaratna, M. R., Jimenez, J. L., Jayne, J. T., Garforth, A. A., Li, S.-M., and Worsnop, D. R.: Characterization of urban and rural organic particulate in the Lower Fraser Valley using two Aerodyne Aerosol Mass Spectrometers, Atmos. Environ., 38, 5745–5758, 2004. a
Andersen, H. and Cermak, J.: How thermodynamic environments control stratocumulus microphysics and interactions with aerosols, Environ. Res. Lett., 10, 024004, https://doi.org/10.1088/1748-9326/10/2/024004, 2015. a
Athanasopoulou, E., Vogel, H., Vogel, B., Tsimpidi, A. P., Pandis, S. N., Knote, C., and Fountoukis, C.: Modeling the meteorological and chemical effects of secondary organic aerosols during an EUCAARI campaign, Atmos. Chem. Phys., 13, 625–645, https://doi.org/10.5194/acp-13-625-2013, 2013. a, b
Baldauf, M., Seifert, A., Förstner, J., Majewski, D., and Raschendorfer, M.: Operational Convective-Scale Numerical Weather Prediction with the COSMO model: Description and Sensitivities, Mon. Weather Rev., 139, 3887–3905, 2011. a
Bangert, M.: Interaction of Aerosol, Clouds, and Radiation on the Regional Scale, Institut für Meteorologie und Klimaforschung, Karlsruher Institut für Technologie, Dissertation, 2012. a
Beyersdorf, A. J., Ziemba, L. D., Chen, G., Corr, C. A., Crawford, J. H., Diskin, G. S., Moore, R. H., Thornhill, K. L., Winstead, E. L., and Anderson, B. E.: The impacts of aerosol loading, composition, and water uptake on aerosol extinction variability in the Baltimore-Washington, D.C. region, Atmos. Chem. Phys., 16, 1003–1015, https://doi.org/10.5194/acp-16-1003-2016, 2016. a
Bian, Y. X., Zhao, C. S., Ma, N., Chen, J., and Xu, W. Y.: A study of aerosol liquid water content based on hygroscopicity measurements at high relative humidity in the North China Plain, Atmos. Chem. Phys., 14, 6417–6426, https://doi.org/10.5194/acp-14-6417-2014, 2014. a, b, c, d, e, f, g
Brock, C. A., Wagner, N. L., Anderson, B. E., Beyersdorf, A., Campuzano-Jost, P., Day, D. A., Diskin, G. S., Gordon, T. D., Jimenez, J. L., Lack, D. A., Liao, J., Markovic, M. Z., Middlebrook, A. M., Perring, A. E., Richardson, M. S., Schwarz, J. P., Welti, A., Ziemba, L. D., and Murphy, D. M.: Aerosol optical properties in the southeastern United States in summer – Part 2: Sensitivity of aerosol optical depth to relative humidity and aerosol parameters, Atmos. Chem. Phys., 16, 5009–5019, https://doi.org/10.5194/acp-16-5009-2016, 2016. a, b
CAMS: Copernicus Atmosphere Monitoring Service, available at: http://apps.ecmwf.int/datasets/data/cams-gfas/, last access: 30 July 2017. a
CCSM: available at: https://svn-ccsm-inputdata.cgd.ucar.edu/trunk/inputdata/lnd/clm2/rawdata/pftlanduse.3minx3min.simyr2000.c110913/, (last access: 10 June 2017), 2015. a
Chen, J., Zhao, C. S., Ma, N., Liu, P. F., Göbel, T., Hallbauer, E., Deng, Z. Z., Ran, L., Xu, W. Y., Liang, Z., Liu, H. J., Yan, P., Zhou, X. J., and Wiedensohler, A.: A parameterization of low visibilities for hazy days in the North China Plain, Atmos. Chem. Phys., 12, 4935–4950, https://doi.org/10.5194/acp-12-4935-2012, 2012. a, b, c
Cheng, Y. F., Wiedensohler, A., Eichler, H., Heintzenberger, J., Tesche, M., Ansmann, A., Wendisch, M., Su, H., Althausen, D., Herrmann, H., Gnauk, T., Brüggemann, E., Hu, M., and Zhang, Y. H.: Relative humidity dependence of aerosol optical properties and direct radiative forcing in the surface boundary layer at Xinken in Pearl River Delta of China: An observation based numerical study, Atmos. Environ., 42, 6373–6397, 2008. a
Crumeyrolle, S., Gomes, L., Tulet, P., Matsuki, A., Schwarzenboeck, A., and Crahan, K.: Increase of the aerosol hygroscopicity by cloud processing in a mesoscale convective system: a case study from the AMMA campaign, Atmos. Chem. Phys., 8, 6907–6924, https://doi.org/10.5194/acp-8-6907-2008, 2008. a
Deetz, K.: Assessing the Aerosol Impact on Southern West African Clouds and Atmospheric Dynamics, Wissenschaftliche Berichte des Instituts für Meteorologie und Klimaforschung des Karlsruher Instituts für Technologie, KIT Scientific Publishing, Karlsruhe, Dissertation, 75, 99–144, 2018. a, b, c
Deetz, K. and Vogel, B.: Development of a new gas-flaring emission dataset for southern West Africa, Geosci. Model Dev., 10, 1607–1620, https://doi.org/10.5194/gmd-10-1607-2017, 2017. a
Deetz, K., Vogel, H., Knippertz, P., Adler, B., Taylor, J., Coe, H., Bower, K., Haslett, S., Flynn, M., Dorsey, J., Crawford, I., Kottmeier, C., and Vogel, B.: Numerical simulations of aerosol radiative effects and their impact on clouds and atmospheric dynamics over southern West Africa, Atmos. Chem. Phys., 18, 9767–9788, https://doi.org/10.5194/acp-18-9767-2018, 2018. a, b, c, d, e, f, g, h, i, j, k, l, m, n, o
EDGAR: Emission Database for Global Atmospheric Research, available at: http://edgar.jrc.ec.europa.eu/htap_v2/index.php?SECURE=123 (last access: 10 June 2017), 2010. a
Fountoukis, C. and Nenes, A.: Continued development of a cloud droplet formation parameterization for global climate models, J. Geophys. Res., 110, D11212, https://doi.org/10.1029/2004JD005591, 2005. a
Fountoukis, C. and Nenes, A.: ISORROPIA II: a computationally efficient thermodynamic equilibrium model for aerosols, Atmos. Chem. Phys., 7, 4639-4659, https://doi.org/10.5194/acp-7-4639-2007, 2007. a, b, c, d
GlobCover: GlobCover Land Cover Map – European Space Agency GlobCover Project, available at: http://www.gelib.com/globcover-2009.htm, last access: 10 June 2017, 2009. a
Grams, C. M., Jones, S. C., Marsham, J. H., Parker, D. J., Haywood, J. M., and Heuveline, V.: The Atlantic Inflow to the Saharan heat low: Observations and Modelling, Q. J. Roy. Meteor. Soc., 136, 125–140, 2010. a
Haslett, S. L., Taylor, J. W., Deetz, K., Vogel, B., Babic, K., Kalthoff, N., Wieser, A., Dione, C., Lohou, F., Brito, J., Dupuy, R., Schwarzenboeck, A., and Coe, H.: The radiative impact of out-of-cloud aerosol hygroscopic growth during the summer monsoon in southernWest Africa, Atmos. Chem. Phys. Discuss., https://doi.org/10.5194/acp-2018-805, in review, 2018. a, b
Hennig, T., Massling, A., Brechtel, F. J., and Wiedensohler, A.: A Tandem DMA for highly temperature-stabilized hygroscopic particle growth measurements between 90% and 98% relative humidity, Aerosol Sci., 36, 1210–1223, 2005. a
Hill, P. G., Allan, R. P., Chiu, J. C., Bodas-Salcedo, A., and Knippertz, P.: Quantifying the Contribution of Different Cloud Types to the Radiation Budget in Southern West Africa, J. Climate, 31, 5273–5291, https://doi.org/10.1175/JCLI-D-17-0586.1, 2018. a
Hsu, N. C., Lee, J., Sayer, A. M., Carletta, N., Chen, S.-H., Tucker, C. J., Holben, B. N., and Tsay, S.-C.: Retrieving near-global aerosol loading over land and ocean from AVHRR, J. Geophys. Res., 122, 9968–9989, 2017. a
HWSD: HWSD (FAO/IIASA/ISRIC/ISSCAS/JRC), 2012: Harmonized World Soil Database (version 1.2), FAO, Rome, Italy and IIASA, Laxenburg, Austria, 2012. a
Jung, J., Lee, H., Kim, Y. J., Liu, X., Zhang, Y., Gu, J., and Fan, S.: Aerosol chemistry and the effect of aerosol water content on visibility impairment and radiative forcing in Guangzhou during the 2006 Pearl River Delta campaign, J. Environ. Manage., 90, 3231–3244, 2009. a, b, c
Kalthoff, N., Lohou, F., Brooks, B., Jegede, G., Adler, B., Babic, K., Dione, C., Ajao, A., Amekudzi, L. K., Aryee, J. N. A., Ayoola, M., Bessardon, G., Danuor, S. K., Handwerker, J., Kohler, M., Lothon, M., Pedruzo-Bagazgoitia, X., Smith, V., Sunmonu, L., Wieser, A., Fink, A. H., and Knippertz, P.: An overview of the diurnal cycle of the atmospheric boundary layer during the West African monsoon season: results from the 2016 observational campaign, Atmos. Chem. Phys., 18, 2913–2928, https://doi.org/10.5194/acp-18-2913-2018, 2018. a, b, c
Knippertz, P., Fink, A. H., Deroubaix, A., Morris, E., Tocquer, F., Evans, M. J., Flamant, C., Gaetani, M., Lavaysse, C., Mari, C., Marsham, J. H., Meynadier, R., Affo-Dogo, A., Bahaga, T., Brosse, F., Deetz, K., Guebsi, R., Latifou, I., Maranan, M., Rosenberg, P. D., and Schlueter, A.: A meteorological and chemical overview of the DACCIWA field campaign in West Africa in June–July 2016, Atmos. Chem. Phys., 17, 10893–10918, https://doi.org/10.5194/acp-17-10893-2017, 2017. a
Kuang, Y., Zhao, C. S., Tao, J. C., and Ma, N.: Diurnal variations of aerosol optical properties in the North China Plain and their influences on the estimates of direct aerosol radiative effect, Atmos. Chem. Phys., 15, 5761–5772, https://doi.org/10.5194/acp-15-5761-2015, 2015. a, b
Lana, A., Bell, T. G., Simó, R., Vallina, S. M., Ballabrera-Poy, J., Kettle, A. J., Dachs, J., Bopp, L., Saltzman, E. S., Stefels., J., Johnson, J. E., and Liss, P. S.: An updated climatology of surface dimethylsulfide concentrations and emission fluxes in the global ocean, Global Biogeochem. Cy., 25, G1004, https://doi.org/10.1029/2010GB003850, 2011. a
Liu, P. F., Zhao, C. S., Göbel, T., Hallbauer, E., Nowak, A., Ran, L., Xu, W. Y., Deng, Z. Z., Ma, N., Mildenberger, K., Henning, S., Stratmann, F., and Wiedensohler, A.: Hygroscopic properties of aerosol particles at high relative humidity and their diurnal variations in the North China Plain, Atmos. Chem. Phys., 11, 3479–3494, https://doi.org/10.5194/acp-11-3479-2011, 2011. a, b, c, d
Lundgren, K.: Direct Radiative Effects of Sea Salt on the Regional Scale, Institut für Meteorologie und Klimaforschung, Karlsruher Institut für Technologie, Dissertation, 2010. a
Lundgren, K., Vogel, B., Vogel, H., and Kottmeier, C.: Direct radiative effects of sea salt for the Mediterranean region under conditions of low to moderate wind speeds, J. Geophys. Res., 118, 1906–1923, 2013. a, b
Ma, N., Zhao, C. S., Nowak, A., Müller, T., Pfeifer, S., Cheng, Y. F., Deng, Z. Z., Liu, P. F., Xu, W. Y., Ran, L., Yan, P., Göbel, T., Hallbauer, E., Mildenberger, K., Henning, S., Yu, J., Chen, L. L., Zhou, X. J., Stratmann, F., and Wiedensohler, A.: Aerosol optical properties in the North China Plain during HaChi campaign: an in-situ optical closure study, Atmos. Chem. Phys., 11, 5959–5973, https://doi.org/10.5194/acp-11-5959-2011, 2011. a
Maranan, M. and Fink, A.: Radiosonde – All sites – SEDOO OMP, https://doi.org/10.6096/baobab-dacciwa.1656, 2016. a
Mari, C. H., Cailley, G., Corre, L., Saunois, M., Attié, J. L., Thouret, V., and Stohl, A.: Tracing biomass burning plumes from the Southern Hemisphere during the AMMA 2006 wet season experiment, Atmos. Chem. Phys., 8, 3951–3961, https://doi.org/10.5194/acp-8-3951-2008, 2008. a, b
Matsuki, A., Quennehen, B., Schwarzenboeck, A., Crumeyrolle, S., Venzac, H., Laj, P., and Gomes, L.: Temporal and vertical variations of aerosol physical and chemical properties over West Africa: AMMA aircraft campaign in summer 2006, Atmos. Chem. Phys., 10, 8437–8451, https://doi.org/10.5194/acp-10-8437-2010, 2010. a
Maßling, A., Wiedensohler, A., Busch, B., Neusüß, C., Quinn, P., Bates, T., and Covert, D.: Hygroscopic properties of different aerosol types over the Atlantic and Indian Oceans, Atmos. Chem. Phys., 3, 1377–1397, https://doi.org/10.5194/acp-3-1377-2003, 2003. a
MOZART: MOZART-4/GEOS-5 forecasts, National Center for Atmospheric Research (NCAR), University Corporation for Atmospheric Research, Atmospheric Chemistry Observations & Modeling, available at: https://www.acom.ucar.edu/acresp/AMADEUS/mz4_output/chemfcst/, last access: 30 July 2017. a
Philipps, V. T. J., DeMott, P. J., and Andronache, C.: An Empirical Parameterization of Heterogeneous Ice Nucleation for Multiple Chemical Species of Aerosol, J. Atmos. Sci., 65, 2757–2783, 2008. a
R: R Core Team, R: A Language and Environment for Statistical Computing, R Foundation for Statistical Computing, Vienna, Austria, available at: http://www.R-project.org/ (last access: 9 August 2017), 2013. a
Redelsperger, J.-L., Thorncroft, C. D., Diedhiou, A., Lebel, T., Parker, D. J., and Polcher, J.: African Monsoon Multidisciplinary Analysis – An International Research Project and Field Campaign, B. Am. Meteorol. Soc., 87, 1739–1746, 2006. a
Rieger, D., Steiner, A., Bachmann, V., Gasch, P., Förstner, J., Deetz, K., Vogel, B., and Vogel, H.: Impact of the 4 April 2014 Saharan dust outbreak on the photovoltaic power generation in Germany, Atmos. Chem. Phys., 17, 13391–13415, https://doi.org/10.5194/acp-17-13391-2017, 2017. a
Riemer, N.: Numerische Simulationen zur Wirkung des Aerosols auf die troposphärische Chemie und die Sichtweite, Wissenschaftliche Berichte des Instituts für Meteorologie und Klimaforschung der Universität Karlsruhe, Dissertation, 2002. a
Riemer, N., Vogel, H., Vogel, B., and Fiedler, F.: Modeling aerosols of the mesoscale-y: Treatment of soot aerosols and its radiative effects, J. Geophys. Res., 108, 4601, https://doi.org/10.1029/2003JD003448, 2003. a
Ritter, B. and Geleyn, J.-F.: A Comprehensive Radiation Scheme for Numerical Weather Prediction Models with Potential Application in Climate Simulations, Mon. Weather Rev., 129, 303–325, 1992. a
Schraff, C. and Hess, R.: COSMO Documentation Part III – Data assimilation, 89–90, avilable at: http://www.cosmo-model.org/content/model/documentation/core/cosmoAssim.pdf (last access: 28 August 2018), 2012. a
Schrage, J. M. and Fink, A. H.: Nocturnal Continental Low-Level Stratus over Tropical West Africa: Observations and Possible Mechanisms Controlling Its Onset, Mon. Weather Rev., 140, 1794–1809, 2012. a
Schuster, R., Fink, A. H., and Knippertz, P.: Formation and Maintenance of Nocturnal Low-Level Stratus over the Southern West African Monsoon Region during AMMA 2006, J. Atmos. Sci., 70, 2337–2355, 2013. a
Seifert, A. and Beheng, K. D.: A two-moment cloud microphysics parameterization for mixed-phase clouds. Part 1: Model description, Meteor. Atmos. Phys., 92, 45–66, 2006. a
Seinfeld, J. H. and Pandis, S. N.: Atmospheric Chemistry and Physics, From Air Polution to Climate Change, John Wiley & Sons, Inc., Hoboken, New Jersey, 2, 449–450, 2006. a
Stokes, R. H. and Robinson, R. A.: Interactions in aqueous nonelectrolyte solutions. I. Solute-solvent equilibria, J. Phys. Chem., 70, 2126–2130, 1966. a, b
Tegen, I., Hollrig, P., Chin, M., Fung, I., Jacob, D., and Penner, J.: Contribution of different aerosol species to the global aerosol extinction optical thickness: Estimates from model results, J. Geophys. Res., 102, 23895–23915, 1997. a
van der Linden, R., Fink, A. H., and Redl, R.: Satellite-based climatology of low-level continental clouds in southern West Africa during the summer monsoon season, J. Geophys. Res., 120, 1186–1201, 2015. a
Vogel, B., Vogel, H., Bäumer, D., Bangert, M., Lundgren, K., Rinke, R., and Stanelle, T.: The comprehensive model system COSMO-ART – Radiative impact of aerosol on the state of the atmosphere on the regional scale, Atmos. Chem. Phys., 9, 8661–8680, https://doi.org/10.5194/acp-9-8661-2009, 2009. a, b, c, d
Walter, C., Freitas, S. R., Kottmeier, C., Kraut, I., Rieger, D., Vogel, H., and Vogel, B.: The importance of plume rise on the concentrations and atmospheric impacts of biomass burning aerosol, Atmos. Chem. Phys., 16, 9201–9219, https://doi.org/10.5194/acp-16-9201-2016, 2016. a
Weimer, M., Schröter, J., Eckstein, J., Deetz, K., Neumaier, M., Fischbeck, G., Hu, L., Millet, D. B., Rieger, D., Vogel, H., Vogel, B., Reddmann, T., Kirner, O., Ruhnke, R., and Braesicke, P.: An emission module for ICON-ART 2.0: implementation and simulations of acetone, Geosci. Model Dev., 10, 2471–2494, https://doi.org/10.5194/gmd-10-2471-2017, 2017. a
Zieger, P., Väisänen, O., Corbin, J. C., Partridge, D. G., Bastelberger, S., Mousavi-Fard, M., Rosati, B., Gysel, M., Krieger, U. K., Leck, C., Nenes, A., Riipinen, I., Virtanen, A., and Salter, M. E.: Revising the hygroscopicity of inorganic sea salt particles, Nat. Commun., 8, 15883, https://doi.org/10.1038/ncomms15883, 2017. a
- Abstract
- Introduction
- Model framework and setup
- Quantities affecting the ALWC
- ALWC impact on radiative transfer
- Conclusions
- Data availability
- Appendix A: COSMO-ART model configuration
- Appendix B: Evaluation of RH vertical profiles
- Appendix C: Spatiotemporally averaged profiles of aerosol mass concentration on 2–3 July 2016
- Appendix D: Aerosol dry and wet diameters on 3 July 2016, 06:00 UTC
- Appendix E: Realization-related cloud property differences on 2–3 July 2016
- Appendix F: ALWC–radiation relationship on 6–7 July 2016
- Author contributions
- Competing interests
- Special issue statement
- Acknowledgements
- References