the Creative Commons Attribution 4.0 License.
the Creative Commons Attribution 4.0 License.
 | 08 Oct 2018
The impacts of regional shipping emissions on the chemical characteristics of coastal submicron aerosols near Houston, TX
Benjamin C. Schulze
Henry W. Wallace
Alexander T. Bui
James H. Flynn
Matt H. Erickson
Sergio Alvarez
Sascha Usenko
Rebecca J. Sheesley
Robert J. Griffin
The air quality of the Texas Gulf Coast region historically has been influenced heavily by regional shipping emissions. However, the effects of the recently established North American Emissions Control Area on aerosol concentrations and properties in this region are presently unknown. In order to better understand the current sources and processing mechanisms influencing coastal aerosol near Houston, a high-resolution time-of-flight aerosol mass spectrometer (HR-ToF-AMS) was deployed for 3 weeks at a coastal location during May–June 2016. Total mass loadings of organic and inorganic non-refractory aerosol components during onshore flow periods were similar to those published before establishment of the regulations. Based on estimated methanesulfonic acid (MSA) mass loadings and published biogenic MSA / non-sea-salt sulfate (nss-SO4) ratios, an average of over 75 % of the observed nss-SO4 was from anthropogenic sources, predominantly shipping emissions. Mass spectral analysis indicated that for periods with similar backward-trajectory-averaged meteorological conditions, air masses influenced by shipping emissions had an increased mass fraction of ions related to carboxylic acids and larger oxygen-to-carbon ratios than those that avoided shipping lanes, suggesting that shipping emissions increase marine organic aerosol (OA) oxidation state. Amine fragment mass loadings were correlated positively with anthropogenic nss-SO4 during onshore flow, implying anthropogenic–biogenic interaction in marine OA production. Model calculations also suggest that advection of shipping-derived aerosol may enhance inland aqueous-phase secondary OA production. These results imply a continuing role of shipping emissions on aerosol properties over the Gulf of Mexico and suggest that further regulation of shipping fuel sulfur content will reduce coastal submicron aerosol mass loadings near Houston.
- Article
(18764 KB) - Full-text XML
-
Supplement
(5302 KB) - BibTeX
- EndNote


Seaborne trade is a relatively inexpensive and efficient mechanism for transporting goods across the globe (IMO, 2012). As a result, such transportation is thought to account for more than 90 % of global trade volume (Eyring et al., 2010; IMO, 2012) and has been growing rapidly in the past 2 decades (Lack et al., 2009; Eyring et al., 2010; Tournadre, 2014; Johansson et al., 2017). As large commercial shipping vessels historically have had little or inconsistent regulation in international waters, they frequently burn low-quality residual fuel oils, leading to considerable emissions of sulfur dioxide (SO2), nitrogen oxides (NOx), and particulate matter (PM) (Lack et al., 2009; Murphy et al., 2009; Czech et al., 2017). Recently, increasing attention has been paid to the impact of these emissions on ambient PM mass loadings in coastal areas, with notable contributions in Europe (Viana et al., 2014, and references therein; Aksoyoglu et al., 2016), Asia (Zhao et al., 2012; Liu et al., 2016) and the United States (Vutukuru and Dabdub, 2008; Agrawal et al., 2009). Coastal populations exposed to these emissions are subsequently affected by numerous negative health impacts. Corbett et al. (2007) estimated that shipping activity was responsible for 60 000 global premature mortalities annually. More recent studies have confirmed links between shipping emissions and increased hospitalizations (Tian et al., 2013).
The Port of Houston is the second largest in the United States (U.S.) by tonnage (Port of Houston, 2017), and the Gulf of Mexico has a high density of marine vessel emissions relative to many other marine locations (Tournadre, 2014; Johansson et al., 2017); however, relatively little research has aimed to characterize the impact of shipping emissions on Houston air quality. During the Texas Air Quality Study and Gulf of Mexico Atmospheric Composition and Climate Study 2006, measurements on board the R/V Brown were used to characterize aerosol sources over the Gulf of Mexico (Bates et al., 2008; Russell et al., 2009). Measured submicron aerosol sulfate (SO4) mass loadings during periods of onshore flow were significantly larger than expected for a marine environment, leading Bates et al. (2008) to conclude that shipping emissions contributed heavily to total submicron aerosol mass. Russell et al. (2009) further determined that an “oil combustion/refining” organic factor accounted for 33 %–68 % of organic aerosol (OA) mass during onshore flow periods. Using a large-scale three-dimensional air quality model, Caiazzo et al. (2013) calculated that in 2005 marine vessel emissions increased annual average PM mass loadings across the Texas Gulf Coast by ∼0.5 to 1 µg m−3, leading to 645 estimated premature mortalities in Texas.
Recent concerns over the health impacts of marine vessel emissions led to the establishment of the North American Emissions Control Area (ECA; U.S. Environmental Protection Agency (EPA), 2010). Prior to establishment of the ECA, multiple studies demonstrated that shipping emissions of PM were related to fuel sulfur content (FSC) (Kasper et al., 2007; Lack et al., 2009, and references therein), leading to the requirement that shipping vessels within 200 nautical miles of the U.S. and Canadian coast reduce their FSC from the commonly utilized 3 %–4 % (by mass) to only 1 %. In 2015, the limit was reduced to 0.1 % (Zetterdahl et al., 2017). In order to comply with these regulations, marine vessels typically switch from low-grade heavy fuel oil to marine gas oil or marine diesel oil at the ECA boundary; however, low-FSC residual fuels have also recently become available (Wan et al., 2016; Czech et al., 2017). Numerous studies have demonstrated that such fuel switching dramatically reduces emissions of SO2, SO4, primary OA (POA), and black carbon (Lack et al., 2011; Browning et al., 2012; Tao et al., 2013; Zetterdahl et al., 2017).
Using the U.S. Interagency Monitoring of Protected Visual Environments network and positive matrix factorization (PMF) modeling, Kotchenruther (2016) determined that the average decrease in annual PM2.5 (that with diameters less than or equal to 2.5 µm) from residual fuel combustion (i.e., shipping emissions) in U.S. coastal locations due to establishment of the ECA (i.e., pre-2012 to 2016) was 74.1 %. However, at two sites along the Gulf Coast (located in Louisiana and Florida), the average reduction was only 35 %–50 % (Kotchenruther, 2016). While the reason for the difference between the gulf sites and the rest of the country is currently unclear, it is nevertheless evident that the implementation of the ECA may have drastically changed the speciation and total mass loading of aerosol over the Gulf of Mexico, presenting the need for further research on this source.
Shipping emissions also may have numerous secondary effects on marine aerosol. Models indicate that shipping-related NOx emissions likely elevate hydroxyl radical (OH) concentrations within the marine boundary layer (MBL) (Chen et al., 2005; Kim et al., 2009, 2013), potentially impacting the oxidation state of marine OA. Furthermore, production of the two most commonly identified components of marine secondary OA (SOA), methanesulfonic acid (MSA) and dimethyl/diethylamines (Facchini et al., 2008; Claeys et al., 2009; Rinaldi et al., 2010), may be enhanced in the presence of shipping emissions (Gaston et al., 2010; Sorooshian et al., 2015a). Finally, shipping-related SO4 should increase submicron mass loadings of aerosol liquid water (ALW), which may subsequently impact aqueous processing of water-soluble organics (Carlton and Turpin, 2013). These effects are difficult to model on a global scale due to the complexities of accurately simulating the photochemistry and physical transport of shipping plumes (Kim et al., 2009), making field measurements useful to evaluate these hypotheses.
In the present study, 3 weeks of coastal air measurements were performed near Houston, TX, to investigate the impact of marine vessel emissions on ambient aerosol mass and composition. Specific focus was placed on apportioning anthropogenic and biogenic sources of SO4; attributing anthropogenic SO4 to marine vessel emissions; investigating links between marine vessel emissions and measured OA; and exploring whether these emissions appear to influence OA composition, amine/MSA aerosol formation, or ALW.
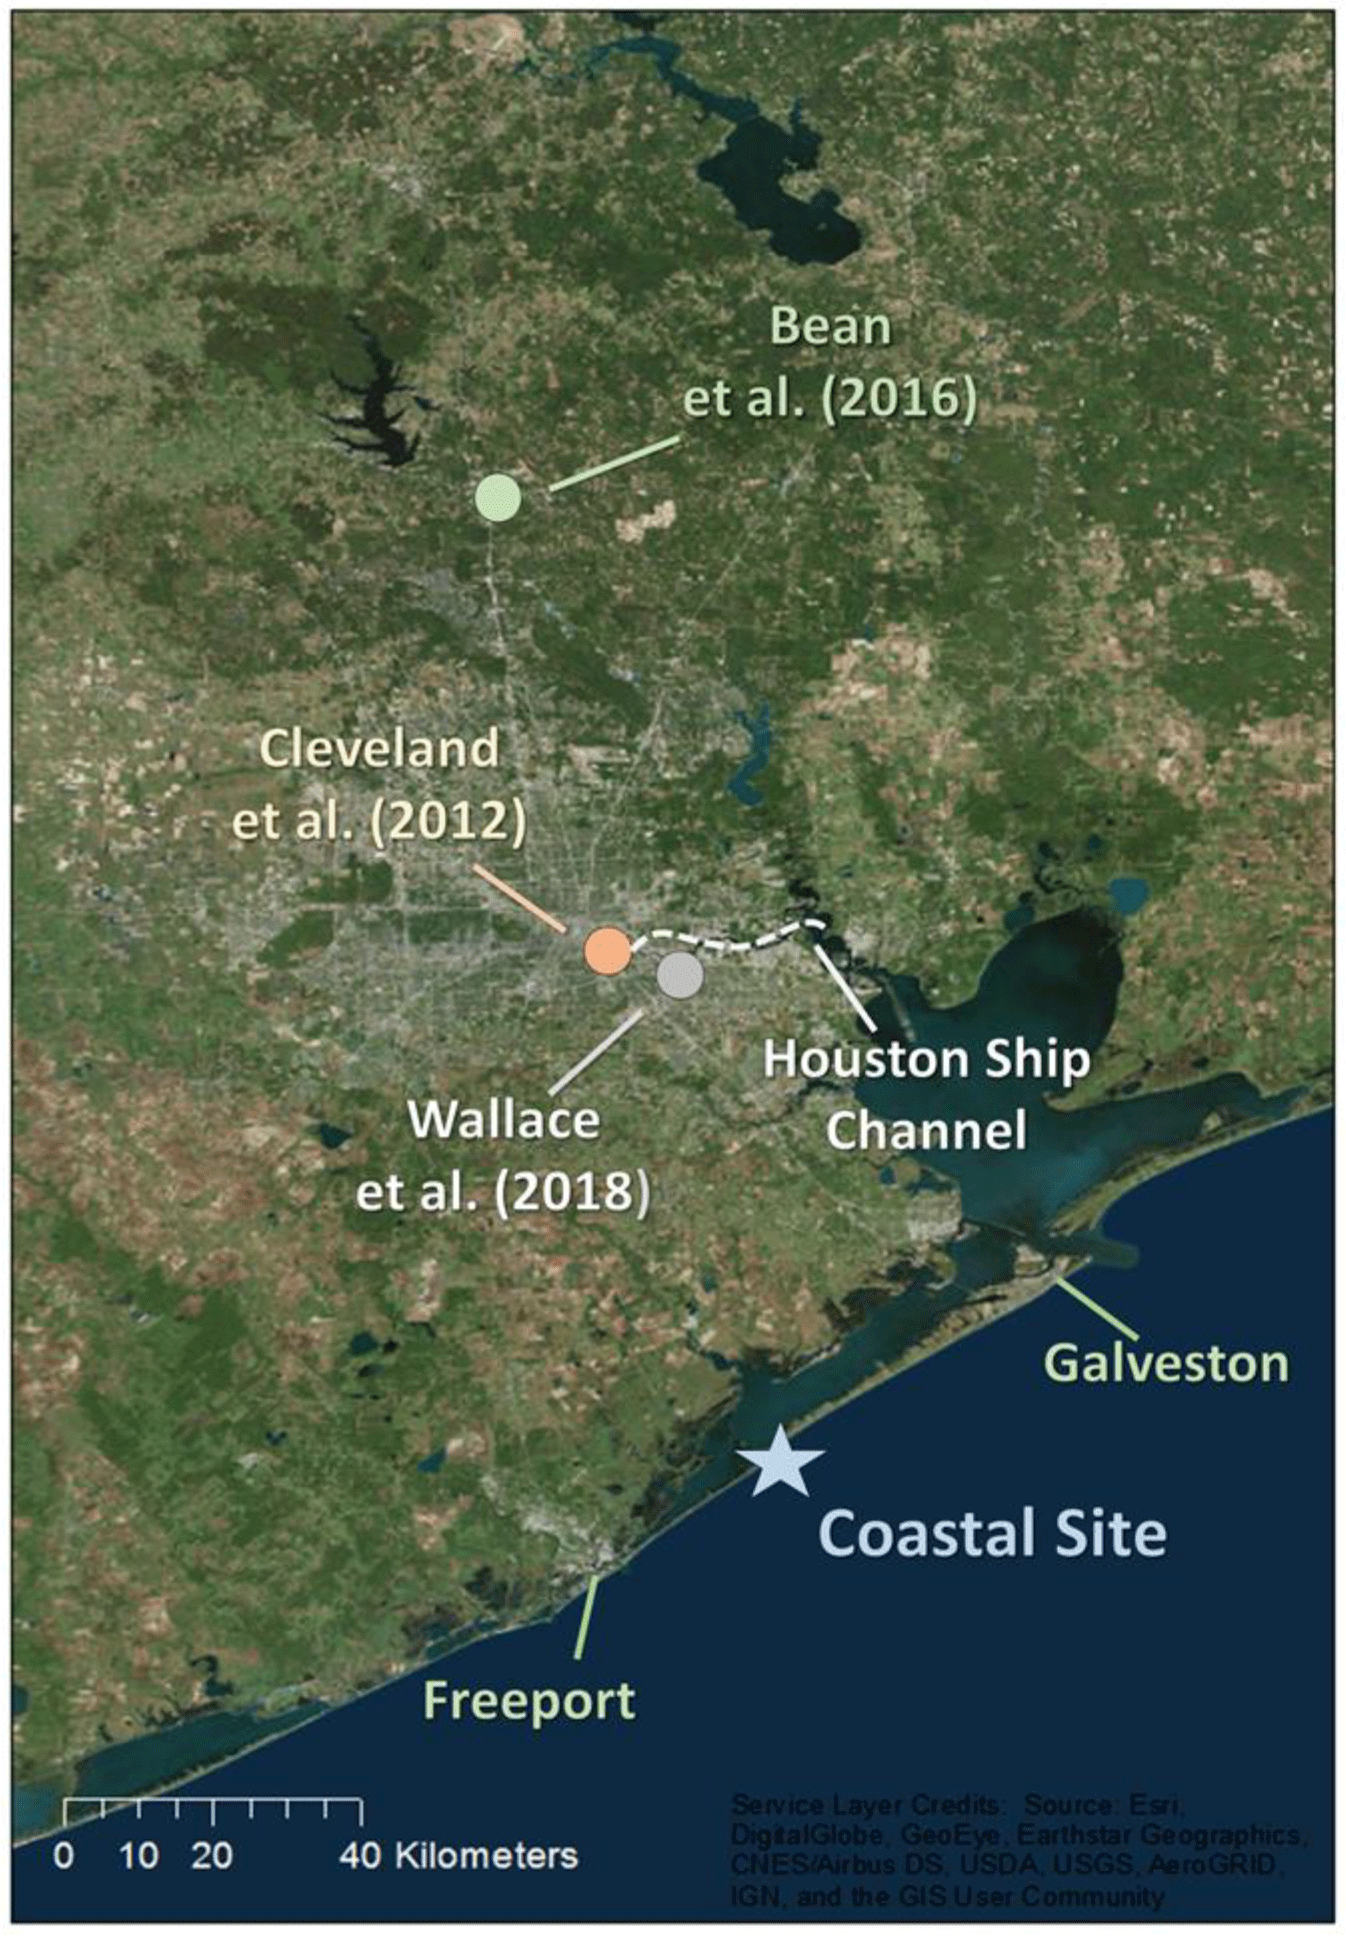
Figure 1Map depicting the Houston region, the coastal study site (star), and the location of recent stationary campaigns that characterized aerosol dynamics in Houston.
2.1 Sampling site characterization
Atmospheric measurements were conducted during 24 May–14 June 2016, at a private coastal home southwest of Galveston, Texas (29.074∘ N, 95.125∘ W). Figure 1 presents an overview of the sampling location. The site is approximately 75 km directly south of the Houston Ship Channel (HSC) and is therefore a similar distance from Houston's urban core. In addition, the primary inlet to Galveston Bay used for commercial shipping is about 45 km to the northeast. The nearest road – Highway 257, just north of the site – connects the cities of Galveston and Freeport, TX, and receives relatively little traffic. As a result, this location is likely to be less influenced by primary anthropogenic emissions than recent campaigns in Houston that took place closer to the urban core (Cleveland et al., 2012; Bean et al., 2016; Leong et al., 2017; Wallace et al., 2018). Instruments including a high-resolution time-of-flight aerosol mass spectrometer (HR-ToF-AMS, Aerodyne, Inc.) and those measuring traces gases and meteorological parameters were housed inside the University of Houston/Rice University Mobile Air Quality Laboratory (MAQL), which was stationed outside of the private home and has been described previously (Leong et al., 2017). As measurements were performed during a single 3-week period, presented results should be viewed with this limitation in mind. Ultimately, longer-time-frame studies are warranted to test whether results presented here are consistently observed.
2.2 HR-ToF-AMS operation
The chemical composition of non-refractory submicron PM (NR-PM1) was determined through the use of a HR-ToF-AMS (DeCarlo et al., 2006). Numerous detailed descriptions of HR-ToF-AMS operation can be found elsewhere (DeCarlo et al., 2006; Canagaratna et al., 2007). Air flow was drawn into the HR-ToF-AMS through a 2.5 µm cut diameter Teflon®-coated cyclone located on top of the MAQL mast approximately 6 m above ground level. Incoming air is transmitted through a 100 µm critical orifice, after which particles are focused into a beam through the use of an aerodynamic lens and accelerated under high vacuum (10−5 Torr) into the sizing chamber. After passing the sizing chamber, non-refractory chemical components are flash-vaporized at approximately 600 ∘C and ionized at 70 eV. Ionized mass fragments are then directed into the time-of-flight mass spectral detection region. For this study, the HR-ToF-AMS was operated in V mode (higher signal, less mass-to-charge (m∕z) resolution compared to the alternative W mode), and data were collected over 80 s intervals. A Nafion dryer was placed upstream of the HR-ToF-AMS inlet to maintain a sampling line relative humidity (RH) below 40 %.
2.3 HR-ToF-AMS data analysis
The HR-ToF-AMS data were analyzed with the SQUIRREL v 1.57I and PiKA v 1.16I (D. Sueper, University of Colorado-Boulder) software packages within Igor Pro (Wavemetrics, Inc.). The collection efficiency (CE) of the HR-ToF-AMS, which is influenced by sampling line RH as well as particle composition, was determined using the composition-dependent calculator within the SQUIRREL and PiKA software packages (Middlebrook et al., 2011). This method produced a CE of 0.5 for the majority of the campaign (89 % of the time). High-resolution analysis was performed on each ion in the m∕z range 10–125, and elemental analysis of organic composition was performed using the improved-ambient method (Canagaratna et al., 2015). The ionization efficiency of the HR-ToF-AMS with respect to nitrate (NO3) was calibrated before and after the campaign using 350 nm ammonium nitrate (NH4NO3) particles following standard procedures. In order to calculate campaign-averaged detection limits, filtered air was sampled every 2 days for approximately 30 min at a time, and the detection limit was calculated as 3 times the standard deviation of the filter measurements. Detection limits are provided in Table S1 in the Supplement.
2.4 Positive matrix factorization
Positive matrix factorization analysis (Paatero and Tapper, 1994) was performed on the high-resolution HR-ToF-AMS mass spectral dataset in order to further investigate potential sources and transformation processes of measured OA. The PMF technique has been applied extensively in urban (Ulbrich et al., 2009; Ng et al., 2010), rural/downwind (Crippa et al., 2014, and references therein), and coastal locations (Hildebrandt et al., 2010, 2011; Schmale et al., 2013) to characterize classes of compounds that constitute OA. The PMF model assumes that the time series of organic mass spectra can be divided into a number of temporally unvarying components. These components, defined by their fixed mass spectra, contribute varying amounts of organic mass to the total organic signal at each time. Details on PMF and the resulting factors are included in the Supplement.
2.5 HYSPLIT backward-trajectory calculation
Analysis of air mass history is often a useful tool for characterizing likely sources and processes affecting measured aerosol composition. As a result, 120 h backward trajectories were calculated at heights of 100, 200, 300, 400, and 500 m using the Hybrid Single-Particle Lagrangian Integrated Trajectory (HYSPLIT) model (Draxler and Rolph, 2003) for every hour during the campaign. Meteorological data at a resolution of 12 km × 12 km were obtained from the North American Mesoscale Forecast System (NAMS) archive (https://ready.arl.noaa.gov/archives.php, last access: 30 August 2018) through the HYSPLIT software. Recorded meteorological parameters such as solar flux (W m−2), mixing-layer depth, and precipitation were averaged for each trajectory to provide insight into influences of photochemistry, mixing, and possible wet deposition during transport. In addition, the overall length of each 5-day trajectory was used to represent an average wind speed, as knowledge of historical wind speed is important for predictions concerning the influence of POA particles in ocean environments (Zorn et al., 2008; Russell et al., 2010; Ovadnevaite et al., 2011).
2.6 Weighted potential source contribution function
In order to provide further insight into likely aerosol source regions during the campaign, the weighted potential source contribution function (WPSCF) was applied to the dataset. The WPSCF combines measured mass loadings of atmospheric species with air mass trajectories to determine probable source locations. The WPSCF method has been used to study regional sources of air pollutants at different receptor sites (Hopke et al., 1995; Zhu et al., 2011; Guo et al., 2014). For this study, the WPSCF analysis utilized HYSPLIT trajectories described previously. The spatial area covered by the trajectories was divided into a grid of 0.5∘ × 0.5∘ cells, and the number of trajectory segment end points located in each cell for five different starting heights (100, 200, 300, 400, and 500 m) was determined. Incorporation of multiple starting heights accounts for the general clockwise rotation of air mass backward trajectories with altitude. While these cell sizes are relatively small (typical values ∼0.5–2∘), this study was particularly focused on attribution of measured SO4 to specific locations within the Gulf of Mexico (i.e., shipping lanes), which requires a small cell size.
In order to calculate the WPSCF value for each cell, the total potential source contribution function (TPSCF) value is first calculated and then weighted. The value of the TPSCF function for a specific grid cell (i,j) is calculated using (Hopke et al., 1995; Guo et al., 2014)
where represents the total number of trajectory segment end points located within cell i,j for height k, while represents the number of these end points that also correspond to measured values of a specific species above a critical value, in this case the 75th percentile (Hopke et al., 1995; Guo et al., 2014).
In the case of highly variable air mass trajectories or strong local sources during a campaign, distant grid cells that were intersected by only a small number of trajectories may be incorrectly assumed to represent likely sources. To prevent this, a weighting function is applied to TPSCF values based on the value, with higher weight given to cells that were intersected by more trajectories. The weighting method, based on the power of the number of trajectories at a specific height, is (Guo et al., 2014)
where T represents the total number of trajectories calculated at each specific height. The WPSCF value is then calculated by applying the relevant weights to each cell.
2.7 MSA calibration
Methanesulfonic acid is widely regarded as a robust indicator of SOA production from marine sources (Facchini et al., 2008; Crippa et al., 2013; Schmale et al., 2013; Ovadnevaite et al., 2014). In addition, MSA is often the most abundant identifiable component of marine OA (Facchini et al., 2008; Claeys et al., 2009). Recent work has identified that MSA mass loadings can be quantified in near-real time by the HR-ToF-AMS provided that accurate instrument-specific calibrations are performed (Zorn et al., 2008; Ovadenvaite et al., 2014; Huang et al., 2017). As MSA fragments into both organic and inorganic SO4-containing ions within the HR-ToF-AMS, accurate mass prediction requires reconstruction of the compound based on knowledge of the fragmentation pattern in the specific instrument being used (Zorn et al., 2008). As such, calibrations were performed following the procedure of Ovadnevaite et al. (2014).
A 0.02 % aqueous solution of MSA (Sigma-Aldrich, >99.0 % purity) was nebulized by a TSI, Inc. atomizer (model 3076) and passed through a differential mobility analyzer (BMI, Inc.) to size-select particles 300 nm in mobility diameter. These particles were then measured by the HR-ToF-AMS. Mass spectra from two separate calibrations are provided in Fig. S13. While MSA fragments into a variety of ions within the HR-ToF-AMS (, CHS+, CH3, SO+, , etc.), the ion is thought to originate almost exclusively from MSA, as other organosulfate standards measured by the HR-ToF-AMS show negligible contributions to (Huang et al., 2015). Therefore, MSA mass loadings during the campaign were calculated based on the ratio of this ion to the total MSA mass measured during the calibrations (Huang et al., 2015, 2017). The average ratio measured during the two calibrations (18.18) was similar to that determined from the calibration of Huang et al. (2017) (23.81).
2.8 Distinction between anthropogenic and biogenic nss-SO4
The MSA measurements also allow estimation of the relative contributions of biogenic and anthropogenic (primarily due to shipping) sources of non-sea-salt sulfate (nss-SO4) in marine environments. In many studies attempting to apportion the impact of shipping emissions on measured aerosol mass, ratios of trace metals specific to heavy-fuel-oil combustion are used as tracers (Zhao et al., 2012; Viana et al., 2014; Kotchenruther, 2016). However, in cases where such data are unavailable, biogenic sulfur sources, based on the oxidation chemistry of dimethyl sulfide (DMS), should produce a latitude-specific biogenic MSA / nss-SO4 ratio, presenting a metric to apportion biogenic and anthropogenic nss-SO4 (Jung et al., 2014). Specifically, DMS oxidation, which primarily occurs through initial reaction with OH, can proceed through either an abstraction or addition pathway (Hynes et al., 1986). The addition pathway, which is favored at lower temperatures prevalent at higher latitudes, mainly produces dimethylsulfoxide and MSA. The abstraction pathway, favored in higher temperatures, primarily produces SO2 and therefore eventually nss-SO4 (Hynes et al., 1986; Jung et al., 2014). As a result, previous long-distance remote transoceanic cruises have observed significant latitudinal gradients in the MSA / nss-SO4 ratio in both the Atlantic and Pacific oceans (Jung et al., 2014; Huang et al., 2017), with consistently larger values at high latitudes.
As nss-SO4 measured in marine environments is often produced by a combination of anthropogenic and biogenic sources, multiple linear regression (MLR) analysis is often used to extract the biogenic MSA / nss-SO4 ratio from ambient marine aerosol data. The MLR technique assumes that marine nss-SO4 is produced from a biogenic source, which can be traced with MSA mass loadings (used as one predictor variable), and an anthropogenic source, which can be traced using concentrations of heavy metals emitted by shipping vessels (e.g., antimony) (used as the second predictor variable) (Savoie et al., 2002). Previously published agreement between measured and predicted nss-SO4 using the MLR method was robust (R2>0.7) (Savoie et al., 2002). For this study, the biogenic MSA / nss-SO4 ratio (0.053) determined by Savoie et al. (2002) using MLR at Bermuda was utilized to apportion biogenic versus anthropogenic sources of nss-SO4, as Bermuda is the closest location to our sampling site in terms of latitude (32∘ N at Bermuda versus 29∘ N at our sampling site). In addition to being collected at the closest location to our sampling site, the ratio extracted at Bermuda is the lowest reported ratio in the literature, to the authors' knowledge. A more recent study by Lin et al. (2012) quantified the biogenic MSA / nss-SO4 ratio of submicron marine aerosol using sulfur isotopic data at varying latitudes across the Atlantic Ocean. The authors reported ratios similar to or larger than 0.053 at all sampled latitudes. As a result, the application of other published ratios will only increase the fraction of nss-SO4 attributed to anthropogenic sources.
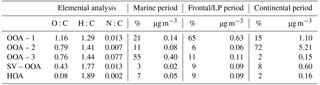
Table 1Aerosol (µg m−3) and trace gas (ppbv) characteristics (avg. ± SD) measured during each distinct period type of the campaign.

Table 2Elemental composition of each PMF factor and contributions to total OA during each period of the campaign.
However, as the biogenic MSA / nss-SO4 ratio was originally determined using samples of total suspended particulate matter (i.e., no size cutoff) application of the ratio to PM1 data should produce an upper-limit estimate of the anthropogenic fraction of marine nss-SO4. Briefly, as previous field and laboratory studies have noted that MSA solubility decreases with solution acidity (Kerminen et al., 1997; Jung et al., 2014), the presence of acidic sulfate aerosol can shift the size distribution of MSA towards larger, more alkaline particles relative to sulfate (a stronger acid) (Jung et al., 2014). This effect, if substantial, could cause the HR-ToF-AMS to report a lower observed MSA / nss-SO4 ratio than would be observed by an instrument measuring both submicron and super-micron PM. However, Saltzman et al. (1983) found that the size distributions of MSA and SO4 measured in the Gulf of Mexico were quite similar, with around 75 % of MSA and approximately 87 % of nss-SO4 contained within submicron particles, suggesting that the overall uncertainty resulting from this effect is small.
Quantification of anthropogenic nss-SO4 also requires that the contribution of sea salt sulfate (ss-SO4) be determined. Using laboratory calibrations, the ss-SO4 mass loading measured by the HR-ToF-AMS when sampling a sea salt standard (Lake Products Co., ASTM D1141) is approximately 26±2 % of the corresponding chloride mass loading. Using this ratio and measured chloride mass loadings during the campaign, ss-SO4 contributed only 0.4±0.4 % of the total SO4 mass loading. Therefore, to produce an estimate of anthropogenic nss-SO4, the HR-ToF-AMS estimate of MSA is divided by the biogenic MSA / nss-SO4 ratio published by Savoie et al. (2002) to produce a “biogenic” mass loading of nss-SO4. This amount is subtracted from the total nss-SO4 measured by the HR-ToF-AMS, and the remaining nss-SO4 is assumed to be anthropogenic. This technique could lead to underprediction of sea-salt sulfate mass loadings in the case of substantial chloride displacement by nitrate in the marine boundary layer. However, the near-detection-limit concentrations of nitrate measured during the marine period of the study (0.02±0.01 µg m−3) suggest that this possibility has at most a negligible influence on our results. Multiple lines of evidence described in Sect. 3.2 support the use of this technique.
2.9 Ancillary measurements
A variety of trace gases and meteorological parameters were measured during the campaign. All trace gas and meteorological data were measured with a 5 min averaging time. Individual NOx species (nitric oxide and nitrogen dioxide (NO2)) and total reactive gas-phase nitrogen were measured using high-sensitivity chemiluminescence monitors (AQD, Inc.). Ozone (O3) mixing ratios were measured with an ultraviolet absorption instrument (2BTech, Inc., model 205), and carbon monoxide mixing ratios were measured using high-resolution cavity-enhanced direct-absorption spectroscopy (Los Gatos Research, Inc.). Sulfur dioxide was measured with a pulsed fluorescence analyzer (ThermoFischer Scientific, model 43i). Ambient temperature, pressure, wind speed, and wind direction were measured using an RM Young meteorological station.
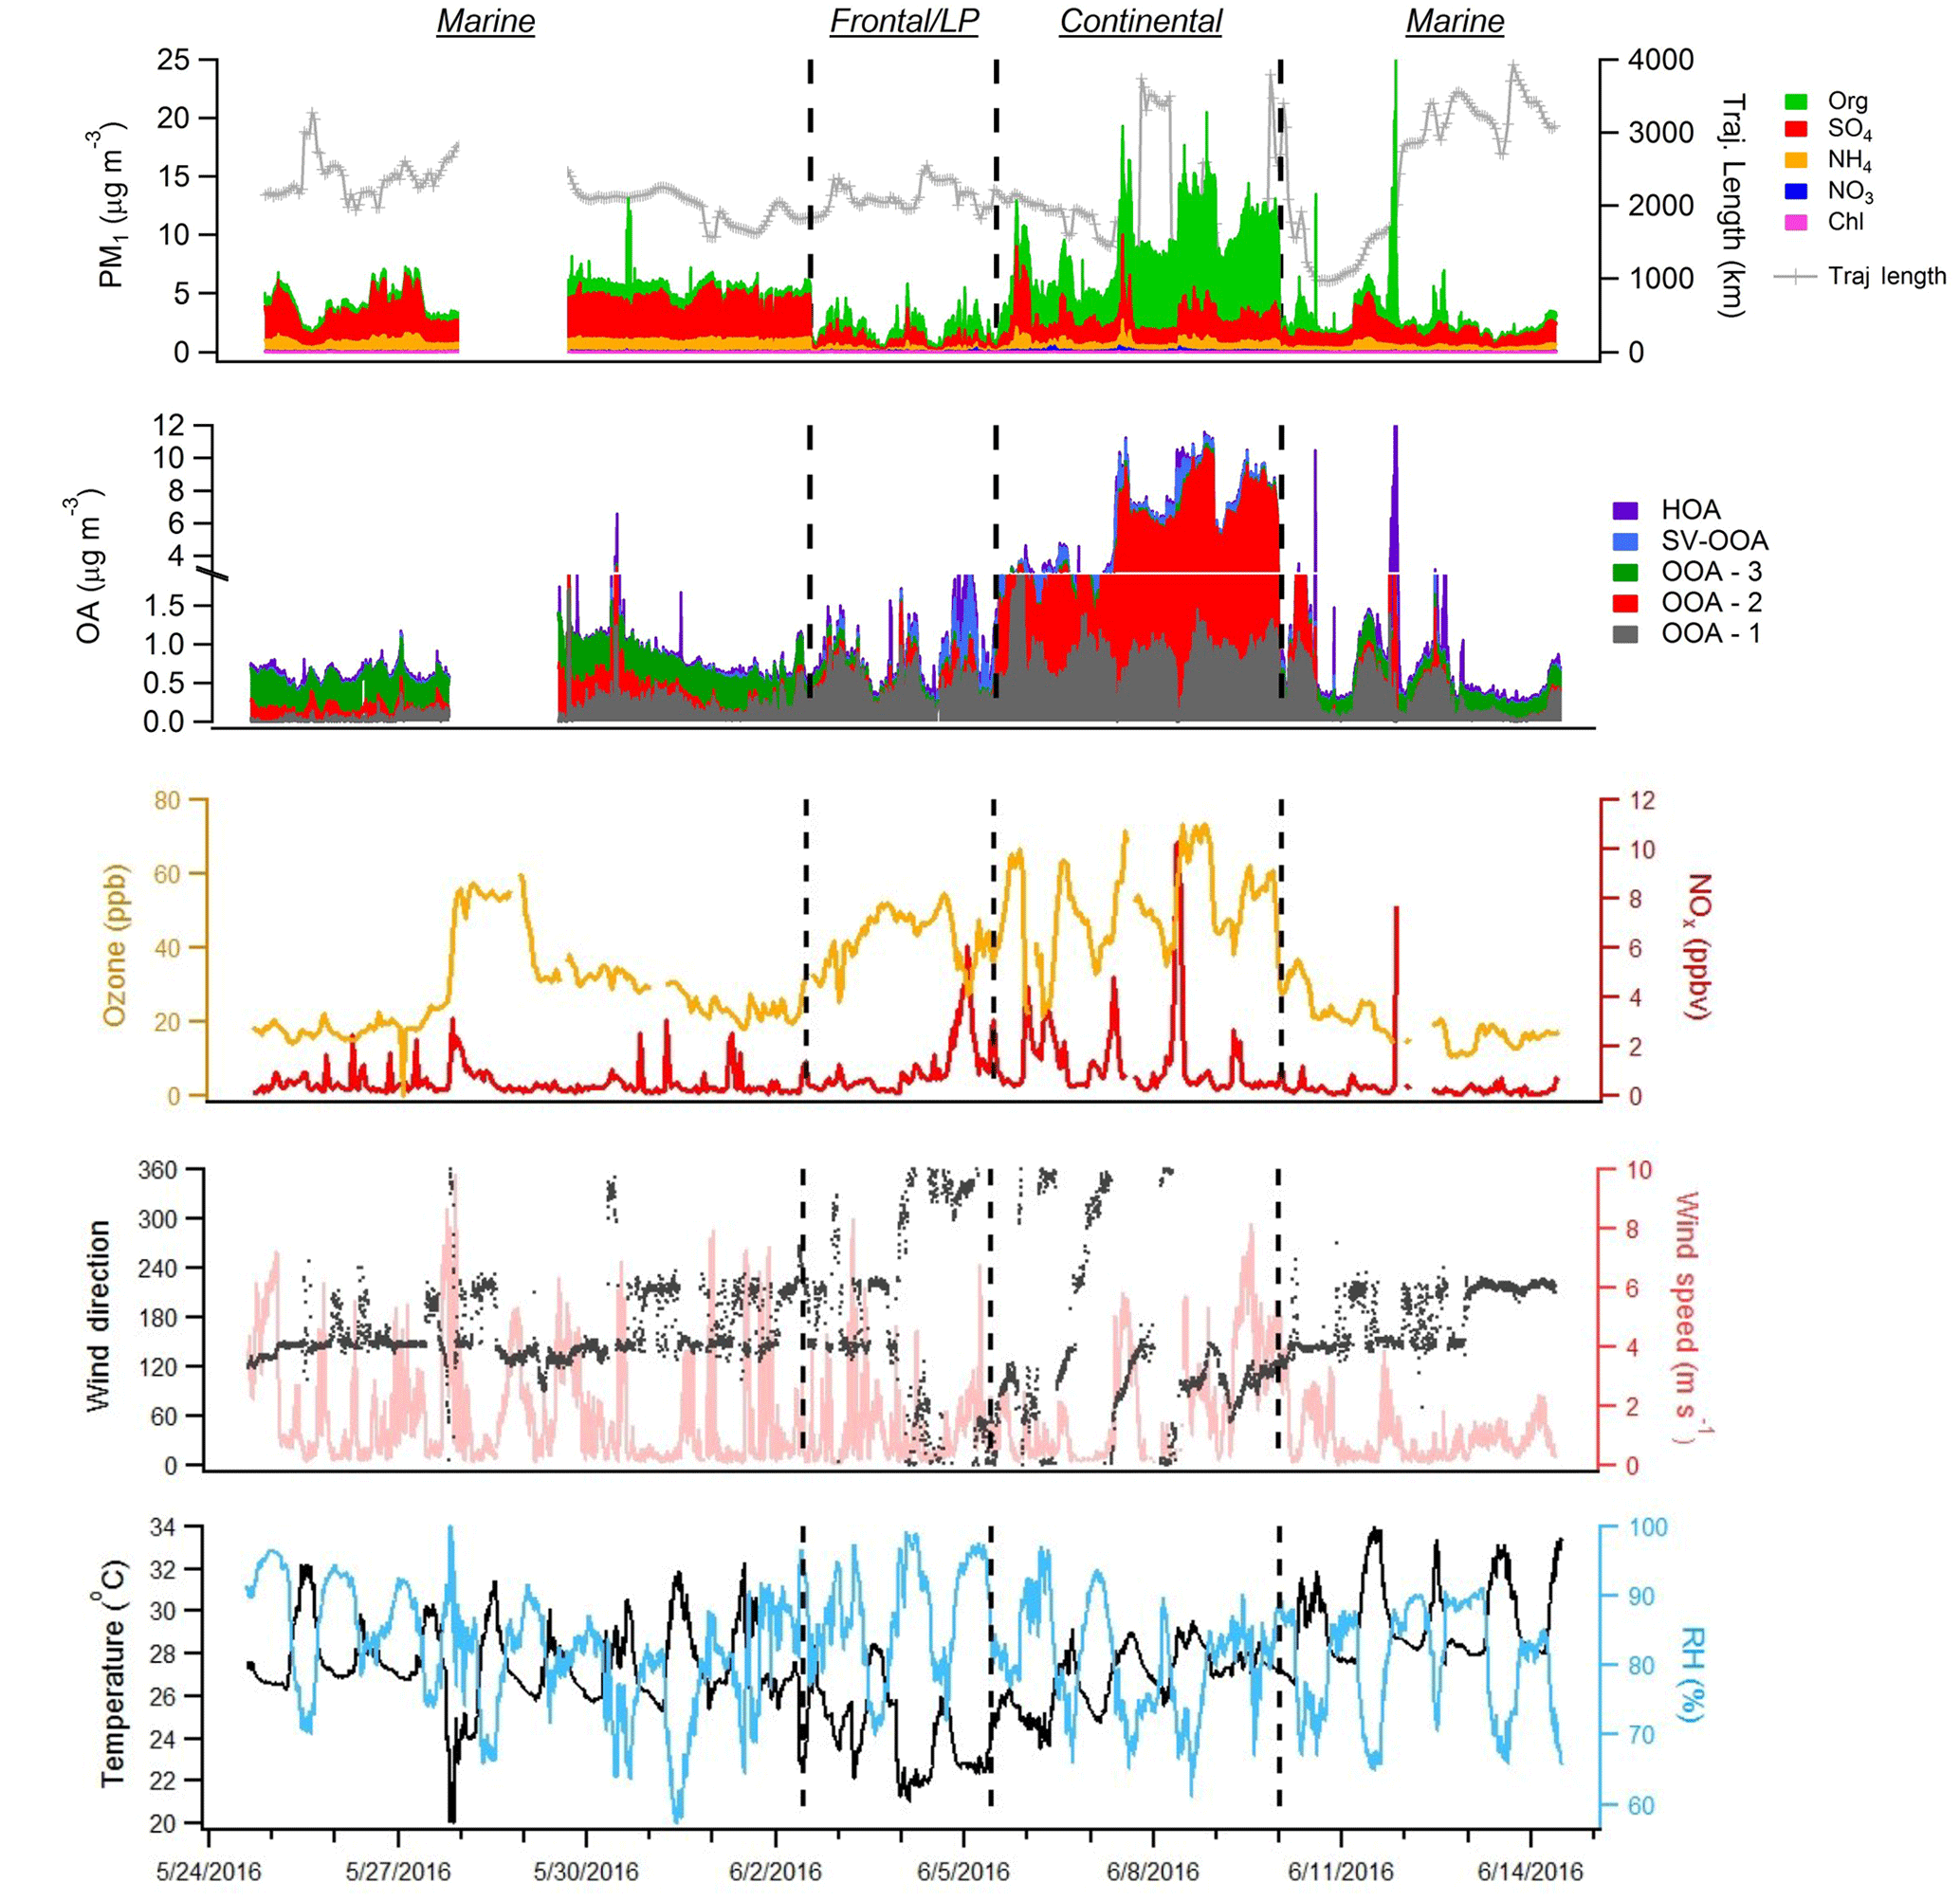
Figure 2From top to bottom, time series of major NR-PM1 species, extracted PMF factors, O3 and NO2, and meteorological variables (wind direction, wind speed, RH, and temperature) measured during the campaign. Dotted lines distinguish distinct time period types described in Sect. 3.1.
3.1 Campaign overview
Figure 2 displays the speciated aerosol mass loadings, PMF factor contributions, important trace gas concentrations, and meteorological conditions encountered during the campaign. Overall, the average NR-PM1 mass loading was 4.66±3.17 µg m−3 (1 standard deviation) and was dominated at times by either SO4 (44 % on average) or OA (42 %). As the measurements were performed in the early summer in close proximity to the coast, RH was relatively high (average: 81 %), conditions were generally sunny, and temperatures were warm (average: 27.3 ∘C). Examination of the aerosol time series data reveals three distinct period types. Marine periods are characterized by consistent onshore flow, while continental periods are characterized by offshore flow or daily land and sea breeze circulation patterns. A 3-day period influenced by the passage of two cold fronts and a low-pressure (LP) system that produced heavy cloud cover, intermittent rain, and a distinct aerosol diurnal profile was termed “frontal/LP.”

Figure 3Diurnal variation of NR-PM1 component average concentrations (a–c) and PMF factors (d–f) during the marine period (a, d), the frontal/LP period (b, e), and the continental period (c, f). The legends above (a–c) describe how mass loadings of specific components were adjusted to fit the figure. Note the different y-axis ranges applicable to each period type.
Each of these periods contained a unique dominant PMF factor resembling low-volatility oxygenated organic aerosol (OOA) (Ng et al., 2010), denoted as OOA-1, OOA-2, or OOA-3 (Fig. 3). An overview of the average aerosol and trace gas characteristics during each period is provided in Table 1, and a comparison to previous campaigns in the Houston region is shown in Fig. S14. While the extracted PMF factors are highlighted briefly below and summarized in Table 2, more detailed factor descriptions are included in the Supplement.
The majority of the campaign (∼12 days total), characterized by onshore flow conditions with wind directions generally between 120o and 240∘, was classified as “marine.” During these periods, which encompass 24 May–1 June and 10–14 June, aerosol mass loadings were relatively stable from day to day. Interestingly, average observed mass loadings were much larger in the first portion of the marine period (4.69 µg m−3) (24 May–1 June) than in the second (2.71 µg m−3) (10–14 June), despite similar local wind direction, O3, and meteorological conditions, implying that air mass history has a large influence on marine aerosol loadings. The observation of SO4 mass loadings much larger than 1 µg m−3, which is generally the maximum observed in remote marine locations, even during periods of high biological activity (Zorn et al., 2008; Rinaldi et al., 2010; Schmale et al., 2013; Ovadnevaite et al., 2014), supports either a major anthropogenic aerosol source in the Gulf of Mexico or an influence from continental recirculation; however, backward-trajectory analysis combined with an investigation of relevant source magnitudes, described in Sect. 3.3, points to a marine anthropogenic source. The average mass loading of SO4 plus NH4 (3.04 µg m−3) was similar to that measured during onshore flow by Bates et al. (2008) (3 µg m−3), despite recent regulations on shipping emissions, while measured OA mass loadings were larger during this study (0.72 µg m−3 versus 0.38 µg m−3 from Bates et al., 2008). The OA, which constituted 21 % of total mass, was highly oxidized (average oxygen-to-carbon ratio, O:C = 0.73), consistent with previous measurements of marine aerosols (Russell et al., 2009; Chang et al., 2011; Schmale et al., 2013). The average mass fraction of m∕z44 (f44), a metric used to describe the extent of OA oxidation, was 0.15, a value very similar to that observed by Russell et al. (2009) during marine flow conditions (0.16), suggesting that on average the oxidation state of marine OA over the Gulf of Mexico has not changed substantially since ECA implementation. However, as these comparisons are based on only 3–4 weeks of data collected during each of the two time periods, the results should be interpreted with this limitation in mind.
The light winds observed during the campaign suggest that little of the measured marine OA was the result of organic-enriched sea spray, as this production pathway generally requires significant whitecap coverage, which is typically only observed above wind speeds of 7–8 m s−1 (Gantt et al., 2011; Shank et al., 2012; Ovadnevaite et al., 2011; Schmale et al., 2013; Frossard et al., 2014). Local wind speeds were virtually never above 8 m s−1 (Fig. 2), and 5-day-averaged wind speeds calculated using total trajectory lengths were only >8 m s−1 for 4 % of the marine period. Potential major sources of OA therefore include secondary production through processing of biogenic volatile organic compounds (VOCs), as well as primary and secondary production from shipping emissions (Lack et al., 2009; Coggon et al., 2012). This hypothesis is supported by the fact that marine OA composition was dominated by a highly oxidized PMF factor, OOA-3 (O:C = 0.77; 55 % of OA on average) (Fig. S5), which was moderately correlated with SO4 (R2=0.55) and displayed little diurnal variation.
Two storms occurred during the sampling campaign. The first (27 May) caused a loss of power to the HR-ToF-AMS and the data gap shown in Fig. 2; the second, denoting the beginning of the frontal/LP period, caused a rapid reduction in aerosol mass that was followed by 3 days of markedly different aerosol characteristics, despite initially similar wind directions. Diurnal profiles of virtually all NR-PM1 species during the frontal/LP period are distinct from the preceding marine period (Fig. 3) and show maximum concentrations at night. Satellite images of the area show the arrival of a large-scale frontal system on 2 June and the presence of heavy cloud cover through 5 June (Fig. S15). The O:C ratio during this period is the highest of the campaign, which, combined with the strong correlation between diurnal trends of OA and SO4 (R2=0.78), suggests measured OA represents regional background OA that is diluted with the rise of the boundary layer in the morning. The dominant PMF factor extracted during this period (OOA-1) had an O:C ratio (1.15) similar to the most aged OA observed in urban areas (Hayes et al., 2013), implying an influence of extensive atmospheric processing during transport (Ortega et al., 2016), aqueous processing of highly oxidized water-soluble organics (e.g., glyoxal O:C = 1) (Chhabra et al., 2010), or some combination of the two.
The third identified period, which occurred from 6 to 9 June, shows evidence of continentally influenced air masses and a multi-day increase of NR-PM1 following passage of the frontal system. The organic-to-SO4 ratio shifts from a value of 0.34 during the marine period, typical of marine environments (Coggon et al., 2012), to an average value of 3.08, highlighting the predominance of OA sources within the Houston region. Local wind direction measured from 6 to 8 June appears to show a land–sea breeze type circulation pattern, and midday O3 concentrations during this period reach the highest levels of the campaign (Fig. 2). Diurnal profiles of NR-PM1 species highlight the influence of local photochemistry and/or boundary layer dynamics (i.e., downward mixing of aged OA into the growing boundary layer) on aerosol mass loadings (Fig. 3). OOA-2, the dominant PMF factor during this period (72 %), displays a diurnal profile similar to a previously extracted OOA factor in Houston's urban core (Cleveland et al., 2012) but is much more oxidized (O:C = 0.79 in this study versus 0.46 in Cleveland et al., 2012), highlighting the effect of aging during transport. Plotting mass loadings of OOA-2 against ambient CO concentrations produces a slope of ∼150 µg m−3 ppmv−1 during this period. This value is similar to previous aircraft measurements of aged industrial plumes in Houston (Bahreini et al., 2009; Wood et al., 2010). Modeling results have suggested that biogenic VOCs contribute little OA during Houston industrial plume transport (Bahreini et al., 2009) except in the case of advection into the forested north of Houston (Brown et al., 2013), which suggests a likely anthropogenic origin of OOA-2.
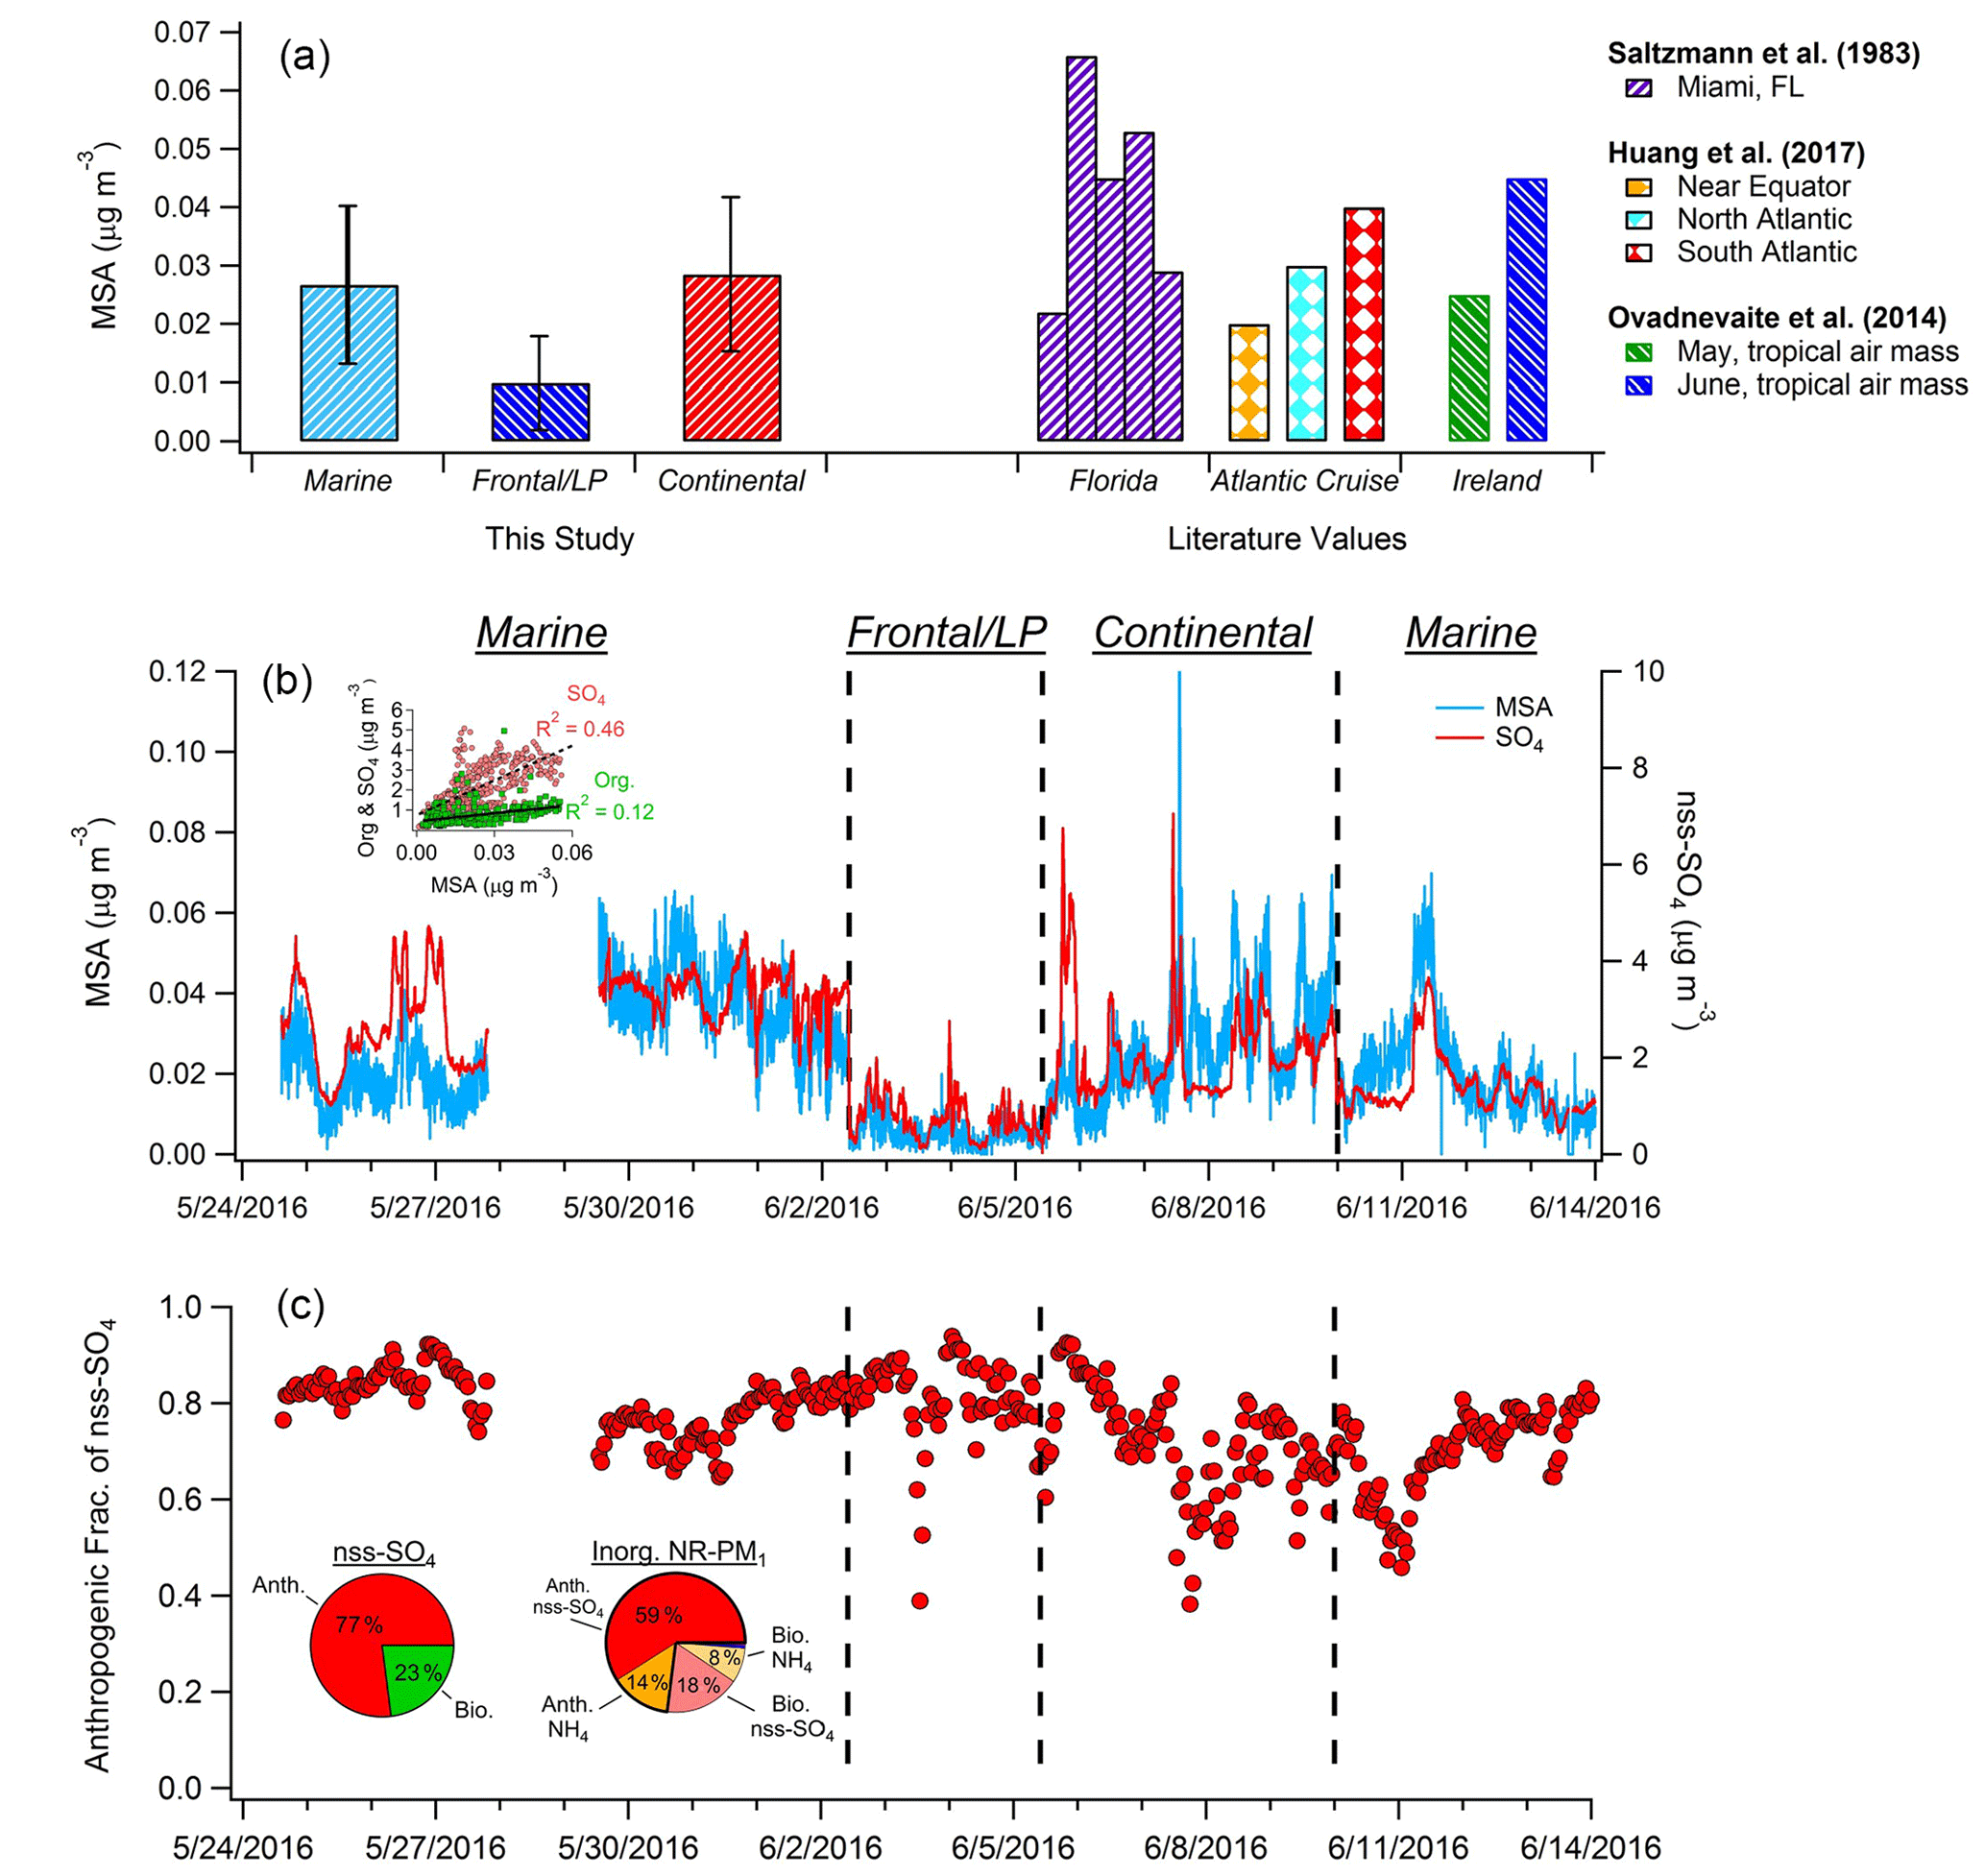
Figure 4(a) Comparison of average MSA mass loadings measured during each of the three major periods of the campaign with previously published values measured in Florida; on an Atlantic Cruise; and at Mace Head, Ireland. (b) Time series of MSA and nss-SO4. Black dashed lines denote boundaries of distinct time period types. Inset graph shows the correlation of total OA and SO4 with MSA during the marine period. (c) Hourly averages of the estimated fraction of nss-SO4 attributed to anthropogenic sources. Inset pie charts depict anthropogenic and biogenic contributions to nss-SO4 (left) and total inorganic NR-PM1 (right) during the marine period. Mass loadings of nitrate and chloride comprise less than 2 % of total inorganic aerosol.
3.2 Analysis of MSA mass loadings
The time series of calculated MSA mass loadings is shown in Fig. 4, as are concentrations determined for the three distinct periods described previously and comparisons with literature values. Overall during the marine period, MSA mass ranged from ∼0 to 0.07 µg m−3 and showed moderate correlation with nss-SO4 (R2=0.46) and weak correlation with OA (R2=0.12), suggesting major additional sources of both nss-SO4 and OA over the MBL. While previous MSA measurements in the Gulf of Mexico are sparse, Saltzman et al. (1983) recorded submicron mass loadings of 0.022–0.066 µg m−3 in Miami, in agreement with our results. In addition, our results align well with previous submicron measurements taken at lower latitudes in both the Atlantic and Pacific oceans, as well as with measurements taken at higher latitudes while sampling tropical air masses (Fig. 4) (Zorn et al., 2008; Ovadnevaite et al., 2014; Huang et al., 2017).
On average, MSA accounts for only 3.2 % of submicron OA during marine periods, a value much lower than observed in previous coastal measurements with a HR-ToF-AMS. For instance, Crippa et al. (2013) reported that MSA accounted for approximately 20 % of submicron OA in Paris when air masses traveled from marine locations. At Mace Head, Ireland, MSA represented 12.5 %–18 % of submicron OA during May and June when air masses traveled from the tropics (Ovadnevaite et al., 2014). However, before establishment of the ECA, Russell et al. (2009) found that during onshore flow in the Gulf of Mexico between 52 % and 89 % of organic mass could be attributed to oil combustion/refining and wood-smoke-related sources. Therefore, the small MSA mass fraction observed here is likely the result of strong remaining anthropogenic OA sources over the gulf. This hypothesis is supported by the relatively weak correlation between the dominant marine PMF factor (OOA-3) and MSA (R2=0.41). For comparison, the distinctly biogenic marine PMF factor extracted by Crippa et al. (2013) in Paris correlated strongly with MSA (R2=0.84).
Quantification of the MSA / OA ratio permits a rough calculation of the contribution of biogenic sources to total marine OA. Using an assumption that MSA should only represent 5 %–10 % of total biogenic OA under pristine conditions over the Gulf of Mexico (a low estimate based on the previous observations discussed), calculation of the mass fraction of biogenic OA based on this ratio (MSA / biogenic OA = 0.05–0.1) and the measured MSA / total OA ratio (MSA / total OA = 0.032) implies biogenic sources only produce ∼32 %–64 % of total measured marine OA. In addition, vanadium, an element common to shipping emissions, is thought to act as a catalyst to MSA formation (Gaston et al., 2010). As oil combustion emissions were responsible for a major fraction of OA over the Gulf of Mexico in the past (Russell et al., 2009), this type of catalytic process may be enhancing MSA production relative to more pristine locations at similar latitudes. This further suggests that the assumption that MSA accounts for only 5 %–10 % of biogenic OA is likely a low estimate.
MSA mass loadings were positively, though only slightly, correlated with trajectory-averaged solar flux (R2=0.12) and negatively correlated with trajectory length (i.e., wind speed) (R2=0.16). The lack of a strong correlation with these parameters is partly due to the fact that DMS is emitted primarily in regions with high concentrations of biological organisms in the sea-surface layer, which typically occur close to the coast. Therefore, emissions are not uniform across the Gulf of Mexico (Sorooshian et al., 2009). Often, high MSA mass loadings are linked to specific locations of high biological activity through analysis of backward trajectories and comparison to chlorophyll-a levels (Sorooshian et al., 2009, 2015a; Gaston et al., 2010; Schmale et al., 2013; Huang et al., 2017). While the accuracy of satellite-derived measures of chlorophyll a as an indicator of DMS production potential is still under debate (Sorooshian et al., 2009; Huang et al., 2017), the data here support a link between oceanic chlorophyll a and MSA mass loadings, as a peak in MSA mass is observed on 11 June, when backward-trajectory analysis indicates air masses slowly traveled over the nutrient-rich waters close to the coast and near the mouth of the Rio Grande (Fig. S16).
3.3 Quantifying anthropogenic contributions to marine aerosol mass
The average MSA / nss-SO4 ratio measured during the marine period was 0.012. Applying the biogenic MSA / nss-SO4 ratio determined by Savoie et al. (2002) indicates that an average of 77 % of nss-SO4 (1.8 µg m−3) is the result of anthropogenic sources during onshore flow (Fig. 4c). This value likely represents an upper limit (see Sect. 2.8). Furthermore, as the partitioning of gaseous ammonia (NH3) to the aerosol phase is driven by the neutralization of acidic SO4, mass loadings of nss-SO4 and NH4 are highly correlated during the marine period (R2=0.97). As a result, an estimate of an “anthropogenic” mass loading of NH4 can be calculated based on the NH4 / nss-SO4 ratio and the calculated anthropogenic fraction of nss-SO4. The classification of a fraction of NH4 as “anthropogenic” therefore refers to the necessity of an anthropogenic species (in this case nss-SO4) for the production of NH4 aerosol, rather than anthropogenic NH3 emissions. By applying this method and combining anthropogenic NH4 and nss-SO4 mass loadings, anthropogenic sources contribute 73 % of total inorganic NR-PM1 (2.3 µg m−3) on average during marine flow conditions.
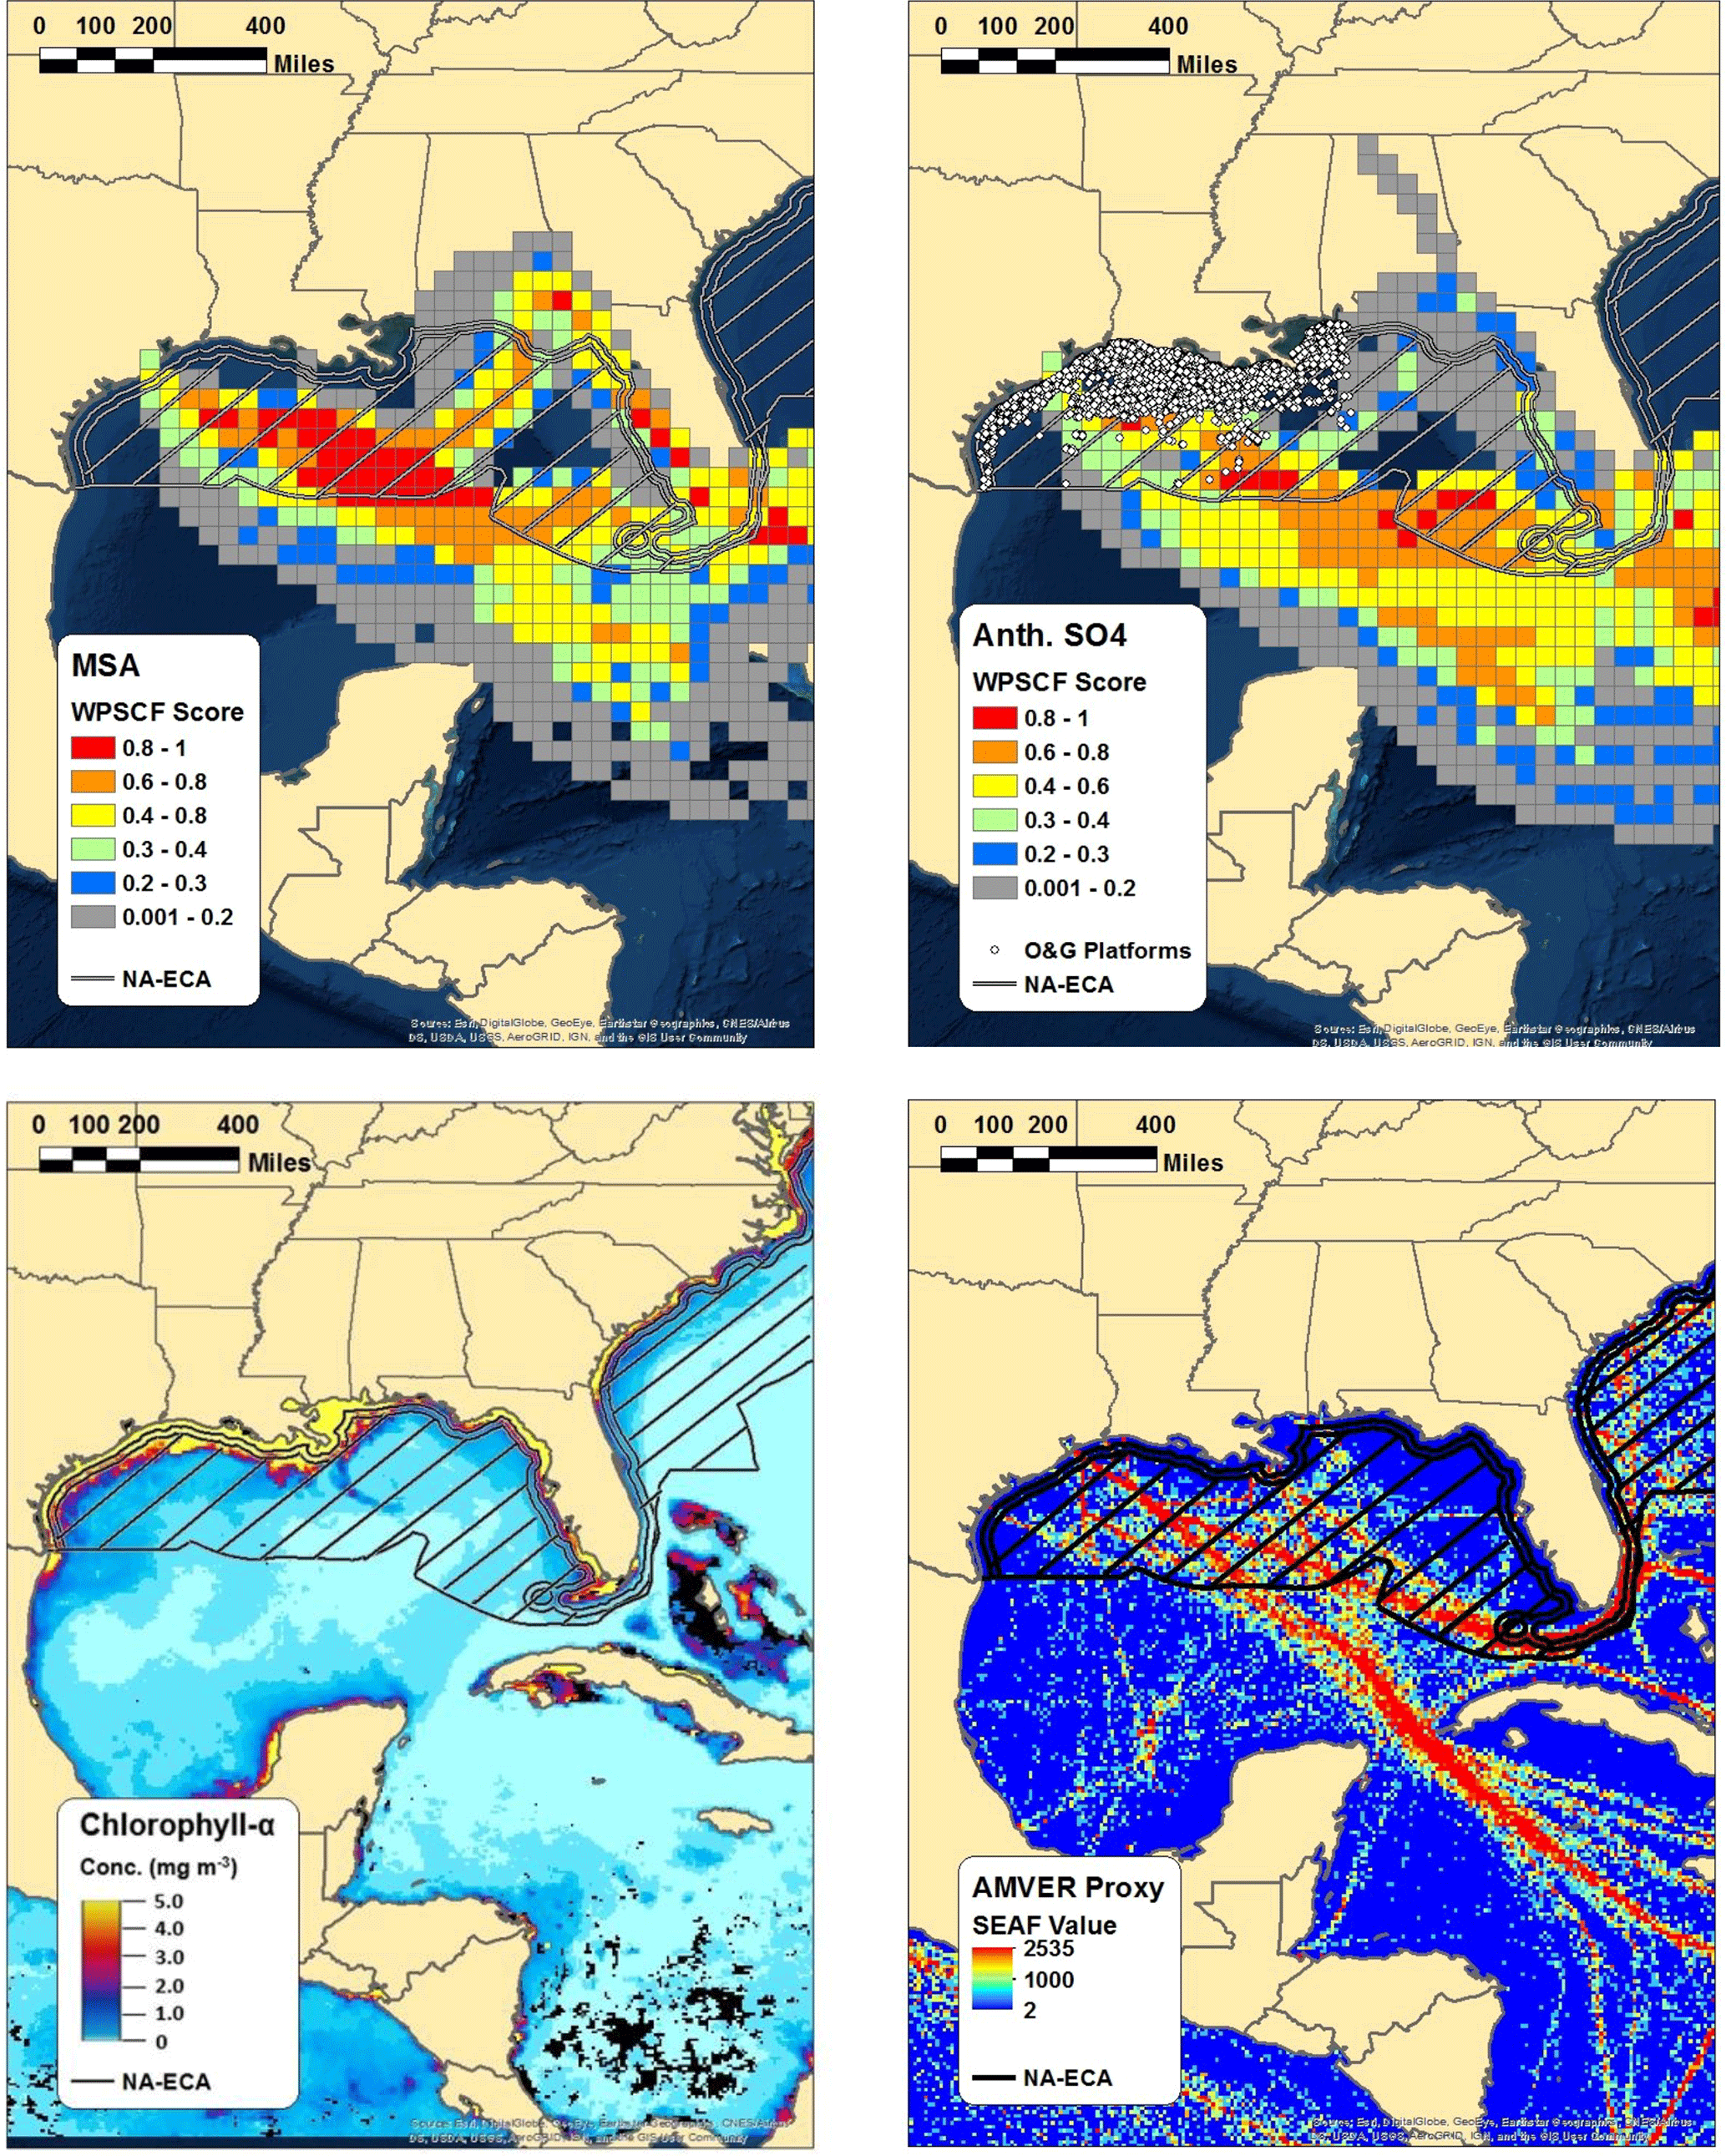
Figure 5WPSCF plots of MSA (top left) and anthropogenic nss-SO4 (top right) for the marine period of the study, along with the chlorophyll-a concentration observed by the NASA MODIS satellite (bottom left) and AMVER shipping spatial proxy map (bottom right). Warmer colors in the WPSCF grid cells indicate higher source probability. The color of each 0.1∘ × 0.1∘ grid cell in the AMVER map is based on the corresponding “shipping emissions allocation factor” (SEAF) value (Wang et al., 2008). The hatched region extending from the coasts in each panel represents the approximate area encompassed by the ECA. Note that the ECA boundary is narrowed on the southeastern coast of Florida due to proximity to the territorial waters of Cuba and the Bahamas.
Multiple lines of evidence support the use of MSA measurements coupled with the biogenic MSA / nss-SO4 ratio to apportion anthropogenic and biogenic nss-SO4. Using measurements of chlorophyll-a concentrations, wind speeds measured on board the R/V Brown, and the wind speed–transfer velocity relationship determined by Nightingale et al. (2000), Bates et al. (2008) estimated that the DMS flux from the Gulf of Mexico was capable of producing between 0.2 and 0.4 µg m−3 of biogenic nss-SO4. For comparison, the average mass loading of biogenic nss-SO4 calculated using the biogenic MSA / nss-SO4 ratio during marine periods in our study is 0.54 µg m−3, in relatively good agreement with those results. Furthermore, Fig. 5 shows the WPSCF analysis of anthropogenic nss-SO4 and MSA, the Automated Mutual Assistance Vessel Rescue System (AMVER) shipping spatial proxy map (Wang et al., 2008), and chlorophyll-a levels derived from MODIS satellite measurements. The use of the biogenic MSA / nss-SO4 ratio is qualitatively supported by the relatively distinct WPSCF results of anthropogenic nss-SO4 and MSA and by the agreement between the anthropogenic nss-SO4 WPSCF map and the region of high shipping traffic indicated by the AMVER inventory. The high-probability region of anthropogenic nss-SO4 is located predominately outside of the ECA boundary where shipping lanes converge, while the MSA high-probability region is largely within the ECA where surface chlorophyll-a concentrations are elevated (Fig. 5).
While point-source emissions in Florida or long-range transport could contribute to the anthropogenic nss-SO4 measured during this study, further analysis suggests these sources are minor in comparison to marine vessel emissions. According to the National Emissions Inventory (NEI), ∼160 000 t of SO2 were emitted in Florida in 2014 (U.S. EPA, 2014). However, only ∼30 000 t (∼19 %) were emitted in the southern peninsular region indicated as a potential source by the WPSCF analysis (south of 28∘ N) (Fig. S17). While point-source-distributed NEI data are not yet available for 2016, EPA statewide average data suggest that Florida SO2 emissions were approximately half of those in 2014 (∼80 000 t), with the change almost entirely due to a 75 % reduction in emissions from electricity-generating stations (U.S. EPA, 2017). If emissions from individual electricity-generating stations south of 28∘ N have been similarly reduced, only ∼20 000 tons of SO2 were emitted in the southern peninsular region in 2016. For comparison, recent emissions inventories predict that marine vessels emit as much as 75 000 t of SO2 annually in the Gulf of Mexico after accounting for the ECA, nearly 4 times as much as the geographically relevant Florida emissions (Johansson et al., 2017).
Offshore oil and gas extraction operations represent another source of SO2 emissions within the Gulf of Mexico. As can be seen from Fig. 5, all currently operating offshore sites are located within the ECA (Wilson et al., 2017). Under the Clean Air Act, regulation of currently operating offshore oil and gas sites is handled by the Department of the Interior's Bureau of Ocean Energy Management (BOEM). According to the BOEM 2014 Gulfwide Emission Inventory Study, annual SO2 emissions from platform and non-platform oil and gas operations totaled 7150 t (Wilson et al., 2017). Within the same study region, SO2 emissions from commercial marine vessels were estimated at 48 215 t (Wilson et al., 2017). The discrepancy between marine vessel SO2 emissions reported in the BOEM inventory (48 215 t) and that of Johansson et al. (2017) (75 000 t) is due to the limited spatial scope of the BOEM study (only the western Gulf of Mexico was considered). While non-negligible, offshore operations therefore represent less than ∼15 % of SO2 emissions in the western Gulf of Mexico and less than ∼10 % of total SO2 emissions in the entire Gulf of Mexico.
In terms of the contribution from long-range transport, air masses that originated in Europe or Africa required 15 days of transit or more to reach the measurement site based on HYSPLIT modeling. Assuming that sulfur compounds have a lifetime of ∼5–7 days in the MBL (Faloona, 2009), 89 %–95 % of the original sulfur in these air masses would be lost prior to measurement. This agrees with the finding by Bates et al. (2008) that only a small fraction of SO4 measured in the Gulf of Mexico was contributed by African dust during measurements in 2006.
Volcanic sources of SO2 have occasionally contributed significantly to nss-SO4 in marine regions during previous campaigns (Jung et al., 2014). Any nss-SO4 produced by volcanic emissions would be apportioned to anthropogenic sources due to the apportionment technique used (i.e., volcanoes would not be expected to produce substantial MSA, leading to a depression of the MSA / nss-SO4 ratio). Therefore, the influence of volcanic emissions would incorrectly increase the fraction of measured nss-SO4 attributed to anthropogenic sources. However, the only relevant volcanoes in the area are along the Caribbean islands, and backward-trajectory analysis reveals that the largest measured mass loadings of nss-SO4 correspond to air masses that passed far north of them. It therefore appears that the vast majority of measured anthropogenic nss-SO4 was emitted by marine vessels rather than other sources.
These results contrast with those from the previous model study of Lauer et al. (2007), who predicted using a global model that shipping contributes only ∼30 % of submicron SO4 over the Gulf of Mexico using the AMVER-distributed shipping inventory from Eyring et al. (2005) and as little as 15 % or less using the International Comprehensive Ocean-Atmospheric Data Set-distributed inventory from Corbett and Kohler (2003) on an annual basis. Multiple lines of evidence suggest that the discrepancies observed between our results and previous modeling results are not simply due to the timing of our measurements. For instance, while less shipping-related SO4 is likely produced in the fall/winter due to the reduction in photochemical activity during that time, conversion of biologically emitted SO2 into nss-SO4 should have the same photochemical dependence. Furthermore, the SO2 yield from DMS oxidation, the major biological nss-SO4 production pathway, is reduced in the winter due to the temperature dependence of DMS oxidation chemistry, as previously explained (Sect. 2.8) (Jung et al., 2014). Finally, data from the Port of Houston suggest that shipping traffic (estimated by the number of 20 ft equivalent cargo units (TEUs) processed at the port) is only reduced by ∼10 % in the winter (Fig. S18) (Port of Houston, 2017). However, a portion of this discrepancy is likely attributable to the fact that the marine period of our study only encompasses onshore flow conditions, whereas the annual average calculated by Lauer et al. (2007) also incorporates periods of offshore flow, when continental emissions act as source of nss-SO4 to the MBL over the Gulf of Mexico.
Quantification of anthropogenic nss-SO4 allows for a more detailed apportionment of marine OA than was possible based on MSA alone. While the correlation between total nss-SO4 and OOA-3 (the dominant marine OA factor) is moderate (R2=0.55), anthropogenic nss-SO4 is strongly correlated with OOA-3 (R2≥0.78) (Fig. S12), suggesting OOA-3 is coupled to shipping emissions either directly (e.g., SOA from marine vessel VOCs or oxidation of evaporated marine POA) or indirectly (e.g., increased uptake of water-soluble gases over the MBL due to increased ALW). Substantial processing of OOA-3 during transport leads to the removal of major mass spectral tracers; however, there is some evidence for a contribution from naphthalene OA (discussed in the Supplement), which is a dominant, commonly measured VOC emitted by major commercial shipping vessels (Agrawal et al., 2008; Murphy et al., 2009; Czech et al., 2017). Assuming, as a strictly upper-bound estimate, that OOA-3 production is entirely dependent on shipping emissions, anthropogenic sources contributed 71 % of total NR-PM1 (2.7 µg m−3) on average during the marine period.
Comparing the submicron mass loadings of nss-SO4 and NH4 measured during marine periods by Bates et al. (2008) (pre-ECA) (3 µg m−3) to those measured during our study (3.04 µg m−3) suggests ECA implementation has had a negligible effect on aerosol mass. However, the amount of shipping traffic within the Gulf of Mexico, estimated with the total number of loaded TEUs processed at the ports of Houston, TX; Galveston, TX; Freeport, TX; New Orleans, LA; and Mobile, AL, has increased by approximately 42 % since 2006 (Fig. S19) (U.S. Army Corps of Engineers, Navigation Data Center, 2016), suggesting that emissions reductions per vessel within the ECA boundary may have been offset by increased traffic. On a yearly basis, the estimated increase in shipping traffic since 2006 (4.6 % per year) is similar to the annual growth in seaborne trade observed between 2002 and 2007 (5.2 %) and is within the range of growth predicted through 2050 (3.6 %–5.9 %) (Corbett et al., 2007; Eyring et al., 2010). In support of these rapid growth estimates, Tournadre (2014) recently concluded that shipping traffic in the Atlantic Ocean nearly doubled between 2006 and 2012, corresponding to an average annual increase of ∼8 %. While it is also possible that the specific meteorological conditions encountered during this campaign (e.g., air mass trajectories, average wind speeds) were more conducive to the accumulation of anthropogenic nss-SO4 than during the study of Bates et al. (2008), this is unlikely to be the dominant reason for the little change observed since ECA implementation. Therefore, our results suggest that the ECA has reduced shipping emissions on a per-vessel basis, as there has been little change in shipping-related aerosol despite significant growth in the shipping trade. These results also provide justification for further limits on FSC, which are expected to be implemented in 2020 and require a reduction of FSC to a maximum of 0.5 % globally (Kotchenruther, 2016). However, longer-term observational or modeling studies are nevertheless needed to more definitively quantify the effect of the ECA.
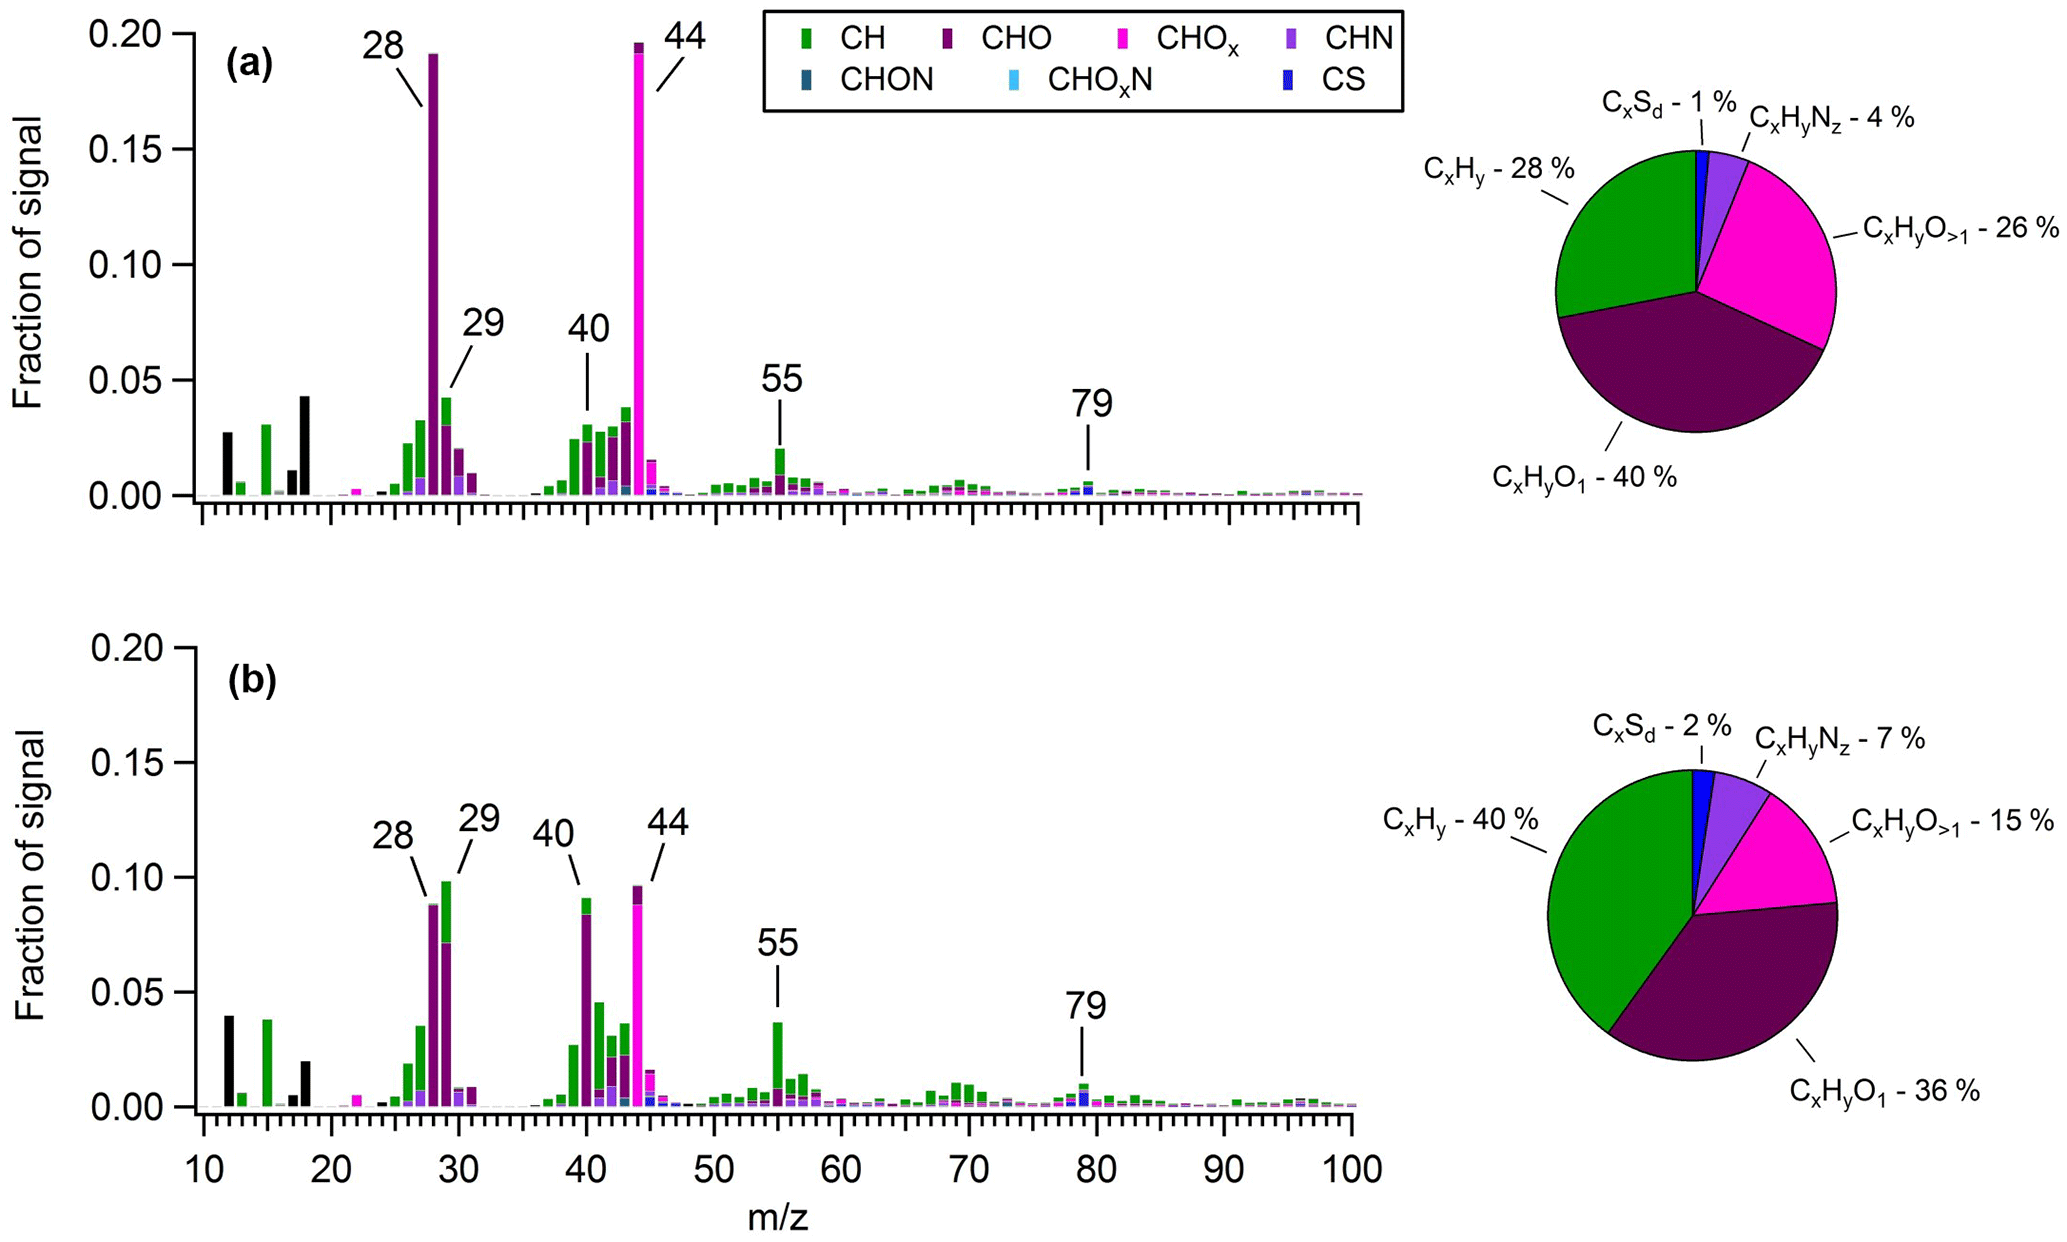
Figure 6Average OA mass spectra measured during (a) a period heavily influenced by shipping emissions (30 May 2016) and (b) the “marine-biogenic” period when air masses traveled within the ECA for nearly their entire 5-day history. The overall organic fragment composition measured during each period is shown in the corresponding pie charts.
3.4 Relationship between shipping emissions and OA oxidation state
In order to obtain a quantitative measure of the difference in OA composition between air masses influenced by shipping emissions and those lacking such influence, a 12 h period was isolated on 10–11 June, when the site encountered air masses that had been inside the ECA boundary but over the ocean (i.e., within 200 nautical miles of the coast) for virtually their entire 5-day history (Fig. S20). Assuming ECA compliance, these air masses should receive only a small fraction of the particulate and SO2 emissions encountered by those originating outside the boundary (Lack et al., 2009, 2011; Browning et al., 2012). Based on air mass history and the accompanying mass spectral analysis described below, we classified OA measured during this period as “marine-biogenic”. For comparison, we distinguished a second 24 h period (30 May) that had similar 5-day backward-trajectory-averaged meteorological conditions to the biogenic period (faster average wind speed and comparable average solar flux) but had trajectories that originated outside the ECA boundary and passed through the high-intensity shipping region. The shipping-influenced period had notably larger mass loadings of anthropogenic nss-SO4 (2.24 versus 1.09 µg m−3) and OA (1.04 versus 0.29 µg m−3).
Figure 6 presents the average OA mass spectra determined for each of these periods. In the shipping-influenced air masses, measured OA is highly processed, with a much larger f44 (0.20) (a marker of carboxylic acids) than is typical of marine biogenic OA (∼0.08–0.14) (Chang et al., 2011; Coggon et al., 2012, 2014; Crippa et al., 2013) and a composition dominated by oxygenated species (66 %). In contrast, OA measured during the period of minor shipping influence is notably less aged and contains numerous indicators of a marine biogenic source. For instance, prominent non-oxygenated spectral fragments are observed at m∕z27, 39, 41, 43, 55, and 67 (Fig. S21), implying the presence of alkenes, cycloalkenes, cycloalkanes, and dienes, in agreement with Ovadnevaite et al. (2011, 2014) for marine OA measured at Mace Head, Ireland, and by Bates et al. (2012) in physically generated sea spray aerosol. A relatively significant contribution from m∕z79 (CH3SO2) (∼1 %) is also apparent, and as a result MSA contributes 9.3 % of total OA, a value 3 times larger than the average during the marine period and in closer agreement with previous measurements in remote marine regions (Ovadnevaite et al., 2014). Furthermore, a prominent signal from the CHO+ ion, an aldehyde tracer, is observed (∼7 %), which is uncharacteristic of aged urban emissions (Ng et al., 2010) but has been observed in the mass spectra of numerous biogenic SOAs from both chamber experiments and ambient measurements (Shilling et al., 2009; Chhabra et al., 2010; Slowik et al., 2010; Setyan et al., 2012) and from marine biogenic OA specifically (Chang et al., 2011; Crippa et al., 2013; Coggon et al., 2014). Ultimately, the biogenic period spectra correlate well with the marine biogenic factor extracted by Chang et al. (2011) over the Arctic Ocean (R2=0.78) as well as with the marine OA factor extracted by Crippa et al. (2013) in Paris (R2 = 0.68), while the shipping-influenced period spectra correlate extremely well with the continental factor extracted by Chang et al. (2011) (R2=0.95).
The mass spectra from the shipping-influenced period have notably larger signals from m∕z44 and m∕z28 than the biogenic period, suggesting a larger amount of atmospheric processing that converted OA components into organic acids (Chhabra et al., 2011). Numerous remote marine studies have shown that, on average, the oxidation state of marine aerosol varies only slightly in the absence of anthropogenic influences (Gantt and Meskhidze, 2013; Wozniak et al., 2014). In this case, the absolute difference in the O:C ratio between the two scenarios is 0.29 (0.90 for the shipping-influenced period versus 0.61 for the marine-biogenic period), implying a major impact of shipping on related OA chemical and potentially physical properties. While primary marine aerosol particles can have high O:C ratios (∼1) due to the significant mass fraction of carbohydrate components in dissolved organic matter (Russell et al., 2010), the low trajectory-averaged wind speeds and high f44 suggest that OA measured during the shipping-influenced period is not primary (Frossard et al., 2014).
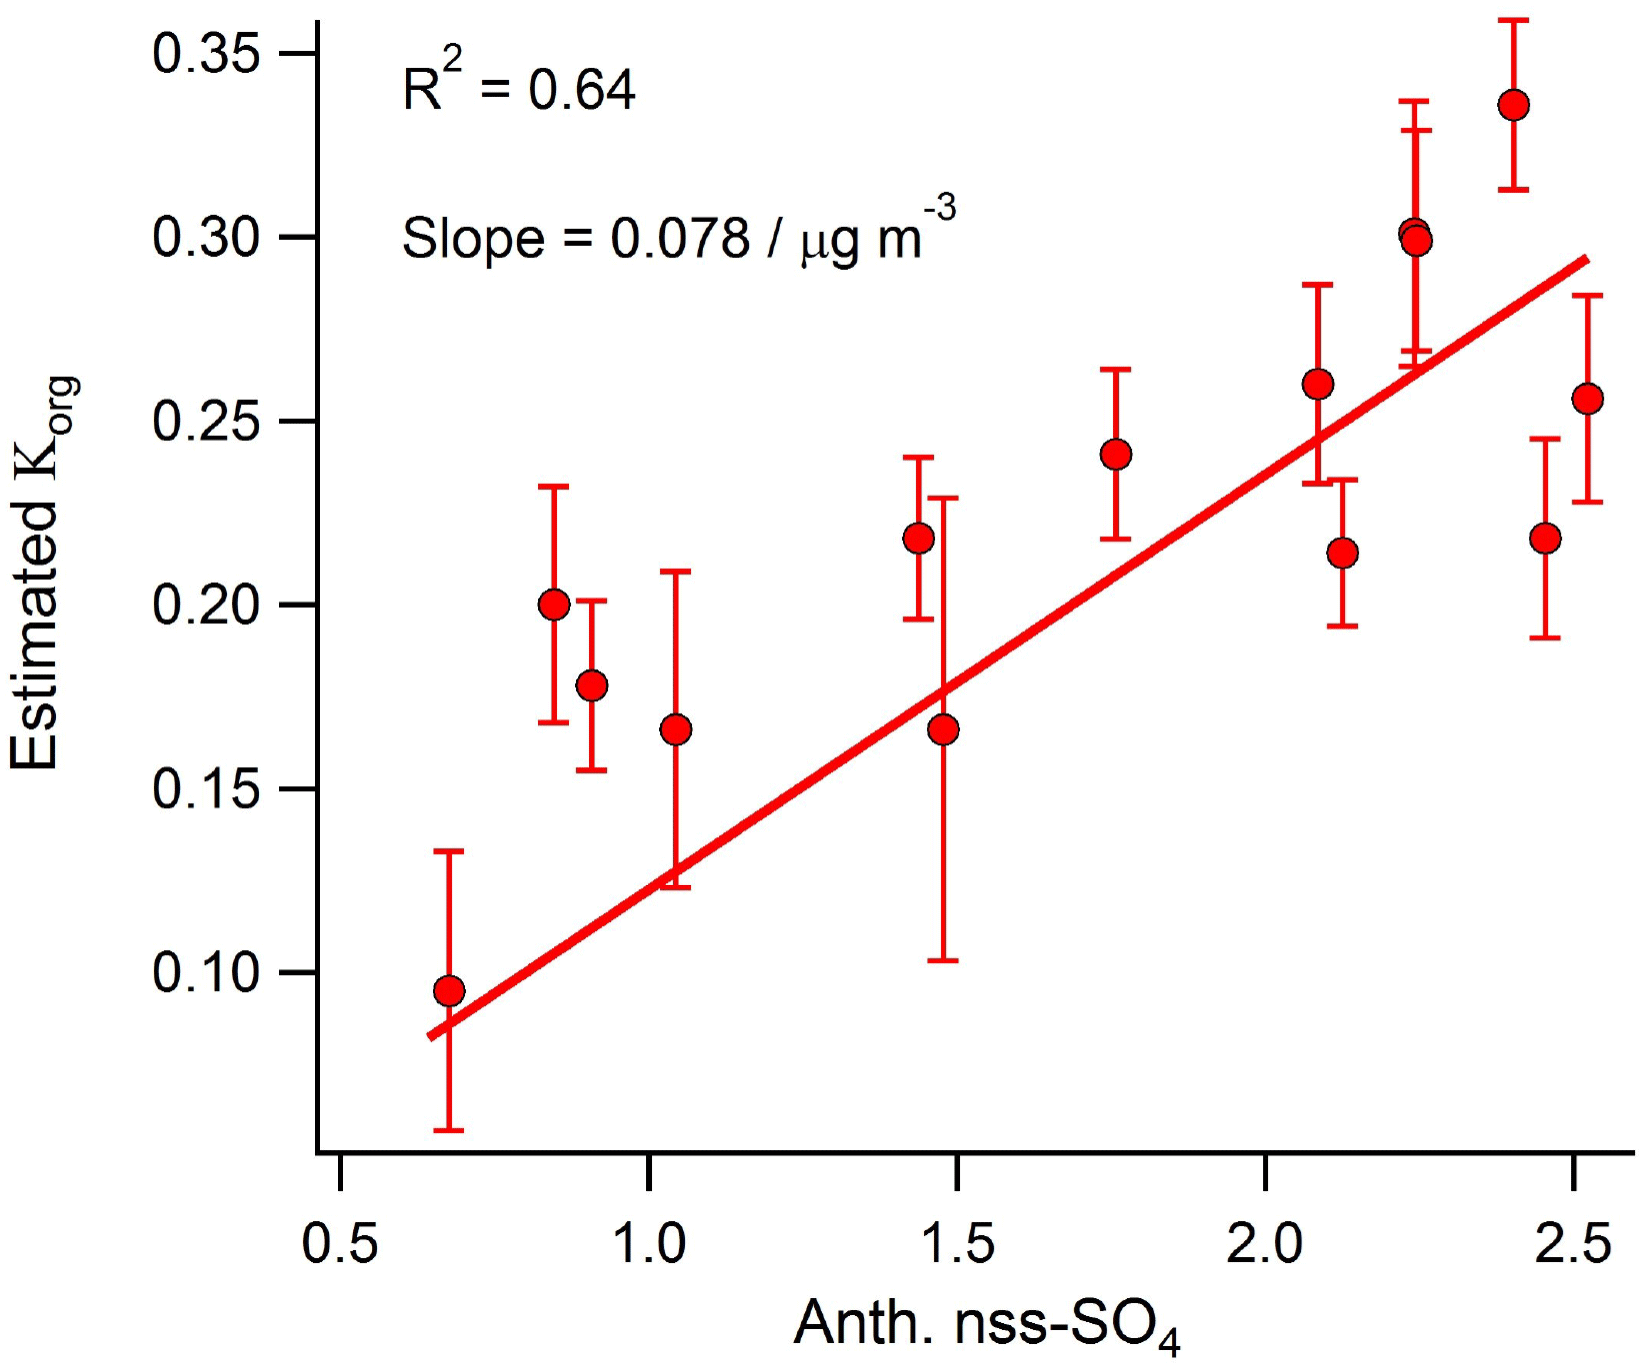
Figure 7Correlation between daily averaged anthropogenic nss-SO4 and the OA hygroscopicity factor calculated using the method developed by Duplissy et al. (2011).
Using the function developed by Duplissy et al. (2011) to describe the relationship between OA oxidation state (represented by the mass fraction of m∕z44) and hygroscopicity, the calculated organic hygroscopic growth factor (Korg) for the shipping-influenced period is 3 times larger (0.31 versus 0.101) than that calculated for the marine-biogenic period. Therefore, despite the fact that freshly emitted in-plume shipping aerosol is thought to have a suppressed hygroscopic growth factor relative to background marine aerosol (Murphy et al., 2009), our results suggest that extensive aging during transport near shipping lanes (presumably due to increased oxidant levels) may lead to an eventual increase in bulk marine OA hygroscopicity relative to aerosol unaffected by shipping emissions. This hypothesis is supported by the relatively strong correlation observed between daily anthropogenic nss-SO4 and the organic hygroscopicity factor (R2=0.64) calculated using the Duplissy et al. (2011) method during the marine period (Fig. 7).
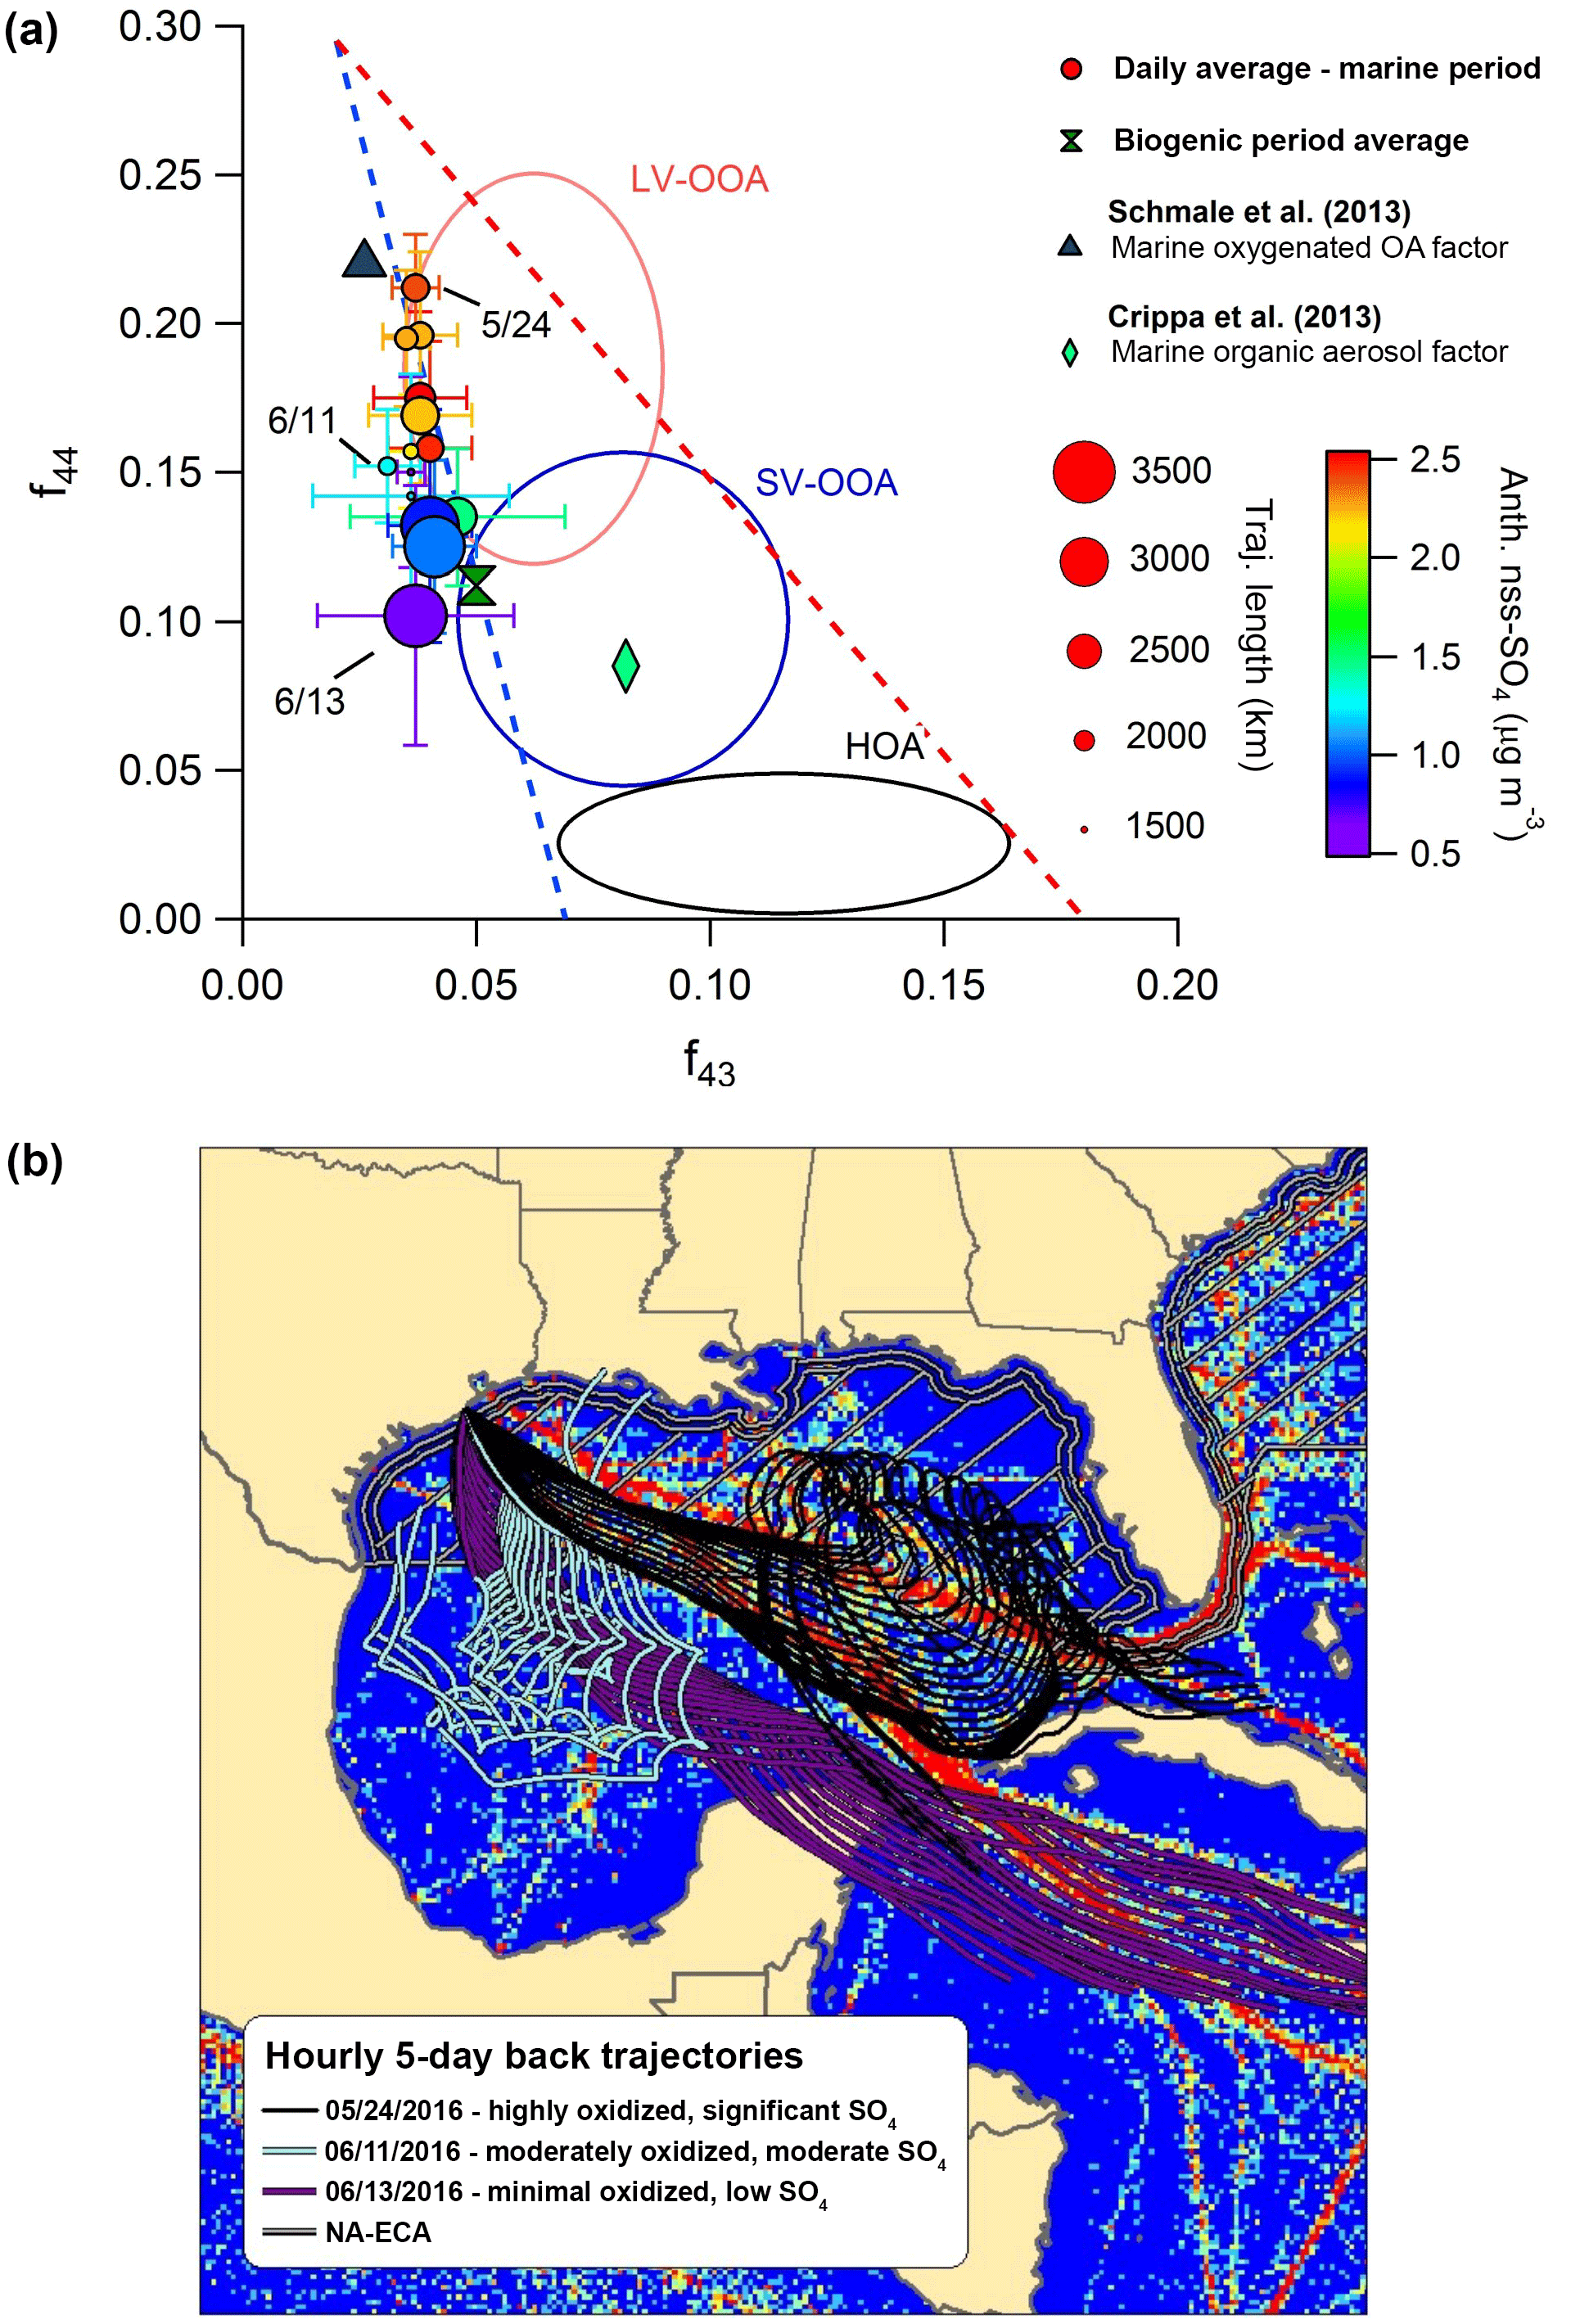
Figure 8(a) The f44:f43 diagram highlighting different influences on OA oxidation state during the marine period. Circles represent daily average values, and bars indicate standard deviations. Periods with HOA mass loadings greater than twice the median value during the marine period were removed from the analysis. Two additional values from published marine studies are shown as a reference. (b) Map of Gulf of Mexico showing hourly 5-day back trajectories calculated for each of the 3 days identified in the f44:f43 diagram. The AMVER shipping emissions spatial proxy map (Wang et al., 2008) is shown for reference. The hatched region extending from the coasts represents the approximate area encompassed by the ECA. Note that the ECA boundary is narrowed on the southeastern coast of Florida due to proximity to the territorial waters of Cuba and the Bahamas.
Figure 8 displays marine OA plotted on the f44-versus-f43 triangle diagram (Ng et al., 2010) to describe OA aging. Less oxidized OA typically occupies a wide space at the bottom of the plot, indicative of variable ambient OA mass spectra, while aging causes movement diagonally upward, as mass spectra become more similar with age (Ng et al., 2010). Figure 8 highlights that OA oxidation is greatly influenced by a combination of physical air mass history and meteorology. Three specific days demonstrate these influences particularly well. On 24 May, backward-trajectory analysis reveals that air masses passed directly over the region of major shipping influence, resulting in a substantial amount of nss-SO4 aerosol and highly oxidized OA. In contrast, on 11 June – despite the fact that trajectory-averaged wind speeds were lower and solar flux was comparable, suggesting meteorological conditions were more conducive to OA processing and elevated aerosol mass loadings – air masses largely missed the high-intensity shipping region (and remained largely within the ECA), resulting in less nss-SO4 and less oxidized OA. On 13 June, arriving air masses had faster average wind speeds and avoided shipping lanes, resulting in an extreme case of very little nss-SO4 and only minor processing. Based on this information, it appears that air mass transit within major shipping corridors is associated with more processed organic aerosol relative to background marine conditions in the Gulf of Mexico.
There are multiple ways in which the presence of shipping emissions could increase the rate of OA processing. While peak daytime concentrations of OH of 6×10⁶–1×10⁷ mol cm−3 are relatively consistent throughout the clean MBL (Raper et al., 2001; Vaughan et al., 2012), modeling results by Chen et al. (2005) and Kim et al. (2013) indicate that, within individual shipping plumes, OH concentrations are elevated by a factor of 1.2 to 2.7 and OH concentrations can remain elevated up to 140 km behind an individual shipping vessel. Significant NO2 levels within the plume also increase concentrations of nitrate radical to several pptv, even during the daytime, which would hypothetically result in rapid oxidation of any unsaturated VOCs or components of primary marine OA (Myriokefalitakis et al., 2010; Bates et al., 2012; Kim et al., 2013). Additionally, elevated production of nss-SO4 aerosol increases ambient ALW mass, increasing the partitioning medium available to small, water-soluble organic gases (WSOGs) produced from both biogenic and anthropogenic sources (e.g., glyoxal, methylglyoxal, acetaldehyde) and processed in the aqueous phase into highly oxidized species (such as glyoxylic acid/glyoxylate, O:C = 1.5, or oxalic acid/oxalate, O:C = 2) (Ervens et al., 2011; Ge et al., 2012).
However, it should be noted that, unlike SO2 emissions/concentrations, the presence of the ECA may not substantially reduce concentrations of atmospheric oxidants within shipping plumes. Numerous studies have linked shipping-related perturbations of marine OH radical concentrations to vessel NOx emissions (e.g., Lawrence and Crutzen, 1999; Kim et al., 2013). While Tier III NOx emissions standards implemented in the ECA in 2016 are projected to slowly reduce emissions over time (as standards only apply to vessels constructed in 2016 and later), Browning et al. (2012) have shown that the sole switching from high-sulfur HFO to MGO at the ECA border in the Gulf of Mexico only produced NOx reductions of 1 %–6 %. As a result, the effect of shipping emissions on marine OA processing likely depends more on whether air masses align with shipping lanes during transit than whether such transit occurs within or outside of the current ECA.
3.5 Relationship between shipping emissions and major marine OA components: amines and MSA
While MSA and alkylamines, such as dimethylamine (DMA) and diethylamine specifically, are frequently observed over the MBL and are linked to biogenic emissions (Murphy et al., 2007; Facchini et al., 2008; Sorooshian et al., 2009), the partitioning dynamics of each are influenced by shipping emissions. For instance, recent single-particle measurements in California reveal a possible catalytic role of vanadium in MSA formation (Gaston et al., 2010), while gaseous alkylamines typically undergo neutralization reactions with sulfuric or nitric acids to form aminium salts (Murphy et al., 2007). However, previous studies have produced conflicting results about whether biogenic marine SOA mass is maximized in clean or polluted environments. For instance, Sorooshian et al. (2009) and Facchini et al. (2008) both noted that mass loadings of amines and MSA were largest in clean rather than polluted air masses, supporting their attribution to biogenic sources; however, Sorooshian et al. (2015a) observed similar size distributions of MSA and vanadium along the California coast, while Youn et al. (2015) reported noticeable long-term correlations between amines and SO4. Myriokefalitakis et al. (2010) suggested that, on a global basis, modeled marine SOA originates almost entirely from either DMS oxidation (i.e., MSA-related) (∼78 %) or formation of dialkyl amine salts (∼21 %), highlighting the importance of understanding anthropogenic influences on their production in areas influenced heavily by ship traffic. To quantify a lower-bound ambient amine signal from this coastal dataset, individual mass spectral fragments typical of alkyl amines identified in previous HR-ToF-AMS studies – specifically those at m∕z27 (CHN+), 30 (CH4N+) , 44 (C2H6N+), 56 (C3H6N+), 58 (C3H8N+), and 72 () – were combined (Murphy et al. 2007; Hildebrandt et al., 2011; Sun et al., 2011).

Figure 9Observed correlation between anthropogenic nss-SO4 and (left) the sum of measured alkyl amine fragments and (right) MSA.
Figure 9 highlights that hourly averaged amine mass loadings correlate well with anthropogenic nss-SO4 (R2=0.63), while MSA mass loadings show a noticeably weaker relationship (R2=0.30). A strong correlation between MSA and anthropogenic nss-SO4 would indicate either that the biogenic nss-SO4 fraction had been underpredicted or that a strong catalytic effect on MSA production was occurring.
The correlation between anthropogenic nss-SO4 and amines is consistent with those observed by Youn et al. (2015) for DMA and SO4 in Tucson, AZ, in 2013 (r≥0.72). Amines also display a positive relationship with NH4 (R2=0.61, similarly to nss-SO4), in agreement with the fact that throughout the campaign NR-PM1 was never fully neutralized by the small ammonia sources that exist over the MBL. This is highlighted by the fact that the average neutralization ratio, the molar ratio of ammonium to the sum of sulfate and nitrate ([]/(2× [] + []), was only 0.74, resulting in a consistent pathway for amine SOA formation through aqueous dissolution and partial neutralization of the acidic nss-SO4 aerosol. Furthermore, the correlation between amines and anthropogenic nss-SO4 is much stronger than correlations with average wind speed, solar flux, and mixing-layer depth (R2= 0.04, 0.18, and 0.10, respectively), suggesting that anthropogenic emissions play a larger role in amine aerosol formation than meteorology.
The link between shipping emissions and amine formation also is supported by the high nitrogen-to-carbon ratio (N:C) of the dominant marine PMF factor, OOA-3 (N:C = 0.074), a value larger than that observed in aged marine OA (N:C ∼0.04) (Schmale et al., 2013) and amine-related urban PMF factors extracted in Pasadena, CA (N:C = 0.052) (Hayes et al., 2013), and New York City (N:C = 0.053) (Sun et al., 2011), but similar to a biogenic MSA-related factor extracted at Bird Island near Antarctica (N:C = 0.08) (Schmale et al., 2013). It is likely that this anthropogenic–biogenic link can be extrapolated to other areas where marine biogenic and shipping emissions coexist. As a result, amines measured in heavily trafficked marine environments should not be interpreted exclusively as products of a purely biogenic SOA formation pathway.
3.6 Anthropogenic ALW and potential influences on SOA formation
While the impacts of shipping emissions on marine cloud condensation nuclei concentrations, cloud formation processes (e.g., ship tracks), and cloud properties (e.g., increased albedo, increased droplet acidity) have been extensively studied in the recent past (e.g., Coakley et al., 1987; Durkee et al., 2000; Coggon et al., 2012; Peters et al., 2012; Sorooshian et al., 2015b), there have been few measurement-based analyses of the role of these emissions on the production of ALW and subsequent OA processing in coastal marine environments. The injection of SO2 and production of SO4 aerosol mass in the marine boundary layer, combined with high ambient relative humidity levels, will lead to a substantial mass concentration of ALW associated with submicron anthropogenic particles, even in cloud-free conditions. As organic gases capable of partitioning to ALW are present throughout the MBL (Sinreich et al., 2010), have elevated concentrations near the coasts (Fu et al., 2008, 2011), and contribute significantly to aerosol mass in both rural and urban areas within the southeastern United States (Li et al., 2015), the production of this partitioning medium over the marine boundary layer may impact SOA production. As a result, measurement-based modeling of ALW is needed to inform understanding of how future changes to shipping sulfur emissions might influence SOA formation in coastal environments.
On average, ALW mass loadings of 5.21±4.62 µg m−3 are modeled using ISORROPIA II (Fountoukis and Nenes, 2007) during the marine period, representing on average 58 % of total NR-PM1 particle mass. This value is slightly larger than the average determined for the HSC region in September–October 2006 by Nguyen et al. (2016) (4.6 µg m−3), presumably because of higher average RH along the coast and similar total inorganic mass loadings, and is larger than the average values reported for every major city in North America analyzed by Nguyen et al. (2016). If anthropogenic nss-SO4 were eliminated completely, average ALW mass loadings associated with NR-PM1 aerosol would ultimately be reduced by 66.4 %. As a result, the majority of NR-PM1-associated ALW over the Gulf of Mexico appears to be controllable. While concentrations of WSOG over the MBL are relatively small (Sinreich et al., 2010), advection of this ALW inland may have large impacts on nearby SOA formation where precursor sources are more prevalent.
Multiple modeling studies have suggested that small WSOGs – specifically glyoxal, methylglyoxal, and isoprene epoxides (IEPOX) – contribute heavily to SOA mass in the Houston region (Li et al., 2015; Ying et al., 2015). Li et al. (2015) found that these three compounds were responsible for nearly 80 % of total SOA mass loadings at a downtown site during a simulated period in 2006, with the largest fraction (∼30 %–50 %) contributed by IEPOX. The authors also showed that these species dominate SOA mass across the Gulf Coast, with significant total loadings (∼4 µg m−3 or greater) from the southern end of Texas to the Florida panhandle. Ying et al. (2015) used the Community Multiscale Air Quality model (CMAQ) to characterize biogenic and anthropogenic contributions to glyoxal and methylglyoxal SOA and found that isoprene is a major contributor to both (47 % of glyoxal and 82 % of methylglyoxal SOA, specifically). As these compounds are precursors to aqueous SOA (aqSOA) formation, anthropogenic impacts on ALW represent another potential anthropogenic–biogenic link in SOA production (Carlton and Turpin, 2013).
The aqSOA formation from these WSOGs ultimately depends on both uptake into ALW and subsequent reactions to produce low-volatility organic acids or high-molecular-weight oligomeric products (McNeill, 2015). However, as uptake of OH, the dominant aqueous phase oxidant, is typically surface-limited (Ervens et al., 2014), large-scale models often simplify this process by assuming that aqSOA formation is irreversible and surface-controlled (Li et al., 2015; Ying et al., 2015), representing SOA production rate by
where Ma,i is the aerosol-phase mass concentration of species i (µg m−3), γi is its reactive uptake coefficient, vi is its gas-phase thermal velocity (m s−1), A is the ambient aerosol surface area (SA) concentration (m2 m−3), and Mi is the mass concentration of the species in the gas phase (µg m−3). As a fraction of WSOG partitioning is reversible (Chhabra et al., 2010; Wong et al., 2015), and SOA formation may be more dependent on the particle-phase reaction rate than simply the particle SA (Budisulistiorini et al., 2017), this estimated production rate likely represents an upper limit; however, published CMAQ results for OA mass loadings in the Houston area calculated in this manner agree well with observations (Li et al., 2015; Ying et al., 2015).
In order to approximate the effect of anthropogenic marine aerosol (AMA) on WSOG aqSOA production, we modeled aqSOA formation from isoprene-derived glyoxal, methylglyoxal, and IEPOX in the Houston area using the equation above and a previously developed 0-D model including a semi-explicit isoprene oxidation mechanism (Schulze et al., 2017). This model assumes that air masses rich in AMA advect over the urban core of Houston, where the added SA due to anthropogenic emissions over the ocean increases SA-dependent aqSOA production rates. Total model SA was quantified by combining the dry-mass size distribution measured by the HR-ToF-AMS at the coastal site during onshore flow and the mass added by NR-PM1-associated ALW; however, a correction was applied to account for SA loss due to deposition and ALW evaporation during transport to the HSC. A detailed description of all model assumptions (e.g., boundary layer height, aerosol deposition, and ALW evaporation during transport) is provided in the SI. Average diurnal isoprene, O3, and NOx concentrations measured by five monitors within the HSC during the marine period were used as model constraints (Fig. S22). Diurnal OH concentrations were taken from measurements in downtown Houston during the SHARP 2009 campaign (Ren et al., 2013).
A diurnal model run was first performed using the total corrected marine aerosol SA to predict aqSOA formation in the HSC. This procedure isolates aqSOA production due to marine aerosol SA specifically. In order to produce an upper-bound estimate of the effect of AMA, a second run was performed with all SA contributions from anthropogenic species removed (i.e., anthropogenic nss-SO4, NH4, and ALW), and the difference in aqSOA was calculated. A lower-bound estimate was calculated with a model run that only removed the SA contribution of anthropogenic ALW. In order to ensure conservative results, OA was assumed to be entirely biogenic for the purposes of this calculation.
To compare this effect with SOA production from locally emitted anthropogenic VOCs (AVOC-SOA) in Houston, gas-phase AVOC data measured during the marine period (concentrations of 16 alkanes, 7 alkenes, and 9 aromatics) were obtained from the same monitoring sites around the HSC (Fig. S22). Estimates of SOA production rates from these 32 VOCs were calculated using the volatility basis set approach utilized in Tsimpidi et al. (2010). In this mechanism, organic condensable gases produced from initial VOC oxidation are allowed to undergo further aging to produce lower-volatility products (Tsimpidi et al., 2010; Hayes et al., 2015). A more detailed description of this process is provided in the Supplement.
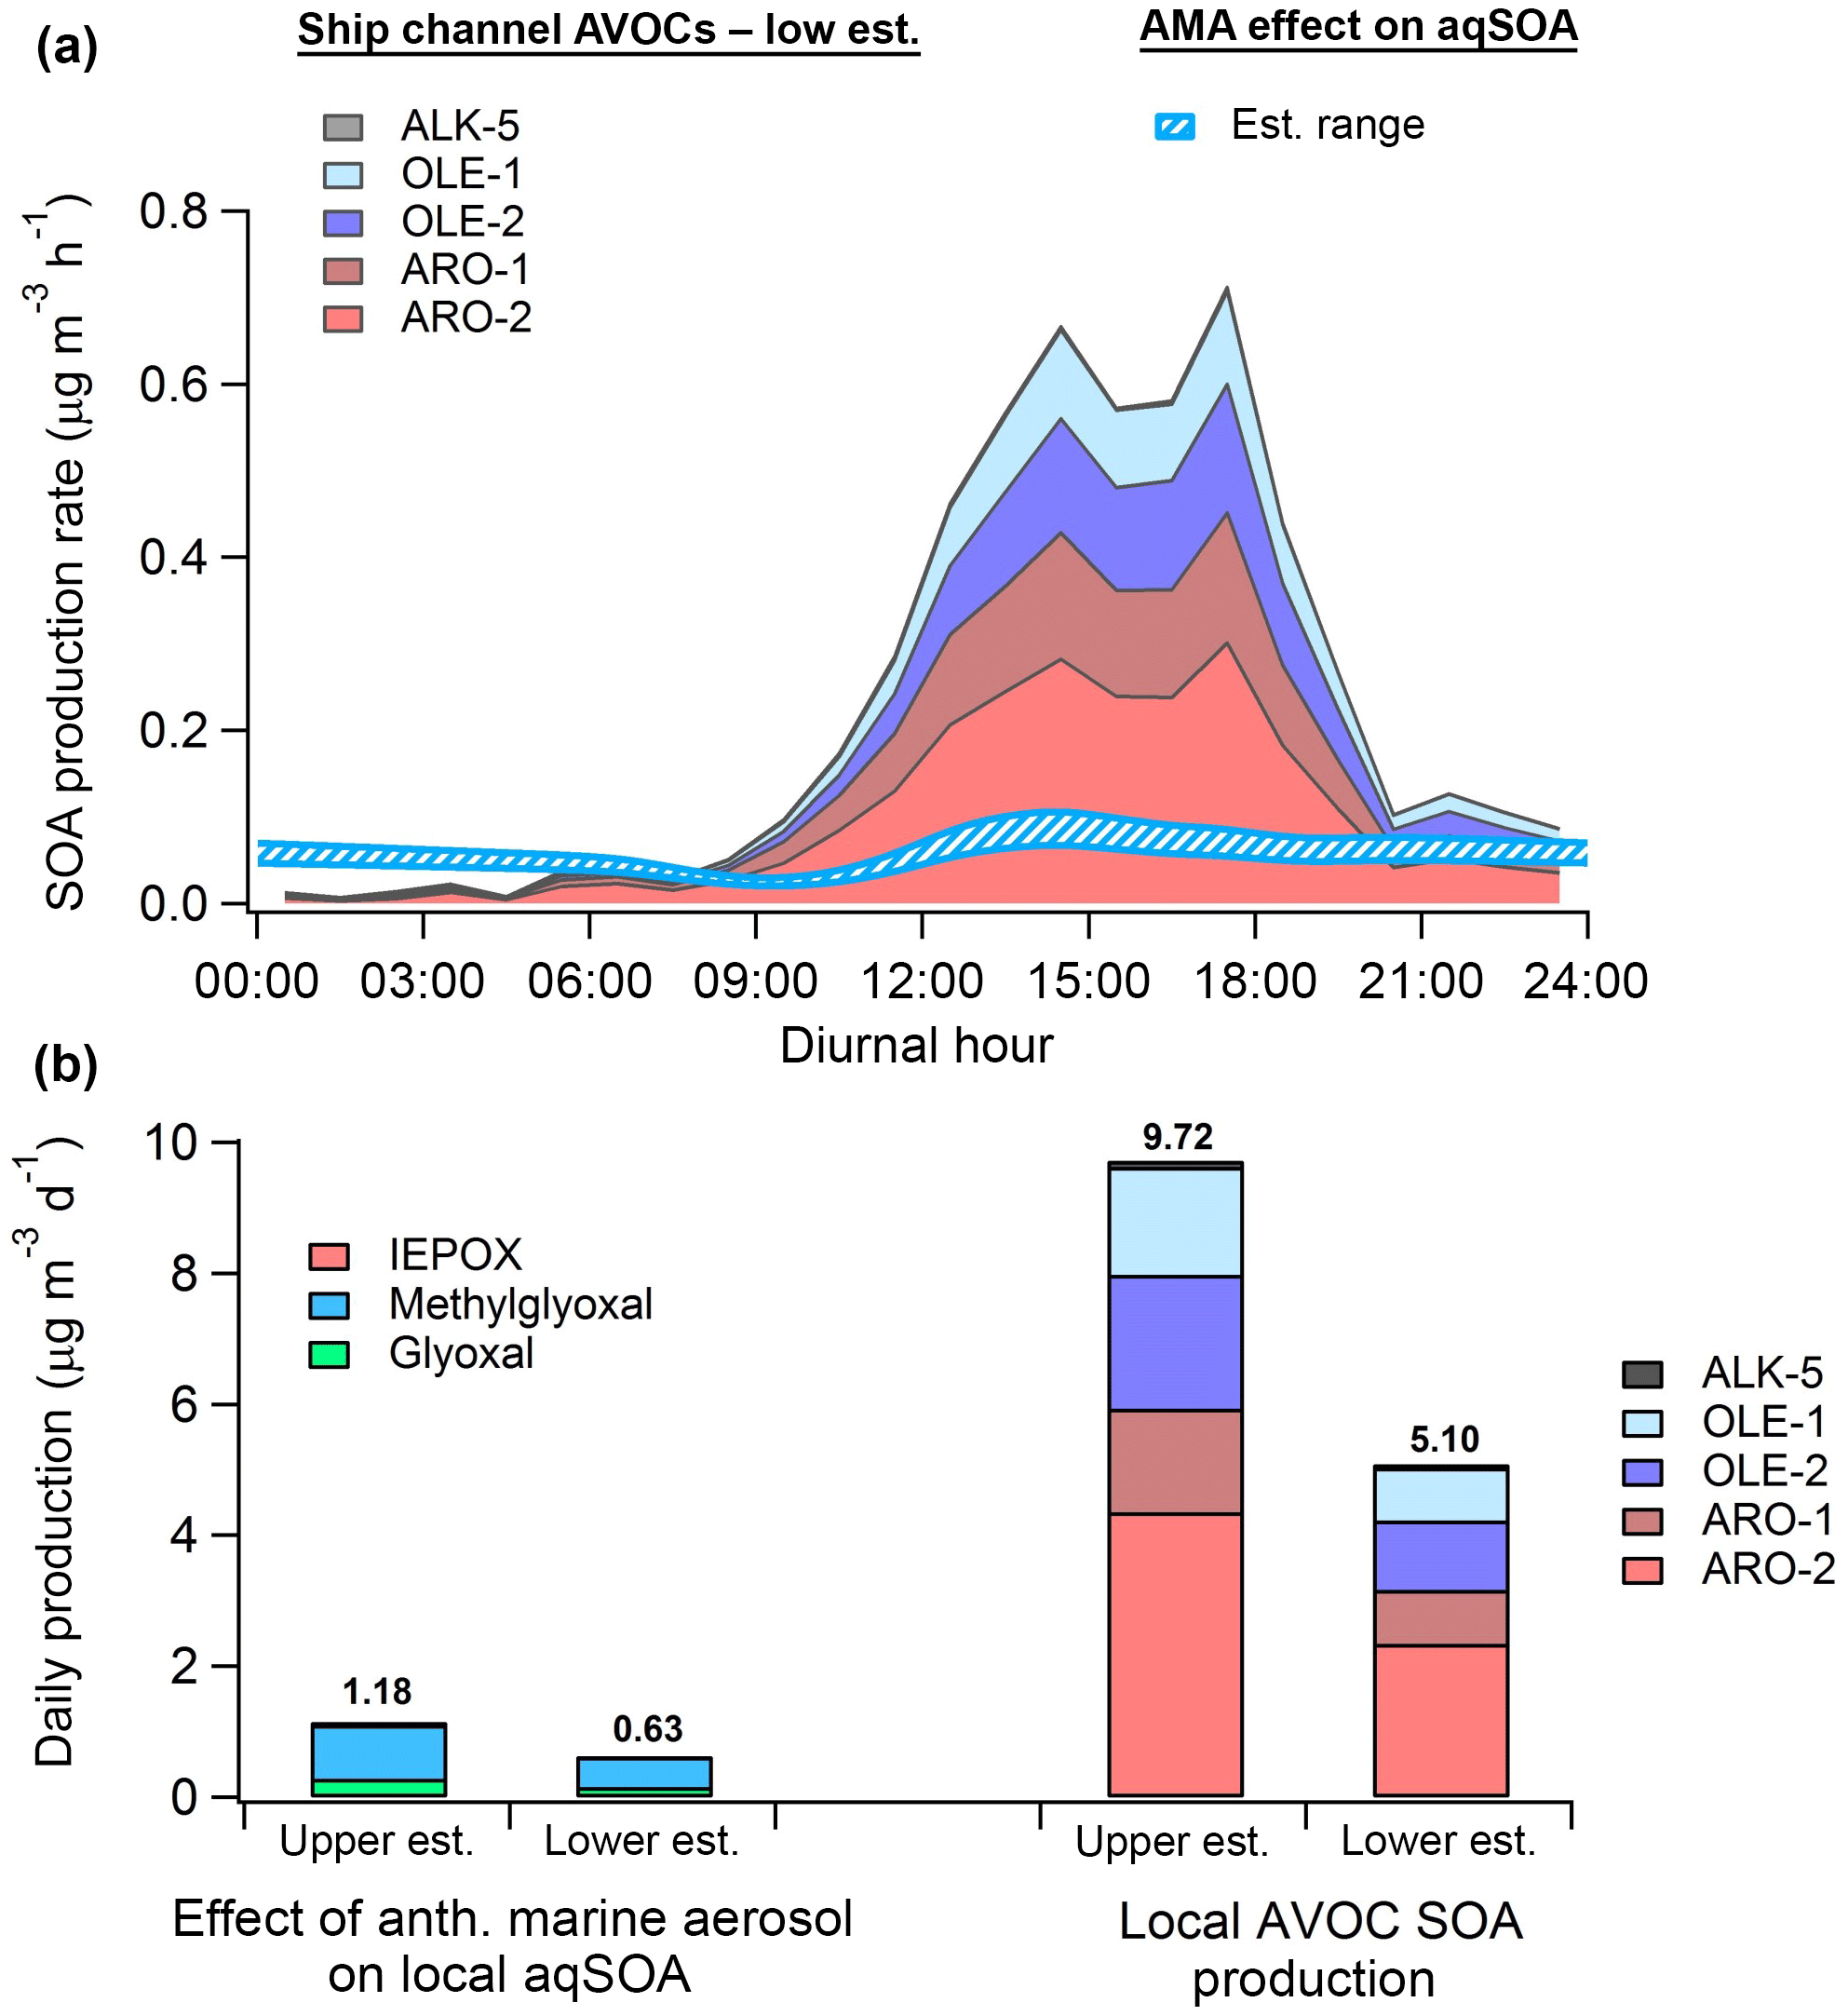
Figure 10(a) Diurnal SOA production rate calculated from anthropogenic VOCs (low estimate) measured by monitors in the HSC (filled) and the modeled-estimated production rate from WSOGs (glyoxal, methylglyoxal, IEPOX) attributable to the effect of anthropogenic marine aerosol (AMA) (hatched). (b) Total daily SOA production from WSOGs (upper and lower estimates) and HSC AVOCs (upper and lower estimates). WSOG aqSOA production is characterized by individual species. Note that IEPOX production is negligible. AVOC SOA production is characterized by lumped VOC species defined in Tsimpidi et al. (2010). These species are further described in the Supplement. Upper and lower estimates of AVOC SOA production are based on the assumed background OA mass loading, as described in the Supplement. High-NOx product yields were used for both AVOC estimates.
Figure 10 shows that, on a daily basis, aqSOA production attributable to isoprene WSOG reactive uptake is primarily due to methylglyoxal rather than IEPOX, implying “high-NOx” rather than “low-NOx” ambient conditions (Budisulistiorini et al., 2017). Assuming high-NOx conditions, the modeled effect of AMA on aqSOA production in the HSC is equivalent to 6 %–23 % of potential daily SOA production from AVOCs measured locally. Using data from the monitor with the highest isoprene concentrations (Haden Road; Fig. S24), we predict that the AMA effect may constitute as much as 11 %–43 % of total AVOC-SOA production, implying strong spatial variability in the relative contribution of this effect. Modeled AVOC-SOA production peaks in the early afternoon, consistent with the fact that the aging of condensable gases formed by measured VOCs produces the majority (∼80 %) of modeled AVOC-SOA.
Recent studies have revealed that a substantial fraction of SOA formation in urban environments may be produced by primary anthropogenic semi-volatile/intermediate volatility VOCs (P-S/IVOCs) co-emitted with typical VOCs or evaporated during POA dilution but not typically measured (Hayes et al., 2015, and references therein). In Los Angeles, for instance, Hayes et al. (2015) predicted that P-S/IVOCs comprise between 44 % and 92 % of total modeled SOA depending on the specific SOA formation mechanism used. As a result, the relative magnitude of the AMA effect may be somewhat overestimated here. Still, the AMA effect is responsible for 0.2–0.35 µg m3 of ambient aqSOA according to the model calculations, which represents 4 %–6 % of ambient OA measured by Cleveland et al. (2012) near downtown, ∼3 %–5 % of OA modeled using CMAQ by Li et al. (2015), and as high as ∼10 %–17 % of average OA measured in Houston's urban core by Leong et al. (2017). Furthermore, as AVOCs such as benzene and acetylene are known to produce glyoxal and methylglyoxal with high yields (Fu et al., 2008), the total OA mass attributable to AMA through this pathway (on an absolute rather than relative basis) may actually be larger than predicted here. Our results therefore suggest that future reductions in marine nss-SO4 may reduce aqSOA formation in both urban (e.g., Houston) and forested regions across the Gulf Coast.
Three weeks of continuous measurements with an HR-ToF-AMS at a coastal location near Houston, TX, were used to gain further insight into the impact of shipping emissions on coastal aerosol properties. Measured mass loadings of inorganic NR-PM1 components were similar to those reported before establishment of the ECA within the Gulf of Mexico; however, data from nearby ports suggest that this is the result of growth in the shipping trade rather than regulatory ineffectiveness on a per-vessel basis. Using MSA calibrations and published biogenic MSA / nss-SO4 ratios, we predict that over 70 % of inorganic marine NR-PM1 is anthropogenic rather than biogenic. Source apportionment using PMF revealed that the dominant marine OA factor (OOA-3) is highly correlated with calculated anthropogenic nss-SO4 (R2≥0.78), supporting a link between shipping emissions and SOA production. Assuming, as an upper-bound estimate, that OOA-3 production is entirely dependent on shipping emissions, anthropogenic sources contribute over 70 % of total measured NR-PM1 during onshore flow, despite the regulations. This suggests that the proposed future global decrease in shipping FSC (decrease to 0.5 %) should substantially reduce PM levels over the Gulf of Mexico. However, longer-term studies are warranted to fully investigate this possibility.
Shipping emissions were also found to have numerous secondary effects on OA composition. Detailed backward-trajectory and mass spectral analysis revealed that air mass transit within shipping lanes leads to more processed (i.e., oxidized) OA than is encountered in “clean” marine air masses, and calculations suggest that this aging increases OA hygroscopicity. In addition, marine alkyl amine aerosol formation in the Gulf of Mexico appears to depend on ambient anthropogenic nss-SO4 mass, implying that marine amine aerosol cannot be viewed as purely biogenic in heavily trafficked marine environments. OOA-3 was found to have a larger N:C ratio than is typical of aged marine components, supporting this link. Finally, modeling suggests that inland advection of shipping-related nss-SO4 and related ALW may enhance aqSOA formation and produce 4 % to 17 % of OA in the urban core of Houston during marine flow for the conditions considered. Future detailed three-dimensional modeling studies are recommended to better quantify this effect.
The compiled datasets used to produce each figure within the paper are available as Igor Pro files upon request.
The supplement related to this article is available online at: https://doi.org/10.5194/acp-18-14217-2018-supplement.
All listed authors other than QD contributed to data collection during the field campaign. BCS performed the data analysis and wrote the manuscript. RJG assisted heavily with manuscript development and editing. HWW, AB, QD, MHE, JHF, SA, SU, and RS provided helpful comments and edits.
The authors declare that they have no conflict of interest.
The authors would like to acknowledge Jochen Stutz and Katie Tuite (UCLA) for
assistance and helpful discussions during the field campaign. This material
is based upon work supported by the National Science Foundation Graduate
Research Fellowship under grant no. DGE# 1450681.
Edited by: Robert Harley
Reviewed by: two anonymous referees
Agrawal, H., Welch, W. A., Miller, J. W., and Cocker, D. R.: Emission measurements from a crude oil tanker at sea, Environ. Sci. Technol., 42, 7098–7103, https://doi.org/10.1021/es703102y, 2008.
Agrawal, H., Eden, R., Zhang, X., Fine, P. M., Katzenstein, A., Miller, J. W., Ospital, J., Teffera, S., and Cocker, D.: Primary particulate matter from ocean-going engines in the Southern California Air Basin, Environ. Sci. Technol., 43, 5398–5402, https://doi.org/10.1021/es8035016, 2009.
Aksoyoglu, S., Baltensperger, U., and Prévôt, A. S. H.: Contribution of ship emissions to the concentration and deposition of air pollutants in Europe, Atmos. Chem. Phys., 16, 1895–1906, https://doi.org/10.5194/acp-16-1895-2016, 2016.
Bahreini, R., Ervens, B., Middlebrook, A. M., Warneke, C., de Gouw, J. A., DeCarlo, P. F., Jimenez, J. L., Brock, C. A., Neuman, J. A., Ryerson, T. B., Stark, H., Atlas, E., Brioude, J., Fried, A., Holloway, J. S., Peischl, J., Richter, D., Walega, J., Weibring, P., Wollny, A. G., and Fehsenfeld, F. C.: Organic aerosol formation in urban and industrial plumes near Houston and Dallas, Texas, J. Geophys. Res.-Atmos. 114, D00F16, https://doi.org/10.1029/2008JD011493, 2009.
Bates, T. S., Quinn, P. K., Coffman, D., Schulz, K., Covert, D. S., Johnson, J. E., Williams, E. J., Lerner, B. M., Angevine, W. M., Tucker, S. C., Brewer, W. A., and Stohl, A.: Boundary layer aerosol chemistry during TexAQS/GoMACCS 2006: Insights into aerosol sources and transformation processes, J. Geophys. Res.-Atmos., 113, D00F01, https://doi.org/10.1029/2008JD010023, 2008.
Bates, T. S., Quinn, P. K., Frossard, A. A., Russell, L. M., Hakala J., Petajä, T., Kulmala, M., Covert, D. S., Cappa, C. D., Li, S.-M., Hayden, K. L., Nuaaman, I., McLaren, R., Massoli, P., Canagaratna, M. R, Onasch, T. B., Sueper, D., Worsnop, D. R., and Keene, W. C.: Measurements of ocean derived aerosol off the coast of California, J. Geophys. Res., 117, D00V15, https://doi.org/10.1029/2012JD017588, 2012.
Bean, J. K., Faxon, C. B., Leong, Y. J., Wallace, H. W., Cevik, B. K., Ortiz, S., Canagaratna, M. R., Usenko, S., Sheesley, R. J., Griffin, R. J., and Hildebrandt, L: Composition and sources of particulate matter measured near Houston, TX; Anthropogenic-biogenic interactions, Atmos., 7, 73, https://doi.org/10.3390/atmos7050073, 2016.
Brown, S. S., Dubé, W. P., Bahreini, R., Middlebrook, A. M., Brock, C. A., Warneke, C., de Gouw, J. A., Washenfelder, R. A., Atlas, E., Peischl, J., Ryerson, T. B., Holloway, J. S., Schwarz, J. P., Spackman, R., Trainer, M., Parrish, D. D., Fehshenfeld, F. C., and Ravishankara, A. R.: Biogenic VOC oxidation and organic aerosol formation in an urban nocturnal boundary layer: aircraft vertical profiles in Houston, TX, Atmos. Chem. Phys., 13, 11317–11337, https://doi.org/10.5194/acp-13-11317-2013, 2013.
Browning, L., Hartley, S., Bandemehr, A., Gathright, K., and Miller, W.: Demonstration of fuel switching on oceangoing vessels in the Gulf of Mexico, J. Air. Waste Manag. Assoc., 62, 1093–1101, https://doi.org/10.1080/10962247.2012.697974, 2012.
Budisulistiorini, S. H., Nenes, A., Carlton, A. G., Surratt, J. D., McNeill, V. F., and Pye, H. O. T.: Simulating aqueous phase isoprene epoxydiol (IEPOX) secondary organic aerosol production during the 2013 Southern Oxidant and Aerosol Study (SOAS), Environ. Sci. Tech., 51, 5026–5034, https://doi.org/10.1021/acs.est.6b05750, 2017.
Caiazzo, F., Ashok, A., Waitz, I. A., Yim, S. H. L., and Barrett, S. R. H.: Air pollution and early deaths in the United States: Part I: Quantifying the impact of major sectors in 2005, Atmos. Environ., 79, 198–208, https://doi.org/10.1016/j.atmosenv.2013.05.081, 2013.
Canagaratna, M. R., Jayne, J. T., Jimenez, J. L., Allan, J. D., Alfarra, M. R., Zhang, Q., Onasch, T. B., Drewnick, F., Coe, H., Middlebrook, A., Delia, A., Williams, L. R., Trimborn, A. M., Northway, M. J., DeCarlo, P. F., Kolb, C. E., Davidovits, P., and Worsnop, D. R.: Chemical and microphysical characterization of ambient aerosols with the aerodyne aerosol mass spectrometer, Mass Spectrom. Rev., 26, 185–222, https://doi.org/10.1002/mas.20115, 2007.
Canagaratna, M. R., Jimenez, J. L., Kroll, J. H., Chen, Q., Kessler, S. H., Massoli, P., Hildebrandt Ruiz, L., Fortner, E., Williams, L. R., Wilson, K. R., Surratt, J. D., Donahue, N. M., Jayne, J. T., and Worsnop, D. R.: Elemental ratio measurements of organic compounds using aerosol mass spectrometry: characterization, improved calibration, and implications, Atmos. Chem. Phys., 15, 253–272, https://doi.org/10.5194/acp-15-253-2015, 2015.
Carlton, A. G. and Turpin, B. J.: Particle partitioning potential of organic compounds is highest in the Eastern U.S. and driven by anthropogenic water, Atmos. Chem. Phys., 13, 10203–10214, https://doi.org/10.5194/acp-13-10203-2013, 2013.
Chang, R. Y.-W., Leck, C., Graus, M., Müller, M., Paatero, J., Burkhart, J. F., Stohl, A., Orr, L. H., Hayden, K., Li, S.-M., Hansel, A., Tjernström, M., Leaitch, W. R., and Abbatt, J. P. D.: Aerosol composition and sources in the central Arctic Ocean during ASCOS, Atmos. Chem. Phys., 11, 10619–10636, https://doi.org/10.5194/acp-11-10619-2011, 2011.
Chen, G., Huey, L. G., Trainer, M., Nicks, D., Corbett, J., Ryerson, T., Parrish, D., Neuman, J. A., Nowak, J., Tanner, D., Holloway, J., Brock, C., Crawford, J., Olson, J. R., Sullivan, A., Weber, R., Schauffler, S., Donnelly, S., Atlas, E., Roberts, J., Flocke, F., Hubler, G., and Fehsenfeld, F.: An investigation of the chemistry of ship emission plumes during ITCT 2002, J. Geophys. Res., 110, D10S90, https://doi.org/10.1029/2004JD005236, 2005.
Chhabra, P. S., Flagan, R. C., and Seinfeld, J. H.: Elemental analysis of chamber organic aerosol using an aerodyne high-resolution aerosol mass spectrometer, Atmos. Chem. Phys., 10, 4111–4131, https://doi.org/10.5194/acp-10-4111-2010, 2010.
Chhabra, P. S., Ng, N. L., Canagaratna, M. R., Corrigan, A. L., Russell, L. M., Worsnop, D. R., Flagan, R. C., and Seinfeld, J. H.: Elemental composition and oxidation of chamber organic aerosol, Atmos. Chem. Phys., 11, 8827–8845, https://doi.org/10.5194/acp-11-8827-2011, 2011.
Claeys, M. B., Wang, W., Vermeylen, R., Kourtchev, I., Chi, X., Farhat, Y.J., Surratt, D., Gomez-Gonzalez, Y., Sciare, J., and Maenhaut, W.: Chemical characterization of marine aerosol at Amsterdam Island during the austral summer of 2006–2007, J. Aero. Sci., 41, 13–22, https://doi.org/10.1016/j.jaerosci.2009.08.003, 2009.
Cleveland, M. J., Ziemba, L. D., Griffin, R. J., Dibb, J. E., Anderson C. H., Lefer, B., and Rappengluck, B.: Characterization of urban aerosol using aerosol mass spectrometry and proton nuclear magnetic resonance spectroscopy, Atmos. Environ., 54, 511–518, https://doi.org/10.1016/j.atmosenv.2012.02.074, 2012.
Coakley, J. A. Jr., Bernstein, R. L., and Durkee, P. A.: Effect of ship-stack effluents on cloud reflectivity, Science, 237, 1020–1022, https://doi.org/10.1126/science.237.4818.1020, 1987.
Coggon, M. M., Sorooshian, A., Wang, Z., Metcalf, A. R., Frossard, A. A., Lin, J. J., Craven, J. S., Nenes, A., Jonsson, H. H., Russell, L. M., Flagan, R. C., and Seinfeld, J. H.: Ship impacts on the marine atmosphere: insights into the contribution of shipping emissions to the properties of marine aerosol and clouds, Atmos. Chem. Phys., 12, 8439–8458, https://doi.org/10.5194/acp-12-8439-2012, 2012.
Coggon, M. M., Sorooshian, A., Wang, Z., Craven, J. S., Metcalf, A. R., Lin, J. J., Nenes, A., Jonsson, H. H., Flagan, R. C., and Seinfeld, J. H.: Observations of continental biogenic impacts on marine aerosol and clouds off the coast of California, J. Geophys. Res., 119, 6724–6748, https://doi.org/10.1002/2013JD021228, 2014.
Corbett, J. J. and Kohler, H. W.: Updated emissions from ocean shipping, J. Geophys. Res., 108, 4650, https://doi.org/10.1029/2003JD003751, 2003.
Corbett, J. J., Winebrake, J. J., Green, E. H., Kasibhatla, P., Eyring, V., and Lauer, A.: Mortality from ship emissions: A global assessment, Environ. Sci. Technol., 41, 8512–8518, https://doi.org/10.1021/es071686z, 2007.
Crippa, M., Canonaco, F., Lanz, V. A., Äijälä, M., Allan, J. D., Carbone, S., Capes, G., Ceburnis, D., Dall'Osto, M., Day, D. A., DeCarlo, P. F., Ehn, M., Eriksson, A., Freney, E., Hildebrandt Ruiz, L., Hillamo, R., Jimenez, J. L., Junninen, H., Kiendler-Scharr, A., Kortelainen, A.-M., Kulmala, M., Laaksonen, A., Mensah, A. A., Mohr, C., Nemitz, E., O'Dowd, C., Ovadnevaite, J., Pandis, S. N., Petäjä, T., Poulain, L., Saarikoski, S., Sellegri, K., Swietlicki, E., Tiitta, P., Worsnop, D. R., Baltensperger, U., and Prévôt, A. S. H.: Organic aerosol components derived from 25 AMS data sets across Europe using a consistent ME-2 based source apportionment approach, Atmos. Chem. Phys., 14, 6159–6176, https://doi.org/10.5194/acp-14-6159-2014, 2014.
Crippa, M., El Haddad, I., Slowik, J. G., DeCarlo, P. F., Mohr, C., Heringa, M. F., Chirico, R., Marchand, N., Sciare, J., Baltensperger, U., and Prévôt, A. S. H.: Identification of marine and continental aerosol sources in Paris using high resolution aerosol mass spectrometry, J. Geophys. Res.-Atmos., 118, 1950–1963, https://doi.org/10.1002/jgrd.50151, 2013.
Czech, H., Stengel, B., Adam, T., Sklorz, M., Streibel, T., and Zimmerman, R.: A chemometric investigation of aromatic emission profiles from a marine engine in comparison with residential wood combustion and road traffic: Implications for source apportionment inside and outside sulphur emission control areas, Atmos. Environ., 167, 212–222, https://doi.org/10.1016/j.atmosenv.2017.08.022, 2017.
DeCarlo, P. F., Kimmel, J. R., Trimborn, A., Northway, M. J., Jayne, J. T., Aiken, A. C., Gonin, M., Fuhrer, K., Horvath, T., Docherty, K. S., Worsnop, D. R., and Jimenez, J. L.: Field-deployable, high-resolution, time-of-flight aerosol mass spectrometer, Anal. Chem., 78, 8281–8289, https://doi.org/10.1021/ac061249n, 2006.
Draxler, R. R. and Rolph, G. D.: HYSPLIT (Hybrid Single-Particle Lagrangian Integrated Trajectory) Model, access via NOAA ARL READY Website, NOAA Air Resources Laboratory, Silver Spring, MD, available at: http://www.arl.noaa.gov/ready/hysplit4.html, last access: 30 August 2018, 2013.
Duplissy, J., DeCarlo, P. F., Dommen, J., Alfarra, M. R., Metzger, A., Barmpadimos, I., Prevot, A. S. H., Weingartner, E., Tritscher, T., Gysel, M., Aiken, A. C., Jimenez, J. L., Canagaratna, M. R., Worsnop, D. R., Collins, D. R., Tomlinson, J., and Baltensperger, U.: Relating hygroscopicity and composition of organic aerosol particulate matter, Atmos. Chem. Phys., 11, 1155–1165, https://doi.org/10.5194/acp-11-1155-2011, 2011.
Durkee, P. A., Noone, K. J., and Bluth, R. T.: The Monterey Area Ship Track Experiment, J. Atmos. Sci., 57, 2523–2541, https://doi.org/10.1175/1520-0469(2000)057<2523:TMASTE>2.0.CO;2, 2000.
Ervens, B., Turpin, B. J., and Weber, R. J.: Secondary organic aerosol formation in cloud droplets and aqueous particles (aqSOA): a review of laboratory, field and model studies, Atmos. Chem. Phys., 11, 11069–11102, https://doi.org/10.5194/acp-11-11069-2011, 2011.
Ervens, B., Sorooshian, A., Lim, Y. B., and Turpin, B.: Key parameters controlling OH-initiated formation of secondary organic aerosol in the aqueous phase (aqSOA), J. Geophys. Res.-Atmos., 119, 3997–4016, https://doi.org/10.1002/2013JD021021, 2014.
Eyring, V., Kohler, H. W., Lauer, A., and Lemper, B.: Emissions from international shipping: 2. Impact of future technologies on scenarios until 2050, J. Geophys. Res., 110, D17301, https://doi.org/10.1029/2004JD005620, 2005.
Eyring, V., Isaksen, I. S. A., Berntsen, T., Collins, W. J., Corbett, J. J., Endresen, O., Grainger, R. G., Moldanova, J., Schlager, H., and Stevenson, D. S.: Transport impacts on atmosphere and climate: Shipping, Atmos. Environ., 44, 4735–4771, https://doi.org/10.1016/j.atmosenv.2009.04.059, 2010.
Facchini, M. C., Decesari, S., Rinaldi, M., Carbone, C., Finessi, E., Mircea, M., Fuzzi, S., Moretti, F., Tagliavini, E., Ceburnis, D., and O'Dowd, C. D.: Important source of marine secondary organic aerosol from biogenic amines, Environ. Sci. Technol., 42, 9116–9121, https://doi.org/10.1021/es8018385, 2008.
Faloona, I.: Sulfur processing in the marine atmospheric boundary layer: A review and critical assessment of modeling uncertainties, Atmos. Environ., 43, 2841–2854, https://doi.org/10.1016/j.atmosenv.2009.02.043, 2009.
Fountoukis, C. and Nenes, A.: ISORROPIA II: a computationally efficient thermodynamic equilibrium model for aerosols, Atmos. Chem. Phys., 7, 4639–4659, https://doi.org/10.5194/acp-7-4639-2007, 2007.
Frossard, A. A., Russell, L. M., Burrows, S. M., Elliott, S. M., Bates, T. S., and Quinn, P. K.: Sources and composition of submicron organic mass in marine aerosol particles, J. Geophys. Res.-Atmos., 119, 12977–13003, https://doi.org/10.1002/2014JD021913, 2014.
Fu, P., Kawamura, K., and Miura, K.: Molecular characterization of marine organic aerosols collected during a round-the-world cruise, J. Geophys. Res.-Atmos., 116, D13302, https://doi.org/10.1029/2011JD015604, 2011.
Fu, T., Jacob, D. J., Wittrock, F., Burrows, J. P., Vrekoussis, M., and Henze, D. K.: Global budgets of atmospheric glyoxal and methylglyoxal, and implications for formation of secondary organic aerosols, J. Geophys. Res. Atmos., 113, 15303, https://doi.org/10.1029/2007JD009505, 2008.
Gantt, B. and Meskhidze, N.: The physical and chemical characteristics of marine primary organic aerosol: a review, Atmos. Chem. Phys., 13, 3979–3996, https://doi.org/10.5194/acp-13-3979-2013, 2013.
Gantt, B., Meskhidze, N., Facchini, M. C., Rinaldi, M., Ceburnis, D., and O'Dowd, C. D.: Wind speed dependent size-resolved parameterization for the organic mass fraction of sea spray aerosol, Atmos. Chem. Phys., 11, 8777–8790, https://doi.org/10.5194/acp-11-8777-2011, 2011.
Gaston, C. J., Pratt, K. A., Qin, X., and Prather, K. A.: Real-time detection and mixing state of methanesulfonate in single particles at an inland urban location during a phytoplankton bloom, Environ. Sci. Technol., 44, 1566–1572, https://doi.org/10.1021/es902069d, 2010.
Ge, X., Zhang, Q., Sun, Y., Ruehl, C. R., and Setyan, A.: Effect of aqueous-phase processing on aerosol chemistry and size distributions in Fresno, California, during wintertime, Environ. Chem., 9, 221–235, https://doi.org/10.1071/en11168, 2012.
Guo, Q., Hu, M., Guo, S., Wu, Z., Hu, W., Peng, J., Hu, W., Wu, Y., Yuan, B., Zhang, Q., and Song, Y: The identification of source regions of black carbon at a receptor site off the eastern coast of China, Atmos. Environ., 100, 78–84, https://doi.org/10.1016/j.atmosenv.2014.10.053, 2014.
Hayes, P. L., Ortega, A. M., Cubison, M. J., Froyd, K. D., Zhao, Y., Cliff, S. S., Hu, W. W., Toohey, D. W., Flynn, J. H., Lefer, B. L., Grossberg, N., Alvarez, S., Rappenglück, B., Taylor, J. W., Allan, J. D., Holloway, J. S., Gilman, J. B., Kuster, W. C., de Gouw, J. A., Massoli, P., Zhang, X., Liu, J., Weber, R. J., Corrigan, A. L., Russell, L. M., Isaacman, G., Worton, D. R., Kreisberg, N. M., Goldstein, A. H., Thalman, R., Waxman, E. M., Volkamer, R., Lin, Y. H., Surratt, J. D., Kleindienst, T. E., Offenberg, J. H., Dusanter, S., Griffith, S., Stevens, P. S., Brioude, J., Angevine, W. M., and Jimenez, J. L.: Organic aerosol composition and sources in Pasadena, California, during the 2010 CalNex campaign, J. Geophys. Res.-Atmos., 118, 9233–9257, https://doi.org/10.1002/jgrd.50530, 2013.
Hayes, P. L., Carlton, A. G., Baker, K. R., Ahmadov, R., Washenfelder, R. A., Alvarez, S., Rappenglück, B., Gilman, J. B., Kuster, W. C., de Gouw, J. A., Zotter, P., Prévôt, A. S. H., Szidat, S., Kleindienst, T. E., Offenberg, J. H., Ma, P. K., and Jimenez, J. L.: Modeling the formation and aging of secondary organic aerosols in Los Angeles during CalNex 2010, Atmos. Chem. Phys., 15, 5773–5801, https://doi.org/10.5194/acp-15-5773-2015, 2015.
Hildebrandt, L., Engelhart, G. J., Mohr, C., Kostenidou, E., Lanz, V. A., Bougiatioti, A., DeCarlo, P. F., Prevot, A. S. H., Baltensperger, U., Mihalopoulos, N., Donahue, N. M., and Pandis, S. N.: Aged organic aerosol in the Eastern Mediterranean: the Finokalia Aerosol Measurement Experiment – 2008, Atmos. Chem. Phys., 10, 4167–4186, https://doi.org/10.5194/acp-10-4167-2010, 2010.
Hildebrandt, L., Kostenidou, E., Lanz, V. A., Prevot, A. S. H., Baltensperger, U., Mihalopoulos, N., Laaksonen, A., Donahue, N. M., and Pandis, S. N.: Sources and atmospheric processing of organic aerosol in the Mediterranean: insights from aerosol mass spectrometer factor analysis, Atmos. Chem. Phys., 11, 12499–12515, https://doi.org/10.5194/acp-11-12499-2011, 2011.
Hopke, P. K., Barrie, L. A., Li, S. M., Cheng, M. D., Li, C., and Xie, Y.: Possible sources and preferred pathways for biogenic and non-sea-salt sulfur for the high arctic. J. Geophys. Res.-Atmos. 100, 16595–16603, https://doi.org/10.1029/95JD01712, 1995.
Huang, D. D., Li, Y. J., Lee, B. P., and Chan, C. K.: Analysis of organic sulfur compounds in atmospheric aerosols at the HKUST supersite in Hong Kong using HR-ToF-AMS, Environ. Sci. Technol., 49, 3672–3679, https://doi.org/10.1021/es5056269, 2015.
Huang, S., Poulain, L., Pinxteren, D. V., Pinxteren, M. V., Wu, Z., Herrmann, H., and Wiedensohler, A.: Latitudinal and seasonal distribution of particulate MSA over the Atlantic using a validated quantification method with HR-ToF-AMS, Environ. Sci. Technol., 51, 418–426, https://doi.org/10.1021/acs.est.6b03186, 2017.
Hynes, A. J., Wine, P. H., and Semmes, D. H.: Kinetics and mechanism of hydroxyl reactions with organic sulfide, J. Phys. Chem., 90, 4148–4156, https://doi.org/10.1021/j100408a062, 1986.
IMO: International Shipping Facts and Figures – Information Resources on Trade, Safety, Security, Environment, International Maritime Organization, 2012.
Johansson, L., Jalkanen, J.-P., and Kukkonen, J.: Global assessment of shipping emissions in 2015 on a high spatial and temporal resolution, Atmos. Environ., 167, 403–415, https://doi.org/10.1016/j.atmosenv.2017.08.042, 2017.
Jung, J., Furutani, H., Uematsu, M., and Park, J.: Distributions of atmospheric non-sea-salt sulfate and methanesulfonic acid over the Pacific Ocean between 48∘ N and 55∘ S during summer, Atmos. Environ., 99, 374–384, https://doi.org/10.1016/j.atmosenv.2014.10.009, 2014.
Kasper, A., Aufdenblatten, S., Forss, A., Mohr, M., and Burtscher, H.: Particulate emissions from a low-speed marine diesel engine, Aerosol Sci. Technol., 41, 24–32, https://doi.org/10.1080/02786820601055392, 2007.
Kerminen, V.-M., Aurela, M., Hillamo, R. E., and Virkkula, A.: Formation of particulate MSA: deductions from size distribution measurements in the Finnish Arctic, Tellus, 49B, 159–171, https://doi.org/10.3402/tellusb.v49i2.15959, 1997.
Kim, H. S., Song, C. H., Park, R. S., Huey, G., and Ryu, J. Y.: Investigation of ship-plume chemistry using a newly-developed photochemical/dynamic ship-plume model, Atmos. Chem. Phys., 9, 7531–7550, https://doi.org/10.5194/acp-9-7531-2009, 2009.
Kim, H. S., Kim, Y. H., and Song, C. H.: Ship-plume sulfur chemistry: ITCT 2K2 case study, Sci. Tot. Environ., 450–451, 178–187, https://doi.org/10.1016/j.scitotenv.2013.01.099, 2013.
Kotchenruther, R.: The effects of marine vessel fuel sulfur regulations on ambient PM2.5 at coastal and near coastal monitoring sites in the U.S., Atmos. Environ., 151, 52–61, https://doi.org/10.1016/j.atmosenv.2016.12.012, 2016.
Lack, D. A., Corbett, J. J., Onasch, T., Lerner, B., Massoli, P., Quinn, P. K., Bates, T. S., Covert, D. S., Coffman, D., Sierau, B., Herndon, S., Allan, J., Baynard, T., Lovejoy, E., Ravishankara, A. R., and Williams, E.: Particulate emissions from commercial shipping: Chemical, physical, and optical properties, J. Geophys. Res., 114, D00F04, https://doi.org/10.1029/2008JD011300, 2009.
Lack, D. A., Cappa, C. D., Langridge, J., Bahreini, R., Buffaloe, G., Brock, C. A., Cerully, K., Hayden, K., Holloway, J. S., Lerner, B., Li, S. M., McLaren, R., Middlebrook, A., Moore, R., Nenes, A., Nuaanman, I., Peischl, J., Perring, A., Quinn, P. K., Ryerson, T. B., Schwarz, J. P., Spackman, J. R., and Williams, E. J.: Impact of fuel quality regulation and speed reductions on shipping emissions: Implications for climate and air quality, Environ. Sci. Technol., 45, 9052–9060, https://doi.org/10.1021/es2013424, 2011.
Lauer, A., Eyring, V., Hendricks, J., Jockel, P., and Lohmann, U.: Effects of oceangoing shipping on aerosols and clouds, Atmos. Chem. Phys., 7, 5061–5079, https://doi.org/10.5194/acp-7-5061-2007, 2007.
Lawrence, M. G. and Crutzen, P. J.: Influence of NOx emissions from ships on tropospheric photochemistry and climate, Nature, 402, 167–170, https://doi.org/10.1038/46013, 1999.
Leong, Y. J., Sanchez, N. P., Wallace, H. W., Cevik, K., Hernandez, C. S., Han, Y., Flynn, J. H., Massoli, P., Floerchinger, C., Fortner E. C., Herndon, S., Bean, J. K., Hildebrandt Ruiz, L., Jeon, W., Choi, Y., Lefer, B., and Griffin, R. J.: Overview of surface measurements and spatial characterization of submicrometer particulate matter during the DISCOVER-AQ 2013 campaign in Houston, J. Air Waste Manage. Assoc., 28, 1–19, https://doi.org/10.1080/10962247.2017.1296502, 2017.
Li, J., Cleveland, M., Ziemba, L. D., Griffin, R. J., Barsanti, K. C., Pankow, J. F., and Ying, Q.: Modeling regional secondary organic aerosol using the Master Chemical Mechanism, Atmos. Environ., 102, 52–61, https://doi.org/10.1016/j.atmosenv.2014.11.054, 2015.
Lin, C. T., Baker, A. R., Jickells, T. D., Kelly, S., and Lesworth, T.: An assessment of the significance of sulphate sources over the Atlantic Ocean based on sulphur isotope data, Atmos. Environ., 62, 615–621, https://doi.org/10.1016/j.atmosenv.2012.08.052, 2012.
Liu, H., Fu, M., Jin, X., Shang, Y., Shindell, D., Faluvegi, G., Shindell, C., and He, K.: Health and climate impacts of ocean-going vessels in East Asia, Nat. Clim. Change Adv., 6, 1037–1041, https://doi.org/10.1038/nclimate3083, 2016.
McNeill, V. F.: Aqueous organic chemistry in the atmosphere: sources and chemical processing of organic aerosols, Environ. Sci. Technol., 49, 1237–1244, https://doi.org/10.1021/es5043707, 2015.
Middlebrook, A. M., Bahreini, R., Jimenez, J. L., and Canagaratna, M. R.: Evaluation of composition-dependent collection efficiencies for the Aerodyne aerosol mass spectrometer using field data, Aerosol. Sci. Technol., 46, 258–271, https://doi.org/10.1080/02786826.2011.620041, 2011.
Murphy, S. M., Sorooshian, A., Kroll, J. H., Ng, N. L., Chhabra, P., Tong, C., Surratt, J. D., Knipping, E., Flagan, R. C., and Seinfeld, J. H.: Secondary aerosol formation from atmospheric reactions of aliphatic amines, Atmos. Chem. Phys., 7, 2313–2337, https://doi.org/10.5194/acp-7-2313-2007, 2007.
Murphy, S. M., Agrawal, H., Sorooshian, A., Padro, L. T., Gates, H., Hersey, S., Welch, W. A., Jung, H., Miller, J. W., Cocker, D. R., Nenes, A., Jonsson, H. H., Flagan, R. C., and Seinfeld, J. H.: Comprehensive simultaneous shipboard and airborne characterization of exhaust from a modern container ship at sea, Environ. Sci. Technol., 43, 4626–4640, https://doi.org/10.1021/es802413j, 2009.
Myriokefalitakis, S., Vignati, E., Tsigaridis, K., Papadimas, C., Sciare, J., Mihalopoulos, N., Facchini, M. C., Rinaldi, M., Dentener, F. J., Ceburnis, D., Hatzianastasiou, N., O'Dowd, C. D., van Weele, M., and Kanakidou, M.: Global modelling of the oceanic source of organic aerosols, Adv. Meteorol., 2010, 939171, https://doi.org/10.1155/2010/939171, 2010.
Ng, N. L., Canagaratna, M. R., Zhang, Q., Jimenez, J. L., Tian, J., Ulbrich, I. M., Kroll, J. H., Docherty, K. S., Chhabra, P. S., Bahreini, R., Murphy, S. M., Seinfeld, J. H., Hildebrandt, L., Donahue, N. M., DeCarlo, P. F., Lanz, V. A., Prevot, A. S. H., Dinar, E., Rudich, Y., and Worsnop, D. R.: Organic aerosol components observed in Northern Hemispheric datasets from Aerosol Mass Spectrometry, Atmos. Chem. Phys., 10, 4625–4641, https://doi.org/10.5194/acp-10-4625-2010, 2010.
Nguyen, T. K. V., Zhang, Q., Jimenez, J. L., Pike, M., and Carlton, A. G.: Liquid water: ubiquitous contributor to aerosol mass, Environ. Sci. Technol. Lett., 3, 257–263, https://doi.org/10.1021/acs.estlett.6b00167, 2016.
Nightingale, P. D., Liss, P. S., and Schlosser, P.: Measurements of air-sea gas transfer during an open ocean algal bloom, J. Geophys. Res. Lett., 27, 2117–2120, https://doi.org/10.1029/2000GL011541, 2000.
Ortega, A. M., Hayes, P. L., Peng, Z., Palm, B. B., Hu, W., Day, D. A., Li, R., Cubison, M. J., Brune, W. H., Graus, M., Warneke, C., Gilman, J. B., Kuster, W. C., de Gouw, J., Gutiérrez-Montes, C., and Jimenez, J. L.: Real-time measurements of secondary organic aerosol formation and aging from ambient air in an oxidation flow reactor in the Los Angeles area, Atmos. Chem. Phys., 16, 7411–7433, https://doi.org/10.5194/acp-16-7411-2016, 2016.
Ovadnevaite, J., O'Dowd, C., Dall'Osto, M., Ceburnis, D., Worsnop, D. R., and Berresheim, H.: Detecting high contributions of primary organic matter to marine aerosol: A case study, Geophys. Res. Lett., 38, L02807, https://doi.org/10.1029/2010GL046083, 2011.
Ovadnevaite, J., Ceburnis, D., Leinert, S., Dall'Osto, M., Canagaratna, M., O'Doherty, S., Berresheim, H., and O'Dowd, C.: Submicron NE Atlantic marine aerosol chemical composition and abundance: Seasonal trends and air mass categorization, J. Geophys. Res. Atmos., 119, 11850–11863, https://doi.org/10.1002/2013JD021330, 2014.
Paatero, P. and Tapper, U.: Positive matrix factorization – A nonnegative factor model with optimal utilization of error-estimates of data values, Environmetrics, 5, 111–126, https://doi.org/10.1002/env.3170050203, 1994.
Peters, K., Stier, P., Quaas, J., and Grabl, H.: Aerosol indirect effects from shipping emissions: sensitivity studies with the global aerosol-climate model ECHAM-HAM, Atmos. Chem. Phys., 12, 5985–6007, https://doi.org/10.5194/acp-12-5985-2012, 2012
“Port Houston Statistics” Port Houston, available at: http://porthouston.com/portweb/about-us/statistics/, last access: 9 August 2017.
Raper, J. L., Kleb, M. M., Jacob, D. J., Davis, D., Newell, R. E., Fuelberg, H. E., Bendura, R. J., Hoell, J. M., and McNeal, R. J.: Pacific Exploratory Mission in the Tropical Pacific: PEM Tropics B, March–April 1999, J. Geophys. Res.-Atmos., 106, 32401–32425, https://doi.org/10.1029/2000JD900833, 2001.
Ren, X., van Duin, D., Cazorla, M., Chen, S., Mao, J., Zhang, L., Brune, W. H., Flynn, J., Grossberg, N., Lefer, B. L., Rappengluck, B., Wong, K. W., Tsai, C., Stutz, J., Dibb, J. E., Jobson, B. T., Luke, W. T., and Kelley, P.: Atmospheric oxidation chemistry and ozone production: Results from SHARP 2009 in Houston, Texas, J. Geophys. Res.-Atmos., 118, 5770–5780, https://doi.org/10.1002/jgrd.50342, 2013.
Rinaldi, M., Decesari, S., Finessi, E., Giulianelli, L., Carbone, C., Fuzzi, S., O'Dowd, C. D., Ceburnis, D., and Facchini, M. C.: Primary and secondary organic marine aerosol and oceanic biological activity: Recent results and new perspectives for future studies, Adv. Meteorol., 2010, 310–682, https://doi.org/10.1155/2010/310682, 2010.
Russell, L. M., Takahama, S., Liu, S., Hawkins, L. N., Covert, D. S., Quinn, P. K., and Bates, T. S.: Oxygenated fraction and mass of organic aerosol from direct emission and atmospheric processing measured on the R/V Ronald Brown during TexAQS/GoMACCS 2006, J. Geophys. Res.-Atmos., 114, D00F05, https://doi.org/10.1029/2008JD011275, 2009.
Russell, L. M., Hawkins, L. N., Frossard, A. A., Quinn, P. K., and Bates, T. S.: Carbohydrate-like composition of submicron atmospheric particles and their production from ocean bubble bursting, P. Natl. Acad. Sci. USA, 107, 6652–6657, https://doi.org/10.1073/pnas.0908905107, 2010.
Saltzman, E. S., Savoie, D. L., Zika, R. G., and Prospero, J. M.: Methane sulfonic acid in the marine atmosphere, J. Geophys. Res., 88, 10897–10902, https://doi.org/10.1029/JC088iC15p10897, 1983.
Savoie, D. L., Arimoto, R., Keene, W. C., Prospero, J. M., Duce, R. A., and Galloway, J. N.: Marine biogenic and anthropogenic contributions to non-sea-salt sulfate in the marine boundary layer over the North Atlantic Ocean, J. Geophys. Res., 107, 4356, https://doi.org/10.1029/2001JD000970, 2002.
Schmale, J., Schneider, J., Nemitz, E., Tang, Y. S., Dragosits, U., Blackall, T. D., Trathan, P. N., Phillips, G. J., Sutton, M., and Braban, C. F.: Sub-Antarctic marine aerosol: dominant contributions from biogenic sources, Atmos. Chem. Phys., 13, 8669–8694, https://doi.org/10.5194/acp-13-8669-2013, 2013.
Schulze, B. C., Wallace, H. W., Flynn, J. H., Lefer, B. L., Erickson, M. H., Jobson, B. T., Dusanter, S., Griffith, S. M., Hansen, R. F., Stevens, P. S., VanReken, T., and Griffin, R. J.: Differences in BVOC oxidation and SOA formation above and below the forest canopy, Atmos. Chem. Phys., 17, 1805–1828, https://doi.org/10.5194/acp-17-1805-2017, 2017.
Setyan, A., Zhang, Q., Merkel, M., Knighton, W. B., Sun, Y., Song, C., Shilling, J. E., Onasch, T. B., Herndon, S. C., Worsnop, D. R., Fast, J. D., Zaveri, R. A., Berg, L. K., Wiedensohler, A., Flowers, B. A., Dubey, M. K., and Subramanian, R.: Characterization of submicron particles influenced by mixed biogenic and anthropogenic emissions using high-resolution aerosol mass spectrometry: results from CARES, Atmos. Chem. Phys., 12, 8131–8156, https://doi.org/10.5194/acp-12-8131-2012, 2012.
Shank, L. M., Howell, S., Clarke, A. D., Freitag, S., Brekhovskikh, V., Kapustin, V., McNaughton, C., Campos, T., and Wood, R.: Organic matter and non-refractory aerosol over the remote Southeast Pacific: oceanic and combustion sources, Atmos. Chem. Phys., 12, 557–576, https://doi.org/10.5194/acp-12-557-2012, 2012.
Shilling, J. E., Chen, Q., King, S. M., Rosenoern, T., Kroll, J. H., Worsnop, D. R., DeCarlo, P. F., Aiken, A. C., Sueper, D., Jimenez, J. L., and Martin, S. T.: Loading-dependent elemental composition of alpha-pinene SOA particles, Atmos. Chem. Phys., 9, 771–782, https://doi.org/10.5194/acp-9-771-2009, 2009.
Sinreich, R., Coburn, S., Dix, B., and Volkamer, R.: Ship-based detection of glyoxal over the remote tropical Pacific Ocean, Atmos. Chem. Phys., 10, 11359–11371, https://doi.org/10.5194/acp-10-11359-2010, 2010.
Slowik, J. G., Stroud, C., Bottenheim, J. W., Brickell, P. C., Chang, R. Y.-W., Liggio, J., Makar, P. A., Martin, R. V., Moran, M. D., Shantz, N. C., Sjostedt, S. J., van Donkelaar, A., Vlasenko, A., Wiebe, H. A., Xia, A. G., Zhang, J., Leaitch, W. R., and Abbatt, J. P. D.: Characterization of a large biogenic secondary organic aerosol event from eastern Canadian forests, Atmos. Chem. Phys., 10, 2825–2845, https://doi.org/10.5194/acp-10-2825-2010, 2010.
Sorooshian, A., Padro, L. T., Nenes, A., Feingold, G., McComiskey, A., Hersey, S. P., Gates, H., Jonsson, H. H., Miller, S. D., Stephens, G. L., Flagan, R. C., and Seinfeld, J. H.: On the link between ocean biota emissions, aerosol, and maritime clouds: Airborne, ground, and satellite measurements off the coast of California, Global Biogeochem. Cy., 23, Gb4007, https://doi.org/10.1029/2009gb003464, 2009.
Sorooshian, A., Crosbie, E., Maudlin, L. C., Youn, J. S., Wang, Z., Shingler, T., Ortega, A. M., Hersey, S., and Woods, R. K.: Surface and airborne measurements of organosulfur and methanesulfonate over the western United States and coastal areas, J. Geophys. Res., 120, 8535–8548, https://doi.org/10.1002/2015JD023822, 2015a.
Sorooshian, A., Prabhakar, G., Jonsson, H., Woods, R. K., Flagan, R. C., and Seinfeld, J. H.: On the presence of giant particles downwind of ships in the marine boundary layer, Geophys. Res. Lett., 42, 2024–2030, https://doi.org/10.1002/2015GL063179, 2015b.
Sun, Y.-L., Zhang, Q., Schwab, J. J., Demerjian, K. L., Chen, W.-N., Bae, M.-S., Hung, H.-M., Hogrefe, O., Frank, B., Rattigan, O. V., and Lin, Y.-C.: Characterization of the sources and processes of organic and inorganic aerosols in New York city with a high-resolution time-of-flight aerosol mass spectrometer, Atmos. Chem. Phys., 11, 1581–1602, https://doi.org/10.5194/acp-11-1581-2011, 2011.
Tao, I., Fairley, D., Kleeman, M. J., and Harley, R. A.: Effects of switching to lower sulfur marine fuel on air quality in the San Francisco Bay Area, Environ. Sci. Technol., 47, 10171–10178, https://doi.org/10.1021/es401049x, 2013.
Tian, L., Ho, K. F., Louie, P. K. K., Qiu, H., Pun, V. C., Kan, H., Yu, I. T. S., and Wong, T. W.: Shipping emissions associated with increased cardiovascular hospitalizations, Atmos. Environ., 74, 320–325, https://doi.org/10.1016/j.atmosenv.2013.04.014, 2013.
Tournadre, J.: Anthropogenic pressure on the open ocean: The growth of ship traffic revealed by altimeter analysis, Geophys. Res. Lett., 41, 7924–7932, https://doi.org/10.1002/2014GL061786, 2014.
Tsimpidi, A. P., Karydis, V. A., Zavala, M., Lei, W., Molina, L., Ulbrich, I. M., Jimenez, J. L., and Pandis, S. N.: Evaluation of the volatility basis-set approach for the simulation of organic aerosol formation in the Mexico City metropolitan area, Atmos. Chem. Phys., 10, 525–546, https://doi.org/10.5194/acp-10-525-2010, 2010.
Ulbrich, I. M., Canagaratna, M. R., Zhang, Q., Worsnop, D. R., and Jimenez, J. L.: Interpretation of organic components from Positive Matrix Factorization of aerosol mass spectrometric data, Atmos. Chem. Phys., 9, 2891–2918, https://doi.org/10.5194/acp-9-2891-2009, 2009.
U.S. Army Corps of Engineers, Navigation Data Center, 2016: Waterborne Commerce Statistics Center, U.S. Waterborne Container Traffic in 2015 – 2003, available at: http://www.navigationdatacenter.us/wcsc/containers.htm (last access: 9 August 2017), 2003.
U.S. Environmental Protection Agency: Designation of North American Emission Control Area to Reduce Emissions from Ships: Regulatory Announcement, EPA-420-F-10-015, 2010.
U.S. Environmental Protection Agency: National Emissions Inventory (NEI) Data, available at: https://www.epa.gov/air-emissions-inventories/2014-national-emissions-inventory-nei-data (last access: 10 November 2017), 2014.
U.S. Environmental Protection Agency: Air Pollutants Emissions Trends Data, State Average Annual Emissions Trends, available at: https://www.epa.gov/air-emissions-inventories/air-pollutant-emissions-trends-data, last access: 10 November 2017.
Vaughan, S., Ingham, T., Whalley, L. K., Stone, D., Evans, M. J., Read, K. A., Lee, J. D., Moller, S. J., Carpenter, L. J., Lewis, A. C., Fleming, Z. L., and Heard, D. E.: Seasonal observations of OH and HO2 in the remote tropical marine boundary layer, Atmos. Chem. Phys., 12, 2149–2172, https://doi.org/10.5194/acp-12-2149-2012, 2012.
Viana, M., Hammingh, P., Colette, A., Querol, X., Degraeuwe, B., de Vlieger, I., van Aardenne, J.: Impact of maritime transport emissions on coastal air quality in Europe, Atmos. Environ., 90, 96–105, https://doi.org/10.1016/j.atmosenv.2014.03.046, 2014.
Vutukuru, S. and Dabdub, D.: Modeling the effects of ship emissions on coastal air quality: A case study of southern California, Atmos. Environ., 42, 3751–3764, https://doi.org/10.1016/j.atmosenv.2007.12.073, 2008.
Wallace, H. W., Sanchez, N. P., Flynn, J. H., Erickson, M. H., Lefer, B. L., and Griffin, R. J.: Source apportionment of particulate matter and trace gases near a major refinery near the Houston Ship Channel, Atmos. Environ., 173, 16–29, https://doi.org/10.1016/j.atmosenv.2017.10.049, 2018.
Wan, Z., Zhu, M., Chen, S., and Sperling, D.: Pollution: three steps to a green shipping industry. Nature, 530, 275–277, https://doi.org/10.1038/530275a, 2016.
Wang, C., Corbett, J. J., and Firestone, J.: Improving spatial representation of global ship emissions inventories, Environ. Sci. Technol., 42, 193–199, https://doi.org/10.1021/es0700799, 2008.
Wilson, D., Billings, R., Chang, R., Enoch, S., Do, B., Perez, H., and Sellers, J.: Year 2014 Gulfwide Emissions Inventory Study, U.S. Department of the Interior, Bureau of Ocean Energy Management, available at: https://www.boem.gov/2014-Gulfwide-Emission-Inventory/ (last access: 19 August 2018), 2017
Wong, J. P. S., Lee, A. K. Y., and Abbatt, J. P. D: Impacts of sulfate seed acidity and water content on isoprene secondary organic aerosol formation, Environ. Sci. Technol., 49, 13215–13221, https://doi.org/10.1021/acs.est.5b02686, 2015.
Wood, E. C., Canagaratna, M. R., Herndon, S. C., Onasch, T. B., Kolb, C. E., Worsnop, D. R., Kroll, J. H., Knighton, W. B., Seila, R., Zavala, M., Molina, L. T., DeCarlo, P. F., Jimenez, J. L., Weinheimer, A. J., Knapp, D. J., Jobson, B. T., Stutz, J., Kuster, W. C., and Williams, E. J.: Investigation of the correlation between odd oxygen and secondary organic aerosol in Mexico City and Houston, Atmos. Chem. Phys., 10, 8947–8968, https://doi.org/10.5194/acp-10-8947-2010, 2010.
Wozniak, A. S., Willoughby, A. S., Gurganus, S. C., and Hatcher, P. G.: Distinguishing molecular characteristics of aerosol water soluble organic matter from the 2011 trans-North Atlantic US GEOTRACES cruise, Atmos. Chem. Phys., 14, 8419–8434, https://doi.org/10.5194/acp-14-8419-2014, 2014.
Ying, Q., Li, J., and Kota, S. H.: Significant contributions of isoprene to summertime secondary organic aerosol in eastern United States, Environ. Sci. Technol., 49, 7834–7842, https://doi.org/10.1021/acs.est.5b02514, 2015.
Youn, J.-S., Crosbie, E., Maudlin, L. C., Wang, Z., and Sorooshian, A.: Dimethylamine as a major alkyl amine species in particles and cloud water: Observations in semi-arid and coastal regions, Atmos. Environ., 122, 250–258, https://doi.org/10.1016/j.atmosenv.2015.09.061, 2015.
Zetterdahl, M., Salo, K., Fridell, E., and Sjoblom, J.: Impact of aromatic concentration in marine fuels on particle emissions, J. Mar. Sci. App., 16, 352–361, https://doi.org/10.1007/s11804-017-1417-7, 2017.
Zhao, M., Zhang, Y., Ma, W., Fu, Q., Yang, X., Li, C., Zhou, B., Yu, Q., and Chen, L: Characteristics and ship traffic source identification of air pollutants in China's largest port, Atmos. Environ., 64, 277–286, https://doi.org/10.1016/j.atmosenv.2012.10.007, 2012.
Zhu, L., Huang, X., Shi, H., Cai, X., and Song, Y.: Transport pathways and potential sources of PM10 in Beijing, Atmos. Environ., 45, 594–604, https://doi.org/10.1016/j.atmosenv.2010.10.040, 2011.
Zorn, S. R., Drewnick, F., Schott, M., Hoffmann, T., and Borrmann, S.: Characterization of the South Atlantic marine boundary layer aerosol using an aerodyne aerosol mass spectrometer, Atmos. Chem. Phys., 8, 4711–4728, https://doi.org/10.5194/acp-8-4711-2008, 2008.