the Creative Commons Attribution 4.0 License.
the Creative Commons Attribution 4.0 License.
 | 27 Sep 2018
Surface roughness during depositional growth and sublimation of ice crystals
Jens Voigtländer
Cedric Chou
Henner Bieligk
Tina Clauss
Susan Hartmann
Paul Herenz
Dennis Niedermeier
Georg Ritter
Frank Stratmann
Zbigniew Ulanowski
Ice surface properties can modify the scattering properties of atmospheric ice crystals and therefore affect the radiative properties of mixed-phase and cirrus clouds. The Ice Roughness Investigation System (IRIS) is a new laboratory setup designed to investigate the conditions under which roughness develops on single ice crystals, based on their size, morphology and growth conditions (relative humidity and temperature). Ice roughness is quantified through the analysis of speckle in 2-D light-scattering patterns. Characterization of the setup shows that a supersaturation of 20 % with respect to ice and a temperature at the sample position as low as −40 ∘C could be achieved within IRIS. Investigations of the influence of humidity show that higher supersaturations with respect to ice lead to enhanced roughness and irregularities of ice crystal surfaces. Moreover, relative humidity oscillations lead to gradual “ratcheting-up” of roughness and irregularities, as the crystals undergo repeated growth–sublimation cycles. This memory effect also appears to result in reduced growth rates in later cycles. Thus, growth history, as well as supersaturation and temperature, influences ice crystal growth and properties, and future atmospheric models may benefit from its inclusion in the cloud evolution process and allow more accurate representation of not just roughness but crystal size too, and possibly also electrification properties.
- Article
(1510 KB) - Full-text XML
-
Supplement
(21412 KB) - BibTeX
- EndNote


Cloud properties and their effects remain the largest uncertainty in global climate models (Boucher et al., 2013). In particular, climate feedbacks of cirrus clouds, which cover 30 % of the globe (Wylie et al., 2005) and 60 %–70 % of the tropics (Sassen et al., 2009), are still not well understood. The main reasons for these uncertainties lie in the fact that ice crystals which compose cirrus clouds have widely varying morphology, size and concentration (McFarquhar and Heymsfield, 1997; Heymsfield et al., 2017) and therefore have different scattering properties, influencing in turn the radiative properties of the clouds (Hartmann et al., 1992; McFarquhar et al., 2000; Baran, 2012; Yang et al., 2015). Several cloud imaging probes like the Cloud Imaging Probe (CIP), Cloud Particle Imager (CPI) or various optical array probes (e.g. 2DC, 2DS), among others, have been developed over the last decades in order to characterize those parameters. However, these probes have difficulties characterising the size and shape of smaller ice crystals, due to optical-resolution limitations. Moreover, these probes do have a further limitation due to varying degrees of shattering of ice particles on their inlets, only partly reduced by various mitigation measures (Ulanowski et al., 2004; Field et al., 2006; Connolly et al., 2007; Jensen et al., 2009; Korolev et al., 2011; Baumgardner et al., 2017). For these reasons, a new family of probes collectively called the Small Ice Detector has been developed, which has open-path detection geometry designed to reduce shattering and relies on retrieving particle size and shape from scattering patterns instead of images (Kaye et al., 2008; Cotton et al., 2010; Ulanowski et al., 2014).
Further to the challenge of retrieving the size distribution and concentration of small ice crystals present in clouds, it has been shown on the basis of light-scattering models that irregularities of ice crystal surfaces, such as roughness and concavity, can affect the light-scattering properties (Yang et al., 2008a, b; Liu et al., 2013). Experiments performed on ice analogues have shown that the asymmetry parameter of large ice analogue crystals possessing surface irregularities can be over 20 % lower at visible wavelengths in comparison to smooth counterparts (Ulanowski et al., 2003, 2006). This in turn can result in large reductions in shortwave radiative forcing (Yi et al., 2013). Suggestions that atmospheric ice may depart from the idealized hexagonal crystal model have been made for several decades (Foot, 1988; Korolev et al., 1999; Auriol et al., 2001; Garrett et al., 2001), and there is now accumulating evidence that natural ice clouds can contain a significant proportion of, or can even be dominated by, ice particles that substantially depart from the idealized smooth, hexagonal prism shape – for reviews and recent results see Ulanowski et al. (2014), Yang et al. (2015) and Hioki et al. (2016). Recent in-cloud measurements using the Small Ice Detector 3 (SID-3) during CONSTRAIN (Ulanowski et al., 2014) and MACPEX (Schmitt et al., 2016) have shown that most of the ice crystal encountered could be classified as rough. However, the conditions that lead to the development of crystal irregularities are still not well understood, because previous ice growth experiments have tended to focus on growth rates and crystal habits, rather than the fine detail that can contribute to light-scattering properties.
To study the influence of growth conditions on ice crystal roughness, laboratory experiments simulating atmospherically relevant depositional growth and sublimation of ice crystals are required. In the present study, the newly developed experimental setup IRIS (Ice Roughness Investigation System) is introduced, which facilitates the exposure of a fixed ice crystal to different controlled relative humidity (RH) and temperature regimes. The system is used to carry out ice crystal growth experiments at different supersaturation ratios and to investigate the impact of repeated growth–sublimation cycles on surface roughness. The findings are discussed in the context of fundamental features of ice crystal growth and their atmospheric implications.
2.1 Experimental setup
The experimental setup is a combination of a laminar flow tube and a laboratory version of the SID-3 instruments, which has been additionally equipped with an optical microscope. The laminar flow tube is used to precisely control the thermodynamic conditions in the optical measuring volume at the tube outlet. In the experiments, the ice crystals, generally single, are fixed within the measuring volume and exposed to thermodynamic conditions simulating single or multiple growth cycles at various temperatures and saturation ratios. A brief description of the setup, the operating principle and the thermodynamical characterization is given in the following subsections.
2.1.1 Laminar flow tube
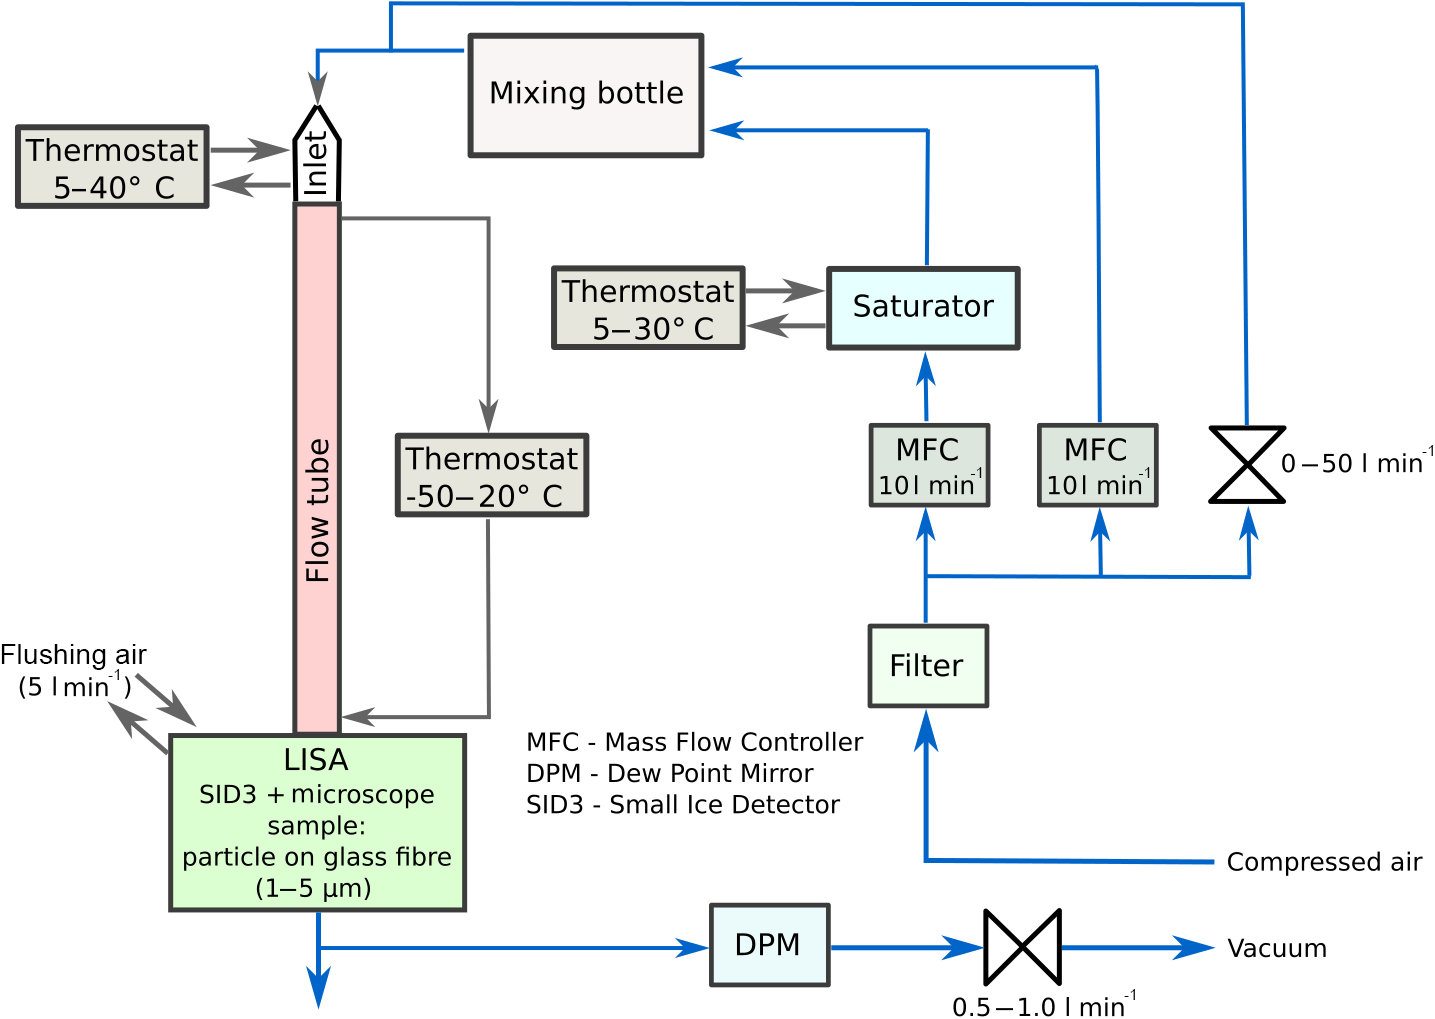
The laminar flow tube follows the principle of the Leipzig Aerosol Cloud Interaction Simulator (LACIS; Stratmann et al., 2004; Hartmann et al., 2011). It has been further developed to provide required conditions with respect to humidity and temperature at the outlet where the ice crystal is situated. The main part is a thermodynamically controlled laminar flow tube with a diameter of 15 mm and a length of 1.0 m. Both the wall and the inlet temperature of the insulated flow tube can be precisely controlled by means of thermostats, which are operated in counter-flow direction. The main differences between LACIS and IRIS are the extended mass flow range and the missing separated aerosol beam. The mass flow is adjusted by means of two mass flow controllers (Brooks 5850s, Brooks Instruments, Hatfield, PA, USA), controlling a dry (dew point between −60 and −40 ∘C) and a humidified gas flow in the range between 1 and 10 L min−1 standard temperature and pressure (STP). The humidification of the wet flow is done by water vapour transport through a micro-porous Nafion (sulfonated-tetrafluoroethylene-based fluoropolymer-copolymer) membrane. By operating the water cycle of the humidifier in counter-flow direction, the air flow reaches a RH of 100±0.03 % at equilibrium. Both flows are combined in a small mixing bottle before entering the tube to ensure a well-mixed gas flow. The dew point temperature at the tube inlet then is defined by the mixing ratio and the dew points of both flows. A simplified schematic of the experimental setup is given in Fig. 1.
2.1.2 Optical system
The Leipzig Ice Scattering Apparatus (LISA) is a laboratory version of the SID-3 (also known in its other laboratory version as the Particle Phase Discriminator – PPD), which allows the differentiation of ice crystals from water droplets, as well as ice crystal size and shape characterization (Kaye et al., 2008). In addition, it also allows the characterization of ice crystal irregularities on the basis of the two-dimensional (2-D) speckle pattern distribution (Ulanowski et al., 2014). Two-dimensional scattering patterns are collected by LISA via an intensified charge-coupled device (CCD) camera at scattering angles from 6 to 25∘ in an annular shape, which ensures that the bright feature associated with the familiar halo occurring for ice prisms at the scattering angle of 22∘ is included. The smaller angles in the central area are not captured due to the presence of a beam stop. The camera images are digitized as 12 bit TIFF files allowing a wider dynamic range with a fixed intensifier gain value, as opposed to the 8 bit JPEG files used during CONSTRAIN (Ulanowski et al., 2014). In addition, a metal–oxide–semiconductor (CMOS) camera (Prosilica GC1280, Allied Vision Technologies, USA) attached to a 20× magnification long working-distance microscope objective (20× Mitutoyo Plan Apo) via an Infinitube right-angle adaptor with fibre-optics in-line illumination (Infinity Photo-Optical Company, USA) was added to LISA in order to visualize the evolution of the ice crystal. Ice crystals were monitored by the camera at 27 frames per second, ensuring no loss of information during fast humidity cycles. Figure 2 shows a simplified schematic of LISA.
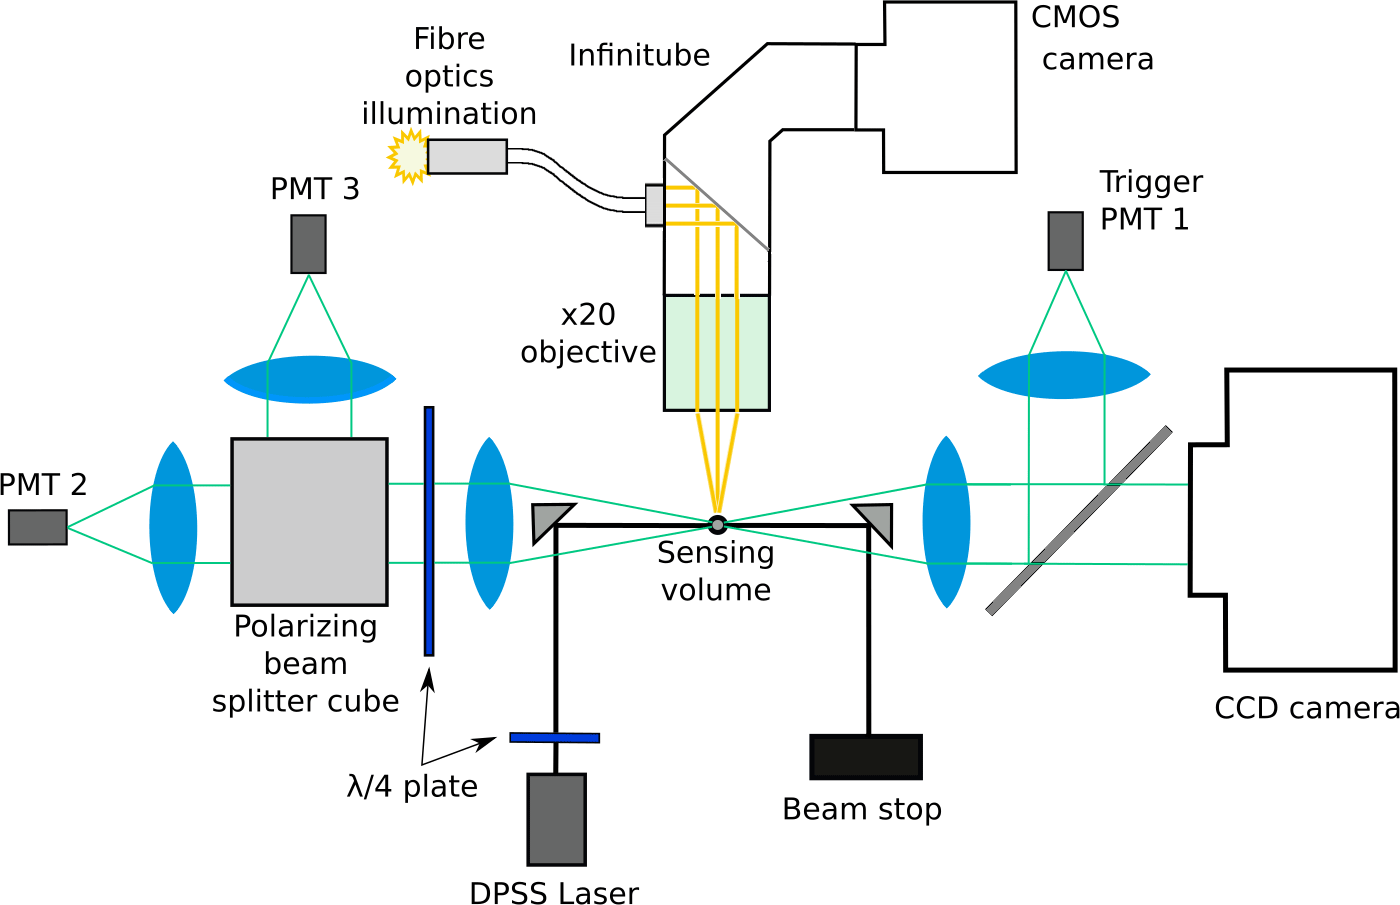
Figure 2Schematic of the Leipzig Ice Scattering Apparatus (LISA), the optical system of IRIS.
2.2 Numerical simulations and thermodynamic characterization
The thermodynamic conditions at the tube outlet were extensively studied by means of computational fluid dynamics (CFD) simulations of the laminar flow tube and by measurements of flow velocity, temperature and dew point at the tube outlet. Both the numerical simulations and the measurements have been done to characterize the experimental setup, as well as to demonstrate the fast control of temperature and supersaturation in the measuring volume.
The numerical simulations were done with the commercially available CFD code Fluent (Ansys Inc., USA). The Fluent model is a general-purpose FVM (finite-volume method) CFD model allowing the simulation of a wide range of small-scale fluid flow problems. Here, the flow through the flow tube was simulated including the coupled processes of mass and heat transfer. With respect to the geometry and the laminar flow regime, the simulations were done on a 2-D axisymmetric Cartesian grid by means of a pressure-based steady-state solver. Additional information about the numerical model, which has already been successfully applied to the characterization of the Leipzig Aerosol Cloud Interaction Simulator (LACIS) laminar flow, can be found for example in Stratmann et al. (2004), Voigtländer et al. (2007) and Hartmann et al. (2011).
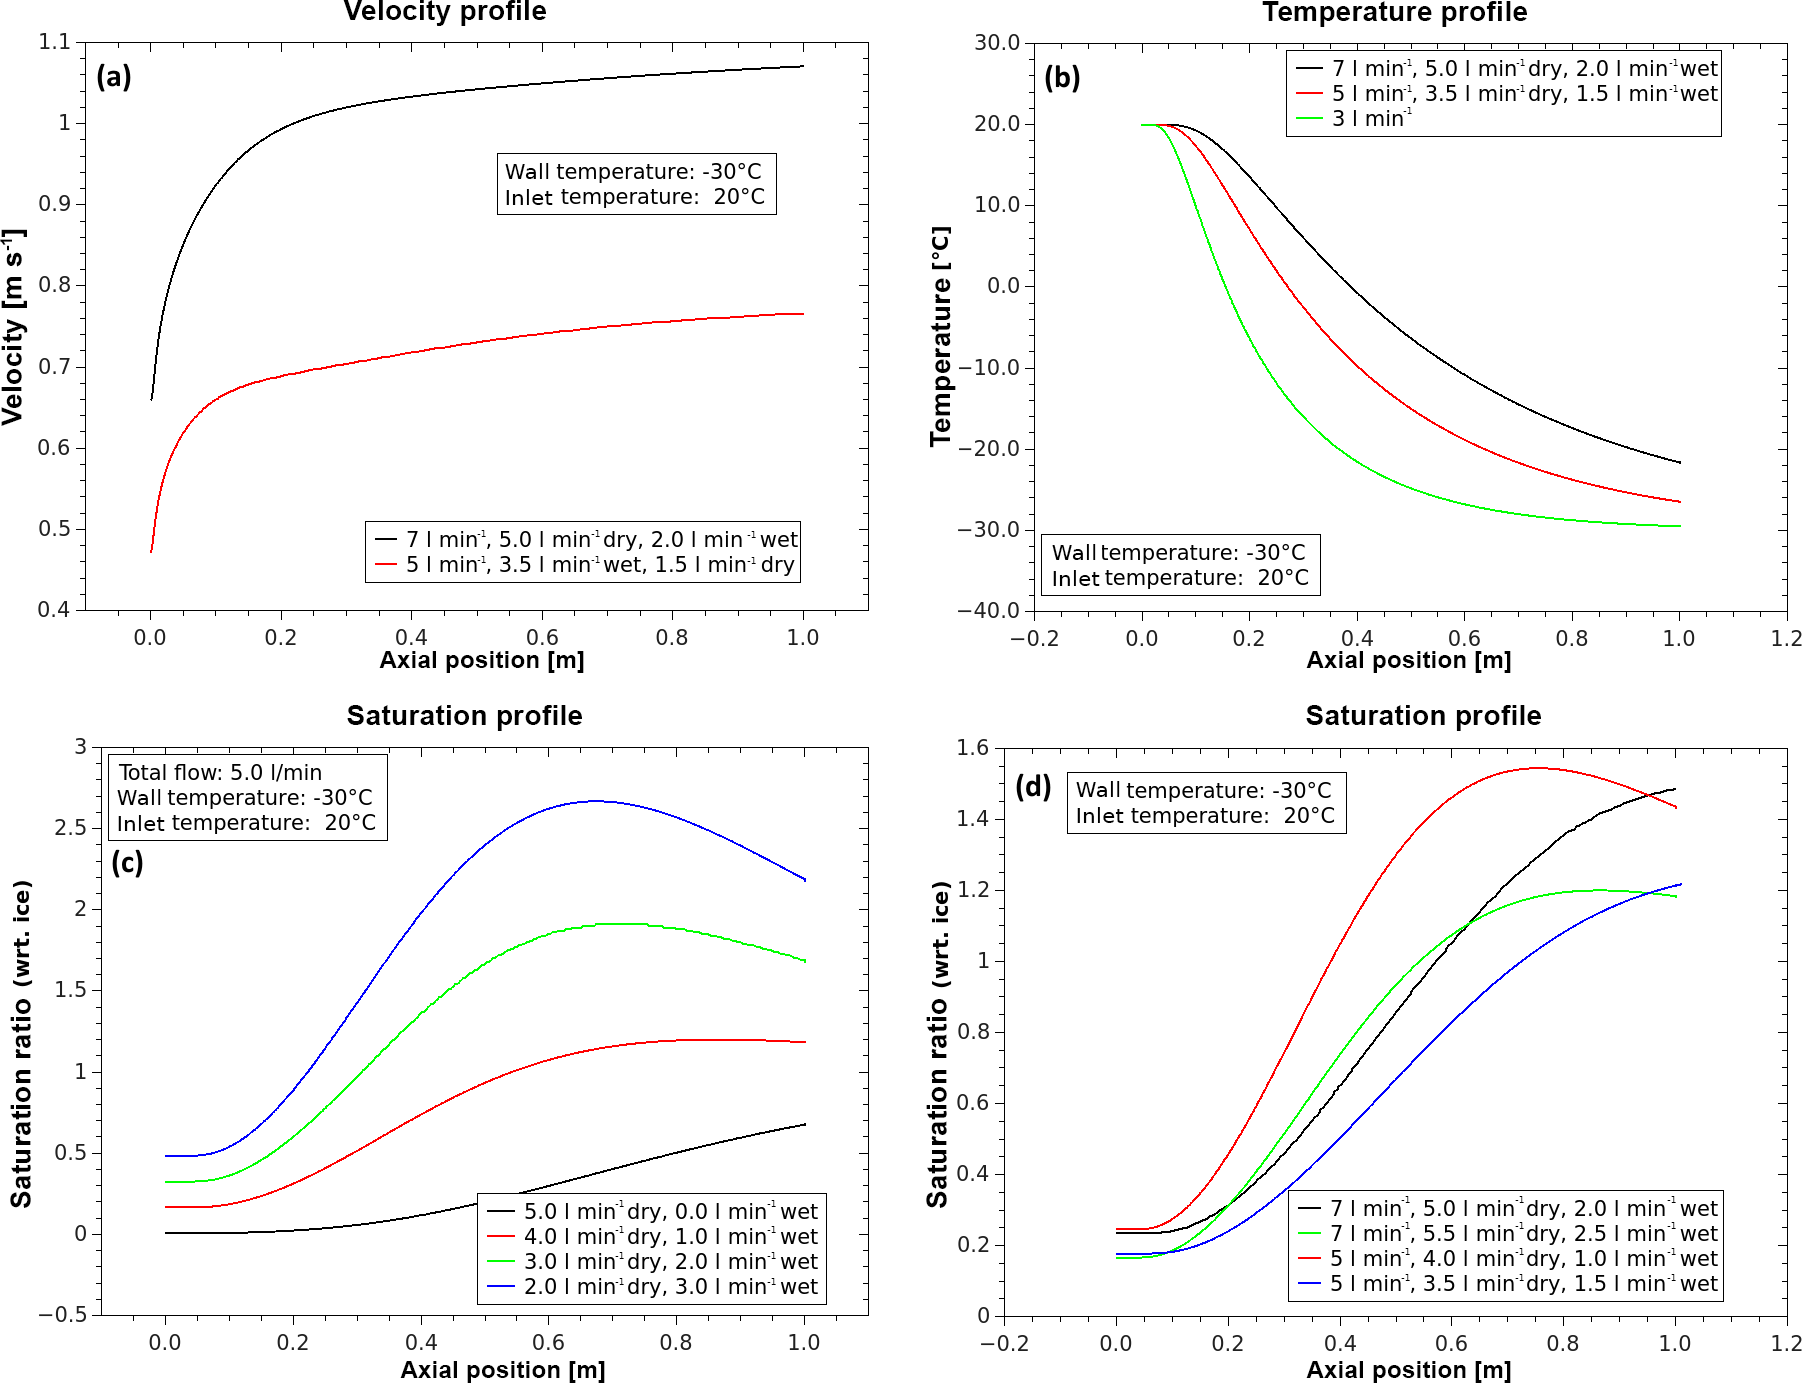
Figure 3Examples of calculated flow velocity (a), temperature (b) and saturation ratio (c, d) profiles along the tube axis. The simulations were done with the computational fluid dynamics (CFD) code Fluent.
To illustrate the operating principle of the laminar flow diffusion channel, calculated thermodynamic profiles along the tube axis are shown in Fig. 3. Generally, the thermodynamic conditions in the measuring volume at the flow tube outlet depend on mass and heat transfer to the tube wall. Since the tube wall temperature is adjusted to lower values than the inlet temperature, the gas flow temperature along the tube axis decreases due to heat conduction (Fig. 3, top right). Depending on both the temperature gradient and the inlet dew point, supersaturation with respect to water and/or ice can be achieved (Fig. 3, bottom). If the residence time of the gas flow (controlled by the mass flow rate) is large enough, the gas flow cools down until thermodynamic equilibrium with the tube wall is reached. Conversely, for a sufficiently fast flow, equilibrium will not be reached. Consequently, the thermodynamic conditions at the tube outlet are determined by the total mass flow, the wall and inlet temperatures and the inlet saturation ratio. Figure 4 shows that – for a total flow rate between 4 and 10 L min−1, an inlet temperature of 20 ∘C and a wall temperature of −30 ∘C – the temperature at the tube centre outlet increases almost linearly by about 10 ∘C with increasing flow. As a consequence the temperature in the measuring volume can be varied by at least 10 ∘C on a very short timescale (about 2 s) by varying the total flow rate. In contrast, the temperature values for a flow rate smaller than about 3 L min−1 indicate that the residence time becomes sufficiently long to approach the thermodynamic equilibrium state. In this case, the thermodynamic conditions can no longer be controlled by varying the flow rate. Since control of the conditions by adjusting the thermostats (wall and inlet temperatures) is much slower, a flow rate of about 3–4 L min−1 represents the lower practical limit for the experiments. Because temperature is usually kept constant in typical experiments, the saturation ratio is controlled by varying the inlet dew point. As mentioned before, this can be also done on a short timescale (about 5 s) by controlling the ratio of the dry and the wet air flow while the total flow is kept constant.
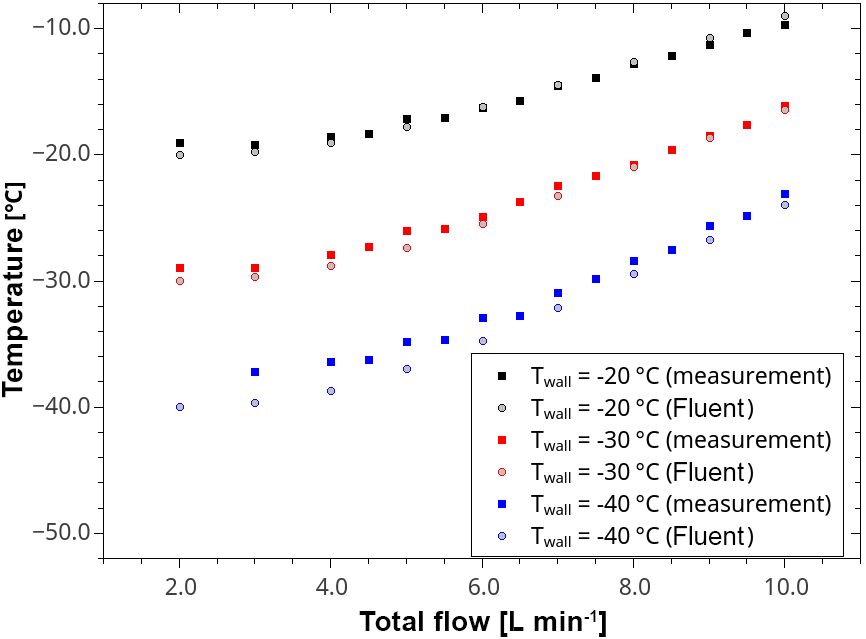
Figure 4Comparison between measured and calculated temperature as a function of the total flow rate using three different wall temperatures. The solid lines represent interpolation of the experimental data.
The thermodynamic conditions at the tube outlet have been extensively characterized using measurements of the flow velocity, temperature and dew point. The flow characterization was done applying hot-wire anemometry (Dantec Dynamics A/S, Skovlunde, Denmark). By means of a miniature single-axis probe, the velocity magnitude was determined at several points along a cross-sectional profile of the tube outlet showing a parabolic laminar velocity profile without any back flows. In the measuring volume, the flow velocity increases linearly from approx. 0.5 to 2.0 m s−1 for total flow rates between 3 and 10 L min−1. For typical experimental conditions with flow rates around 5 L min−1 the resulting flow velocity is about 1 m s−1. Measured and calculated flow velocities were found to be very similar (see Supplement). Temperature measurements were done at the outlet of the laminar flow chamber using calibrated (to an accuracy of ±0.01 K) external resistance thermometers (Pt100), as well as K-type thermocouple sensors. Figure 4 shows measured temperatures as a function of the total volume flow at selected wall temperatures (−20, −30 and −40 ∘C) in comparison to Fluent simulation data for an inlet temperature of 20 ∘C. It can also be seen that both data sets are in a good agreement. Additionally, an extended data set of temperature measurements is shown in the Supplement.
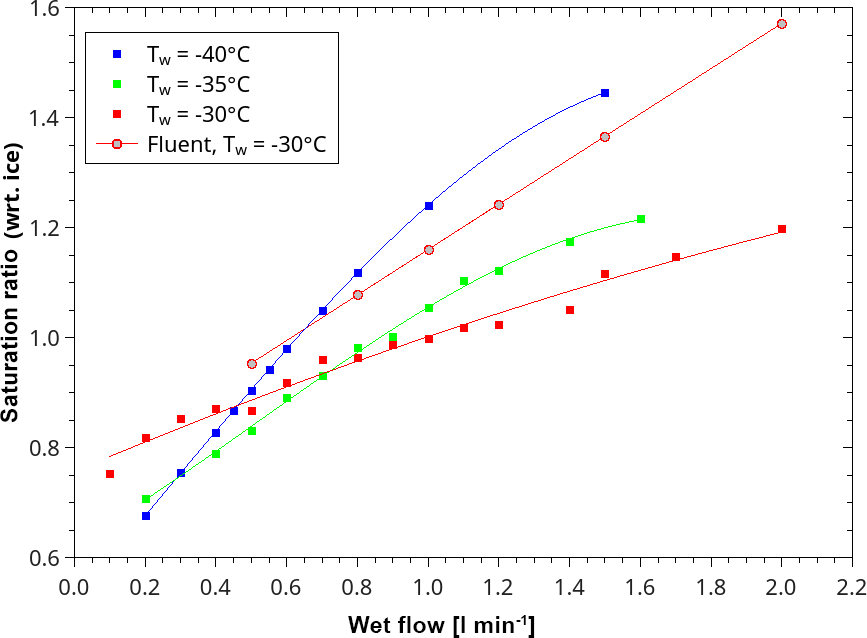
Figure 5Measured (circles) and modelled (squares) relative humidity (with respect to ice) in the sampling volume of LISA. Measured temperatures in the observation volume of LISA. The total flow rate was 5 L min−1. The values are given as a function of the wet-flow rate.
The dew point temperature (frost point temperature and relative humidity) was characterized using a dew point mirror (model Dew Point Mirror 973, MBW Calibration, Wettingen, Switzerland). An example of measured relative humidity with respect to ice (RHi) is shown in Fig. 5. Therein, the RHi is depicted as a function of the wet flow. In this example, which represents typical experimental conditions, the wall temperature was at −30 ∘C, the inlet temperature at 20 ∘C, and the inlet dew point temperature at 19.5 ∘C. The total flow was kept at a constant value of 5 L min−1. According to Fig. 4, the resulting temperature was about −27.5 ∘C. The saturation ratio rises steeply with increasing fraction of the humidified flow. Figure 5 demonstrates that the saturation ratio in the measuring volume can be varied between sub- and supersaturated conditions (with respect to both water and ice). Here, the saturation ratio with respect to ice ranges from 0.75 (0.1 L min−1 wet flow) up to 1.2 (2 L min−1 wet flow).
In the experiments it was also found that for low wall temperatures and supersaturated conditions (with respect to ice) the conditions in the sampling volume changed slowly with time: the lower the wall temperature and the higher the supersaturation, the faster the conditions in the tube change. Consequently, experiments at very high saturation ratios (>1.20 with respect to ice) were avoided . Due to ice formation at the tube wall, the observed temperature and the dew point increased at the tube outlet. This is most likely caused by the growing ice shell at the tube wall, which acts as a thermal insulator suppressing the temperature gradient and hence the diffusional processes in the flow tube. For example, considering a wall temperature of −40 ∘C, a total flow of 7 L min−1 and a wet flow of 0.9 L min−1, resulting in a saturation ratio of about 1.2 with respect to ice in the beginning, the temperature increases from about −31.7 to −31.0 ∘C, and the frost point from about −29.5 to −29.0 ∘C within 20 min. Fluctuations of both the temperature and the dew/frost point have an impact on the saturation ratio and therefore on the growth rate of the observed ice crystal; the ice layer at the tube wall can also act as an extra source for water vapour if the conditions are changed from super- to subsaturated. It has to be concluded that for supersaturated experiments a detailed quantitative characterization of the saturation ratio on the basis of dew point measurements is not possible and that additional methods are needed to evaluate the saturation ratio during the experiments. This is done by observation of the ice crystal with the optical microscope. Since the ice crystal growth process is highly sensitive to the prevailing thermodynamic conditions, i.e. the saturation ratio determines the ice crystal growth rate, the mass flow controllers can be adjusted according to the microscope images. In this way the settings corresponding to the point of equilibrium between the crystal and the vapour can be found, to act as a reference point.
2.3 Sample preparation
Laboratory investigation of ice crystal surface properties requires the formation of the initial ice crystal from a foreign particle termed an ice-nucleating particle (INP). For experiments done at IRIS, a single INP is attached to the tip of a thin glass fibre. These very thin tips of about 2 µm in diameter were pulled from 1 mm diameter borosilicate rods using a micropipette glass puller. The glass was cleaned and hydrophobically coated following the procedure described by Dymarska et al. (2006). The glass fibre was then attached to a micromanipulator (Singer Mk.1, Singer Instruments, UK) which was used to pick the INP (usually of several micrometres in size) that had been deposited on a microscope glass slide under a microscope (Zeiss Primo Vert, Germany).
2.4 Scattering pattern analysis
The 2-D scattering patterns are characterized by quantifying their brightness distributions and texture (Ulanowski et al., 2014). In brief, image texture can be retrieved by using the grey-level co-occurrence matrix (GLCM), which consists of pairing each grey-level pixel with the nearest neighbour pixels in four directions (Haralick et al., 1973). GLCM has been used in the past to assess surface roughness based on laser speckle images (Lu et al., 2006). It was found and discussed in Ulanowski et al. (2014) that, among the four features of the GLCM (contrast, correlation, homogeneity and energy, also known as uniformity or angular second moment), energy is the parameter which has the strongest correlation to roughness but is also less biased by external factors (e.g. image brightness change due to camera gain change). Statistical measures describing image brightness distribution are obtained by two methods, firstly by calculating the ratio of root-mean-squared brightness to its standard deviation (RMS ∕ SD) (Jolic et al., 1994) and secondly by calculating the kurtosis of the brightness distribution. This leads to a “combined roughness” measure, following the expression
where E is the energy derived from the GLCM and K the kurtosis. The combined measure is dependent on the number of independent “scattering centres” present on the surface of the crystal, so it reflects the overall complexity of ice crystals, including both small-scale roughness and a larger-scale structure, such as that found in so-called “polycrystals” (Ulanowski et al., 2012, 2014). The combined roughness has been tested on ice analogues and mineral dust with various surfaces, and results that are reported in Ulanowski et al. (2014) show that it does provide a good estimation of a particle surface irregularity. In addition, the size of the ice particles, which is inversely proportional to the average area of speckle spots, is retrieved and is used throughout the present work to determine crystal size. The size measured in this way represents the diameter of an equal-area circle projected along the line parallel to the laser beam (Ulanowski et al., 2012).
Time-lapse videos showing the evolution of LISA 2-D scattering patterns during cyclic ice growth experiments are shown in the Supplement (S1 and S2, Chou et al., 2018a, b). Broadly, the size of the speckle spots visible in the patterns is a reflection of ice crystal size (strictly speaking, its inverse), and the amount of speckle represents crystal roughness. In the videos, growth periods are characterized by the spots shrinking and generally moving inwards, and the opposite occurs during sublimation periods. The presence of isolated bright spots or bands is an indication of flat crystal facets, while spots covering a large proportion of the pattern signify the presence of roughness or high complexity.
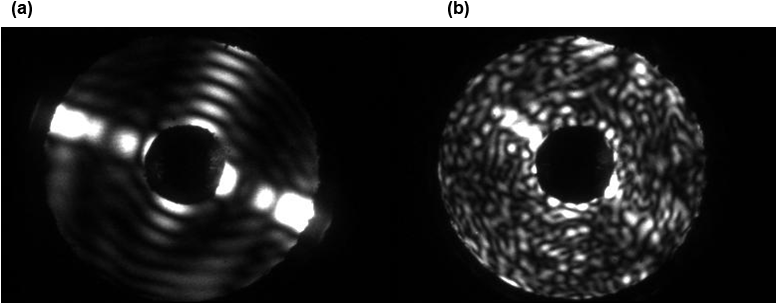
Figure 62-D scattering patterns of a smooth column (a) and a rough column (b). The patterns were produced using the SID-3 instrument in the AIDA cloud chamber during growth at low (a) and high (b) supersaturation (Schnaiter et al., 2016).
In the following, experiments are presented and discussed first, addressing two aspects: the influence of supersaturation and of regrowth cycles on the ice crystal surface roughness measures. However, we note that in general other factors may also influence crystal morphology, like the type, shape and size of the INP; the mode of ice nucleation (homogeneous, immersion freezing or deposition nucleation); temperature; and ventilation (as represented by the fall speed). For example, the AIDA (Aerosol Interaction and Dynamics in the Atmosphere) cloud chamber experiments also indicate that homogeneous nucleation can lead to crystals with strongly rough surfaces (Schnaiter et al., 2016). Furthermore, it has been shown that droplets freezing at lower temperatures are more likely to grow into complex polycrystals (Pitter and Pruppacher, 1973; Bacon et al., 2003). Since homogeneous nucleation occurs, by definition, at low temperatures, it may lead to the formation of more imperfect crystals; however, we must note that the temperature effect may be secondary to the influence of the high saturation ratios that are necessary to initiate homogeneous nucleation. Investigation of the influence of these parameters is beyond the scope of this paper but might be addressed in future work.
Figure 6 shows examples of 2-D scattering patterns from smooth and rough ice columns to illustrate what patterns could be classified as originating from smooth or rough ice crystals in the following discussion. It can be seen that the main characteristic of a rough particle/crystal is the speckle captured by the CCD camera, which is the outcome of complex interference between scattered waves originating from multiple regions of the particle (Ulanowski et al., 2012). Smooth crystals on the other hand do not produce strong speckle, as scattering is dominated by fewer distinct interactions with the particle, which tend not to produce the interference giving rise to speckle patterns; these interactions are more akin to the reflections and refractions of classical geometric optics but enhanced by diffraction, which leads to the appearance of arc-like features in the 2-D patterns (Clarke et al., 2006). More examples obtained from ice analogues and other types of smooth and rough or irregular particles can be seen in Ulanowski et al. (2014).
Most of the noise visible in the retrieved crystal size and roughness measure in the experiment time series has been found to originate from the gas flow of the laminar flow tube, which creates vibrations of the fibre. Slight vibrations of the sample result in scattered data points. However, in all the cases, the trend is discernible and becomes clearer after applying locally weighted scatterplot smoothing (LOESS; Cleveland and Devlin, 1988) to the data points in order to obtain a trend curve for each experiment.
3.1 Slow and fast growth
Fast crystal growth tends to lead to the emergence of roughness on crystal surfaces. The conventional view of ice (and other material) growth suggests that regular, smooth crystals grow at low supersaturation, where the growth rate is slow enough for the deposited molecules to diffuse laterally on facets to well-separated attachment sites at steps, kinks and ledges. In contrast, fast growth promotes attachment anywhere on crystal surface through 2-D nucleation, and potentially also step bunching, resulting in roughness (Mason et al., 1963; Beckmann, 1982; Dash and Wettlaufer, 2003; Pantaraks and Flood, 2005; Dash et al., 2006; Ferreira et al., 2008; Flood, 2010; Sazaki et al., 2010). Fast growth can moreover lead to the creation of defects and ionization, which further promote irregular growth (Dash et al., 2001; Dash and Wettlaufer, 2003). Furthermore, the mechanisms leading to surface roughness are likely to depend on growth temperature, in the same way that the gross crystal habit does due to different growth rates on the basal and prismatic facets (Mason et al., 1963; Bailey and Hallett, 2004). Hence roughness may arise on different facets at different temperatures. Also temperature dependent is the role in ice growth of the quasi-liquid layer (QLL). Its thickness, amount of disorder and hence importance diminish with decreasing temperature, with some studies indicating little impact at the temperatures used here, but there is still much disagreement between molecular dynamics modelling and measurements of QLLs (Dash et al., 2006; Gladich et al., 2015; Michaelides et al., 2017). Supersaturation was identified as one of the main parameters controlling the surface roughness in experiments conducted for ice by Hallett (1987), and complex polycrystals tend to dominate ice habits at high supersaturations (Bacon et al., 2003; Bailey and Hallett, 2004). There is evidence from recent dedicated experiments in the AIDA cloud chamber that increasing the maximum supersaturation achieved during chamber expansions leads to increased roughness, as indicated by SID-3 measurements (Schnaiter et al., 2016).
Since the supersaturation controls the growth rate but could not be determined directly with high accuracy in our experiments, several slow and fast ice crystal growth experiments at −40 ∘C were performed. Thereby, slow ice crystal growth could be observed at low supersaturation, and faster growth at higher supersaturation. For comparability, the shape of the investigated ice crystals was kept similar; hence very high supersaturation ratios resulting in the formation of complex ice crystals were excluded, and only single columns were considered. This means that even in the fast-growth experiments the supersaturation with respect to ice was less than about 20 % (typically between 10 % and 20 %). The slow-growth experiments were done closer to saturated conditions (typically about 5 % supersaturation with respect to ice).

Figure 7Size and roughness of two pre-existing ice crystals exposed to different supersaturations (difference about 10 %): slow growth (blue symbols and lines) and fast growth (red symbol and lines); the trend curves were fitted using LOESS. The crystals can be compared directly as they grow from 20 to 29 µm. Based on the flow rate ratio, which was varied between 0.7∕4.3 L min−1 (wet/dry, slow) and 1.0∕4.0 L min−1 (fast), the difference in relative humidity with respect to ice was about 10 % (compare Fig. 5).
Figure 7 shows the growth of two regrown ice crystals exposed to different level of supersaturation at −35 ∘C. Based on the flow rate ratio, which was varied between 0.7∕4.3 L min−1 (wet/dry, slow) and 1.0∕4.0 L min−1 (fast), the difference in relative humidity with respect to ice was about 10 % (compare Fig. 5). The crystals can be compared directly as they grow from 20 to 29 µm, after fitting trend curves using LOESS. The crystal regrown at a higher saturation ratio shows a greater and steeper roughness increase – from 0.27 to 0.39 over 23 s, an increase of 0.12 – as compared to the crystal exposed to lower humidity: from 0.29 to 0.37 over 100 s, an increase of 0.08. In Fig. 8 the relationship between the temporal rate of change of roughness and the growth rate is depicted for ice crystals in the size range from 20 to 80 µm. Fifteen different growth experiments leading to the formation of simple columns were performed to investigate this relationship with 12 cases where the initial crystal was sublimated and regrown. The correlation was found to be strong, with the coefficient of determination R2 of 0.82, implying that a higher degree of supersaturation leads to faster roughness evolution, i.e. quicker formation of more irregular ice surfaces.
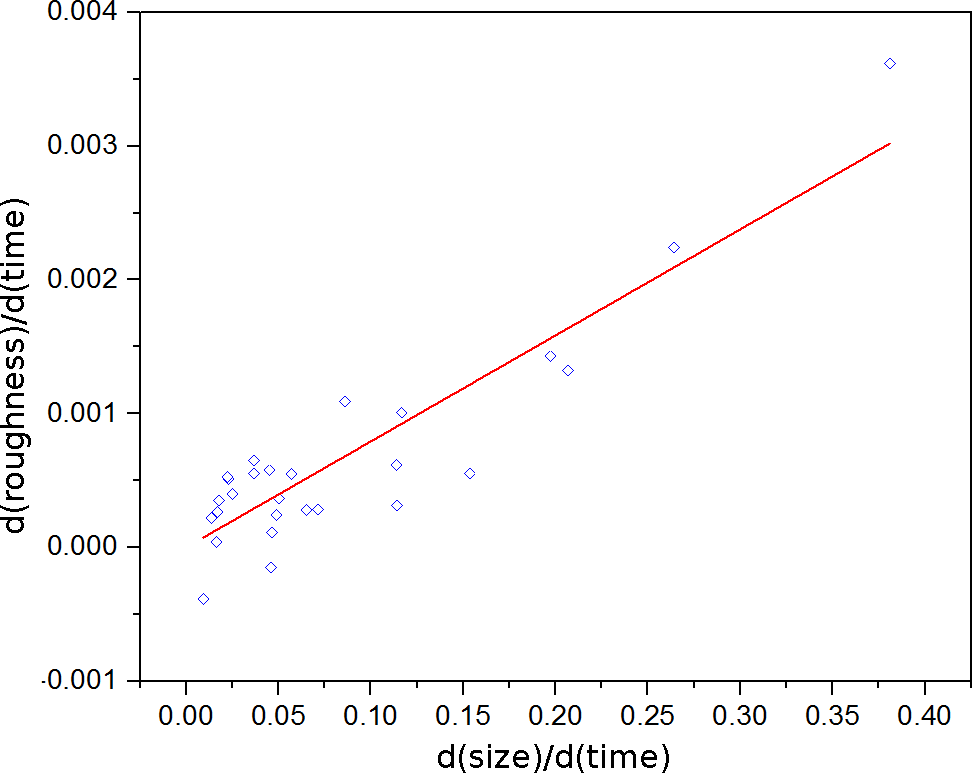
Figure 8Rate of increase of roughness as a function of the growth rate (indicating the degree of supersaturation in the flow tube). Each point corresponds to a separate growth experiment. The coefficient of determination R2 is 0.82.
Concerning possible mechanisms for the emergence of roughness during crystal growth, while the general ones discussed above are likely to play a role, an additional one may be important specifically for water ice. Laboratory experiments indicate that ice at atmospherically relevant temperatures, rather than being formed purely from the hexagonal crystallographic phase, can contain numerous stacking faults, where adjacent molecular layers are stacked in the cubic instead of hexagonal sequence, leading to “stacking-disordered ice”. Such a structure is associated with the lower symmetry, trigonal crystallographic space group P3m1 (Hansen et al., 2008; Murray et al., 2015) and can lead to the production of scalene ice crystals (Kuhs et al., 2012; Murray et al., 2015). Stacking disorder has been associated with the presence of macroscopic kinks and roughness on prismatic facets (Kuhs et al., 2012). It can occur at both cold and warmer temperatures (Malkin et al., 2012, 2015). While stacking-disordered ice tends to anneal to hexagonal ice at higher temperatures (Kuhs et al., 2012), its presence in the early stages of growth may nevertheless influence crystal shape, even if the phase is absent from “mature” crystals. However, we must note that on the basis of molecular modelling the stacking-disordered phase may be less likely to form during growth from vapour than during freezing (Hudait and Molinero, 2016).

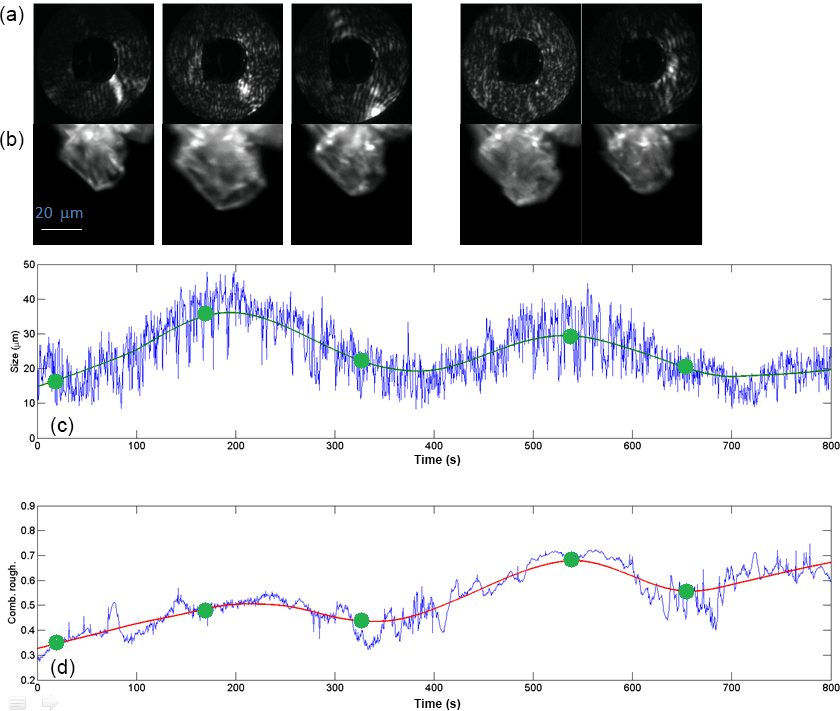
Figure 9Cyclic growth–sublimation experiments with a single ice prism nucleated on a glass fibre at −30 ∘C. After the initial growth, the saturation ratio with respect to ice was between about 1.0 and 1.05 (based on flow rate ratio, which was set to values between 0.8 and 1.0 L min−1 wet flow, and 4.2 and 4.0 L min−1 dry flow; see Fig. 5) and was decreased in order to partly sublimate the crystal. First row shows the 2-D scattering patterns with the corresponding time marked in green. Second row shows the ice crystal at the indicated times. The blue curves below show the actual retrieved data for particle size and roughness. The corresponding green and red best-fit curves were obtained using LOESS regression. A time-lapse video showing the entire sequence of LISA 2-D patterns is given in the Supplement (S1), labelled with experiment time.
3.2 Roughness due to humidity cycles
Another process that could influence the roughness of ice crystals is the exposure to several depositional growth–sublimation cycles which can occur in the atmosphere (Nelson, 1998; Korolev et al., 1999; Ulanowski et al., 2014). Figure 9 shows an example of how such repeated cycles performed at −30 ∘C can lead to roughness in an initially smooth column. After the initial growth, the saturation ratio with respect to ice was between about 1.0 and 1.05 (based on flow rate ratio, which was set to values between 0.8 and 1.0 L min−1 wet flow, and 4.2 and 4.0 L min−1 dry flow; see Fig. 5) and was decreased in order to partly sublimate the crystal. At t=140 s, it can be seen that the column has shrunk and shows a relatively smooth surface with a combined roughness value of about 0.3. The corresponding 2-D scattering pattern is also typical of a relatively smooth column, as can be seen by comparison with Fig. 6. Upon regrowing the crystal, irregularities started forming on the surface, as can be observed in the microscopy image and in the increase of the combined roughness at t=250 s. The ice crystal then was shrunk and regrown again, ending with a combined roughness of about 0.6. A video showing the evolution of the LISA 2-D scattering patterns during the experiment in Fig. 9 is shown in the Supplement (S1). The 10 min period is condensed into 1 min, but the time displayed corresponds to the abscissa in Fig. 9. In the video, the inward and outward drifting of speckle spots corresponds to crystal growth and sublimation, respectively.
A second example is shown in Fig. 10. In this experiment an illite particle on the tip of the glass fibre nucleated an ice crystal at a lower temperature of −40 ∘C. The saturation ratio with respect to ice was similar and between about 1.0 and 1.1 (after the initial growth, values based on flow rate ratio, which was set to values between 0.6 and 0.8 L min−1 wet flow, and 4.4 and 4.2 L min−1 dry flow; see Fig. 5). A video showing the evolution of the 2-D patterns during the experiment in Fig. 10 is shown in the Supplement (S2); as in the previous video the time is speeded up by a factor of 10. As in Fig. 9, rougher features appear during the second growth cycle, as well as in the additional third cycle. Although more experiments would be required to get robust statistics, these observations indicate that the more growth–sublimation cycles are performed, the rougher the crystal can become. The increase observed in the final roughness appeared to be the outcome of an asymmetric, irreversible character of the cyclic growth process; i.e. the increase in roughness during a growth phase was not mirrored by an equal decrease of roughness during the subsequent sublimation phase. Thus, the overall outcome was a gradual “ratcheting-up” of roughness.
We note that similar behaviour has been postulated by Nelson (1998), who stated that due to asymmetry between the growth and sublimation processes – primarily because of different energy barriers to step formation, weaker in the case of sublimation – repeated growth–sublimation cycles would lead to progressively more complex ice crystals. Furthermore, in experiments carried out under atmospherically relevant air pressures, crystals having undergone more than one growth cycle tended to develop more faults (Beckmann, 1982). Korolev et al. (1999) stated that cycling of growth and sublimation caused by mixing and small-scale vertical motions might be a possible route for the formation of irregular crystals. This conjecture is supported by our experiments. It was also suggested by the same authors that “sublimation may cause numerous irregularities on the surface of the ice crystal”. However, while sublimation can in some cases lead to increased roughness, as demonstrated by experiments carried out in scanning electron microscopy (SEM) chambers (Cross, 1969; Pfalzgraff et al., 2010; Neshyba et al., 2013; Ulanowski et al., 2014; Magee et al., 2014), the cyclic growth described here tended to result in a reduction in roughness during each sublimation phase.
The apparent disparity between our observations and SEM experiments can be accounted for by the fact that growth in the absence of air that takes place in a SEM chamber, instead of being limited by vapour diffusion as is the case for ice at tropospheric pressures, becomes limited by the attachment kinetics. This distinction is known to lead to different growth rates as well as habits (Beckmann, 1982; Kuroda and Gonda, 1984; Libbrecht, 2017). Consequently, during SEM observations water molecule removal can take place anywhere on facet surfaces, leading to pronounced roughness. Moreover, the bunching of elementary molecular steps, possibly due to the Schwoebel effect (Misbah et al., 2010), can result in the creation of larger, microscopic (as opposed to elementary) steps that can be seen in SEM micrographs (Cross, 1969). In contrast, in the diffusion-limited regime sublimation tends to remove material near crystal edges and vertices, which can lead to reduced roughness (and rounding), as was the case in our observations. However, for very small crystals the relative impact of diffusion is diminished anyway (Yokoyama and Kuroda, 1990), so we conjecture that sublimation of such crystals might potentially lead to increased roughness even at tropospheric pressures.
A further difference between the diffusion-limited and kinetics-limited growth is that the former can lead to increased numbers of faults (Beckmann, 1982) and dendritic, skeletal or needle-shaped crystals, while the latter tends to produce more perfect, smooth, isometric prisms (Gonda, 1976, 1977) – with similarity to the SEM chamber experiments. Thus stronger departure from smooth, regular crystal shapes – roughness in a general sense – can be expected at tropospheric pressures, provided that the crystals are large enough compared to the mean free path of the water molecule at a given pressure (Yokoyama and Kuroda, 1990).
Another feature of the growth process may be borne out by the cyclic growth experiments. Careful examination of the retrieved crystal size shown in Fig. 9 indicates markedly slower growth in later cycles, despite similar supersaturation levels. A similar effect has been observed in the past for crystallization from solution – a reduction of the growth rate of sucrose crystals that previously experienced a period of rapid growth (Pantaraks and Flood, 2005; Ferreira et al., 2008; Flood, 2010). Thus a “memory effect” may be present, which not only leads to increased roughness in subsequent growth cycles but also results in reduced growth rates under identical supersaturations. This reduction can at first sight be contrary to expectations: high roughness, reflected by high density of surface defects, might lead to increased growth rate under kinetically limited growth conditions. However, this does not occur when growth is diffusion limited, as is the case at tropospherically relevant air pressures. On the contrary, defects resulting from fast growth may inhibit the incorporation of molecules on the crystal surface, possibly through the introduction of impurities (Ferreira et al., 2008; Flood, 2010). Nevertheless we caution that this potentially very important finding must be confirmed through carefully controlled experiments, to eliminate the possibility that the reduced growth rate may have been caused by instrumental factors, such as a reduction of supersaturation in later cycles.
3.3 Atmospheric implications
It is important to mention that certain atmospheric parameters cannot be reproduced in the current experimental setup. These parameters – like air pressure (Neshyba et al., 2013), radiative heating/cooling or fall velocity – can potentially influence the shape of the crystals and their complexity (Hallett, 1987). For example, ice crystal growth is significantly influenced by the ventilation effect (Westbrook and Heymsfield, 2011); high velocities favour plate-like over dendritic habits (Keller and Hallett, 1982); roughness can emerge at lower supersaturations for falling crystals than for stationary ones (Yokoyama and Kuroda, 1990). As stated above, the flow velocity in IRIS is about 1 m s−1, which is slightly higher than the typical fall velocity of ice crystals in the atmosphere; consequently, at more atmospherically relevant velocities, crystal roughness might conceivably become greater than observed here. Airflow could also create asymmetry of the ice crystal shape (Takahashi and Mori, 2006), and therefore the same crystal can have quite different properties depending on its orientation.
Nevertheless, the combined roughness values obtained in the experiments shown here during the two regrowth cycles (values between 0.55 and 0.65) are comparable to the values encountered in mid-latitude cirrus and mixed-phase clouds during CONSTRAIN (Ulanowski et al., 2014), indicating that the results are at least qualitatively comparable.
Regions of very high supersaturation can be encountered in clean air at cirrus altitudes or within cirrus clouds. Several studies have reported supersaturations with respect to ice up to 140 % (the onset of homogeneous ice nucleation) within a temperature range from −33 to −73 ∘C (Gierens et al., 1999, 2000; Ovarlez et al., 2002; Spichtinger et al., 2003, 2004; Krämer et al., 2009). It is very likely, as shown in our experiments, that at higher supersaturation rougher crystals tend to develop instead of smoother ones. The low temperatures at which homogeneous nucleation becomes dominant may be an additional factor leading to increased crystal roughness in the broad sense, as droplets freezing at lower temperatures are more likely to grow into complex polycrystals (Pitter and Pruppacher, 1973; Bacon et al., 2003). On the other hand, high number concentrations of homogeneously nucleated ice lead to quick depletion of available water vapour; hence the ice growth rate can be expected to rapidly peak and then decline. We suggest that disentangling these conflicting influences may be possible through cloud chamber studies.
Humidity variation is omnipresent in cirrus. For example, Kübbeler et al. (2011) and Krämer et al. (2009) show that saturation with respect to ice can depart widely from equilibrium. Therefore, mixing and small-scale vertical motions in clouds, leading to the presence of many depositional growth and sublimation regions, may be a possible mechanism by which roughness emerges (Korolev et al., 1999). In both cirrus and mixed-phase clouds, high-resolution modelling predicts that ice particle trajectories can contain multiple super- and subsaturated regions (Flossmann and Wobrock, 2010; Kübbeler et al., 2011). Such inhomogeneity can be seen as arising from temperature fluctuations due to turbulence at various scales or gravity waves. Indeed, agreement between models and cirrus ice measurements is improved by the inclusion of such fluctuations, in comparisons across a broad range of geographical latitudes (Hoyle et al., 2005; Engel et al., 2013; Jensen et al., 2013). Provided that the ice crystals do not fully sublimate following such cyclic growth, this process would lead to creating rougher ice crystals. Moreover, longer-lived (older) clouds may contain higher incidence and/or intensity of roughness than short-lived ones. The history of individual ice crystals may also impact their subsequent growth rates, as discussed in Sect. 3.2. Therefore future microphysical or parameterized cloud models may be improved by the introduction of such a memory effect, in addition to temperature and humidity.
Finally, we note that rough ice surfaces are associated with stronger electrical charging (Caranti and Illingworth, 1983; Dash et al., 2001; Dash and Wettlaufer, 2003); hence the presence of roughness may influence storm electrification. If so, measures of roughness based on 2-D scattering patterns could be an indicator of the cloud electrification potential of ice crystals, since they are sensitive to the presence of multiple scattering centres on ice surfaces, corresponding to the unevenness of the surfaces.
An experimental system was developed to investigate light-scattering properties of single ice crystals grown on a glass fibre as a function of the prevailing thermodynamic conditions. The system, called Ice Roughness Investigation System (IRIS), is based on the laminar flow tube LACIS and a laboratory version of the Small Ice Detector 3 (SID-3), which was additionally equipped with an optical microscope. The thermodynamic conditions during the experiments are controlled by varying the dry and wet gas flows passing through the flow tube, allowing changes of temperature and saturation ratio over a wide range on a timescale of less than 5 s.
First investigations of the impact of the saturation ratio and cyclic growth on the development of ice crystal roughness show that repeated depositional growth–sublimation cycles lead to progressively increasing ice crystal roughness, as indicated by 2-D scattering patterns. Results also show that the higher the supersaturation, the faster the increase in roughness. Moreover, crystal growth rate appears to be lower later in the cycles, once roughness has developed, hinting at an additional memory effect.
Further experiments should be performed to achieve a better understanding of the influence of supersaturation on the development of rough ice crystals at different temperatures. In addition, it is also of great importance to investigate what the impact is of the nature of the ice-nucleating particle and the nucleation mechanism on the development of roughness. In particular, cloud chamber experiments should elucidate the influence of the dynamics of the homogeneous nucleation process, whereby large initial supersaturation leading potentially to increased roughness (due to fast growth) may be counteracted by reduced supersaturation due to the presence of high ice crystal concentrations (i.e. slow growth). Experiments comparing the degree of roughness from repeated humidity cycles with different frequencies (i.e. the same growth and sublimation rates (i.e. humidity amplitude) and total duration but shorter or longer cycles) would elucidate whether the lifetime of the cloud or the frequency of fluctuations is more important for roughness development. Finally, the sensitivity of ice crystal growth rate to growth history, in particular the resulting roughness, should be investigated, with a view to improving future cloud models. Such improvements may allow more accurate representation of not just roughness but crystal size too, and hence characteristics such as radiative properties, cloud lifetime, precipitation development and possibly also cloud electrification properties.
Videos containing time series of 2-D scattering patterns obtained during experiments shown in Figs. 9 and 10 have been deposited on the TIB AV-Portal (Chou et al., 2018a, b, respectively). Experimental and modelling data are available from the authors upon request.
The supplement related to this article is available online at: https://doi.org/10.5194/acp-18-13687-2018-supplement.
CC, JV, PH and HB designed and carried out the experiments including sample preparation and data analysis with assistance from TC. JV performed the computational fluid dynamics simulations. ZU conceived and supervised the project and provided crystal property measurement techniques and interpretation of ice growth processes. FS, ZU and JV developed the main conceptual ideas and the technical details of the experiments and the experimental setup IRIS. CC, JV and ZU wrote the manuscript with support from PH, HB, FS, TC, DN, SH and GR. All authors discussed the results. JV and CC contributed equally to this work.
The authors declare that they have no conflict of interest.
This work was supported by the UK Natural
Environment Research Council grant NE/I020067/1 (ACID-PRUF) and the EU
Eurochamp-2 scheme grant E2-2011-12-06-0065. The concept of LISA was proposed
by Alexei Kiselev, and the instrument itself was designed and built by Edwin Hirst
at the University of Hertfordshire. We also acknowledge Christabel Tan
for preparing the chemical solution used to clean the fibres.
Edited by: Daniel J. Cziczo
Reviewed by: three anonymous referees
Auriol, F., Gayet, J.-F., Febvre, G., Jourdan, O., Labonnote, L., and Brogniez, G.: In situ observations of cirrus cloud scattering phase function with 22∘ and 46∘ halos: Cloud field study on 19 February 1998, J. Atmos. Sci., 58, 3376–3390, https://doi.org/10.1175/1520-0469(2001)058<3376:ISOOCS>2.0.CO;2, 2001. a
Bacon, N. J., Baker, M. B., and Swanson, B. D.: Initial stages in the morphological evolution of vapour-grown ice crystals: A laboratory investigation, Q. J. Roy. Meteor. Soc., 129, 1903–1927, https://doi.org/10.1256/qj.02.04, 2003. a, b, c
Bailey, M. and Hallett, J.: Growth rates and habits of ice crystals between −20 ∘ and −70 ∘C, J. Atmos. Sci., 61, 514–544, https://doi.org/10.1175/1520-0469(2004)061<0514:GRAHOI>2.0.CO;2, 2004. a, b
Baran, A. J.: From the single-scattering properties of ice crystals to climate prediction: A way forward, Atmos. Res., 112, 45–69, https://doi.org/10.1016/j.atmosres.2012.04.010, 2012. a
Baumgardner, D., Abel, S. J., Axisa, D., Cotton, R., Crosier, J., Field, P., Gurganus, C., Heymsfield, A., Korolev, A., Kraemer, M., Lawson, P., McFarquhar, G., Ulanowski, Z., and Um, J.: Cloud ice properties: in situ measurement challenges, Meteor. Monographs, 58, 9.1–9.23, https://doi.org/10.1175/AMSMONOGRAPHS-D-16-0011.1, 2017. a
Beckmann, W.: Interface kinectics of the growth and evaporation of ice single crystals from the vapour phase: III. Measurements under partial pressures of nitrogen, J. Cryst. Growth, 58, 443–451, https://doi.org/10.1016/0022-0248(82)90291-3, 1982. a, b, c, d
Boucher, O., Randall, D., Artaxo, P., Bretherton, C., Feingold, G., Forster, P., Kerminen, V.-M., Kondo, Y., Liao, H., Lohmann, U., Rasch, P., Satheesh, S. K., Sherwood, S., Stevens, B., and Zhang, X. Y.: Clouds and aerosols, in: Climate change 2013: the physical science basis. Contribution of Working Group I to the Fifth Assessment Report of the Intergovernmental Panel on Climate Change, 571–657, Cambridge University Press, Cambridge, UK, https://doi.org/10.1017/CBO9781107415324.016, 2013. a
Caranti, J. M. and Illingworth, A. J.: The contact potential of rimed ice, J. Phys. Chem., 87, 4125–4130, https://doi.org/10.1021/j100244a028, 1983. a
Chou, C., Voigtländer, J., and Ulanowski, Z.: Evolution of 2-D light scattering patterns during cyclic ice growth experiment in Fig. 9, https://doi.org/10.5446/35425, 2018a.
Chou, C., Voigtländer, J., and Ulanowski, Z.: Evolution of 2-D light scattering patterns during cyclic ice growth experiment in Fig. 10, https://doi.org/10.5446/35426, 2018b.
Clarke, A. J. M., Hesse, E., Ulanowski, Z., and Kaye, P. H.: A 3D implementation of ray tracing combined with diffraction on facets: Verification and a potential application, J. Quant. Spectrosc. Ra., 100, 103–114, https://doi.org/10.1016/j.jqsrt.2005.11.028, 2006. a
Cleveland, W. S. and Devlin, S. J.: Locally weighted regression: an approach to regression analysis by local fitting, J. Am. Stat. Assoc., 83, 596–610, https://doi.org/10.1080/01621459.1988.10478639, 1988. a
Connolly, P. J., Flynn, M. J., Ulanowski, Z., Choularton, T. W., Gallagher, M. W., and Bower, K. N.: Calibration of 2-D imaging probes using calibration beads and ice crystal analogues, J. Atmos. Ocean. Tech., 24, 1860–1879, https://doi.org/10.1175/JTECH2096.1, 2007. a
Cotton, R., Osborne, S., Ulanowski, Z., Hirst, E., Kaye, P. H., and Greenaway, R.: The ability of the Small Ice Detector (SID-2) to characterize cloud particle and aerosol morphologies obtained during flights of the FAAM BAe-146 research aircraft, J. Atmos. Ocean. Tech., 27, 290–303, https://doi.org/10.1175/2009JTECHA1282.1, 2010. a
Cross, J. D.: Scanning electron microscopy of evaporating ice, Science, 164, 174–175, https://doi.org/10.1126/science.164.3876.174, 1969. a, b
Dash, J. G. and Wettlaufer, J. S.: The surface physics of ice in thunderstorms, Can. J. Phys., 81, 201–207, https://doi.org/10.1139/p03-011, 2003. a, b, c
Dash, J. G., Mason, B. L., and Wettlaufer, J. S.: Theory of charge and mass transfer in ice-ice collisions, J. Geophys. Res., 106, 20395–20402, https://doi.org/10.1029/2001JD900109, 2001. a, b
Dash, J. G., Rempel, A. W., and Wettlaufer, J. S.: The physics of premelted ice and its geophysical consequences, Rev. Mod. Phys., 78, 695–741, https://doi.org/10.1103/RevModPhys.78.695, 2006. a, b
Dymarska, M., Murray, B. J., Sun, L., Eastwood, M. L., Knopf, D. A., and Bertram, A. K.: Deposition ice nucleation on soot at temperatures relevant for the lower troposphere, J. Geophys. Res., 111, D04204, https://doi.org/10.1029/2005JD006627, 2006. a
Engel, I., Luo, B. P., Pitts, M. C., Poole, L. R., Hoyle, C. R., Grooß, J.-U., Dörnbrack, A., and Peter, T.: Heterogeneous formation of polar stratospheric clouds – Part 2: Nucleation of ice on synoptic scales, Atmos. Chem. Phys., 13, 10769–10785, https://doi.org/10.5194/acp-13-10769-2013, 2013. a
Ferreira, A., Faria, N., and Rocha, F.: Roughness effect on the overall growth rate of sucrose crystals, J. Cryst. Growth, 310, 442–451, https://doi.org/10.1016/j.jcrysgro.2007.11.031, 2008. a, b, c
Field, P. R., Heymsfield, A. J., and Bansemer, A.: Shattering and particle interarrival times measured by optical array probes in ice clouds, J. Atmos. Ocean. Tech., 23, 1357–1371, https://doi.org/10.1175/JTECH1922.1, 2006. a
Flood, A. E.: Feedback between crystal growth rates and surface roughness, Cryst. Eng. Comm., 12, 313–323, https://doi.org/10.1039/B914913A, 2010. a, b, c
Flossmann, A. I. and Wobrock, W.: A review of our understanding of the aerosol–cloud interaction from the perspective of a bin resolved cloud scale modelling, Atmos. Res., 97, 478–497, https://doi.org/10.1016/j.atmosres.2010.05.008, 2010. a
Foot, J. S.: Some observations of the optical properties of clouds. II: Cirrus, Q. J. Roy. Meteor. Soc., 114, 145–164, https://doi.org/10.1002/qj.49711447908, 1988. a
Garrett, T. J., Hobbs, P. V., and Gerber, H.: Shortwave, single-scattering properties of arctic ice clouds, J. Geophys. Res., 106, 15155–15172, https://doi.org/10.1029/2000JD900195, 2001. a
Gierens, K., Schumann, U., Helten, M., Smit, H., and Marenco, A.: A distribution law for relative humidity in the upper troposphere and lower stratosphere derived from three years of MOZAIC measurements, Ann. Geophys., 17, 1218–1226, https://doi.org/10.1007/s00585-999-1218-7, 1999. a
Gierens, K., Schumann, U., Helten, M., Smit, H., and Wang, P.-H.: Ice-supersaturated regions and subvisible cirrus in the northern midlatitude upper troposphere, J. Geophys. Res., 105, 22743–22753, https://doi.org/10.1029/2000JD900341, 2000. a
Gladich, I., Oswald, A., Bowens, N., Naatz, S., Rowe, P., Roeselova, M., and Neshyba, S.: Mechanism of anisotropic surface self-diffusivity at the prismatic ice–vapor interface, Phys. Chem. Chem. Phys., 17, 22947–22958, https://doi.org/10.1039/c5cp01330e, 2015. a
Gonda, T.: The growth of small ice crystals in gases of high and low pressures, J. Meteor. Soc. Japan, 54, 233–240, https://doi.org/10.2151/jmsj1965.54.4_233, 1976. a
Gonda, T.: The growth of small ice crystals in gases of high and low pressures at −30 and −44 ∘C, J. Meteor. Soc. Japan, 55, 142–146, https://doi.org/10.2151/jmsj1965.55.1_142, 1977. a
Hallett, J.: Faceted snow crystals, J. Opt. Soc. Am., 4, 581–588, https://doi.org/10.1364/JOSAA.4.000581, 1987. a
Hansen, T. C., Koza, M. M., and Kuhs, W. F.: Formation and annealing of cubic ice: I. Modelling of stacking faults, J. Phys., 20, 285104, https://doi.org/10.1088/0953-8984/20/28/285104, 2008. a
Haralick, R. M., Shanmugam, K., and Dinstein, I.: Textural features for image classification, IEEE T. Syst. Man. Cyb., SMC-3, 610–621, https://doi.org/10.1109/TSMC.1973.4309314, 1973. a
Hartmann, D. L., Ockert-Bell, M. E., and Michelsen, M. L.: The effect of cloud type on Earth's energy balance: Global analysis, J. Climate, 5, 1281–1304, https://doi.org/10.1175/1520-0442(1992)005<1281:TEOCTO>2.0.CO;2, 1992. a
Hartmann, S., Niedermeier, D., Voigtländer, J., Clauss, T., Shaw, R. A., Wex, H., Kiselev, A., and Stratmann, F.: Homogeneous and heterogeneous ice nucleation at LACIS: operating principle and theoretical studies, Atmos. Chem. Phys., 11, 1753–1767, https://doi.org/10.5194/acp-11-1753-2011, 2011. a, b
Heymsfield, A. J., Krämer, M., Luebke, A., Brown, P., Cziczo, D. J., Franklin, C., Lawson, P., Lohmann, U., McFarquhar, G., Ulanowski, Z., and VanTricht, K.: Cirrus clouds, Meteor. Monographs, 58, 2.1–2.26, https://doi.org/10.1175/AMSMONOGRAPHS-D-16-0010.1, 2017. a
Hioki, S., Yang, P., Baum, B. A., Platnick, S., Meyer, K. G., King, M. D., and Riedi, J.: Degree of ice particle surface roughness inferred from polarimetric observations, Atmos. Chem. Phys., 16, 7545–7558, https://doi.org/10.5194/acp-16-7545-2016, 2016. a
Hoyle, C. R., Luo, B. P., and Peter, T.: The origin of high ice crystal number densities in cirrus clouds, J. Atmos. Sci., 62, 2568–2579, https://doi.org/10.1175/JAS3487.1, 2005. a
Hudait, A. and Molinero, V.: What determines the ice polymorph in clouds?, J. Amer. Chem. Soc., 138, 8958–8967, https://doi.org/10.1021/jacs.6b05227, 2016. a
Jensen, E. J., Lawson, P., Baker, B., Pilson, B., Mo, Q., Heymsfield, A. J., Bansemer, A., Bui, T. P., McGill, M., Hlavka, D., Heymsfield, G., Platnick, S., Arnold, G. T., and Tanelli, S.: On the importance of small ice crystals in tropical anvil cirrus, Atmos. Chem. Phys., 9, 5519–5537, https://doi.org/10.5194/acp-9-5519-2009, 2009. a
Jensen, E. J., Lawson, R. P., Bergman, J. W., Pfister, L., Bui, T. P., and Schmitt, C. G.: Physical processes controlling ice concentrations in synoptically forced, midlatitude cirrus, J. Geophys. Res., 118, 5348–5360, https://doi.org/10.1002/jgrd.50421, 2013. a
Jolic, K. I., Nagarajah, C. R., and Thompson, W.: Non-contact, optically based measurement of surface roughness of ceramics, Meas. Sci. Technol., 5, 671–684, https://doi.org/10.1088/0957-0233/5/6/007, 1994. a
Kaye, P. H., Hirst, E., Greenaway, R. S., Ulanowski, Z., Hesse, E., DeMott, P. J., Saunders, C., and Connolly, P.: Classifying atmospheric ice crystals by spatial light scattering, Opt. Lett., 33, 1545–1547, https://doi.org/10.1364/OL.33.001545, 2008. a, b
Keller, V. W. and Hallett, J.: Influence of air velocity on the habit of ice crystal growth from the vapor, J. Cryst. Growth, 60, 91–106, https://doi.org/10.1016/0022-0248(82)90176-2, 1982. a
Korolev, A. V., Isaac, G. A., and Hallett, J.: Ice particle habits in Arctic clouds, Geophys. Res. Lett., 26, 1299–1302, https://doi.org/10.1029/1999GL900232, 1999. a, b, c, d
Korolev, A. V., Emery, E. F., Strapp, J. W., Cober, S. G., Isaac, G. A., Wasey, M., and Marcotte, D.: Small ice particles in tropospheric clouds: Fact or artifact? Airborne Icing Instrumentation Evaluation Experiment, B. Am. Meteorol. Soc., 92, 967–973, https://doi.org/10.1175/2010BAMS3141.1, 2011. a
Krämer, M., Schiller, C., Afchine, A., Bauer, R., Gensch, I., Mangold, A., Schlicht, S., Spelten, N., Sitnikov, N., Borrmann, S., de Reus, M., and Spichtinger, P.: Ice supersaturations and cirrus cloud crystal numbers, Atmos. Chem. Phys., 9, 3505–3522, https://doi.org/10.5194/acp-9-3505-2009, 2009. a, b
Kübbeler, M., Hildebrandt, M., Meyer, J., Schiller, C., Hamburger, Th., Jurkat, T., Minikin, A., Petzold, A., Rautenhaus, M., Schlager, H., Schumann, U., Voigt, C., Spichtinger, P., Gayet, J.-F., Gourbeyre, C., and Krämer, M.: Thin and subvisible cirrus and contrails in a subsaturated environment, Atmos. Chem. Phys., 11, 5853–5865, https://doi.org/10.5194/acp-11-5853-2011, 2011. a, b
Kuhs, W. F., Sippel, C., Falenty, A., and Hansen, T. C.: Extent and relevance of stacking disorder in “ice Ic”, P. Natl. Acad. Sci. USA, 109, 21259–21264, https://doi.org/10.1073/pnas.1210331110, 2012. a, b, c
Kuroda, T. and Gonda, T.: Rate determining provesses of growth of ice crystals from the vapour phase, Part II: investigations of surface kinetic processes, J. Meteor. Soc. Jap., 62, 563–572, https://doi.org/10.2151/jmsj1965.62.3_563, 1984. a
Libbrecht, K. G.: Physical dynamics of ice crystal growth, Annu. Rev. Mat. Res., 47, 271–295, https://doi.org/10.1146/annurev-matsci-070616-124135, 2017. a
Liu, C., Panetta, R. L., and Yang, P.: The effects of surface roughness on the scattering properties of hexagonal columns with sizes from the Rayleigh to the geometric optics regimes, J. Quant. Spectrosc. Ra., 129, 169–185, https://doi.org/10.1016/j.jqsrt.2013.06.011, 2013. a
Lu, R.-S., Tian, G.-Y., Gledhill, D., and Ward, S.: Grinding surface roughness measurement based on the co-occurrence matrix of speckle pattern texture, Appl. Optics, 45, 8839–8847, https://doi.org/10.1364/AO.45.008839, 2006. a
Magee, N. B., Miller, A., Amaral, M., and Cumiskey, A.: Mesoscopic surface roughness of ice crystals pervasive across a wide range of ice crystal conditions, Atmos. Chem. Phys., 14, 12357–12371, https://doi.org/10.5194/acp-14-12357-2014, 2014. a
Malkin, T. L., Murray, B. J., Brukhno, A. V., Anwar, J., and Salzmann, C. G.: Structure of ice crystallized from supercooled water, P. Natl. Acad. Sci. USA, 109, 1041–1045, https://doi.org/10.1073/pnas.1113059109, 2012. a
Malkin, T. L., Murray, B. J., Salzmann, C. G., Molinero, V., Pickering, S. J., and Whale, T. F.: Stacking disorder in ice I, Phys. Chem. Chem. Phys., 17, 60–76, https://doi.org/10.1039/C4CP02893G, 2015. a
Mason, B. J., Bryant G. W., and Van den Heuvel, A. P.: The growth habits and surface structure of ice crystals, Philos. Mag. 8, 505–526, https://doi.org/10.1080/14786436308211150, 1963. a, b
McFarquhar, G. M. and Heymsfield, A. J.: Parameterization of tropical cirrus ice crystal size distributions and implications for radiative transfer: Results from CEPEX, J. Atmos. Sci., 54, 2187–2200, https://doi.org/10.1175/1520-0469(1997)054<2187:POTCIC>2.0.CO;2, 1997. a
McFarquhar, G. M., Heymsfield, A. J., Spinhirne, J., and Hart, B.: Thin and subvisual tropopause tropical cirrus: Observations and radiative impacts, J. Atmos. Sci., 57, 1841–1853, https://doi.org/10.1175/1520-0469(2000)057<1841:TASTTC>2.0.CO;2, 2000. a
Michaelides, A., and Slater, B.: Melting the ice one layer at a time, P. Natl. Acad. Sci. USA, 114, 195–197, https://doi.org/10.1073/pnas.1619259114, 2017. a
Misbah, C., Pierre-Louis, O., and Saito, Y.: Crystal surfaces in and out of equilibrium: A modern view, Rev. Mod. Phys., 82, 981–1040, https://doi.org/10.1103/RevModPhys.82.981, 2010. a
Murray, B. J., Salzmann, C. G., Heymsfield, A. J., Dobbie, S., Neely III, R. R., and Cox, C. J.: Trigonal ice crystals in Earth's atmosphere, B. Am. Meteorol. Soc., 96, 1519–1531, https://doi.org/10.1175/BAMS-D-13-00128.1, 2015. a, b
Nelson, J.: Sublimation of ice crystals, J. Atmos. Sci., 55, 910–919, https://doi.org/10.1175/1520-0469(1998)055<0910:SOIC>2.0.CO;2, 1998. a, b
Neshyba, S. P., Lowen, B., Benning, M., Lawson, A., and Rowe, P. M.: Roughness metrics of prismatic facets of ice, J. Geophys. Res., 118, 3309–3318, https://doi.org/10.1002/jgrd.50357, 2013. a, b
Ovarlez, J., Gayet, J.-F., Gierens, K., Ström, J., Ovarlez, H., Auriol, F., Busen, R., and Schumann, U.: Water vapour measurements inside cirrus clouds in Northern and Southern hemispheres during INCA, Geophys. Res. Lett., 29, 60-1–60-4, https://doi.org/10.1029/2001GL014440, 2002. a
Pantaraks, P. and Flood, A. E.: Effect of growth rate history on current crystal growth: A second look at surface effects on crystal growth rates, Cryst. Growth Des., 5, 365–371, https://doi.org/10.1021/cg049863k, 2005. a, b
Pfalzgraff, W. C., Hulscher, R. M., and Neshyba, S. P.: Scanning electron microscopy and molecular dynamics of surfaces of growing and ablating hexagonal ice crystals, Atmos. Chem. Phys., 10, 2927–2935, https://doi.org/10.5194/acp-10-2927-2010, 2010. a
Pitter, R. L. and Pruppacher, H. R.: A wind tunnel investigation of freezing of small water drops falling at terminal velocity in air, Q. J. Roy. Meteor. Soc., 99, 540–550, https://doi.org/10.1002/qj.49709942111, 1973. a, b
Sassen, K., Wang, Z., and Liu, D.: Cirrus clouds and deep convection in the tropics: Insights from CALIPSO and CloudSat, J. Geophys. Res., 114, D00H06, https://doi.org/10.1029/2009JD011916, 2009. a
Sazaki, G., Zepeda, S., Nakatsubo, S., Yokoyama, E., and Furukawa, Y.: Elementary steps at the surface of ice crystals visualized by advanced optical microscopy, P. Natl. Acad. Sci. USA, 107, 19702–19707, https://doi.org/10.1073/pnas.1008866107, 2010. a
Schmitt, C. G., Schnaiter, M., Heymsfield, A. J., Yang, P., Hirst, E., and Bansemer, A.: The Microphysical Properties of Small Ice Particles Measured by the Small Ice Detector-3 Probe during the MACPEX Field Campaign, J. Atmos. Sci., 73, 4775–4791, https://doi.org/10.1175/JAS-D-16-0126.1, 2016. a
Schnaiter, M., Järvinen, E., Vochezer, P., Abdelmonem, A., Wagner, R., Jourdan, O., Mioche, G., Shcherbakov, V. N., Schmitt, C. G., Tricoli, U., Ulanowski, Z., and Heymsfield, A. J.: Cloud chamber experiments on the origin of ice crystal complexity in cirrus clouds, Atmos. Chem. Phys., 16, 5091–5110, https://doi.org/10.5194/acp-16-5091-2016, 2016. a, b, c
Spichtinger, P., Gierens, K., and Read, W.: The global distribution of ice-supersaturated regions as seen by the Microwave Limb Sounder, Q. J. Roy. Meteor. Soc., 129, 3391–3410, https://doi.org/10.1256/qj.02.141, 2003. a
Spichtinger, P., Gierens, K., Smit, H. G. J., Ovarlez, J., and Gayet, J.-F.: On the distribution of relative humidity in cirrus clouds, Atmos. Chem. Phys., 4, 639–647, https://doi.org/10.5194/acp-4-639-2004, 2004. a
Stratmann, F., Kiselev, A., Wurzler, S., Wendisch, M., Heintzenberg, J., Charlson, R. J., Diehl, K., Wex, H., and Schmidt, S.: Laboratory studies and numerical simulations of cloud droplet formation under realistic supersaturation conditions, J. Atmos. Ocean. Technol., 21, 876–887, https://doi.org/10.1175/1520-0426(2004)021<0876:LSANSO>2.0.CO;2, 2004. a, b
Takahashi, C. and Mori, M.: Growth of snow crystals from frozen water droplets, Atmos. Res., 82, 385–390, https://doi.org/10.1016/j.atmosres.2005.12.013, 2006. a
Ulanowski, Z., Hesse, E., Kaye, P. H., Baran, A. J., and Chandrasekhar, R.: Scattering of light from atmospheric ice analogues, J. Quant. Spectrosc. Ra., 79, 1091–1102, https://doi.org/10.1016/S0022-4073(02)00342-4, 2003. a
Ulanowski, Z., Connolly, P., Flynn, M., Gallagher, M., Clarke, A. J. M., and Hesse, E.: Using ice crystal analogues to validate cloud ice parameter retrievals from the CPI ice spectrometer data, Proc. 14 Int. Conf. Clouds and Precip., 1175–1178, available at: http://hdl.handle.net/2299/6753 (last access: 13 September 2018), 2004. a
Ulanowski, Z., Hesse, E., Kaye, P. H., and Baran, A. J.: Light scattering by complex ice-analogue crystals, J. Quant. Spectrosc. Ra., 100, 382–392, https://doi.org/10.1016/j.jqsrt.2005.11.052, 2006. a
Ulanowski, Z., Hirst, E., Kaye, P. H., and Greenaway, R.: Retrieving the size of particles with rough and complex surfaces from two-dimensional scattering patterns, J. Quant. Spectrosc. Ra., 113, 2457–2464, https://doi.org/10.1016/j.jqsrt.2012.06.019, 2012. a, b, c
Ulanowski, Z., Kaye, P. H., Hirst, E., Greenaway, R. S., Cotton, R. J., Hesse, E., and Collier, C. T.: Incidence of rough and irregular atmospheric ice particles from Small Ice Detector 3 measurements, Atmos. Chem. Phys., 14, 1649–1662, https://doi.org/10.5194/acp-14-1649-2014, 2014. a, b, c, d, e, f, g, h, i, j, k, l, m
Voigtländer, J., Stratmann, F., Niedermeier, D., Wex, H., and Kiselev, A.: Mass accommodation coefficient of water: A combined computational fluid dynamics and experimental data analysis, J. Geophys. Res., 112, D20208, https://doi.org/10.1029/2007JD008604, 2007. a
Westbrook, C. D. and Heymsfield, A. J.: Ice crystals growing from vapor in supercooled clouds between −2.5 ∘C and −22 ∘C: Testing current parameterization methods using laboratory data, J. Atmos. Sci., 68, 2416–2429, https://doi.org/10.1175/JAS-D-11-017.1, 2011. a
Wylie, D., Jackson, D. L., Menzel, W. P., and Bates, J. J.: Trends in global cloud cover in two decades of HIRS observations, J. Climate, 18, 3021–3031, https://doi.org/10.1175/JCLI3461.1, 2005. a
Yang, P., Hong, G., Kattawar, G. W., Minnis, P., and Hu, Y.: Uncertainties associated with the surface texture of ice particles in satellite-based retrieval of cirrus clouds – Part II: Effect of particle surface roughness on retrieved cloud optical thickness and effective particle size, IEEE T. Geosci. Remote Sens., 46, 1948–1957, https://doi.org/10.1109/TGRS.2008.916472, 2008a. a
Yang, P., Kattawar, G. W., Hong, G., Minnis, P., and Hu, Y.: Uncertainties associated with the surface texture of ice particles in satellite-based retrieval of cirrus clouds – Part I: Single-scattering properties of ice crystals with surface roughness, IEEE T. Geosci. Remote Sens., 46, 1940–1947, https://doi.org/10.1109/TGRS.2008.916471, 2008b. a
Yang, P., Liou, K.-N., Bi, L., Liu, C., Yi, B., and Baum, B. A.: On the radiative properties of ice clouds: Light scattering, remote sensing, and radiation parameterization, Adv. Atmos. Sci., 32, 32–63, https://doi.org/10.1007/s00376-014-0011-z, 2015. a, b
Yi, B., Yang, P., Baum, B. A., L'Ecuyer, T., Oreopoulos, L., Mlawer, E. J., Heymsfield, A. J., and Liou, K.-N.: Influence of ice particle surface roughening on the global cloud radiative effect, J. Atmos. Sci., 70, 2794–2807, https://doi.org/10.1175/JAS-D-13-020.1, 2013. a
Yokoyama, E. and Kuroda, T.: Pattern formation in growth of snow crystals occurring in the surface kinetic process and the diffusion process, Phys. Rev. A, 41, 2038–2050, https://doi.org/10.1103/PhysRevA.41.2038, 1990. a, b, c