the Creative Commons Attribution 4.0 License.
the Creative Commons Attribution 4.0 License.
 | 25 Sep 2018
Counteractive effects of regional transport and emission control on the formation of fine particles: a case study during the Hangzhou G20 summit
Xiaofei Qin
Bo Wang
Jian Xu
Jiandong Shen
Jianmin Chen
Kan Huang
Congrui Deng
Renchang Yan
Kaier Xu
Tian Zhang
To evaluate the effect of temporary emission control measures on air quality during the 2016 G20 summit held in Hangzhou, China, an intensive field campaign was conducted with a focus on aerosol chemistry and gaseous precursors from 15 August to 12 September 2016. The concentrations of fine particles were reduced during the intense emission control stages, with the reduction of carbonaceous matter being mostly responsible for this observed decrease. This, in turn, was mainly ascribed to the decrease of secondary organic aerosols via the suppression of daytime peak secondary organic carbon (SOC)formation. Although the regional joint control was enacted extending to the Yangtze River Delta region, the effect of long-range transport on the air quality of Hangzhou was ubiquitous. Unexpectedly high NOx concentrations were observed during the control stage, when the strictest restriction on vehicles was implemented, owing to contributions from upstream populous regions such as Jiangsu and Shandong provinces. In addition, the continental outflow traveling over the ocean triggered a short pollution episode on the first day of the G20 summit, resulting in a significant enhancement of the nitrogen/sulfur oxidation rates. In the wake of the summit, all air pollutants evidently rebounded after the various control measures were lifted. Overall, the fraction of secondary inorganic aerosols (SIA; in this case sulfate, nitrate, and ammonium aerosols – SNA) in PM2.5 increased as relative humidity increased; however, the overall concentration of PM2.5 did not increase. Aerosol components that had distinctly different sources and formation mechanisms, e.g., sulfate/nitrate and elemental carbon, exclusively showed strong correlations during the regional/long-range transport episodes. The sulfate, nitrate, and ammonium to elemental carbon (SNA∕EC) ratio, which was used as a proxy for assessing the extent of secondary inorganic aerosol formation, was found to be significantly enhanced under transport conditions from northern China. This study highlighted that emission control strategies were beneficial for curbing particulate pollution, in addition to the fact that regional/long-range transport may offset local emission control effects to some extent.
- Article
(4166 KB) - Full-text XML
-
Supplement
(1745 KB) - BibTeX
- EndNote


Fine particulate matter (PM) is associated with air quality, public health, and the Earth's climate (Garrett and Zhao, 2006; Liao et al., 2006; Menon et al., 2008; Tie and Cao, 2009; Kim et al., 2008). China, especially its megacities, has experienced frequent and severe air pollution events during the past decade. Severe air pollution episodes are also often accompanied by high PM levels. The chemical composition of PM mainly consists of secondary inorganic aerosols (SIA) and organic matter (OM) that can be differentiated into primary organic aerosol (POA) and secondary organic aerosol (SOA) groups. SIA typically accounts for 40 %–50 % of the particulate mass during heavy pollution events, whilst OM accounts for 30 %–40 % (Sun et al., 2016; Chen et al., 2015; Huang et al., 2012; Guo et al., 2014). During a historical regional pollution episode, the mass ratio of SIA was over one-third in both of China's megacities (Beijing and Shanghai) and in the remote Isle of Huaniao region over the East China Sea (Q. Wang et al., 2015).
After the 2008 Olympic Games and the 2014 APEC (Asia-Pacific Economic Cooperation) summit in Beijing, the G20 (Group of Twenty Finance Ministers and Central Bank Governors) summit in Hangzhou, which took place from 4 to 6 September 2016, was the biggest recent international event in China. The G20 is an international economic cooperation forum that aims to promoting open and constructive discussions and research on substantive issues between developed and emerging market countries in order to seek cooperation and promote international financial stability and economic sustainability. To improve the air quality during the summit, the Chinese government took strict control measures to reduce air pollutant emissions from transportation, industry, construction sites, and power plants. Thus, it was an excellent opportunity to conduct an impact assessment of control measures on atmospheric components. In addition, this assessment was expected to deduce the sources of different air pollution components and provide references for the prevention and control of air pollution in the future.
The components of air pollutants are affected by both emission sources and weather conditions (Wang and Dai, 2016; H. Liu et al., 2016; Schleicher et al., 2012). During the 2008 Olympic Games and the 2014 APEC summit, similar control measures were taken in Beijing and the surrounding areas to achieve a good level of air quality. During the 2008 Olympic period, the decrease in PM2.5 mass was mainly due to the reduction of SIAs, whilst an unexpected PM2.5 increase during the emission control period may have been related to poor weather conditions such as transport from the south and a small amount of precipitation (Li et al., 2013). In addition, the contribution of SIAs increased during this period, while the opposite was noted for organics during haze development, indicating that NOx emission control should be a priority for improving air quality in Chinese megacities (Pan et al., 2016). Particulate matter and street dust concentrations also remained high throughout the Olympic period, probably due to the redistribution of existing sources, implying that the aim of zero pollution is not achievable in the short term (Qiao et al., 2016). Moreover, significant reductions of NOx and VOCs were observed in the first 2 weeks after the control measures were fully implemented. However, the levels of ozone, sulfate, and nitrate in PM2.5 increased; high levels of ozone may also accelerate the oxidation of SO2 to form sulfate (Wang et al., 2010). During the 2014 APEC summit, all aerosol components were significantly reduced, while the O3 concentration was still high (Z. Wang et al., 2015). Reductions of the precursors of secondary aerosols over regional scales were crucial and effective in mitigating PM pollution (Sun et al., 2016; Chen et al., 2015). From a remote sensing perspective, the regional emission control strategy significantly lowered the extent of regional transport (Huang et al., 2015). When local emission reduction is weakened, the variability of weather conditions plays a more important role, and regional/long-range transport also becomes important (Xu et al., 2016). Therefore, the mechanisms regarding control measures and meteorological conditions on perturbing the levels of air pollutants are complex.
Furthermore, the formation mechanisms for severe pollution are complex and still require clarification, which is also the case for the formation of nitrate and sulfate. Nevertheless, the formation of nitrate is generally dominated by three pathways. Under ammonia-rich conditions, nitrate is mainly formed via the reaction of gaseous HNO3 or nitric acid in droplets; however, in ammonia-poor environments, the heterogeneous hydrolysis of N2O5 on aerosol surfaces dominates (Schryer, 1982; Pathak et al., 2009; Russell et al., 1986; Richards, 1983); this pathway primarily occurs at night under high relative humidity (RH) and low temperature conditions (Lin et al., 2006). During the daytime, NOx reacts with hydroxyl radicals to produce nitric and nitrous acids via complex photochemical reactions (Khoder, 2002). As for sulfate, the gas-phase oxidation of SO2 by OH radicals is its main formation pathway, although the heterogeneous uptake of SO2 on pre-existing particles or in cloud droplets with oxidation by H2O2, O3, NO2, and metal ions is also important for sulfate formation (Cheng et al., 2016; He et al., 2014; Khoder, 2002; Sander and Seinfeld, 1976). Both gas-phase and heterogeneous reactions have been found to be responsible for the increase of fine particles, which ultimately leads to the occurrence of haze (Li et al., 2013; Pan et al., 2016; Wang et al., 2010). The secondary formation of SIAs has been found to be related to heterogeneous aqueous reactions and is largely dependent on the ambient humidity (Wang et al., 2012). Humidity plays a more important role in the rapid increase of nitrate than that of sulfate and ammonium in PM2.5 (Pan et al., 2016). The nitrate to sulfate ratios also exhibit a dependency on RH, and the daily variation of PM2.5 has been found to track the pattern of RH in Beijing (Cheng et al., 2014).
Air pollution has become serious in the Yangtze River Delta region over the past few years due to the fast development of urbanization and industrialization. Hangzhou is one of the major cities in this area, and a large number of economic activities have made its air pollution increasingly prominent. Although some air pollution control measures have been adopted in recent years and the overall air quality in Hangzhou has been improved, air pollution incidents still frequently occur. The average mass concentration of PM2.5 has been reported to be 118 µg m−3 during haze periods, and the contribution of SIA species to PM2.5 mass has increased to almost 50 % under haze and fog conditions (Jansen et al., 2014). Iron/steel manufacturing and secondary aerosols are the main sources of fine particles (G. Liu et al., 2015). In addition to local emissions, it has also been found that air mass pathways and cross-border transport control the high PM2.5 concentrations and formation in Hangzhou (Yu et al., 2014). The PM2.5 and ozone levels in Hangzhou during the G20 summit were considerably lower than previously simulated using the WRF-CMAQ modeling system (P. Li et al., 2017).
In this study, meteorological parameters, gaseous precursors, and aerosol chemical components in Hangzhou before, during, and after the 2016 G20 summit are analyzed. Learning how the emission control measures affect the chemical compositions, sources, and formation mechanisms of fine particles under variable meteorological conditions during the control periods allows for a systematic evaluation of the effectiveness of control measures and provides a relevant basis for the improvement of environmental quality. Although studies regarding the impact of emission controls on air quality have been widely undertaken, this paper introduces the following novel findings. Obvious increases of air pollutants were observed during the two most rigorous control stages, inferring that regional and long-range transport have a significant impact on the air quality of Hangzhou. The formation mechanism of sulfate was different to that of nitrate, with photochemical formation being the dominant mechanism for sulfate and heterogeneous formation being the dominant mechanism for nitrate. The implementation of emission control measures had a significant impact on modifying the diurnal pattern of SOC.
2.1 Observational site
The observational site (120.17∘ N, 30.29∘ E) for this study is located on the roof (∼20 m high) of a residential building in Hangzhou, Zhejiang Province. It is about 13 km from the Hangzhou International Expo Center, which was the main venue for the G20 summit (Fig. 1). This site is surrounded by residential buildings to the north, south, and east, and by several hospitals, with banks and convenience stores to the west. It is representative of mixed emissions such as residential, traffic, etc. During the study period, three zones with different emission control intensities were set up, as shown in Fig. 1.
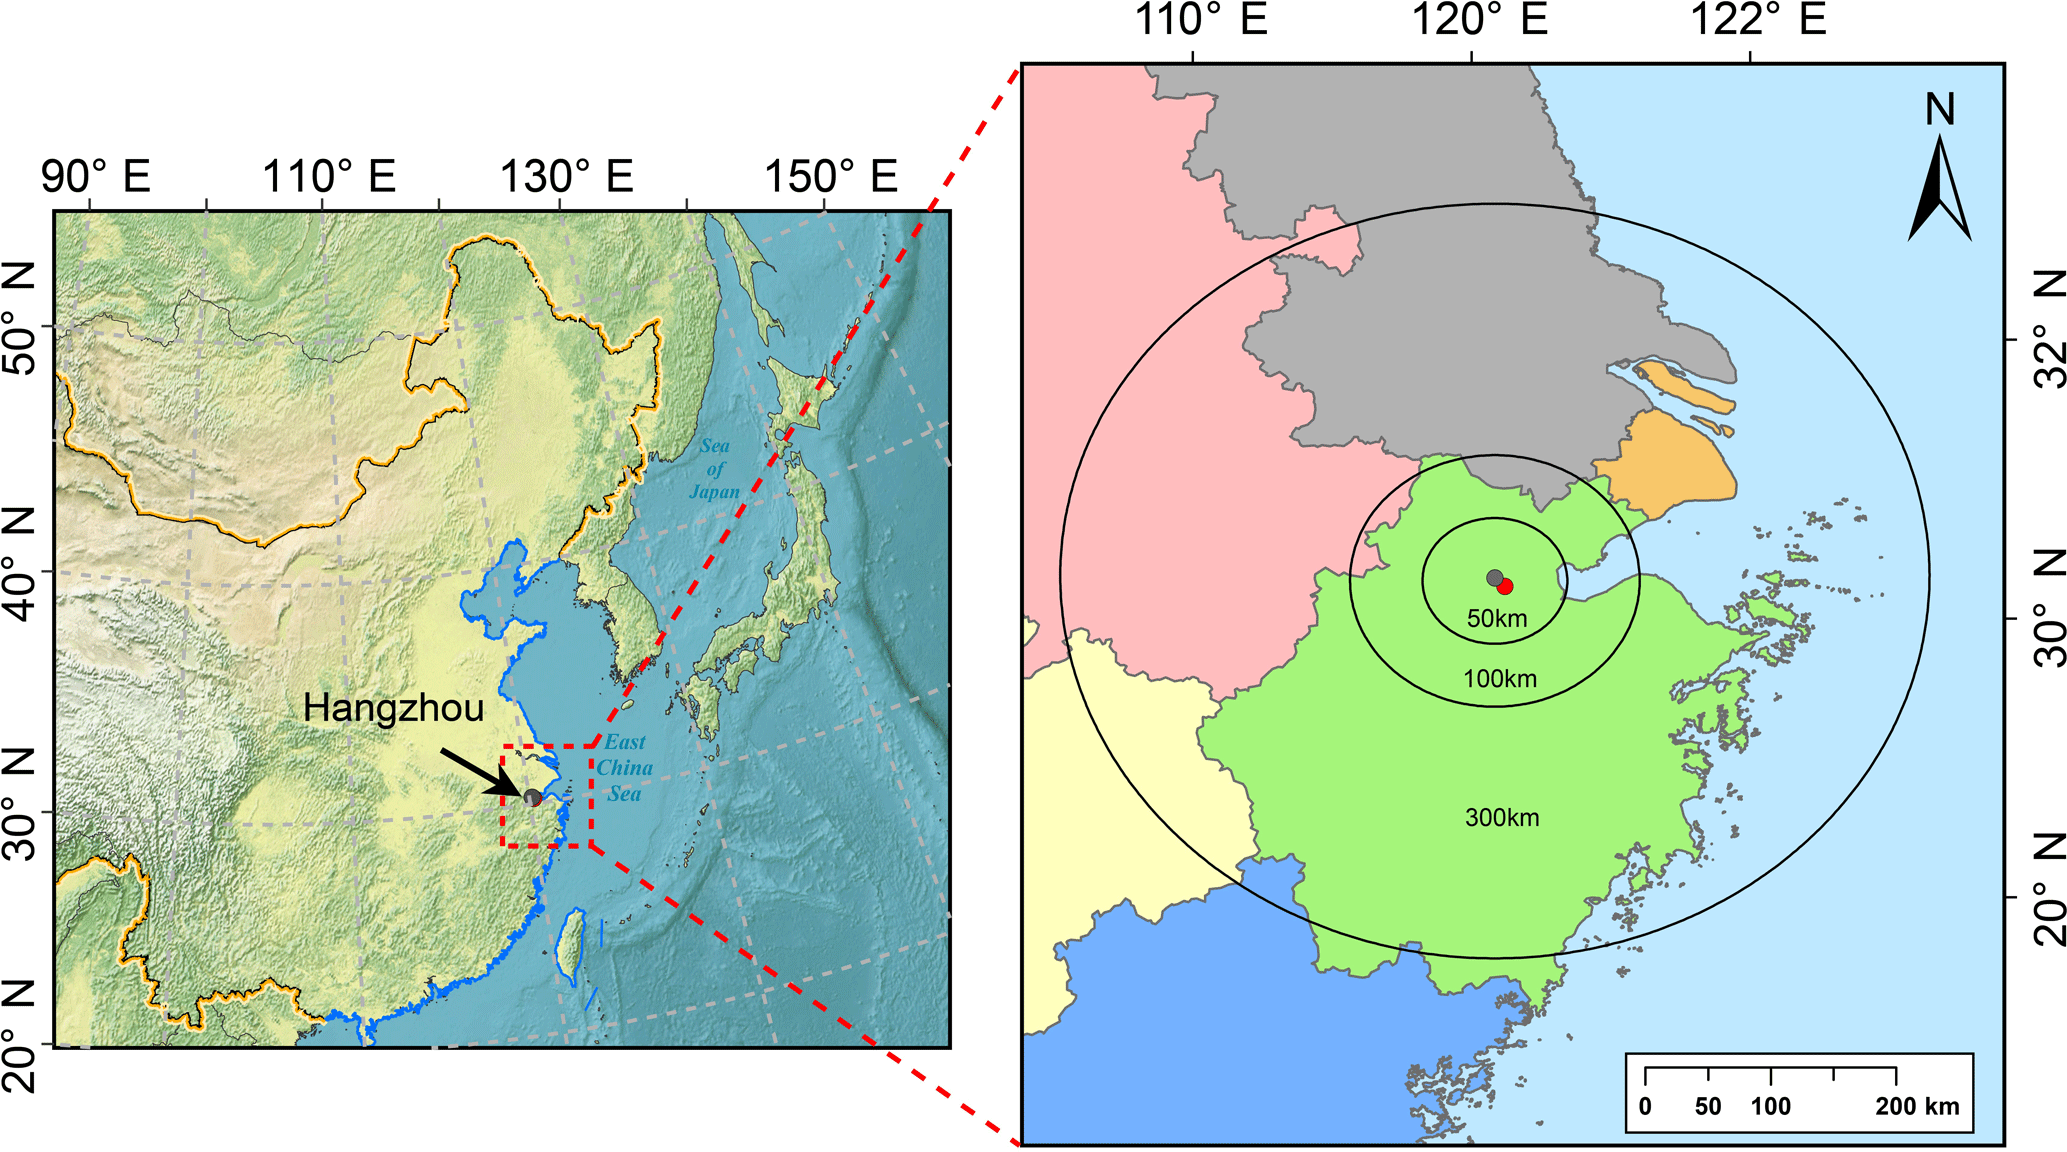
Figure 1Geographic locations of Zhejiang (green), Shanghai (blue), Jiangsu (brown), Anhui (pink), Jiangxi (purple), and Fujian (gray). The red dot in the right panel represents the main venue for the Hangzhou G20 summit, and the gray dot denotes the location of the observational site for this study. By taking the main venue as the center of the emission control zone, the following three regions were set up with respect to different control intensities: the core emission control zone (r<50 km), the strict emission control zone (r<100 km), and the general emission control zone (r<300 km).
2.2 Instrumentation
2.2.1 Water-soluble ions
Water-soluble components of airborne fine particles were continuously measured by an Ambient Ion Monitor (AIM, URG-9000D) during the entire study period. The system consisted of a steam jet aerosol collector (SJAC) and a ion chromatograph (ICS-2100, Dionex). Air flowed into the sampling tube at a rate of 16.7 L min−1. The sampling tube was equipped with a PM2.5 cyclone cutting head, which separated out particulate matter less than 2.5 µm in aerodynamic diameter. Part of the air passed through a liquid diffusion denuder at a rate of 3 L min−1 in order to remove interfering gases (mainly SO2 and HNO3) and the rest of air was emptied. The air then mixed with hot saturated water after entering the steam generator and the mixing chamber, which caused aerosol particles to grow into droplets. The enlarged particles were then separated by an inertial separator. After filtering, the aerosolized liquid was temporarily stored in an aerosol sample collector until the analysis was carried out. The collector then automatically injected the samples into the ion chromatograph. The aerosolized water-soluble ions collected on-line were simultaneously measured by two ion chromatographs via a three-way device.
The routine QA∕QC included the proviso that all standard solutions were of an excellent purity grade and re-prepared monthly. The correlation coefficients (R2) of the standard curve were greater than 99.9 %, except for (R2>99.5 %). The flow rate of the AIM system was checked periodically and kept at 3 L min−1.
2.2.2 Organic carbon (OC) ∕ element carbon (EC)
Organic carbon (OC) and element carbon (EC) in PM2.5 were measured using a Semi-Continuous OC∕EC Analyzer (Sunset Laboratory Inc.). Particles with an aerodynamic particle diameter of less than 2.5 µm were collected by the cyclone separator at a sampling flow rate of 8 L min−1; the sampling time was 40 min per cycle. Air particles were collected on a circular quartz filter with a diameter of about 1.6 cm and an effective sampling area of 2.0 cm2. The volatile organic compounds (VOCs) were removed by a multi-layer parallel organic denuder during sampling. After finishing the collection, high purity helium gas was used to purge the pipeline of the system. NIOSH (National Institute for Occupational Safety and Health) 5040 thermal-optical transmittance (TOT) was then used for analysis within a duration of 15∼20 min. The carbonaceous matter collected on the quartz film was gradually pyrolyzed and catalytically oxidized to CO2 using the programmed temperature and thermo-optical method, and then quantified by a non-dispersive infrared detector (NDIR). The temporal resolution of the measurement was 1 h and the OC∕EC detection sensitivity (calculate as C) could reach 0.1 µg m−3. The instrument was calibrated with methane standard gas for each monitoring cycle, and a monthly standard sucrose solution was used to calibrate the methane standard gas.
2.2.3 PM2.5 and trace gases
PM2.5 was measured by a continuous particulate matter monitor (5030, Thermo, USA). A 43i SO2 gas analyzer and a 42i NO–NO2–NOx analyzer were used to measure the concentrations of trace gases.
2.2.4 Meteorological parameters
The meteorological parameters (wind speed, wind direction, relative humidity, temperature, and radiation) during the G20 period were all measured at the observational site. The height of the boundary layer was estimated based on a co-located aerosol lidar, and was determined based on the height where the decreasing rate of the aerosol extinction coefficient was the most abrupt.
2.3 Data analysis
2.3.1 Air mass back trajectory
The HYSPLIT (HYbrid Single-Particle Lagrangian Integrated Trajectory) model is a complete system for calculating simple air mass backward trajectories, in addition to dispersion and complex deposition simulations (Draxler and Rolph, 2012). To clarify the possible sources of various air pollutants, HYSPLIT4 was run online at the NOAA (National Oceanic and Atmospheric Administration) ARL (Air Resource Laboratory) READY Website (http://www.arl.noaa.gov/ready/hysplit4.html, last access: 18 September 2018) using the meteorological data archives from the ARL. The meteorological input data used in the model were obtained from the National Center for Environmental Prediction's (NCEP) global data assimilation system (GDAS) with a horizontal resolution of . In this study, all back trajectories were calculated at 500 m AGL (above ground level).
2.3.2 Concentration weighted trajectory (CWT) analysis
Concentration weighted trajectory (CWT) analysis (Hsu et al., 2003), a useful tool for source identification, was performed to pinpoint the potential geographic source regions of air pollutants. It should be noted that both air mass trajectory and CWT analyses are methods to reveal potential source regions. Compared to air mass trajectory analysis, CWT has the additional advantage of presenting the spatial distribution of potential sources regions. In this study, we combined air mass trajectory and CWT to identify the source regions of specific air pollutants.
In the CWT method, each grid cell is assigned a weighted concentration by averaging the sample concentrations that have associated trajectories crossing the grid cell as follows:
where Cij is the average weighted concentration in the ijth cell, l is the index of the trajectory, M is the total number of trajectories, Cl is the concentration observed on the arrival of trajectory l, and τijl is the time spent in the ijth cell by trajectory l. A high value for Cij implies that air parcels traveling over the ijth cell are, on average, associated with high concentrations at the receptor.
To eliminate the uncertainty of Cij caused by low nij values, every Cij is multiplied by an arbitrary weight function, Wij, to get more accurate results. The weight function Wij is defined as:
where nave represents the average number of trajectories in grid cells with trajectories passing through the partition region, and nij is the number of all trajectories in the (i, j) cell.
2.3.3 The EC-tracer method
Organic carbon (OC) and elemental carbon (EC) were the major components of fine particles (PM2.5) (Malm et al., 2004). EC was a product of the carbon-based fuel combustion process and was considered to be entirely derived from primary emissions, while OC can be derived from both primary emissions and second formation. SOC (secondary organic carbon) can be estimated using EC as a tracer as follows (Turpin and Huntzicker, 1994):
where (OC∕EC)pri is the OC∕EC ratio of freshly combusted aerosols. To determine the values of (OC∕EC)pri, it was first assumed that the (OC∕EC)pri values varied continuously. We then calculated the corresponding SOC concentrations based on each hypothesized (OC∕EC)pri value and the correlation coefficient (R2) of the SOC and EC pair, i.e., R2 (EC, SOC). Thus, a series of R2 (EC, SOC) values could be plotted against the OC∕EC ratios. Since the sources of EC and SOC were independent, the OC∕EC ratio corresponding to the minimum R2 (EC, SOC) was considered to be (OC∕EC)pri (Wu and Yu, 2016).
3.1 Air quality and weather conditions during the whole study period
The whole study period was divided into five stages: S1 (15–23 August), S2 (24–27 August), S3 (28 August–3 September), S4 (4–6 September), and S5 (7–12 September). S1 was the reference stage without intense emission control measures. S2 was the stage with industrial and construction emission control. In detail, the emission control on industry was implemented during the period from 24 to 25 August. Enterprises in Hangzhou were either temporally suspended or reduced production. After 25 August, construction activities were prohibited. S3 added traffic restrictions. The odd–even traffic rule was fully implemented and vehicles from outside Hangzhou were prohibited from entering the city. In addition, the transportation of dusty materials was not allowed during this period. S4 was the G20 summit period, which was the most stringent emission control stage; this stage involved the implementation of emergency controls on VOC and PM2.5 precursor emissions based on whether a pollution day was predicted by air quality forecasting. S5 was the post-G20 stage with all of the control measures lifted.
A time series of hourly PM2.5, PM10, and their precursors (SO2, NOx) are illustrated in Fig. 2, along with meteorological parameters (i.e., wind speed – WS, wind direction – WD, temperature – T, relative humidity – RH, radiation, and boundary layer height – BLH). As shown in Fig. 2, the easterlies dominated during S1, S4, and S5. The winds changed from easterlies to westerlies in S2 and became southwesterlies in S3. The average wind speeds for S1, S2, S3, S4, and S5 were 1.34, 1.68, 1.30, 1.31, and 0.96 m s−1, respectively. RH in S3 was obviously lower than during the other stages and it later peaked in S5. Temperatures were highest in S1 and S2, gradually decreased in S3, and finally quickly declined in S4 and S5. Radiation was high during the first three stages (with respective mean values of 301, 357, and 433 W m−2 in S1, S2 and S3), especially in S3. It then became weaker during the last two stages (with respective mean values of 204 and 215 W m−2 in S4 and S5). The variation of the boundary layer height was similar to the radiation to some extent: it was high from S1 to S3 but quickly became shallow in S4 and S5. During S2 the industry and construction emission control was accompanied by the highest wind speed, and the concentrations of NOx, SO2, and PM all dropped to low levels. However, it should be noted that although the emission control measures on motor vehicles were added during S3, the concentrations of NOx remained at relatively high levels even under favorable meteorological conditions such as high wind speed, strong radiation, and low relative humidity. This phenomenon will be discussed later in this paper. As S4 was the most stringent emission control period, all air pollutants were greatly reduced even though the meteorological conditions were unfavorable due to relatively low wind speed and high RH. However, a short pollution episode occurred on the morning of 4 September with the hourly PM2.5 concentration exceeding 100 µg m−3. After all of the control measures were lifted in S5, PM2.5 rebounded; this was associated with unfavorable weather conditions (i.e., low wind speed and BLH, weak radiation, and high RH). The average concentrations of PM2.5 during the five stages (S1–S5) were 37.4, 31.8, 40.4, 35.0, and 49.5 µg m−3, respectively. On the whole, the PM2.5 concentrations during the control stages were lower than the reference and post-G20 stages.
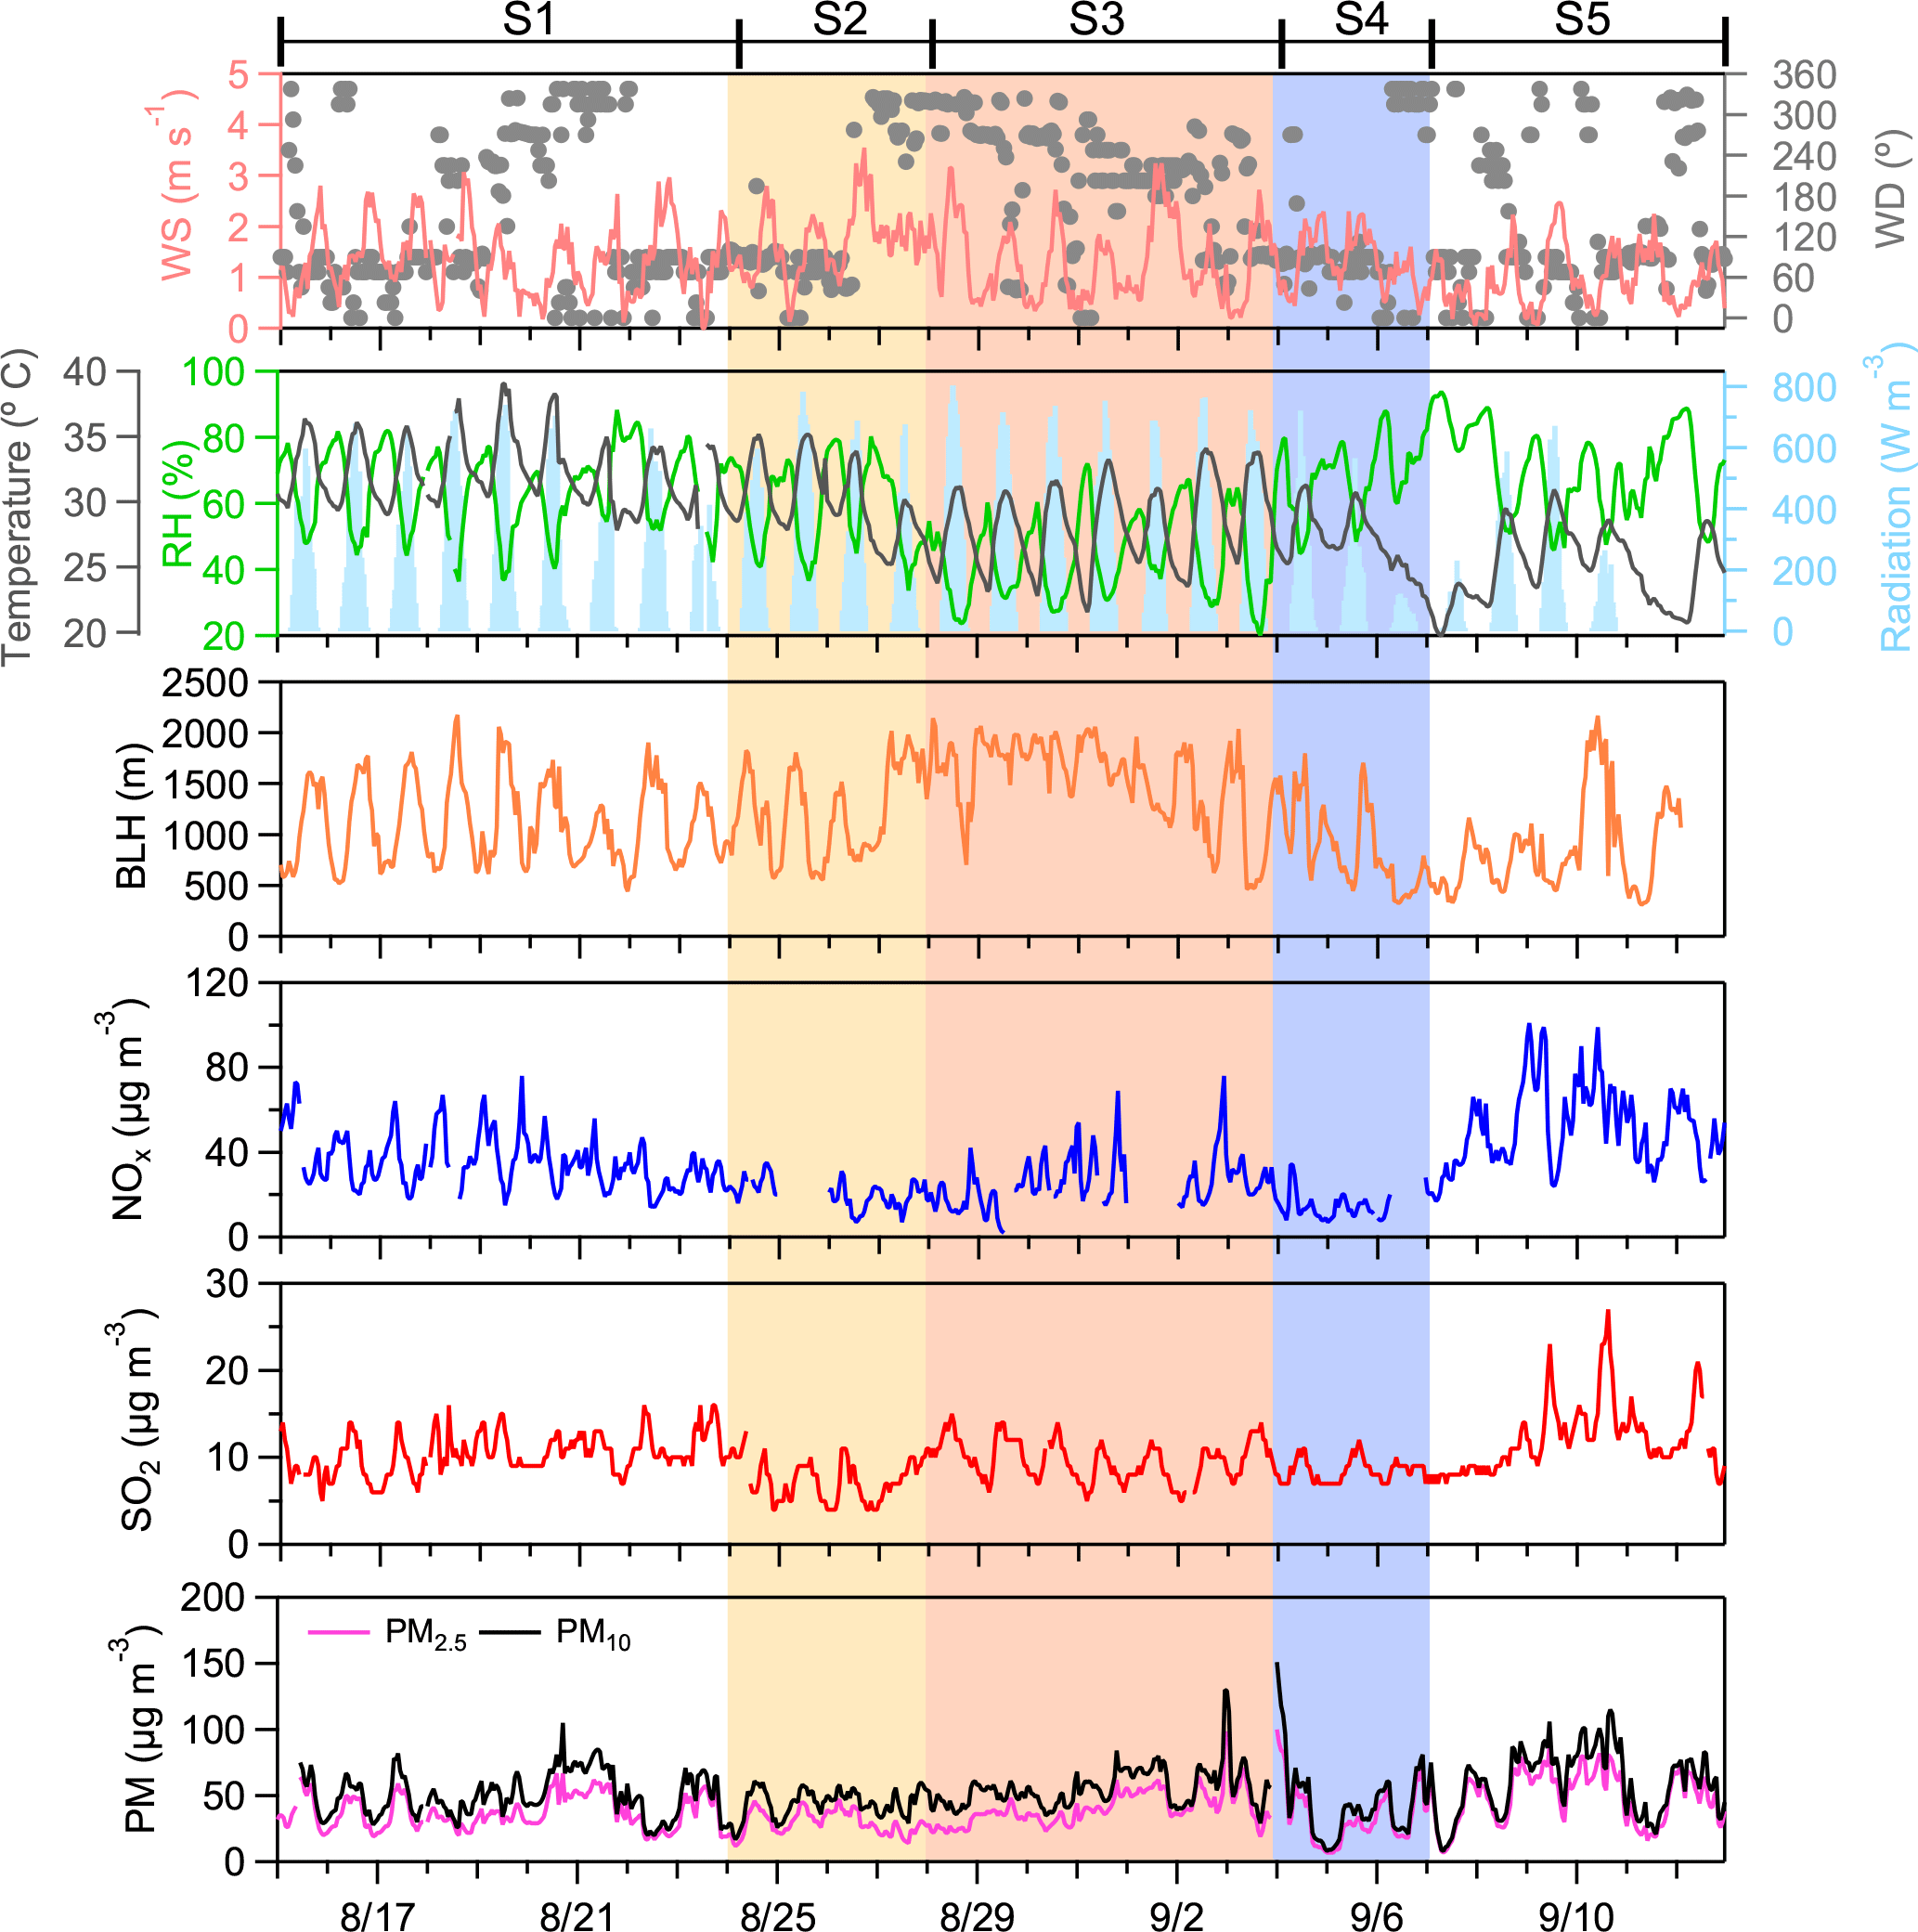
Figure 2Time series of hourly PM2.5 and PM10 concentrations, trace gases (NOx, SO2), and meteorological parameters (wind speed – WS, wind direction – WD, boundary layer height – BLH, relative humidity – RH, temperature – T, and radiation). The five defined stages from S1 to S5 are marked at the top of the figure. S1 was the reference stage, S2 was the stage with industrial and construction emission control, S3 was the stage with added restrictions on motor vehicles, S4 was the G20 summit period, and S5 was the post-G20 stage. The missing data in Fig. 2 are due to the malfunction or maintenance of the instruments.
3.2 Diurnal profiles of PM2.5 species and meteorological variables
The diurnal variations of the major components of PM2.5, as well as the key meteorological parameters, are demonstrated in Fig. 3 for the five abovementioned stages. Regarding the meteorological parameters, in general, RH, T, and WS exhibited consistent diurnal trends throughout the five stages. RH was relatively low during the daytime and high at nighttime, while temperature showed the opposite trend. Wind speed was relatively low during the first half of the day and gradually increased in the afternoon.
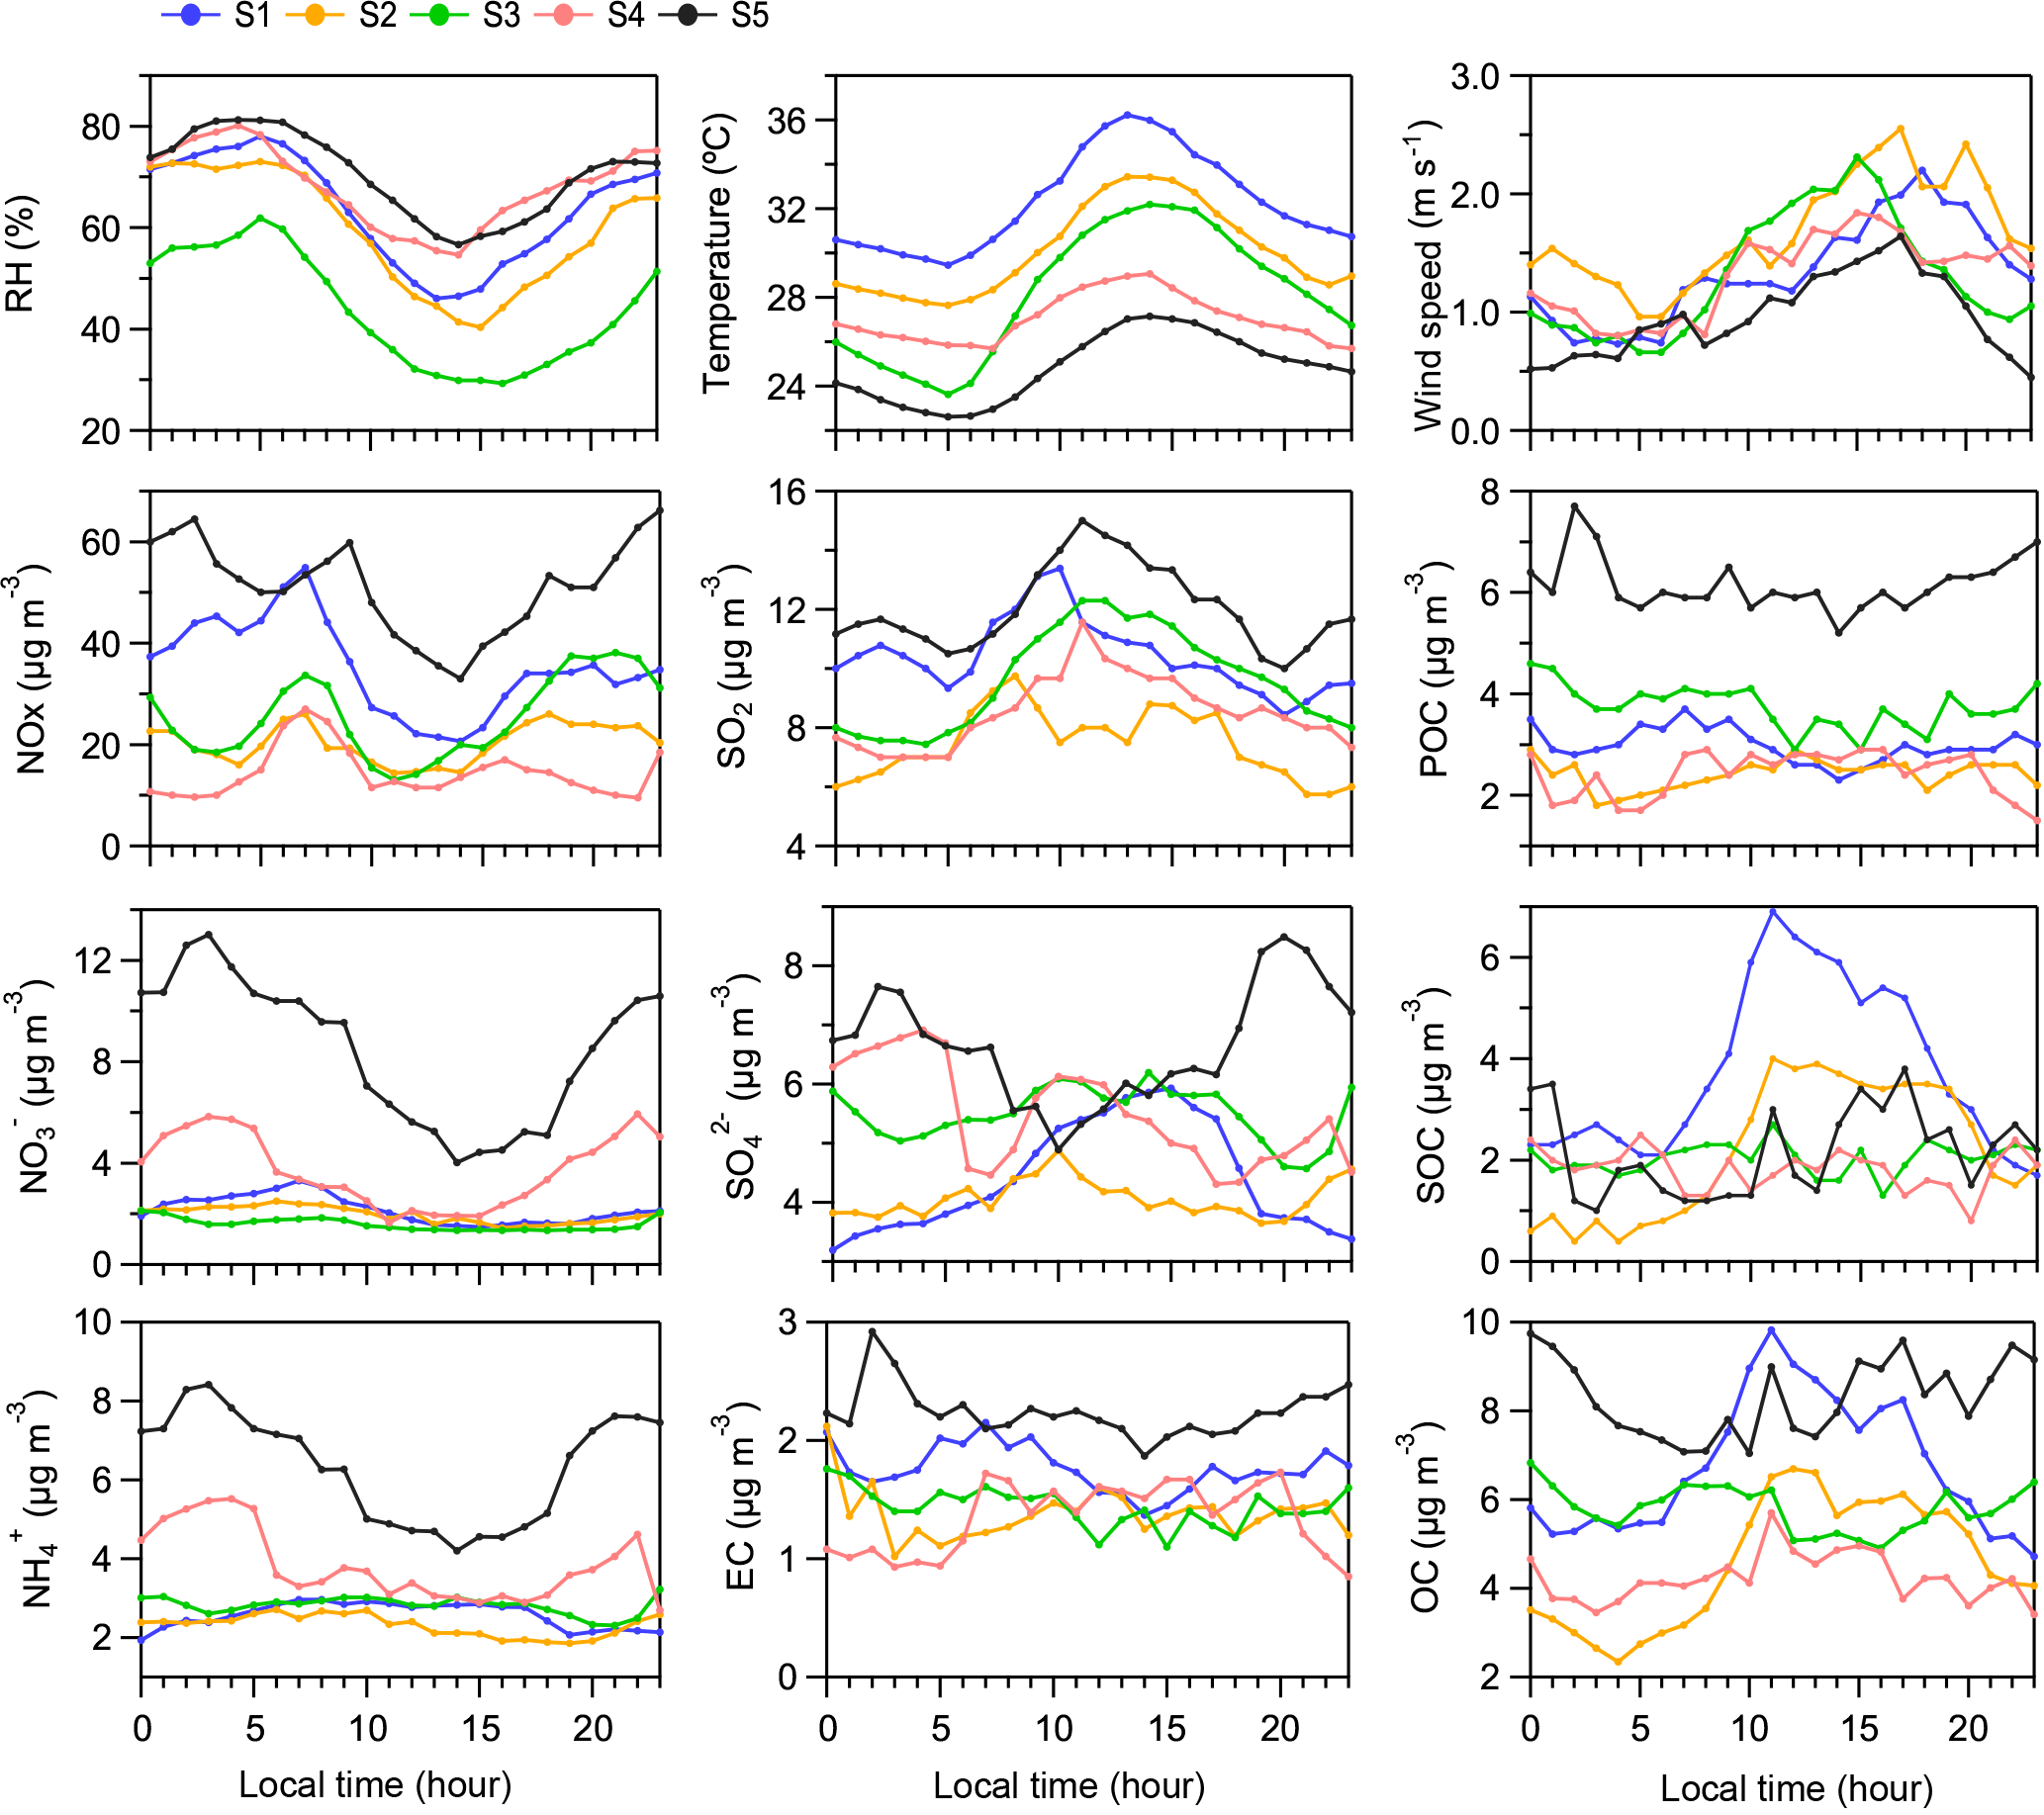
Figure 3Diurnal profiles of PM2.5 species, gaseous pollutants, and meteorological variables during the five stages.
During all five stages, NOx exhibited peak values at around 06:00 ∼ 08:00 LT (local time) and 16:00 ∼ 20:00 LT corresponding to the morning and evening rush hours (due to the enhanced emissions from traffic). In S4 (the G20 period), the evening peak of NOx was almost missing, which can be attributed to the stringent emission control during this period. While in S5, in addition to the peaks during the morning and evening rush hours, NOx showed significant enhancement from around 21:00 to 03:00 LT. This was ascribed to the fact that heavy-duty diesel trucks were allowed into Hangzhou at nighttime after the G20 summit. This phenomenon was also reflected by the corresponding EC and OC peaks, which occurred around the same time. In contrast, the high concentrations of SO2 and mainly appeared from 06:00 to 18:00 LT, tracking well with the working hours. Power plants and industry were the major contributors to SO2 emissions, and they mainly operate during the day. The diurnal variation of sulfate in S5 was a notable exception to this temporal trend, and was different from the other four stages, peaking early in the morning and during the night. The low sulfate levels during daytime were likely due to the low secondary conversion rate associated with weak radiation and low temperatures during this stage. In addition, there were sustained precipitation events during the day on 7 and 9 September (Fig. S1 in the Supplement), which could have reduced the daytime sulfate concentrations to some extent. Therefore, the high levels of sulfate during daybreak and at night may have been related to heterogeneous reactions due to high RH and PM. High PM concentrations in S5 provided enough surface area for the conversion of sulfate under high RH conditions (Mattias Hallquist, 2016).
Primary organic carbon (POC) and secondary organic carbon (SOC) were differentiated in the five stages based on the method described in Sect. 2.2.3. As shown in Fig. 3, POC in all five stages was maintained at certain levels without dramatic diurnal fluctuations. In contrast, SOC in S1, S2, and S5 tended to increase from the early morning and reach a maximum around midday, which indicates the photochemical formation of SOC. This is consistent with previous studies which have shown that photochemical pathways are important for the formation of SOC (Wyche et al., 2014; T. Liu et al., 2015; Kleeman et al., 2007; Xu et al., 2017). Unlike the three abovementioned stages, there were noticeable absences of SOC peaks around midday in stages S3 and S4, which resulted in ambiguous diurnal fluctuations. This makes sense, as the stringent emission control measures during these stages should have exerted a significant impact on SOC formation due to the great reduction of its precursors. Furthermore, the concentration of SOC showed a positive relationship with temperature (Fig. S2): at relatively low temperatures the concentrations of SOC remained at relatively low levels, and they increased greatly with increases in temperature. This indicates the enhanced role of higher temperatures in SOC formation in summer. In this regard, the relatively low temperatures in S3 and S4 may also explain the low SOC concentrations during these two stages. Although S2 was also an emission control stage, no absence of SOC peaks during daytime was observed during this period (as shown in Fig. 3). On the one hand, S2 was the weakest emission control stage and did not involve emission control measures on vehicles, which are important sources of VOCs. Therefore, the impact of emission control measures on SOC formation at this stage was not as significant as during stages S3 and S4. On the other hand, the relatively high temperatures and strong radiation intensity during S2 may have been favorable for SOC formation. As for the relationship between SOC and RH, no clear correlation was observed in this study, which is similar to findings from Beijing (Zheng et al., 2015). Overall, we found that emission controls had an evident suppressing impact on SOC formation and that crucial meteorological parameters (e.g., temperature and radiation) were also of importance.
3.3 Aerosol chemical composition
Figure 4a shows a comparison the aerosol chemical components from the five stages. The major components of PM2.5 were identified as SNA (, , and ), EC, and OM, which together accounted for approximately 60 %–80 % of the aerosol masses during the different stages (Fig. 4b). The sum of SNA, EC, and OM decreased to different extents from S2 to S4 compared with S1, demonstrating the effectiveness of emission control measures in Hangzhou and its surroundings on the improvement of air quality. However, the decrease of OM was mostly responsible for the abovementioned decline with a reduction of 32 %, 15 %, and 38 % from S2, S3, and S4, respectively, compared to S1. The reductions of EC were 21 %, 18 %, and 23 % from S2, S3, and S4, respectively, compared to S1. This suggests that the emission control measures played a significant role in reducing the carbonaceous aerosols. Conversely, SNA increased by 8 % and 43 % in S3 and S4, respectively. This highlights the fact that SNA was more enhanced during the emission control stages under variable meteorological conditions. Specifically, the average concentrations of in S3 (5.4 µg m−3) and in S4 (3.9 µg m−3) were higher than those of S1 ( : 4.4 µg m−3, : 2.2 µg m−3). Given that both S3 and S4 were intense emission control periods, the unexpected increases of secondary aerosol components may be attributed to long-range transport or unfavorable meteorological conditions. A more detailed analysis is presented in Sect. 3.4. After the G20 summit, the sum of SNA, OM, and EC increased by 42 %, 52 %, and 62 % compared to S2, S3, and S4, respectively, which clearly demonstrates the negative effect of lifting the emission control measures on the air quality.
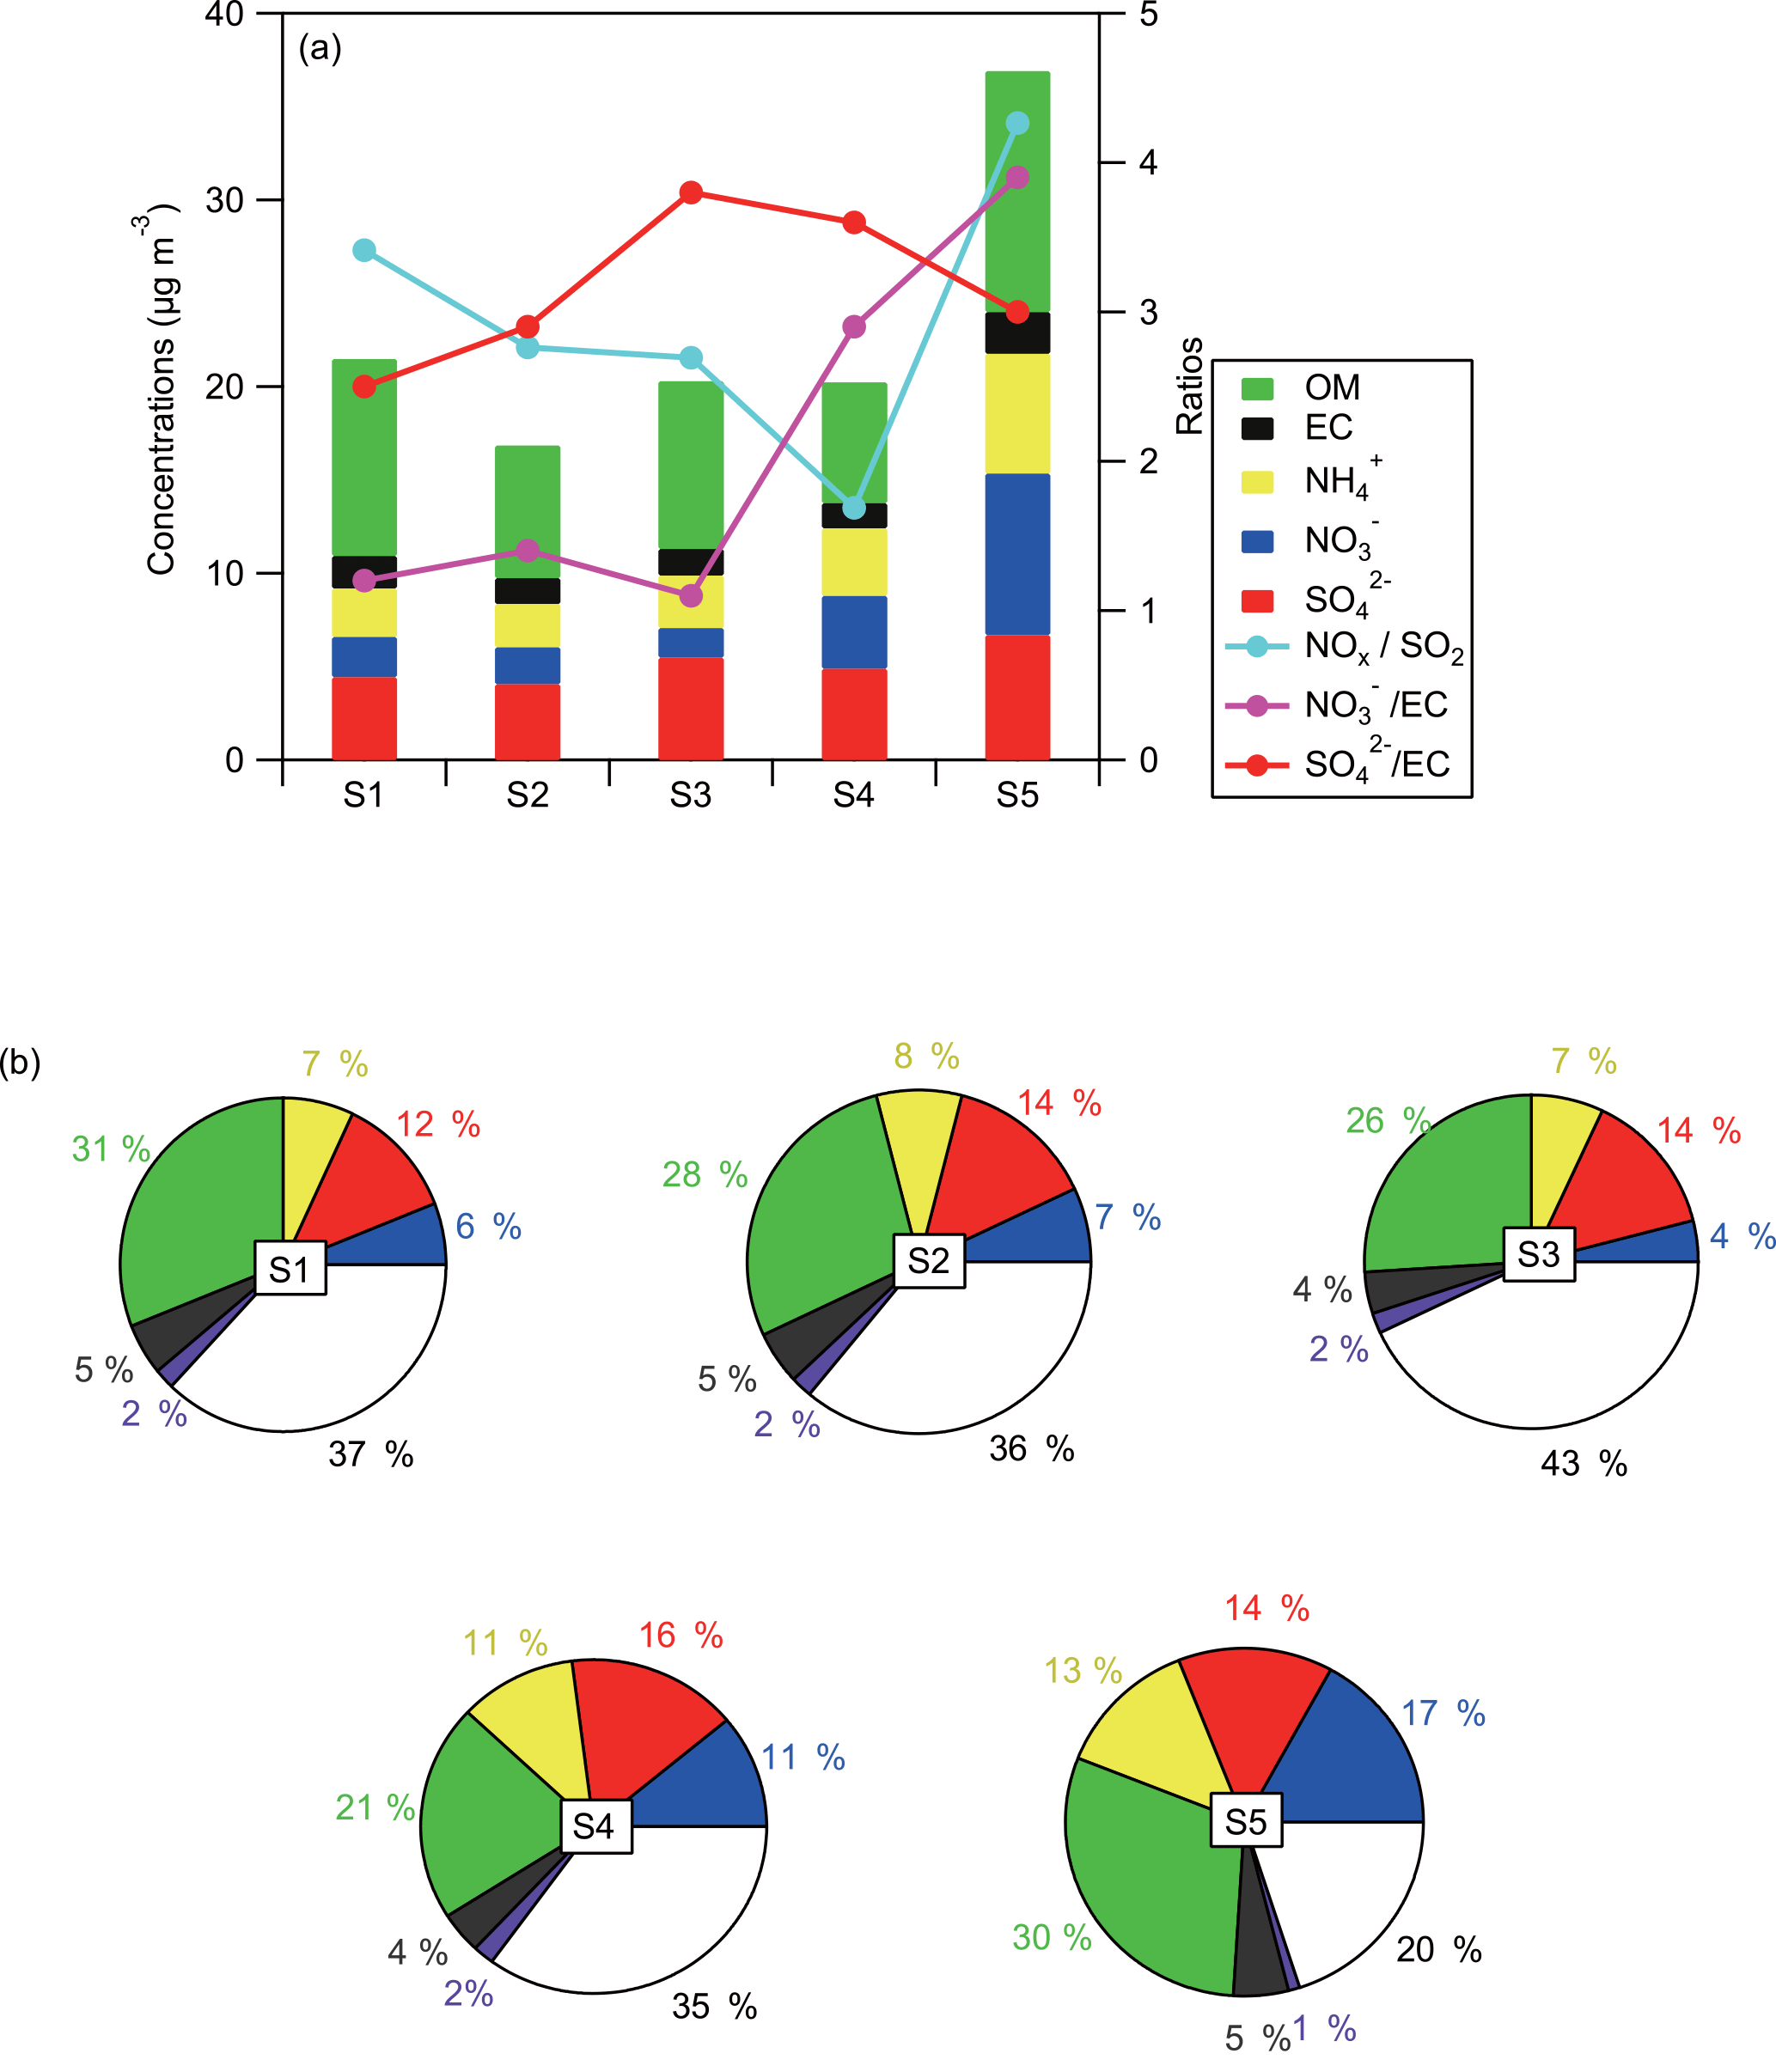
Figure 4(a) Mean concentrations of major chemical components of PM2.5 with respect to the different stages (S1 – S5). OM (organic matter) was estimated based on OC multiplied by a factor of 1.8 in this study (Xing et al., 2013). The mass ratios of NOx∕SO2, , and at each stage are also plotted. (b) Mass fractions of the measured aerosol chemical components from S1 to S5. The different colored numbers around the pie charts denote the mass fractions of major aerosol constituents, i.e., green for organic matter (OM), black for elemental carbon (EC), red for , dark blue for , yellow for , purple for the sum of Ca2+, Mg2+, K+, Na+, and Cl−.
Figure 4a also shows the mass ratios of NOx∕SO2, , and at each stage. The ratio of NOx∕SO2 gradually decreased from S1 to S4 as the emission control measures intensified, indicating that NOx emissions were more effectively abated than SO2 emissions. The NOx∕SO2 ratio peaked in S5, owing to the lifting of emission control measures (especially from the traffic sector). The ratios of and can be used to pinpoint the extent of secondary formation by minimizing the effect of different meteorological conditions on the absolute concentrations of aerosol components (Zheng et al., 2015). In other words, the ratios of and can represent the extent of the secondary reactions. As shown in Fig. 4a, the ratios gradually increased during the first three stages, followed by a slight decrease during S4 and S5. Generally, the ratios varied within a narrow range of approximately 3–4, indicating the relatively stable reaction of SO2 to throughout the five stages. The variation of the ratio showed a different pattern: it remained consistently low during the first three stages before showing a substantial increase during stages S4 and S5. The ratios in S4 and S5 increased to about 2–3 times those of stages S1–S3. Moreover, the ratios were lower than the ratios during the first four stages while they exceeded the ratios in stage S5.
3.4 Process analysis in each stage
3.4.1 High aerosol species in S1
Figure 5 shows a time series of the major aerosol chemical components during the whole study period. In S1, most of the aerosol components maintained high levels, especially for sulfate, EC, and OC. Since the weather conditions were characterized by a well-developed boundary layer, high temperature, low RH, and a moderate WS (Fig. 2), air pollutants should have been subject to efficient diffusion. However, relatively high concentrations of EC and OC, accompanied by a high concentration of NOx were observed, which indicated strong emissions from the traffic sector in S1. In addition, concentrations of sulfate were also at high levels, which suggested a considerable impact from the power grid.

3.4.2 The substantial decrease of aerosol species in S2
S2 was the stage when industrial and construction emission control measures were implemented. The concentrations of SNA, EC, and POC were significantly reduced, indicating great benefits from the emission control strategy.
3.4.3 Influence from long-range transport in S3
A continuously increasing trend of particulate mass concentrations was observed in S3 (Fig. 2), including , , EC, and POC (Fig. 5). The meteorological conditions during this stage were generally favorable for the diffusion of air pollutants, as indicated by the low RH, strong radiation, and high BLH (Sect. 3.1). It was noted that the high pollution episodes tended to accompany high wind speed (Fig. S3), which suggests that the increases of aerosol components may be due to regional or long-range transport. A 72 h backward trajectory clustering analysis was performed during S3 (Fig. 6a). It was found that over 60 % of the backward trajectories were related to regional/long-range transport, while the rest of the backward trajectories were restrained within the local range. To further identify the potential source regions of specific air pollutants, we conducted a concentration weighted trajectory (CWT) analysis (Fig. 6b–e). The results showed fairly consistent CWT spatial patterns for NOx and , i.e., NOx and hotspots were mainly found in Hebei Province, Shandong Province, and the bordering area of Anhui and Jiangsu provinces. This could partly explain why the concentration of NOx increased significantly in S3, even though motor vehicle emission control measures had been fully implemented in Hangzhou. Compared to NOx and , the potential source regions of SO2 and exhibited inconsistent spatial patterns. As shown in Fig. 6d–e, the SO2 CWT plot mainly indicates hotspots from southern Hebei, Shandong, and Jiangsu provinces, while the potential sources of sulfate were mainly ascribed to regions south of Hangzhou, i.e., the bordering areas of Jiangxi, Anhui, and Zhejiang provinces. This may be attributed to the impact of meteorological conditions on the formation of sulfate. Table S1 in the Supplement shows the temperature in the different areas that the hotspots had covered during the three days before S3 according to the 72 h air mass back trajectory in the CWT analysis. It is noted that the temperatures in the northern regions were much lower than those in the southern regions. The high temperature in the south should have been favorable for the photochemical formation of in summer. Therefore, this could have been the reason for the different potential source regions of SO2 and .

Figure 6(a) Cluster analysis of the 72 h air mass backward trajectories starting at 500 m in Hangzhou during S3. Concentration weighted trajectory (CWT) maps for (b) NOx, (c) SO2, (d) , and (e) for the whole S3 period. The location of the monitoring site is marked by a green star.
3.4.4 Impact from continental outflow in S4
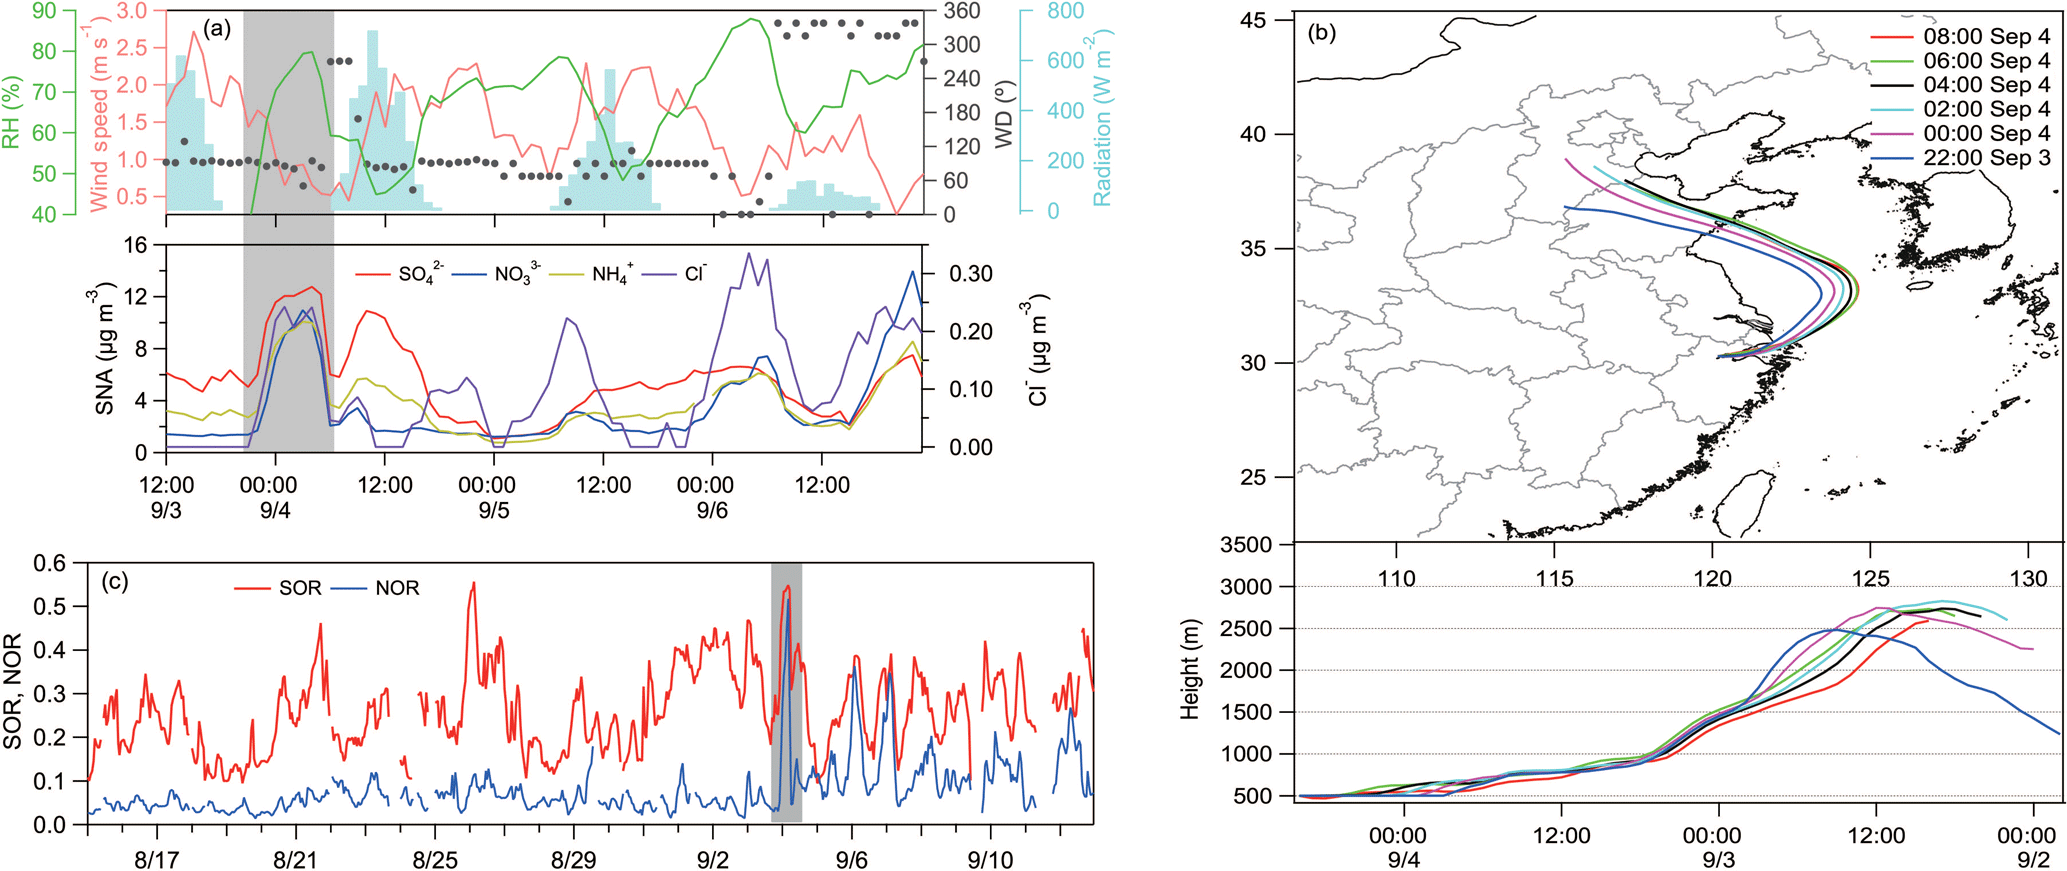
Figure 7(a) Time series of hourly concentrations of SNA, Cl−, and meteorological parameters (WS, WD, RH, and radiation) during S4. (b) 48 h air mass backward trajectories for the short pollution episode on the morning of 4 September 2016. (c) Hourly variations in the sulfur oxidation ratio (SOR) and the nitrogen oxidation ratio (NOR) during the entire study period. The highlighted period in panels (a) and (c) represents the short pollution episode on the morning of 4 September 2016.
S4 was the G20 summit period, which was the most rigorous emission control stage. However, a high particulate pollution episode with an hourly PM2.5 peak concentration exceeding 100 µg m−3 occurred between 0:00 and 05:00 LT on the morning of 4 September, which was the first day of the G20 summit. Concentrations of the major aerosol components also underwent consistent substantial increases during this time (Fig. 7a). If this short pollution episode had been absent, the average concentrations of PM2.5, SNA, and OC during S4 would have been 12 %, 12 %, and 3 % lower, respectively. Figure 7c shows the 48 h air mass backward trajectories during this pollution period and six backward trajectories that were computed at 500 AGL from 22:00 LT on 3 September to 08:00 LT on 4 September (22:00, 00:00, 02:00, 04:00, 06:00, and 08:00). It is shown that the prevailing air masses mainly originated from Hebei and Shandong provinces, before passing over the East China Sea and reaching Hangzhou. As shown in Fig. 7a, Cl− underwent a dramatic increase, rising from almost zero before 4 September to a peak value of 0.24 µg m−3 on the morning of 4 September. The RH also underwent a similar increase, which further indicates the long-range transport route over the ocean. This implies that the meteorological conditions should have been favorable for the heterogeneous reaction pathway of secondary aerosol formation, which is facilitated by the humid oceanic air masses. As for the potential source regions in Shandong, Fig. S4 plots the concentrations of NO2 and SO2 in different urban areas of Shandong Province, where the trajectories passed through during the same period. The concentrations of NOx and SO2 in Shandong Province ranged from 31 to 78 µg m−3 and 13 to 56 µg m−3, respectively. The respective mean values of NOx and SO2 were 56 and 32 µg m−3, and were much higher than those of in Hangzhou (14 and 8 µg m−3 for NOx and SO2, respectively). Hence, the air masses originating from Shandong Province should have contributed to the observed high values of aerosol secondary components on the morning of 4 September. However, it is difficult to determine whether the high concentrations of SNA were dominated by local atmospheric processing or directly transported from upstream areas. Therefore, we calculated the time series of the sulfur oxidation ratio (SOR) and the nitrogen oxidation ratio (NOR) as shown in Fig. 7b. The NOR and SOR in this study are calculated as a molar fraction using the following equations:
Both the SOR and the NOR showed obvious increases on the morning of 4 September. The NOR increased dramatically from a mean value of 0.06 during the period from 00:00 LT on 1 August to 23:00 LT on 3 September before reaching a peak value of 0.52 at 04:00 LT on 4 September. We do not think that this 9-fold increase of the NOR over 5 h was due to local atmospheric processing. Instead, the massive input of secondary aerosols via long-range transport is believed to have been the major cause of the abrupt increase of the SOR and NOR. It has been recognized that secondary formation from the oxidation of NOx and SO2 can occur in air masses during transport and directly result in the rapid increase of PM2.5 (Li et al., 2015). After this short particulate pollution episode, the concentrations of SNA, OC, and EC decreased quickly during the afternoon of 4 September, demonstrating the effectiveness of the emission control measures during the G20 summit period. In addition, all of the abovementioned pollutants remained at low levels throughout S4, further confirming the positive impact on PM reduction caused by emission control strategies.
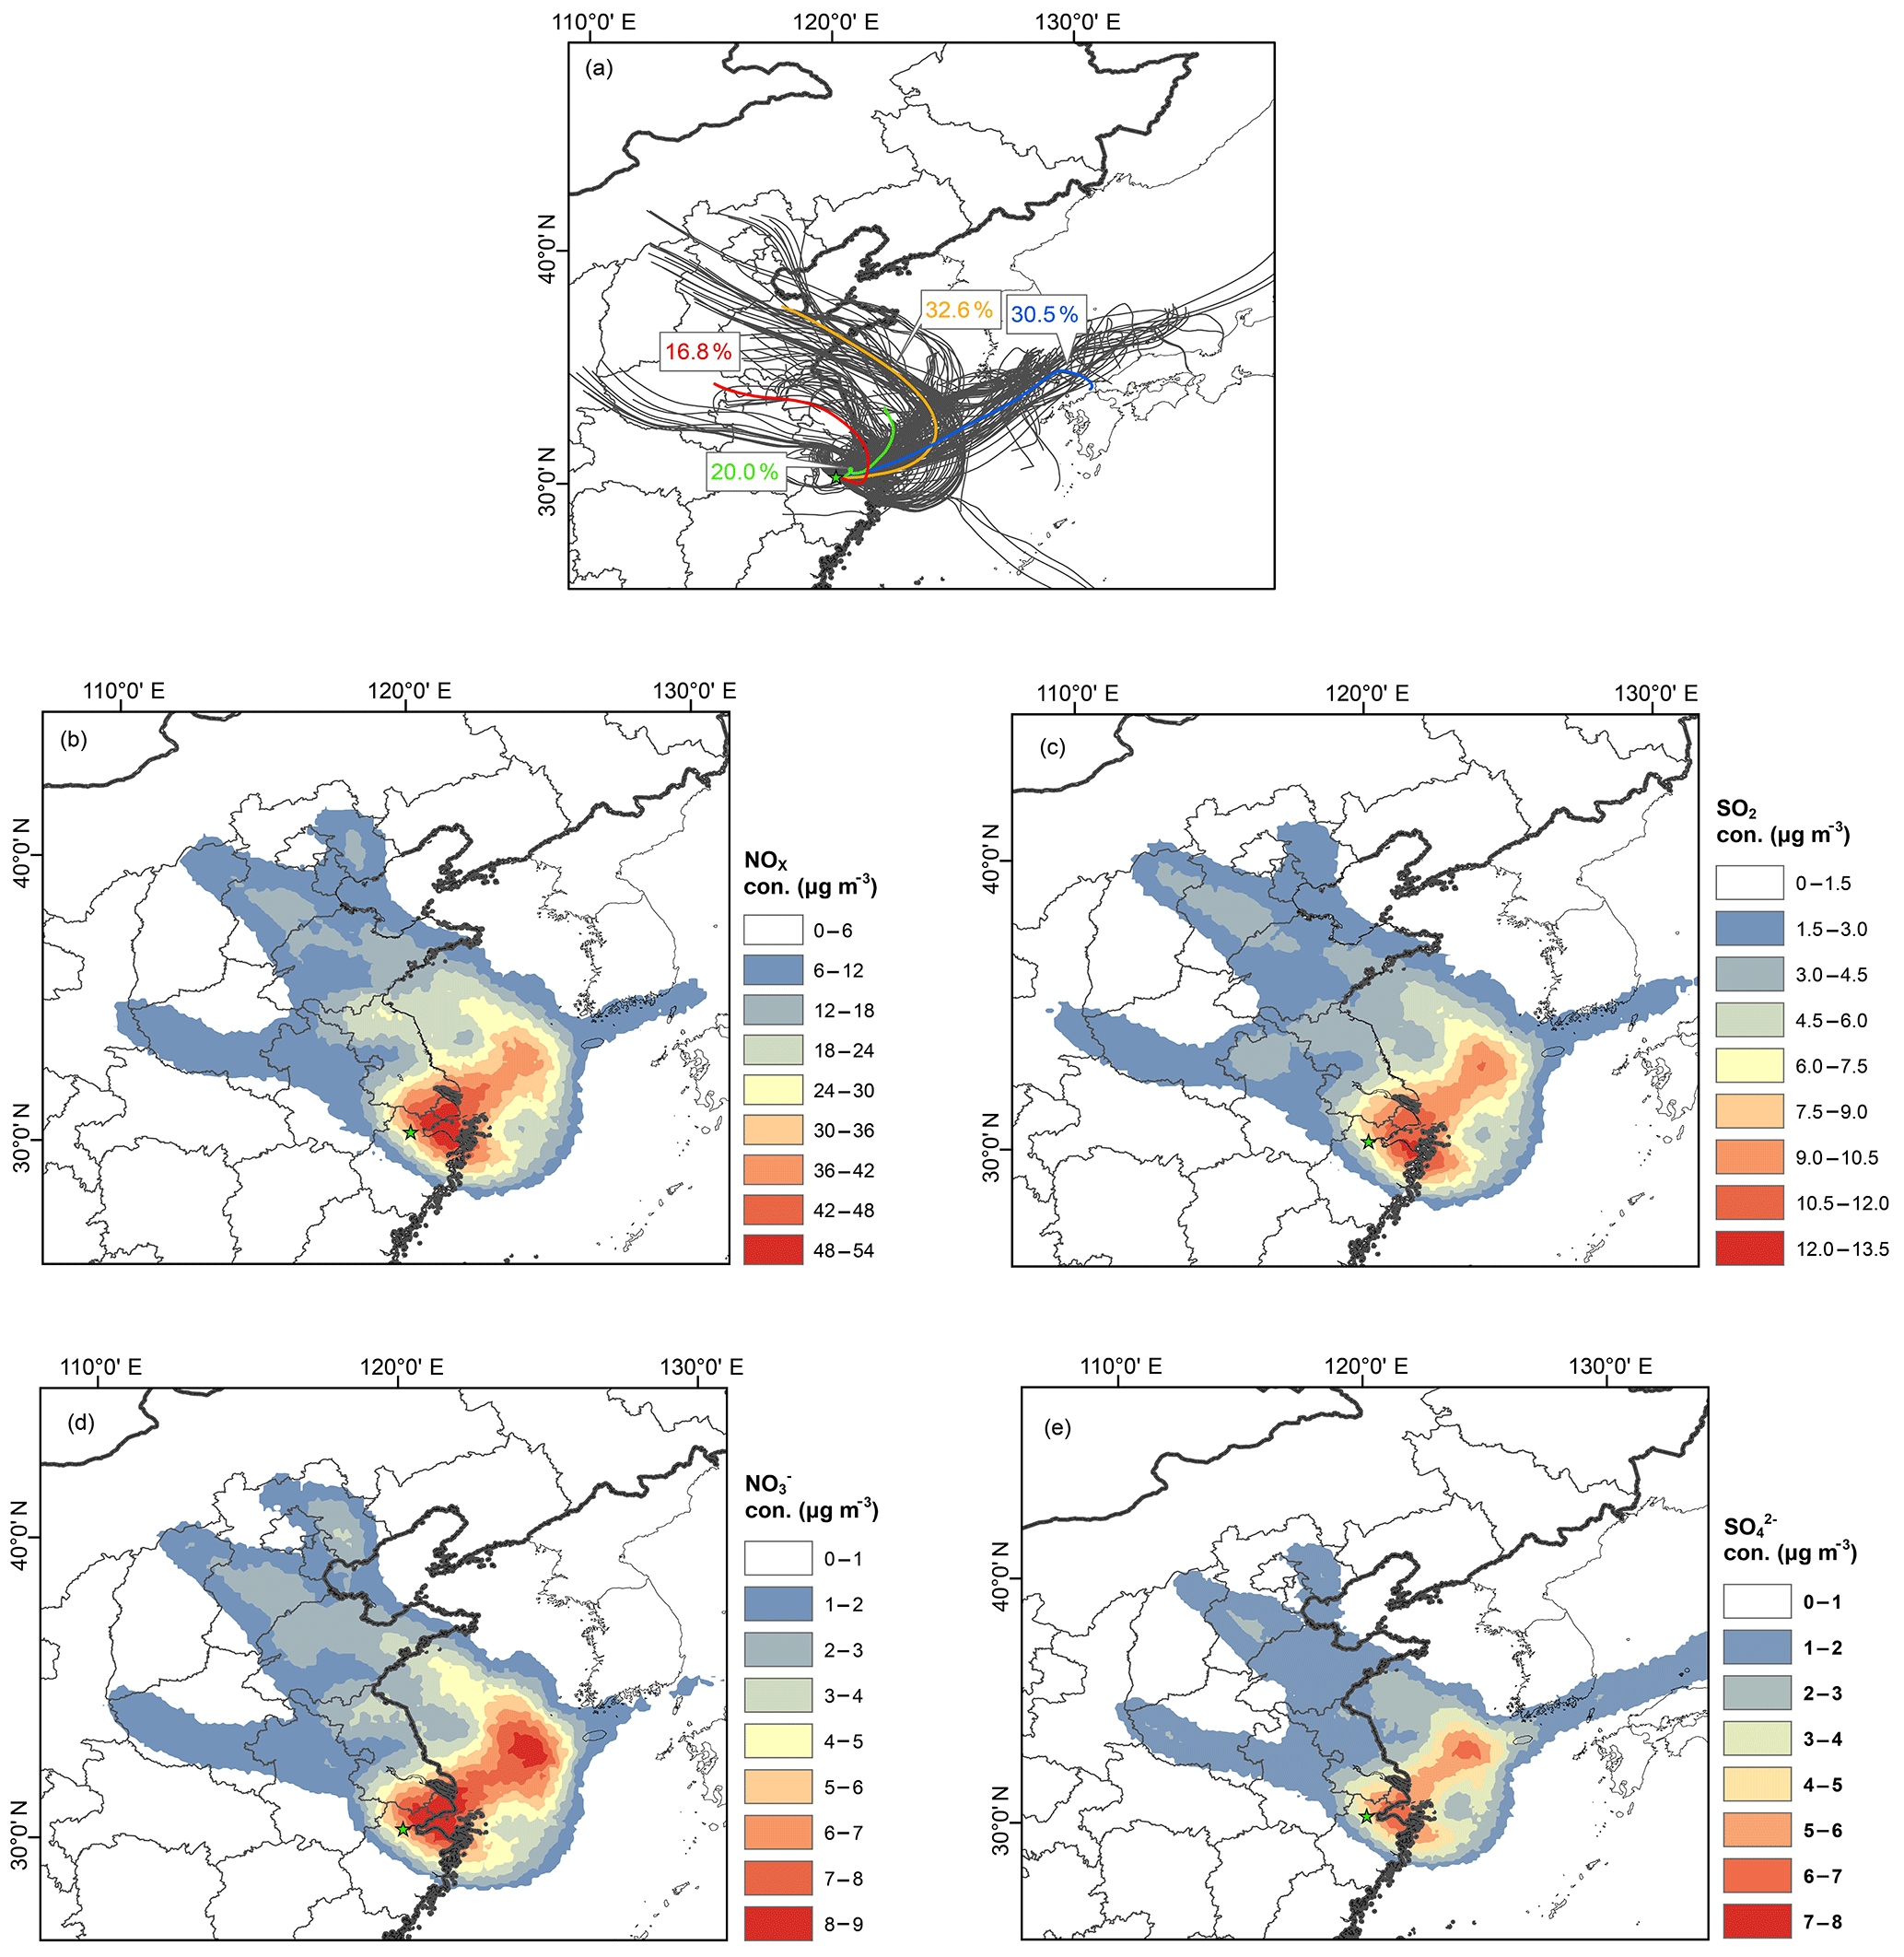
Figure 8(a) Clustering analysis of 72 h air mass backward trajectories starting at 200 m during S5. The choice of 200 m is due to the low boundary layer height (about 500 m on average) during this stage. Concentration weighted trajectory (CWT) maps for (b) NOx, (c) SO2, (d) , and (e) for the whole S5 period. The location of the monitoring site is marked by a green star.
3.4.5 Rebound of air pollutants in S5
After the emission control measures were lifted, the concentrations of all air pollutants quickly climbed, demonstrating an abrupt decline in the air quality after the G20 summit (Fig. 5). Mean concentrations of SNA, OC, and EC increased significantly compared with the control stages. In detail, SNA increased by 62 %, 52 %, and 37 % compared with S2, S3, and S4, respectively, with an average rise of 50 %. OC increased by 45 %, 30 %, and 50 %, respectively, compared to the three abovementioned stages, with an average rise of 42 %. As for EC, the increases for staged S2, S3, and S4 reached 40 %, 18 %, and 29 %, respectively, with a mean value of 29 %. The substantial increase of the air pollutants in the post-control period further corroborated the prominent effect of emission controls on PM reduction during the control period. As described in Sect. 3.1, the meteorological conditions in this stage were characterized by a high RH that ranged from 46 % to 94 %, low wind speeds that ranged from 0.05 to 2.5 m s−1, and low radiation that ranged from 3 to 672 W m−2. This suggested that the unfavorable meteorological conditions during S5 should have additionally contributed to the deterioration of the air quality. However, the high concentrations of SNA, OC, and EC were mostly observed at nighttime, accompanied by high RH and low wind speeds, elucidating the important role of meteorological conditions in the rise of particulate matter in S5. The 72 h air mass backward trajectory clustering results illustrated that about 20 % of the trajectories traveled relatively short distances, which were restrained within the Yangtze River Delta, while the rest of the trajectories were derived from much farther afield (Fig. 8a). This indicated that external transport likely contributed almost 80 % of the pollutants observed during the S5 periods from the perspective of synoptic meteorology. However, the CWT results (Fig. 8b–e) showed that the major potential sources of sulfate and nitrate and their gaseous precursors were primarily local and regional emissions, with the most prominent hotspots around the Hangzhou Bay region. It should be noted that a large number of hotspots also appeared over the East China Sea, as indicated in Fig. 8b–e. It can be seen that the plumes over the ocean can be linked back to the hotspots over land, specifically to Jiangsu and Shandong provinces, indicating that continental outflows were influential on the high levels of , , and their precursors during the post-G20 period. In addition, the hotspots over the ocean, especially in coastal regions near Shanghai and Hangzhou, may be related to emissions from shipping activities. Our sampling site is located in the northeast of Hangzhou, close to the Ningbo-Zhoushan Port, which ranks as the second largest port in China and has the largest cargo throughput of China's top ten ports. Previous studies have shown that ship emissions have an important impact on the Yangtze River Delta region and eastern China (Fan et al., 2016; Liu et al., 2016). Liu et al. (2016) even showed that shipping emissions could contribute 20 %–30 % (2–7 µg m−3) of the total PM2.5 for areas within tens of kilometers of coastal and riverside Shanghai during periods influenced by ship plumes in spring and summer. Furthermore, Fan et al. (2016) estimated that the total emissions of SO2 and NOx reached 3.8×10⁵ and 7.1×10⁵ tons yr in the study area (119∘ E to 125∘ E and 27∘ N to 36∘ N) in 2010, respectively.
3.5 Formation of secondary aerosols
3.5.1 Secondary inorganic aerosols

Figure 9Hourly nitrogen oxidation ratio (NOR) (a) and sulfur oxidation ratio (SOR) (b) plotted against RH, where the colored dots represent temperature. The pentagons in (a, b) denote the mean values of NOR and SOR in each stage and the values can be derived from the right axis; DSOR and NSOR in panel (b) represent the daytime and nighttime SOR values, respectively. (c) The relationship between hourly sulfate and nitrate, where the colored dots represent RH. (d) Hourly , , SO2, and NOx as a function of RH. (e) The ratio of SNA∕PM2.5 as function of RH in each 10 % bin. The filled circles are colored by temperature and the sizes of the circles correspond to the mass concentrations of PM2.5. The error bars refer to one standard deviation of the SNA∕PM2.5 values. The open circles represent the mean value of the five stages.
The formation pathways of sulfate and nitrate are usually dominated by heterogeneous reactions, and it has been as indicated by previous studies that both of these species show a strong dependence on the relative humidity (Cheng et al., 2014; Pan et al., 2016). However, this study has shown contrasting results to previous studies. Figure 9a and b plot the variations of NOR and SOR as a function of RH (colored by temperature). In addition, the relationship between the respective NOR and SOR with RH was investigated by grouping RH into eight bins with a RH increment of 10 %. As shown in Fig. 9a, NOR was low and fluctuated within a relatively narrow range under low RH conditions (RH < 60 %). It is usually recognized that the conversion efficiency from NOx to via aqueous pathways is relatively low under low RH conditions. Furthermore, the low RH periods were generally associated with high temperatures, as indicated by the colored scatters in Fig. 9a. Nitrate is unstable and easy to decompose under high temperatures; thus, this also would have influenced the resulting low NOR values in this study. As RH increased (RH > 60 %), the NOR also started to quickly increase with the decrease in temperature. In accordance with previous studies, the variation of the NOR as function of RH exhibited exponential growth, resulting in the heterogeneous formation of nitrate. In comparison, the variation of the SOR as a function of RH and temperature was totally different from that of the NOR (Fig. 9b). The values of the SOR fluctuated much more significantly than the NOR under almost all the RH conditions, showing an ambiguous relationship between the SOR and RH. This relationship was further evaluated by grouping all of the data into daytime and nighttime. In the daytime, the SOR showed an increasing trend following increases in the RH under low RH conditions (RH < 50 %), while it showed a slightly decreasing trend under higher RH conditions and reached its lowest observed value under RH > 90 %. As discussed above, low RH periods were mostly associated with high temperature, which often meant strong radiation (as shown in Fig. 2). This was beneficial for generating sufficient hydroxyl radicals and promoting the subsequent photochemical reactions of sulfate formation (Canty, 2002; Matthijsen et al., 1998). However, under high RH conditions the temperature was much lower, which was not favorable for the photochemical formation of sulfate. This suggested the importance of the photochemical formation pathway of sulfate during the whole study period in Hangzhou. In contrast to daytime, the SOR showed an increasing trend with RH at nighttime under the full range of RH conditions, indicating that aqueous processing was also crucial for the formation of sulfate.
The mean values of the NOR and SOR in each of the five stages are also shown in Fig. 9a and b. Variations of the staged SOR and NOR showed totally different patterns. The mean values of the NOR remained low in the first three stages; however, it increased to high levels in S4 and S5 due to the changed meteorological conditions and the influence of regional/long-range transport. The NOR varied throughout the five stages within a range of 0.05–0.15 with a gap of 0.1. In contrast, the SOR values throughout the five stages varied weakly from 0.22 to 0.29, suggesting that nitrate was more influenced by emissions and the extent of long-range transport than sulfate.
Table 1The ratios of mean (OC∕EC)pri, SOC∕OC, and POC∕OC and the mass concentrations (µg m−3) of OC, EC, POC, and SOC during the five stages.
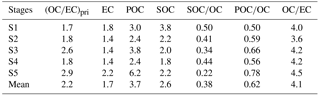
Figure 9c further shows the relationship between sulfate and nitrate as a function of RH. It is clearly shown that high RH episodes tended to be accompanied by high nitrate concentrations, whereas a number of high sulfate values appeared during low RH periods. This is quite different from the results observed during severe haze episodes in Beijing, which showed that high levels of both nitrate and sulfate occurred under high RH conditions (Sun et al., 2013; Wang et al., 2016). In Fig. 9d, we also investigate the behavior of SO2 and NOx, the precursors of sulfate and nitrate, under the computed RH bins. It is found that SO2 concentrations showed a substantial decrease, while NOx concentrations increased with increasing RH. This suggests that the emission of sulfate and nitrate precursors also has a great impact on secondary aerosol formation, in addition to the meteorological conditions. Due to the relatively low concentrations of SO2 under high RH conditions as well as the moderate level of SOR, the low sulfate concentrations were expected as discussed above.
Figure 9e shows the mass fraction of SNA in PM2.5 as a function of RH (with the temperature denoted by color). The sizes of the circles corresponded to the mass concentrations of PM2.5. Generally, the ratios of SNA∕PM2.5 increased with elevated RH, demonstrating the significant enhancement of SNA formation under high RH conditions. An exception to this trend is the RH bin of 90 %–100 %, where the SNA∕PM2.5 ratio increased to an abnormally high value of 0.65. All data in this RH bin are from 7 September, which was a rainy day with an accumulated precipitation of 9.5 mm (Fig. S1). Accordingly, the PM2.5 concentrations averaged within this RH bin were the lowest according to the size of the circles, as shown in Fig. 9e. Thus, these data are excluded in the following discussion. Compared to the study in Beijing (Wu et al., 2018) which showed a more obvious increase of the SNA∕PM2.5 ratio from 24 % to 55 % under average RH levels (from 15 % to 83 %), this study showed a weaker increase of the SNA∕PM2.5 ratio from 23 % to 43 % in a similar RH range. This could be partly attributed to the fact that the formation of sulfate was not very sensitive to RH, as shown in Fig. 9b. In addition, our results showed that the mass concentrations of PM2.5 did not display an increasing trend as RH increased, which was different to the findings of Wu et al. (2018). In detail, Wu et al. (2018) found significant increases of PM2.5 concentrations from an average of 39.4 µg m−3 under RH < 20 % to 98.7 µg m−3 under RH levels between 60 % and 70 %; this suggested a feedback mechanism between the aerosol liquid water and the uptake of inorganic matter. Figure 9e shows that the highest PM2.5 concentrations occurred under medium RH levels, e.g., 40 %–60 %, but not necessary under high RH conditions. It should be noted that the average PM2.5 concentration in this study was 39.3 µg m−3, which was much lower than that of the Beijing study due to less strong emission intensities. In this regard, the level of PM2.5 over the study region is most likely to have been vulnerable to the input of outside air pollutants, especially during the emission control period.
We further investigated the average SNA∕PM2.5 ratios and PM2.5 concentrations during the five stages, as marked by the open circles in Fig. 9e. The SNA∕PM2.5 ratios of S4 and S5 largely deviated from the statistical curve between SNA∕PM2.5 and RH. As discussed in Sect. 3.4, regional and long-range transport were ubiquitous during S4 and S5. Thus, it was likely that the input of transported air pollutants disturbed the relationship between PM2.5 and RH to some extent. As for S3, although evidence of transport was also revealed during this stage, the extent of long-range transport was relatively weak, which will be discussed in Sect. 3.6. Hence, the mean SNA∕PM2.5 ratio and PM2.5 concentration during S3 still coincided with the statistical curve. Overall, the relationship between PM2.5 concentrations and RH was ambiguous, which was attributed to the net effects of regional/long-range transport and emission control.
3.5.2 Secondary organic aerosols (SOAs)
The respective average OC∕EC ratios were 4.0, 3.6, 4.2, 4.2, and 4.5 during S1, S2, S3, S4, and S5 with an average value of 4.1. It has been recognized that if the OC∕EC ratios exceed 2.0, the production of SOAs occur (Cao et al., 2013). Hence, the mean ratio of OC∕EC in this study implied the substantial formation of SOC during the whole study, which was ascribed to the warm, humid weather conditions in the summer and autumn in Hangzhou.
As introduced in Sect. 2.3.3, the EC-tracer method derived the (OC∕EC)pri values in the range from 1.7 to 2.9 (Fig. S5), which were within or slightly higher than the (OC∕EC)pri values of 1.15–1.85 that were derived by Wu et al. (2016). Due to the implementation of different control strategies, the (OC∕EC)pri values fluctuated greatly among the five stages, as shown in Table 1.
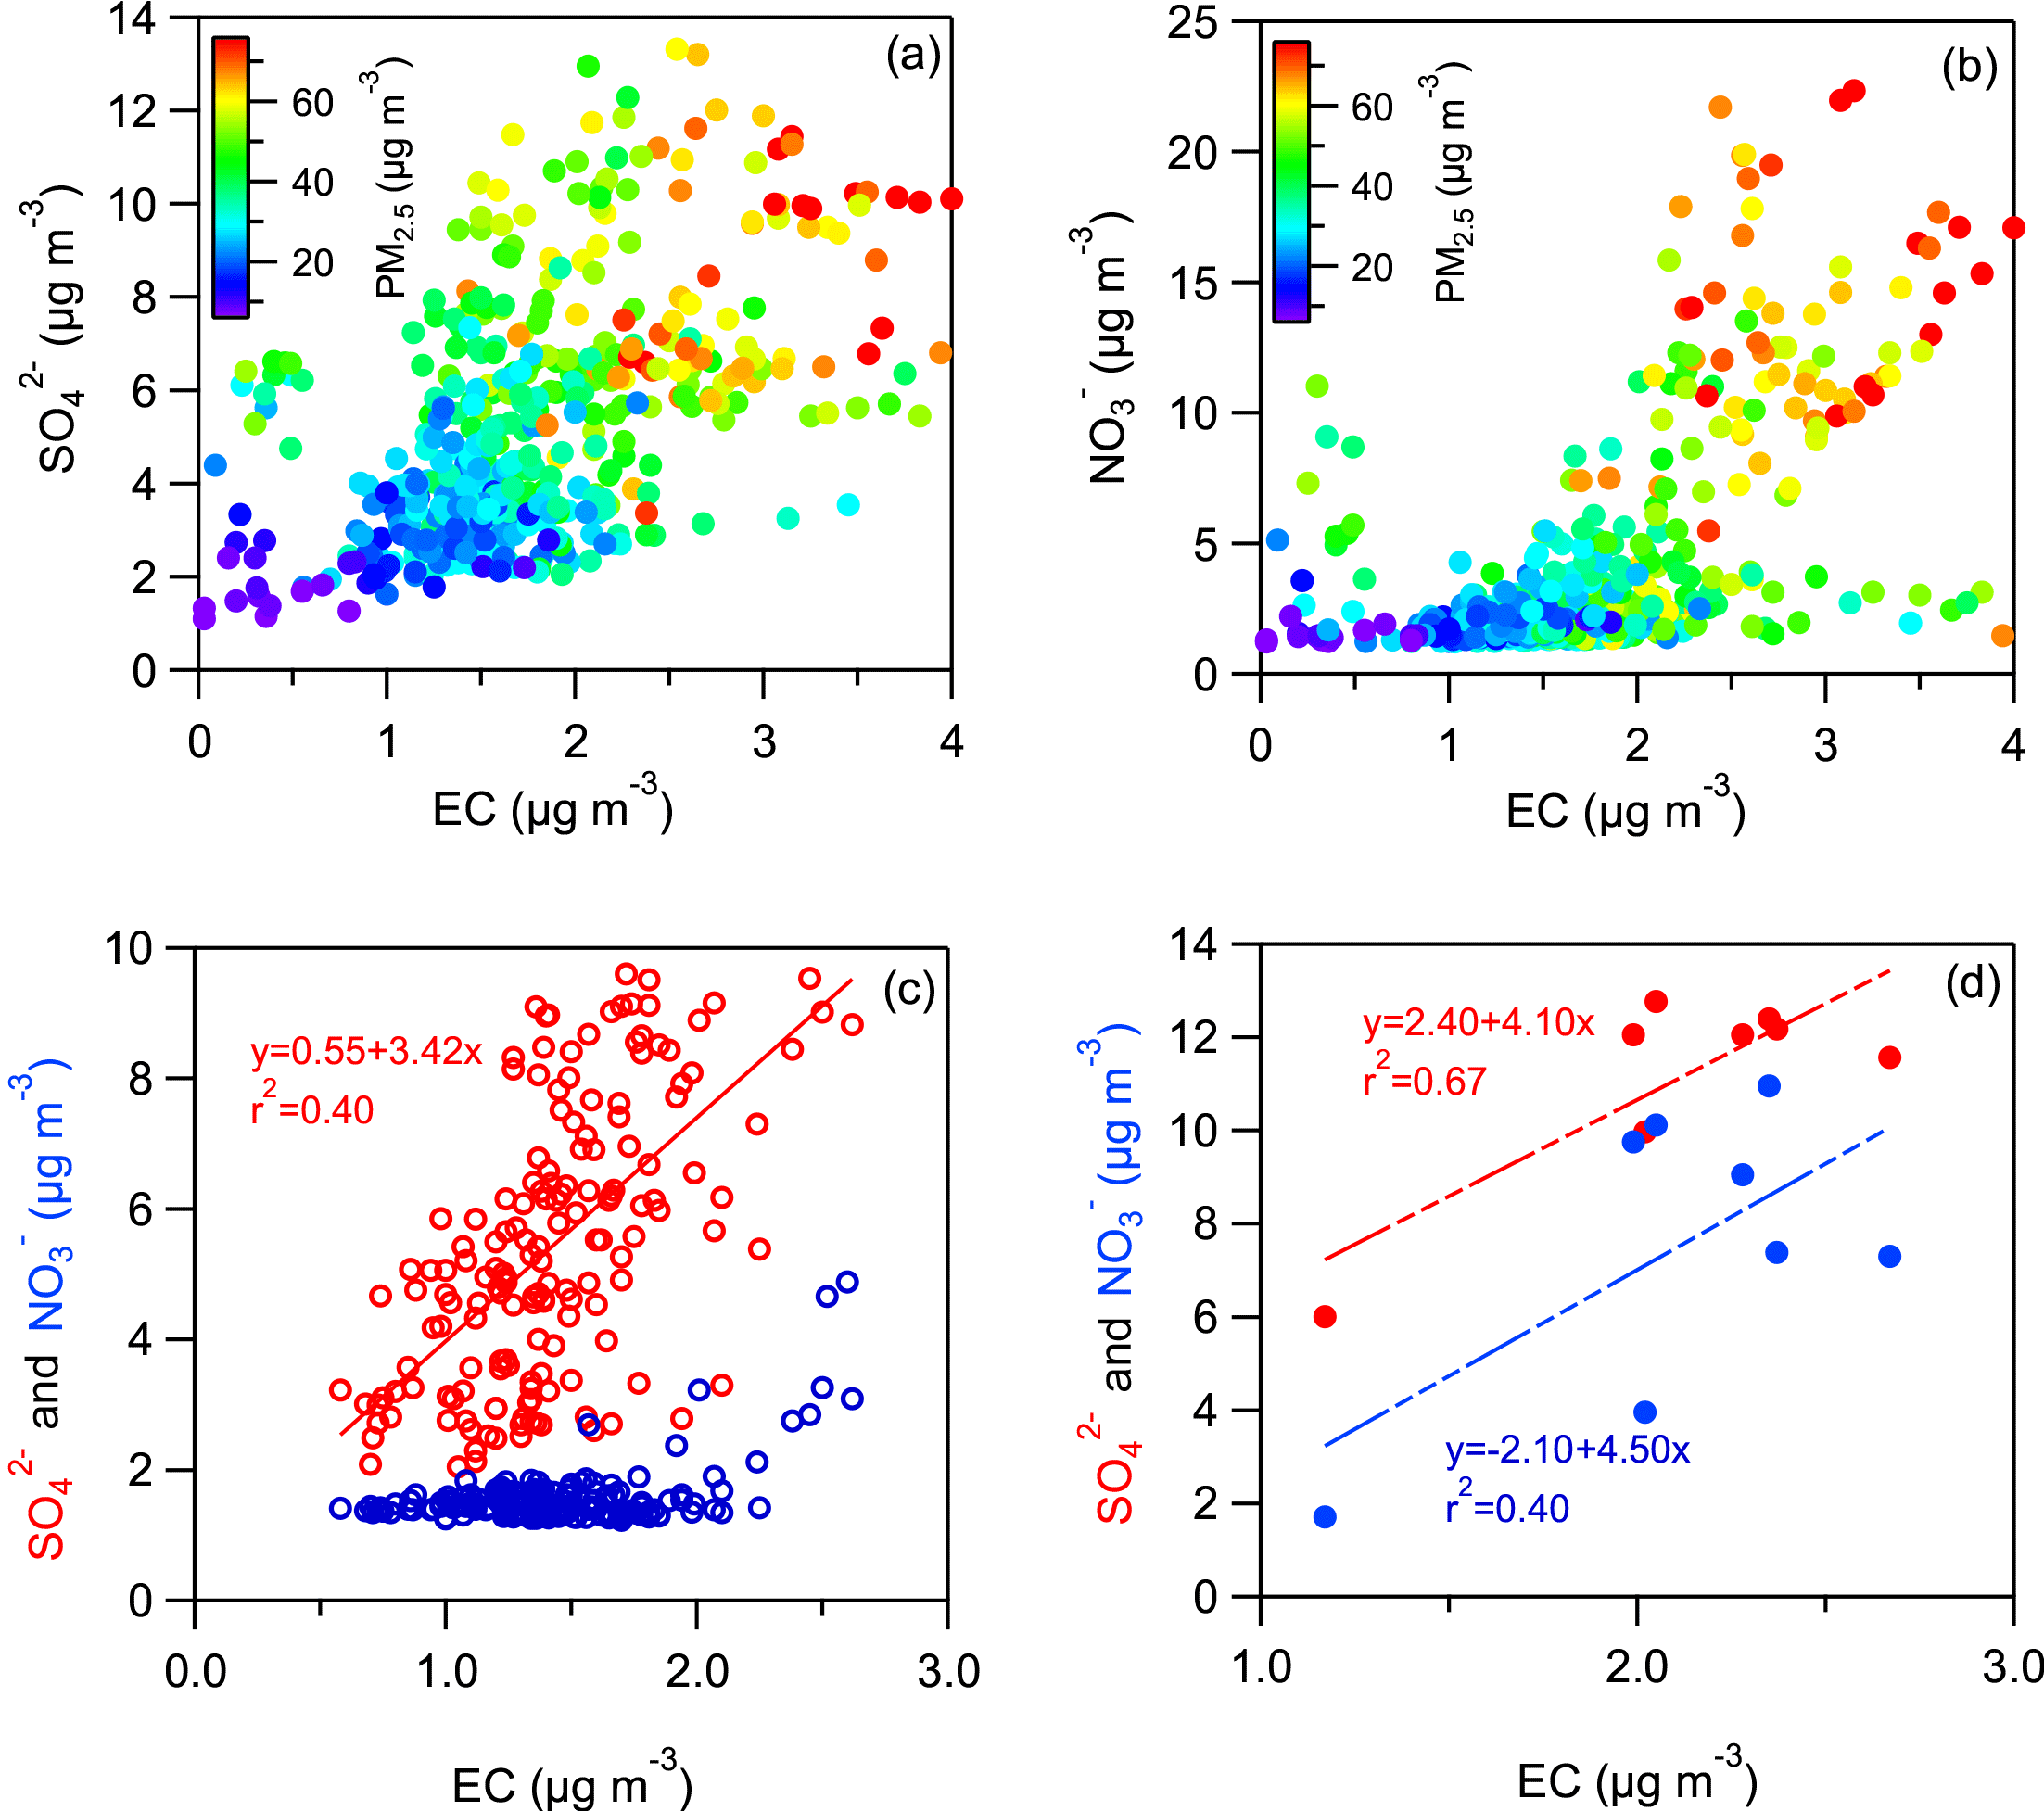
Figure 10Hourly sulfate (a) and nitrate (b) plotted against EC, with the dots colored according to PM2.5 mass concentrations. Data in (a, b) included the whole study period by excluding data in (c, d). (c) The relationship between hourly sulfate, nitrate, and EC from 00:00 on 28 August to 21:00 LT on 3 September. (d) The relationship between hourly sulfate, nitrate, and EC from 22:00 on 3 September to 05:00 LT on 4 September.
The average SOC concentrations were estimated to be 3.8, 2.2, 2.0, 1.8, and 2.2 µg m−3 during S1, S2, S3, S4, and S5, respectively. The highest SOC concentration and the highest SOC∕OC ratio (0.5) in S1 can be partly explained by the possibly of the high abundance of SOC precursors before the implementation of the intense emission control measures. In addition, the highest temperature and solar radiation in S1 may also have been responsible for the strong formation of SOC (Fig. S2 in Sect. 3.2). During the S2–S4 period, the concentrations of SOC evidently decreased compared to S1, while those of POC stayed at similar levels to S1; thus, this resulted in an obvious decrease of the SOC∕OC ratios. This is mainly ascribed to the abatement of SOC precursors, e.g., VOCs. The restrictions on traffic, construction work, and giving local residents extra holiday should greatly reduce the VOC emissions from vehicles, painting, residential and restaurant cooking, etc. The lowest concentrations of SOC during the intense control stages reflected the effectiveness of the emission control measures on suppressing the formation of SOAs. During S5, SOC rebounded slightly compared to the control stages, while POC increased substantially to an average of 6.2 µg m−3 – about 50 % to 150 % higher than the previous stages. As a result, an extremely low SOC∕OC ratio (0.22) and a very high POC∕OC ratio (0.78) were estimated. This suggested that the primary carbonaceous emissions were greatly enhanced after the various emission control measures were lifted. The fact that all vehicles types were permitted into the city after the G20 summit was most likely the major factor contributing to the elevated primary carbonaceous aerosols; in addition, the recovery of industry and construction work may also have been partly responsible.
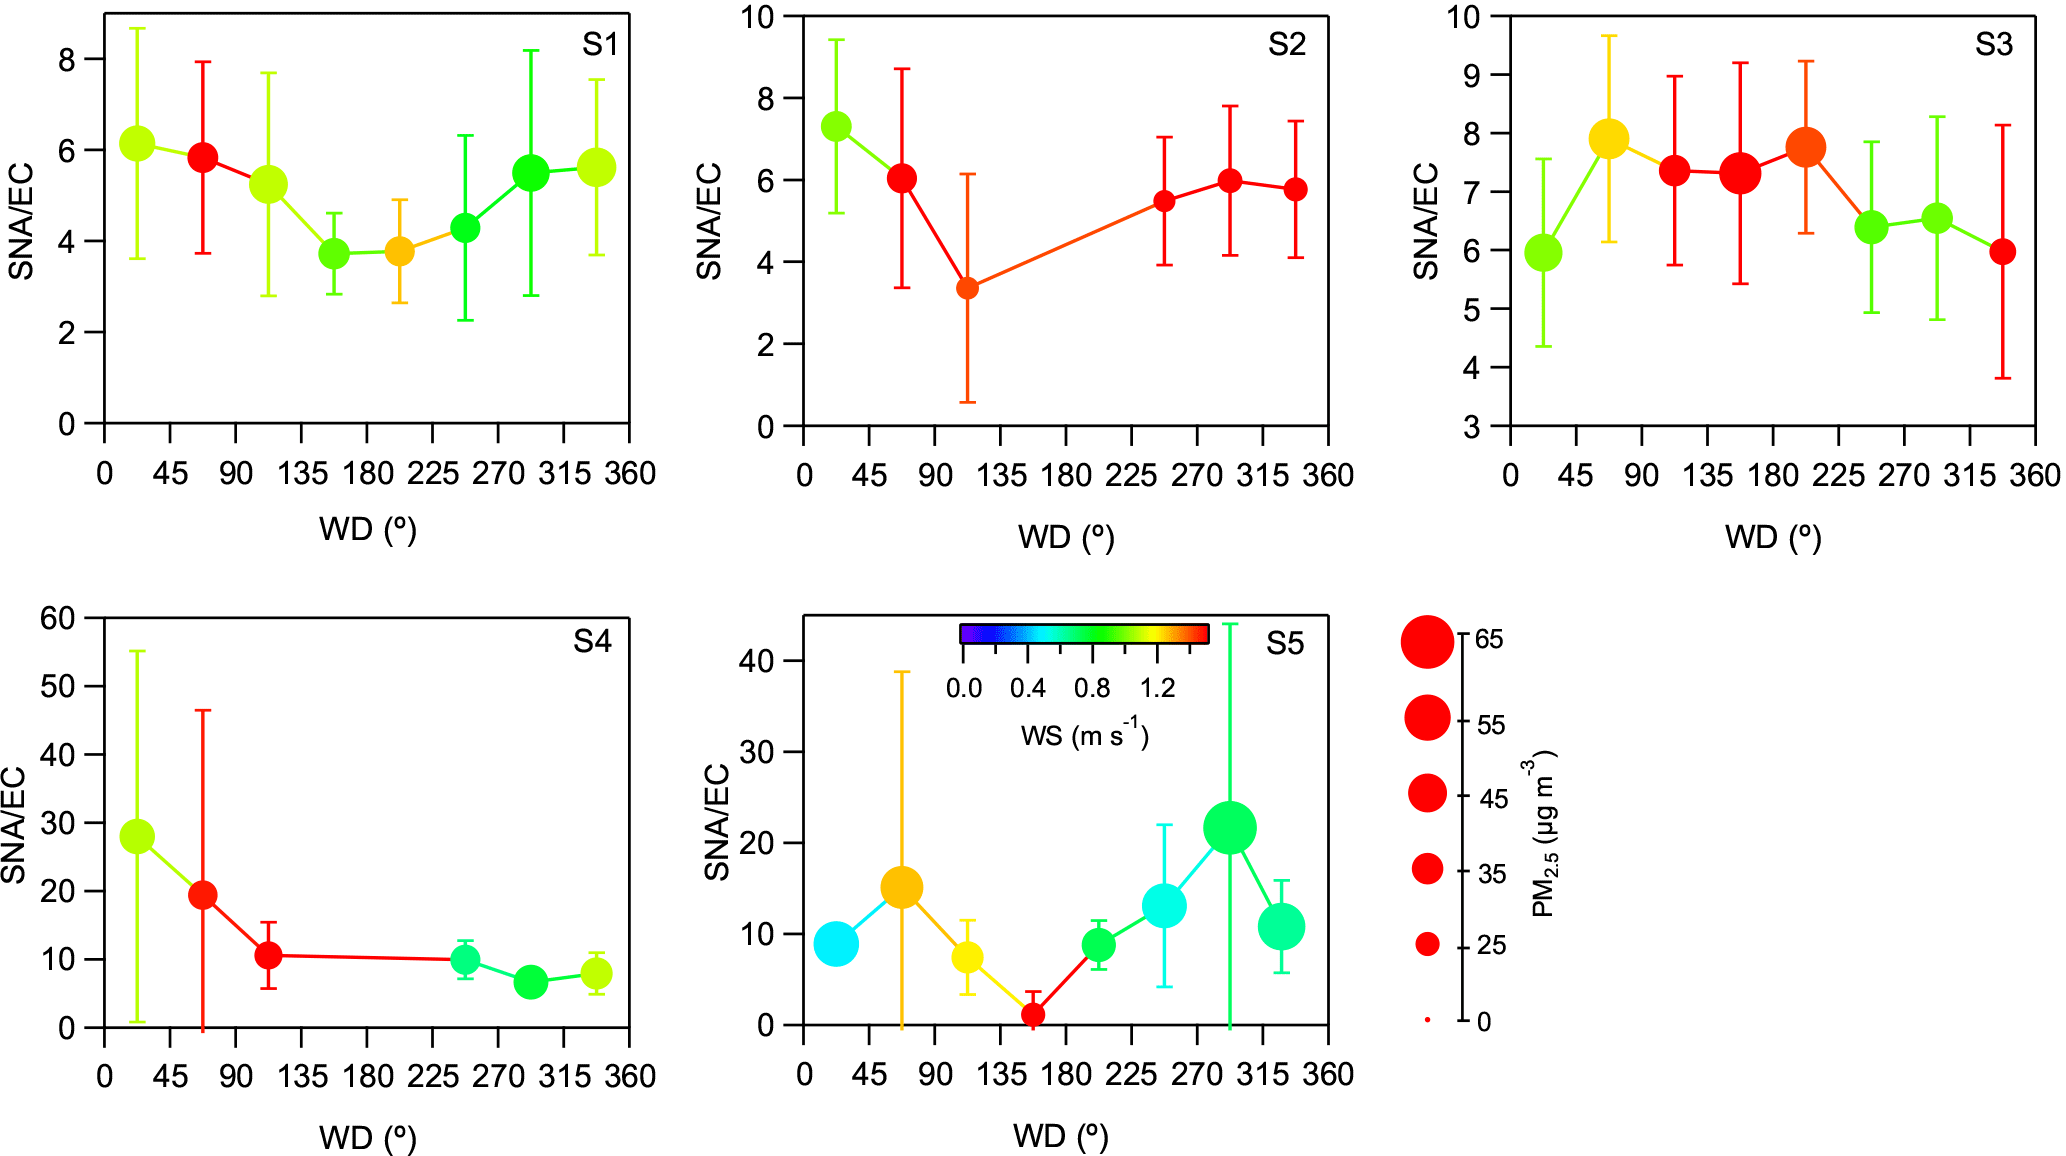
Figure 11Variation of the ratio of SNA∕PM2.5 in eight wind direction sectors with a bin width of 45∘ during the five stages. The filled circles are colored by wind speed and the sizes of the circles correspond to the mass concentrations of PM2.5. The error bars refer to one standard deviation of the SNA∕EC values.
Table S2 summarizes the SOC∕OC ratios in different urban areas. Generally, the average SOC∕OC ratios in this study were lower than those from previous studies. Previous research from Hangzhou, such as L. Li et al. (2017), has estimated a SOC∕OC ratio of around 40 %, which is slightly higher than this study. However, the study by L. Li et al. (2017) was conducted in winter, meaning that the SOC∕OC ratio should be considered as a lower limit. In comparison, results from Jiao and Qi (2007) report the SOC∕OC ratio in summer as being 45.8 %, which is much higher than this study. All of the abovementioned results indicate that the intense emission control measures exerted significantly negative impacts on the formation of SOAs.
3.6 Diagnose the effect of regional/long-range transport
Figure 10 shows the relationship between hourly sulfate/nitrate and EC during different time periods: three periods are defined. Fig. 10a and b consist of all the data by excluding the regional and long-range transport episodes as identified in earlier discussions. It is obviously shown that sulfate/nitrate and EC are weakly correlated. This is expected as EC is a primary particulate pollutant emitted from incomplete combustion, while sulfate and nitrate are formed from secondary reactions. As a comparison, sulfate and EC exhibited a moderate correlation (r2=0.40) during S3 (Fig. 10c), which was a period identified as displaying intensive long-range transport (Sect. 3.4.3). This phenomenon was more evident in the quick pollution episode in S4 (Fig. 10d). Sulfate showed a significant correlation with EC (r2=0.67), and a moderate correlation was also observed between nitrate and EC (r2=0.40). This “abnormally” positive correlation between species that had been derived from different sources and formation pathways indicated that the temporal variation of aerosol components was dominated by physical processes rather than atmospheric chemical processing. That is to say, the correlation was driven by transport that brought massive inputs of air pollutants, which then diluted or accumulated synchronously. Hence, by assessing whether there is a significant correlation between EC and secondary aerosol components, one could possibly judge whether regional and long-range transport is occurring and to what extent.
Figure 11 further evaluates the effect of regional/long-range transport on the extent of the formation of secondary inorganic aerosols (i.e., the SNA∕EC ratio) and PM2.5 levels by grouping each stage into 45∘ wind direction bins. All data are colored by wind speed and the sizes of the filled circles corresponded to the PM2.5 concentrations. It is clearly shown that both the SNA∕EC ratios and the PM2.5 concentrations in S1 became relatively high from the northeast and northwest, i.e., the upstream polluted regions with much higher emission intensities than the Yangtze River Delta. Statistically, the SNA∕EC ratios from the northwest to northeast wind sectors were moderately higher (1.4-fold) than those from the other directions, suggesting that regional transport was not prominent. S2 generally exhibited a similar pattern to S1; however, there was an overall decrease of PM2.5 concentrations from all wind sectors. This was partly ascribed to emission control, although it was also related to the higher wind speed as depicted by the colored circles (Fig. 11).
Compared to S1 and S2, S3 showed an opposite pattern for SNA∕EC as a function of wind direction. Relatively high SNA∕EC ratios were observed anticlockwise from the northeast to the southwest, which was the case for the PM2.5 concentrations. This was consistent with the CWT results which found that the southern areas of Hangzhou to be the potential source regions of high sulfate and nitrate (Sect. 3.4.3). It should be noted that although regional transport was observed during this stage, the SNA∕EC ratios from the northeast to southwest were only 18 %–27 % higher than those from other directions, which was much lower than regional transport from the north, as discussed below. We believe that this was due to the fact that the southern part of the Yangtze River Delta had lower emission intensities than the north, which limited the elevation of the SNA∕EC ratios during transport.
In S4, a distinctly different pattern of SNA∕EC was observed with respect to the other stages. S4 showed extremely high ratios of SNA∕EC from the north and northeast, about 2.4–3.4 times those from other directions. This corroborated the findings from the air mass backward trajectory analysis in Fig. 7, and verified the transport path in the form of continental outflows. The high ratios of SNA∕EC from the north and northeast in S4 were almost 4 times higher than the other four stages, which was also consistent with the discussions in Sect. 3.4.4 regarding the fact that the SOR and NOR abruptly increased during the quick pollution episode on the morning of 4 September. Specifically, the two highest SNA∕EC ratios were accompanied by large error bars, which suggests great fluctuations of SNA∕EC in the divided wind direction intervals. This was related to the characteristics of the oceanic air masses from the north and to the east. In most circumstances, the oceanic air masses directly from the ocean exerted cleansing effect, lowering the levels of air pollutants. However, the oceanic air masses originating over land in S4 could have transported abundant air pollutants back to the downstream areas, worsening the air quality in this study. Thus, the PM2.5 levels associated with the oceanic air masses could have varied greatly and generated large SNA∕EC error bars.
As for S5, the pattern of SNA∕EC as a function of wind direction was somewhat similar to S1 and S2; however, the values of SNA∕EC were much higher than those of S1–S3 in almost all wind directions. The lifting of emission control measures is believed to be the major cause for this. In addition, unfavorable meteorological conditions (e.g., low wind speed for the high SNA∕EC groups) also accelerated the formation and accumulation of secondary aerosols.
In this study, atmospheric chemical compositions from 15 August to 12 September before, during, and after the 2016 Hangzhou G20 summit were monitored. Water-soluble ions, organic/elemental carbon, and gaseous pollutants were continuously measured. Soluble ions and carbonaceous matter were the major components of fine particles, accounting for 60 %–80 % of PM2.5. The average PM2.5 concentrations during the five defined stages (one reference stage, three control stages, and one post-G20 stage) were 37.4, 31.8, 40.4, 35.0, and 49.5 µg m−3, respectively. In general, the emission control measures were effective in lowering the concentrations of fine particles. The impact of emission control measures on perturbing the air quality was fully assessed. The major findings are summarized as follows.
Both sulfate and nitrate showed a dependency on RH, but RH played a more important role in the formation of nitrate. In addition, the formation of sulfate was found to be highly related to photochemical reactions, especially during daytime. This is different from previous studies on haze in Beijing, as the formation of sulfate was more influenced by RH.
Air mass backward trajectory and CWT analyses suggested that regional and long-range transport were ubiquitous, even during the strict traffic control period. Long-range transport from upstream regions such as Shandong and Jiangsu was diagnosed as the main cause of high NOx concentrations.
One high particulate pollution episode observed on the morning of 4 September (the first day of the G20 summit) was found to be related to the continental outflow traveling over the East China Sea. Abrupt increases of the SOR and NOR values were observed during this short pollution episode, especially for the NOR that underwent a 9-fold increase within 5 h. Local atmospheric processing in Hangzhou is not believed to be the driving force. Instead, the formation of secondary aerosols in the humid oceanic air masses or direct inputs of secondary aerosols from upstream source regions are thought to be responsible for the most severe particulate pollution during the study period.
The concentrations of estimated SOC showed significant decreases during all of the control stages. Specifically, the SOC diurnal pattern was modified and its peaks in the daytime were greatly reduced, indicating the influence of emission control effects on SOC formation.
This study shows that the various emission control measures implemented during the Hangzhou G20 summit had a positive impact on the reduction of aerosol concentrations over a short period of time. However, the regional/long-range transport may offset the local emission control effects to some extent. Finally, the post-G20 period showed a quick and sustained deterioration of air quality, which was as similar to the periods following the 2010 Shanghai Expo and the 2014 Beijing APEC summit when all emission control measures were lifted.
All data used in this paper are available from Kan Huang (huangkan@fudan.edu.cn).
The supplement related to this article is available online at: https://doi.org/10.5194/acp-18-13581-2018-supplement.
YJ and KH conceived the study. YJ, KH, and CD wrote the paper. JS, RY, KX, and TZ performed the measurements and collected data. All have contributed to the data analysis and review of the manuscript.
The authors declare that they have no conflict of interest.
This article is part of the special issue “Regional transport and transformation of air pollution in eastern China”. It is not associated with a conference.
This work was financially supported by the National Key R&D Program of
China (grant no. 2018YFC0213105), the
National Natural Science Foundation of China (grant no. 91644105 and 41429501), the Social
Development Research Plan of Hangzhou (grant no. 20160533B83), and the Initiative
Design Project for Agricultural and Social Development of Hangzhou
(grant no. 20172016A07).
Edited by: Yuan
Wang
Reviewed by: three anonymous referees
Canty, T.: Seasonal and solar cycle variability of OH in the middle atmosphere, J. Geophys. Res., 107, 4737, https://doi.org/10.1029/2002jd002278, 2002.
Cao, J.-J., Zhu, C.-S., Tie, X.-X., Geng, F.-H., Xu, H.-M., Ho, S. S. H., Wang, G.-H., Han, Y.-M., and Ho, K.-F.: Characteristics and sources of carbonaceous aerosols from Shanghai, China, Atmos. Chem. Phys., 13, 803–817, https://doi.org/10.5194/acp-13-803-2013, 2013.
Chen, C., Sun, Y. L., Xu, W. Q., Du, W., Zhou, L. B., Han, T. T., Wang, Q. Q., Fu, P. Q., Wang, Z. F., Gao, Z. Q., Zhang, Q., and Worsnop, D. R.: Characteristics and sources of submicron aerosols above the urban canopy (260 m) in Beijing, China, during the 2014 APEC summit, Atmos. Chem. Phys., 15, 12879–12895, https://doi.org/10.5194/acp-15-12879-2015, 2015.
Cheng, Y., He, K. B., Du, Z. Y., Zheng, M., Duan, F. K., and Ma, Y. L.: Humidity plays an important role in the PM2.5 pollution in Beijing, Environ. Pollut., 197, 68–75, https://doi.org/10.1016/j.envpol.2014.11.028, 2014.
Cheng, Y., Zheng, G., Wei, C., Mu, Q., Zheng, B., Wang, Z., Gao, M., Zhang, Q., He, K., Carmichael, G., Pöschl, U., and Su, H.: Reactive nitrogen chemistry in aerosol water as a source of sulfate during haze events in China, Science Advance, 2, e1601530, https://doi.org/10.1126/sciadv.1601530, 2016.
Fan, Q., Zhang, Y., Ma, W., Ma, H., Feng, J., Yu, Q., Yang, X., Ng, S. K., Fu, Q., and Chen, L.: Spatial and Seasonal Dynamics of Ship Emissions over the Yangtze River Delta and East China Sea and Their Potential Environmental Influence, Environ. Sci. Technol., 50, 1322–1329, https://doi.org/10.1021/acs.est.5b03965, 2016.
Garrett, T. J. and Zhao, C.: Increased Arctic cloud longwave emissivity associated with pollution from mid-latitudes, Nature, 440, 787–789, https://doi.org/10.1038/nature04636, 2006.
Guo, S., Hu, M., Zamora, M. L., Peng, J., Shang, D., Zheng, J., Du, Z., Wu, Z., Shao, M., Zeng, L., Molina, M. J., and Zhang, R.: Elucidating severe urban haze formation in China, P. Natl. Acad. Sci. USA, 111, 17373–17378, https://doi.org/10.1073/pnas.1419604111, 2014.
He, H., Wang, Y., Ma, Q., Ma, J., Chu, B., Ji, D., Tang, G., Liu, C., Zhang, H., and Hao, J.: Mineral dust and NOx promote the conversion of SO2 to sulfate in heavy pollution days, Sci. Rep., 4, 4172, https://doi.org/10.1038/srep04172, 2014.
Hsu, Y. K., Holsen, T. M., and Hopke, P. K.: Comparison of hybrid receptor models to locate PCB sources in Chicago, Atmos. Environ., 37, 545–562, 2003.
Huang, K., Zhuang, G., Lin, Y., Fu, J. S., Wang, Q., Liu, T., Zhang, R., Jiang, Y., Deng, C., Fu, Q., Hsu, N. C., and Cao, B.: Typical types and formation mechanisms of haze in an Eastern Asia megacity, Shanghai, Atmos. Chem. Phys., 12, 105–124, https://doi.org/10.5194/acp-12-105-2012, 2012.
Huang, K., Zhang, X., and Lin, Y.: The “APEC Blue” phenomenon: Regional emission control effects observed from space, Atmos. Res., 164/165, 65–75, https://doi.org/10.1016/j.atmosres.2015.04.018, 2015.
Jansen, R. C., Shi, Y., Chen, J., Hu, Y., Xu, C., Hong, S., Li, J., and Zhang, M.: Using hourly measurements to explore the role of secondary inorganic aerosol in PM2.5 during haze and fog in Hangzhou, China, Adv. Atmos. Sci., 31, 1427–1434, https://doi.org/10.1007/s00376-014-4042-2, 2014.
Jiao, L. and Qi, G.: Characteristics of organic and elemental carbon in PM10 over Hangzhou atmosphere, Journal of the Graduate School of the Chinese Academy of Sciences, 24, 625–629, 2007.
Khoder, M. I.: Atmospheric conversion of sulfur dioxide to particulate sulfate and nitrogen dioxide to particulate nitrate and gaseous nitric acid in an urban area, Chemosphere, 49, 675–684, 2002.
Kim, J. J., Huen, K., Adams, S., Smorodinsky, S., Hoats, A., Malig, B., Lipsett, M., and Ostro, B.: Residential traffic and children's respiratory health, Environ. Health Perspect., 116, 1274–1279, https://doi.org/10.1289/ehp.10735, 2008.
Kleeman, M. J., Ying, Q., Lu, J., Mysliwiec, M. J., Griffin, R. J., Chen, J., and Clegg, S.: Source apportionment of secondary organic aerosol during a severe photochemical smog episode, Atmos. Environ., 41, 576–591, https://doi.org/10.1016/j.atmosenv.2006.08.042, 2007.
Li, L., Dai, Q., Bi, X., Gao, J., Yang, J., Hong, S., and Feng, Y.: Characteristics and sources of carbonaceous species in atmospheric PM2.5 during winter in Hangzhou city, Research of Environmental Sciences, 30, 340–348, 2017.
Li, P., Yan, R., Yu, S., Wang, S., Liu, W., and Bao, H.: Reinstate regional transport of PM2.5 as a major cause of severe haze in Beijing, P. Natl. Acad. Sci. USA, 112, 2739–2740, https://doi.org/10.1073/pnas.1502596112, 2015.
Li, P., Wang, L., Guo, P., Yu, S., Mehmood, K., Wang, S., Liu, W., Seinfeld, J. H., Zhang, Y., Wong, D. C., Alapaty, K., Pleim, J., and Mathur, R.: High reduction of ozone and particulate matter during the 2016 G20 summit in Hangzhou by forced emission controls of industry and traffic, Environ. Chem. Lett., 15, 709–715, https://doi.org/10.1007/s10311-017-0642-2, 2017.
Li, X., He, K., Li, C., Yang, F., Zhao, Q., Ma, Y., Cheng, Y., Ouyang, W., and Chen, G.: PM2.5 mass, chemical composition, and light extinction beforeand during the 2008 Beijing Olympics, J. Geophys. Res.-Atmos., 118, 12158–12167, https://doi.org/10.1002/2013JD020106, 2013.
Liao, H., Chen, W. T., and Seinfeld, J. H.: Role of climate change in global predictions of future tropospheric ozone and aerosols, J. Geophys. Res., 111, D12304, https://doi.org/10.1029/2005jd006852, 2006.
Lin, Y., Cheng, M., Ting, W., and Yeh, C.: Characteristics of gaseous HNO2, HNO3, NH3 and particulate ammonium nitrate in an urban city of Central Taiwan, Atmos. Environ., 40, 4725–4733, https://doi.org/10.1016/j.atmosenv.2006.04.037, 2006.
Liu, G., Li, J., Wu, D., and Xu, H.: Chemical composition and source apportionment of the ambient PM2.5 in Hangzhou, China, Particuology, 18, 135–143, https://doi.org/10.1016/j.partic.2014.03.011, 2015.
Liu, H., Liu, C., Xie, Z., Li, Y., Huang, X., Wang, S., Xu, J., and Xie, P.: A paradox for air pollution controlling in China revealed by “APEC Blue” and “Parade Blue”, Sci. Rep., 6, 34408, https://doi.org/10.1038/srep34408, 2016.
Liu, T., Wang, X., Deng, W., Hu, Q., Ding, X., Zhang, Y., He, Q., Zhang, Z., Lü, S., Bi, X., Chen, J., and Yu, J.: Secondary organic aerosol formation from photochemical aging of light-duty gasoline vehicle exhausts in a smog chamber, Atmos. Chem. Phys., 15, 9049–9062, https://doi.org/10.5194/acp-15-9049-2015, 2015.
Liu, Z., Lu, X., Feng, J., Fan, Q., Zhang, Y., and Yang, X.: Influence of Ship Emissions on Urban Air Quality: A Comprehensive Study Using Highly Time-Resolved Online Measurements and Numerical Simulation in Shanghai, Environ. Sci. Technol., 51, 202–211, https://doi.org/10.1021/acs.est.6b03834, 2016.
Malm, W. C., Schichtel, B. A., Pitchford, M. L., Ashbaugh, L. L., and Eldred, R. A.: Spatial and monthly trends in speciated fine particle concentration in the United States, J. Geophys. Res.-Atmos., 109, D003739, https://doi.org/10.1029/2003jd003739, 2004.
Matthijsen, J., Suhre, K., Rosset, R., Eisele, F. L., Mauldin, R. L., and Tanner, D. J.: Photodissociation and UV radiative transfer in a cloudy atmosphere: Modeling and measurements, J. Geophys. Res.-Atmos., 103, 16665–16676, https://doi.org/10.1029/97jd02989, 1998.
Mattias Hallquist, J. M., Min, M., and Wang, T.: Photochemical smog in China scientific challenges and implications for air-quality policies, Natl. Sci. Rev., 3, 401–403, 2016.
Menon, S., Unger, N., Koch, D., Francis, J., Garrett, T., Sednev, I., Shindell, D., and Streets, D.: Aerosol climate effects and air quality impacts from 1980 to 2030, Environ. Res. Lett., 3, 024004, https://doi.org/10.1088/1748-9326/3/2/024004, 2008.
Pan, Y., Wang, Y., Zhang, J., Liu, Z., Wang, L., Tian, S., Tang, G., Gao, W., Ji, D., Song, T., and Wang, Y.: Redefining the importance of nitrate during haze pollution to help optimize an emission control strategy, Atmos. Environ., 141, 197–202, https://doi.org/10.1016/j.atmosenv.2016.06.035, 2016.
Pathak, R. K., Wu, W. S., and Wang, T.: Summertime PM2.5 ionic species in four major cities of China: nitrate formation in an ammonia-deficient atmosphere, Atmos. Chem. Phys., 9, 1711–1722, https://doi.org/10.5194/acp-9-1711-2009, 2009.
Qiao, Q., Huang, B., Piper, J. D. A., Biggin, A. J., and Zhang, C.: The characteristics of environmental particulate matter in the urban area of Beijing China during the 2008 Olympic Games, Atmos. Pollut. Res., 8, 141–148, https://doi.org/10.1016/j.apr.2016.08.003, 2016.
Richards, L. W.: Comments on the Oxidation of NO2 to Nitrate – Day and Night, Atmos. Environ., 17, 397–402, 1983.
Rolph, G., Stein, A., and Stunder, B.: Real-time Environmental Applications and Display sYstem: READY, Environ. Modell. Soft., 95, 210–228, 2017.
Russell, A. G., Cass, G. R., and Seinfeld, J. H.: On Some Aspects of Nighttime Atmospheric Chemistry, Environ. Sci. Technol., 20, 1167–1172, 1986.
Sander, S. P. and Seinfeld, J. H.: Chemical-Kinetics of Homogeneous Atmospheric Oxidation of Sulfur-Dioxide, Environ. Sci. Technol., 10, 1114–1123, 1976.
Schleicher, N., Norra, S., Chen, Y., Chai, F., and Wang, S.: Efficiency of mitigation measures to reduce particulate air pollution – a case study during the Olympic Summer Games 2008 in Beijing, China, Sci. Total Environ., 427–428, 146–158, https://doi.org/10.1016/j.scitotenv.2012.04.004, 2012.
Schryer, D. R.: Heterogeneous Atmospheric Chemistry, American Geophysical Union, 1982.
Sun, Y., Wang, Z., Wild, O., Xu, W., Chen, C., Fu, P., Du, W., Zhou, L., Zhang, Q., Han, T., Wang, Q., Pan, X., Zheng, H., Li, J., Guo, X., Liu, J., and Worsnop, D. R.: “APEC Blue”: Secondary Aerosol Reductions from Emission Controls in Beijing, Sci. Rep., 6, 20668, https://doi.org/10.1038/srep20668, 2016.
Sun, Y. L., Wang, Z. F., Fu, P. Q., Yang, T., Jiang, Q., Dong, H. B., Li, J., and Jia, J. J.: Aerosol composition, sources and processes during wintertime in Beijing, China, Atmos. Chem. Phys., 13, 4577–4592, https://doi.org/10.5194/acp-13-4577-2013, 2013.
Tie, X. and Cao, J.: Aerosol pollution in China: Present and future impact on environment, Particuology, 7, 426–431, https://doi.org/10.1016/j.partic.2009.09.003, 2009.
Turpin, B. J. and Huntzicker, J. J.: Identification of secondary organic aerosol episodes and quantitation of primary and secondary organic aerosl cocentration during SCAQS, Atmos. Environ., 29, 3527–3544, 1994.
Wang, G., Zhang, R., Gomez, M. E., Yang, L., Levy Zamora, M., Hu, M., Lin, Y., Peng, J., Guo, S., Meng, J., Li, J., Cheng, C., Hu, T., Ren, Y., Wang, Y., Gao, J., Cao, J., An, Z., Zhou, W., Li, G., Wang, J., Tian, P., Marrero-Ortiz, W., Secrest, J., Du, Z., Zheng, J., Shang, D., Zeng, L., Shao, M., Wang, W., Huang, Y., Wang, Y., Zhu, Y., Li, Y., Hu, J., Pan, B., Cai, L., Cheng, Y., Ji, Y., Zhang, F., Rosenfeld, D., Liss, P. S., Duce, R. A., Kolb, C. E., and Molina, M. J.: Persistent sulfate formation from London Fog to Chinese haze, P. Natl. Acad. Sci. USA, 113, 13630–13635, https://doi.org/10.1073/pnas.1616540113, 2016.
Wang, P. and Dai, X.-G.: “APEC Blue” association with emission control and meteorological conditions detected by multi-scale statistics, Atmos. Res., 178–179, 497–505, https://doi.org/10.1016/j.atmosres.2016.05.001, 2016.
Wang, Q., Zhuang, G., Huang, K., Liu, T., Deng, C., Xu, J., Lin, Y., Guo, Z., Chen, Y., Fu, Q., Fu, J. S., and Chen, J.: Probing the severe haze pollution in three typical regions of China, Atoms. Environ., 120, 76–88, https://doi.org/10.1016/j.atmosenv.2015.08.076, 2015.
Wang, T., Nie, W., Gao, J., Xue, L. K., Gao, X. M., Wang, X. F., Qiu, J., Poon, C. N., Meinardi, S., Blake, D., Wang, S. L., Ding, A. J., Chai, F. H., Zhang, Q. Z., and Wang, W. X.: Air quality during the 2008 Beijing Olympics: secondary pollutants and regional impact, Atmos. Chem. Phys., 10, 7603–7615, https://doi.org/10.5194/acp-10-7603-2010, 2010.
Wang, X., Wang, W., Yang, L., Gao, X., Nie, W., Yu, Y., Xu, P., Zhou, Y., and Wang, Z.: The secondary formation of inorganic aerosols in the droplet mode through heterogeneous aqueous reactions under haze conditions, Atmos. Environ., 63, 68–76, https://doi.org/10.1016/j.atmosenv.2012.09.029, 2012.
Wang, Z., Li, Y., Chen, T., Li, L., Liu, B., Zhang, D., Sun, F., Wei, Q., Jiang, L., and Pan, L.: Changes in atmospheric composition during the 2014APEC conference in Beijing, J. Geophys. Res.-Atmos., 120, 12695–12707, 2015.
Wu, C. and Yu, J. Z.: Determination of primary combustion source organic carbon-to-elemental carbon (OC∕EC) ratio using ambient OC and EC measurements: secondary OC-EC correlation minimization method, Atmos. Chem. Phys., 16, 5453–5465, https://doi.org/10.5194/acp-16-5453-2016, 2016.
Wu, C., Huang, X. H. H., Ng, W. M., Griffith, S. M., and Yu, J. Z.: Inter-comparison of NIOSH and IMPROVE protocols for OC and EC determination: implications for inter-protocol data conversion, Atmos. Meas. Tech., 9, 4547–4560, https://doi.org/10.5194/amt-9-4547-2016, 2016.
Wu, Z., Wang, Y., Tan, T., Zhu, Y., Li, M., Shang, D., Wang, H., Lu, K., Guo, S., Zeng, L., and Zhang, Y.: Aerosol Liquid Water Driven by Anthropogenic Inorganic Salts: Implying Its Key Role in Haze Formation over the North China Plain, Environ. Sci. Technol. Lett., 5, 160–166, https://doi.org/10.1021/acs.estlett.8b00021, 2018.
Wyche, K. P., Ryan, A. C., Hewitt, C. N., Alfarra, M. R., McFiggans, G., Carr, T., Monks, P. S., Smallbone, K. L., Capes, G., Hamilton, J. F., Pugh, T. A. M., and MacKenzie, A. R.: Emissions of biogenic volatile organic compounds and subsequent photochemical production of secondary organic aerosol in mesocosm studies of temperate and tropical plant species, Atmos. Chem. Phys., 14, 12781–12801, https://doi.org/10.5194/acp-14-12781-2014, 2014.
Xing, L., Fu, T.-M., Cao, J. J., Lee, S. C., Wang, G. H., Ho, K. F., Cheng, M.-C., You, C.-F., and Wang, T. J.: Seasonal and spatial variability of the OM/OC mass ratios and high regional correlation between oxalic acid and zinc in Chinese urban organic aerosols, Atmos. Chem. Phys., 13, 4307–4318, https://doi.org/10.5194/acp-13-4307-2013, 2013.
Xu, R., Tang, G., Wang, Y., and Tie, X.: Analysis of a long-term measurement of air pollutants (2007–2011) in North China Plain (NCP); Impact of emission reduction during the Beijing Olympic Games, Chemosphere, 159, 647–658, https://doi.org/10.1016/j.chemosphere.2016.06.025, 2016.
Xu, W., Han, T., Du, W., Wang, Q., Chen, C., Zhao, J., Zhang, Y., Li, J., Fu, P., Wang, Z., Worsnop, D. R., and Sun, Y.: Effects of Aqueous-Phase and Photochemical Processing on Secondary Organic Aerosol Formation and Evolution in Beijing, China, Environ. Sci. Technol., 51, 762–770, https://doi.org/10.1021/acs.est.6b04498, 2017.
Yu, S., Zhang, Q., Yan, R., Wang, S., Li, P., Chen, B., Liu, W., and Zhang, X.: Origin of air pollution during a weekly heavy haze episode in Hangzhou, China, Environ. Chem. Lett., 12, 543–550, https://doi.org/10.1007/s10311-014-0483-1, 2014.
Zheng, G. J., Duan, F. K., Su, H., Ma, Y. L., Cheng, Y., Zheng, B., Zhang, Q., Huang, T., Kimoto, T., Chang, D., Pöschl, U., Cheng, Y. F., and He, K. B.: Exploring the severe winter haze in Beijing: the impact of synoptic weather, regional transport and heterogeneous reactions, Atmos. Chem. Phys., 15, 2969–2983, https://doi.org/10.5194/acp-15-2969-2015, 2015.