the Creative Commons Attribution 4.0 License.
the Creative Commons Attribution 4.0 License.
 | 23 Aug 2018
Urban influence on the concentration and composition of submicron particulate matter in central Amazonia
Suzane S. de Sá
Brett B. Palm
Pedro Campuzano-Jost
Douglas A. Day
Weiwei Hu
Gabriel Isaacman-VanWertz
Lindsay D. Yee
Joel Brito
Samara Carbone
Igor O. Ribeiro
Glauber G. Cirino
Yingjun Liu
Ryan Thalman
Arthur Sedlacek
Aaron Funk
Courtney Schumacher
John E. Shilling
Johannes Schneider
Paulo Artaxo
Allen H. Goldstein
Rodrigo A. F. Souza
Jian Wang
Karena A. McKinney
Henrique Barbosa
M. Lizabeth Alexander
Jose L. Jimenez
Scot T. Martin
An understanding of how anthropogenic emissions affect the concentrations and composition of airborne particulate matter (PM) is fundamental to quantifying the influence of human activities on climate and air quality. The central Amazon Basin, especially around the city of Manaus, Brazil, has experienced rapid changes in the past decades due to ongoing urbanization. Herein, changes in the concentration and composition of submicron PM due to pollution downwind of the Manaus metropolitan region are reported as part of the GoAmazon2014/5 experiment. A high-resolution time-of-flight aerosol mass spectrometer (HR-ToF-AMS) and a suite of other gas- and particle-phase instruments were deployed at the “T3” research site, 70 km downwind of Manaus, during the wet season. At this site, organic components represented 79±7 % of the non-refractory PM1 mass concentration on average, which was in the same range as several upwind sites. However, the organic PM1 was considerably more oxidized at T3 compared to upwind measurements. Positive-matrix factorization (PMF) was applied to the time series of organic mass spectra collected at the T3 site, yielding three factors representing secondary processes (73±15 % of total organic mass concentration) and three factors representing primary anthropogenic emissions (27±15 %). Fuzzy c-means clustering (FCM) was applied to the afternoon time series of concentrations of NOy, ozone, total particle number, black carbon, and sulfate. Four clusters were identified and characterized by distinct air mass origins and particle compositions. Two clusters, Bkgd-1 and Bkgd-2, were associated with background conditions. Bkgd-1 appeared to represent near-field atmospheric PM production and oxidation of a day or less. Bkgd-2 appeared to represent material transported and oxidized for two or more days, often with out-of-basin contributions. Two other clusters, Pol-1 and Pol-2, represented the Manaus influence, one apparently associated with the northern region of Manaus and the other with the southern region of the city. A composite of the PMF and FCM analyses provided insights into the anthropogenic effects on PM concentration and composition. The increase in mass concentration of submicron PM ranged from 25 % to 200 % under polluted compared with background conditions, including contributions from both primary and secondary PM. Furthermore, a comparison of PMF factor loadings for different clusters suggested a shift in the pathways of PM production under polluted conditions. Nitrogen oxides may have played a critical role in these shifts. Increased concentrations of nitrogen oxides can shift pathways of PM production from HO2-dominant to NO-dominant as well as increase the concentrations of oxidants in the atmosphere. Consequently, the oxidation of biogenic and anthropogenic precursor gases as well as the oxidative processing of preexisting atmospheric PM can be accelerated. This combined set of results demonstrates the susceptibility of atmospheric chemistry, air quality, and associated climate forcing to anthropogenic perturbations over tropical forests.
- Article
(6159 KB) - Full-text XML
-
Supplement
(1997 KB) - BibTeX
- EndNote


Secondary organic material (SOM) constitutes a large fraction of the atmospheric particle burden (Hallquist et al., 2009; Jimenez et al., 2009). Therefore, it has important effects on the Earth's radiation balance, atmospheric visibility, and human health. SOM is a complex mixture of compounds resulting from many chemical pathways, and the processes underlying the production of SOM remain poorly understood. Models are especially challenged to accurately represent the production of SOM in regions where there is a mix of biogenic and anthropogenic emissions (de Gouw et al., 2008; Glasius and Goldstein, 2016; Shrivastava et al., 2017). Possible shifts in the contributing mechanisms of SOM production between background and polluted conditions must be understood and quantified for distinct environments on the globe to test and enable accurate modeling predictions.
Several field observations, mainly in midlatitudes of the Northern Hemisphere, and modeling efforts have suggested that the production of SOM from biogenic precursor compounds becomes more efficient in polluted air (Weber et al., 2007; Goldstein et al., 2009; Hoyle et al., 2011; Huang et al., 2014; Zhang et al., 2018). In the northeastern USA, de Gouw et al. (2005) showed that concentrations of organic particulate matter (PM) correlated well with anthropogenic tracers, yet the concentrations of the anthropogenic precursors were insufficient to explain the observed PM concentrations. In the southeastern USA, radioisotope analysis of organic PM determined that 70 % to 80 % of the carbon mass had a modern origin even as correlations were observed between SOM mass concentrations and anthropogenic VOC and CO concentrations (Weber et al., 2007). This finding and those of further field studies in the region together suggested that the organic PM was mainly produced from biogenic VOCs (BVOCs), yet it was modulated by anthropogenic emissions of NOx and SO2 (Hu et al., 2015; Xu et al., 2015a, b; Zhang et al., 2018). In the western USA, ground and aircraft measurements observed the highest organic PM increases when air masses containing high BVOC concentrations intercepted anthropogenic emissions (Setyan et al., 2012; Shilling et al., 2013). A metastudy for several locations in the USA concluded that air downwind of urban areas had increased organic PM concentrations due to the photochemical production of SOM (De Gouw and Jimenez, 2009). Models have estimated that 50 % to 70 % of the biogenic SOM mass concentration in several locations is modulated by anthropogenic emissions (Carlton et al., 2010; Heald et al., 2011; Spracklen et al., 2011). In addition, global-scale modeling studies have estimated an increase of 20 % to 60 % in the global annual mean SOM concentration relative to the preindustrial period (Tsigaridis et al., 2006; Hoyle et al., 2009).
Many possible mechanisms may contribute to the effects of anthropogenic emissions on increased SOM production, including changes in gas–particle partitioning, new particle production and growth, and particle acidity. However, changes in the concentrations of nitrogen oxides should be regarded as a critical factor (Hoyle et al., 2011 and references therein). Different NOx regimes favor distinct gas-phase oxidation pathways, leading to different oxidation products and particle yields, as evidenced in isoprene photooxidation (Kroll et al., 2005, 2006; Hallquist et al., 2009; Worton et al., 2013; J. Liu et al., 2016; Y. Liu et al., 2016). Isoprene accounts for half of global BVOC mass emissions, and tropical forests are responsible for about 80 % of terpenoid emissions (Guenther et al., 2012). In the Amazon, isoprene is the dominant BVOC emitted by vegetation and is estimated to contribute to about half of the organic PM concentrations under background conditions (Kuhn et al., 2010; Chen et al., 2015; Yáñez-Serrano et al., 2015). Under HO2-dominant conditions (i.e., low NOx), isoprene epoxydiols (IEPOX) are produced in the gas phase and, through heterogenous reactions involving sulfate, PM is produced (Paulot et al., 2009; Surratt et al., 2010). Depending on the relative importance of increased concentrations of sulfate and NOx associated with pollution in a given region, an enhancement or suppression of IEPOX-derived PM production relative to background conditions may occur (Xu et al., 2015a; de Sá et al., 2017). As part of GoAmazon2014/5, de Sá et al. (2017) demonstrated that PM derived from IEPOX decreased under polluted compared to background conditions downwind of Manaus. Nitrogen oxides in the pollution plume suppressed the production of isoprene hydroxyhydroperoxides (Y. Liu et al., 2016), leading to a decrease in the production of gas-phase IEPOX and subsequently of IEPOX-derived PM (de Sá et al., 2017).
Amazonia, the largest tropical forest in the world and a large global source of SOM, is comparatively understudied relative to northern midlatitude regions, and the influence of pollution on the SOM life cycle is, in particular, little studied (Martin et al., 2010a). Manaus, a city of over two million people in the central Amazon, continuously releases an urban plume into an otherwise mostly unperturbed region (Kuhn et al., 2010; Martin et al., 2017). The region downwind of Manaus, especially in the wet season in the absence of regional fires (Artaxo et al., 2013), offers a natural laboratory for the investigation of biogenic–anthropogenic interactions and the resulting consequences for the amount and composition of PM in the region.
The present study investigates the influences of urban pollution on the concentration and composition of fine particles in central Amazonia, focusing on organic PM and its several component classes. The analysis employs datasets collected in the wet season from 1 February to 31 March, 2014, corresponding to the first Intensive Operating Period (IOP1) of the GoAmazon2014/5 experiment (Martin et al., 2016). Herein, positive-matrix factorization (PMF) of organic mass spectra measured by an aerosol mass spectrometer (AMS) in conjunction with a clustering analysis of pollution indicators by fuzzy c-means are employed to investigate the changes in particle concentration and composition associated with the influence of urban pollution downwind of Manaus.
2.1 Site description
The primary site in this study, named “T3” (3.2133∘ S, 60.5987∘ W), was located 70 km to the west of Manaus, Brazil, in central Amazonia (Martin et al., 2016). The site was situated in a pasture of 2.5 km × 2 km surrounded by forest. Based on modeled flow trajectories of the pollution plume, the T3 site intercepted the plume about 40 % of the time (Martin et al., 2017). Auxiliary sites “T0a” and “T0t”, served as references for background conditions in relation to T3 (Fig. S1 in the Supplement). Site T0a (2.1466∘ S, 59.0050∘ W) refers to the Amazonian Tall Tower Observatory (ATTO; Andreae et al., 2015), located 150 km to the northeast of Manaus. Site T0t (2.5946∘ S, 60.2093∘ W) was situated 60 km to the north-northwest of Manaus in the Cuieiras Biological Reserve (“ZF2”) and refers to tower “TT34”, established in 2008 for the AMAZE-08 experiment (Martin et al., 2010b). The T0 sites were typically upwind of Manaus, with only occasional transport of pollution to these sites (Andreae et al., 2015; Chen et al., 2015). Auxiliary site “T2” served as a reference for polluted conditions. This site was located just across the Rio Negro (3.1392∘ S, 60.1315∘ W), 8 km from the southwestern edge of Manaus and typically downwind of urban emissions during the daytime.
2.2 Aerosol mass spectrometry
Characterization of the atmospheric PM was obtained using a high-resolution time-of-flight aerosol mass spectrometer (hereafter AMS; Aerodyne, Inc., Billerica, Massachusetts, USA; DeCarlo et al., 2006; Canagaratna et al., 2007). Detailed aspects of the AMS operation in GoAmazon2014/5 were presented in de Sá et al. (2017). In brief, the instrument was housed in a temperature-controlled research container, and the inlet to the instrument sampled from 5 m above ground level. Ambient measurements for this study were obtained every other 4 min. The other 4 min was used for an analysis of the output from an oxidation flow reactor as presented in Palm et al. (2018).
Data analysis was performed using SQUIRREL (1.56D) and PIKA (1.14G) of the AMS software suite (Sueper et al., 2017; DeCarlo et al., 2006). Organic, sulfate, ammonium, nitrate, and chloride PM mass concentrations were quantified. “Sulfate” and “nitrate” concentrations reported by the AMS may include contributions from both organic and inorganic species (Farmer et al., 2010; Liao et al., 2015). Organic and inorganic nitrate concentrations were estimated based on the ratio of to NO+ signal intensity, as described in Sect. S2 (Fry et al., 2009, 2013; Farmer et al., 2010). The organic elemental ratios, O : C and H : C, were calculated following the methods of Canagaratna et al. (2015).
2.3 Auxiliary measurements and datasets
In complement to the AMS dataset, the analysis herein incorporated auxiliary gas and particle measurements collected during IOP1 at T3 (Martin et al., 2016). Mass concentrations of molecular and tracer organic species in the gas and particle phases were measured by a semi-volatile thermal desorption aerosol gas chromatograph (SV-TAG) at a time resolution of one hour (Isaacman-VanWertz et al., 2016). Concentrations of volatile organic compounds (VOCs) were measured by a proton-transfer-reaction time-of-flight mass spectrometer (PTR-ToF-MS; Y. Liu et al., 2016). In the Mobile Aerosol Observing System (MAOS) of the ARM Climate Research Facility (ACRF; Martin et al., 2016), measurements of NOy were made using a chemiluminescence-based instrument (Air Quality Design). The raw NOy measurements (10 s resolution) were averaged across 30 min intervals to dampen the influence of brief local events. In addition, ozone concentrations were measured by an ultraviolet photometric analyzer (Thermo Fisher, model 49i, Ozone Analyzer). Particle number concentrations were measured by a condensation particle counter (TSI, model 3772). Black carbon (BC) concentrations were measured both by a 7-wavelength aethalometer (Magee Scientific, model AE-31) and a single particle soot photometer (SP2; Droplet Measurement Techniques). The two datasets differed by a factor of up to 3 in absolute mass concentrations, as observed in other studies (Subramanian et al., 2007; Cappa et al., 2008; Lack et al., 2008), but they agreed well in the temporal trend. Thus, the analysis herein for BC is restricted to the temporal trends. Wind direction, solar irradiance, and precipitation rate were measured by the ARM Mobile Facility (AMF-1), which was also part of the ACRF.
Additional measurements from T0a, T0t, and T2 were also used in the analysis. At T2, non-refractory particle composition and concentration were measured by an Aerosol Chemical Speciation Monitor (ACSM) during the wet season from 9 March to 30 April 2014 (Cirino et al., 2018). ACSM measurements were made at T0a during the wet season of 2015, from 1 February to 31 March (Andreae et al., 2015). Further AMS datasets collected at T0t during the wet season of 2008 (6 February to 22 March; AMAZE-08 campaign) were used in the analysis (Chen et al., 2009; Schneider et al., 2011).
2.4 Air mass back trajectories and precipitation rates
Simulations of 2-day backward air mass trajectories, starting at 100 m above T3, were made using HYSPLIT4 (Draxler and Hess, 1998). Input meteorological data were obtained from the Global Data Assimilation System (GDAS), provided by the NOAA Air Resources Laboratory (ARL), on a regular grid of , 18 pressure levels, and 3 h intervals. Trajectory steps were calculated for every 12 min.
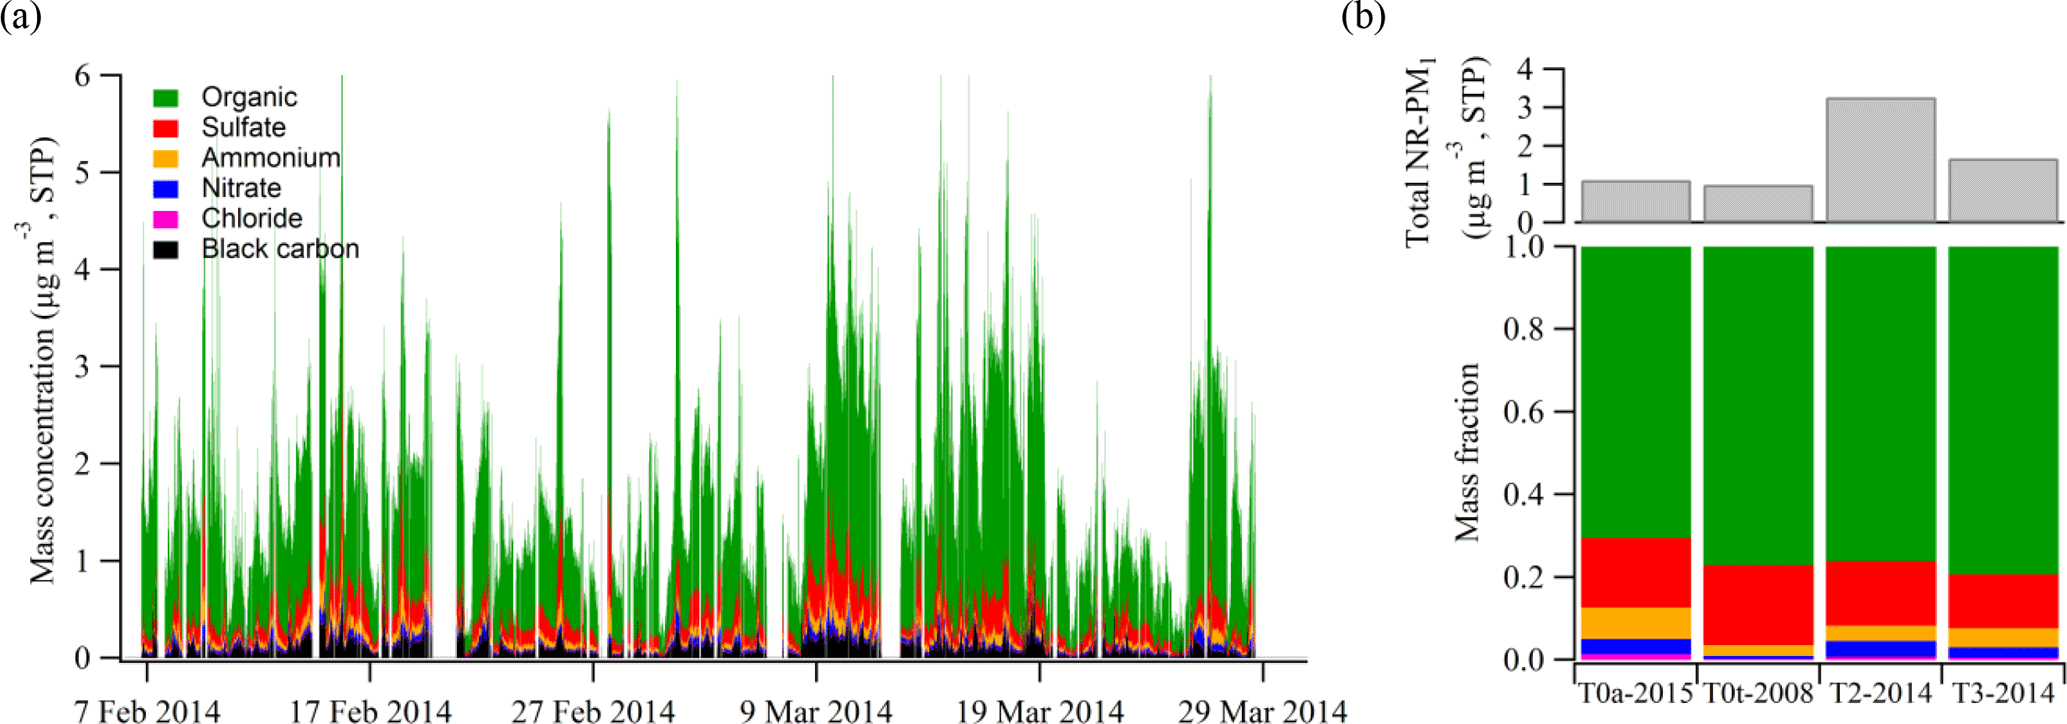
Figure 1(a) Mass concentrations of PM1 species at T3 during the wet season of 2014 (IOP1). Non-refractory (NR) PM1 species of organic, sulfate, ammonium, nitrate, and chloride were measured by the AMS. Mass concentrations of black carbon were obtained by scaling aethalometer measurements by a factor of 2 based on the range of 1 to 3 for the comparison of SP2 to aethalometer measurements. The temporal trend of the two instruments agreed well. (b) Comparison of the summed mass concentrations of (top) non-refractory PM1 species and (bottom) the mass fractions of these species at T3 and three other regional sites. T0a-2015 refers to measurements in the wet season of 2015 at the ATTO location (Andreae et al., 2015). T0t-2008 refers to the AMAZE-08 experiment, which took place in the wet season of 2008 at the TT34 location (Chen et al., 2015). T2-2014 refers to measurements made during IOP1 at a site 8 km downwind of Manaus, just across the Black River (“Rio Negro”) (Cirino et al., 2018). Measurements at T0a in 2015 and at T2 in 2014 were made by an ACSM, and measurements at T0t in 2008 and at T3 in 2014 were made by an AMS. Concentrations were adjusted to standard temperature (273.15 K) and pressure (105 Pa) (STP). The variability of measurements across sites is evaluated in Fig. 2.
Information on precipitation along the trajectories was obtained from the S-band radar of the System for Amazon Protection (SIPAM) in Manaus (Machado et al., 2014). The radar had a beam width of 1.8∘, and it scanned 17 elevation angles every 12 min. Data were recorded to a range of 240 km at 500 m gate spacing. The reflectivity fields were quality controlled to remove non-meteorological echo and calibrated against the satellite precipitation radar of the Tropical Rainfall Measuring Mission and Global Precipitation Measurement (TRMM-GPM; Kummerow et al., 1998; Hou et al., 2014). Ground clutter was used to analyze the stability of the calibration. The data were gridded at 2 km × 2 km in the horizontal and 0.5 km in the vertical using the NCAR Radx software. The reflectivity at 2.5 km of altitude was converted to rain rates based on the datasets of a Joss–Waldvogel disdrometer (Joss and Waldvogel, 1967), located at T3, 70 km downwind of the radar.
3.1 Fine-mode PM composition
The time series of mass concentrations of PM1 species at T3 during the wet season of 2014 are plotted in Fig. 1a. Organic material dominated the composition, contributing 79±7 % (average ± one standard deviation), followed by sulfate (13±5 %). The standard deviation quantifies the variability across the time series. Average non-refractory (NR) PM1 mass concentrations and compositions at T3 as well as at three other sites in the region are represented in Fig. 1b. The two T0 sites corresponded to predominantly background conditions. By contrast, the T2 site represented conditions just downwind of Manaus, and depending on wind direction experienced fresh Manaus pollution or background air. The comparison in Fig. 1b demonstrates that the organic component consistently constituted 70 % to 80 % of NR-PM1 across sites in this region in the wet season, for both background and polluted conditions, in line with previous observations (Chen et al., 2009; Martin et al., 2010a).
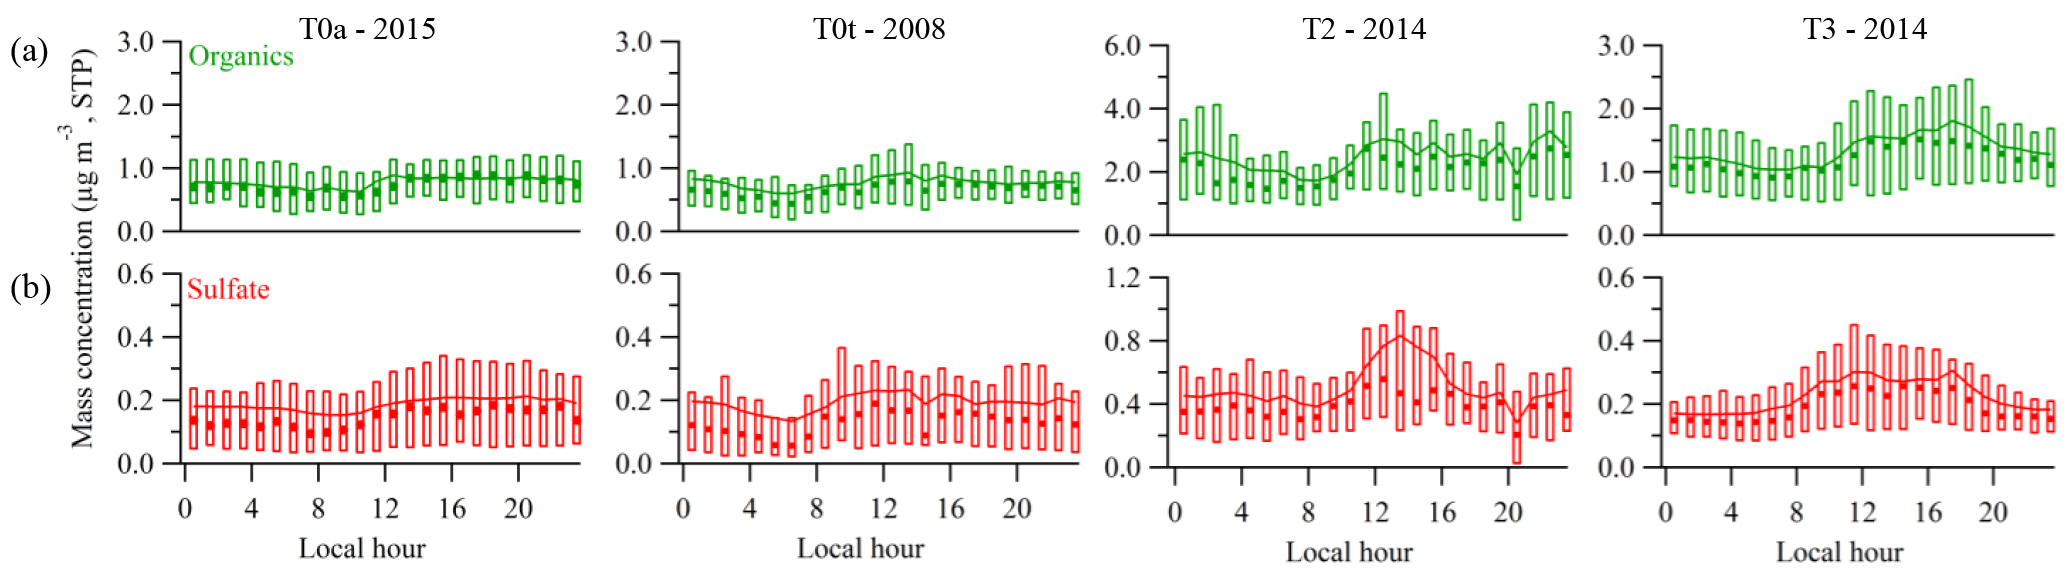
Figure 2Diel patterns of the mass concentrations of (a, green) organic and (b, red) sulfate species during the wet season at four different sites (cf. Figs. 1 and S1). The ordinate scale for the T2-2014 panel is twice that of the other panels. Mass concentrations were corrected to standard temperature and pressure (273.15 K and 105 Pa) (STP). Local time is UTC minus 4 h. Lines represent means, solid markers show medians, and boxes span interquartile ranges.
Even though the relative composition was similar across all sites, there were differences in the absolute mass concentrations (Fig. 1b, top panel). The NR-PM1 mass concentrations at the T0 sites upwind of Manaus, although measured in different years, were consistently around 1 µg m−3. The concentrations at the T2 site just downwind of Manaus were more than three times higher on average (3.3 µg m−3). Average concentrations at the T3 site (1.7 µg m−3), several hours downwind of Manaus, were lower compared to those at T2. This relative progression from T0, to T2, and then to T3 can be understood as a first-order quantification of the overall effect of Manaus emissions in increasing the airborne PM burden in the downwind region.
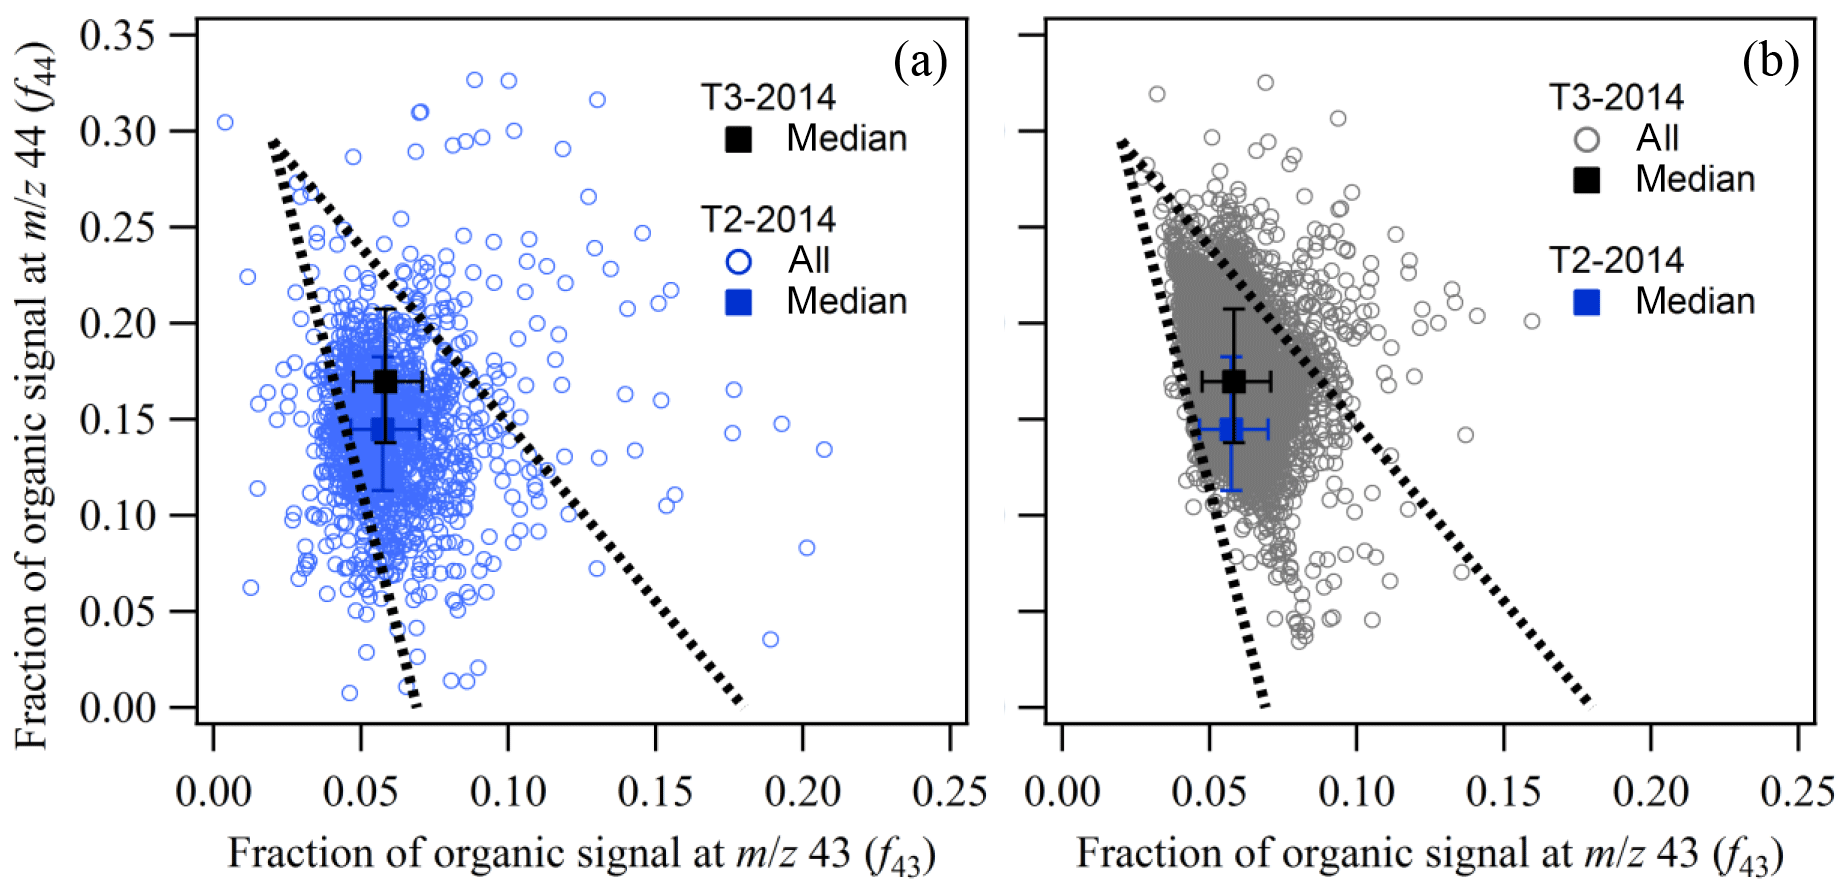
Figure 3Scatterplot of the AMS signal fraction at m∕z 44 (f44) against that at m∕z 43 (f43). Gray and blue circles correspond to measurements at T3 and T2 during IOP1, respectively, in the wet season of 2014. For visualization purposes, the two datasets are plotted separately in panels (a) and (b). Solid squares represent median values, and whiskers represent 10 and 90 percentiles. Dashed lines delineate the region where worldwide measurements of ambient organic PM1 commonly lie (Ng et al., 2011a).
The diel trends of organic and sulfate mass concentrations as well as their variabilities across the four sites are shown in Fig. 2. Lines represent means, solid markers show medians, and boxes span the interquartile ranges. Organic mass concentrations and associated variability were higher at the T3 site compared with the T0 sites, markedly so in the afternoon hours. The greater variability at T3 is in line with a time-varying influence of Manaus emissions. This influence waxes and wanes with small northerly or southerly shifts of the trade winds as well as other changes in regional circulation tied to daily meteorology (dos Santos et al., 2014; Martin et al., 2017). The higher afternoon mass concentrations at T3 can be attributed to the combination of (i) an oxidant-rich, sunlight-fed plume that increases the production rate of secondary PM and (ii) faster near-surface winds during the day that transport PM from Manaus to T3 with less loss by deposition and dispersion compared with more stagnant air at night. Among all sites, the T2 observations had both the highest average organic mass concentrations and the largest variability. These characteristics of the T2 dataset can be explained by a combination of (i) the proximity of the site to Manaus, (ii) the rapid and 180∘ changes in wind direction caused by the intersection of the trade winds with a local river breeze (dos Santos et al., 2014), and (iii) the possible contributions of emissions from brick kilns, located mostly southwest of the site, especially during nighttime (Martin et al., 2016; Cirino et al., 2018).
The diel trends of the sulfate mass concentrations were, in large part, similar to those of the organic mass concentrations. However, one distinction in the case of sulfate is that the variability at the T0 sites is similar to that at the T3 site. The explanation is that the background sources of sulfate, including not only in-basin emissions but also out-of-basin long-range transport, are variable and significant enough to make the variability at the background sites similar to that at the T3 site (de Sá et al., 2017).
Overall, the organic PM1 at T3 was highly oxidized, as indicated by the position of the gray markers in Fig. 3b. By contrast, the blue markers in Fig. 3a represent the dataset collected at T2 during the same period. The datasets encompass all times of the day and all conditions at both sites. Datasets from background sites collected in different years are shown in Fig. S2. Points in the upper left represent more-oxidized material, and points in the lower right represent less-oxidized material (Ng et al., 2011a). The comparison depicted in Fig. 3 indicates the effects of the plume over the 4 h of transport from T2 to T3, which were investigated in detail by Cirino et al. (2018). The plot suggests that the enhanced oxidative cycle associated with higher OH and O3 concentrations in the pollution plume might cause (i) the production of highly oxidized SOM, from both biogenic and anthropogenic precursors including aromatic compounds (Chhabra et al., 2011; Lambe et al., 2011), and (ii) the accelerated oxidative processing of preexisting organic PM by OH and O3 (Martin et al., 2017). The implication of this is that the emissions from Manaus can significantly affect the mechanisms that produce or modify fine-mode PM over the tropical forest.
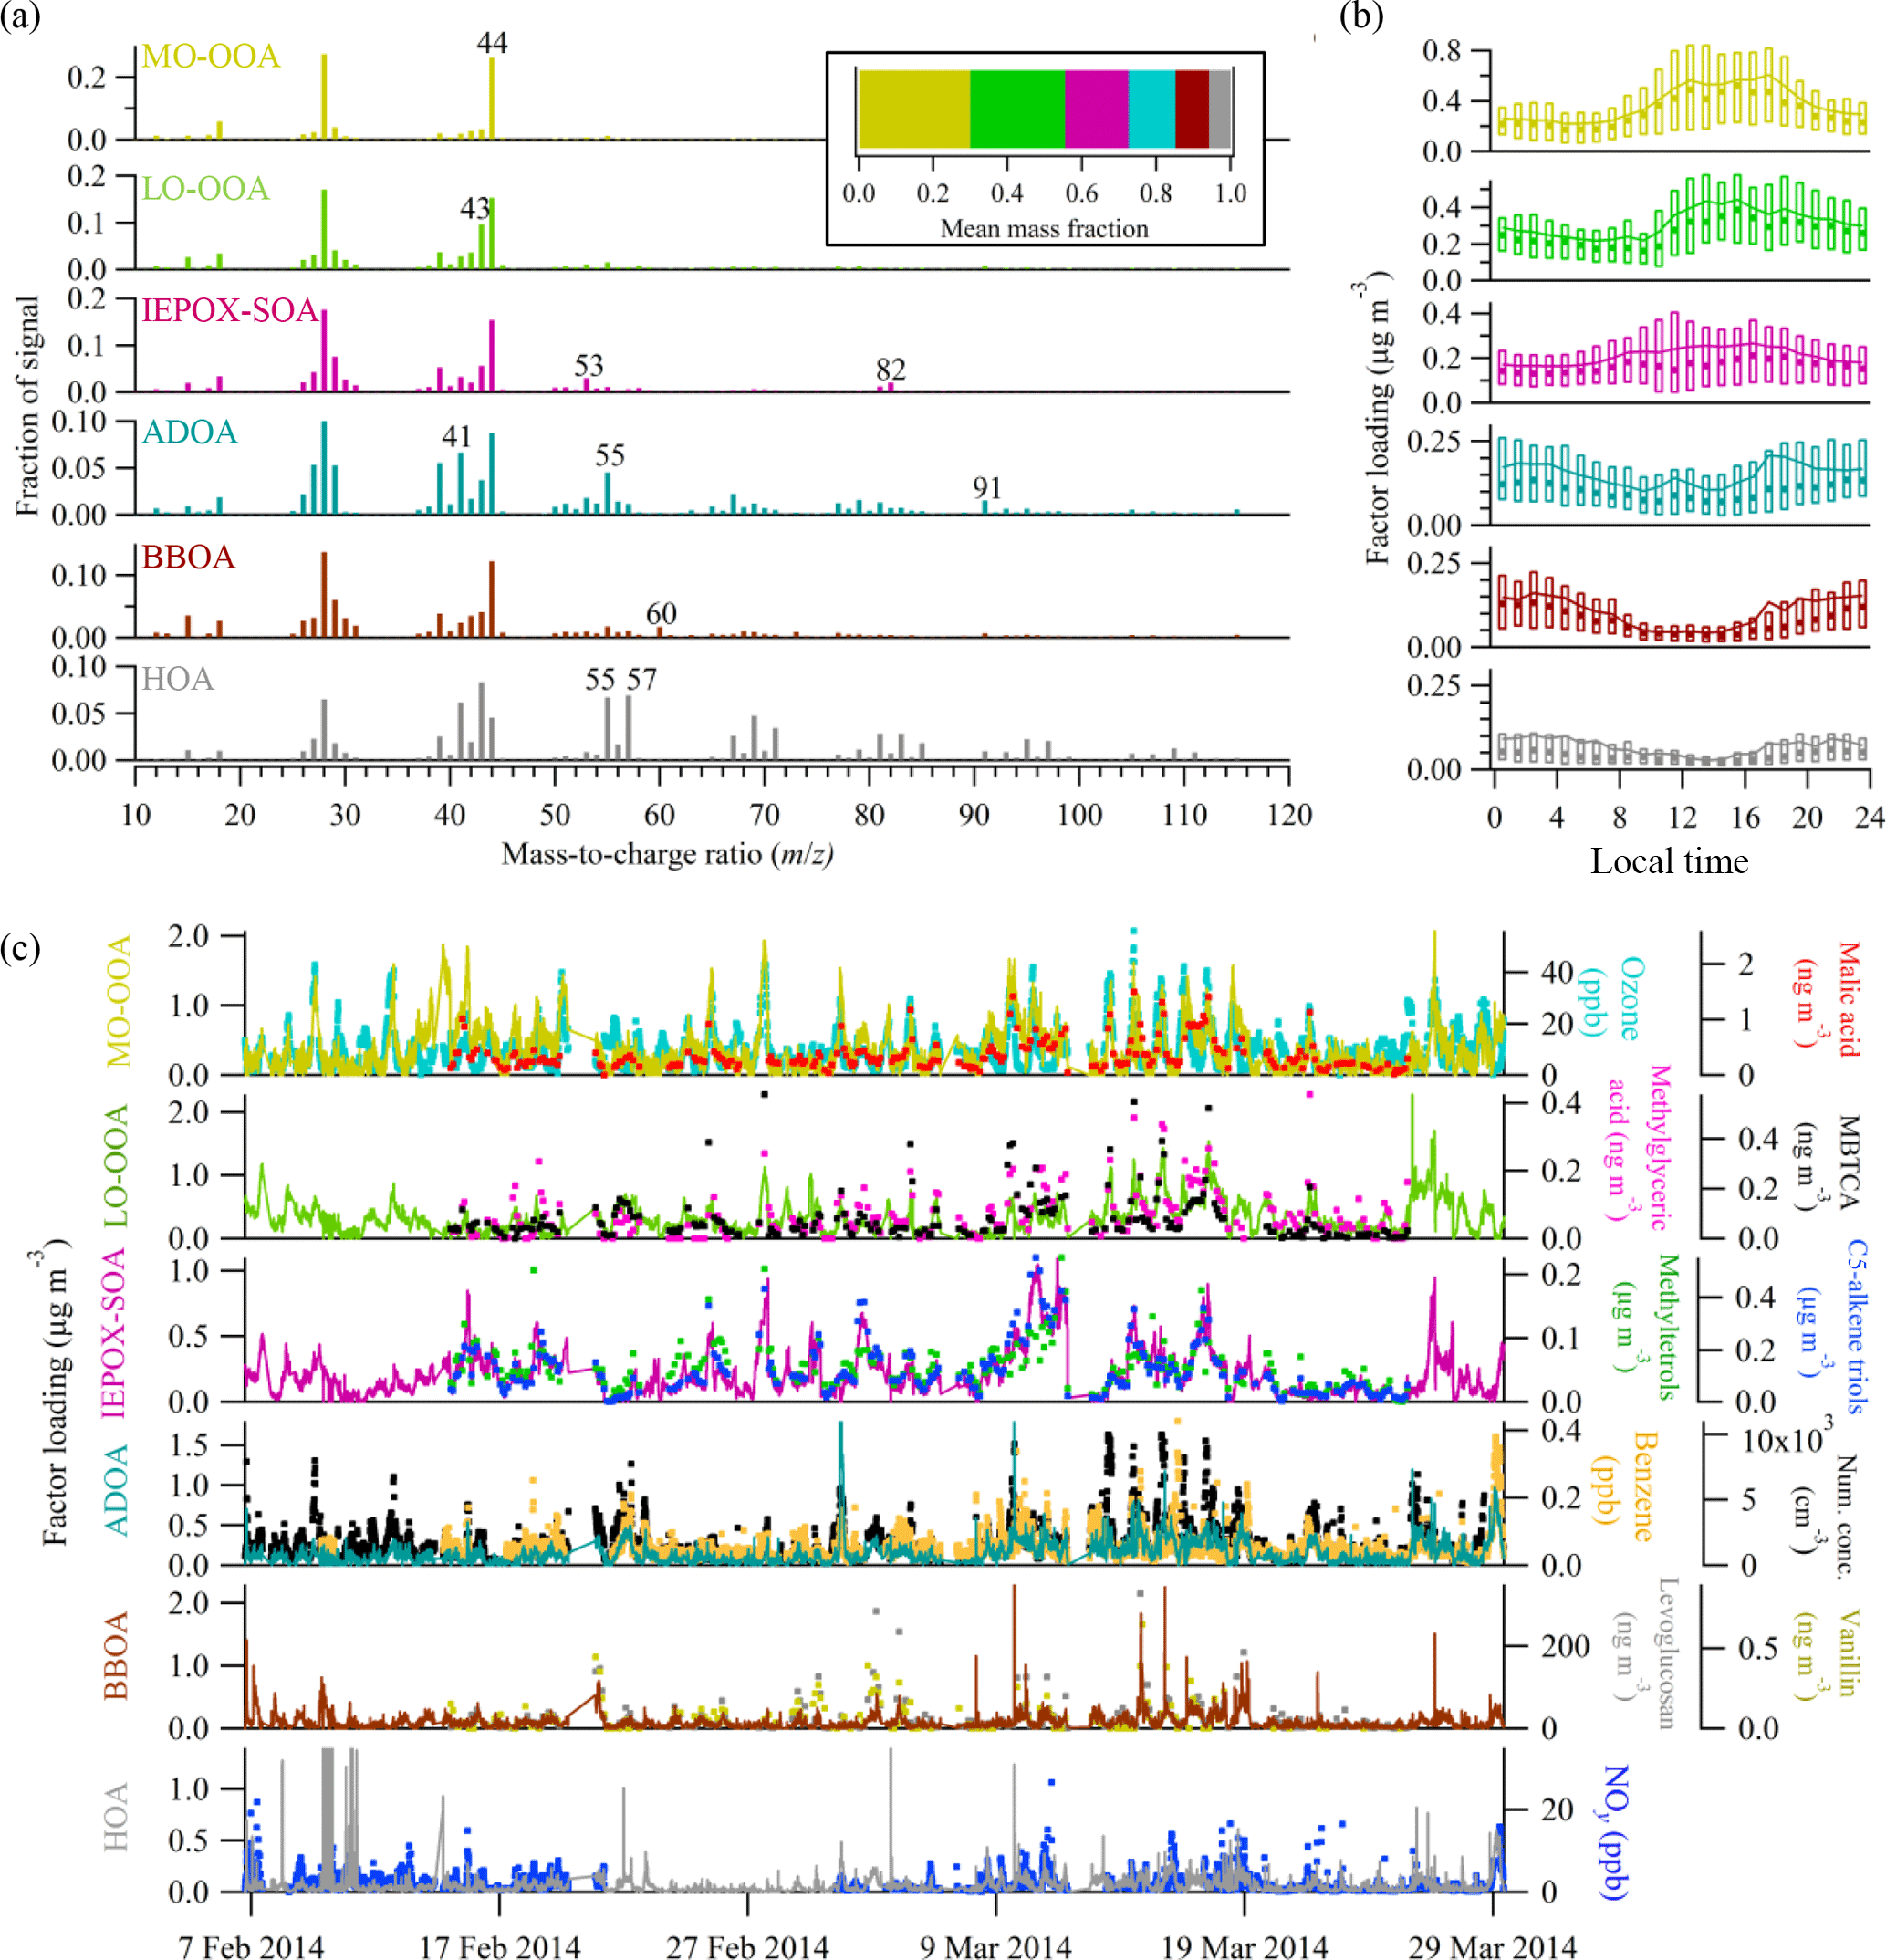
Figure 4Results of the PMF analysis on the time series of AMS organic mass spectra collected at T3. (a) Mass spectral profile of each factor represented at unit mass resolution. The inset shows the mean fractional loading of each factor. (b) Diel trends for the loadings of each PMF factor. Local time is UTC minus 4 h. Lines represent means, solid markers show medians, and boxes span the interquartile ranges. (c) Time series of the factor loadings (left axis) and other related measurements at T3 (right axis). Methyl-butyl-tricarboxylic acid is abbreviated as MBTCA.
3.2 Characterization of organic PM by positive-matrix factorization
Positive-matrix factorization was applied to the time series of the organic component of the high-resolution mass spectra (Ulbrich et al., 2009b). Diagnostics of the PMF analysis are presented in the Supplement (Sect. S1; Figs. S3 and S4). Herein, “factor profile” and “factor loading” refer to the mathematical products of the multivariate statistical analysis, whereas “mass spectrum” and “mass concentration” refer to direct measurements.
A six-factor solution was obtained based both on the numerical diagnostics of the PMF algorithm and the judged scientific meaningfulness of the resolved factors (Sect. S1). The factor profiles, diel trends of the factor loadings, and the time series of the factor loadings and other related measurements are plotted in panels (a), (b), and (c) of Fig. 4, respectively. The inset of Fig. 4a shows the mean fractional loading contribution of each factor during the analysis period. The correlations of factor loadings with co-located measurements of gas- and particle-phase species are shown in Fig. 5.
The scientific interpretation of each factor was based on a combination of (i) the characteristics of the factor profile (i.e., “mass spectrum”), as referenced to a worldwide database of AMS spectra and PMF analyses (Ulbrich et al., 2009a, b, c), and (ii) the temporal correlations between the factor loading and other co-located measurements (Fig. 5). Three factors interpreted as primary emissions of organic PM were resolved: an anthropogenic-dominated factor (hereafter, “ADOA”), a biomass burning factor (“BBOA”), and a fossil-fuel hydrocarbon-like factor (“HOA”). Three factors interpreted as secondary production and processing were resolved: a more oxidized oxygenated factor (“MO-OOA”), a less oxidized oxygenated factor (“LO-OOA”), and an isoprene-epoxydiols-derived factor (“IEPOX-SOA”). Figure 5 shows that the correlations of factor loadings with external measurements of gas- and particle-phase species support this interpretation, as detailed in the following discussion for each factor.
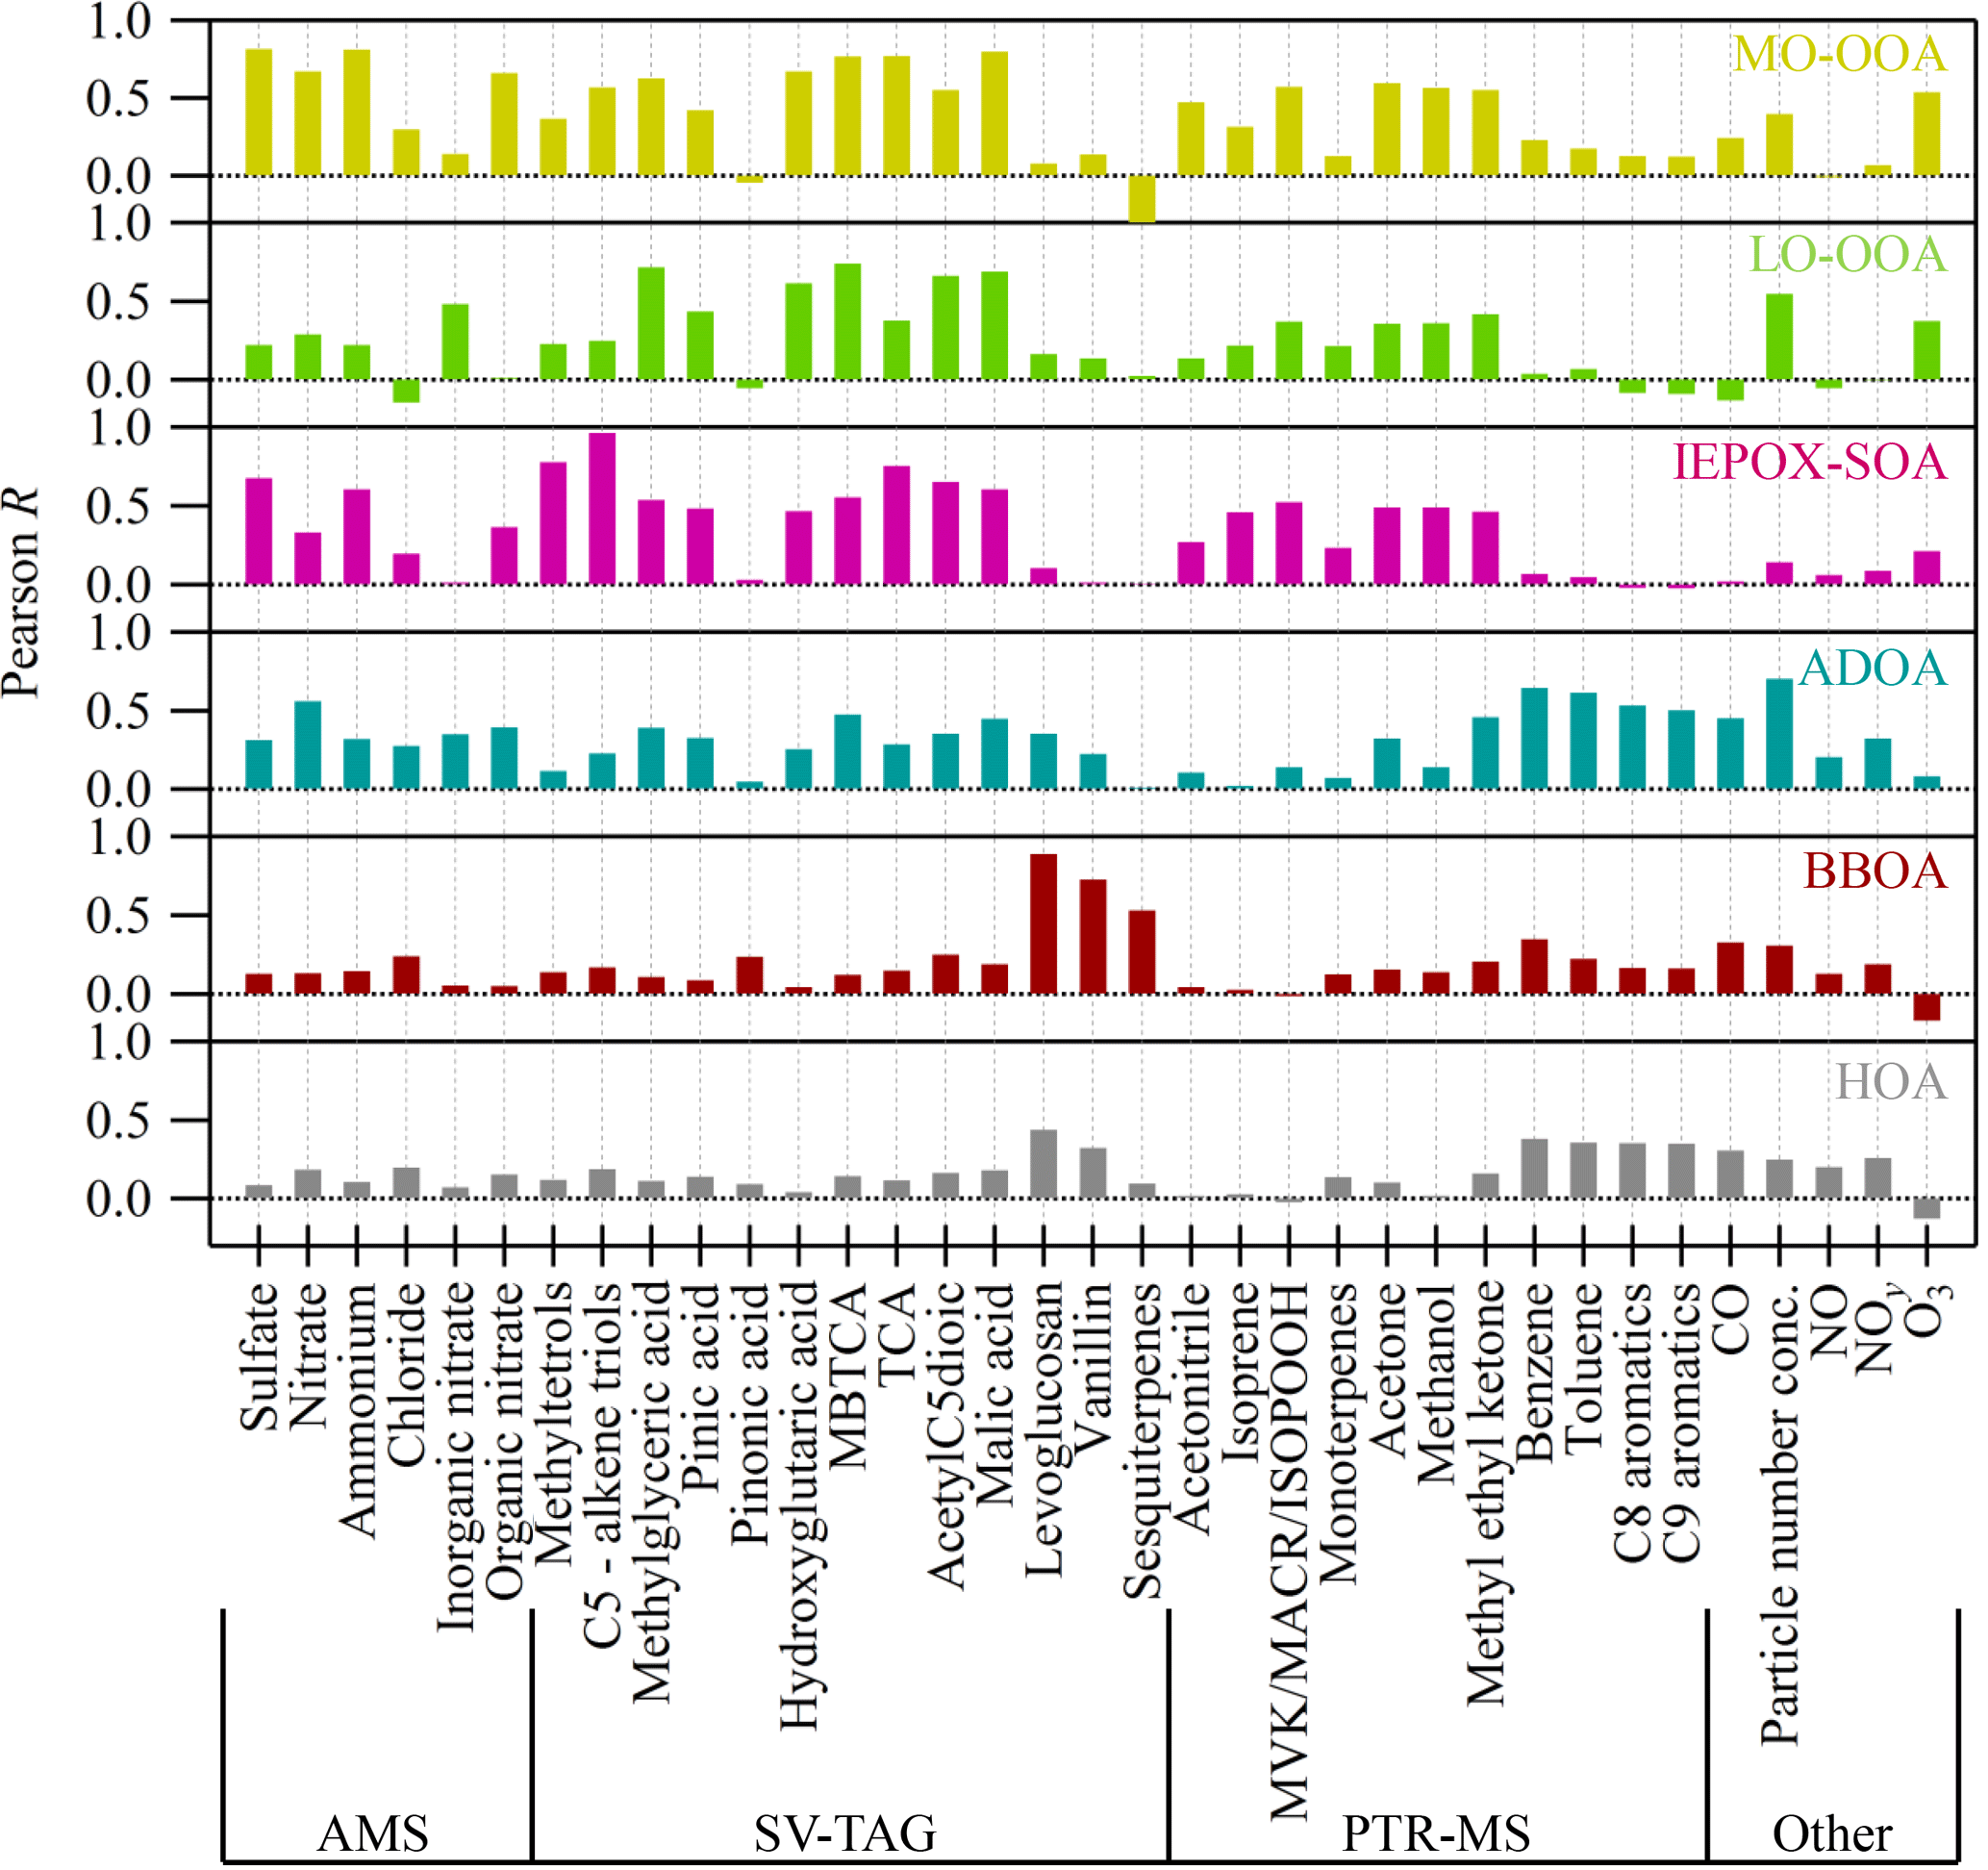
Figure 5Column plot of Pearson R correlations between the loading of each PMF factor and values of selected measurements at T3. Abbreviations include tricarballylic acid (TCA), methyl-butyl-tricarboxylic acid (MBTCA), methyl vinyl ketone (MVK), methacrolein (MACR), and isoprene hydroxyhydroperoxides (ISOPOOH). SV-TAG measurements refer to particle-phase concentrations. Isomers could not be distinguished by PTR-ToF-MS measurements; C8 and C9 aromatics include the xylene and trimethylbenzene isomers, respectively.
Table 1Characteristics of the PMF factors derived from the AMS datasets. Listed are signal fractions at nominal m∕z 44 and oxygen-to-carbon (O : C) and hydrogen-to-carbon (H : C) ratios. Values and associated uncertainties were calculated by running PMF in “bootstrap mode” (Ulbrich et al., 2009b). Elemental ratios were calibrated by the “improved-ambient” method, which has an estimated uncertainty of 12 % for O : C and 4 % for H : C (Canagaratna et al., 2015).
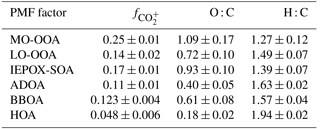
The HOA factor profile had characteristic ions of and at nominal values of m∕z 55 and 57, respectively (Fig. 4a). It had an oxygen-to-carbon (O : C) ratio of 0.18±0.02, the lowest among the six factors (Table 1). In line with the AMS PMF literature, the HOA factor represents a class of primary hydrocarbon-like organic compounds that are typically associated with traffic emissions (Zhang et al., 2005). In the present study, the HOA factor loadings accounted for 6 % of the organic mass concentrations on average (Fig. 4a, inset). As a point of comparison, the average in the southeastern USA typically varies from 9 % to 15 % (Xu et al., 2015b). The lower relative contribution of 6 % in this study might be due in part to the larger relative role of secondary production in a tropical forest environment. In addition, the distance from Manaus to the T3 site might allow time for substantial vertical mixing, dilution, and the subsequent evaporation of primary emissions into entrained background air (Robinson et al., 2007; Y. Liu et al., 2018; Shilling et al., 2018). Finally, the possible differences in emission profiles associated with different types of regional economic development between the Brazilian Amazon and the southeastern USA (e.g., fleet density, fuel matrix, industry, and so forth) should also be considered. The HOA factor loading decreased during the day, which can be explained by the growth of the planetary boundary layer (PBL) and the subsequent dilution of the concentrations of primary emissions (Fig. 4b). The time series of HOA factor loading did not correlate well (R<0.5) with any of the co-located measurements at T3 (Fig. 5). It is plotted alongside the time series of NOy concentration in Fig. 4c.
The BBOA factor profile was characterized by distinct peaks of (m∕z 60) and (m∕z 73), as shown in Fig. 4a. These peaks can be attributed to levoglucosan and other anhydrous sugars that result from biomass pyrolysis (Schneider et al., 2006; Cubison et al., 2011). Correlations of the factor loadings with the mass concentrations of levoglucosan and vanillin (R>0.8) measured by SV-TAG corroborate the association with biomass burning (Figs. 4c, 5). The BBOA factor of this study had an O : C ratio of 0.61±0.08 (Table 1), which is consistent with large contributions from levoglucosan (O : C of 0.83) and similar sugars. The factor loading accounted for 9 % of the organic PM1 mass concentration on average (Fig. 4a, inset). This result is consistent with the low incidence of fires in the Amazon during the wet season (Martin et al., 2016). The BBOA factor loading typically decreased during the day (Fig. 4b), which is suggestive of the dilution of local sources during the development of the PBL rather than long-range transport. Emissions from local fires around T3, including trash and tree burning, as well as from wood-fueled brick kilns along the road from Manaus to T3 might have contributed to this factor.
The ADOA factor profile, distinguished prominently by the ion at m∕z 91, also had characteristic ions of at m∕z 55 and at m∕z 41 (Fig. 4a). A peak at m∕z 91 can arise from many sources, including biogenic and anthropogenic emissions (Ng et al., 2011b). Therefore, elevated signal intensity m∕z 91 in itself does not serve as a tracer for a specific source or process without consideration of the atmospheric context. Factors with a characteristic m∕z 91 peak (usually labeled “91fac”) have typically been associated with biogenic emissions (Robinson et al., 2011; Budisulistiorini et al., 2015; Chen et al., 2015; Riva et al., 2016). However, the ADOA factor profile of this study more strongly resembles the mass spectra previously reported for PM emissions from cooking activities (Lanz et al., 2007; Mohr et al., 2012) than those from “91fac” (Sect. S1; Fig. S5). The ratio of m∕z 55 to m∕z 57 of the ADOA factor was 4.1. This ratio lies in the range of 2 to 10 reported for several factors representing primary cooking emissions and is well above the range of 0.8 to 1.4 reported for factors associated with traffic emissions, such as the HOA factor (Mohr et al., 2012 and references therein; Hu et al., 2016). Even though the ADOA factor profile has a large contribution from non-oxygenated ions, similar to the HOA factor and consistent with a dominance by primary emissions, it also contains considerable signal from oxygenated ions, resulting in a relatively higher O : C of 0.40±0.05 (Table 1). The factor loading accounted for 13 % of the organic PM1 mass concentration on average (Fig. 4a, inset). The factor loading decreased as the PBL developed during the day, consistent with dominant non-photochemical, primary sources (Fig. 4b). Furthermore, there were small increases in factor loading at 12:00 and 18:00 LT (local time), suggestive of breakfast-time and lunch-time cooking activities in Manaus based on a transport time of 4 to 6 h between the city and the T3 site (Martin et al., 2016; Cirino et al., 2018). Manaus typically has four rush hour periods each day from 06:30 to 08:00, 12:00 to 13:30, 16:30 to 18:30, and 21:00 to 22:00 LT. Therefore, heavy traffic at these hours may also have contributed to the ADOA factor. Correlations between factor loading and external measurements exceeded R=0.5 for many anthropogenic markers, including concentrations of aromatics (e.g., benzene, toluene, and C8 and C9 species), carbon monoxide, particle count, and NOy (Figs. 4c, 5). Contributions from secondary processes cannot be ruled out, and PM production from anthropogenic VOCs might also have been captured in this factor. Overall, the ADOA factor was interpreted in the present study as an indicator of anthropogenic influence associated with several sources in Manaus, most importantly cooking and possibly traffic emissions.
The IEPOX-SOA factor profile had marker ions of (m∕z 53) and C5H6O+ (m∕z 82) (Fig. 4a; Lin et al., 2012; Hu et al., 2015; de Sá et al., 2017). Furthermore, it had an O : C ratio of 0.9±0.10 (Table 1). The factor loading accounted for 17 % of the organic PM1 mass concentration on average (Fig. 4a, inset). There were high correlations (R>0.8) between factor loadings and concentrations of C5-alkenetriols and 2-methyltetrols, which are markers of IEPOX-derived PM, produced by the photooxidation of isoprene under HO2-dominant conditions (Surratt et al., 2010; Lin et al., 2012; Fig. 4c). The increase in factor loading during daytime was consistent with a photochemical source (Fig. 4b). There were also correlations between factor loadings and concentrations of sulfate and some acids, such as tricarballylic acid (TCA; Fig. 5), which is in agreement with the association of IEPOX-derived PM and sulfate/acidity observed in other studies (Budisulistiorini et al., 2013; Nguyen et al., 2014; Kuwata et al., 2015). Therefore, this factor was interpreted as representative of PM produced from isoprene photooxidation under HO2-dominant conditions. The effects of urban pollution on the loadings of this factor were the focus of a previous publication (de Sá et al., 2017).
The two remaining factors, LO-OOA and MO-OOA, were also associated with secondary atmospheric processes. The LO-OOA and MO-OOA factors had O : C ratios of 0.72±0.10 and 1.09±0.17, respectively. The LO-OOA factor was characterized by the greatest ratio of signal intensity of the C2H3O+ ion (m∕z 43) to that of the ion (m∕z 44) (Fig. 4a) compared with all other factors. This factor is usually attributed to lower generation, less oxidized, higher volatility secondary organic PM (Jimenez et al., 2009). By comparison, the MO-OOA factor profile had the strongest (m∕z 44) peak among all factors (Fig. 4a). This factor is usually attributed to higher generation, more oxidized, less volatile secondary organic PM or extensively oxidized primary PM of any type that has resided in the atmosphere for several days or more (Jimenez et al., 2009).
The LO-OOA factor loading accounted for 25 % of the organic PM1 mass concentration on average (Fig. 4a, inset). The factor loading correlated better with the estimated concentrations of inorganic nitrate than with organic or total nitrate (Fig. 5; Sect. S2 and Fig. S6), which is consistent with the interpretation of the higher volatility associated with this factor (Jimenez et al., 2009; Zhang et al., 2011). The factor loading also correlated (R>0.7) with the concentrations of 2-methylglyceric acid and methyl-butyl-tricarboxylic acid (MBTCA), which are products of isoprene and monoterpene oxidation, respectively, under NO-dominant conditions (Figs. 4c, 5). The factor loading increased starting at 09:00 LT and peaked in the afternoon hours (Fig. 4b). This diel trend, tied to the sunlight cycle, tracked the typical daily emission patterns of isoprene and monoterpenes from the surrounding forest (Yáñez-Serrano et al., 2015). The absence of a sharp decline at sunset and higher variability at nighttime may also indicate a contribution from terpene ozonolysis. For these several reasons, the LO-OOA factor was interpreted herein as secondary organic PM produced mostly within several hours of observations by many possible pathways. Some of the inferred pathways include the following: (i) the photooxidation of isoprene along non-IEPOX pathways, (ii) the photooxidation of terpenes and other biogenic VOCs along both HO2- and NO-dominant reaction pathways, (iii) the ozonolysis of terpenes, and (iv) the possible production of SOM from anthropogenic emissions from Manaus.
The MO-OOA factor loading accounted for 30 % of the organic PM1 mass concentration on average (Fig. 4a, inset). The factor loading correlated (R>0.7) with the mass concentrations of several particle-phase carboxylic acids as well as the concentrations of sulfate, ammonium, and ozone (Fig. 5). The time series of malic acid and ozone concentrations are shown alongside the MO-OOA factor loadings in Fig. 4c. Malic acid is a highly oxidized compound (O : C of 1.25), which may have many different sources (Röhrl and Lammel, 2002; van Pinxteren et al., 2014). The MO-OOA factor loading increased starting at 08:00 LT (sunrise was at 06:00 LT) and peaked between 10:00 and 16:00 LT. There was a large variability in the factor loading in the afternoon hours among different days (Fig. 4b). The afternoon increase and day-to-day variability were consistent with strong but variable photochemical processing leading to further oxidation of organic PM during the day, depending on daily weather. The high O : C of 1.09±0.17 could also be indicative of production of PM from aromatic compounds emitted from Manaus (Chhabra et al., 2011; Lambe et al., 2011). Overall, this factor was interpreted as representing highly oxidized PM from multiple processes. Species initially associated with HOA, BBOA, ADOA, IEPOX-SOA, and LO-OOA factors may converge after sufficient atmospheric oxidation to become represented by the MO-OOA factor (Jimenez et al., 2009; Palm et al., 2018).
3.3 Shifts in PM with anthropogenic influences
3.3.1 Cluster analysis
To further investigate changes in the concentration and composition of PM associated with anthropogenic influences, a fuzzy c-means (FCM) algorithm was applied to the time series of concentrations of particle number, NOy, ozone, black carbon, and sulfate measurements at the T3 site (Bezdek et al., 1984). The analysis was fully independent of the PMF results. For each point in time, these concentrations represented the spatial coordinates of the data point. As discussed below, four clusters were identified. Based on measures of spatial similarity, the clustering algorithm attributed a degree of membership relative to each of the four clusters to each data point (Sect. S3; Figs. S7 and S8).
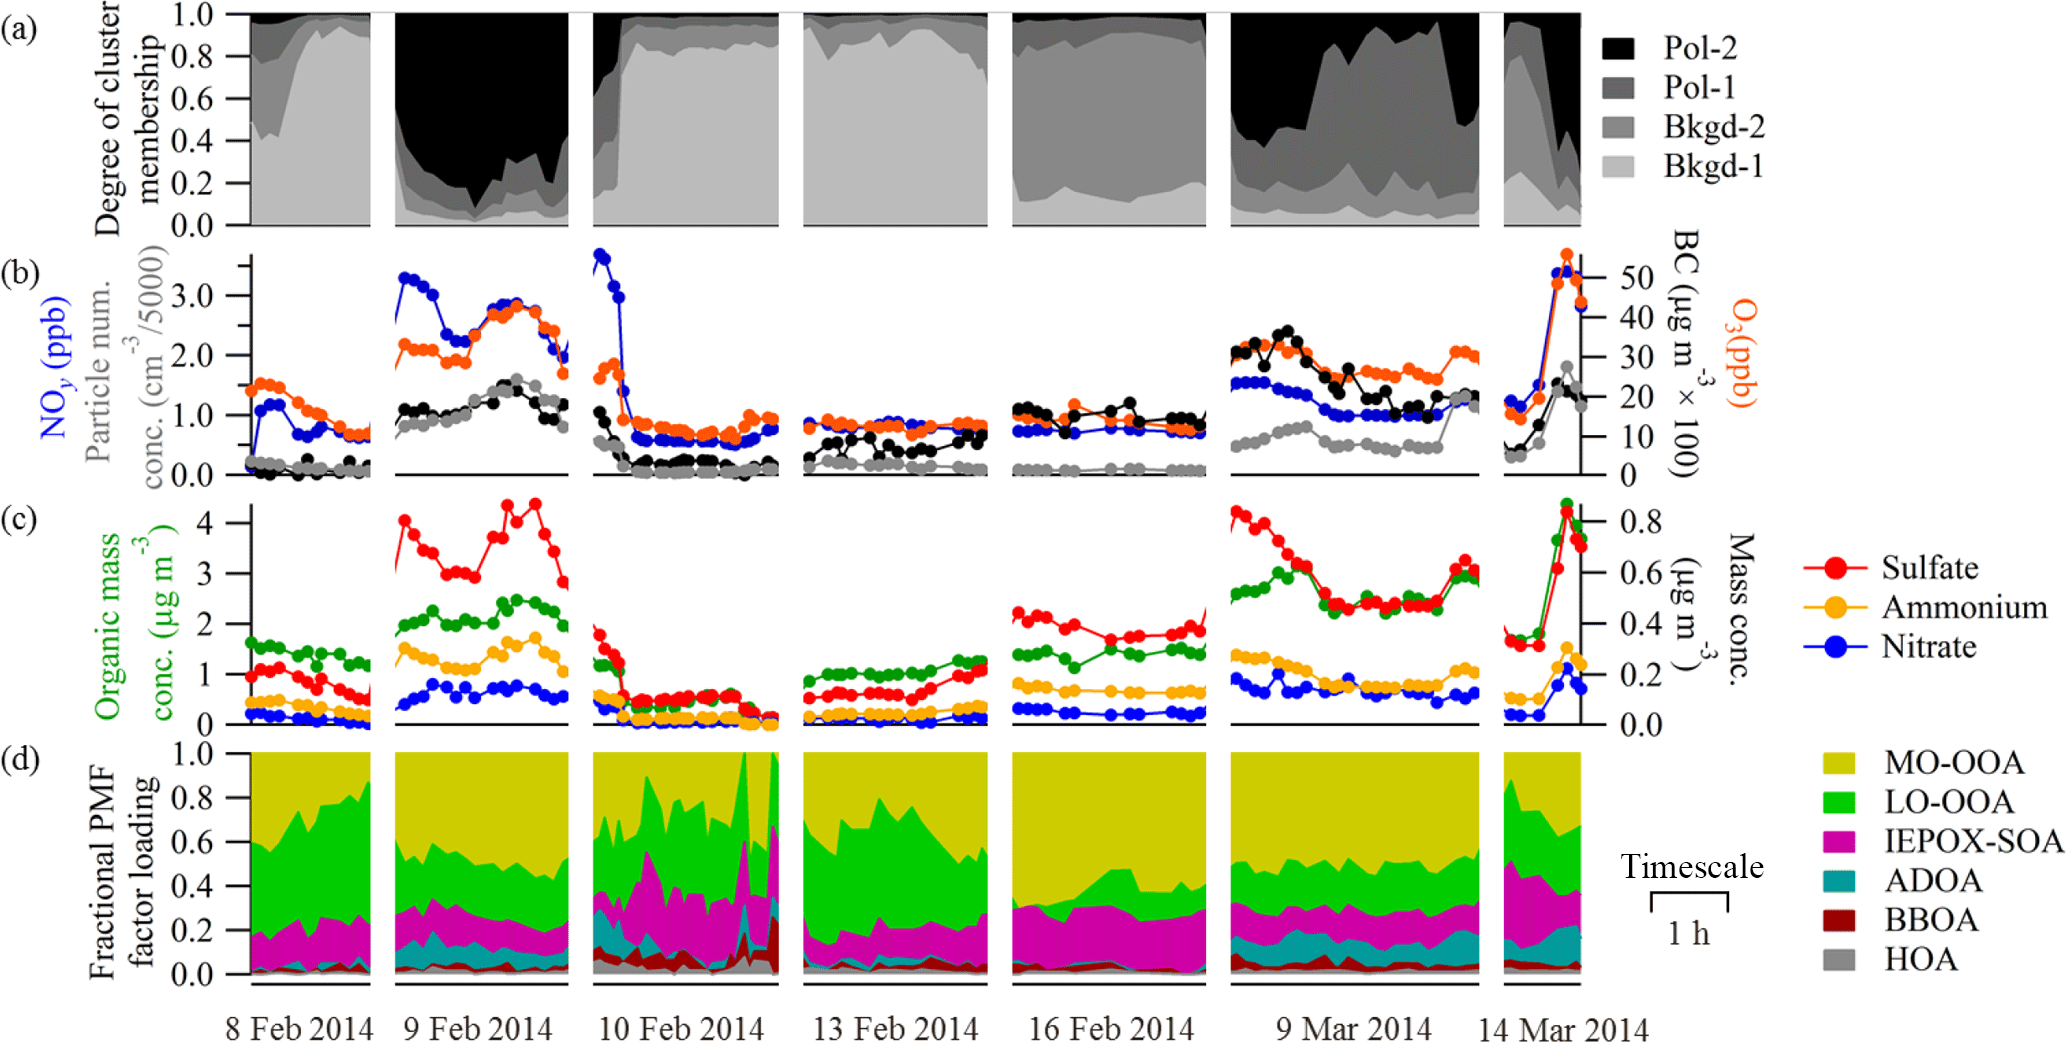
Figure 6Results of the cluster analysis by fuzzy c-means (FCM) for afternoon periods (12:00 to 16:00 LT) are presented by several case studies. (a) The degree of membership in each of the four clusters. The sum of the degrees of membership across all clusters is unity. Background conditions are abbreviated as “Bkgd”, and polluted conditions are abbreviated as “Pol”. (b) Pollution indicators: concentrations of NOy, O3, black carbon (BC), and particle number count are plotted. (c) PM1 mass concentrations for organic, sulfate, nitrate, and ammonium species. (d) Fractional contribution of each factor to total organic PM1.
The scope of the clustering analysis was restricted to afternoon time points for which 10-hour air mass back trajectories did not intersect significant precipitation and for which solar irradiance at T3 averaged over the previous 4 h was higher than 200 W m−2 (Sect. S3). This scope aimed at capturing fair-weather conditions and thereby minimizing the role of otherwise confounding processes, such as boundary layer dynamics and wet deposition. However, the elimination of trajectories containing precipitation should not be regarded as fully accurate given the uncertainties in the HYSPLIT trajectories. The scoped dataset spanned 24 afternoons.
Four clusters were identified based on minimization of the FCM objective function as well as a subjective assessment of the meaningful interpretation of the set of clusters (Sect. S3). The FCM algorithm returned a matrix containing the degrees of membership (ranging from 0 to 1) to each of the four clusters (columns) for each point in time (rows). For any given time point (i.e., row), the sum of its degrees of membership to clusters (i.e., sum across columns) was always unity, by definition. A collection of examples, representing 37 % of the analyzed data points by FCM, is shown in Fig. 6a. For times predominantly associated with only one cluster (e.g., 9 and 10 February), the corresponding air mass back trajectories are plotted in Fig. 7. The FCM algorithm also returned the coordinates of cluster centroids, which are listed in Table 2.
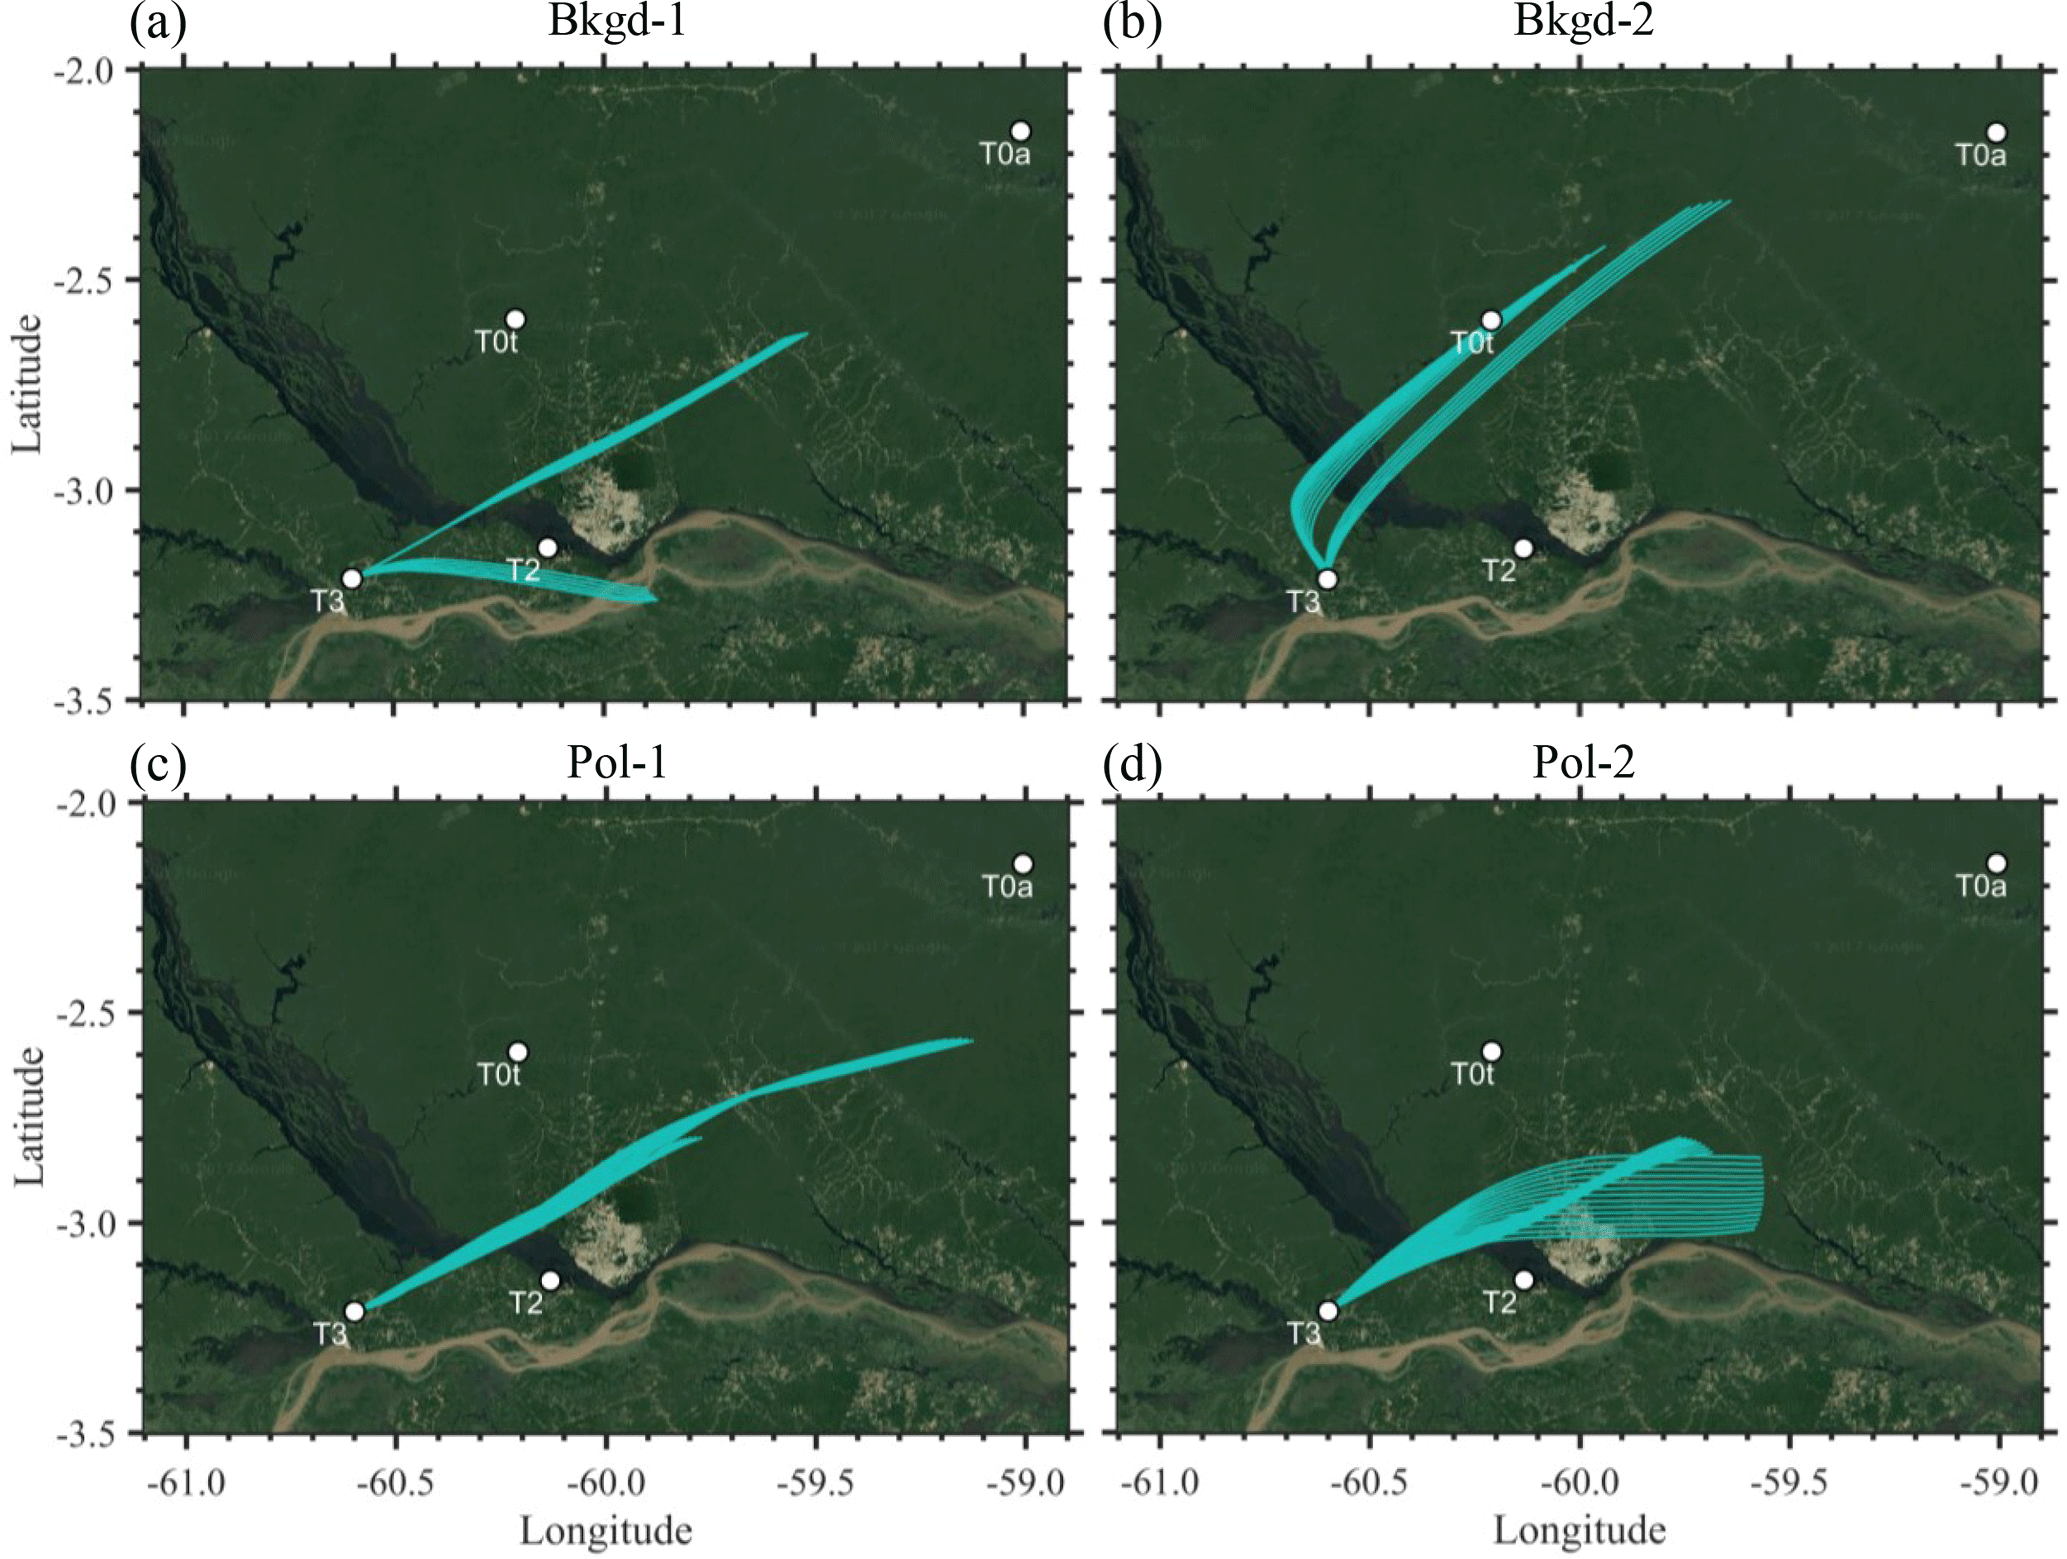
Figure 7Air mass back trajectories associated with the four clusters of the FCM analysis for the case studies in Fig. 6. Trajectories were calculated using HYSPLIT 4 in steps of 12 min for 10 h (Draxler and Hess, 1998). Image data: Google Earth.
Two clusters of data were interpreted as “background” and labeled “Bkgd-1” and “Bkgd-2”. They were characterized by NOy<1 ppb, ozone <20 ppb, and particle number <1200 cm−3 (Table 2; Fig. 6). The two clusters primarily differed in that Bkgd-2 had significantly larger concentrations of sulfate and black carbon. A comparison of the datasets of 13 February 2014 (predominantly Bkgd-1) and 16 February 2014 (predominantly Bkgd-2) in Fig. 6 highlights these differences. Concentrations of sulfate and black carbon were 0.15 and 0.10 µg m−3, respectively, on 13 February, compared with 0.40 and 0.15 µg m−3 on 16 February. The back trajectories associated with Bkgd-1 had both northeasterly and southeasterly components. The wind fields, out of line with the trade winds, may suggest passage through recent weather systems and may imply wet deposition, which in turn might explain lower gas and particle concentrations (Table 2). These recent weather systems might not have been excluded from the scoped dataset because of inaccuracies in the intersections of the back trajectories with precipitation data, as discussed above, or because they were more distant than captured by the 10 h back trajectories. Consistent with this hypothesis, the centroid value of the solar irradiance at T3 averaged across 4 h (Sect. 3.3.2) was lower for Bkgd-1 (400 W m−2) compared to that of the other clusters (600 W m−2), suggesting an association of Bkgd-1 with overcast conditions. By comparison, the back trajectories associated with Bkgd-2 were predominantly from the northeast, coming from the direction of the T0t and T0a sites (Fig. 7), in line with the dominant trade winds of the wet season. The air masses of Bkgd-2 may have experienced less wet deposition and may represent more extensive atmospheric oxidation than those of Bkgd-1. They may also have carried PM contributions from out-of-basin sources, which would be consistent with the higher sulfate and black carbon concentrations of Bkgd-2 compared to those of Bkgd-1 (Chen et al., 2009; Pöhlker et al., 2018).
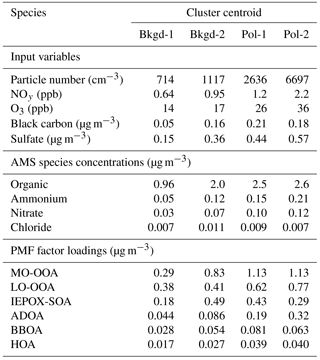
Table 2Coordinates of cluster centroids for input variables, AMS species concentrations, and PMF factor loadings. Table entries for AMS species and PMF factors are plotted in Fig. 8. The AMS species concentrations (except for sulfate) and the PMF factor loadings were not used as input variables in the FCM clustering analysis.
Two other clusters were interpreted as “polluted” and labeled “Pol-1” and “Pol-2”. They were characterized by concentrations of NOy > 1 ppb, ozone > 20 ppb, and particle number >1200 cm−3 (Table 2; Fig. 6). The dataset of the afternoon of 9 March illustrates a shift in dominance from Pol-2 to Pol-1 (Fig. 6). Although Pol-1 and Pol-2 both have high concentrations of sulfate and other pollutants, they differ in the extent of those high concentrations. The explanation may be that these clusters represent different source regions. Pol-1 may be associated with emissions from the northern region of Manaus, and Pol-2 may be associated with emissions from the southern region of Manaus. Industry, power production, and oil refineries are concentrated in the southeastern region of Manaus (Fig. S9; Medeiros et al., 2017). Population density and commercial activity are concentrated in the southwestern portion of the city where downtown is located (Fig. S10). Aircraft observations show that concentrations of sulfate as well as other pollutants are higher in the urban outflow from the southern compared to the northern region of Manaus (Fig. S10). Directional plots of SO2 and particle number concentrations observed at the T2 site further demonstrate the heterogeneity in Manaus emissions (Fig. S10). This hypothesis of a geographical difference in source regions qualitatively aligns with the differences in back trajectories characteristic of times dominated by Pol-1 and Pol-2 (Fig. 7). However, this interpretation does imply that the back trajectories may have a 20∘ inaccuracy. Such inaccuracy is reasonable for the application of HYSPLIT modeling in this region given (i) the absence of surface weather stations and (ii) the relatively large scale of input wind fields (i.e., 50 km) compared to the scale of modeling (i.e., 70 km from T3 to Manaus and a city cross section of 20 km).
3.3.2 Comparison of PM among clusters
The characteristic PM composition associated with each cluster was determined by calculating the centroid coordinates of the clusters for the AMS species and PMF factors (Sect. S3). The centroid coordinate of a cluster for a given variable is defined as a weighted mean of that variable across all points in time, where the weight is the degree of membership of each data point to that cluster. A comparison of PM1 concentrations and compositions for the four clusters is shown in Fig. 8. Values are listed in Table 2.
The NR-PM1 mass concentrations increased by 25 % to 200 % for clusters Pol-1 and Pol-2 compared with those of clusters Bkgd-1 and Bkgd-2 (Fig. 8a). Increases in sulfate and associated ammonium concentrations had a smaller, yet non-negligible, role in the increased PM1 mass concentrations. Sources of sulfate other than Manaus sustain relatively high concentrations in the Amazon Basin, as represented by the Bkgd-2 cluster (Chen et al., 2009; de Sá et al., 2017). Compared to these regional background concentrations (i.e., Bkgd-2 cluster), the increases in sulfate concentrations were significant only for air masses associated with the heavily industrialized and densely populated southern region of Manaus (i.e., Pol-2 cluster).
Figure 8Characteristic PM composition of the FCM clusters as represented by coordinates of cluster centroids. (a) Mass concentrations of AMS species characteristic of each cluster. (b) PMF factor loadings characteristic of each cluster. Calculations are presented in more detail in the Supplement (Sect. S3). Values plotted are shown in Table 2.
With respect to the composition of the organic PM, Fig. 8b shows that the Bkgd-1 cluster had a large contribution from the LO-OOA factor. By comparison, the Bkgd-2 cluster had larger contributions from the MO-OOA and IEPOX-SOA factors. A comparison of the results for 13 and 16 February of 2014 (Fig. 6d) illustrates these findings. The low mass concentrations and the dominant contribution by the LO-OOA factor suggest that the Bkgd-1 cluster may represent conditions under which secondary organic PM was produced within recent hours through photooxidation of VOCs emitted by the forest and subsequent condensation of secondary organic material. The low sulfate concentrations for Bkgd-1 may rationalize the absence of a significant contribution by the IEPOX-SOA factor. Isoprene photooxidation may have contributed to PM production via pathways other than IEPOX uptake (Krechmer et al., 2015; Riva et al., 2016). By comparison, for Bkgd-2, the higher mass concentrations and the greater contributions by IEPOX-SOA and MO-OOA factors suggest that this cluster may represent conditions under which secondary organic PM was a combination of material produced both on that day and on previous days. During transport, the organic PM may have undergone extensive atmospheric oxidation by a combination of surface and condensed-phase chemistry, including cloud water processes (Carlton et al., 2006; Ervens et al., 2011; Hoyle et al., 2011; Perraud et al., 2012). Therefore, concentrations and composition of the Bkgd-2 cluster may represent an extensive geographical footprint.
The organic PM concentration and composition associated with the Pol-1 and Pol-2 clusters were distinct from those of the Bkgd-1 and Bkgd-2 clusters (Fig. 8). The mass concentrations of organic PM were greater by 25 % to 150 % for Pol-1 and Pol-2. According to the PMF factors (Fig. 8b), the larger part of this increase in organic PM between the background and polluted clusters was tied to the production of secondary organic PM, although primary emissions also contributed significantly. By comparison, for both Bkgd-1 and Bkgd-2 clusters, contributions by primary emissions were negligible, as indicated by the low summed contribution of factors of primary origin (i.e., ADOA, BBOA, and HOA) to the organic PM1 (<10 %). For Pol-1 and Pol-2, the ADOA factor loading accounted for 10 % of the organic mass concentration at T3 on average, serving as a strong marker of Manaus pollution. A comparison of the results for 9 February and 9 March with those of 13 and 16 February illustrates these findings (Fig. 6d).
With regard to secondary organic PM, the IEPOX-SOA factor loading decreased by almost 50 % under polluted compared with background conditions. The study of de Sá et al. (2017) attributed this decrease to the suppression of IEPOX production by elevated NO concentrations. This suppression typically outweighed possible enhancements in IEPOX uptake and subsequent PM production because of elevated sulfate concentrations. By contrast, the LO-OOA and MO-OOA factor loadings increased by 50 % to 100 % under polluted conditions. These increases exceeded the decrease in IEPOX-SOA factor loadings, resulting in a net increase of around 100 % in mass concentration of secondary organic PM (Fig. 8).
The shifts in the processes governing the production of secondary organic PM because of increased NOx, OH, and O3 concentrations characteristic of the pollution plume were complex and nonlinear (Fig. 9a). Overall, the oxidation pathways were driven faster. The relatively high values and O : C ratios of all factors (Table 1), including those associated with primary emissions, compared to typical values at other locations worldwide (Canagaratna et al., 2015), corroborate this interpretation. Ozone concentrations in the plume increase by 200 % to 300 %, and hydroxyl radical concentrations increased by 250 % or more (Y. Liu et al., 2018). As HO2 pathways were suppressed, NO pathways became more active. Increased oxidant concentrations may also have promoted additional multigenerational chemistry of semi- or intermediate-volatility species (Robinson et al., 2007). Oxidation of VOCs by aqueous-phase reactions, including in-cloud processing, and the oxidation of biomass burning emissions may also have played roles to varying degrees on different days (Carlton et al., 2006; Ervens et al., 2011; Hoyle et al., 2011; Perraud et al., 2012). In addition, when primary and secondary PM mass concentrations increased, further uptake of oxidized semi-volatile molecules could have been thermodynamically favored according to partitioning theory, representing a positive feedback on the increase of mass concentrations (Pankow, 1994; Odum et al., 1996; Carlton et al., 2010).
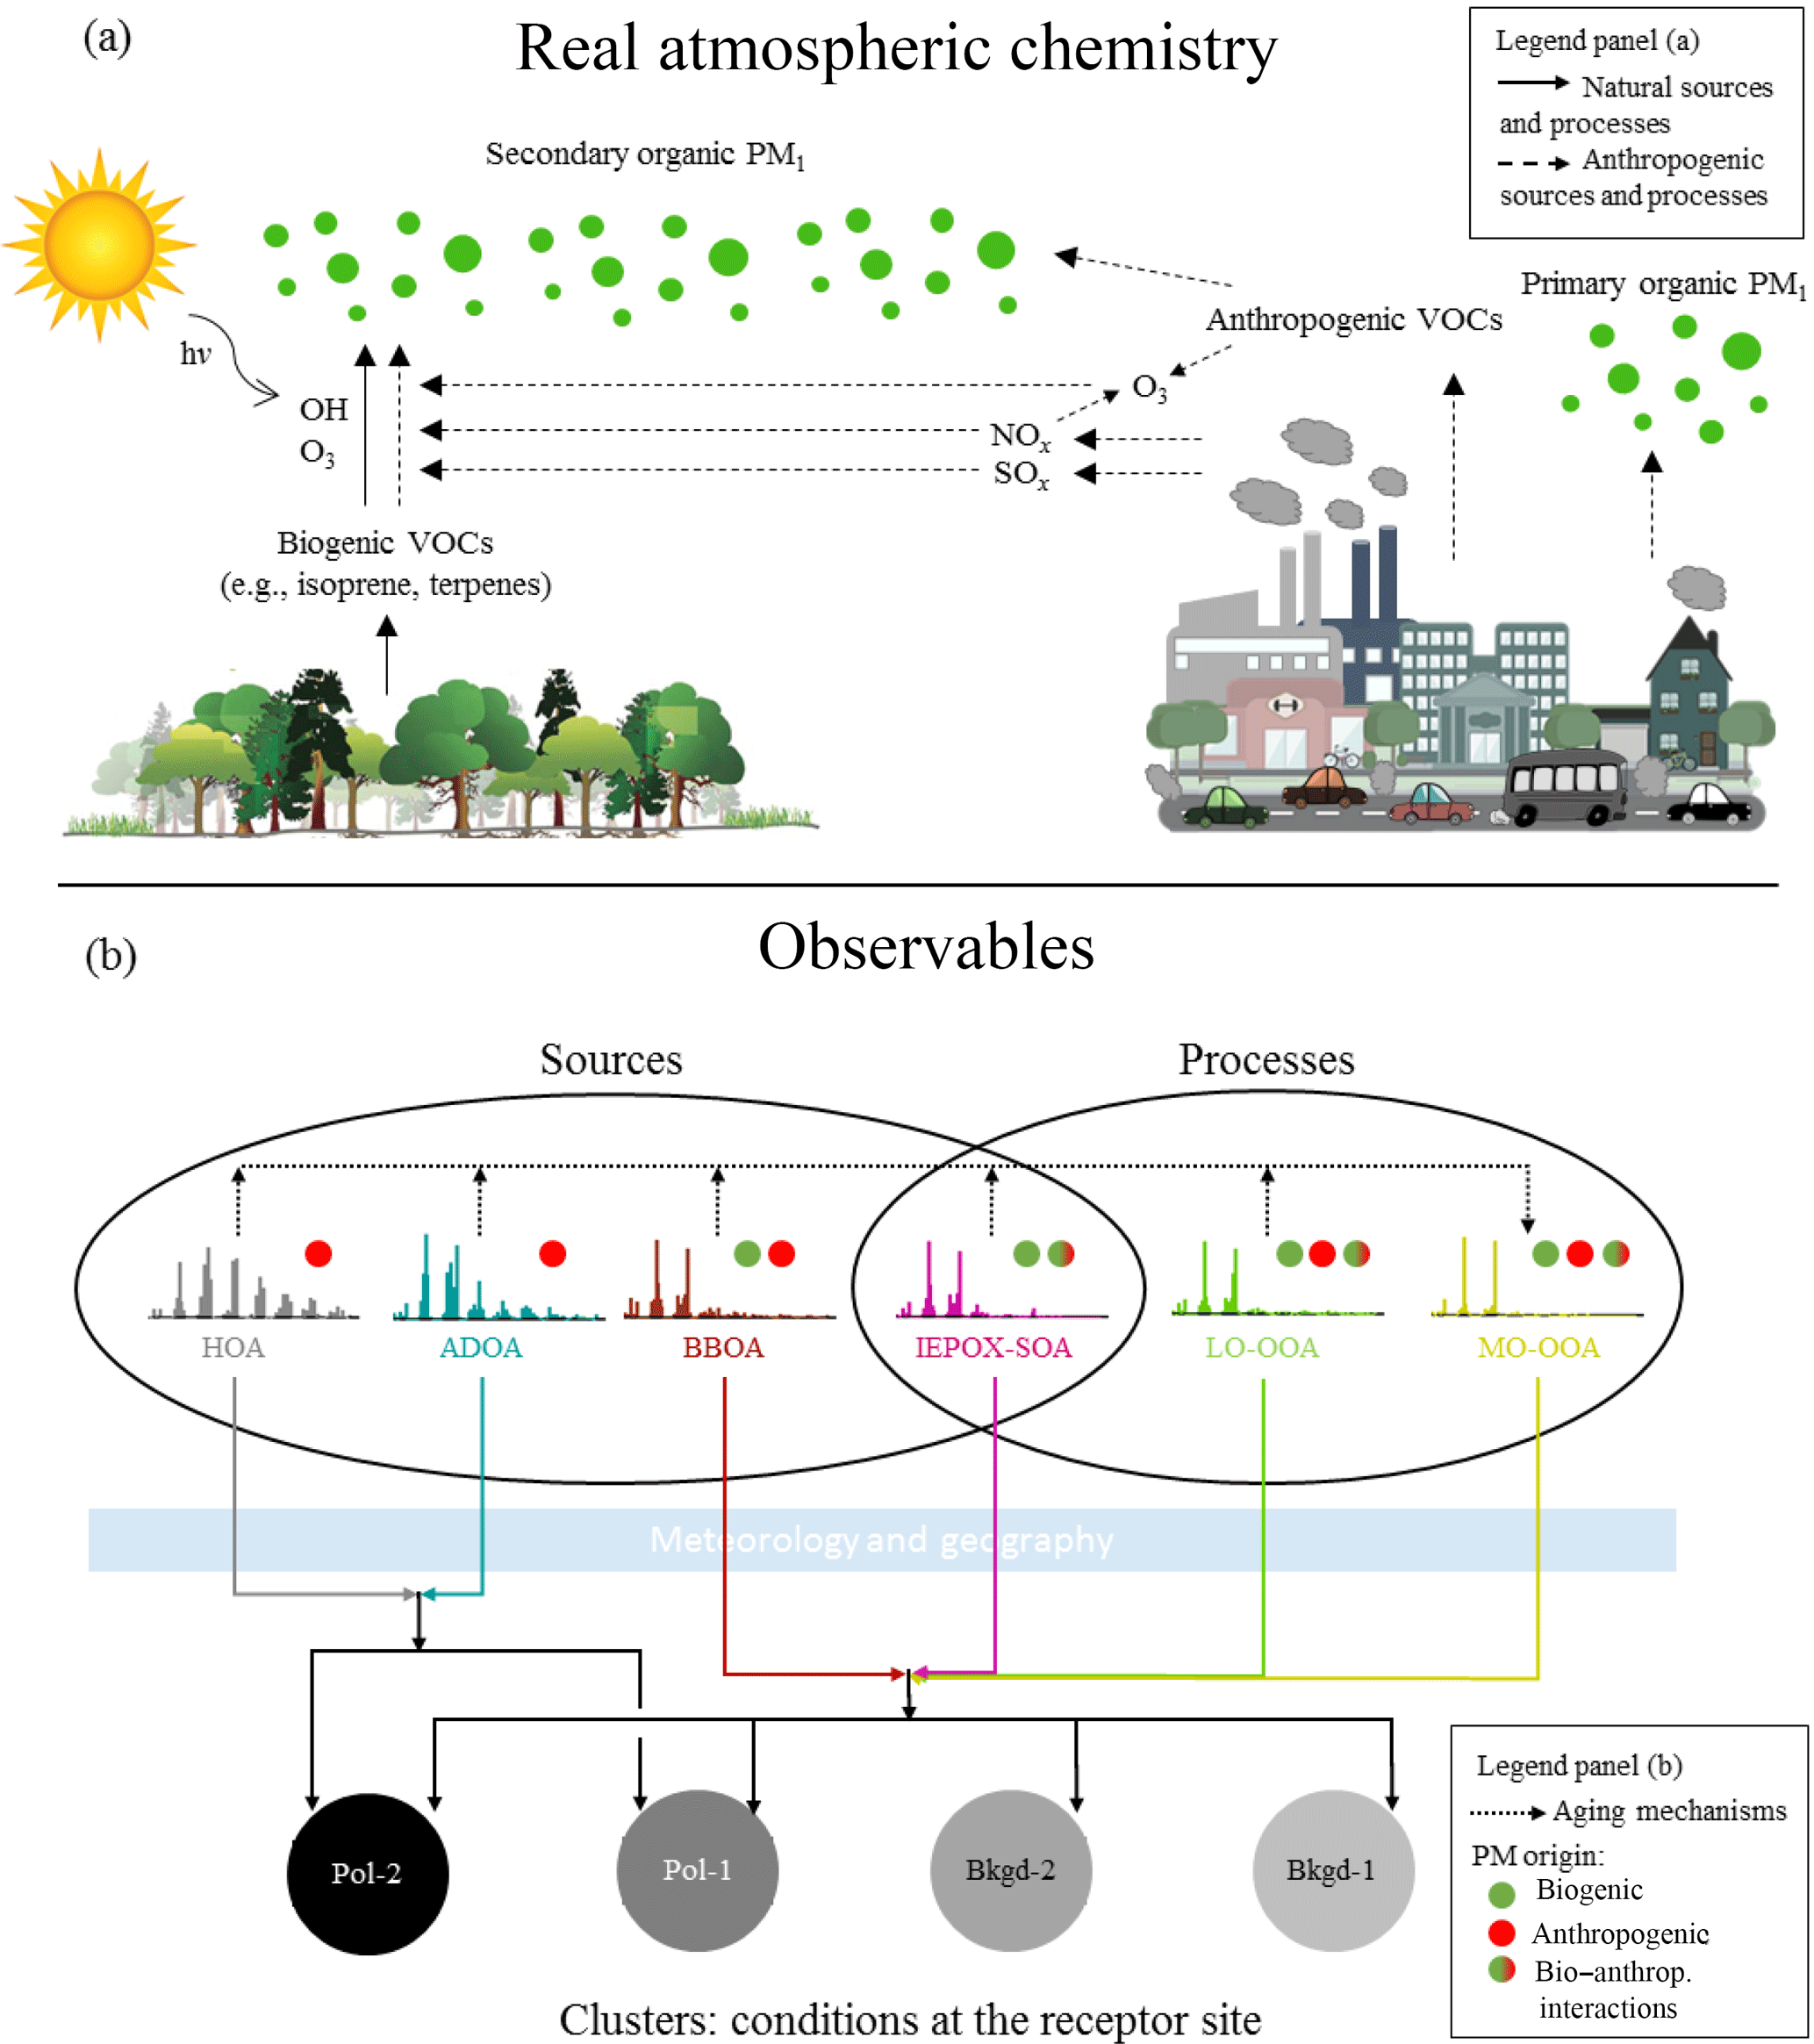
Figure 9Schematic representation of (a) atmospheric processes, illustrated in a simplified manner, associated with the production of organic PM1 and (b) observables of these processes as captured by the datasets and analytical approach employed in this study. In panel (a), the left side depicts the emissions of biogenic volatile organic compounds (VOCs), their atmospheric oxidation, and the production of biogenic secondary organic PM1. The right side depicts anthropogenic emissions of gas species and particulate matter that can alter natural atmospheric concentrations and processes. There are primary organic PM1 emissions from traffic, cooking, and industrial activities. Anthropogenic VOCs can be precursors for the production of secondary organic PM1 and can affect the production of ozone and hydroxyl radicals. NOx emissions directly and indirectly alter the natural pathways of PM1 production in the atmosphere. NOx and SOx can also directly contribute to the formation of secondary inorganic PM1 (not shown), which can in turn play a role in changing pathways of secondary organic PM1 production. In panel (b), different PMF factors represent distinct sources and/or processes. The IEPOX-SOA factor is at the intersection of the two, as it represents both a source (i.e., isoprene emissions from the forest) and a process (i.e., photooxidation under HO2 dominant conditions, influenced by sulfate concentrations). The dashed black line represents the natural and anthropogenic oxidative processes that transform the chemical signature of the HOA, ADOA, BBOA, IEPOX-SOA, and LO-OOA factors after sufficient atmospheric residence time into the MO-OOA factor. The clusters represent different conditions at the receptor site (i.e., T3); therefore, they incorporate the meteorological and geographical histories of the air masses that reach the site and affect the observed concentrations. The different PMF factors are associated to the different clusters (solid lines) to various extents (not detailed here for simplification purposes; cf. Fig. 8).
The increase in the LO-OOA and MO-OOA factor loadings associated with Pol-1 and Pol-2 indicates that the net effect of this accelerated and modified chemistry was the quick production and further oxidation of secondary organic PM. Precursors may have included both the wide range of biogenic VOCs as well as contributions from anthropogenic precursors, such as gas-phase species from vehicle emissions or evaporated primary material (Nordin et al., 2013; Presto et al., 2014). The LO-OOA factor loading was important for the polluted conditions of Pol-1 and Pol-2 as well as for the clean conditions of Bkgd-1. This result is not necessarily because of a similar molecular composition but rather because of a shared process, i.e., fresh production of secondary organic PM (Fig. 9b). Likewise, the MO-OOA factor loading was important for Pol-1, Pol-2, and Bkgd-2 because this factor represented a shared process, i.e., extensive oxidation (Fig. 9b). In the case of the MO-OOA factor, there is also an overall similar composition characterized by highly oxidized species even as precursor species and subsequent oxidation pathways differed (Jimenez et al., 2009).
The complexity of the real atmospheric processes, as illustrated in Fig. 9, is to some extent captured by the instrumental and analytical tools employed in this study. Positive-matrix factorization identified several broad classes of organic PM. Some PMF factors had sufficiently unique signatures that they could be associated to one specific source and/or process (e.g., HOA and IEPOX-SOA). Other factors, in contrast, represented a wide range of sources that shared processes (e.g., LO-OOA and MO-OOA). The clustering analysis contextualized the PMF results and demonstrated that the effects of the urban pollution were neither limited to nor captured by a single PMF factor. Instead, the urban plume influenced several PMF factors in different ways and to different extents. The implication is that changes in the AMS spectral signature of the organic PM caused by polluted conditions may not be sufficiently unique to allow for its complete separation by PMF analysis alone, especially with respect to the production of secondary organic PM. In this context, the fuzzy c-means analysis served as a useful tool in this study to incorporate auxiliary datasets and further understand anthropogenic influences on PM production and characteristics.
Changes in the concentrations and the composition of fine-mode PM due to the influence of anthropogenic emissions were investigated for the Amazonian wet season. Organic material dominated the submicron composition, consistently representing between 70 % and 80 % of the PM1 mean mass concentration across measurement sites upwind and downwind of Manaus and across different levels of pollution. However, absolute mass concentrations varied significantly among sites. Average concentrations downwind of Manaus were 100 % to 200 % higher than those upwind. Furthest downwind at T3, the organic component was more oxidized than that at the T2 site.
Positive-matrix factorization and fuzzy c-means clustering were applied to the datasets to obtain a composite analysis of the shifts in PM1 concentrations and composition under polluted conditions. Based on the FCM clustering, every point in time at T3 was interpreted as being affected by a combination of four influences, as represented by four clusters. Two background (Bkgd-1 and Bkgd-2) and two polluted (Pol-1 and Pol-2) clusters were identified. Particle mass concentrations were double for polluted compared with background conditions. Contributions from secondary processes dominated (>80 %) for both background and polluted conditions.
In terms of primary emissions, absolute contributions increased by a factor of 5 or more under polluted conditions, corresponding to an increase from <10 % to 15 % of total PM1. The ADOA factor loading increased over 5-fold for the polluted compared with the background clusters; thus, this factor served as a strong tracer of Manaus pollution. BBOA and HOA factor loadings, associated with biomass burning and fossil fuels, respectively, increased 2-fold with pollution. The ADOA factor loading represented 61 % to 76 % of the total primary factor loadings for the Pol-1 and Pol-2 clusters.
Regarding secondary processes, the analysis finds that the pollution plume acted both to shift pathways of secondary organic PM production and to accelerate the atmospheric oxidation of preexisting organic PM. The oxidation of biogenic PM precursors shifted from HO2- to NO-dominant pathways, and the oxidation of anthropogenic precursors possibly contributed to increased PM concentrations. The IEPOX-SOA factor loadings were highest for the Bkgd-2 cluster, associated with long-range transport under background conditions, and decreased by almost 50 % for the polluted clusters, in line with a shift of isoprene oxidation from HO2-dominant to NO-dominant pathways. Concomitantly, the LO-OOA factor loading increased by more than 50 % for these clusters, suggesting rapid in-plume production of secondary organic PM through several pathways. The LO-OOA factor was also important for the Bkgd-1 cluster, associated with fresh background conditions, which is suggestive of recent biogenic organic PM production. The MO-OOA factor had large relative contributions in the Bkgd-2, Pol-1, and Pol-2 clusters, which is suggestive of significant oxidative processing associated with these clusters. Increases of up to 300 % in the MO-OOA factor loadings for Pol-1 and Pol-2 relative to background conditions of Bkgd-1 showed the effects of an accelerated oxidation cycle, leading to highly oxidized PM downwind of Manaus. Based on this and related studies (Y. Liu et al., 2016; de Sá et al., 2017; Martin et al., 2017), the critical lever seems to be increased concentrations of nitrogen oxides in the pollution plume for both directly shifting and indirectly accelerating mechanisms of secondary organic PM production in central Amazonia during the wet season.
The altered composition under anthropogenic influences also affects the physical properties of the PM1. Bateman et al. (2017), using the results of the PMF analysis presented herein, reported a shift from predominantly liquid PM under background conditions to a considerable presence of non-liquid PM under polluted conditions above a relative humidity of 50 %. Non-liquid PM can have different reactive chemistry from liquid PM (Li et al., 2015; P. Liu et al., 2018). A linear relationship between the increase in particle rebound fraction and the sum of ADOA, BBOA, and HOA factor loadings had an R2 of 0.7. The highest individual correlation was with the ADOA factor loading (Adam Bateman, personal communication, 2017). In addition, Thalman et al. (2017), also using the PMF results reported herein, concluded that the larger relative contribution of secondary organic material during the daytime compared with the nighttime was the primary driver of the diel trend of higher particle hygroscopicity during the day compared to the night, as tied to the properties of cloud condensation nuclei.
This study communicates a snapshot of the changes that occur in the atmospheric composition over a tropical forest due to regional urbanization. In the context of a forest in transition (Davidson et al., 2012), the findings of this study provide a quantitative assessment of the effects of urban pollution on the forested surroundings of Manaus. The studied region and the observed changes in atmospheric composition represent a microcosm that might become more widespread through Amazonia as urbanization trends continue in the future. Further investigations of the specific chemical pathways and physical mechanisms that enhance PM production in the urban plume are warranted to understand what other pollutants are critical for control in the context of ongoing and future air quality regulation in the study region as well as for other tropical forested environments worldwide.
The data sets used in this publication are available at the ARM Climate Research Facility database for the GoAmazon2014/5 experiment (https://www.arm.gov/research/campaigns/amf2014goamazon, last access: 1 February 2018).
The supplement related to this article is available online at: https://doi.org/10.5194/acp-18-12185-2018-supplement.
STM, JLJ, MLA, JW, RAFS, AHG, and PA designed, planned, and supervised the broader GoAmazon2014/5 field experiment. SSdS and STM defined the scientific questions and scope of this study. SSdS, BBP, PCJ, DAD, and WH carried out the primary measurements and data processing. GIV, LDY, JB, SC, YL, RT, AS, AF, CS, JES, JS, KAM, HB, GGC, and IOR performed auxiliary data collection/processing and simulations. SSdS, STM, and PA carried out the scientific analysis involving PMF and FCM. SSdS prepared the paper with substantial contributions from STM and additional contributions from all coauthors.
The authors declare that they have no conflict of interest.
This article is part of the special issue “Observations and Modeling of the Green Ocean Amazon (GoAmazon2014/5) (ACP/AMT/GI/GMD inter-journal SI)”. It is not associated with a conference.
Institutional support was provided by the Central Office of
the Large Scale Biosphere Atmosphere Experiment in Amazonia (LBA), the
National Institute of Amazonian Research (INPA), and Amazonas State
University (UEA). We acknowledge support from the Atmospheric Radiation
Measurement (ARM) Climate Research Facility, a user facility of the United
States Department of Energy (DOE; grant no. DE-SC0006680), Office of Science,
sponsored by the Office of Biological and Environmental Research, and
support from the Atmospheric System Research (ASR; grant no. DE-SC0011115,
DE-SC0011105) program of that office. Additional funding was provided by the
Amazonas State Research Foundation (grant no. FAPEAM 062.00568/2014 and 134/2016), the
São Paulo State Research Foundation (grant no. FAPESP 2013/05014-0), the USA
National Science Foundation (grant nos. 1106400 and 1332998), and the Brazilian
Scientific Mobility Program (CsF/CAPES). Suzane S. de Sá acknowledges
support from the Faculty for the Future Fellowship of the Schlumberger
Foundation. Brett B. Palm is grateful for a US EPA STAR Graduate Fellowship
(grant no. FP-91761701-0). The authors thank Paulo Castillo for his assistance in
quality checking the black carbon data from MAOS. Data access from the
Sistema de Proteção da Amazônia (SIPAM) is gratefully
acknowledged. The research was conducted under scientific license
001030/2012-4 of the Brazilian National Council for Scientific and
Technological Development (CNPq).
Edited by: James Allan
Reviewed by: two anonymous referees
Andreae, M. O., Acevedo, O. C., Araùjo, A., Artaxo, P., Barbosa, C. G. G., Barbosa, H. M. J., Brito, J., Carbone, S., Chi, X., Cintra, B. B. L., da Silva, N. F., Dias, N. L., Dias-Júnior, C. Q., Ditas, F., Ditz, R., Godoi, A. F. L., Godoi, R. H. M., Heimann, M., Hoffmann, T., Kesselmeier, J., Könemann, T., Krüger, M. L., Lavric, J. V., Manzi, A. O., Lopes, A. P., Martins, D. L., Mikhailov, E. F., Moran-Zuloaga, D., Nelson, B. W., Nölscher, A. C., Santos Nogueira, D., Piedade, M. T. F., Pöhlker, C., Pöschl, U., Quesada, C. A., Rizzo, L. V., Ro, C.-U., Ruckteschler, N., Sá, L. D. A., de Oliveira Sá, M., Sales, C. B., dos Santos, R. M. N., Saturno, J., Schöngart, J., Sörgel, M., de Souza, C. M., de Souza, R. A. F., Su, H., Targhetta, N., Tóta, J., Trebs, I., Trumbore, S., van Eijck, A., Walter, D., Wang, Z., Weber, B., Williams, J., Winderlich, J., Wittmann, F., Wolff, S., and Yáñez-Serrano, A. M.: The Amazon Tall Tower Observatory (ATTO): overview of pilot measurements on ecosystem ecology, meteorology, trace gases, and aerosols, Atmos. Chem. Phys., 15, 10723–10776, https://doi.org/10.5194/acp-15-10723-2015, 2015.
Artaxo, P., Rizzo, L. V., Brito, J. F., Barbosa, H. M. J., Arana, A., Sena, E. T., Cirino, G. G., Bastos, W., Martin, S. T., and Andreae, M. O.: Atmospheric aerosols in Amazonia and land use change: from natural biogenic to biomass burning conditions, Faraday Discuss., 165, 203–235, https://doi.org/10.1039/C3FD00052D, 2013.
Bateman, A. P., Gong, Z., Harder, T. H., de Sá, S. S., Wang, B., Castillo, P., China, S., Liu, Y., O'Brien, R. E., Palm, B. B., Shiu, H.-W., Cirino, G. G., Thalman, R., Adachi, K., Alexander, M. L., Artaxo, P., Bertram, A. K., Buseck, P. R., Gilles, M. K., Jimenez, J. L., Laskin, A., Manzi, A. O., Sedlacek, A., Souza, R. A. F., Wang, J., Zaveri, R., and Martin, S. T.: Anthropogenic influences on the physical state of submicron particulate matter over a tropical forest, Atmos. Chem. Phys., 17, 1759–1773, https://doi.org/10.5194/acp-17-1759-2017, 2017.
Bezdek, J. C., Ehrlich, R., and Full, W.: FCM: The fuzzy c-means clustering algorithm, Comput. Geosci., 10, 191–203, 1984.
Budisulistiorini, S. H., Canagaratna, M. R., Croteau, P. L., Marth, W. J., Baumann, K., Edgerton, E. S., Shaw, S. L., Knipping, E. M., Worsnop, D. R., Jayne, J. T., Gold, A., and Surratt, J. D.: Real-time continuous characterization of secondary organic aerosol derived from isoprene epoxydiols in downtown Atlanta, Georgia, using the Aerodyne Aerosol Chemical Speciation Monitor, Environ. Sci. Technol., 47, 5686–5694, https://doi.org/10.1021/es400023n, 2013.
Budisulistiorini, S. H., Li, X., Bairai, S. T., Renfro, J., Liu, Y., Liu, Y. J., McKinney, K. A., Martin, S. T., McNeill, V. F., Pye, H. O. T., Nenes, A., Neff, M. E., Stone, E. A., Mueller, S., Knote, C., Shaw, S. L., Zhang, Z., Gold, A., and Surratt, J. D.: Examining the effects of anthropogenic emissions on isoprene-derived secondary organic aerosol formation during the 2013 Southern Oxidant and Aerosol Study (SOAS) at the Look Rock, Tennessee ground site, Atmos. Chem. Phys., 15, 8871–8888, https://doi.org/10.5194/acp-15-8871-2015, 2015.
Canagaratna, M. R., Jayne, J. T., Jimenez, J. L., Allan, J. D., Alfarra, M. R., Zhang, Q., Onasch, T. B., Drewnick, F., Coe, H., Middlebrook, A., Delia, A., Williams, L. R., Trimborn, A. M., Northway, M. J., DeCarlo, P. F., Kolb, C. E., Davidovits, P., and Worsnop, D. R.: Chemical and microphysical characterization of ambient aerosols with the aerodyne aerosol mass spectrometer, Mass Spectrom. Rev., 26, 185–222, https://doi.org/10.1002/mas.20115, 2007.
Canagaratna, M. R., Jimenez, J. L., Kroll, J. H., Chen, Q., Kessler, S. H., Massoli, P., Hildebrandt Ruiz, L., Fortner, E., Williams, L. R., Wilson, K. R., Surratt, J. D., Donahue, N. M., Jayne, J. T., and Worsnop, D. R.: Elemental ratio measurements of organic compounds using aerosol mass spectrometry: characterization, improved calibration, and implications, Atmos. Chem. Phys., 15, 253–272, https://doi.org/10.5194/acp-15-253-2015, 2015.
Cappa, C. D., Lack, D. A., Burkholder, J. B., and Ravishankara, A. R.: Bias in filter-based aerosol light absorption measurements due to organic aerosol loading: evidence from laboratory Measurements, Aerosol Sci. Tech., 42, 1022–1032, https://doi.org/10.1080/02786820802389285, 2008.
Carlton, A. G., Turpin, B. J., Lim, H.-J., Altieri, K. E., and Seitzinger, S.: Link between isoprene and secondary organic aerosol (SOA): Pyruvic acid oxidation yields low volatility organic acids in clouds, Geophys. Res. Lett., 33, L06822, https://doi.org/10.1029/2005GL025374, 2006.
Carlton, A. G., Pinder, R. W., Bhave, P. V., and Pouliot, G. A.: To What Extent Can Biogenic SOA be Controlled?, Environ. Sci. Technol., 44, 3376–3380, https://doi.org/10.1021/es903506b, 2010.
Chen, Q., Farmer, D. K., Schneider, J., Zorn, S. R., Heald, C. L., Karl, T. G., Guenther, A., Allan, J. D., Robinson, N., Coe, H., Kimmel, J. R., Pauliquevis, T., Borrmann, S., Pöschl, U., Andreae, M. O., Artaxo, P., Jimenez, J. L., and Martin, S. T.: Mass spectral characterization of submicron biogenic organic particles in the Amazon Basin, Geophys. Res. Lett., 36, L20806, https://doi.org/10.1029/2009GL039880, 2009.
Chen, Q., Farmer, D. K., Rizzo, L. V., Pauliquevis, T., Kuwata, M., Karl, T. G., Guenther, A., Allan, J. D., Coe, H., Andreae, M. O., Pöschl, U., Jimenez, J. L., Artaxo, P., and Martin, S. T.: Submicron particle mass concentrations and sources in the Amazonian wet season (AMAZE-08), Atmos. Chem. Phys., 15, 3687–3701, https://doi.org/10.5194/acp-15-3687-2015, 2015.
Chhabra, P. S., Ng, N. L., Canagaratna, M. R., Corrigan, A. L., Russell, L. M., Worsnop, D. R., Flagan, R. C., and Seinfeld, J. H.: Elemental composition and oxidation of chamber organic aerosol, Atmos. Chem. Phys., 11, 8827–8845, https://doi.org/10.5194/acp-11-8827-2011, 2011.
Cirino, G., Brito, J., Barbosa, H. M. J., Rizzo, L. V., Tunved, P., de Sá, S. S., Jimenez, J. L., Palm, B. B., Carbone, S., Lavric, J., Souza, R. A. F., Wolff, S., Walter, D., Tota, J., Oliveira, M. B. L., Martin, S. T., and Artaxo, P.: Observations of Manaus urban plume evolution and interaction with biogenic emissions in GoAmazon 2014/5, Atmos. Environ., https://doi.org/10.1016/j.atmosenv.2018.08.031, in press, 2018.
Cubison, M. J., Ortega, A. M., Hayes, P. L., Farmer, D. K., Day, D., Lechner, M. J., Brune, W. H., Apel, E., Diskin, G. S., Fisher, J. A., Fuelberg, H. E., Hecobian, A., Knapp, D. J., Mikoviny, T., Riemer, D., Sachse, G. W., Sessions, W., Weber, R. J., Weinheimer, A. J., Wisthaler, A., and Jimenez, J. L.: Effects of aging on organic aerosol from open biomass burning smoke in aircraft and laboratory studies, Atmos. Chem. Phys., 11, 12049–12064, https://doi.org/10.5194/acp-11-12049-2011, 2011.
Davidson, E. A., de Araújo, A. C., Artaxo, P., Balch, J. K., Brown, I. F., Bustamante, M. M., Coe, M. T., DeFries, R. S., Keller, M., and Longo, M.: The Amazon basin in transition, Nature, 481, 321–328, 2012.
DeCarlo, P. F., Kimmel, J. R., Trimborn, A., Northway, M. J., Jayne, J. T., Aiken, A. C., Gonin, M., Fuhrer, K., Horvath, T., Docherty, K. S., Worsnop, D. R., and Jimenez, J. L.: Field-deployable, high-resolution, time-of-flight aerosol mass spectrometer, Anal. Chem., 78, 8281–8289, https://doi.org/10.1021/ac061249n, 2006.
De Gouw, J. and Jimenez, J. L.: Organic Aerosols in the Earth's Atmosphere, Environ. Sci. Technol., 43, 7614–7618, https://doi.org/10.1021/es9006004, 2009.
de Gouw, J. A., Middlebrook, A. M., Warneke, C., Goldan, P. D., Kuster, W. C., Roberts, J. M., Fehsenfeld, F. C., Worsnop, D. R., Canagaratna, M. R., Pszenny, A. A. P., Keene, W. C., Marchewka, M., Bertman, S. B., and Bates, T. S.: Budget of organic carbon in a polluted atmosphere: Results from the New England Air Quality Study in 2002, J. Geophys. Res.-Atmos., 110, D16305, https://doi.org/10.1029/2004JD005623, 2005.
de Gouw, J. A., Brock, C. A., Atlas, E. L., Bates, T. S., Fehsenfeld, F. C., Goldan, P. D., Holloway, J. S., Kuster, W. C., Lerner, B. M., Matthew, B. M., Middlebrook, A. M., Onasch, T. B., Peltier, R. E., Quinn, P. K., Senff, C. J., Stohl, A., Sullivan, A. P., Trainer, M., Warneke, C., Weber, R. J., and Williams, E. J.: Sources of particulate matter in the northeastern United States in summer: 1. Direct emissions and secondary formation of organic matter in urban plumes, J. Geophys. Res.-Atmos., 113, D08301, https://doi.org/10.1029/2007JD009243, 2008.
de Sá, S. S., Palm, B. B., Campuzano-Jost, P., Day, D. A., Newburn, M. K., Hu, W., Isaacman-VanWertz, G., Yee, L. D., Thalman, R., Brito, J., Carbone, S., Artaxo, P., Goldstein, A. H., Manzi, A. O., Souza, R. A. F., Mei, F., Shilling, J. E., Springston, S. R., Wang, J., Surratt, J. D., Alexander, M. L., Jimenez, J. L., and Martin, S. T.: Influence of urban pollution on the production of organic particulate matter from isoprene epoxydiols in central Amazonia, Atmos. Chem. Phys., 17, 6611–6629, https://doi.org/10.5194/acp-17-6611-2017, 2017.
dos Santos, M. J., Silva Dias, M. A. F., and Freitas, E. D.: Influence of local circulations on wind, moisture, and precipitation close to Manaus City, Amazon Region, Brazil, J. Geophys. Res.-Atmos., 119, 13233–13249, https://doi.org/10.1002/2014JD021969, 2014.
Draxler, R. and Hess, G.: An overview of the HYSPLIT_4 modeling system for trajectories, dispersion, and deposition, Aust. Meteorol. Mag., 47, 295–308, 1998.
Ervens, B., Turpin, B. J., and Weber, R. J.: Secondary organic aerosol formation in cloud droplets and aqueous particles (aqSOA): a review of laboratory, field and model studies, Atmos. Chem. Phys., 11, 11069–11102, https://doi.org/10.5194/acp-11-11069-2011, 2011.
Farmer, D. K., Matsunaga, A., Docherty, K. S., Surratt, J. D., Seinfeld, J. H., Ziemann, P. J., and Jimenez, J. L.: Response of an aerosol mass spectrometer to organonitrates and organosulfates and implications for atmospheric chemistry, P. Natl. Acad. Sci. USA, 107, 6670–6675, https://doi.org/10.1073/pnas.0912340107, 2010.
Fry, J. L., Kiendler-Scharr, A., Rollins, A. W., Wooldridge, P. J., Brown, S. S., Fuchs, H., Dubé, W., Mensah, A., dal Maso, M., Tillmann, R., Dorn, H.-P., Brauers, T., and Cohen, R. C.: Organic nitrate and secondary organic aerosol yield from NO3 oxidation of β-pinene evaluated using a gas-phase kinetics/aerosol partitioning model, Atmos. Chem. Phys., 9, 1431–1449, https://doi.org/10.5194/acp-9-1431-2009, 2009.
Fry, J. L., Draper, D. C., Zarzana, K. J., Campuzano-Jost, P., Day, D. A., Jimenez, J. L., Brown, S. S., Cohen, R. C., Kaser, L., Hansel, A., Cappellin, L., Karl, T., Hodzic Roux, A., Turnipseed, A., Cantrell, C., Lefer, B. L., and Grossberg, N.: Observations of gas- and aerosol-phase organic nitrates at BEACHON-RoMBAS 2011, Atmos. Chem. Phys., 13, 8585–8605, https://doi.org/10.5194/acp-13-8585-2013, 2013.
Glasius, M. and Goldstein, A. H.: Recent discoveries and future challenges in atmospheric organic chemistry, Environ. Sci. Technol., 50, 2754–2764, https://doi.org/10.1021/acs.est.5b05105, 2016.
Goldstein, A. H., Koven, C. D., Heald, C. L., and Fung, I. Y.: Biogenic carbon and anthropogenic pollutants combine to form a cooling haze over the southeastern United States, P. Natl Acad. Sci. USA, 106, 8835–8840, https://doi.org/10.1073/pnas.0904128106, 2009.
Guenther, A. B., Jiang, X., Heald, C. L., Sakulyanontvittaya, T., Duhl, T., Emmons, L. K., and Wang, X.: The Model of Emissions of Gases and Aerosols from Nature version 2.1 (MEGAN2.1): an extended and updated framework for modeling biogenic emissions, Geosci. Model Dev., 5, 1471–1492, https://doi.org/10.5194/gmd-5-1471-2012, 2012.
Hallquist, M., Wenger, J. C., Baltensperger, U., Rudich, Y., Simpson, D., Claeys, M., Dommen, J., Donahue, N. M., George, C., Goldstein, A. H., Hamilton, J. F., Herrmann, H., Hoffmann, T., Iinuma, Y., Jang, M., Jenkin, M. E., Jimenez, J. L., Kiendler-Scharr, A., Maenhaut, W., McFiggans, G., Mentel, Th. F., Monod, A., Prévôt, A. S. H., Seinfeld, J. H., Surratt, J. D., Szmigielski, R., and Wildt, J.: The formation, properties and impact of secondary organic aerosol: current and emerging issues, Atmos. Chem. Phys., 9, 5155–5236, https://doi.org/10.5194/acp-9-5155-2009, 2009.
Heald, C. L., Coe, H., Jimenez, J. L., Weber, R. J., Bahreini, R., Middlebrook, A. M., Russell, L. M., Jolleys, M., Fu, T.-M., Allan, J. D., Bower, K. N., Capes, G., Crosier, J., Morgan, W. T., Robinson, N. H., Williams, P. I., Cubison, M. J., DeCarlo, P. F., and Dunlea, E. J.: Exploring the vertical profile of atmospheric organic aerosol: comparing 17 aircraft field campaigns with a global model, Atmos. Chem. Phys., 11, 12673–12696, https://doi.org/10.5194/acp-11-12673-2011, 2011.
Hou, A. Y., Kakar, R. K., Neeck, S., Azarbarzin, A. A., Kummerow, C. D., Kojima, M., Oki, R., Nakamura, K., and Iguchi, T.: The Global Precipitation Measurement mission, B. Am. Meteorol. Soc., 95, 701–722, https://doi.org/10.1175/bams-d-13-00164.1, 2014.
Hoyle, C. R., Myhre, G., Berntsen, T. K., and Isaksen, I. S. A.: Anthropogenic influence on SOA and the resulting radiative forcing, Atmos. Chem. Phys., 9, 2715–2728, https://doi.org/10.5194/acp-9-2715-2009, 2009.
Hoyle, C. R., Boy, M., Donahue, N. M., Fry, J. L., Glasius, M., Guenther, A., Hallar, A. G., Huff Hartz, K., Petters, M. D., Petäjä, T., Rosenoern, T., and Sullivan, A. P.: A review of the anthropogenic influence on biogenic secondary organic aerosol, Atmos. Chem. Phys., 11, 321–343, https://doi.org/10.5194/acp-11-321-2011, 2011.
Hu, W. W., Campuzano-Jost, P., Palm, B. B., Day, D. A., Ortega, A. M., Hayes, P. L., Krechmer, J. E., Chen, Q., Kuwata, M., Liu, Y. J., de Sá, S. S., McKinney, K., Martin, S. T., Hu, M., Budisulistiorini, S. H., Riva, M., Surratt, J. D., St. Clair, J. M., Isaacman-Van Wertz, G., Yee, L. D., Goldstein, A. H., Carbone, S., Brito, J., Artaxo, P., de Gouw, J. A., Koss, A., Wisthaler, A., Mikoviny, T., Karl, T., Kaser, L., Jud, W., Hansel, A., Docherty, K. S., Alexander, M. L., Robinson, N. H., Coe, H., Allan, J. D., Canagaratna, M. R., Paulot, F., and Jimenez, J. L.: Characterization of a real-time tracer for isoprene epoxydiols-derived secondary organic aerosol (IEPOX-SOA) from aerosol mass spectrometer measurements, Atmos. Chem. Phys., 15, 11807–11833, https://doi.org/10.5194/acp-15-11807-2015, 2015.
Hu, W. W., Hu, M., Hu, W., Jimenez, J. L., Yuan, B., Chen, W., Wang, M., Wu, Y., Chen, C., Wang, Z., Peng, J., Zeng, L., and Shao, M.: Chemical composition, sources, and aging process of submicron aerosols in Beijing: Contrast between summer and winter, J. Geophys. Res.-Atmos., 121, 1955–1977, https://doi.org/10.1002/2015JD024020, 2016.
Huang, R.-J., Zhang, Y., Bozzetti, C., Ho, K.-F., Cao, J.-J., Han, Y., Daellenbach, K. R., Slowik, J. G., Platt, S. M., Canonaco, F., Zotter, P., Wolf, R., Pieber, S. M., Bruns, E. A., Crippa, M., Ciarelli, G., Piazzalunga, A., Schwikowski, M., Abbaszade, G., Schnelle-Kreis, J., Zimmermann, R., An, Z., Szidat, S., Baltensperger, U., Haddad, I. E., and Prevot, A. S. H.: High secondary aerosol contribution to particulate pollution during haze events in China, Nature, 514, 218–222, https://doi.org/10.1038/nature13774, 2014.
Isaacman-VanWertz, G., Yee, L. D., Kreisberg, N. M., Wernis, R., Moss, J. A., Hering, S. V., de Sá, S. S., Martin, S. T., Alexander, M. L., Palm, B. B., Hu, W., Campuzano-Jost, P., Day, D. A., Jimenez, J. L., Riva, M., Surratt, J. D., Viegas, J., Manzi, A., Edgerton, E., Baumann, K., Souza, R., Artaxo, P., and Goldstein, A. H.: Ambient Gas-Particle Partitioning of Tracers for Biogenic Oxidation, Environ. Sci. Technol., 9952–9962, https://doi.org/10.1021/acs.est.6b01674, 2016.
Jimenez, J. L., Canagaratna, M. R., Donahue, N. M., Prevot, A. S. H., Zhang, Q., Kroll, J. H., DeCarlo, P. F., Allan, J. D., Coe, H., Ng, N. L., Aiken, A. C., Docherty, K. S., Ulbrich, I. M., Grieshop, A. P., Robinson, A. L., Duplissy, J., Smith, J. D., Wilson, K. R., Lanz, V. A., Hueglin, C., Sun, Y. L., Tian, J., Laaksonen, A., Raatikainen, T., Rautiainen, J., Vaattovaara, P., Ehn, M., Kulmala, M., Tomlinson, J. M., Collins, D. R., Cubison, M. J., Dunlea, J., Huffman, J. A., Onasch, T. B., Alfarra, M. R., Williams, P. I., Bower, K., Kondo, Y., Schneider, J., Drewnick, F., Borrmann, S., Weimer, S., Demerjian, K., Salcedo, D., Cottrell, L., Griffin, R., Takami, A., Miyoshi, T., Hatakeyama, S., Shimono, A., Sun, J. Y., Zhang, Y. M., Dzepina, K., Kimmel, J. R., Sueper, D., Jayne, J. T., Herndon, S. C., Trimborn, A. M., Williams, L. R., Wood, E. C., Middlebrook, A. M., Kolb, C. E., Baltensperger, U., and Worsnop, D. R.: Evolution of organic aerosols in the atmosphere, Science, 326, 1525–1529, https://doi.org/10.1126/science.1180353, 2009.
Joss, J. and Waldvogel, A.: Ein Spektrograph für Niederschlagstropfen mit automatischer Auswertung, Pure Appl. Geophys., 68, 240–246, https://doi.org/10.1007/BF00874898, 1967.
Krechmer, J. E., Coggon, M. M., Massoli, P., Nguyen, T. B., Crounse, J. D., Hu, W., Day, D. A., Tyndall, G. S., Henze, D. K., Rivera-Rios, J. C., Nowak, J. B., Kimmel, J. R., Mauldin, R. L., Stark, H., Jayne, J. T., Sipilä, M., Junninen, H., Clair, J. M. S., Zhang, X., Feiner, P. A., Zhang, L., Miller, D. O., Brune, W. H., Keutsch, F. N., Wennberg, P. O., Seinfeld, J. H., Worsnop, D. R., Jimenez, J. L., and Canagaratna, M. R.: Formation of low volatility organic compounds and secondary organic aerosol from isoprene hydroxyhydroperoxide low-NO oxidation, Environ. Sci. Technol., 49, 10330–10339, https://doi.org/10.1021/acs.est.5b02031, 2015.
Kroll, J. H., Ng, N. L., Murphy, S. M., Flagan, R. C., and Seinfeld, J. H.: Secondary organic aerosol formation from isoprene photooxidation under high-NOx conditions, Geophys. Res. Lett., 32, L18808, https://doi.org/10.1029/2005GL023637, 2005.
Kroll, J. H., Ng, N. L., Murphy, S. M., Flagan, R. C., and Seinfeld, J. H.: Secondary organic aerosol formation from isoprene photooxidation, Environ. Sci. Technol., 40, 1869–1877, https://doi.org/10.1021/es0524301, 2006.
Kuhn, U., Ganzeveld, L., Thielmann, A., Dindorf, T., Schebeske, G., Welling, M., Sciare, J., Roberts, G., Meixner, F. X., Kesselmeier, J., Lelieveld, J., Kolle, O., Ciccioli, P., Lloyd, J., Trentmann, J., Artaxo, P., and Andreae, M. O.: Impact of Manaus City on the Amazon Green Ocean atmosphere: ozone production, precursor sensitivity and aerosol load, Atmos. Chem. Phys., 10, 9251–9282, https://doi.org/10.5194/acp-10-9251-2010, 2010.
Kummerow, C., Barnes, W., Kozu, T., Shiue, J., and Simpson, J.: The Tropical Rainfall Measuring Mission (TRMM) sensor package, J. Atmos. Ocean. Tech., 15, 809–817, https://doi.org/10.1175/1520-0426(1998)015<0809:ttrmmt>2.0.co;2, 1998.
Kuwata, M., Liu, Y., McKinney, K., and Martin, S. T.: Physical state and acidity of inorganic sulfate can regulate the production of secondary organic material from isoprene photooxidation products, Phys. Chem. Chem. Phys., 17, 5670–5678, https://doi.org/10.1039/C4CP04942J, 2015.
Lack, D. A., Cappa, C. D., Covert, D. S., Baynard, T., Massoli, P., Sierau, B., Bates, T. S., Quinn, P. K., Lovejoy, E. R., and Ravishankara, A. R.: Bias in filter-based aerosol light absorption measurements due to organic aerosol loading: evidence from ambient measurements, Aerosol Sci. Tech., 42, 1033–1041, https://doi.org/10.1080/02786820802389277, 2008.
Lambe, A. T., Onasch, T. B., Massoli, P., Croasdale, D. R., Wright, J. P., Ahern, A. T., Williams, L. R., Worsnop, D. R., Brune, W. H., and Davidovits, P.: Laboratory studies of the chemical composition and cloud condensation nuclei (CCN) activity of secondary organic aerosol (SOA) and oxidized primary organic aerosol (OPOA), Atmos. Chem. Phys., 11, 8913–8928, https://doi.org/10.5194/acp-11-8913-2011, 2011.
Lanz, V. A., Alfarra, M. R., Baltensperger, U., Buchmann, B., Hueglin, C., and Prévôt, A. S. H.: Source apportionment of submicron organic aerosols at an urban site by factor analytical modelling of aerosol mass spectra, Atmos. Chem. Phys., 7, 1503–1522, https://doi.org/10.5194/acp-7-1503-2007, 2007.
Li, Y. J., Liu, P., Gong, Z., Wang, Y., Bateman, A. P., Bergoend, C., Bertram, A. K., and Martin, S. T.: Chemical reactivity and liquid/nonliquid states of secondary organic material, Environ. Sci. Technol., 49, 13264–13274, https://doi.org/10.1021/acs.est.5b03392, 2015.
Liao, J., Froyd, K. D., Murphy, D. M., Keutsch, F. N., Yu, G., Wennberg, P. O., St. Clair, J. M., Crounse, J. D., Wisthaler, A., Mikoviny, T., Jimenez, J. L., Campuzano-Jost, P., Day, D. A., Hu, W., Ryerson, T. B., Pollack, I. B., Peischl, J., Anderson, B. E., Ziemba, L. D., Blake, D. R., Meinardi, S., and Diskin, G.: Airborne measurements of organosulfates over the continental US, J. Geophys. Res.-Atmos., 120, 2990–3005, https://doi.org/10.1002/2014JD022378, 2015.
Lin, Y.-H., Zhang, Z., Docherty, K. S., Zhang, H., Budisulistiorini, S. H., Rubitschun, C. L., Shaw, S. L., Knipping, E. M., Edgerton, E. S., Kleindienst, T. E., Gold, A., and Surratt, J. D.: Isoprene epoxydiols as precursors to secondary organic aerosol formation: acid-catalyzed reactive uptake studies with authentic compounds, Environ. Sci. Technol., 46, 250–258, https://doi.org/10.1021/es202554c, 2012.
Liu, J., D'Ambro, E. L., Lee, B. H., Lopez-Hilfiker, F. D., Zaveri, R. A., Rivera-Rios, J. C., Keutsch, F. N., Iyer, S., Kurten, T., Zhang, Z., Gold, A., Surratt, J. D., Shilling, J. E., and Thornton, J. A.: Efficient isoprene secondary organic aerosol formation from a non-IEPOX pathway, Environ. Sci. Technol., 50, 9872–9880, https://doi.org/10.1021/acs.est.6b01872, 2016.
Liu, P., Li, Y. J., Wang, Y., Bateman, A. P., Zhang, Y., Gong, Z., Bertram, A. K., and Martin, S. T.: Highly viscous states affect the browning of atmospheric organic particulate matter, ACS Cent. Sci., 4, 207–215, https://doi.org/10.1021/acscentsci.7b00452, 2018.
Liu, Y., Brito, J., Dorris, M. R., Rivera-Rios, J. C., Seco, R., Bates, K. H., Artaxo, P., Duvoisin, S., Keutsch, F. N., Kim, S., Goldstein, A. H., Guenther, A. B., Manzi, A. O., Souza, R. A. F., Springston, S. R., Watson, T. B., McKinney, K. A., and Martin, S. T.: Isoprene photochemistry over the Amazon rain forest, P. Natl. Acad. Sci. USA, 113, 6125–6130, https://doi.org/10.1073/pnas.1524136113, 2016.
Liu, Y., Seco, R., Kim, S., Guenther, A. B., Goldstein, A. H., Keutsch, F. N., Springston, S. R., Watson, T. B., Artaxo, P., Souza, R. A. F., McKinney, K. A., and Martin, S. T.: Isoprene photo-oxidation products quantify the effect of pollution on hydroxyl radicals over Amazonia, Science Advances, 4, eaar2547, https://doi.org/10.1126/sciadv.aar2547, 2018.
Machado, L. A. T., Dias, M. A. F. S., Morales, C., Fisch, G., Vila, D., Albrecht, R., Goodman, S. J., Calheiros, A. J. P., Biscaro, T., Kummerow, C., Cohen, J., Fitzjarrald, D., Nascimento, E. L., Sakamoto, M. S., Cunningham, C., Chaboureau, J.-P., Petersen, W. A., Adams, D. K., Baldini, L., Angelis, C. F., Sapucci, L. F., Salio, P., Barbosa, H. M. J., Landulfo, E., Souza, R. A. F., Blakeslee, R. J., Bailey, J., Freitas, S., Lima, W. F. A., and Tokay, A.: The Chuva Project: how does convection vary across Brazil?, B. Am. Meteorol. Soc., 95, 1365–1380, https://doi.org/10.1175/bams-d-13-00084.1, 2014.
Martin, S. T., Andreae, M. O., Artaxo, P., Baumgardner, D., Chen, Q., Goldstein, A. H., Guenther, A., Heald, C. L., Mayol-Bracero, O. L., McMurry, P. H., Pauliquevis, T., Pöschl, U., Prather, K. A., Roberts, G. C., Saleska, S. R., Silva Dias, M. A., Spracklen, D. V., Swietlicki, E., and Trebs, I.: Sources and properties of Amazonian aerosol particles, Rev. Geophys., 48, RG2012, https://doi.org/10.1029/2008RG000280, 2010a.
Martin, S. T., Andreae, M. O., Althausen, D., Artaxo, P., Baars, H., Borrmann, S., Chen, Q., Farmer, D. K., Guenther, A., Gunthe, S. S., Jimenez, J. L., Karl, T., Longo, K., Manzi, A., Müller, T., Pauliquevis, T., Petters, M. D., Prenni, A. J., Pöschl, U., Rizzo, L. V., Schneider, J., Smith, J. N., Swietlicki, E., Tota, J., Wang, J., Wiedensohler, A., and Zorn, S. R.: An overview of the Amazonian Aerosol Characterization Experiment 2008 (AMAZE-08), Atmos. Chem. Phys., 10, 11415–11438, https://doi.org/10.5194/acp-10-11415-2010, 2010b.
Martin, S. T., Artaxo, P., Machado, L. A. T., Manzi, A. O., Souza, R. A. F., Schumacher, C., Wang, J., Andreae, M. O., Barbosa, H. M. J., Fan, J., Fisch, G., Goldstein, A. H., Guenther, A., Jimenez, J. L., Pöschl, U., Silva Dias, M. A., Smith, J. N., and Wendisch, M.: Introduction: Observations and Modeling of the Green Ocean Amazon (GoAmazon2014/5), Atmos. Chem. Phys., 16, 4785–4797, https://doi.org/10.5194/acp-16-4785-2016, 2016.
Martin, S. T., Artaxo, P., Machado, L., Manzi, A. O., Souza, R. A. F., Schumacher, C., Wang, J., Biscaro, T., Brito, J., Calheiros, A., Jardine, K., Medeiros, A., Portela, B., Sá, S. S. d., Adachi, K., Aiken, A. C., Albrecht, R., Alexander, L., Andreae, M. O., Barbosa, H. M. J., Buseck, P., Chand, D., Comstock, J. M., Day, D. A., Dubey, M., Fan, J., Fast, J., Fisch, G., Fortner, E., Giangrande, S., Gilles, M., Goldstein, A. H., Guenther, A., Hubbe, J., Jensen, M., Jimenez, J. L., Keutsch, F. N., Kim, S., Kuang, C., Laskin, A., McKinney, K., Mei, F., Miller, M., Nascimento, R., Pauliquevis, T., Pekour, M., Peres, J., Petäjä, T., Pöhlker, C., Pöschl, U., Rizzo, L., Schmid, B., Shilling, J. E., Dias, M. A. S., Smith, J. N., Tomlinson, J. M., Tóta, J., and Wendisch, M.: The Green Ocean Amazon Experiment (GoAmazon2014/5) observes pollution affecting gases, aerosols, clouds, and rainfall over the rain forest, B. Am. Meteorol. Soc., 98, 981–997, https://doi.org/10.1175/bams-d-15-00221.1, 2017.
Medeiros, A. S. S., Calderaro, G., Guimarães, P. C., Magalhaes, M. R., Morais, M. V. B., Rafee, S. A. A., Ribeiro, I. O., Andreoli, R. V., Martins, J. A., Martins, L. D., Martin, S. T., and Souza, R. A. F.: Power plant fuel switching and air quality in a tropical, forested environment, Atmos. Chem. Phys., 17, 8987–8998, https://doi.org/10.5194/acp-17-8987-2017, 2017.
Mohr, C., DeCarlo, P. F., Heringa, M. F., Chirico, R., Slowik, J. G., Richter, R., Reche, C., Alastuey, A., Querol, X., Seco, R., Peñuelas, J., Jiménez, J. L., Crippa, M., Zimmermann, R., Baltensperger, U., and Prévôt, A. S. H.: Identification and quantification of organic aerosol from cooking and other sources in Barcelona using aerosol mass spectrometer data, Atmos. Chem. Phys., 12, 1649–1665, https://doi.org/10.5194/acp-12-1649-2012, 2012.
Ng, N. L., Canagaratna, M. R., Jimenez, J. L., Chhabra, P. S., Seinfeld, J. H., and Worsnop, D. R.: Changes in organic aerosol composition with aging inferred from aerosol mass spectra, Atmos. Chem. Phys., 11, 6465–6474, https://doi.org/10.5194/acp-11-6465-2011, 2011a.
Ng, N. L., Canagaratna, M. R., Jimenez, J. L., Zhang, Q., Ulbrich, I. M., and Worsnop, D. R.: Real-time methods for estimating organic component mass concentrations from aerosol mass spectrometer data, Environ. Sci. Technol., 45, 910–916, https://doi.org/10.1021/es102951k, 2011b.
Nguyen, T. B., Coggon, M. M., Bates, K. H., Zhang, X., Schwantes, R. H., Schilling, K. A., Loza, C. L., Flagan, R. C., Wennberg, P. O., and Seinfeld, J. H.: Organic aerosol formation from the reactive uptake of isoprene epoxydiols (IEPOX) onto non-acidified inorganic seeds, Atmos. Chem. Phys., 14, 3497–3510, https://doi.org/10.5194/acp-14-3497-2014, 2014.
Nordin, E. Z., Eriksson, A. C., Roldin, P., Nilsson, P. T., Carlsson, J. E., Kajos, M. K., Hellén, H., Wittbom, C., Rissler, J., Löndahl, J., Swietlicki, E., Svenningsson, B., Bohgard, M., Kulmala, M., Hallquist, M., and Pagels, J. H.: Secondary organic aerosol formation from idling gasoline passenger vehicle emissions investigated in a smog chamber, Atmos. Chem. Phys., 13, 6101–6116, https://doi.org/10.5194/acp-13-6101-2013, 2013.
Odum, J. R., Hoffmann, T., Bowman, F., Collins, D., Flagan, R. C., and Seinfeld, J. H.: Gas/particle partitioning and secondary organic aerosol yields, Environ. Sci. Technol., 8, 2580–2585, https://doi.org/10.1021/es950943+, 1996.
Palm, B. B., de Sá, S. S., Day, D. A., Campuzano-Jost, P., Hu, W., Seco, R., Sjostedt, S. J., Park, J.-H., Guenther, A. B., Kim, S., Brito, J., Wurm, F., Artaxo, P., Thalman, R., Wang, J., Yee, L. D., Wernis, R., Isaacman-VanWertz, G., Goldstein, A. H., Liu, Y., Springston, S. R., Souza, R., Newburn, M. K., Alexander, M. L., Martin, S. T., and Jimenez, J. L.: Secondary organic aerosol formation from ambient air in an oxidation flow reactor in central Amazonia, Atmos. Chem. Phys., 18, 467–493, https://doi.org/10.5194/acp-18-467-2018, 2018.
Pankow, J. F.: An absorption model of gas/particle partitioning of organic compounds in the atmosphere, Atmos. Environ., 28, 185–188, https://doi.org/10.1016/1352-2310(94)90093-0, 1994.
Paulot, F., Crounse, J. D., Kjaergaard, H. G., Kürten, A., Clair, J. M. S., Seinfeld, J. H., and Wennberg, P. O.: Unexpected epoxide formation in the gas-phase photooxidation of isoprene, Science, 325, 730–733, https://doi.org/10.1126/science.1172910, 2009.
Perraud, V., Bruns, E. A., Ezell, M. J., Johnson, S. N., Yu, Y., Alexander, M. L., Zelenyuk, A., Imre, D., Chang, W. L., Dabdub, D., Pankow, J. F., and Finlayson-Pitts, B. J.: Nonequilibrium atmospheric secondary organic aerosol formation and growth, P. Natl Acad. Sci. USA, 109, 2836–2841, https://doi.org/10.1073/pnas.1119909109, 2012.
Pöhlker, M. L., Ditas, F., Saturno, J., Klimach, T., Hrabe de Angelis, I., Araùjo, A. C., Brito, J., Carbone, S., Cheng, Y., Chi, X., Ditz, R., Gunthe, S. S., Holanda, B. A., Kandler, K., Kesselmeier, J., Könemann, T., Krüger, O. O., Lavric, J. V., Martin, S. T., Mikhailov, E., Moran-Zuloaga, D., Rizzo, L. V., Rose, D., Su, H., Thalman, R., Walter, D., Wang, J., Wolff, S., Barbosa, H. M. J., Artaxo, P., Andreae, M. O., Pöschl, U., and Pöhlker, C.: Long-term observations of cloud condensation nuclei over the Amazon rain forest – Part 2: Variability and characteristics of biomass burning, long-range transport, and pristine rain forest aerosols, Atmos. Chem. Phys., 18, 10289–10331, https://doi.org/10.5194/acp-18-10289-2018, 2018.
Presto, A. A., Gordon, T. D., and Robinson, A. L.: Primary to secondary organic aerosol: evolution of organic emissions from mobile combustion sources, Atmos. Chem. Phys., 14, 5015–5036, https://doi.org/10.5194/acp-14-5015-2014, 2014.
Riva, M., Budisulistiorini, S. H., Chen, Y., Zhang, Z., D'Ambro, E. L., Zhang, X., Gold, A., Turpin, B. J., Thornton, J. A., Canagaratna, M. R., and Surratt, J. D.: Chemical characterization of secondary organic aerosol from oxidation of isoprene hydroxyhydroperoxides, Environ. Sci. Technol., 50, 9889–9899, https://doi.org/10.1021/acs.est.6b02511, 2016.
Robinson, A. L., Donahue, N. M., Shrivastava, M. K., Weitkamp, E. A., Sage, A. M., Grieshop, A. P., Lane, T. E., Pierce, J. R., and Pandis, S. N.: Rethinking organic aerosols: semivolatile emissions and photochemical aging, Science, 315, 1259–1262, https://doi.org/10.1126/science.1133061, 2007.
Robinson, N. H., Hamilton, J. F., Allan, J. D., Langford, B., Oram, D. E., Chen, Q., Docherty, K., Farmer, D. K., Jimenez, J. L., Ward, M. W., Hewitt, C. N., Barley, M. H., Jenkin, M. E., Rickard, A. R., Martin, S. T., McFiggans, G., and Coe, H.: Evidence for a significant proportion of Secondary Organic Aerosol from isoprene above a maritime tropical forest, Atmos. Chem. Phys., 11, 1039–1050, https://doi.org/10.5194/acp-11-1039-2011, 2011.
Röhrl, A. and Lammel, G.: Determination of malic acid and other C4 dicarboxylic acids in atmospheric aerosol samples, Chemosphere, 46, 1195–1199, https://doi.org/10.1016/S0045-6535(01)00243-0, 2002.
Schneider, J., Weimer, S., Drewnick, F., Borrmann, S., Helas, G., Gwaze, P., Schmid, O., Andreae, M. O., and Kirchner, U.: Mass spectrometric analysis and aerodynamic properties of various types of combustion-related aerosol particles, Int. J. Mass Spectrom., 258, 37–49, https://doi.org/10.1016/j.ijms.2006.07.008, 2006.
Schneider, J., Freutel, F., Zorn, S. R., Chen, Q., Farmer, D. K., Jimenez, J. L., Martin, S. T., Artaxo, P., Wiedensohler, A., and Borrmann, S.: Mass-spectrometric identification of primary biological particle markers and application to pristine submicron aerosol measurements in Amazonia, Atmos. Chem. Phys., 11, 11415–11429, https://doi.org/10.5194/acp-11-11415-2011, 2011.
Setyan, A., Zhang, Q., Merkel, M., Knighton, W. B., Sun, Y., Song, C., Shilling, J. E., Onasch, T. B., Herndon, S. C., Worsnop, D. R., Fast, J. D., Zaveri, R. A., Berg, L. K., Wiedensohler, A., Flowers, B. A., Dubey, M. K., and Subramanian, R.: Characterization of submicron particles influenced by mixed biogenic and anthropogenic emissions using high-resolution aerosol mass spectrometry: results from CARES, Atmos. Chem. Phys., 12, 8131–8156, https://doi.org/10.5194/acp-12-8131-2012, 2012.
Shilling, J. E., Zaveri, R. A., Fast, J. D., Kleinman, L., Alexander, M. L., Canagaratna, M. R., Fortner, E., Hubbe, J. M., Jayne, J. T., Sedlacek, A., Setyan, A., Springston, S., Worsnop, D. R., and Zhang, Q.: Enhanced SOA formation from mixed anthropogenic and biogenic emissions during the CARES campaign, Atmos. Chem. Phys., 13, 2091–2113, https://doi.org/10.5194/acp-13-2091-2013, 2013.
Shilling, J. E., Pekour, M. S., Fortner, E. C., Artaxo, P., de Sá, S., Hubbe, J. M., Longo, K. M., Machado, L. A. T., Martin, S. T., Springston, S. R., Tomlinson, J., and Wang, J.: Aircraft observations of the chemical composition and aging of aerosol in the Manaus urban plume during GoAmazon 2014/5, Atmos. Chem. Phys., 18, 10773–10797, https://doi.org/10.5194/acp-18-10773-2018, 2018.
Shrivastava, M., Cappa, C. D., Fan, J., Goldstein, A. H., Guenther, A. B., Jimenez, J. L., Kuang, C., Laskin, A., Martin, S. T., Ng, N. L., Petaja, T., Pierce, J. R., Rasch, P. J., Roldin, P., Seinfeld, J. H., Shilling, J., Smith, J. N., Thornton, J. A., Volkamer, R., Wang, J., Worsnop, D. R., Zaveri, R. A., Zelenyuk, A., and Zhang, Q.: Recent advances in understanding secondary organic aerosol: Implications for global climate forcing, Rev. Geophys., 55, 509–559, https://doi.org/10.1002/2016RG000540, 2017.
Spracklen, D. V., Jimenez, J. L., Carslaw, K. S., Worsnop, D. R., Evans, M. J., Mann, G. W., Zhang, Q., Canagaratna, M. R., Allan, J., Coe, H., McFiggans, G., Rap, A., and Forster, P.: Aerosol mass spectrometer constraint on the global secondary organic aerosol budget, Atmos. Chem. Phys., 11, 12109–12136, https://doi.org/10.5194/acp-11-12109-2011, 2011.
Subramanian, R., Roden, C. A., Boparai, P., and Bond, T. C.: Yellow beads and missing particles: trouble ahead for filter-based absorption measurements, Aerosol Sci. Tech., 41, 630–637, https://doi.org/10.1080/02786820701344589, 2007.
Sueper, D. and collaborators: ToF-AMS Data Analysis Software Webpage, available at: http://cires1.colorado.edu/jimenez-group/wiki/index.php/ToF-AMS_Analysis_Software, last access: 15 August 2017.
Surratt, J. D., Chan, A. W., Eddingsaas, N. C., Chan, M., Loza, C. L., Kwan, A. J., Hersey, S. P., Flagan, R. C., Wennberg, P. O., and Seinfeld, J. H.: Reactive intermediates revealed in secondary organic aerosol formation from isoprene, P. Natl. Acad. Sci. USA, 107, 6640–6645, https://doi.org/10.1073/pnas.0911114107, 2010.
Thalman, R., de Sá, S. S., Palm, B. B., Barbosa, H. M. J., Pöhlker, M. L., Alexander, M. L., Brito, J., Carbone, S., Castillo, P., Day, D. A., Kuang, C., Manzi, A., Ng, N. L., Sedlacek III, A. J., Souza, R., Springston, S., Watson, T., Pöhlker, C., Pöschl, U., Andreae, M. O., Artaxo, P., Jimenez, J. L., Martin, S. T., and Wang, J.: CCN activity and organic hygroscopicity of aerosols downwind of an urban region in central Amazonia: seasonal and diel variations and impact of anthropogenic emissions, Atmos. Chem. Phys., 17, 11779–11801, https://doi.org/10.5194/acp-17-11779-2017, 2017.
Tsigaridis, K., Krol, M., Dentener, F. J., Balkanski, Y., Lathière, J., Metzger, S., Hauglustaine, D. A., and Kanakidou, M.: Change in global aerosol composition since preindustrial times, Atmos. Chem. Phys., 6, 5143–5162, https://doi.org/10.5194/acp-6-5143-2006, 2006.
Ulbrich, I. M., Handschy, A., Lechner, M. J., and Jimenez, J.: High-Resolution AMS Spectral Database, available at: http://cires.colorado.edu/jimenez-group/HRAMSsd/ (last access: 15 August 2017), 2009a.
Ulbrich, I. M., Canagaratna, M. R., Zhang, Q., Worsnop, D. R., and Jimenez, J. L.: Interpretation of organic components from Positive Matrix Factorization of aerosol mass spectrometric data, Atmos. Chem. Phys., 9, 2891–2918, https://doi.org/10.5194/acp-9-2891-2009, 2009b.
Ulbrich, I. M., Handschy, A., Lechner, M. J., and Jimenez, J.: AMS Spectral Database, available at: http://cires.colorado.edu/jimenez-group/AMSsd/ (last access: 15 August 2017), 2009c.
van Pinxteren, D., Neusüß, C., and Herrmann, H.: On the abundance and source contributions of dicarboxylic acids in size-resolved aerosol particles at continental sites in central Europe, Atmos. Chem. Phys., 14, 3913–3928, https://doi.org/10.5194/acp-14-3913-2014, 2014.
Weber, R. J., Sullivan, A. P., Peltier, R. E., Russell, A., Yan, B., Zheng, M., de Gouw, J., Warneke, C., Brock, C., Holloway, J. S., Atlas, E. L., and Edgerton, E.: A study of secondary organic aerosol formation in the anthropogenic-influenced southeastern United States, J. Geophys. Res.-Atmos., 112, D13302, https://doi.org/10.1029/2007JD008408, 2007.
Worton, D. R., Surratt, J. D., LaFranchi, B. W., Chan, A. W. H., Zhao, Y., Weber, R. J., Park, J.-H., Gilman, J. B., de Gouw, J., Park, C., Schade, G., Beaver, M., Clair, J. M. S., Crounse, J., Wennberg, P., Wolfe, G. M., Harrold, S., Thornton, J. A., Farmer, D. K., Docherty, K. S., Cubison, M. J., Jimenez, J.-L., Frossard, A. A., Russell, L. M., Kristensen, K., Glasius, M., Mao, J., Ren, X., Brune, W., Browne, E. C., Pusede, S. E., Cohen, R. C., Seinfeld, J. H., and Goldstein, A. H.: Observational insights into aerosol formation from isoprene, Environ. Sci. Technol., 47, 11403–11413, https://doi.org/10.1021/es4011064, 2013.
Xu, L., Guo, H., Boyd, C. M., Klein, M., Bougiatioti, A., Cerully, K. M., Hite, J. R., Isaacman-VanWertz, G., Kreisberg, N. M., Knote, C., Olson, K., Koss, A., Goldstein, A. H., Hering, S. V., de Gouw, J., Baumann, K., Lee, S.-H., Nenes, A., Weber, R. J., and Ng, N. L.: Effects of anthropogenic emissions on aerosol formation from isoprene and monoterpenes in the southeastern United States, P. Natl. Acad. Sci. USA, 112, 37–42, https://doi.org/10.1073/pnas.1417609112, 2015a.
Xu, L., Suresh, S., Guo, H., Weber, R. J., and Ng, N. L.: Aerosol characterization over the southeastern United States using high-resolution aerosol mass spectrometry: spatial and seasonal variation of aerosol composition and sources with a focus on organic nitrates, Atmos. Chem. Phys., 15, 7307–7336, https://doi.org/10.5194/acp-15-7307-2015, 2015b.
Yáñez-Serrano, A. M., Nölscher, A. C., Williams, J., Wolff, S., Alves, E., Martins, G. A., Bourtsoukidis, E., Brito, J., Jardine, K., Artaxo, P., and Kesselmeier, J.: Diel and seasonal changes of biogenic volatile organic compounds within and above an Amazonian rainforest, Atmos. Chem. Phys., 15, 3359–3378, https://doi.org/10.5194/acp-15-3359-2015, 2015.
Zhang, H., Yee, L. D., Lee, B. H., Curtis, M. P., Worton, D. R., Isaacman-VanWertz, G., Offenberg, J. H., Lewandowski, M., Kleindienst, T. E., Beaver, M. R., Holder, A. L., Lonneman, W. A., Docherty, K. S., Jaoui, M., Pye, H. O. T., Hu, W., Day, D. A., Campuzano-Jost, P., Jimenez, J. L., Guo, H., Weber, R. J., de Gouw, J., Koss, A. R., Edgerton, E. S., Brune, W., Mohr, C., Lopez-Hilfiker, F. D., Lutz, A., Kreisberg, N. M., Spielman, S. R., Hering, S. V., Wilson, K. R., Thornton, J. A., and Goldstein, A. H.: Monoterpenes are the largest source of summertime organic aerosol in the southeastern United States, P. Natl. Acad. Sci. USA, 115, 2038–2043, https://doi.org/10.1073/pnas.1717513115, 2018.
Zhang, Q., Alfarra, M. R., Worsnop, D. R., Allan, J. D., Coe, H., Canagaratna, M. R., and Jimenez, J. L.: Deconvolution and quantification of hydrocarbon-like and oxygenated organic aerosols based on aerosol mass spectrometry, Environ. Sci. Technol., 39, 4938–4952, https://doi.org/10.1021/es048568l, 2005.
Zhang, Q., Jimenez, J. L., Canagaratna, M. R., Ulbrich, I. M., Ng, N. L., Worsnop, D. R., and Sun, Y.: Understanding atmospheric organic aerosols via factor analysis of aerosol mass spectrometry: a review, Anal. Bioanal. Chem., 401, 3045–3067, https://doi.org/10.1007/s00216-011-5355-y, 2011.