the Creative Commons Attribution 4.0 License.
the Creative Commons Attribution 4.0 License.
 | 16 Aug 2018
Estimating the open biomass burning emissions in central and eastern China from 2003 to 2015 based on satellite observation
Jian Wu
Shaofei Kong
Fangqi Wu
Yi Cheng
Shurui Zheng
Qin Yan
Huang Zheng
Guowei Yang
Mingming Zheng
Dantong Liu
Delong Zhao
Shihua Qi
Open biomass burning (OBB) has significant impacts on air pollution, climate change and potential human health. OBB has gathered wide attention but with little focus on the annual variation of pollutant emission. Central and eastern China (CEC) is one of the most polluted regions in China. This study aims to provide a state-of-the-art estimation of the pollutant emissions from OBB in CEC from 2003 to 2015, by adopting the satellite observation dataset – the burned area product (MCD64Al) and the active fire product (MCD14 ML) – along with local biomass data (updated biomass loading data and high-resolution vegetation data) and local emission factors. The successful adoption of the double satellite dataset for long-term estimation of pollutants from OBB with a high spatial resolution can support the assessing of OBB on regional air quality, especially for harvest periods or dry seasons. It is also useful to evaluate the effects of annual OBB management policies in different regions. Here, monthly emissions of pollutants were estimated and allocated into a 1×1 km spatial grid for four types of OBB including grassland, shrubland, forest and cropland. From 2003 to 2015, the emissions from forest, shrubland and grassland fire burning had an annual fluctuation, whereas the emissions from crop straw burning steadily increased. The cumulative emissions of organic carbon (OC), elemental carbon (EC), methane (CH4), nitric oxide (NOx), non-methane volatile organic compounds (NMVOCs), sulfur dioxide (SO2), ammonia (NH3), carbon monoxide (CO), carbon dioxide (CO2) and fine particles (PM2.5) were 3.64×10³, 2.87×10², 3.05×10³, 1.82×10³, 6.4×10³, 2.12×10², 4.67×10², 4.59×10⁴, 9.39×10⁵ and 4.13×10³ Gg in these years, respectively. Crop straw burning was the largest contributor for all pollutant emissions, by 84 %–96 %. For the forest, shrubland and grassland fire burning, forest fire burning emissions contributed the most, and emissions from grassland fire were negligible due to little grass coverage in this region. High pollutant emissions concentrated in the connection area of Shandong, Henan, Jiangsu and Anhui, with emission intensity higher than 100 tons per square kilometer, which was related to the frequent agricultural activities in these regions. Peak emission of pollutants occurred during summer and autumn harvest periods including May, June, September and October, during which ∼50 % of the total pollutant emissions were emitted in these months. This study highlights the importance of controlling the crop straw burning emissions. From December to March, the crop residue burning emissions decreased, while the emissions from forest, shrubland and grassland exhibited their highest values, leading to another small peak in emissions of pollutants. Obvious regional differences in seasonal variations of OBB were observed due to different local biomass types and environmental conditions. Rural population, agricultural output, economic levels, local burning habits, social customs and management policies were all influencing factors for OBB emissions.
- Article
(10527 KB) - Full-text XML
-
Supplement
(977 KB) - BibTeX
- EndNote


Open biomass burning (OBB), which includes forest, shrubland, grassland and crop residue fire burning (van der Werf et al., 2010; Qiu et al., 2016), is one of the most important sources for gaseous and particulate matter (PM) especially for fine particulate particles (PM2.5) and associated carbonaceous aerosols (elemental carbon, EC; organic carbon, OC) (Zha, 2013; Yan et al., 2014; Zong et al., 2016; Zhou et al., 2017). Previous studies have shown that OBB contributed to approximately 40 % of the annual average submicron EC emission and 65 % of primary OC emission globally (Bond et al., 2013), and contributed more than 45 % of PM2.5 concentration on days of heavy air pollution (Deng, 2011). The pollutants with high emission amounts from OBB posed significant impacts on regional and global climate change, air quality and human health (Seiler and Crutzen, 1980; Crutzen and Andreae, 1990; Andreae and Merlet, 2001; Bond et al., 2004; Akagi et al., 2011; H. Zhang et al., 2016).
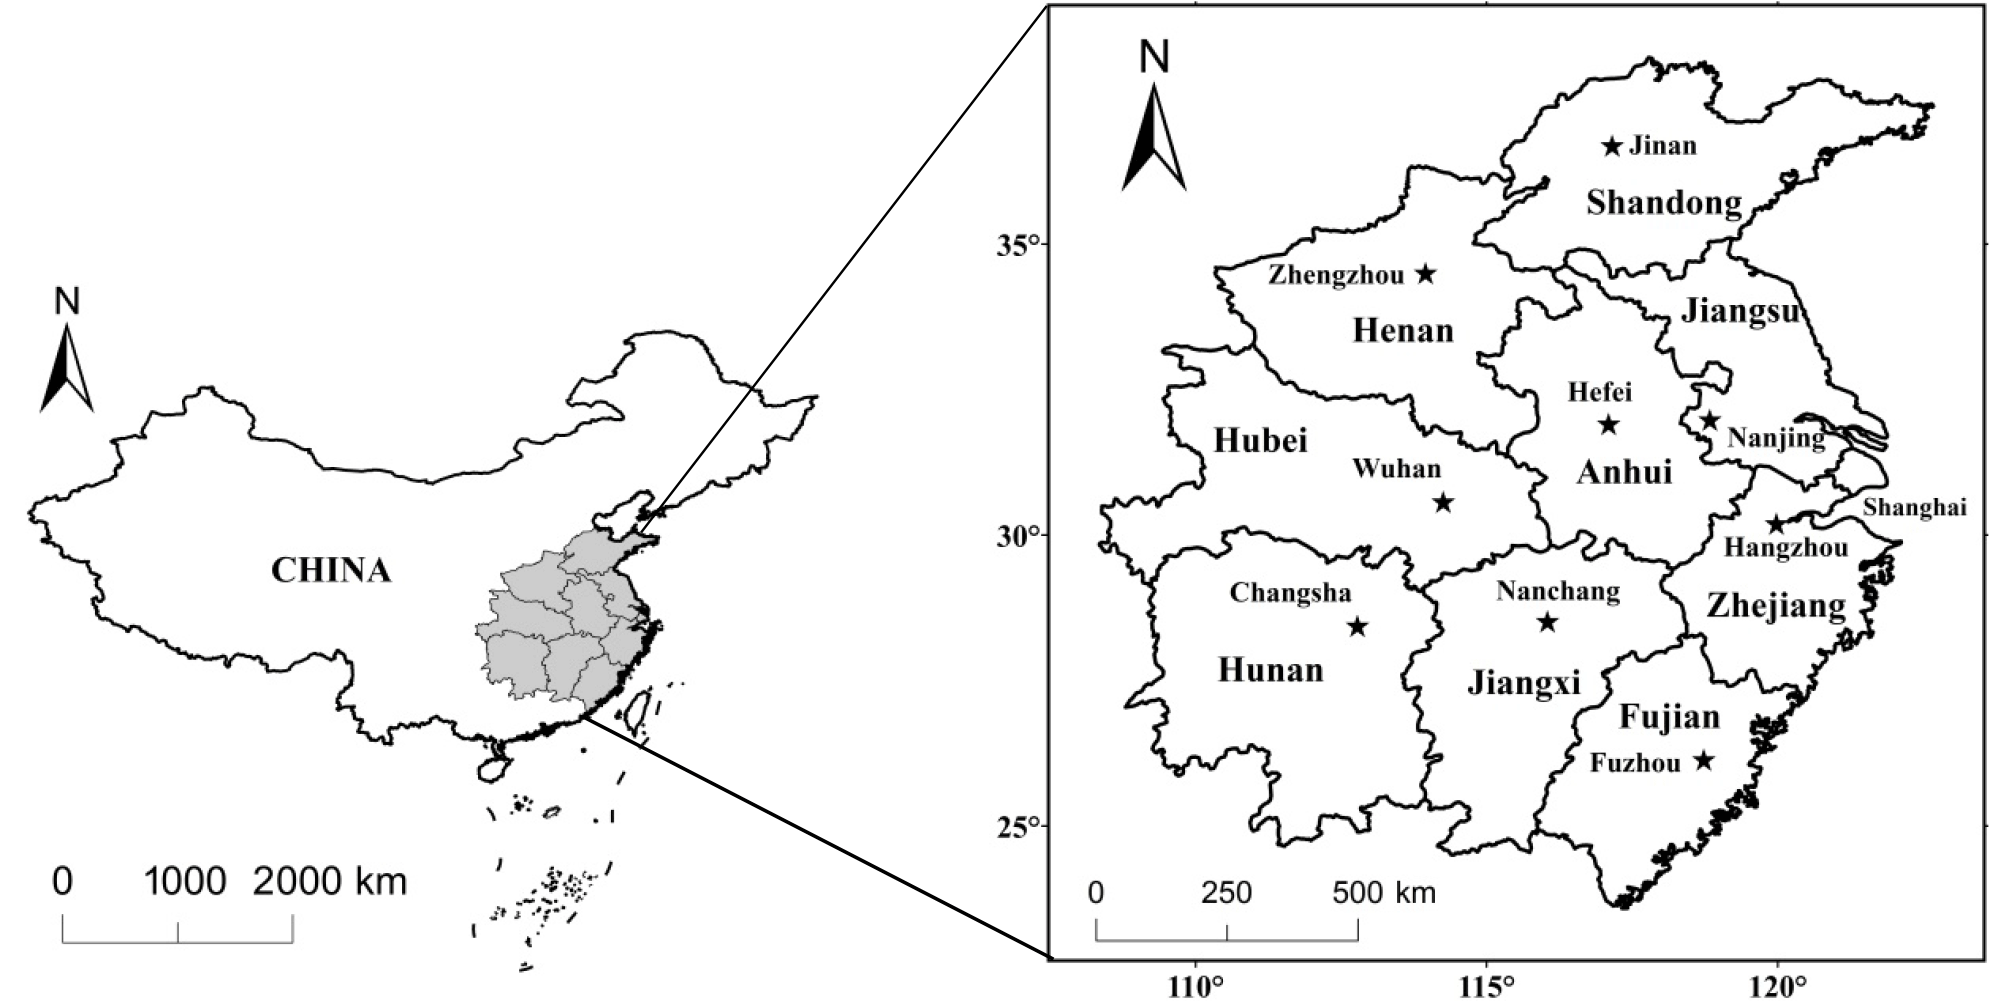
From the 1970s (Crutzen et al., 1979), emission estimation of biomass burning has been a research hot topic from global (Seiler and Crutzen, 1980; Levine et al., 1995; Liousse et al., 1995; Bond et al., 2004; Randerson et al., 2012; Kaiser et al., 2012) to regional scale (Yevich and Logan, 2003; Liousse et al., 2010; Li et al., 2017). China is suffering from severe air pollution with 100 million tons of biomass open burned each year (Zhang et al., 2015). The quantitative estimation of pollutant emissions for all of China (Streets et al., 2003; Tian et al., 2002; Cao et al., 2005; Zhou et al., 2017) or a certain region (Liu et al., 2015; Zhou et al., 2015; Jin et al., 2017a) is also a vital practice, which is the base for assessing the impact of OBB on regional air quality deterioration. Central and eastern China (CEC), including central China (Hunan, Henan and Hubei) and eastern China – part of the North China Plain (Shandong), the Yangtze River Delta (YRD, including Zhejiang, Jiangsu, Anhui and Shanghai) and part of the Pan-Pearl River Delta (Fujian and Jiangxi) (Fig. 1) – is an area with plenty of vegetation coverage (as listed in Fig. S1 of the Supplement). Yin et al. (2017) have indicated that the crop residue fire burning during summer harvest time can lead to the increase of PM2.5 concentration in China's middle east region. As one of the most heavily polluted regions in China (Chang et al., 2009; Fu et al., 2013), many large cities are included in this region, such as Nanjing, Wuhan, Shanghai and Hangzhou. Former studies have highlighted the role of OBB on worsening air quality regionally or in megacities, especially for crop residue burning during harvest periods (Yamaji et al., 2010; Zhu et al., 2010; Huang et al., 2012b; Su et al., 2012; Cheng et al., 2014; Zhou et al., 2016; Zhang et al., 2017).
Previous studies mainly focused on crop residue burning emissions with relatively low spatial and temporal resolution (Yamaji et al., 2010; Huang et al., 2012b), which may limit its adoption in air quality modeling to give an accurate result. An accurate estimation of monthly emissions from OBB with a long timescale and high spatial resolution is still limited. It should be noted that OBB activities showed spatial–temporal variation properties and have changed greatly during the last two decades in China, especially for forest land fire burning (Huang et al., 2011) and crop residue burning, considering the implementation of related policies (Tables S1 and S2 in the Supplement). As a big agricultural country, the Chinese government has placed a high priority on environmental pollution prevention caused by OBB. From 1965 to 2015, 51 management documents for crop straw have been formulated and 34 documents were intensively issued after 2008 (Chen et al., 2016). Up to now, few studies have accurately estimated the biomass burning emissions in a long time period (Fu et al., 2013; Cheng et al., 2014). The role of the pollution prevention policies on the spatial–temporal variation of pollutants emitted needs to be better clarified.
In addition, most previous studies have adopted the top-down method (Seiler and Crutzen, 1980) to estimate OBB emissions by national or provincial statistical data, and then the total emission amounts of pollutants were re-allocated in grids by population, land cover area or even equal sharing, which is one of the key reasons for the high uncertainties of OBB emission inventories (Streets et al., 2003; Klimont and Streets, 2007; Gadde et al., 2009; He et al., 2011; Zhou et al., 2015, 2017). Quantitative estimation of biomass burning was highly improved by the satellite observations of fire burned area or active burning fires (Freitas et al., 2005; Wooster et al., 2005; Roy et al., 2008; Giglio et al., 2008; Reid et al., 2009; Sofiev et al., 2009; Liousse et al., 2010; Huang et al., 2012a; Li et al., 2016). The improvement of spatial–temporal distribution evolution was achieved by active fire products (e.g., the AVHRR fire count product, Setzer and Pereira, 1991; Moderate Resolution Imaging Spectroradiometer (MODIS) active fire satellite products, Cooke et al., 1996; and VIRS fire count product, Ito and Akimoto, 2007). The burned area detection was improved by burned area products (e.g., GBA2000 product, Ito and Penner, 2004; Korontzi, 2005; MODIS burned area dataset, Ito and Akimoto, 2007; and Global Fire Emissions Database (GFED), Randerson et al., 2012). However, satellite observation also exhibited weakness in estimating fire burning emissions (Duncan et al., 2003; He et al., 2015). One is the burned area product, which provides fire burned areas of the whole month. It is limited by the lower pixel resolutions. The sizes of many small burn scars are below the detection limit of these products (Eva and Lambin, 1998; Laris, 2005; McCarty et al., 2009; Roy and Boschetti, 2009). Therefore, the contribution of small fires to fire burned area and the corresponding fire burning emissions are still poorly understood (Randerson et al., 2012). The other is the active fire product, which can provide information on small fire locations, occurrence time and small fire burned area (Prins and Menzel, 1992; Giglio et al., 2006; Chuvieco et al., 2008; Roberts et al., 2009; Aragao and Shimabukuro, 2010; Bowman et al., 2011; Lin et al., 2012; Arino et al., 2012). The uncertainty of fire detection is mainly due to the limitation of satellite overpass periods. To reduce the uncertainty of emission estimation by satellite products, the combination of two satellite datasets has proven to be an effective practice recently (Qiu et al., 2016).
Table 1Forest, shrubland and grassland biomass fuel loading (kt km−2) in each province.
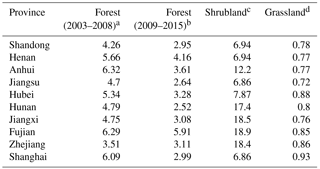
References: a Fang et al. (1996). b This study. c Pu et al. (2004). d Hu et al. (2006).
The lack of local biomass data (biomass loading data and vegetation speciation data) and local emission factors could introduce uncertainty in emission estimates. Currently, local biomass loading data need to be updated and accurately measured. Local high-spatial-resolution vegetation speciation data have been rarely adopted in OBB estimations. Meanwhile, a lot of research on OBB has used the same emission factors for pollutants emitted from OBB without considering the various biomass species and combustion conditions (Andela et al., 2013; Giglio et al., 2013). All these should be considered and improved in the establishment of an OBB emission inventory.
In this study, the multiple satellite data (MCD14 ML and MCD64Al), local high spatial resolution of vegetation speciation data, updated local biomass loading data, local emission factors and survey results were used to estimate multi-year OBB emissions from 2003 to 2015 in CEC. High spatial–temporal resolution of emission allocation was achieved. The possible driving factors like local habits, social customs, rural population, economic level, agricultural production, energy and pollution control policies which may impact the spatial distribution and temporal variation of OBB emissions were explored. They have been overlooked in previous studies (Song et al., 2009; Chen et al., 2013; Shi et al., 2015a). The results here will provide scientific evidence for policy making on controlling OBB emission and modeling its regional impact on air quality, climate and human health. The methods are also helpful for other regions for OBB emission estimation.
2.1 Estimation of burned areas
OBB emissions in CEC were initially estimated based on the local biomass data (biomass loading data and vegetation speciation data), satellite burned area data (Fig. S2) and emission factors. The fire burning emission amount was calculated by the following equation (Wiedinmyer et al., 2011; Shi et al., 2015b):
where j stands the different aggregated vegetation types; i stands for different pollutant species; is the emission amount of pollutant i in location x and month t; BAx,t is the total burned area (km2) of aggregated vegetation class in location x and month t; CEx is defined as the combustion efficiency in location x; BLx is the biomass fuel loading (kg) in location x; EFi,j is the emission factor of pollutant specie i for vegetation type j.
MODIS burned area product (MCD64Al: http://modis-fire.umd.edu, last access: 7 August 2018) and MODIS active fire product (MCD14 ML: https://earthdata.nasa.gov/faq#ed-firms-faq, last access: 7 August 2018) were combined to obtain accurate open biomass burned area data. MCD64Al had a 500 m spatial resolution and monthly temporal resolution, which could accurately detect the burned area at 500 m pixels. A much lower pixel resolution burning was difficult to detect by this satellite. Therefore, we used MODIS active fire product MCD14 ML as a supplemental tool to obtain the small fire burned area. The active fire detection method based on thermal anomalies could detect fires as low as 1∕20 of a pixel. We resampled the two fire products' data into a 1 km × 1 km grid. The total burned area in each grid cell was estimated by the following equation (Randerson et al., 2012):
where BA is the total fire burned area in grid cell i, month t and aggregated vegetation class j; BA is the MCD64Al burned area in grid cell i, month t and aggregated vegetation class j; BA is the small fire burned area in grid cell i, month t and aggregated vegetation class j.
BA was directly detected from the MCD64Al product. MCD14 ML active fire points in each grid included two parts: active fire points with or near MCD64A1 burned area (FCin) and active fires outside the MCD64Al burned area (FCout). BA was the burned area of FCout. The BA was used as a supplement. Because the active fire product existed as the fire points and could not directly obtain the burned area data, the burned area of the small fire was estimated based on the following method (Randerson et al., 2012):
where BA is the small fire burned area of Fout in grid cell i, month t and aggregated vegetation class j; FC is the total number of MCD14 ML active fires outside of the burned area in grid cell i, month t and aggregated vegetation class j; α is the ratio of BAMCD64A1 to Fin and α is equal to the value of the surrounding grid cell if BAMCD64A1 is equal to 0; γ is an additional unit less scalar which indicates the difference between Fin and Fout and γ is assumed equal to 1 in this research; r denotes the burning region; s indicates the burning period.
2.2 Biomass fuel loading
For forest land, most previous studies used the forest biomass loading data from Fang et al. (1996). The forest biomass loading data in recent years need to be updated. In this study, the forest loading data between 2003 and 2008 were collected from Fang et al. (1996). From 2008 to 2015, the forest loading data were calculated based on the eighth Chinese National Forest Resource Inventory (Xu, 2014). The forest biomass density data (Table 1) were estimated by the following equation:
where i stands for different forest species (broadleaf forest, coniferous forest and mixed forest); r indicates each province; Bi,r is the biomass density of forest specie i in province r; Ti,r indicates the total biomass of forest specie i in province r; Ai,r denotes the total area of forest specie i in province r.
The total biomass of different forest species was calculated based on the forest stock volume method as follows (Fang et al., 1996):
where j stands for different tree types of forest specie i; Ej,r indicates the biomass of different tree type j in province r; Vj,r indicates the forest stock volume of different tree type j in province r; a and b are set as correlation coefficients.
The correlation coefficients “a” and “b” for different tree types were derived from previous studies (Fang et al., 1996; Tian et al., 2011; Lu et al., 2012; Li et al., 2014; Wang and Deng, 2014; Wen et al., 2014) (Table 2). Aj,r and Vj,r were collected from the eighth Chinese National Forest Continuous Inventory. As shown in Table 1, the forest biomass density in recent years has changed a lot, which highlighted the importance of the update for improving the emission estimation.
Table 2Parameters of the linear regression model for biomass and stock volume of dominant tree species.
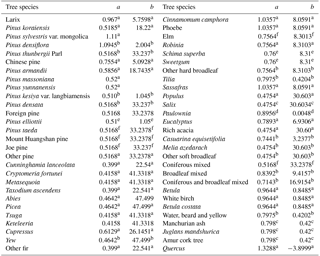
References: a Fang et al. (1996). b Wen et al. (2014). c Lu et al. (2012). d Tian et al. (2014). e Wang and Deng (2014). f Li et al. (2014).
For grassland and shrubland, local biomass density data were collected (Pu et al., 2004; Hu et al., 2006) in Table 1. To determine the accurate provincial amounts of crop residue burning, we gathered the production of different species of crops from the China Statistical Yearbook (NBSC, 2004–2016). Detailed data of crop residue to production ratio (dry matter) were collected from local statistical data (Table 3), and the updated data for crop straw burned ratio were derived from survey results (Table 4). Using the updated biomass data, the accuracy of the estimation of OBB emission is expected to be improved.
Table 3Detailed crop residue to production ratio data for each province.
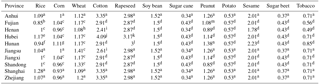
References: a Zhu et al. (2017). b Chen et
al. (2008). c Xie et al. (2011a). d Xie et al. (2011b). e Zeng et al. (2007).
f Ao et al. (2007). g Lei et al. (2009). h Zhao and
Chen (2008).
i Xue et al. (2006). j Yu et al. (2009). k Zou et al. (2008).
l Liu et al. (2010). m Tang et al. (2009). n Li et al. (2008).
Table 4Detailed crop straw burned ratio data for each province.
References: a Tian et al. (2011. b Huang (2014). c Peng et al. (2016). d Zhou et al. (2017).
2.3 Combustion efficiency
In previous studies (Wang and Zhang, 2008; Tian et al., 2011), the combustion efficiency (CE) of OBB was mainly set as a constant, which may bias the emission estimation. To improve the accuracy, for cropland, the CE was set as 0.68 for soy bean and 0.93 for other types (Koopmans and Koppejan, 1997; Wang and Zhang, 2008; Zhang et al., 2011). For forest, shrubland and grassland, the CE of fires at each grid cell was assumed as a function of forest cover of the corresponding grid cell (Ito and Penner, 2004; Wiedinmyer et al., 2006). If areas had tree coverage exceeding 60 %, the CE for woody and herbaceous cover was set as 0.3 and 0.9, respectively; the CE was set as 0 and 0.98 for woody and herbaceous cover with tree coverage less than 40 %; for 40–60 % tree cover of fires, the CE was defined as 0.3 for woody fuels, and the calculation of herbaceous areas was referred to the following equation:
where TB stands for the percent tree cover for fires in each grid cell.
It should be noted that though we improved the selection of CE values for different biomass burning types by reviewing literature, the CE value should not be a constant during burning and the pollution emissions were not uniform in different burning phase, such as smoldering (Kondo et al., 2011) and flaming burning (Burling et al., 2010). Emission inventories in this research and currently published papers (Wang and Zhang, 2008; Zhang et al., 2011; Lu et al., 2011) were estimated for a long time period or a whole year with the timescale as months instead of hours. Therefore, the CE values used here reflected the average biomass burning condition. In the future, for research on developing an emission inventories with hourly or daily resolution, corresponding high-time-resolution activity data and emission factors for different burning stages should be considered.
2.4 Emission factors
Emission factors (EFs) of different OBB were summarized in Table 5. EFs for cropland burning were mainly collected from previous research carried out in CEC (Tang et al., 2014). As there was a lack of EF research on some crop species conducted in CEC and forest, grassland and shrubland conducted in China, EFs were collected from previous research (Cao et al., 2008; Wang and Zhang, 2008; Akagi et al., 2011; He et al., 2015). In addition, some emission factors measured by our research group in CEC were included in this study.
Table 5The emission factors of open biomass burning emissions for various pollutants (g kg−1 dry matter).
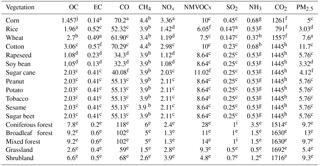
References: a Cao et al. (2008). b Li et al. (2007). c He et al. (2015). d Tang et al. (2014). e Akagi et al. (2011). f Zhang et al. (2008). g EPD (2014). h Wang et al. (2008). i Andreae and Rosenfeld (2008). j This study.
2.5 Spatial and temporal allocation
In order to estimate high spatial resolution of OBB emission in CEC, a high-resolution vegetation map (1:1 000 000) (Fig. S1) together with the burned area of every open biomass species was used. All the data were relocated into a 1 km × 1 km grid to identify and estimate spatial variations of OBB emission. The monthly distributions of OBB emissions were estimated based on the monthly burned area of different vegetation cover types.
The emission in tth grid was calculated by the following equation:
where j means different biomass species; i denotes different provinces; Et,j is the emission of different biomass specie j in tth grid; BAt,j is the burned area in tth grid cell; BAi,j is the total burn area of different vegetation types in province i; Ei,j is the total emission amounts from OBB in province i.
2.6 Other factors influencing OBB emission
Several detailed statistical data in the NBSC were collected, such as rural population, per capita net income of rural residents, agricultural output and forestry output in each province and each year. They may impact OBB emissions. Correlation analyses between OBB emissions and these influencing factors were conducted. Rural population data in 2003, 2004 and 2010 were lacking as the detailed data were not reported in NBSC.
2.7 Uncertainty analysis
The Monte Carlo method together with the Oracle Crystal Ball software was used to evaluate the estimation uncertainty quantitatively for all the pollutants. Pollutant emissions were estimated from 20 000 Monte Carlo simulations with a 95 % coincidence interval.
3.1 Accumulated pollutant emissions from OBB in CEC
Table 6Cumulative emissions of major pollutants from open biomass burning in central and eastern China during 2003–2015 (Gg).
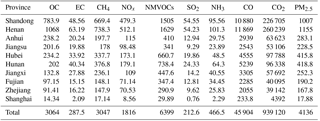
Table 6 presented the cumulative OBB emission amounts during 2003–2015, and multi-year emissions of different provinces were detailedly listed in Table S3. By the end of 2015, the cumulative emissions of OC, EC, CH4, NOx, NMVOCs, SO2, NH3, CO, CO2 and PM2.5 were 3.64×10³, 2.87×10², 3.05×10³, 1.82×10³, 6.4×10³, 2.12×10², 4.67×10², 4.59×10⁴, 9.39×10⁵ and 4.13×10³ Gg, respectively. For better revealing the spatial–temporal variation of OBB emissions, the PM2.5 variation was detailedly discussed as an example. From 2013 to 2015, the highest emission amounts of PM2.5 were found in Henan and Shandong, accounting for 27.93 % and 24.35 % of the total emission amounts, respectively. The lowest emission appeared in Zhejiang and Shanghai, which only contributed 4.05 % and 0.43 %. For other provinces, Hunan, Hubei, Fujian, Anhui, Jiangxi and Jiangsu accounted from 5.52 % to 10.13 % of the total emissions.
The contributions of different biomass burning types for various pollutants were shown in Fig. 2a. Cropland burning contributed the most emission for all the pollutants, by 84 %–96 %. The forest fire exhibited higher emission of NH3, SO2, NMVOCs and PM2.5, accounting for 12 %, 11 %, 7 % and 5 % of the corresponding total emission, respectively. As shown in Fig. 2b, for cropland, wheat, corn and rice straw burning were the top three emission source types for all the pollutants. Corn straw burning contributed the most to SO2 (48 %), NOx (37 %), NMVOCs (33 %), CO (32 %) and CO2 (28 %) emissions. Highest contributions of EC (45 %), OC (33 %) and CH4 (32 %) from rice straw burning were found, while wheat straw burning contributed the most (31 %) to PM2.5 emission.
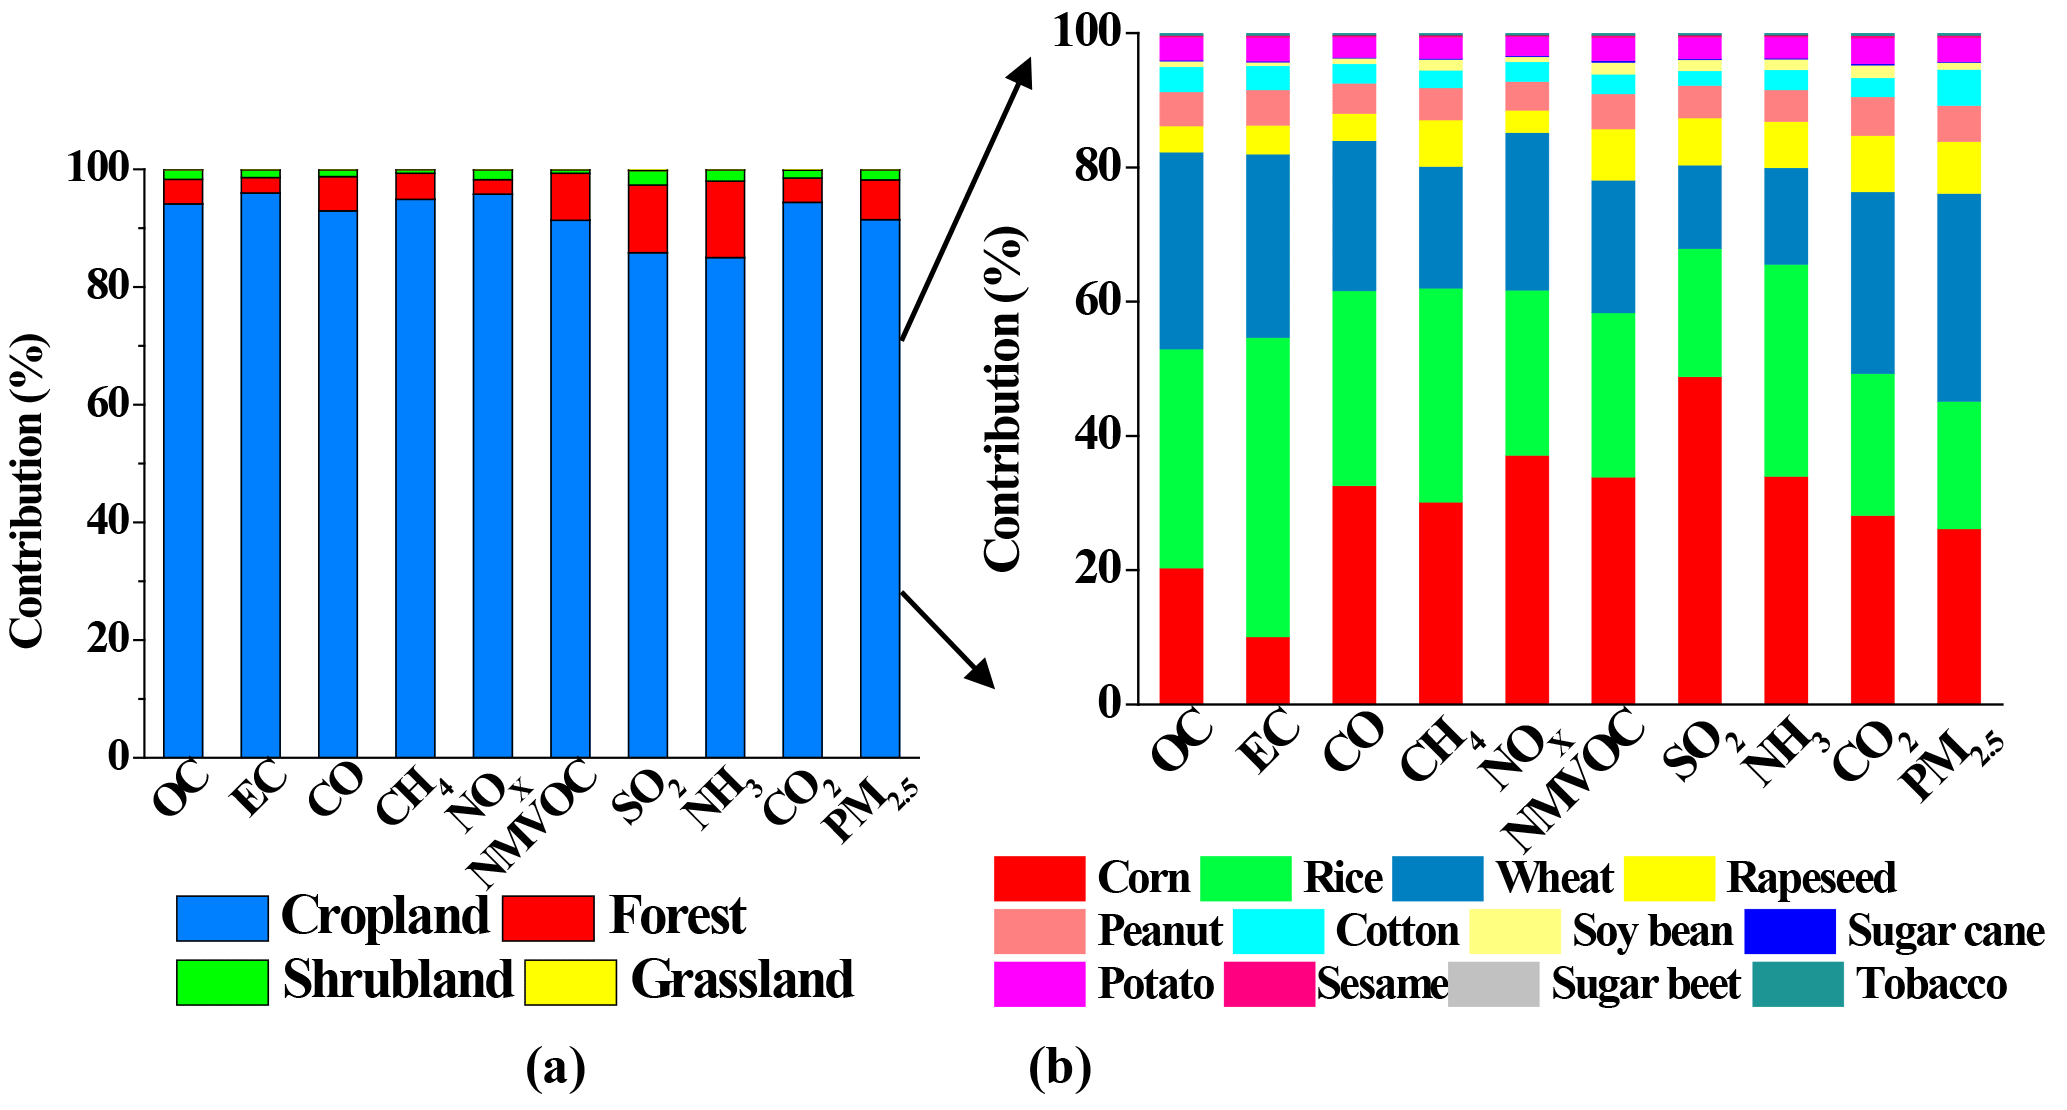
Figure 2The mean contributions of different types of biomass to biomass burning pollutant emission (a) and the mean contributions of different types of crops to cropland accumulative pollutant emission (b) from 2003 to 2015.

Figure 3The averaged contributions of different biomass burning types to PM2.5 emission in each province.
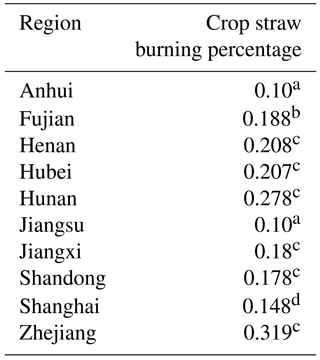
In Fig. 3, except for Fujian, cropland burning emission was the largest contributor to PM2.5 emission, with the contributions ranging from 75.25 % (Jiangxi) to almost 100 % (Shanghai). The higher rural agglomeration, abundant crop production and more crop residue burning activities in these provinces can explain the higher contributions. Shanghai is one of the most developed cities in China. The highest contribution of cropland burning is not related to its high levels of agricultural activities but is due to the lack of emissions from other open biomass burning sources. Highest contribution from the forest fire burning and shrubland fire burning were found in Fujian (45.29 %) and in Jiangxi (23.95 %), respectively. For forest fire burning, the southern provinces (Fujian, Zhejiang, Jiangxi, Hunan, Hubei and Anhui) exhibited higher values, varying from 3.66 % (Hubei) to 38.3 % (Fujian), and for shrubland fire burning, the contributions varied from 1.5 % (Hubei) to 7.23 % (Zhejiang). The relatively high emission contributions of forest and shrubland fire burning in the southern provinces can be explained by the large forest and shrubland coverage, frequent human forestry activities, low precipitation and dry weather in spring and winter (Cao et al., 2015), which may easily lead to forest and shrubland fires. However, for the northern provinces (Shandong, Henan and Jiangsu), the contributions ranged around 0.76 %–1.97 %, which can be neglected. PM2.5 emission from grassland in CEC was negligible with the following provinces holding higher contributions: Jiangxi (0.8 %), Hunan (0.25 %), Fujian (0.11 %) and Anhui (0.1 %).
From Fig. 4, emissions from wheat and corn straw burning mainly concentrated in Shandong and Henan (totally accounting for 82 % and 78 % of the total emissions, respectively), and the rice straw burning exhibited higher concentrations in the Hunan, Jiangxi and Hubei provinces, by 25 %, 18 % and 16 %, respectively. The total contributions of rapeseed, cotton, potato and peanut straw burning to the PM2.5 emission were relatively small, accounting for 21 %–24 % of the total emissions. Most emissions from cotton, peanut and potato straw burning were located in Shandong (totally accounting for 35 %, 35 % and 20 %) and Henan (totally accounting for 19 %, 40 % and 15 %). Hubei (32 %) and Hunan (31 %) were the major provinces for rapeseed straw burning emissions. In addition, emissions from soy bean, sugar cane, tobacco, sesame and sugar beet straw burning were negligible, and never exceeded 1 % of total crop residue burning emission in this study.
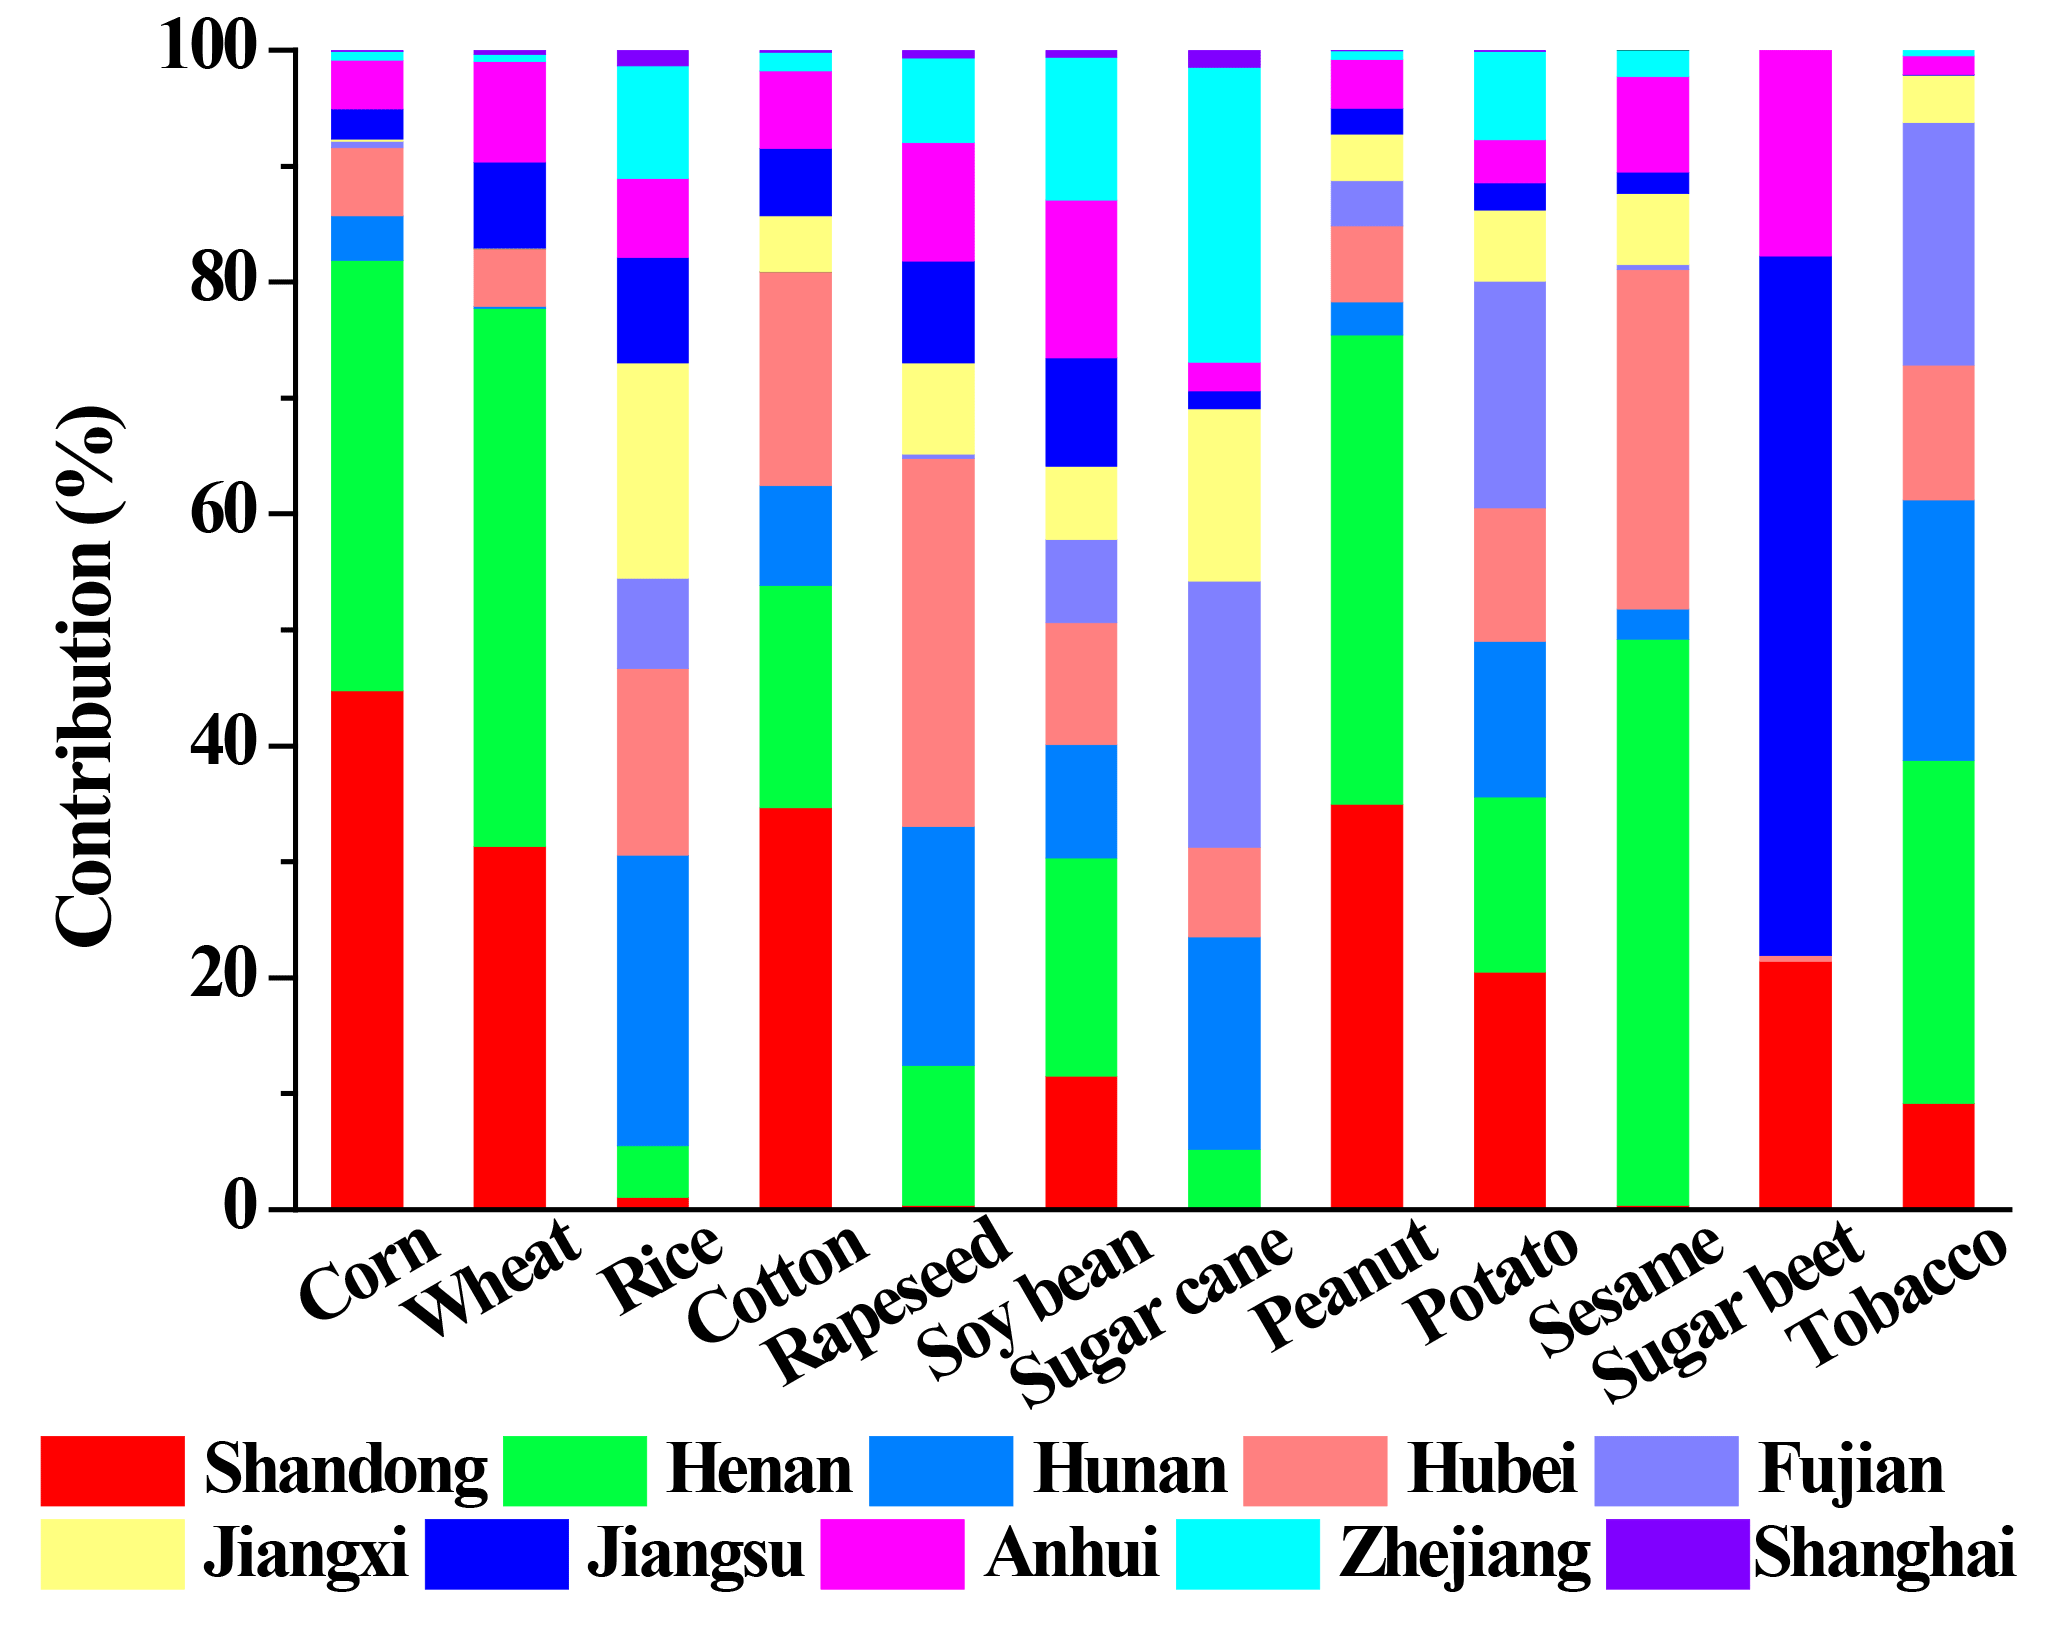
Figure 4The averaged contributions of various crop straw burning to cropland PM2.5 emission in different provinces.
3.2 Temporal variation and spatial distribution for OBB emissions in CEC
3.2.1 Yearly variation
Multi-year emissions of OBB from 2003 to 2015 in CEC were shown in Fig. 5. The multi-year variation of OBB emissions for various pollutants was similar (Fig. 6).
The increase of crop residue burning dominated the significant growth of OBB emission. Pollutants emitted from OBB all increased obviously from 2003 to 2008. Then, with the adoption of strict control policies (Table S1 in Supplement), the growth of crop residue burning emission gradually slowed down. The forest, shrubland and grassland fire burning were related to weather conditions and human activities. Their emissions were difficult to predict and control, and random yearly variation existed. Therefore, we discussed the multi-year variation during 2003–2015 instead of the overall trend for the whole period (Fig. S3). Taking PM2.5 as example, emissions exhibited a clearly increasing trend from 2003 (256 Gg) to 2008 (353 Gg) and then decreased in the following 2 years to 322 Gg. After 2010, there existed higher (2011, 2013 and 2015) and lower values (2010, 2012 and 2014) alternately. The values in 2011, 2013 and 2015 all did not exceed the peak values in 2008.
Emissions from forest, shrubland and grassland fire burning have an obvious trend of declining from 2003 to 2006 and rising from 2006 to 2008. Peak emissions for PM2.5 from forest, shrubland and grassland fire burning were found in 2008, as 49, 8.9 and 0.7 Gg, respectively. In 2008, intensive policies for utilization of straw energy (Table S1) and strengthening the forestry fire prevention (Table S2) were published, which effectively limited the emissions from forest and shrubland fire burning as shown in Fig. 6a. Obvious decreasing was found from 2008 to 2010, down to 19, 4.8 and 0.24 Gg, respectively. Then, they exhibited interannual oscillation from 2010 to 2015, with higher emission in 2011, 2013 and 2015 and lower emission in 2012 and 2014 (Jin et al., 2017a). The multi-year tendency for forest, shrubland and grassland fire burning was mainly affected by the variations in climate, management measures and other human forcing. It can also be concluded that the yearly fluctuation of pollutants from OBB was mainly impacted by the emissions of forest, shrubland and grassland fire burning, but not the crop residue burning.
The emission of PM2.5 from crop residue burning exhibited quite different yearly variation trend with other three types of biomass burning, which gradually increased from 2003 (228 Gg) to 2015 (323 Gg), by 29 %. The increase of crop residue production can primarily explain the increasing of pollutant emission. Meanwhile, as shown in Fig. S6 and Table S1, the controlling of pollutants from crop residue burning in China started from 1965. In 2000, the law for prevention of air pollution was published. Then, in 2003, the regulations on straw banning and comprehensive utilization were released. In Fig. 6, we found that the emission of PM2.5 from crop residue burning significantly increased from 2003 (228 Gg) to 2008 (294 Gg), due to the increase of crop production and deficiency of strict control policies in this period (Table S1). Although emissions from forest, shrubland and grassland fire burning fluctuated markedly during this period, the obvious increase of crop residue burning dominated the total growth of OBB emission from 2003 to 2008 as their higher emission amounts. From 2008 to 2015, strict policies were developed to improve the straw energy utilization and reduce the air pollution raised by its burning. However, it has to be noted that the policies may not be well implemented, with the annual averaged increasing amounts of 7.3 Gg for PM2.5. From Fig. 6b, the large contributions to PM2.5 (22 %–28 % and 29 %–33 %) and increasing trends for corn straw burning and wheat straw burning could be found, which should be further focused. The contribution of rice straw burning has slightly decreased in the research period, by about 19 %. Other types of biomass totally accounted for averaged 25 % of PM2.5 emission and all exhibited a slightly increasing trend from 2003 to 2015, by about 21 %–29 %.
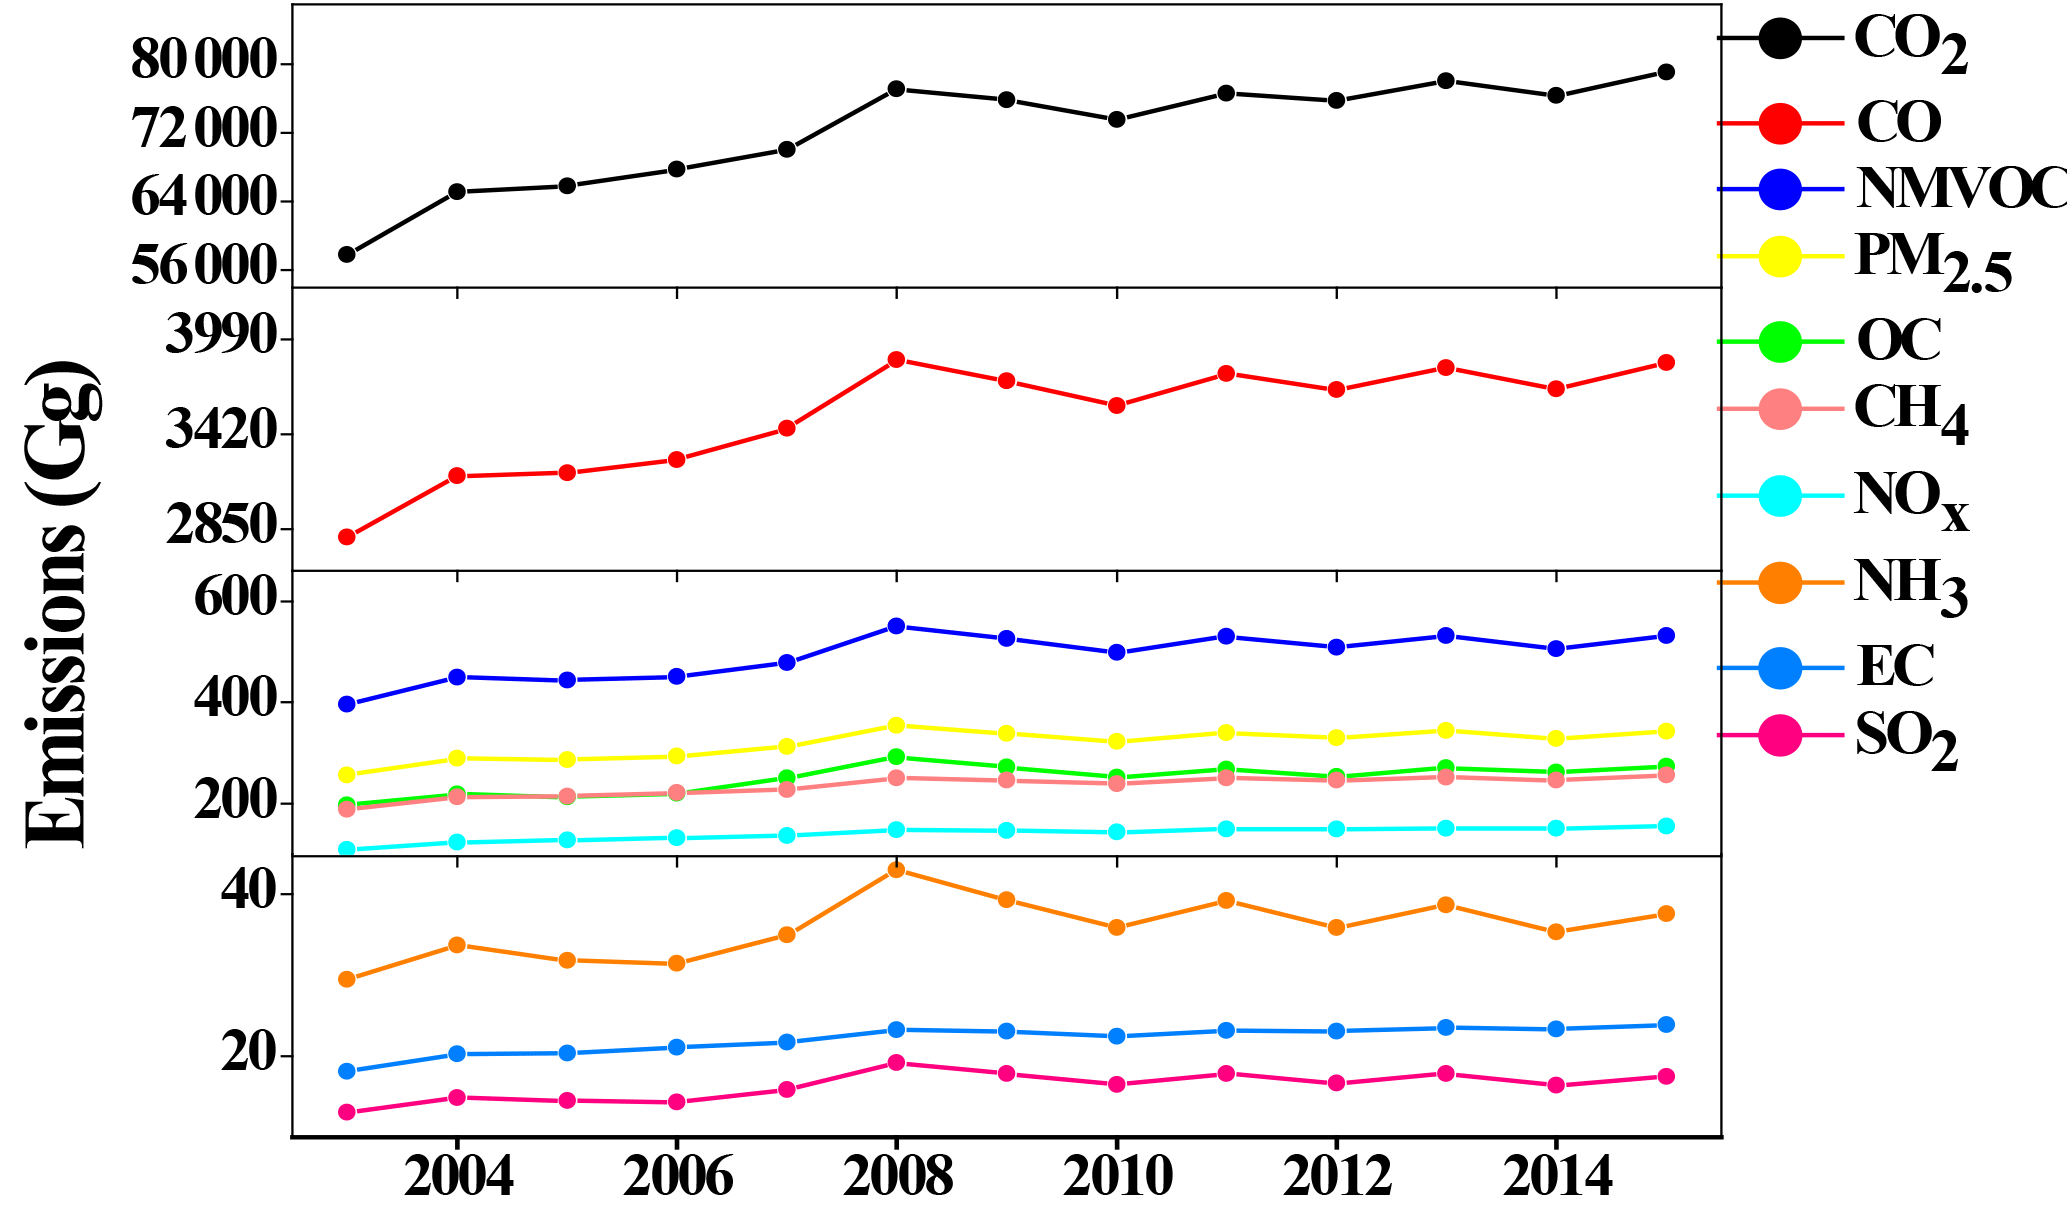

Figure 6The multi-year PM2.5 emissions of different opening biomass burning sources (a) and various crop types (b) from 2003 to 2015.
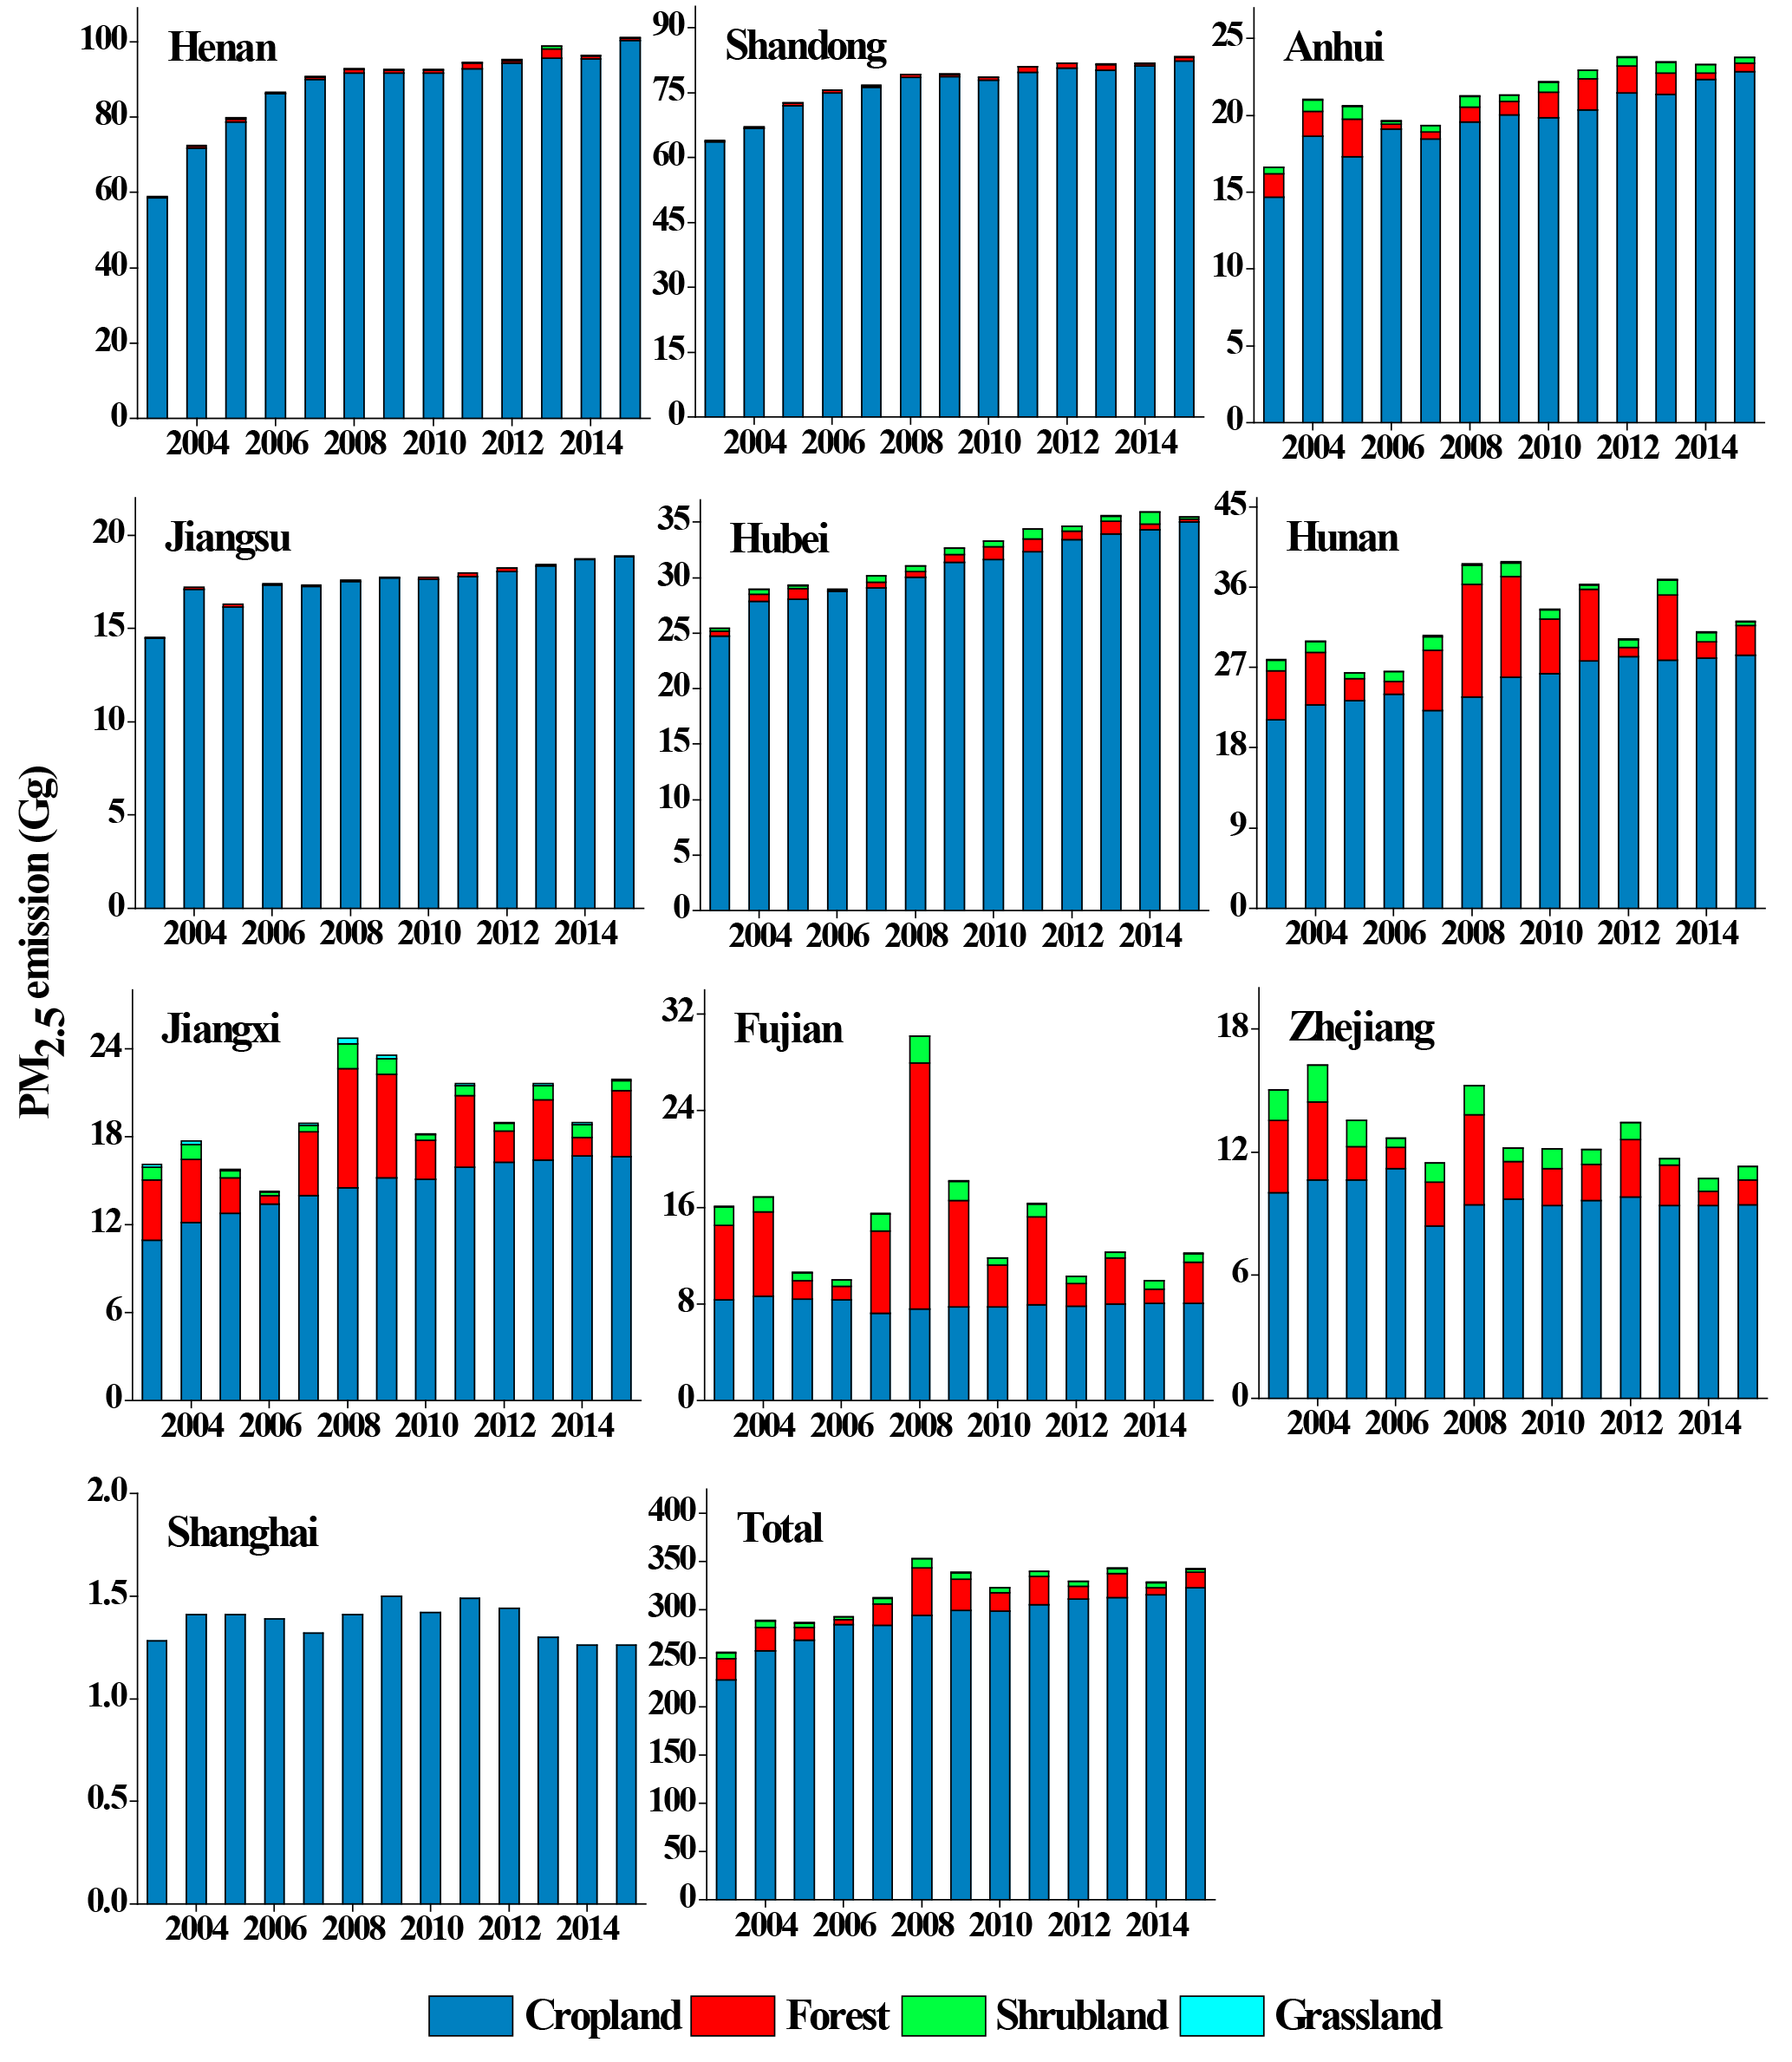
Figure 7The multi-year PM2.5 emissions of the four types of biomass burning in different provinces from 2003 to 2015.
Figure 7 showed that the crop residue burning emissions in Henan, Shandong, Anhui, Jiangsu, Hubei, Hunan and Jiangxi exhibited obvious increasing trends, which suggested the importance of crop residue burning control in these provinces. For Fujian and Zhejiang, no obvious increase for cropland burning emission was found, implying that the emission has been well controlled in these years. It should be noted that in Fujian and Zhejiang, the main crop is rice, while in other provinces, the main crops are corn and wheat, especially in the northern provinces. To conclude, pollutants emitted from crop straw burning (wheat, corn and rice) are now still the key sources for air pollution, in view of its increasing emission trend. The randomness of burning activities and corresponding widespread and scattered distribution make it difficult to control them. The wheat and corn emissions in the northern provinces and rice burning emissions in the southern provinces should be controlled specially in the future.

Figure 8The monthly PM2.5 emissions of different open biomass burning from 2003 to 2015 for all of central and eastern China (a) and each province (b).
In Fig. 8, the PM2.5 emission from crop residue burning exhibited higher amounts for the Henan and Shandong provinces in 2015 (100 and 82 Gg, respectively), which are 200 %–1200 % of those for other provinces. As the main source regions for air pollution of the Yangtze River Delta (YRD) and Beijing–Tianjin–Hebei (BTH) region (Fu et al., 2013; Zhou et al., 2015), the enforced and effective control of crop residue burning in the two provinces during summer and autumn harvest periods is important for improving the air quality of these regions.
3.2.2 Monthly distribution
The monthly PM2.5 emission variation of different OBB in CEC was shown in Fig. 8a. PM2.5 emission demonstrated higher amounts in May and June (90.4–179.3 Gg), followed by December to March of next year (32.2–127.3 Gg) and September–October (8.2–89.2 Gg), and was lowest during July–August (14.3–65.9 Gg). As the emission amount of cropland fire burning was 1 or 2 orders of magnitude higher than other three types of biomass burning, the monthly variation of total PM2.5 emission was dominantly controlled by the crop residue fire burning (L. Zhang et al., 2016). The periods with highest PM2.5 emissions were the summer and autumn harvest times, when the burning activities were more frequent. The peak of open biomass fire burning occurred in May and June, totally accounted for 42 % of the total PM2.5 emissions in 2003–2015, which is caused by the harvest and open residue burning of winter wheat, especially in Henan, Shandong, Jiangsu and Anhui (Fig. 8b). Large amounts of wheat straw were burned after the harvest to increase the soil fertility and prepare for following corn cultivation (Levine et al., 1995). The small peak of open biomass burning emission in September to October (totally accounted for 13.82 % of the total PM2.5 emissions in 2003–2015) can be attributed to the burning of corn straw after corn harvest. Though the open biomass burning was strictly forbidden in recent years, scattered burning activities still existed in these regions. As shown in Fig. S4, the PM2.5 emissions in CEC and major agricultural provinces during harvest time have shown a rapid decline in recent years, in accordance with the change tendency of burned area due to increased government management. Considering the yearly increasing fact of crop straw burning, it is worth noting that fire burning during the harvest season as a way of circumventing governmental polices needs to be well regulated. From December to February, the crop residue burning emissions decreased to the lowest level in the entire year (18.9 % of the total PM2.5 emissions in 2003–2015). However, the emissions of PM2.5 from forest, shrubland and grassland burning achieved peak values from December to March, being 67 % of those in 2003–2015.
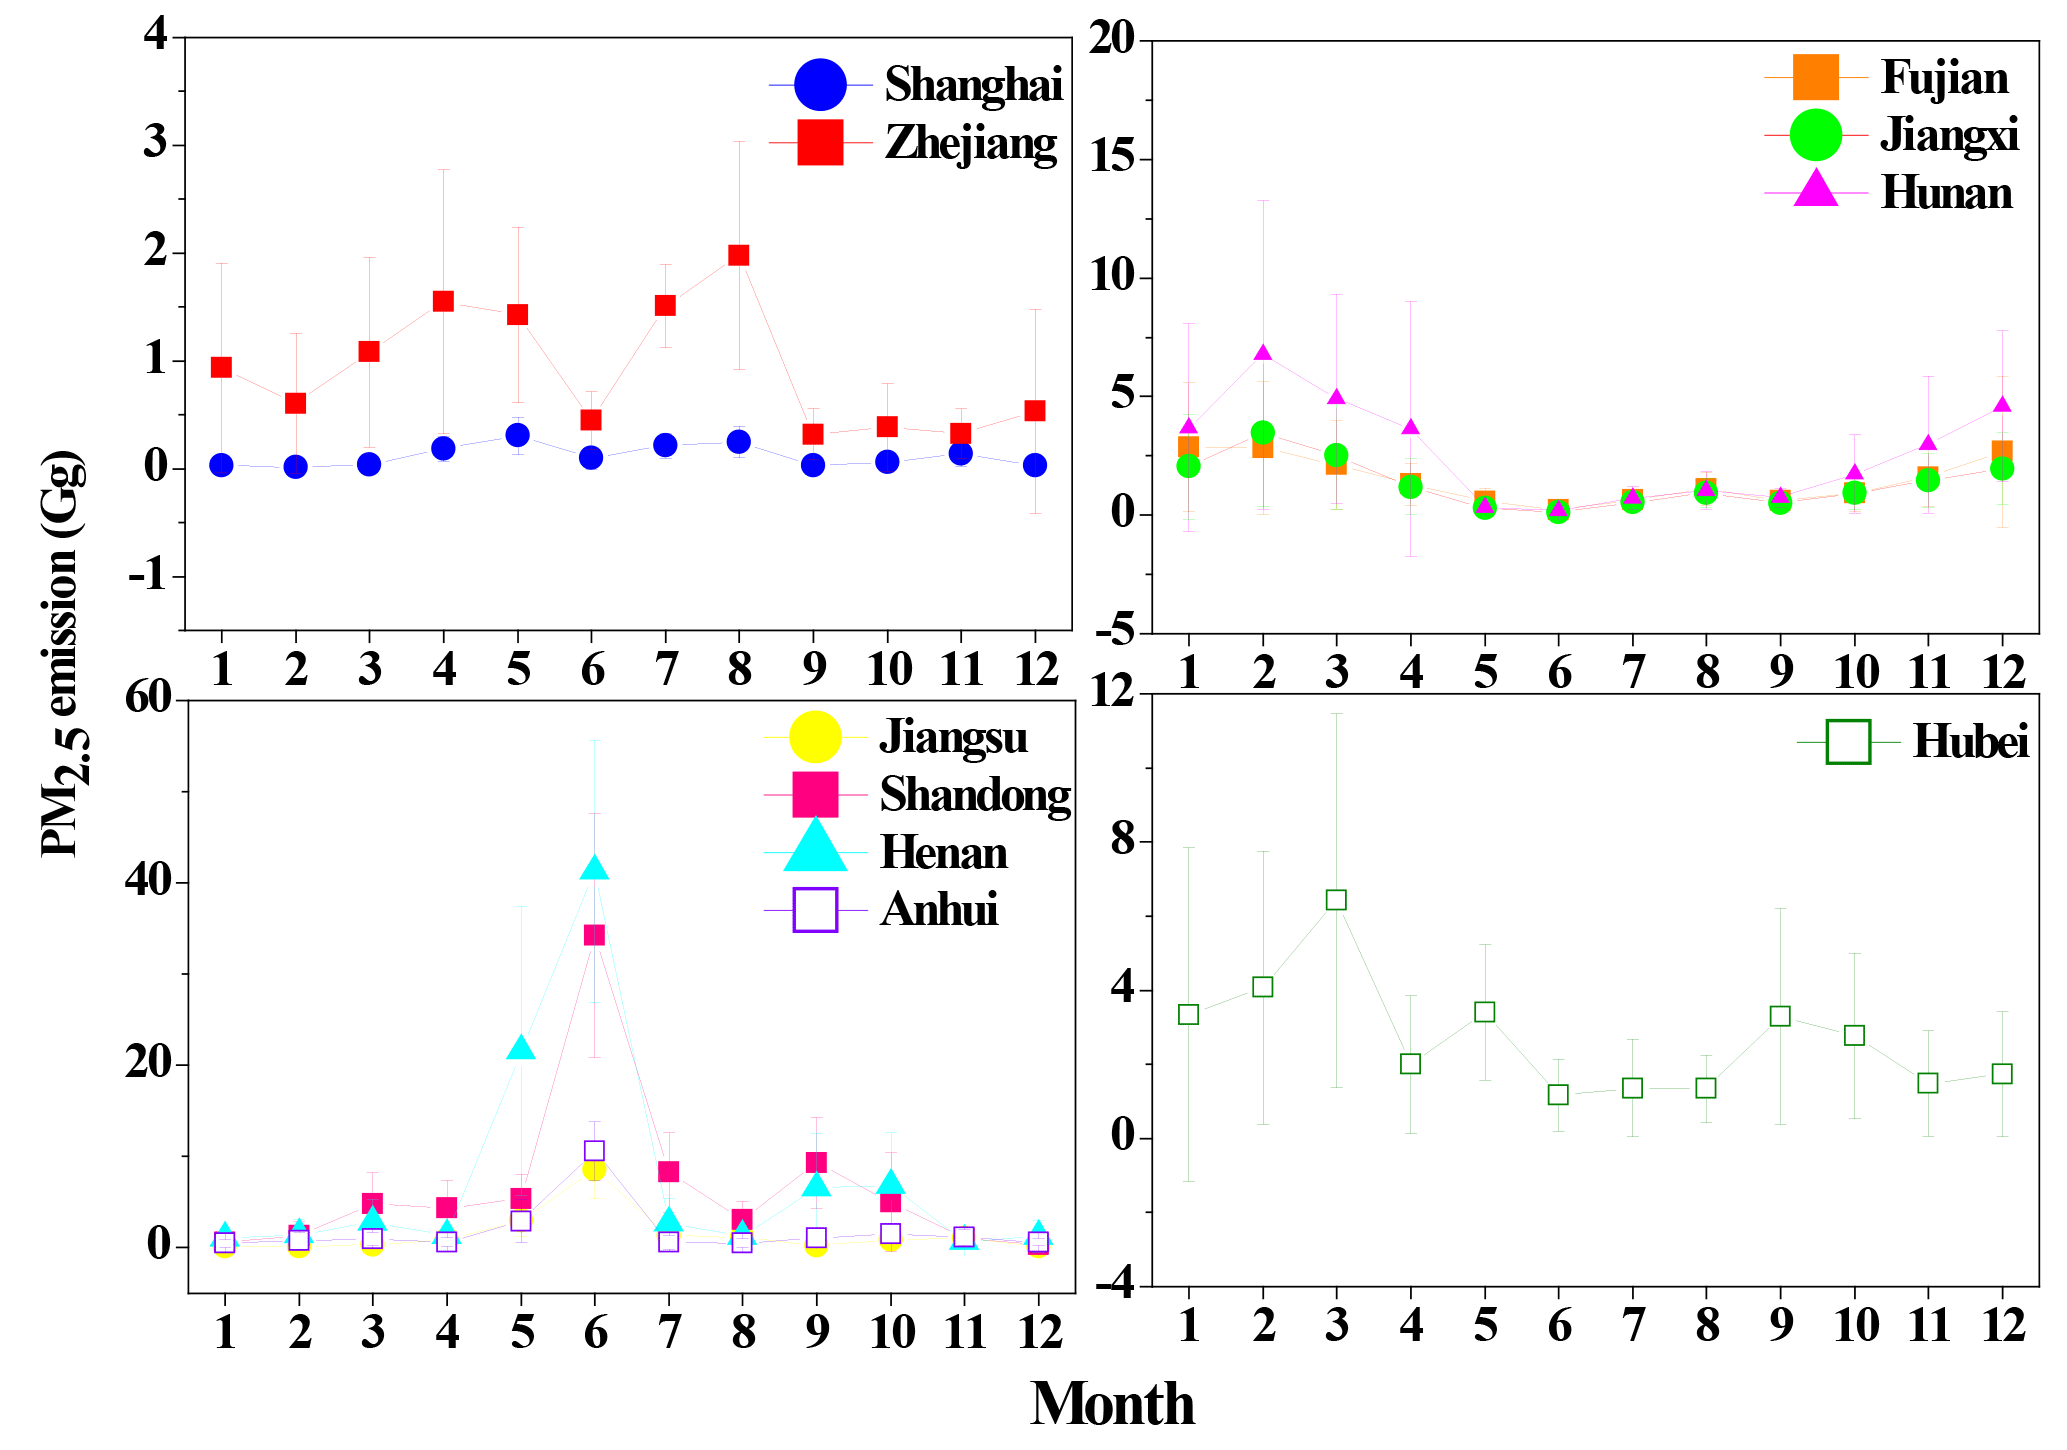
Figure 9 clearly listed the monthly average emissions of PM2.5 from OBB in different provinces. These provinces were classified based on the correlation between their monthly emissions of 2003–2015. The Henan, Shandong, Anhui and Jiangsu provinces (R2 higher than 0.92, p<0.01), as one of the largest and contiguous wheat planting areas in China (Fang et al., 2014), have two crop rotations. The highest monthly emissions were observed for winter wheat harvesting (sown in October and harvested from May to June) and corn harvesting (sown in middle June and harvested from September to October). A large proportion of crop straw was always burnt directly after the crop harvest (MEPC, 2015). For the Hubei province, agricultural emissions fluctuated over the period from February to October with several peaks because different crop species matured in succession. In Jiangxi, Fujian and Hunan (R2 higher than 0.9, p<0.01), the largest monthly emissions were observed with forest and shrubland fire burning during the time between December and March, which is the dry season in these provinces (Li et al., 2014, 2015), while in other months, the emissions were limited. For Shanghai and Zhejiang (R2=0.7, p<0.01), lowest levels of PM2.5 emission were found, with peak values occurring during the summer and autumn harvest periods. An obvious two peaks were found for April–May and July–August periods, which may reflect the rice harvesting at these times. To sum up, the regional differences of monthly PM2.5 emissions from OBB were mainly caused by the different biomass burning types and times, as well as corresponding environmental conditions.
3.2.3 Spatial distribution within 1 km × 1 km of PM2.5 emitted from OBB in CEC
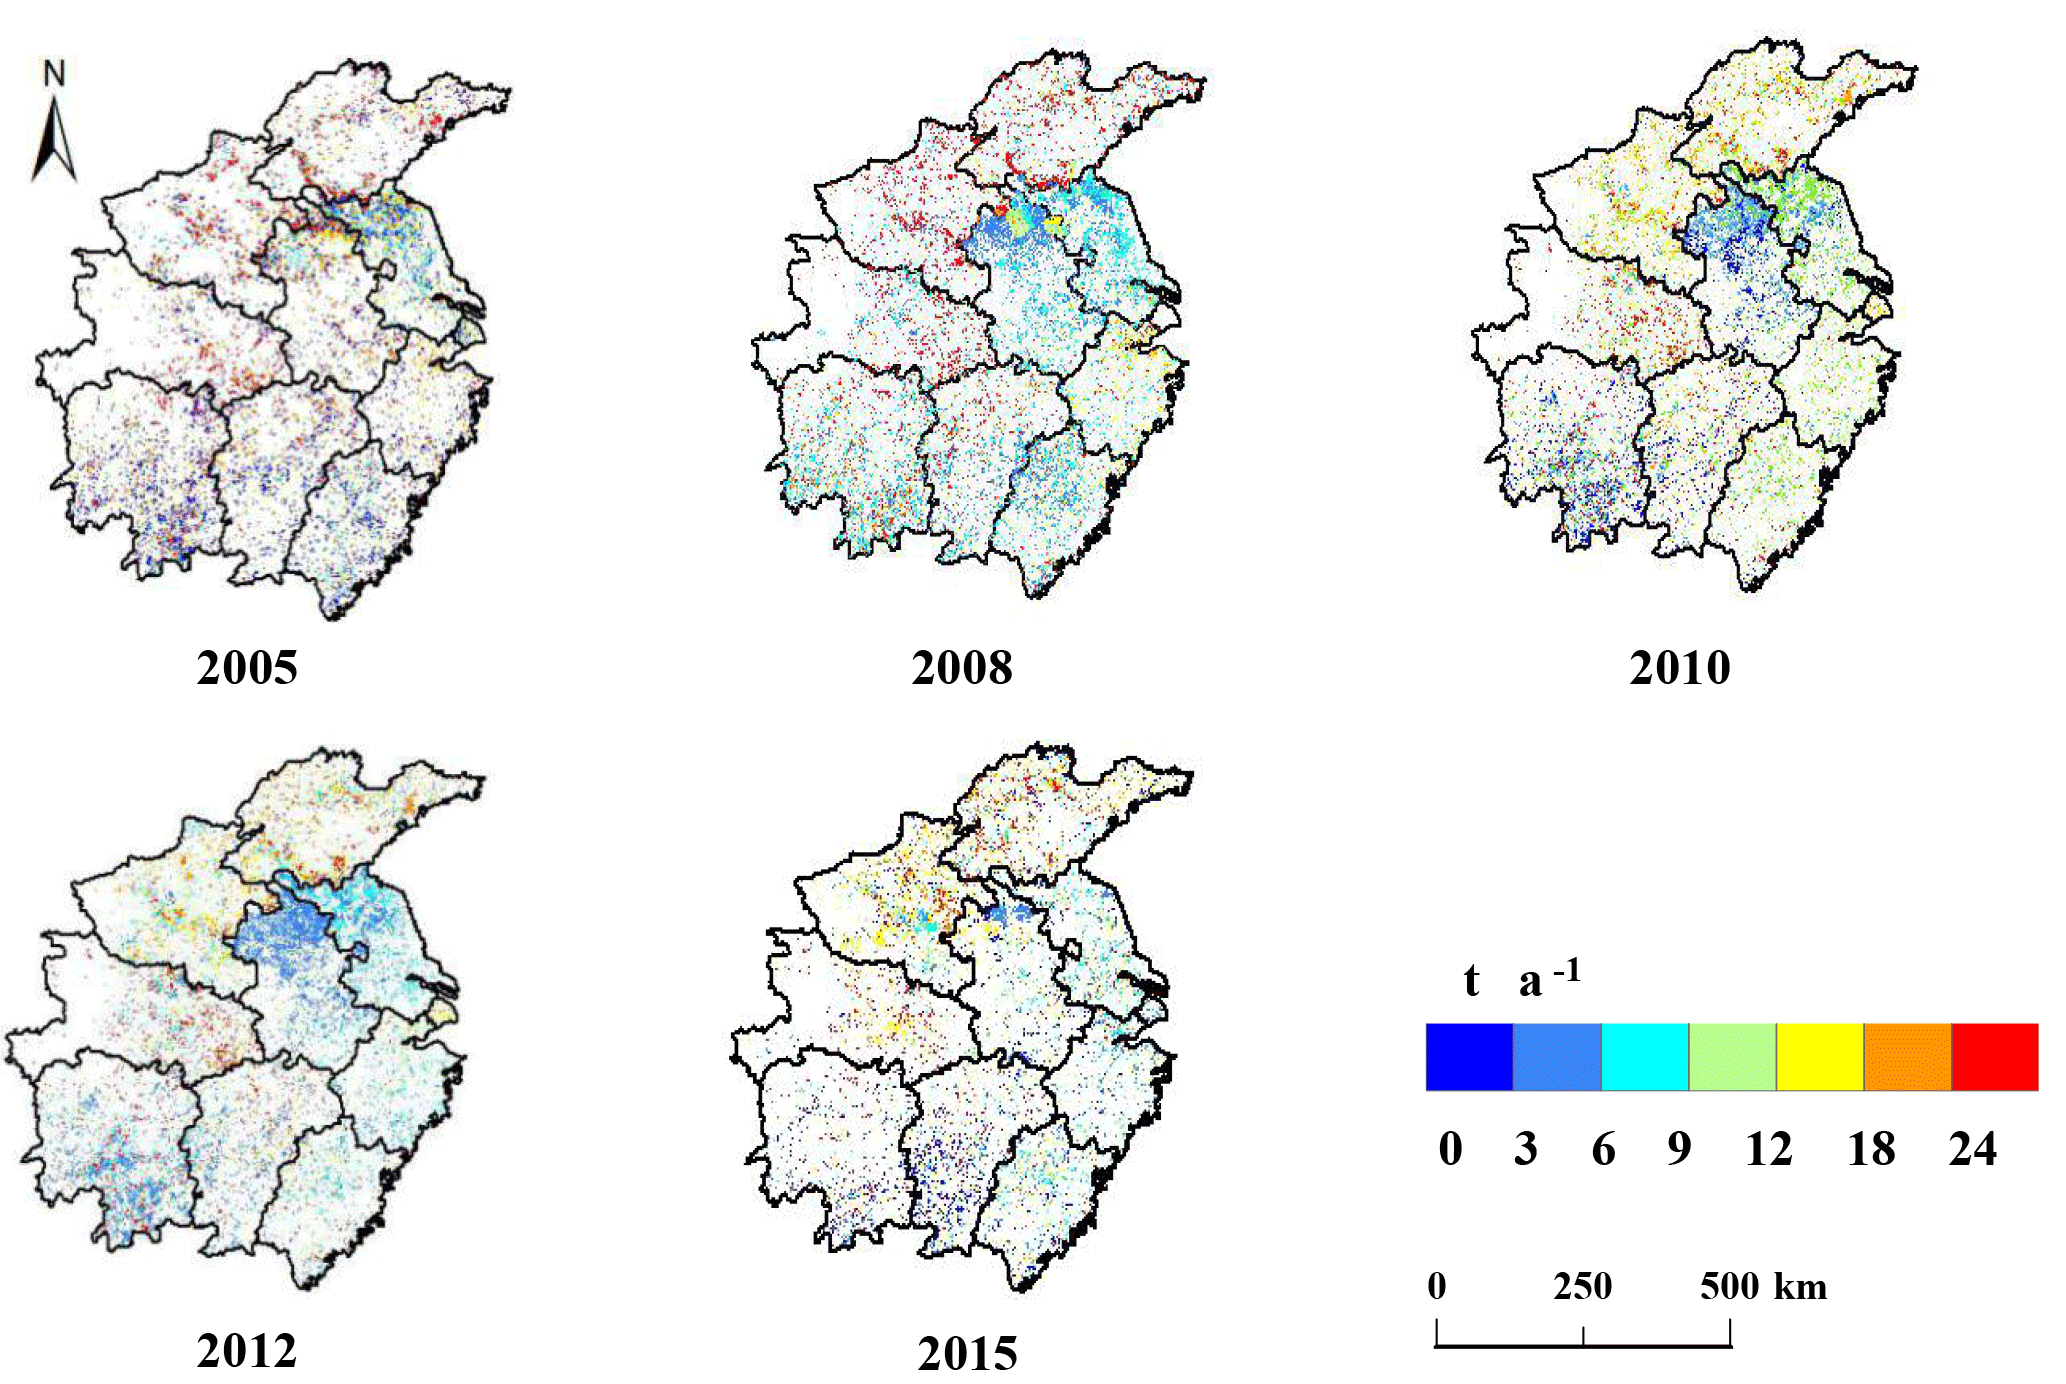
Figure 10Annual spatial distribution (1 km × 1 km) of PM2.5 emissions from opening biomass burning in central and eastern China.
The spatial distribution of PM2.5 emitted from OBB within 1 km × 1 km resolution was mapped based on the burned area and a high-resolution vegetation map (1:1 000 000) in CEC. The multi-year averaged spatial distributions of PM2.5 emission were shown in Fig. 10. It can be found that OBB was widespread and scattered. The average emission intensity of PM2.5 ranged from 0 to 15 tons per pixel in most provinces. The variation range is mainly caused by the socioeconomic development level, rural population and agricultural activities. The highest values in the different provinces were all mainly raised by the cropland fire burning due to the centralized burning in a relatively small area. Some pixels with high emissions exceeding more than 100 tons each year were found in Henan, Shandong and Hunan. It can be attributed to the large amounts of crop straws in these provinces. The pixels of high emission intensity of more than 70 tons from crop straw burning were also found in Hubei, Jiangsu and Anhui. For forest and shrubland fire burning, the high emission points (more than 30 tons per pixel) were found in Fujian and Jiangxi. Lower emission intensities in Zhejiang (lower than 10 tons per pixel on average) and Shanghai (lower than 7 tons on average) were mainly due to the highly developed economy and limited agricultural activities (Su et al., 2012). In addition, northern Anhui and eastern Jiangsu featured high emissions of OBB with a relatively lower intensity (lower than 15 tons per pixel on average), which may be due to the crop straw burning in a large area in these regions. Though the emission intensities varied in the past 10 years, the areas with high emission amounts remain similar. They were mainly located in the main agricultural areas in eastern Henan, southern Shandong, northern Anhui, northern Jiangsu, eastern Hubei and northern Hunan. This result is in accordance with previous studies (Huang et al., 2012b). The junction regions of the four provinces (Henan, Shandong, Anhui and Jiangsu) should be paid more attention, where the pollutant emissions from OBB joined together. This was similar to recent research (Jin et al., 2017b). This region belongs to the Huanghuai Plain, with a large area of cropland and low economic development levels. The open burning activities and corresponding banning policies are both abundant in village scale. The game of “cat and mouse” is frequently played. More effective policies for guiding or helping farmers to utilize straw energy rather than banning crop residue burning arbitrarily should be considered sincerely. In Zhejiang and Shanghai, OBB emissions are sparsely scattered, due to the relatively developed economic level, scarce biomass sources and limited agricultural activities. The recycling of crop straw faces many difficulties due in part to its high cost and the relative low price of crop straw. Improving policies for effectively utilizing crop residue straw is also an important challenge for the government.
Figure 11 highlights the spatial distribution of PM2.5 emitted from OBB in different seasons of 2015. Emissions were more concentrated in summer, followed by winter. In summer, the emission was concentrated in the connection regions of Henan, Shandong, Anhui and Jiangsu, which is mainly raised by the crop residue burning as discussed before. In winter, Jiangxi, Hunan and Fujian showed the higher emission intensities from forest and shrubland burning.
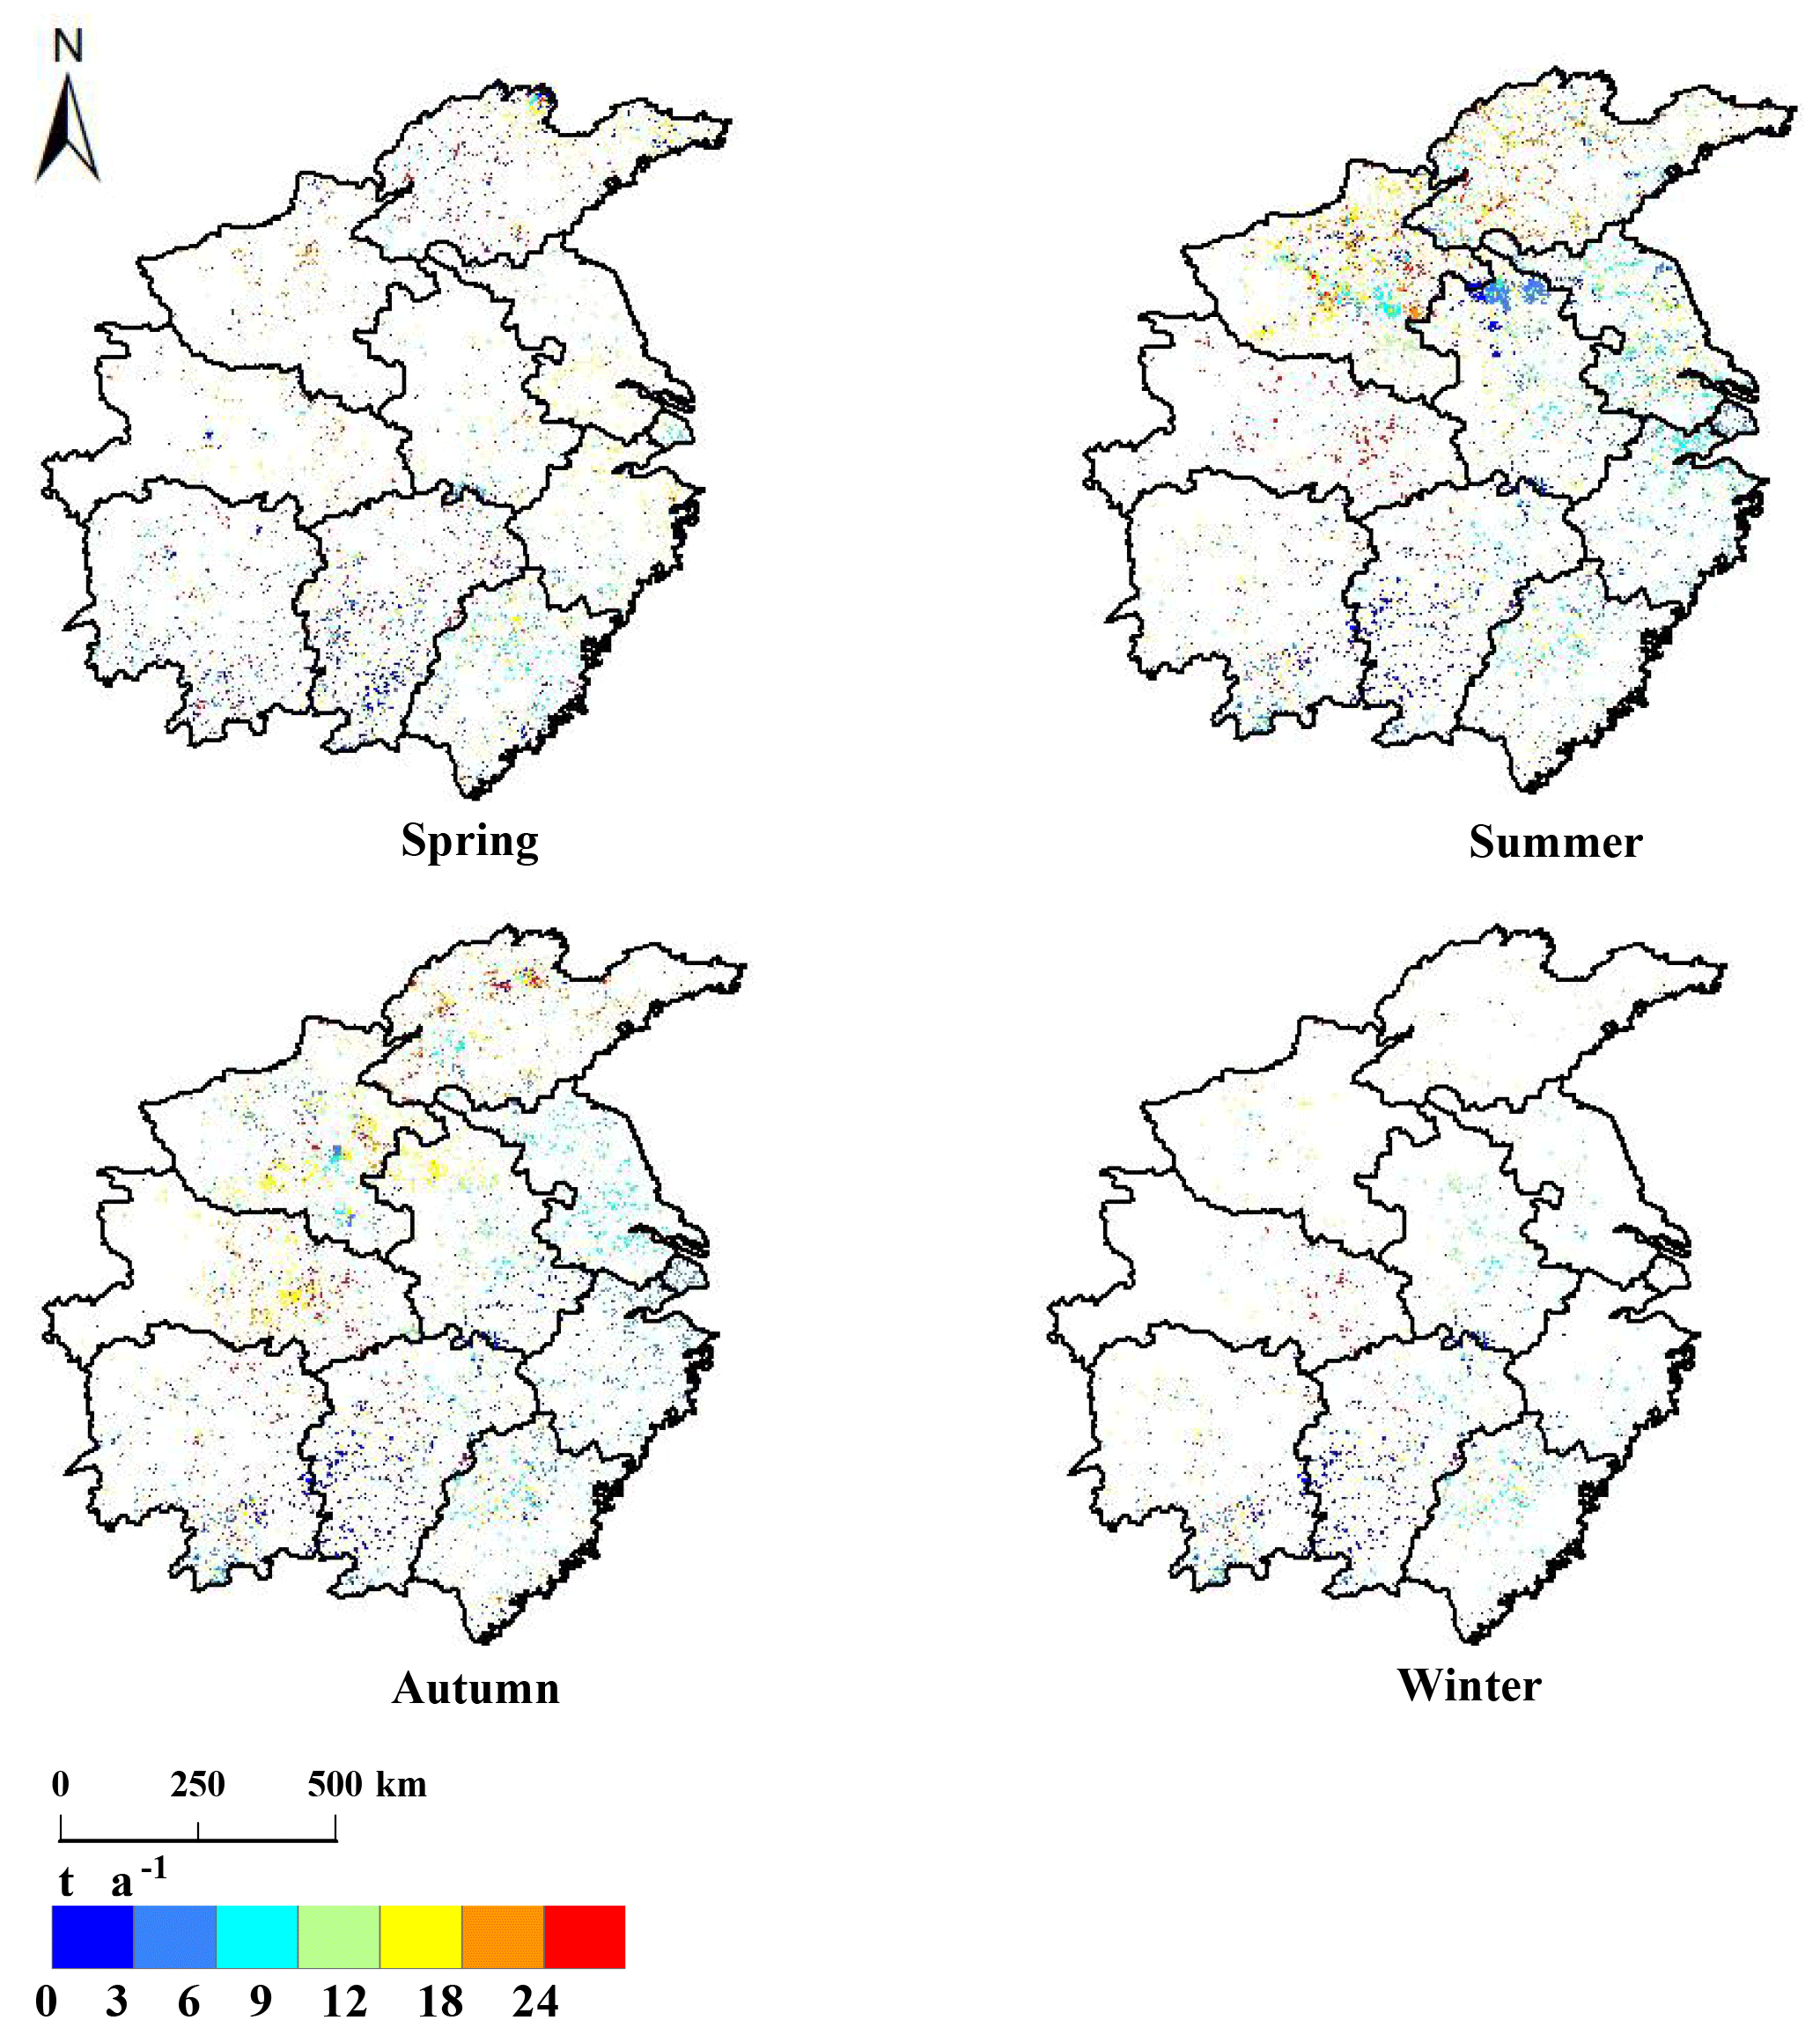
Figure 11Seasonal emissions distribution (1 km × 1 km) of PM2.5 in 2015 from opening biomass burning in central and eastern China.
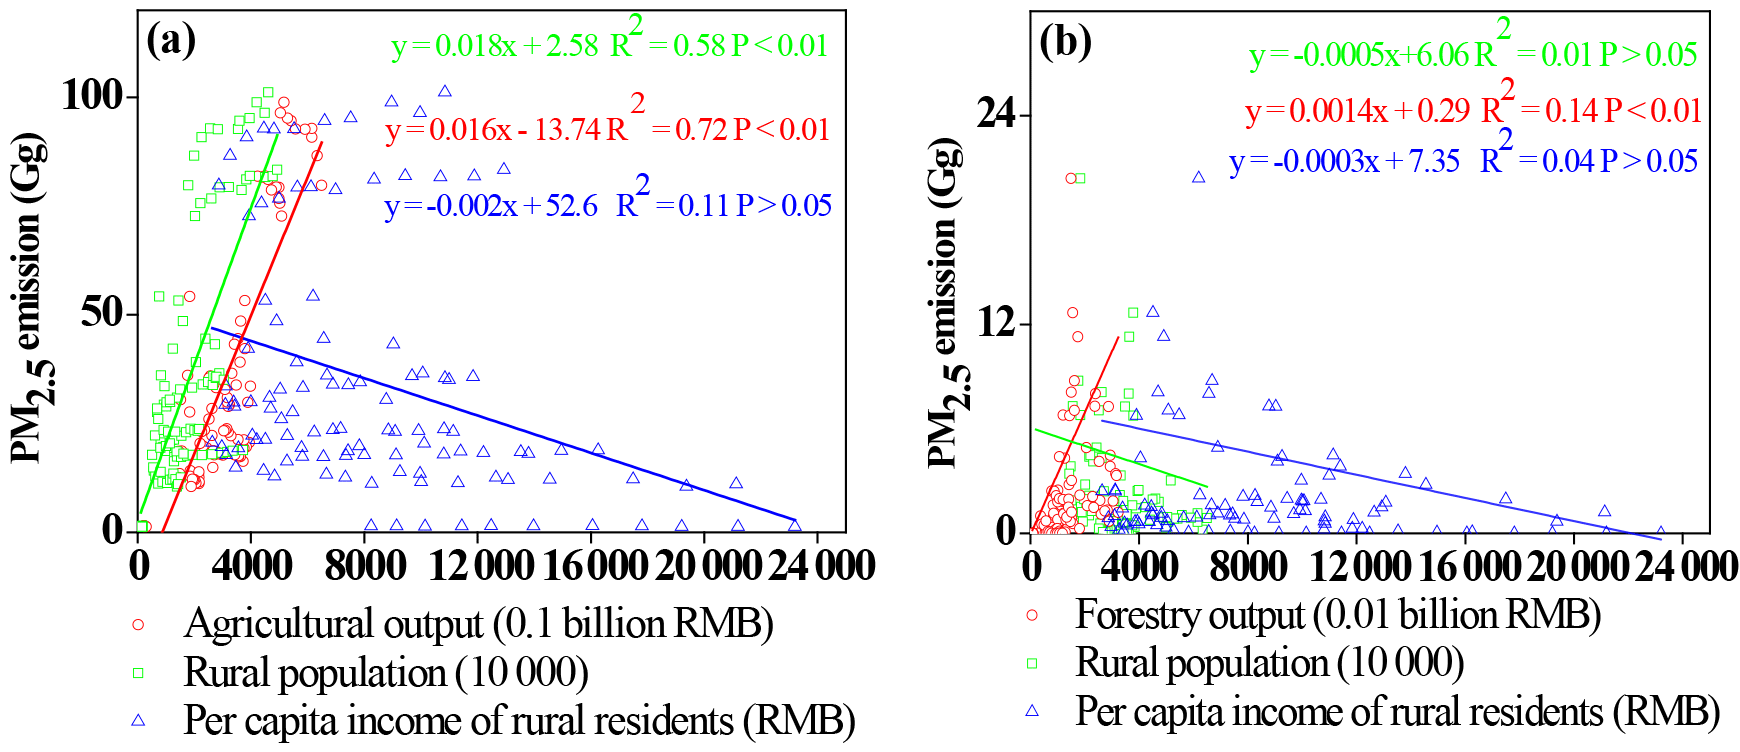
Figure 12Correlation between PM2.5 emissions from crop residue burning and agricultural output, rural population, per capita incomes of rural residents (a) and correlation between PM2.5 emissions from forestry fire burning and forestry output, rural population, per capita incomes of rural residents (b) in different provinces from 2003 to 2015.
3.3 The impact of socioeconomic factors on OBB emission
Emissions from OBB were found to be in line with the local burning habit, social customs, rural population, local economic level, agricultural level and pollution controlling policies. Local burning habits have a great influence on different types of OBB emissions. According to our survey, in agricultural provinces, such as Henan, Shandong, Jiangsu and Anhui, people always burn crop straws during sowing and harvest seasons. Despite the strict implementation of crop residue burning management policies, the burning habit is difficult to change in a short time. Less crop residue production and crop burning activities are found in Jiangxi and Fujian, where people are accustomed to using crop straw to feed draft animals and produce biogas instead of open burning directly. Emission from crop residue burning is low. However, due to the rich forest and shrubland resources, wood is served as the staple household fuel, which mainly comes from felling trees or collecting branches. These human activities can lead to an increase of forest and shrubland fire burning, resulting in the elevated levels of the corresponding emissions in these provinces.
Social customs also have an impact on OBB emissions. Biomass burning emissions in April can be enhanced by human burning activities on the tomb-sweeping day. The tomb-sweeping day (often on 4 or 5 April) is a time to remember the dead. People sweep graves and burn sacrifices by ignited straw, which can easily cause grass, shrub and forest fires (Qiu et al., 2016). The fire points on the tomb-sweeping day in CEC were 22 %–38 % of the total fire points in April in some years (Fig. S5). The Chinese government has also introduced policies to prevent forest, shrubland and grassland fires on tomb-sweeping day (Table S2). The wildfires caused by biomass burning from late January to early February are partially related to the firework burning in the Chinese New Year (Zuo, 2004). The firework burning activities for celebration and official sacrifices to ancestors in the Chinese New Year easily lead to grass, shrub and forest fires. All these activities can affect the emission levels and air quality in a short timescale.
Table 7Correlation of the variation tendency between PM2.5 emission from crop straw burning and rural population, agricultural output, per capita incomes of rural residents in each province from 2003 to 2015.
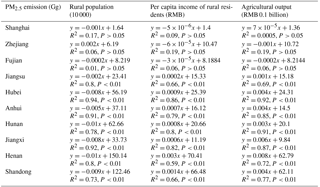
In order to understand the impact of the rural population, local economic level and agricultural level, correlation analyses between PM2.5 emissions from OBB and statistical data (rural population, per capita net income of rural residents, agricultural output (crop straw burning) and forestry output (forest, shrubland and grassland burning) in different provinces were conducted. Significant positive correlations were found between the rural population, agricultural output and the PM2.5 emissions from crop straw burning (R2 higher than 0.58, p<0.01) for the entire CEC (Fig. 12a). According to our survey, the high rural population and agricultural output indicate that agricultural activities are quite important in a certain region. With more crop residue produced, it can easily cause high emissions from cropland fire burning. No significant correlations were found for PM2.5 emission from crop straw burning with the income of rural residents (Fig. 15), which indicates that the rural economic level in different regions in CEC has no relationship with the PM2.5 emission. Then, we calculated the correlations between the change tendency of PM2.5 emission from crop fire burning and the multi-year variation of other three socioeconomic factors as shown in Table 7 for different provinces. Significant positive correlations were found for PM2.5 emission with per capita income of rural residents and agricultural output (most R2 higher than 0.59, p<0.01), and negative correlation were found for PM2.5 emission with rural population (most R2 higher than 0.73, p<0.01) except for the provinces of Shanghai, Zhejiang and Fujian, which are underdeveloped agricultural provinces. From 2003 to 2015, with the increase of agricultural outputs, more crop residue was produced. However, rapid economic development and lower rural population in each province led to the popularization of commercial energy and clean energy in rural areas. It decreased the demands in using crop residue as fuel. As a consequence, more crop residues were directly burned in the agricultural field. However, it was not suitable for Shanghai, Zhejiang and Fujian (most R2 lower than 0.19, p>0.05), which holds less crop residue production and high utilization efficiency of crop straws.
Positive correlations were also found between forestry output and PM2.5 emission from forest land, shrubland and grassland fire burning (R2=0.14, p<0.01) in the entire CEC (Fig. 12b), which indicated that human forestry activities played a positive role in open fire burning (Yan et al., 2006). According to our survey, human forest activities such as felling trees or picking up branches from trees can easily cause more forest and shrubland burning. However, compared with the crop straw burning, no correlation was found between PM2.5 emission and other statistical data (the rural population and the per capita net income of rural residents) (Fig. 13b and Table S4). It may indicate that the forestry fire burning activities were not predominantly associated with the rural human living activity. According to previous studies, forestry fire burning was affected by environmental conditions and human activities with environmental factors having a larger impact (Chen et al., 2013).
3.4 Comparison with others
Table 8Comparison of the emissions with previous studies in different years (Gg).
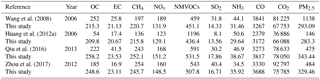
Emission data from OBB in CEC during the past several years have been compared with other studies for the similar year (Table 8). Compared with the emissions derived from Wang et al. (2008) based on statistical data, the differences of OC, EC, CH4, NOx, NMVOCs, NH3, CO2 and CO emissions ranged from −41 % to 12 %. For SO2 (121 %) and PM2.5 (288 %) emission, the differences were relatively high. All these differences were mainly caused by the selection of EFs. The EFs employed in Wang et al. (2008) were constant values for different biomass species. In addition, the crop residue to production ratio data and the burned ratio for various crop types were all specific to CEC in this study based on literature and survey results, which increased the reliability of these data. Similarly, Huang et al. (2012a) used the same EFS of different crop straw burning for emission calculation. Compared with Wang et al. (2008) and Huang et al. (2012a), the estimate in our study is believed to be more accurate. An obvious underestimation of PM2.5 emission from crop straw burning was found in Jin et al. (2017b), in which not all the crop species were considered.
The estimation based on satellite observation was prevalent recently. Compared to Zhou et al. (2017), who estimated the pollutant emission amounts from the MODIS burned area product, the results in this study were much higher. The reason may be that, when using a single satellite dataset, pollutant emission can be underestimated because some actual fire activities could not be detected (van der Werf et al., 2010). The lower emission of CO2, NMVOCs, SO2 and NOx in our study is due to the adoption of more accurate and suitable EF values as those in a previous study (Tang et al., 2014). Our emission estimation of the pollutants is more similar to the results of Qiu et al. (2016), who also used multiple satellite products (MCD14 ML and MCD64Al) to estimate OBB emissions of China in 2013, with the differences of the two studies ranging from −42 % to 22 %. For CH4, NOx, NMVOCs, NH3 and CO2, the differences were less than 10 %. The reason for the differences is due to the use of updated local biomass data and EFs in this study. Therefore, the combination of multiple satellite products with local EF data and updated local biomass data (updated forest loading data, the crop residue to production ratio data and the burned ratio for various crop types) is likely to have improved the estimation of pollutant emission from OBB effectively.
3.5 Uncertainty analysis
Emission uncertainties in this study were associated with the satellite fire products, biomass fuel loading data, combustion efficiency and emission factors. It is difficult to assess the uncertainty of the satellite-derived data for burned land area (Hoelzemann et al., 2004; Chang and Song, 2010). The estimation of fire burned area was proven to be reliable by using the burned area product MCD64Al (Giglio et al., 2013) and active fire product MCD14 ML (Randerson et al., 2012). Although some active fires which burned out at 10:30–13:30 LT each day could not be captured by MCD14 ML, the burned area used in this study was more reliable due to the combination of multiple satellite datasets (MCD64Al and MCD14 ML). The uncertainties in this study were mainly caused by biomass loading data, combustion efficiency and emission factors. These data were assumed to be normal distributions (Zhao et al., 2011). The uncertainty of biomass loading data and combustion efficiency was estimated to be approximately 50 % (Shi et al., 2015b) and the uncertainty of EFs of each pollutant mainly ranged from 0.03 to 0.85 (Table S5). The reliability of emission factors played the most important role in driving uncertainty. Considering all these parameters, 20 000 Monte Carlo simulations were performed to evaluate the estimation uncertainty quantitatively for pollutant emissions with a 95 % coincidence level. Table 9 showed the emission uncertainty for different pollutants from 2003 to 2015. On average, the uncertainties of the estimated OC, EC, CH4, NOx, NMVOCs, CO, SO2, NH3, CO2 and PM2.5 were (−30 %, 30 %), (−48 %, 48 %), (−20 %, 20 %), (−20 %, 20 %), (−45 %, 45 %), (−18 %, 18 %), (−45 %, 45 %), (−35 %, 35 %), (−3 %, 3 %) and (−36 %, 36 %), respectively.
Table 9The uncertainty estimation of open biomass burning emissions for various pollutants from 2003 to 2015.
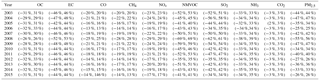
Compared with previous studies, the uncertainty was improved in our study because the datasets used here were better and more suitable. The reliable multiple satellites could better obtain burned area data. The local EF data, updated forest loading data, the adoption of local crop residue to production ratio data and the crop residue burned ratio data based on survey results improved the emission estimation of forestry and cropland burning as they could better reflect the actual situation in this region. Compared with the constant combustion efficiency in previous research, the activity combustion efficiency data could also reduce the uncertainty as they could more accurately reflect the actual combustion conditions (Chen et al., 2013). Therefore, due to the adoption of multiple satellite products, updated local biomass data and local emission factors, the uncertainty ranges of different pollutant emissions were narrowed and reliable in this study, which could better reflect the real emissions.
In this study, a combination of the burned area product (MCD64Al) with the active fire product (MCD14 ML), as well as local high-resolution vegetation speciation data, updated local biomass data, local emission factors and survey results were used to estimate the pollutant emissions from open burning in CEC from 2003 to 2015. The emissions from crop residue, forest, shrubland and grassland fire burning were considered.
Crop residue burning was the major source type for pollutant emissions, followed by forest and shrubland fire burning. The grassland fire burning emissions were negligible in CEC. For cropland, the fire burning was mainly concentrated in agricultural provinces, such as Henan and Shandong. For forest and shrubland, the fire burning was mainly concentrated in the Fujian, Jiangxi and Hunan provinces, with abundant forest resources. Wheat, corn and rice straw were the major three types of crop straws for pollutant emission. Wheat and corn straw burning dominated in Shandong and Henan, and the rice straw burning dominated in the Hunan, Jiangxi and Hubei provinces. For various pollutant emissions, corn straw burning was the largest contributor to SO2, NOx, CO, NMVOCs, CO2 and NH3. OC, EC and CH4 emissions were mainly produced by rice straw burning. Wheat straw burning was the largest contributor to PM2.5. The spatial distribution of open biomass residue burning in different years was similar. The high emissions were mainly found in the major agricultural areas in eastern Henan, southern Shandong, northern Anhui, northern Jiangsu, eastern Hubei and northern Hunan, due to their abundant agricultural cultivated areas and low straw utilization efficiency.
From 2003 to 2015, the multi-year tendency of opening biomass residue burning emission for various pollutants was similar. Emissions from crop straw burning continued to increase, due to the gradual increase of crop residue production. While emissions from forest, shrubland and grassland fire burning exhibited yearly fluctuations, which was mainly influenced by the environmental conditions, management measures and other human driving factors. Monthly distributions revealed that the pollutant emissions were at the highest levels in May and June, with the lowest emissions in July and August. The high emissions in May, June and October were mainly caused by crop straw burning during sowing and harvest times. It is worth noting that the fire burning activities during the harvest season need to be regulated continuously by local governments, and emissions from forest and shrubland burning, which accounted for the vast majority of total emissions in December to March, should also be paid attention. The emissions of crop residue burning were associated with the rural population, agricultural output and economic levels, while the environmental conditions play an important role in the emissions from forest land, shrubland and grassland fire burning.
The estimation of multi-year open biomass burning emissions by satellite data in this study will provide objective and credible evidence for assessing the role of pollution prevention policies on open burning activities issued in the last decade. The high-spatial-resolution (1×1 km) emission inventory in a monthly scale is also useful in modeling regional air quality and human health risks in the future.
The emission data are archived and are available upon request (kongshaofei@cug.edu.cn and shihuaqi@cug.edu.cn).
The supplement related to this article is available online at: https://doi.org/10.5194/acp-18-11623-2018-supplement.
SK and SQ designed the paper; JW and SK wrote the paper; others helped to collect the data and prepare the manuscript.
The authors declare that they have no conflict of interest.
This study was financially supported by the Key Program of Ministry of
Science and Technology of the People's Republic of China (2016YFA0602002;
2017YFC0212602), the Key Program for Technical Innovation of Hubei Province
(2017ACA089) and the Program for Environmental Protection in Hubei Provinces
(2017HB11). The research was also supported by the Start-up Foundation for
Advanced Talents (201616) and Fundamental Research Funds for the Central
Universities (201802), China University of Geosciences,
Wuhan.
Edited by: Dominick Spracklen
Reviewed by: two anonymous referees
Akagi, S. K., Yokelson, R. J., Wiedinmyer, C., Alvarado, M. J., Reid, J. S., Karl, T., Crounse, J. D., and Wennberg, P. O.: Emission factors for open and domestic biomass burning for use in atmospheric models, Atmos. Chem. Phys., 11, 4039–4072, https://doi.org/10.5194/acp-11-4039-2011, 2011.
Andela, N., Schultz, M., Van, der W., Van Leeuwen, T. T., Kaiser, J. W., Wooster, M. J., Heil, A., and Remy, S.: Assessment of the Global Fire Assimilation System (GFASv1), MACC-II Deliverable D_31.2, 2013.
Andreae, M. O. and Merlet, P: Emission of trace gases and aerosols from biomass burning, Global Biogeochem. Cy., 15, 955–966, 2001.
Andreae, M. O. and Rosenfeld, D.: Aerosol-cloud precipitation interactions. Part 1, The nature and sources of cloud-active aerosols, Earth-Sci. Rev., 89, 13–41, https://doi.org/10.1016/j.earscirev.2008.03.001, 2008.
Ao, H. J., Zou, Y. B., Shen, J. B., Peng, S. B., Tang, Q. Y., and Feng, Y. h.: Effects of fertilizer-N application for double early rice on the yield, nitrogen use efficiency and soil nitrogen content of double rice, Plant Nutr. Fert. Sci., 13, 772–780, 2007 (in Chinese).
Aragao, L. E. O. C. and Shimabukuro, Y. E.: The Incidence of Fire in Amazonian Forests with Implications for REDD, Science, 328, 1275–1278, https://doi.org/10.1126/science.1186925, 2010.
Arino, O., Casadio, S., and Serpe, D.: Global night-time fire season timing and fire count trends using the ATSR instrument series, Remote. Sens. Environ., 116, 226–238, https://doi.org/10.1016/j.rse.2011.05.025, 2012.
Bond, T. C., Streets, D. G., Yarber, K. F., Nelson, S. M., Woo, J. H., and Klimont, Z.: A technology-based global inventory of black and organic carbon emissions from combustion, J. Geophys. Res., 109, D14203, https://doi.org/10.1029/2003JD003697, 2004.
Bond, T. C., Doherty, S. J., Fahey, D. W., Forster, P. M., Berntsen, T., DeAngelo, B. J., Flanner, M. G., Ghan, S., Kärcher, B., Koch, D., Kinne, S., Kondo, Y., Quinn, P. K., Sarofim, M. C., Schultz, M. G., Schulz, M., Venkataraman, C., Zhang, H., Zhang, S., Bellouin, N., Guttikunda, S. K., Hopke, P. K., Jacobson, M. Z., Kaiser, J. W., Klimont, Z., Lohmann, U., Schwarz, J. P., Shindell, D., Storelvmo, T., Warren, S. G. and Zender, C. S.: Bounding the role of black carbon in the climate system: A scientific assessment: black carbon in the climate system, J. Geophys. Res.-Atmos., 118, 5380–5552, https://doi.org/10.1002/jgrd.50171, 2013.
Bowman, D. M. J. S., Balch, J., Artaxo, P., Bond, W. J., Cochrane, M. A., D'Antonio, C. M., DeFries, R., Johnston, F. H., Keeley, J. E., Krawchuk, M. A., Kull, C. A., Mack, M., Moritz, M. A., Pyne, S., Roos, C. I., Scott, A. C., Sodhi, N. S., and Swetnam, T. W.: The human dimension of fire regimes on Earth: The human dimension of fire regimes on Earth, J. Biogeogr., 38, 2223–2236, https://doi.org/10.1111/j.1365-2699.2011.02595.x, 2011.
Burling, I. R., Yokelson, R. J., Griffith, D. W. T., Johnson, T. J., Veres, P., Roberts, J. M., Warneke, C., Urbanski, S. P., Reardon, J., Weise, D. R., Hao, W. M., and de Gouw, J.: Laboratory measurements of trace gas emissions from biomass burning of fuel types from the southeastern and southwestern United States, Atmos. Chem. Phys., 10, 11115–11130, https://doi.org/10.5194/acp-10-11115-2010, 2010.
Cao, G. L., Zhang, X. Y., Wang, D., and Deng, F. C.: Inventory of Atmospheric Pollutants Discharged from Biomass Burning in China Continent, China Environ. Sci., 25, 389–393, 2005 (in Chinese).
Cao, G. L., Zhang, X. Y., Gong, S. L., and Zheng, F. C.: Investigation on emission factors of particulate matter and gaseous pollutants from crop residue burning, J. Environ. Sci., 20, 50–55, 2008.
Chang, D. and Song, Y.: Estimates of biomass burning emissions in tropical Asia based on satellite-derived data, Atmos. Chem. Phys., 10, 2335–2351, https://doi.org/10.5194/acp-10-2335-2010, 2010.
Cao, Y., Li, Y. P., and Wang, L.: Cause Analysis and Control Countermeasures of forest fires, Journal of Green Science and Technology, 8, 267–269, 2015 (in Chinese).
Chang, D., Song, Y., and Liu, B.: Visibility trends in six megacities in China 1973–2007, Atmos. Res., 94, 161–167, https://doi.org/10.1016/j.atmosres.2009.05.006, 2009.
Chen, C., Wang, H., Zhang, W., Hu, D., Chen, L., and Wang, X.: High-resolution inventory of mercury emissions from biomass burning in China for 2000–2010 and a projection for 2020: Mercury emission from biomass burning, J. Geophys. Res.-Atmos., 118, 248–212, https://doi.org/10.1002/2013JD019734, 2013.
Chen, C. L., Yang, Y., and Xie, G. H.: Study of the development of crop straw management policy in China, J. China Agric. Univ., 21, 1–11, 2016 (in Chinese).
Chen, H. F., Lin, R. Y., Liang, Y. Y., Zheng, L. D., Liang, K. J., and Lin, W. X.: Dry-matter accumulation and transportation in first-rice crop of early rice-ratoon rice under different cultivation patterns, Chin. J. Eco. Agric., 16, 129–133, 2008 (in Chinese).
Cheng, Z., Wang, S., Fu, X., Watson, J. G., Jiang, J., Fu, Q., Chen, C., Xu, B., Yu, J., Chow, J. C., and Hao, J.: Impact of biomass burning on haze pollution in the Yangtze River delta, China: a case study in summer 2011, Atmos. Chem. Phys., 14, 4573–4585, https://doi.org/10.5194/acp-14-4573-2014, 2014.
Chuvieco, E., Giglio, L., and Justice, C.: Global characterization of fire activity: toward defining fire regimes from Earth observation data, Glob. Change Biol., 14, 1488–1502, https://doi.org/10.1111/j.1365-2486.2008.01585.x, 2008.
Cooke, W. F., Koffi, B., and Grégoire, J. M.: Seasonality of vegetation fires in Africa from remote sensing data and application to a global chemistry model, J. Geophys. Res.-Atmos., 101, 21051–21066, 1996.
Crutzen, P. J. and Andreae, M. O.: Biomass burning in the tropics: impact on atmospheric chemistry and biogeochemical cycles, Science, 250, 1669–1678, 1990.
Crutzen, P. J., Heidt, L. E., Krasnec, J. P., Pollock, W. H. and Seiler, W.: Biomass burning as a source of atmospheric gases CO, H2, N2O, NO, CH3Cl and COS, Nature, 282, 253–256, https://doi.org/10.1038/282253a0, 1979.
Deng, C. R.: Identification of biomass burning source in aerosols and the formation mechanism of haze, PhD dissertation, Fudan University, Shanghai, 2011 (in Chinese).
Duncan, B. N., Martin, R. V., Staudt, A. C., Yevich, R. and Logan, J. A.: Interannual and seasonal variability of biomass burning emissions constrained by satellite observations, J. Geophys. Res., 108, 4100, https://doi.org/10.1029/2002JD002378, 2003.
EPD: Guide for compiling atmospheric pollutant emission inventory for biomass burning, Environmental Protection Department, available at: http://www.zhb.gov.cn/gkml/hbb/bgg/201501/t20150107 293955.htm (last access: 7 August 2018), 2014 (in Chinese).
Eva, H. and Lambin, E. F.: Remote sensing of biomass burning in tropical regions: Sampling issues and multisensor approach, Remote. Sens. Environ., 64, 292–315, 1998.
Fang, J. Y., Liu, G. H., and Xu, S. L.: Biomass and net production of forest vegetation in China, Acta. Eco. Sin., 16, 497–508, 1996 (in Chinese).
Fang, S., Qi, Y., Han, G., Zhou, G., and Cammarano, D.: Meteorological drought trend in winter and spring from 1961 to 2010 and its possible impacts on wheat in wheat planting area of China, Sci. Agric. Sin., 47, 1754–1763, 2014 (in Chinese).
Freitas, S. R., Longo, K. M., Dias, M. A. F. S., Dias, P. L. S., Chatfield, R., Prins, E., Artaxo, P., Grell, G. A., and Recuero, F. S.: Monitoring the transport of biomass burning emissions in South America, Environ. Fluid. Mech., 5, 135–167, 2005.
Fu, X., Wang, S., Zhao, B., Xing, J., Cheng, Z., Liu, H., and Hao, J.: Emission inventory of primary pollutants and chemical speciation in 2010 for the Yangtze River Delta region, China, Atmos. Environ., 70, 39–50, https://doi.org/10.1016/j.atmosenv.2012.12.034, 2013.
Gadde, B., Bonnet, S., Menke, C., and Garivait, S.: Air pollutant emissions from rice straw open field burning in India, Thailand and the Philippines, Environ. Pollut., 157, 1554–1558, https://doi.org/10.1016/j.envpol.2009.01.004, 2009.
Giglio, L., Csiszar, I., and Justice, C. O.: Global distribution and seasonality of active fires as observed with the Terra and Aqua Moderate Resolution Imaging Spectroradiometer (MODIS) sensors: Global fire distribution and seasonality, J. Geophys. Res.-Biogeo., 111, G02016, https://doi.org/10.1029/2005JG000142, 2006.
Giglio, L., Csiszar, I., Restás, Á., Morisette, J. T., Schroeder, W., Morton, D. and Justice, C. O.: Active fire detection and characterization with the advanced spaceborne thermal emission and reflection radiometer (ASTER), Remo. Sens. Environ., 112, 3055–3063, https://doi.org/10.1016/j.rse.2008.03.003, 2008.
Giglio, L., Randerson, J. T., and van der Werf, G. R.: Analysis of daily, monthly, and annual burned area using the fourth-generation global fire emissions database (GFED4): ANALYSIS OF BURNED AREA, J. Geophys. Res.-Biogeo., 118, 317–328, https://doi.org/10.1002/jgrg.20042, 2013.
He, M., Wang, X. R., Han, L., Feng, X. Q., and Mao, X.: Emission Inventory of Crop Residues Field Burning and Its Temporal and Spatial Distribution in Sichuan Province, Environ. Sci., 36, 1208–1216, 2015 (in Chinese).
Hoelzemann, J. J., Schultz, M. G., Brasseur, G. P., Granier, C., and Simon, M.: Global Wildland Fire Emission Model (GWEM): Evaluating the use of global area burnt satellite data, J. Geophys. Res.-Atmos., 109, D14S04, https://doi.org/10.1029/2003JD003666, 2004.
Hu, H. F., Wang, Z. H., Liu, G. H., and Fu, B. J.: Vegetation carbon storage of major shrublands in China, Chin. J. Plant Ecol., 30, 539–544, 2006 (in Chinese).
Huang, G. B.: Evaluation and Trend Analysis of Crop straw comprehensive utilization in Fujian province, China Rural Science Technology, 10, 66–67, 2014 (in Chinese).
Huang, X., Li, M., Friedli, H. R., Song, Y., Chang, D., and Zhu, L.: Mercury Emissions from Biomass Burning in China, Environ. Sci. Technol., 45, 9442–9448, https://doi.org/10.1021/es202224e, 2011.
Huang, X., Li, M., Li, J., and Song, Y.: A high-resolution emission inventory of crop burning in fields in China based on MODIS Thermal Anomalies/Fire products, Atmos. Environ., 50, 9–15, https://doi.org/10.1016/j.atmosenv.2012.01.017, 2012a.
Huang, X., Song, Y., Li, M., Li, J., and Zhu, T.: Harvest season, high polluted season in East China, Environ. Res. Lett., 7, 044033, https://doi.org/10.1088/1748-9326/7/4/044033, 2012b.
Ito, A. and Akimoto, H.: Seasonal and interannual variations in CO and BC emissions from OBB in Southern Africa during 1998–2005: seasonal CO/BC emissions, Global Biogeochem. Cy., 21, GB2011, https://doi.org/10.1029/2006GB002848, 2007.
Ito, A. and Penner, J. E.: Global estimates of biomass burning emissions based on satellite imagery for the year 2000, J. Geophys. Res., 109, D14S05, https://doi.org/10.1029/2003JD004423, 2004.
Jin, Q. F., Ma, X. Q. A., Wang, W. H., Yang, S. Y., and Guo, F. T.: Temporal and spatial dynamics of pollutants emission from forest fires in Fujian during 2000–2010, China Environ. Sci., 37, 476–485, 2017a (in Chinese).
Jin, Q. F., Ma, X. Q. A., Wang, W. H., Yang, S. Y., and Guo, F. T.: Temporal and spatial variations of PM2.5 emissions from crop straw burning in eastern China during 2000–2014, Acta. Sci. Circum., 37, 460–468, 2017b (in Chinese).
Kaiser, J. W., Benedetti, A., Detmers, R., Heil, A., Morcrette, J. J., Schultz, M. G., Van, der W., Wooster, M. J., and Xu, W.: Assimilation of FRP observations for global fire emission estimation in MACC-II, Geophys. Res. Abstr., EGU General Assembly 2012, Vienna, Austria, p. 10521, 2012.
Korontzi, S.: Seasonal patterns in biomass burning emissions from southern African vegetation fires for the year 2000, Glob. Change Biol., 11, 1680–1700, 2005.
Klimont, Z. and Streets, D.: Emission inventories and projections for assessing hemispheric or intercontinental transport, Hemispheric Transport of Air Pollution, UNECE Information Service, Switzerland, Geneva, 2007.
Kondo, Y., Matsui, H., Moteki, N., Sahu, L., Takegawa, N., Kajino, M., Zhao, Y., Cubison, M. J., Jimenez, J. L., Vay, S., Diskin, G. S., Anderson, B., Wisthaler, A., Mikoviny, T., Fuelberg, H. E., Blake, D. R., Huey, G., Weinheimer, A. J., Knapp, D. J., and Brune, W. H.: Emissions of black carbon, organic, and inorganic aerosols from biomass burning in North America and Asia in 2008, J. Geophys. Res.-Atmos., 116, D08204, https://doi.org/10.1029/2010JD015152, 2011.
Koopmans, A. and Koppejan, J.: Agricultural and Forest Residues: Generation, Utilization and Availability, Paper presented at the Regional Consultation on Modern Applications of Biomass Energy, FAO, Kuala Lumpur, Malaysia, 1997.
Laris, P. S.: Spatiotemporal problems with detecting and mapping mosaic fire regimes with coarse-resolution satellite data in savanna environments, Remote. Sens. Environ., 99, 412–424, https://doi.org/10.1016/j.rse.2005.09.012, 2005.
Lei, E., Tang, Q. Y., Luo, H. B., and Chen, L. J.: Comparison of late maturing spring maize varieties in paddy field and its correlation analysis, Crop. Res., 23, 24–29, 2009 (in Chinese).
Levine, J. S., Cofer, W. R., Cahoon, D. R., and Winstead, E. L.: A driver for global change, Environ. Sci. Technol., 29, 120–125, 1995.
Li, C., Hu, Y., Zhang, F., Chen, J., Ma, Z., Ye, X., Yang, X., Wang, L., Tang, X., Zhang, R., Mu, M., Wang, G., Kan, H., Wang, X., and Mellouki, A.: Multi-pollutant emissions from the burning of major agricultural residues in China and the related health-economic effects, Atmos. Chem. Phys., 17, 4957–4988, https://doi.org/10.5194/acp-17-4957-2017, 2017.
Li, J., Li, Y., Bo, Y., and Xie, S.: High-resolution historical emission inventories of crop residue burning in fields in China for the period 1990–2013, Atmos. Environ., 138, 152–161, https://doi.org/10.1016/j.atmosenv.2016.05.002, 2016.
Li, L., Liu, W. D., Zou, D. S., and Liu, F.: The correlation between main characteristics and pod yield in peanut genotypes under natural waterlogging stress, Chin. J. Oil Crop Sci., 30, 62–70, 2008 (in Chinese).
Li, S. M., Yang C. Q., Wang, H. N., and Ge, L. Q.: Carbon storage of forest stands in Shandong Province estimated by forestry inventory data, Chin. J. Appl. Ecol., 25, 2215–2220, 2014 (in Chinese).
Li, X. H., Wang, S. X., Duan, L., Hao, J., Li, C., Chen, Y. S., and Yang, L.: Particulate and trace gas emissions from open burning of wheat straw and corn stover in China, Environ. Sci. Technol., 41, 6052–6058, https://doi.org/10.1021/es0705137, 2007.
Li, Y. P., Wang, J. S., Li Y. H., Wang, S. P., and Sha, S.: Study of the sustainability of droughts in China, J. Glaciol. Geocryol., 36, 1131–1142, 2014 (in Chinese).
Li, W. J., Zuo, J. Q., Song, Y. L., Liu, J. P., Li, Y., Shen, Y. Y., and Li, J. X.: Changes in spatio-temporal distribution of drought/flood disaster in Southern China under global climate warming, Meteor. Mon., 3, 261–271, 2015 (in Chinese).
Lin, H. W., Jin, Y. F., Giglio, L., Foley, J. A., and Randerson, J. T.: Evaluating greenhouse gas emissions inventories for agricultural burning using satellite observations of active fires, Ecol. Appl., 22, 1345–1364, 2012.
Liousse, C., Devaux, C., Dulac, F., and Cachier, H.: Aging of savanna biomass burning aerosols: Consequences on their optical properties, J. Atmos. Chem., 22, 1–17, 1995.
Liousse, C., Guillaume, B., Grégoire, J. M., Mallet, M., Galy, C., Pont, V., Akpo, A., Bedou, M., Castéra, P., Dungall, L., Gardrat, E., Granier, C., Konaré, A., Malavelle, F., Mariscal, A., Mieville, A., Rosset, R., Serça, D., Solmon, F., Tummon, F., Assamoi, E., Yoboué, V., and Van Velthoven, P.: Updated African biomass burning emission inventories in the framework of the AMMA-IDAF program, with an evaluation of combustion aerosols, Atmos. Chem. Phys., 10, 9631–9646, https://doi.org/10.5194/acp-10-9631-2010, 2010.
Liu, D. M., Liu, Q., Rong, X. M., Peng, J. W., Xie, G. X., Zhang, Y. P., and Song, H. X.: Influences of photosynthesis and dry matter accumulation of different oilseed rape cultivars on nitrogen use efficiency, Hunan Agric. Sci., 34, 29–31, 2010 (in Chinese).
Liu, M., Song, Y., Yao, H., Kang, Y., Li, M., Huang, X., and Hu, M.: Estimating emissions from agricultural fires in the North China Plain based on MODIS fire radiative power, Atmos. Environ., 112, 326–334, https://doi.org/10.1016/j.atmosenv.2015.04.058, 2015.
Lu, B., Kong, S. F., Han, B., Wang, X. Y., and Bai, Z. P.: Inventory of atmospheric pollutants discharged from biomass burning in China continent in 2007, China Environ. Sci., 31, 186–194, 2011 (in Chinese).
Lu, J. L., Liang, S. L., and Liu, J.: Study on estimation of forest biomass and carbon storage of Shanxi Province, Chin. Agric. Sci. Bull., 31, 51–56, 2012 (in Chinese).
McCarty, J. L., Korontzi, S., Justice, C. O., and Loboda, T.: The spatial and temporal distribution of crop residue burning in the contiguous United States, Sci. Total. Environ., 407, 5701–5712, https://doi.org/10.1016/j.scitotenv.2009.07.009, 2009.
MEPC: Ministry of Environmental Protection of China, Crop residue burning report, available at: http://www.zhb.gov.cn/ (last access: 7 August 2018), 2015 (in Chinese).
NBSC (National Bureau of Statistics of China): China Statistical Yearbook 2004–2016, China Statistics Press, Beijing, available at: http://www.stats.gov.cn/tjsj/ndsj/ (last access: 7 August 2018), 2004–2016 (in Chinese).
Peng, L., Qiang, Z., and Kebin, H. E.: Emissions inventory of atmospheric pollutants from open burning of crop residues in China based on a national questionnaire, Res. Environ. Sci., 29, 1109–1118, 2016 (in Chinese).
Prins, E. M. and Menzel, W. P.: Geostationary satellite detection of bio mass burning in South America, Int. J. Remote. Sens., 13, 2783–2799, 1992.
Pu, S. L., Fang, J. Y., He, J. S., and Xiao, Y.: Spatial distribution of grassland biomass in China, Acta. Phyt. Sci., 28, 491–498, 2004 (in Chinese).
Qiu, X., Duan, L., Chai, F., Wang, S., Yu, Q., and Wang, S.: Deriving high-resolution emission inventory of OBB in China based on satellite observations, Environ. Sci. Technol., 50, 11779–11786, https://doi.org/10.1021/acs.est.6b02705, 2016.
Randerson, J. T., Chen, Y., van der Werf, G. R., Rogers, B. M., and Morton, D. C.: Global burned area and biomass burning emissions from small fires: burned area from small fires, J. Geophys. Res.-Biogeo., 117, G04012, https://doi.org/10.1029/2012JG002128, 2012.
Reid, J. S., Hyer, E. J., Prins, E. M., Westphal, D. L., Zhang, J., Wang, J., Christopher, S. A., Curtis, C. A., Schmidt, C. C., Eleuterio, D. P., Richardson, K. A., and Hoffman, J. P.: Global monitoring and forecasting of biomass-burning smoke: Description of and lessons from the fire locating and modeling of burning emissions (FLAMBE) program, IEEE J.-Stars, 2, 144–162, https://doi.org/10.1109/JSTARS.2009.2027443, 2009.
Roberts, G., Wooster, M. J., and Lagoudakis, E.: Annual and diurnal african biomass burning temporal dynamics, Biogeosciences, 6, 849–866, https://doi.org/10.5194/bg-6-849-2009, 2009.
Roy, D. P. and Boschetti, L.: Southern Africa Validation of the MODIS, L3JRC, and Glob Carbon Burned-Area Products, IEEE T. Geosci. Remote, 47, 1032–1044, https://doi.org/10.1109/TGRS.2008.2009000, 2009.
Roy, D. P., Ju, J., Lewis, P., Schaaf, C., Gao, F., Hansen, M., and Lindquist, E.: Multi-temporal MODIS-Landsat data fusion for relative radiometric normalization, gap filling, and prediction of Landsat data, Remote Sens. Environ., 112, 3112–3130, https://doi.org/10.1016/j.rse.2008.03.009, 2008.
Seiler, W. and Crutzen, P. J.: Estimates of gross and net fluxes of carbon between the biosphere and the atmosphere from biomass burning, Climatic Change, 2, 207–247, 1980.
Setzer, A. W. and Pereira, M. C.: Amazonia biomass burnings in 1987 and an estimate of their tropospheric emissions, Ambio, 20, 19–22, 1991.
Shi, Y., Matsunaga, T., Saito, M., Yamaguchi, Y., and Chen, X.: Comparison of global inventories of CO2 emissions from biomass burning during 2002–2011 derived from multiple satellite products, Environ. Pollut., 206, 479-0487, https://doi.org/10.1016/j.envpol.2015.08.009, 2015a.
Shi, Y., Matsunaga, T., and Yamaguchi, Y.: High-resolution mapping of biomass burning emissions in three tropical regions, Environ. Sci. Technol., 49, 10806–10814, https://doi.org/10.1021/acs.est.5b01598, 2015b.
Sofiev, M., Vankevich, R., Lotjonen, M., Prank, M., Petukhov, V., Ermakova, T., Koskinen, J., and Kukkonen, J.: An operational system for the assimilation of the satellite information on wild-land fires for the needs of air quality modelling and forecasting, Atmos. Chem. Phys., 9, 6833–6847, https://doi.org/10.5194/acp-9-6833-2009, 2009.
Song, Y., Liu, B., Miao, W., Chang, D., and Zhang, Y.: Spatiotemporal variation in nonagricultural open fire emissions in China from 2000 to 2007: open fire emissions in China, Global Biogeochem. Cy., 23, GB2008, https://doi.org/10.1029/2008GB003344, 2009.
Streets, D. G., Yarber, K. F., Woo, J. H., and Carmichael, G. R.: Biomass burning in Asia: Annual and seasonal estimates and atmospheric emissions, Global Biogeochem. Cy., 17, 1099, https://doi.org/10.1029/2003GB002040, 2003.
Su, J. F., Zhu, B., Kang, H. Q., Wang, H. L., and Wang, T. J.: Applications of pollutants released form crop residues at open burning in Yangtze River Delta Region in air quality model, Environm. Sci., 33, 1418–1424, 2012 (in Chinese).
Tang, X. B., Huang, C., Lou, S. R., Qiao, L. P., Wang, H. L., Zhou, M., Chen, M. H., Chen, C. H., Wang, Q., Li, G. L., Li, L., Huang, H. Y., and Zhang, G. F.: Emission factors and PM chemical composition study of biomass burning in the Yangtze River Delta Region, Environ. Sci., 35, 1623–1632, 2014 (in Chinese).
Tang, Z. X., Xu, R. R., and Lan, X. L.: Breeding of a new peanut variety fuhua 3 and the physiological foundation of high yield, Chin. Agric. Sci. Bull., 25, 232–237, 2009 (in Chinese).
Tian, H., Hao, J., Lu, Y. Q., and Zhou, Z.: Evaluation of SO2 and NOx emissions resulted from biomass fuels utilization in China, Acta Scien. Circum., 22, 204–208, 2002 (in Chinese).
Tian, H., Zhao, D., and Wang, Y.: Emission inventories of atmospheric pollutants discharged from biomass burning in China, Acta Scien. Circum., 31, 349–357, 2011 (in Chinese).
Tian, X. L., Xia, J., Xia, H. B., and Ni, J.: Forest biomass and its spatial pattern in Guizhou Province, Chin. J. Appl. Ecol., 22, 287–297, 2014 (in Chinese).
van der Werf, G. R., Randerson, J. T., Giglio, L., Collatz, G. J., Mu, M., Kasibhatla, P. S., Morton, D. C., DeFries, R. S., Jin, Y., and van Leeuwen, T. T.: Global fire emissions and the contribution of deforestation, savanna, forest, agricultural, and peat fires (1997–2009), Atmos. Chem. Phys., 10, 11707–11735, https://doi.org/10.5194/acp-10-11707-2010, 2010.
Wang, K. D. and Deng, L. Y.: Dynamics of forest vegetation carbon stock in Fujian Province based on national forest inventories, J. Fujian For. Univ., 34, 145–151, 2014 (in Chinese).
Wang, S. X. and Zhang, C. Y.: Spatial and temporal distribution of air pollutant emissions from open burning of crop residues in China, Science paper Online, 3, 329–333, 2008 (in Chinese).
Wen, X. R., Jiang, L. X., Liu, L., Lin, G. Z., Zheng, Y., Xie, X. J., and She, G. H.: Forest biomass, spatial distribution analysis and productivity estimation in Jiangsu Province, J. Northwest. For. Univ., 29, 36–40, 2014 (in Chinese).
Wiedinmyer, C., Quayle, B., Geron, C., Belote, A., McKenzie, D., Zhang, X., O'Neill, S., and Wynne, K. K.: Estimating emissions from fires in North America for air quality modeling, Atmos. Environ., 40, 3419–3432, https://doi.org/10.1016/j.atmosenv.2006.02.010, 2006.
Wiedinmyer, C., Akagi, S. K., Yokelson, R. J., Emmons, L. K., Al-Saadi, J. A., Orlando, J. J., and Soja, A. J.: The Fire INventory from NCAR (FINN): a high resolution global model to estimate the emissions from open burning, Geosci. Model Dev., 4, 625–641, https://doi.org/10.5194/gmd-4-625-2011, 2011.
Wooster, M. J., Roberts, G., Perry, G. L. W., and Kaufman, Y. J.: Retrieval of biomass combustion rates and totals from fire radiative power observations: FRP derivation and calibration relationships between biomass consumption and fire radiative energy release, J. Geophys. Res., 110, D24311, https://doi.org/10.1029/2005JD006318, 2005.
Xie, G. H., Han, D. Q., Wang, X. Y., and Lv, R. H.: Harvest index and residue factor of cereal crops in China, J. China Agric. Univ., 16, 1–8, 2011a (in Chinese).
Xie, G. H., Wang, X. Y., Han, D. Q., and Xue, S.: Harvest index and residue factor of non-cereal crops in China, J. China Agric. Univ., 16, 9–17, 2011b (in Chinese).
Xu, J. D.: The 8th forest resources inventory results and analysis in China, For. Econ., 3, 6–8, https://doi.org/10.13843/j.cnki.lyjj.2014.03.002, 2014 (in Chinese).
Xue, X. P., Wang, J. G., Guo, W. Q., Chen, B. L., You, J., and Zhou, Z. G.: Effect of nitrogen applied levels on the dynamics of biomass, nitrogen accumulation and nitrogen fertilization recovery rate of cotton after initial flowering, Acta. Eco. Sin., 26, 3632–3640, 2006 (in Chinese).
Yamaji, K., Li, J., Uno, I., Kanaya, Y., Irie, H., Takigawa, M., Komazaki, Y., Pochanart, P., Liu, Y., Tanimoto, H., Ohara, T., Yan, X., Wang, Z., and Akimoto, H.: Impact of open crop residual burning on air quality over Central Eastern China during the Mount Tai Experiment 2006 (MTX2006), Atmos. Chem. Phys., 10, 7353–7368, https://doi.org/10.5194/acp-10-7353-2010, 2010.
Yan, W. L., Liu, D. Y., Sun Y., Wei, J. S., and Pu, M. J.: Analysis of the sustained fog and haze event resulting from crop burning residue in Jiangsu province, Climatic Environ. Res., 19, 237–247, 2014 (in Chinese).
Yan, X., Ohara, T., and Akimoto, H.: Bottom-up estimate of biomass burning in mainland China, Atmos. Environ., 40, 5262–5273, https://doi.org/10.1016/j.atmosenv.2006.04.040, 2006.
Yevich, R. and Logan, J. A.: An assessment of biofuel use and burning of agricultural waste in the developing world, Global Biogeochem. Cy., 17, 1095, https://doi.org/10.1029/2002GB001952, 2003.
Yin, S., Wang, X., Xiao, Y., Tani, H., Zhong, G., and Sun, Z.: Study on spatial distribution of crop residue burning and PM2.5 change in China, Environ. Pollut., 220, 204–221, https://doi.org/10.1016/j.envpol.2016.09.040, 2017.
Yu, L. X., Zhang, J. H., Liu, L. Q., Chen, Q. Q., Zhou, Y., Wang, X. G., Xia, S. B., and Bie, S.: Study on high yield mechanism of hybrid cotton, Hubei Agric. Sci., 48, 2084–2086, 2009 (in Chinese).
Zeng, J. M., Cui, K. H., Huang, J. L., He, F., and Peng, S. B. : Responses of physio-biochemical properties to N-fertilizer application and its relationship with nitrogen use efficiency in rice, Acta Agron. Sin., 33, 1168–1176, 2007 (in Chinese).
Zha, S.: Agricultural fires and their potential impacts on regional air quality over China, Aerosol Air Qual. Res., 13, 992–1001, 2013.
Zhang, H., Hu, D., Chen, J., Ye, X., Wang, S. X., Hao, J. M., Wang, L., Zhang, R., and An, Z.: Particle size distribution and polycyclic aromatic hydrocarbons emissions from agricultural crop residue burning, Environ. Sci. Technol., 45, 5477–5482, https://doi.org/10.1021/es1037904, 2011.
Zhang, H., Wang, S., Hao, J., Wang, X., Wang, S., Chai, F., and Li, M.: Air pollution and control action in Beijing, J. Clean. Prod., 112, 1519–1527, https://doi.org/10.1016/j.jclepro.2015.04.092, 2016.
Zhang, H. F., Ye, X. N., Cheng, T. T., Chen, J. M., Yang, X., Wang, L., and Zhang, R. Y.: A laboratory study of agricultural crop residue combustion in China: Emission factors and emission inventory, Atmos. Environ., 42, 8432–8441, https://doi.org/10.1016/j.atmosenv.2008.08.015, 2008.
Zhang, L., Liu, Y., and Hao, L.: Contributions of open crop straw burning emissions to PM2.5 concentrations in China, Environ. Res. Lett., 11, 014014, https://doi.org/10.1088/1748-9326/11/1/014014, 2016.
Zhang, J., Cui, M., Fan, D., Zhang, D., Lian, H., Yin, Z. and Li, J.: Relationship between haze and acute cardiovascular, cerebrovascular, and respiratory diseases in Beijing, Environ. Sci. Pollut. R., 22, 3920–3925, https://doi.org/10.1007/s11356-014-3644-7, 2015.
Zhang, Y., Tang, L., Croteau, P. L., Favez, O., Sun, Y., Canagaratna, M. R., Wang, Z., Couvidat, F., Albinet, A., Zhang, H., Sciare, J., Prévôt, A. S. H., Jayne, J. T., and Worsnop, D. R.: Field characterization of the PM2.5 Aerosol Chemical Speciation Monitor: insights into the composition, sources, and processes of fine particles in eastern China, Atmos. Chem. Phys., 17, 14501–14517, https://doi.org/10.5194/acp-17-14501-2017, 2017.
Zhao, P. and Chen, F.: Short-term influences of straw and nitrogen cooperation on nitrogen use and soil nitrate content in North Henan, J. China Agric. Univ., 13, 19–23, 2008 (in Chinese).
Zhao, Y., Nielsen, C. P., Lei, Y., McElroy, M. B., and Hao, J.: Quantifying the uncertainties of a bottom-up emission inventory of anthropogenic atmospheric pollutants in China, Atmos. Chem. Phys., 11, 2295–2308, https://doi.org/10.5194/acp-11-2295-2011, 2011.
Zhou, Y., Cheng, S. Y, Lang, J., Chen, D. S., Zhao, B. B., Liu, C., Xu, R., and Li, T.: A comprehensive ammonia emission inventory with high-resolution and its evaluation in the Beijing-Tianjin-Hebei (BTH) region, China, Atmos. Environ., 106, 305–317, https://doi.org/10.1016/j.atmosenv.2015.01.069, 2015.
Zhou, Y., Yue, Y., Lan, L. I., Liu, M., and Zhou, T.: Analysis of a serious haze event resulting from crop residue burning in Central Eastern Hubei, Climatic Environ. Res., 21, 141–152, 2016.
Zhou, Y., Xing, X., Lang, J., Chen, D., Cheng, S., Wei, L., Wei, X., and Liu, C.: A comprehensive biomass burning emission inventory with high spatial and temporal resolution in China, Atmos. Chem. Phys., 17, 2839–2864, https://doi.org/10.5194/acp-17-2839-2017, 2017.
Zhu, B., Su, J. F., Han, Z. W., Cong, Y., and Wang, T. J.: Analysis of a serious air pollution event resulting from crop residue burning over Nanjing and surrounding regions, China Environ. Sci., 30, 585–592, 2010.
Zhu, L. J., Wang, G. Y., and Zhang, Y. L.: Spatial and temporal distribution of crop straw resources in Yangtze River Delta area, Guizhou Agric. Sci., 45, 138–142, 2017 (in Chinese).
Zong, Z., Wang, X., Tian, C., Chen, Y., Qu, L., Ji, L., Zhi, G., Li, J., and Zhang, G.: Source apportionment of PM2.5 at a regional background site in North China using PMF linked with radiocarbon analysis: insight into the contribution of biomass burning, Atmos. Chem. Phys., 16, 11249–11265, https://doi.org/10.5194/acp-16-11249-2016, 2016.
Zou, J., Lu, J. W., Liao, Z. W., Gong, X. M., Wang, H., Zhou, Y. G.. and Zhou, H.: Study on response of rapeseed to boron application and critical level of soil available B in Hubei province, Sci. Agric. Sin., 41, 752–759, 2008 (in Chinese).
Zuo, Z. G.: The cause and prevention of forest fire in forest area of Southern China, Land Greening, 5, 10, 2004 (in Chinese).