the Creative Commons Attribution 4.0 License.
the Creative Commons Attribution 4.0 License.
 | 29 Aug 2022
Aviation contrail climate effects in the North Atlantic from 2016 to 2021
Roger Teoh
Ulrich Schumann
Edward Gryspeerdt
Marc Shapiro
Jarlath Molloy
George Koudis
Christiane Voigt
Marc E. J. Stettler
Around 5 % of anthropogenic radiative forcing (RF) is attributed to aviation CO2 and non-CO2 impacts. This paper quantifies aviation emissions and contrail climate forcing in the North Atlantic, one of the world's busiest air traffic corridors, over 5 years. Between 2016 and 2019, growth in CO2 (+3.13 % yr−1) and nitrogen oxide emissions (+4.5 % yr−1) outpaced increases in flight distance (+3.05 % yr−1). Over the same period, the annual mean contrail cirrus net RF (204–280 mW m−2) showed significant inter-annual variability caused by variations in meteorology. Responses to COVID-19 caused significant reductions in flight distance travelled (−66 %), CO2 emissions (−71 %) and the contrail net RF (−66 %) compared with the prior 1-year period. Around 12 % of all flights in this region cause 80 % of the annual contrail energy forcing, and the factors associated with strongly warming/cooling contrails include seasonal changes in meteorology and radiation, time of day, background cloud fields, and engine-specific non-volatile particulate matter (nvPM) emissions. Strongly warming contrails in this region are generally formed in wintertime, close to the tropopause, between 15:00 and 04:00 UTC, and above low-level clouds. The most strongly cooling contrails occur in the spring, in the upper troposphere, between 06:00 and 15:00 UTC, and without lower-level clouds. Uncertainty in the contrail cirrus net RF (216–238 mW m−2) arising from meteorology in 2019 is smaller than the inter-annual variability. The contrail RF estimates are most sensitive to the humidity fields, followed by nvPM emissions and aircraft mass assumptions. This longitudinal evaluation of aviation contrail impacts contributes a quantified understanding of inter-annual variability and informs strategies for contrail mitigation.
- Article
(3667 KB) - Full-text XML
-
Supplement
(3541 KB) - BibTeX
- EndNote


Aircraft emissions of CO2, nitrogen oxides (NOx) and soot particles are major contributors to aviation's climate forcing (Lee et al., 2021). Water vapour and soot particles, which consist of a mixture of non-volatile particulate matter (nvPM) and semi-volatile organic and inorganic particles (Petzold et al., 2013; Kärcher and Yu, 2009; Schumann, 1996; Stettler et al., 2011), can also contribute to contrail formation when conditions in the exhaust plume satisfy the Schmidt–Appleman criterion (SAC) (Schumann, 1996). Contrails that are formed in ice supersaturated regions (ISSR) may persist and spread over several hours and evolve into contrail cirrus (Schumann et al., 2017). The annual mean contrail cirrus cover can be up to 10 % of the sky area in high-air-traffic regions such as Europe and the US east coast (Burkhardt and Kärcher, 2011). Contrail cirrus absorbs and re-emits outgoing long-wave (LW) infrared radiation at all times and only reflects incoming short-wave (SW) solar radiation during the day (Meerkötter et al., 1999), with the net result being a positive (warming) radiative forcing (RF) (Kärcher, 2018; Lee et al., 2021).
An evaluation of global aviation activity in 2018 estimated that contrail cirrus is the largest contributor to annual mean RF due to aviation, at 111 [33, 189] mW m−2 (95 % confidence interval), followed by aviation's cumulative CO2 (34 [31, 38] mW m−2) and annual NOx emissions (8.2 [−4.8, 16] mW m−2) (Lee et al., 2021). Although the nominal contrail cirrus net RF is around 3 times higher than the CO2 RF, its effect on global mean surface temperature change is less certain for the following reasons: contrail cirrus is heterogeneously distributed; it mainly warms the upper troposphere; and it dehydrates the atmosphere, which could reduce the occurrence and optical thickness of natural cirrus and partially offset its warming effect (Meerkötter et al., 1999; Schumann and Mayer, 2017; Ponater et al., 2021). To account for these second-order effects, the climate forcing of contrail cirrus is also quantified as the effective radiative forcing (ERF) (Ponater et al., 2021; Lee et al., 2021; Myhre et al., 2013; Szopa et al., 2021). The global annual mean contrail cirrus net ERF (57.4 [17, 98] mW m−2) is estimated to be 47 % smaller than the contrail cirrus net RF (111 [33, 189] mW m−2), but the contrail cirrus net ERF estimate (57.4 [17, 98] mW m−2) is still 67 % larger than the CO2 ERF (34.3 [28, 40] mW m−2) (Lee et al., 2021). Unlike the spatial homogeneity of CO2 forcing, the climate forcing due to contrail cirrus varies spatially and temporally, depending on the local meteorology, surface and cloud albedo, and air traffic density (Meerkötter et al., 1999; Stuber et al., 2006; Sanz-Morère et al., 2021; Schumann et al., 2012; Chen and Gettelman, 2013; Burkhardt and Kärcher, 2011; Schumann and Heymsfield, 2017). The annual mean contrail cirrus net RF ranges from 70 to 360 mW m−2 over low-albedo regions, such as the North Atlantic flight corridor, to over 1 W m−2 over high-traffic regions with higher albedo, such as North America and Europe (Chen and Gettelman, 2013; Schumann et al., 2015; Schumann and Graf, 2013; Burkhardt and Kärcher, 2011; Bock and Burkhardt, 2019).
While atmospheric conditions determine the formation and persistence of a contrail, the aircraft non-volatile soot number emissions index (EIn) modifies the contrail properties (Kärcher, 2018; Schumann, 1996; Voigt et al., 2021; Bräuer et al., 2021b). In the “soot-rich” regime, where EIn>1013 kg−1, and under ice supersaturated conditions, the initial contrail ice crystal number is proportional to nvPM EIn because these particles act as the primary source of condensation nuclei (Schumann, 1996; Kleine et al., 2018). Under “soot-poor” conditions, ice crystal numbers are thought to be constrained by a lower limit of around 1013 kg−1 due to the presence of organic particles and ambient natural aerosols (Kärcher, 2018). Recent cruise measurements have found that the fraction of aircraft nvPM that activates into contrail ice crystals depends on the ambient temperature (Bräuer et al., 2021a), and they also confirmed that a lower EIn reduces the ice crystal number and optical depth (τcontrail) of young contrails (Voigt et al., 2021; Bräuer et al., 2021b). Studies that used a contrail life cycle simulation have shown that a lower nvPM EIn can reduce contrail lifetime and climate forcing (Burkhardt et al., 2018; Teoh et al., 2020b; Bock and Burkhardt, 2019; Schumann et al., 2013). Although the nvPM EIn is recognised as a critical parameter that initialises the ice particle number in contrail models, previous estimates (Schumann et al., 2021; Teoh et al., 2020b; Caiazzo et al., 2017; Schumann, 2012) that found the EIn to be in the range of 1014 to 1015 kg−1 were informed by measurements from a limited number of aircraft–engine types (Moore et al., 2017; Durdina et al., 2017; Wey et al., 2006; Lobo et al., 2015; Boies et al., 2015). However, recent ground nvPM measurements from the International Civil Aviation Organization (ICAO) show that the EIn can vary by up to 5 orders of magnitude for different power outputs and engine types, ranging between 1011 and 1016 kg−1 (EASA, 2021). This large variation in nvPM EIn by engine type would translate to differences in their respective contrail properties (Jeßberger et al., 2013), but these effects have not yet been comprehensively quantified.
An earlier study focusing on the Japanese airspace (Teoh et al., 2020b) found that 2 % of all flights are responsible for 80 % of the contrail energy forcing (the total energy trapped in the atmosphere by contrails). However, these results were derived from 6 weeks of air traffic data, and the relatively small sample size did not allow for the identification of factors that led to the formation of strongly warming/cooling contrails. In this study, we use a new dataset containing air traffic data for the North Atlantic region from January 2016 to March 2021 to address these limitations. This dataset also spans the COVID-19 period, which resulted in a 60 % year-on-year drop in global passenger traffic (ICAO, 2021), thereby enabling us to quantify the changes in aircraft emissions and contrail climate forcing in this region and compare it with previous estimates (Schumann et al., 2021; Gettelman et al., 2021; Quaas et al., 2021).
This paper aims to (i) evaluate the magnitude and the changes in aircraft CO2, NOx and nvPM number emissions and contrail climate forcing in the North Atlantic from January 2016 to March 2021, including effects from the COVID-19 pandemic; (ii) identify the set of factors that lead to strongly warming/cooling contrails; (iii) conduct uncertainty and sensitivity analyses relating to meteorological, emissions and model parameters; and (iv) discuss the implications for contrail mitigation.
This section describes the datasets and models that are used to simulate the aircraft emissions, contrail properties and climate forcing that arise from individual flights in the North Atlantic region. In summary, we used (i) an air traffic dataset provided by the UK air navigation service provider, NATS; (ii) the ERA5 high-resolution realisation (HRES, or “reanalysis”) and 10-member ensemble reanalysis from the European Centre for Medium-Range Weather Forecast (ECMWF); (iii) the Base of Aircraft Data (BADA) aircraft performance models from EUROCONTROL (2016, 2019); (iv) the ICAO Aircraft Engine Emissions Databank (EDB) (EASA, 2021) and methodologies to estimate the nvPM (Teoh et al., 2019, 2020b), NOx (DuBois and Paynter, 2006) and CO2 emissions at cruise; and (v) the contrail cirrus prediction model (CoCiP) (Schumann, 2012).
2.1 Air traffic dataset
The air traffic data contain waypoint data for all civil flights that traversed the Shanwick Oceanic Area Control Centre (OACC) from 1 January 2016 to 31 March 2021, totalling 2.1 million flights. Flight data include the call sign, operator, origin and destination airports, and the ICAO aircraft type designator. Waypoint data include 4D positions (longitude, latitude, altitude and time) recorded when the flight passes through a series of fixed waypoints along the route and when a climb/descend air traffic command is executed by the pilot in between the fixed waypoints.
There are spatio-temporal heterogeneities in the dataset stemming from two distinct sources: (i) waypoints for westbound flights are only recorded in the Shanwick OACC (10 to 40∘ W), whereas additional waypoints are available prior to entry into Shanwick for eastbound flights (10 to 70∘ W); and (ii) the temporal resolution between the recorded waypoints ranges from 30 to 3600 s. We resample the dataset by performing a great-circle interpolation between waypoints to produce flight segments with a uniform temporal resolution (60 s). Full flight trajectory coverage in the adjacent Gander OACC is approximated by a great-circle interpolation between the first (final) recorded waypoint and the origin (destination) airport, with the subsequent removal of waypoints outside Shanwick and Gander. Therefore, the processed dataset approximates the air traffic activity in the North Atlantic flight corridor between 40–75∘ N and 50–10∘ W. Further information on the NATS dataset is detailed in the Supplement (Sect. S1).
2.2 Meteorology
Meteorological and radiation data are downloaded from the ECMWF Copernicus Climate Data Store (ECMWF, 2021). The ERA5 HRES reanalysis is obtained at a 0.25∘ × 0.25∘ horizontal resolution for 37 pressure levels and at a 1 h temporal resolution, whereas the ERA5 10-member ensemble (0.5∘ × 0.5∘ horizontal resolution, 37 pressure levels, 3 h temporal resolution) provides an estimate of uncertainties in the reanalysis (Hersbach et al., 2020) and is used to evaluate uncertainty in contrail forcing due to meteorology (Sect. 2.6). For each waypoint, we use a quadrilinear interpolation to estimate the local meteorological values (Schumann, 2012).
The relative humidity with respect to ice (RHi) determines the contrail persistence and lifetime (Schumann, 1996; Kärcher, 2018). However, existing studies have highlighted that the ERA5 humidity fields are generally weakly supersaturated (RHi ≈100 %) and underestimate regions with very high supersaturations (RHi >120 %) (Gierens et al., 2020; Schumann et al., 2021; Rädel and Shine, 2010; Reutter et al., 2020; Tompkins et al., 2007). We present a comparison of the ERA5 humidity fields with in situ measurements from the In-service Aircraft for a Global Observing System (IAGOS) database (Petzold et al., 2020; Boulanger et al., 2018) in Sect. S3, and our analysis supports these earlier findings (Fig. S9a). To address these issues, we scale the ERA5 humidity fields throughout the domain by division of coefficient a; data points within ISSRs (RHi >100 %) are then scaled up using a power-law function with coefficient b:
The coefficients (a=0.9779 and b=1.635 for the ERA5 HRES; a=0.9666 and b=1.776 for the ERA5 10-member ensemble) are found by minimising the Cramér–von Mises test statistic (Parr and Schucany, 1980), a measure of the goodness of fit between two empirical distributions, between the probability distribution of RHiCorrected and that of the IAGOS observations in the spatial domain of the air traffic dataset in 2019, comprising 262 flights and 43 919 data points. Further details are included in Sect. S3. We explore the sensitivity of contrail predictions to meteorological data in Sects. 2.6 and 3.5.
2.3 Aircraft performance and fuel consumption
The BADA Family 3 and 4 aircraft performance models are used to simulate the physical forces that act upon an aircraft and the resultant fuel consumption (EUROCONTROL, 2016, 2019). BADA 3 covers over 1400 aircraft types, whereas BADA 4, which improves upon BADA 3 by including proprietary manufacturer information and accounting for the compressibility and wave drag (Nuic et al., 2010), covers 105 aircraft–engine combinations. The simulated fuel mass flow rate () and net thrust are used to estimate the overall propulsion efficiency (η), which influences contrail formation (Schumann, 1996).
We use BADA 4 where possible, covering 91 % of flights in the NATS dataset, and BADA 3 for the remaining flights. BADA also provides a range of mass values for each aircraft type. As aircraft mass is not known, we set the initial aircraft mass (at the first waypoint) to the nominal (reference) value for flights occurring before April 2020. For flights affected by the COVID-19 pandemic, from April 2020, we assume a “low” aircraft mass by taking the average of the zero-fuel weight and reference values to account for the reduced load factor. We describe and quantify the sensitivity to these aircraft mass assumptions in Sects. 2.6 and 3.5.
2.4 Emissions
An estimate of the nvPM EIn and NOx emissions index (EI) requires inputs of and engine-specific data. Here, the and aircraft–engine assignments are obtained from BADA, and the ICAO EDB provides the pressure ratio, nvPM EIn and EI for available engine types at the four certification test points (EASA, 2021).
Three approaches are used to estimate the nvPM EIn at cruise: (i) a new approach which utilises nvPM EIn measurements from the ICAO EDB to perform a linear interpolation relative to the non-dimensional engine power (66.4 % of flights in the NATS dataset); (ii) the fractal aggregates model that was used in earlier studies (Teoh et al., 2020b, a, 2019) to estimate the nvPM EIn from the mass emissions index (Stettler et al., 2013; Abrahamson et al., 2016), particle size distribution and morphology (33.3 % of flights); and (iii) a constant nvPM EIn of 1015 kg−1 when data on the aircraft–engine pair are not available (0.3 % of flights). Further methodological details are described in Sect. S2. Method (i) is the preferred approach because it captures the distinct emissions profile from different engine types (Sect. S2.1). However, the new ICAO EDB nvPM database only provides data for 47 aircraft–engine pairs, thereby necessitating the use of method (ii) or (iii). Method (ii) was formulated based on the emissions profile of singular annular combustors. In a comparison against cruise measurements from Voigt et al. (2021), we found good agreement for the nvPM EIn estimated using method (i) for one aircraft–engine pair (Sect. S2.3). While limited, this indicates that the emissions indices that are corrected for system line losses are most appropriate.
We estimate the cruise EI using the Fuel Flow Method 2, where EI from the ICAO EDB is fitted linearly on a log–log scale and interpolated using the equivalent at sea level (DuBois and Paynter, 2006). The CO2 emissions are estimated with a constant emissions index of 3.159 kg CO2 kg−1 (Wilkerson et al., 2010).
2.5 Contrail simulation
CoCiP is used to evaluate the life cycle of contrails produced from individual flights (Schumann, 2012). If two consecutive flight waypoints satisfy the SAC, a contrail segment is formed. A Runge–Kutta integration simulates the contrail evolution with time steps of 1800 s until its end of life, which is defined as the point when the ice number concentration is lower than the background ice nuclei (<103 m−3), τcontrail is less than 10−6 or the maximum contrail lifetime of 24 h is reached (Schumann, 2012). Further information on CoCiP can be found in the literature (Schumann, 2012; Schumann et al., 2012).
The initial contrail properties are dependent on the nvPM EIn (Kärcher, 2018; Schumann, 2012). For this study, we calculate the nvPM EIn for different aircraft–engine types (Sect. 2.4) and set a lower bound of 1013 kg−1 to account for the activation of organic volatile particles and ambient natural aerosols (Kärcher, 2018). We have also used the latest evidence from in situ measurements of contrails that indicates that the activation of nvPM particles to form contrail ice particles is not complete when ambient temperatures (Tamb) are near the SAC threshold temperature (TSAC) (Bräuer et al., 2021a). Specifically, the proportion of nvPM that activates to form contrail ice crystals is calculated as follows:
Equation (2) asymptotically approaches unity and attains values > 0.99 for .
CoCiP simulates the unique properties and shape of individual contrail segments over time (Schumann, 2012), and it accounts for overlapping of contrails above or below clouds present in the meteorological data (Schumann et al., 2012) (Fig. S17 in the Supplement). The model is set up in its original form without humidity exchange between contrails and the background air and without radiative effects caused by contrail–contrail overlapping. We acknowledge that the lack of atmospheric interaction and feedback is a limitation of CoCiP relative to general circulation models (Burkhardt et al., 2018; Chen and Gettelman, 2013; Bickel et al., 2019) and is a topic for further research. Previous studies that approximated the contrail–atmosphere humidity exchange in CoCiP have since found a 10 %–20 % reduction in τcontrail and contrail net RF (Schumann et al., 2015, 2021), while a parametric analysis suggested that the effects of contrail–contrail overlapping on the net RF is small (∼0.3 mW m−2) in regions such as the North Atlantic and can likely be neglected (Sanz-Morère et al., 2021).
The contrail outputs are saved at waypoint, hourly, flight and gridded levels (Schumann, 2012; Teoh et al., 2020b). Contrail cirrus and natural cirrus cover in a grid cell are assumed when their respective optical depth (τ) values are above a threshold of 0.1, which corresponds to the satellite detectability threshold (Mannstein et al., 2010). Contrail cirrus coverage (as a percentage of sky area) in a region is defined as the total cirrus cover minus the natural cirrus cover (Schumann, 2012). The local contrail RF (RF', instantaneous change in energy flux per contrail area) (Schumann et al., 2012) of each waypoint is aggregated to obtain the contrail RF in the domain, and the annual contrail ERF is approximated using an ERF RF ratio of 0.42 (Lee et al., 2021). The contrail energy forcing (EFcontrail) from individual contrail segments and flights is calculated as follows:
where L, W and T are the contrail length, width and lifetime respectively. Essentially, the RF', RF and ERF (in W m−2) quantify the instantaneous changes in the radiative energy balance at one point in time over a defined spatial domain, whereas EF (in J) provides the cumulative radiative effect of individual contrail segments.
2.6 Uncertainty and sensitivity analysis
The simulated contrail properties and climate forcing are sensitive to various input parameters, assumptions and model processes. To perform an uncertainty and sensitivity analysis on our results, we re-run the simulation with five distinct set-ups: (i) the ERA5 10-member ensemble is used to evaluate the uncertainty in contrail properties and forcing due to uncertainty in meteorology and radiation (Hersbach et al., 2020); (ii) a simulation where no corrections are applied to the ERA5 HRES humidity fields; (iii) a simulation to evaluate the sensitivity to EIn, in which we assume a constant nvPM EIn of 1015 kg−1 for all waypoints; (iv) two simulations where we assume a respective “low” aircraft mass (average of the reference and zero-fuel weight) and “high” aircraft mass (average of the reference and maximum take-off weight) for all flights at the initial waypoint; and (v) a simulation to test the sensitivity to the soot activation near threshold conditions by assuming that all nvPM particles activate to form contrail ice crystals (i.e. pactivation=1). Due to computational resource constraints, the uncertainty and sensitivity analysis is conducted for 2019 only.
3.1 Multi-year statistics
Table 1 summarises the annual air traffic, emissions and contrail statistics in the North Atlantic region. Between 2016 and 2019, we found the following: (i) the growth in total fuel consumption and CO2 emissions (+3.13 % yr−1) outpaced the total flight distance (+3.05 % yr−1) due to the use of larger aircraft types (mean aircraft mass, +1.3 % yr−1) (Fig. S6); (ii) total NOx emissions grew by +4.5 % yr−1, which is likely attributable to the higher combustion pressure and temperature in more fuel-efficient engines (Kyprianidis and Dahlquist, 2017; Freeman et al., 2018); (iii) the mean nvPM EIn increased by +0.5 % yr−1; and (iv) the contrail cirrus net RF showed significant inter-annual variability (up to ±19 % relative to the mean, ranging between 204 and 280 mW m−2), consistent with Wilhelm et al. (2021), indicating a stronger dependence on meteorology than the total flight distance (Fig. S12).
Table 1Annual air traffic, emissions, meteorology and contrail statistics in the North Atlantic flight corridor from January 2016 to March 2021.
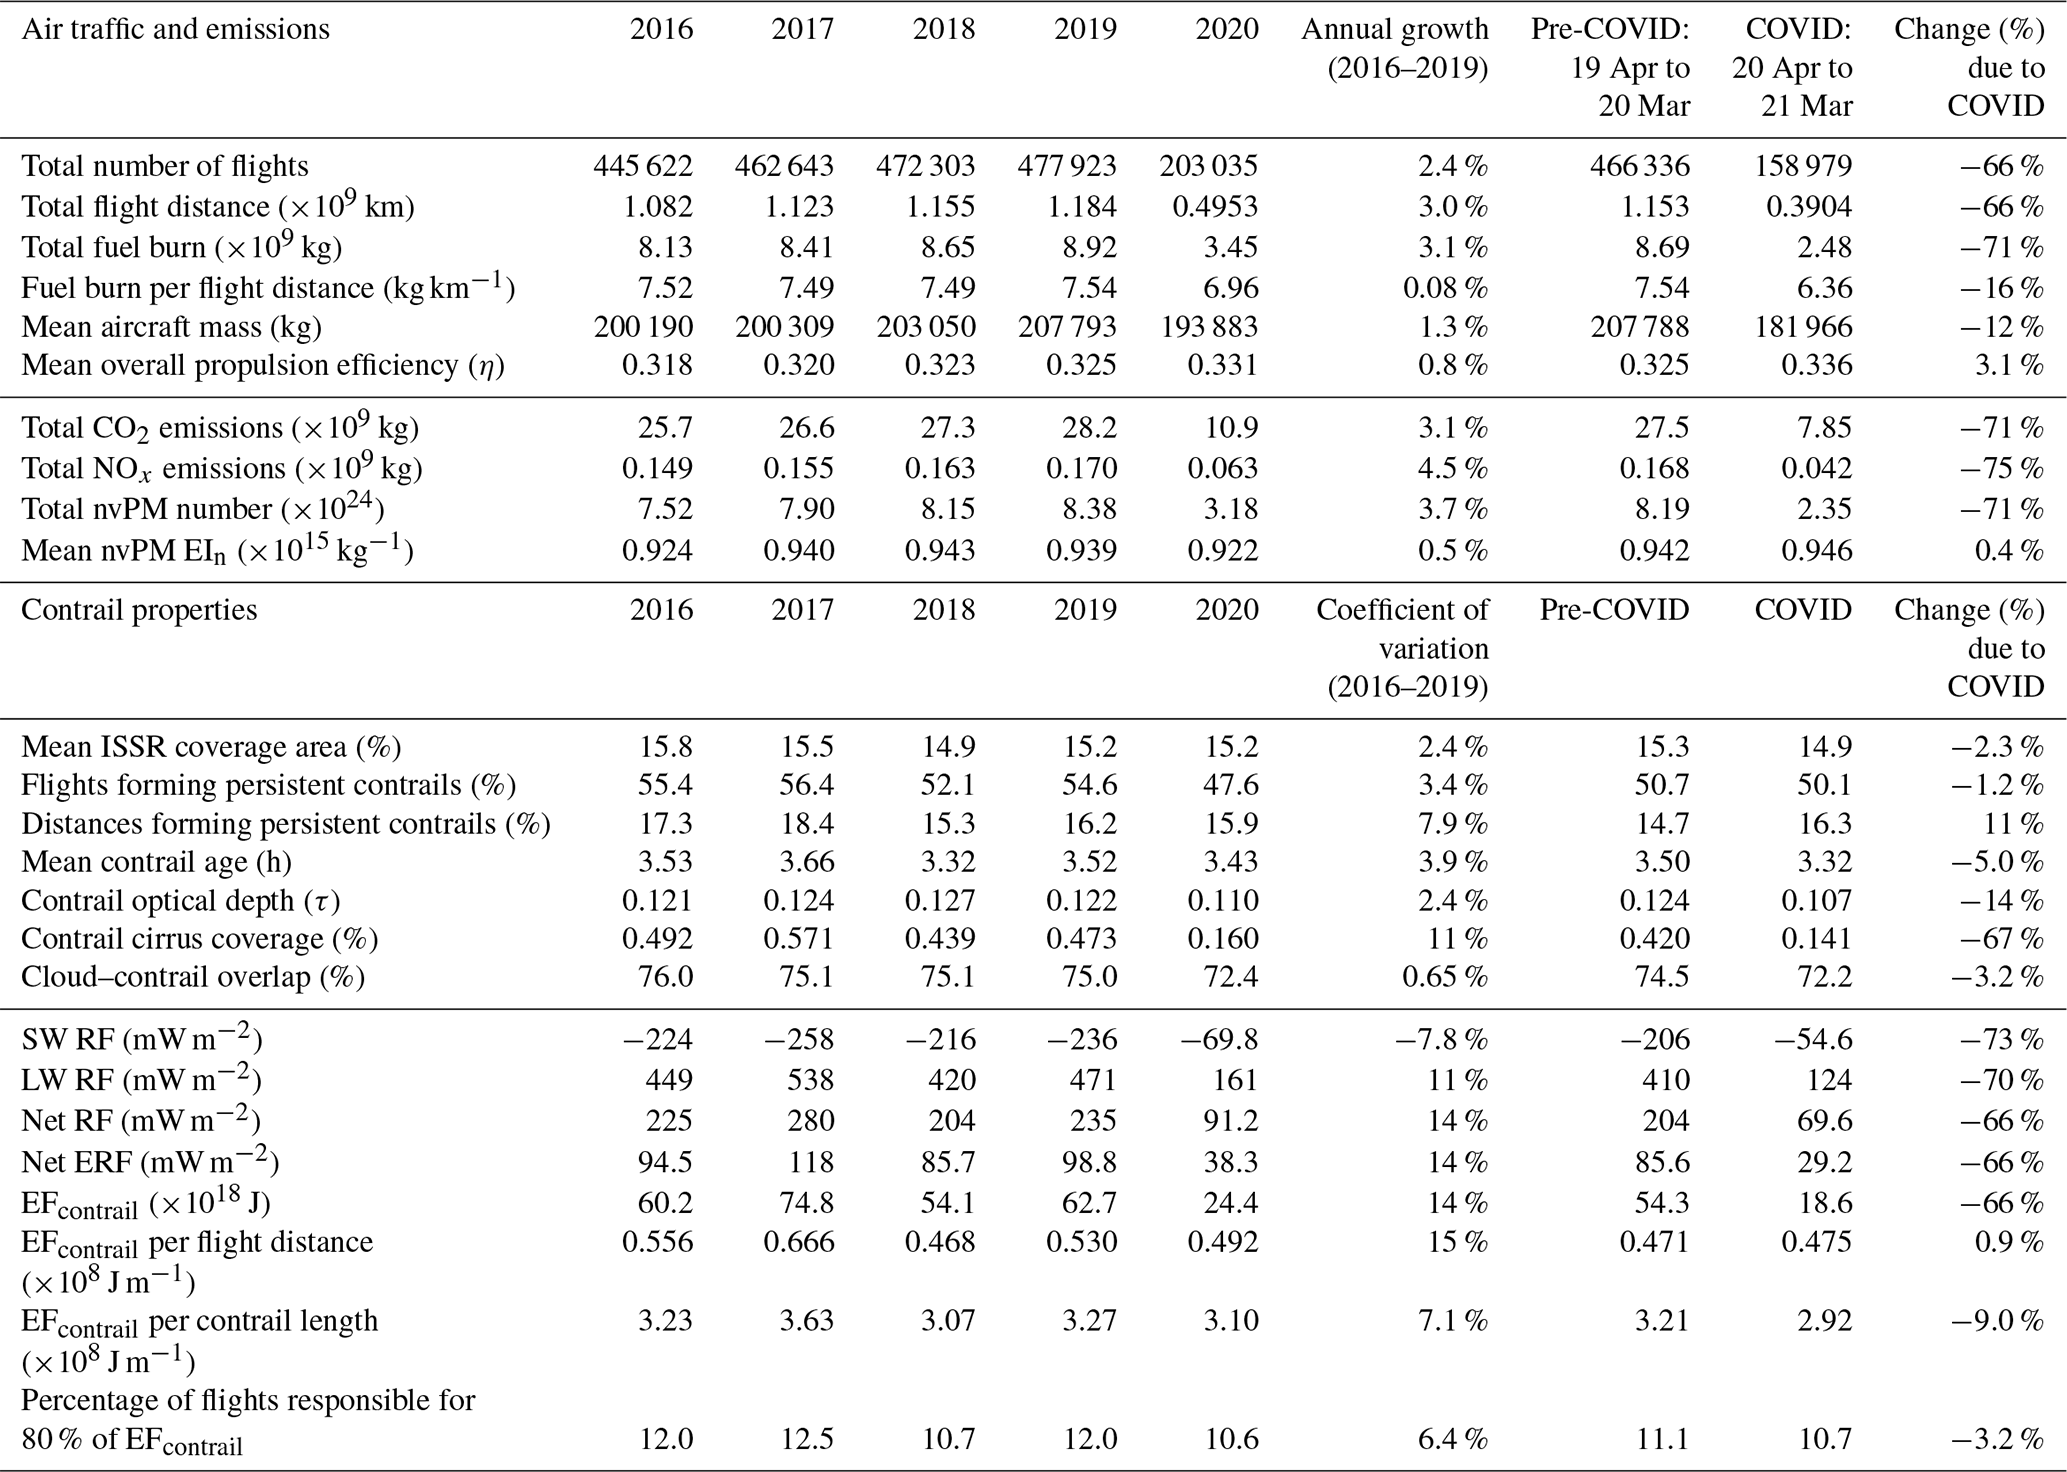
Comparing statistics during the COVID-19 period (1 April 2020 to 31 March 2021) with the prior 1-year period, we find that the reductions in total fuel consumption and CO2 emissions (−71 %) are greater than the reduction in total flight distance (−66 %), partly because we assumed a lower aircraft mass to account for lower passenger load factors resulting from COVID-19 travel restrictions (Sect. 2.3). The proportion of the flight distance forming persistent contrails (pcontrail) during the COVID period was higher relative to pre-COVID (16.3 % vs. 14.7 %), partly due to the use of more efficient aircraft types with a higher mean η (+3.1 %), which facilitates contrail formation. There is a 66 % reduction in the annual contrail cirrus net RF, but the reduction in SW RF (−74 %) is larger than that in LW RF (−70 %) for reasons that are consistent with recent COVID studies (Gettelman et al., 2021; Schumann et al., 2021): reductions in total flight distance and contrail cirrus cover were largest during the spring months (−80 % and −83 % relative to pre-COVID respectively) at a time when the contrail SW RF tends to be at its maximum (Fig. 1f). We also simulated contrails for the COVID-19 period with pre-COVID traffic to approximate the likely contrail climate forcing under normal traffic conditions; in this scenario, the annual contrail cirrus net RF increased from 69.6 mW m−2 (actual COVID scenario) to 235 mW m−2, which is 15 % higher relative to the pre-COVID period (204 mW m−2).
On average (from 2016 to 2020), around 12 % of all flights in this region accounted for 80 % of the annual EFcontrail (Table 1, Fig. 2); this is approximately 5 times larger than an earlier study which found that 2.2 % of flights over Japan caused 80 % of the total EFcontrail (Teoh et al., 2020b). Several factors are likely to have contributed to this difference: (i) the small sample size of the study over Japan, which only utilised 6 weeks of air traffic data; (ii) the fact that 58 % of all flights over Japan are domestic short-haul flights, meaning that more time is spent in climb and descent, leading to a smaller mean pcontrail (7.2 %) relative to the North Atlantic (16.6 %; Table 1); and (iii) the use of radar surveillance in Japanese airspace which results in more randomised traffic patterns, relative to the organised track structure (OTS) in the North Atlantic where flight paths often traverse the same air parcel and have a smaller variation in flight distances and headings.
3.2 Seasonal contrail statistics
The air traffic activity, meteorology and contrail characteristics in the North Atlantic exhibit seasonal patterns (Fig. 1). Air traffic activity peaks in the summer (Fig. 1a), but there is a higher occurrence of persistent contrails during the winter despite traffic levels being 30 % below peak values: pcontrail is higher in wintertime (23 %) relative to summertime (13 %) (Fig. 1b), consistent with the pcontrail derived from in situ measurements (Gierens et al., 1999), and these contrails persist for longer (3.2 in winter vs. 2.6 h in summer) (Fig. 1c). These phenomena can be attributed to seasonal variations in the ISSR coverage (Fig. S13). In winter, the larger horizontal extent of ISSRs increases pcontrail, and the thicker vertical extent of ISSRs reduces the probability of contrails encountering warm/dry air after forming and sedimentation, thereby increasing their lifetime (Agarwal et al., 2022; Kärcher, 2018; Schumann and Heymsfield, 2017). The contrail ice crystal volume mean radius (rice) and τcontrail averaged over all contrail-forming flights in wintertime are around 25 % smaller relative to the summer (Fig. S14g, h), and these are likely caused by seasonal variations in the tropopause and temperature (Hoinka et al., 1993; Lewellen, 2014): a higher proportion of flights cruise above or close to the tropopause in wintertime, due to the lower tropopause height (Fig. S13), and contrails are formed with less condensable water (Fig. S14d), whereas a higher tropopause height in the summer and the moist upper troposphere facilitate the formation of contrails with larger ice water content, rice and τcontrail.
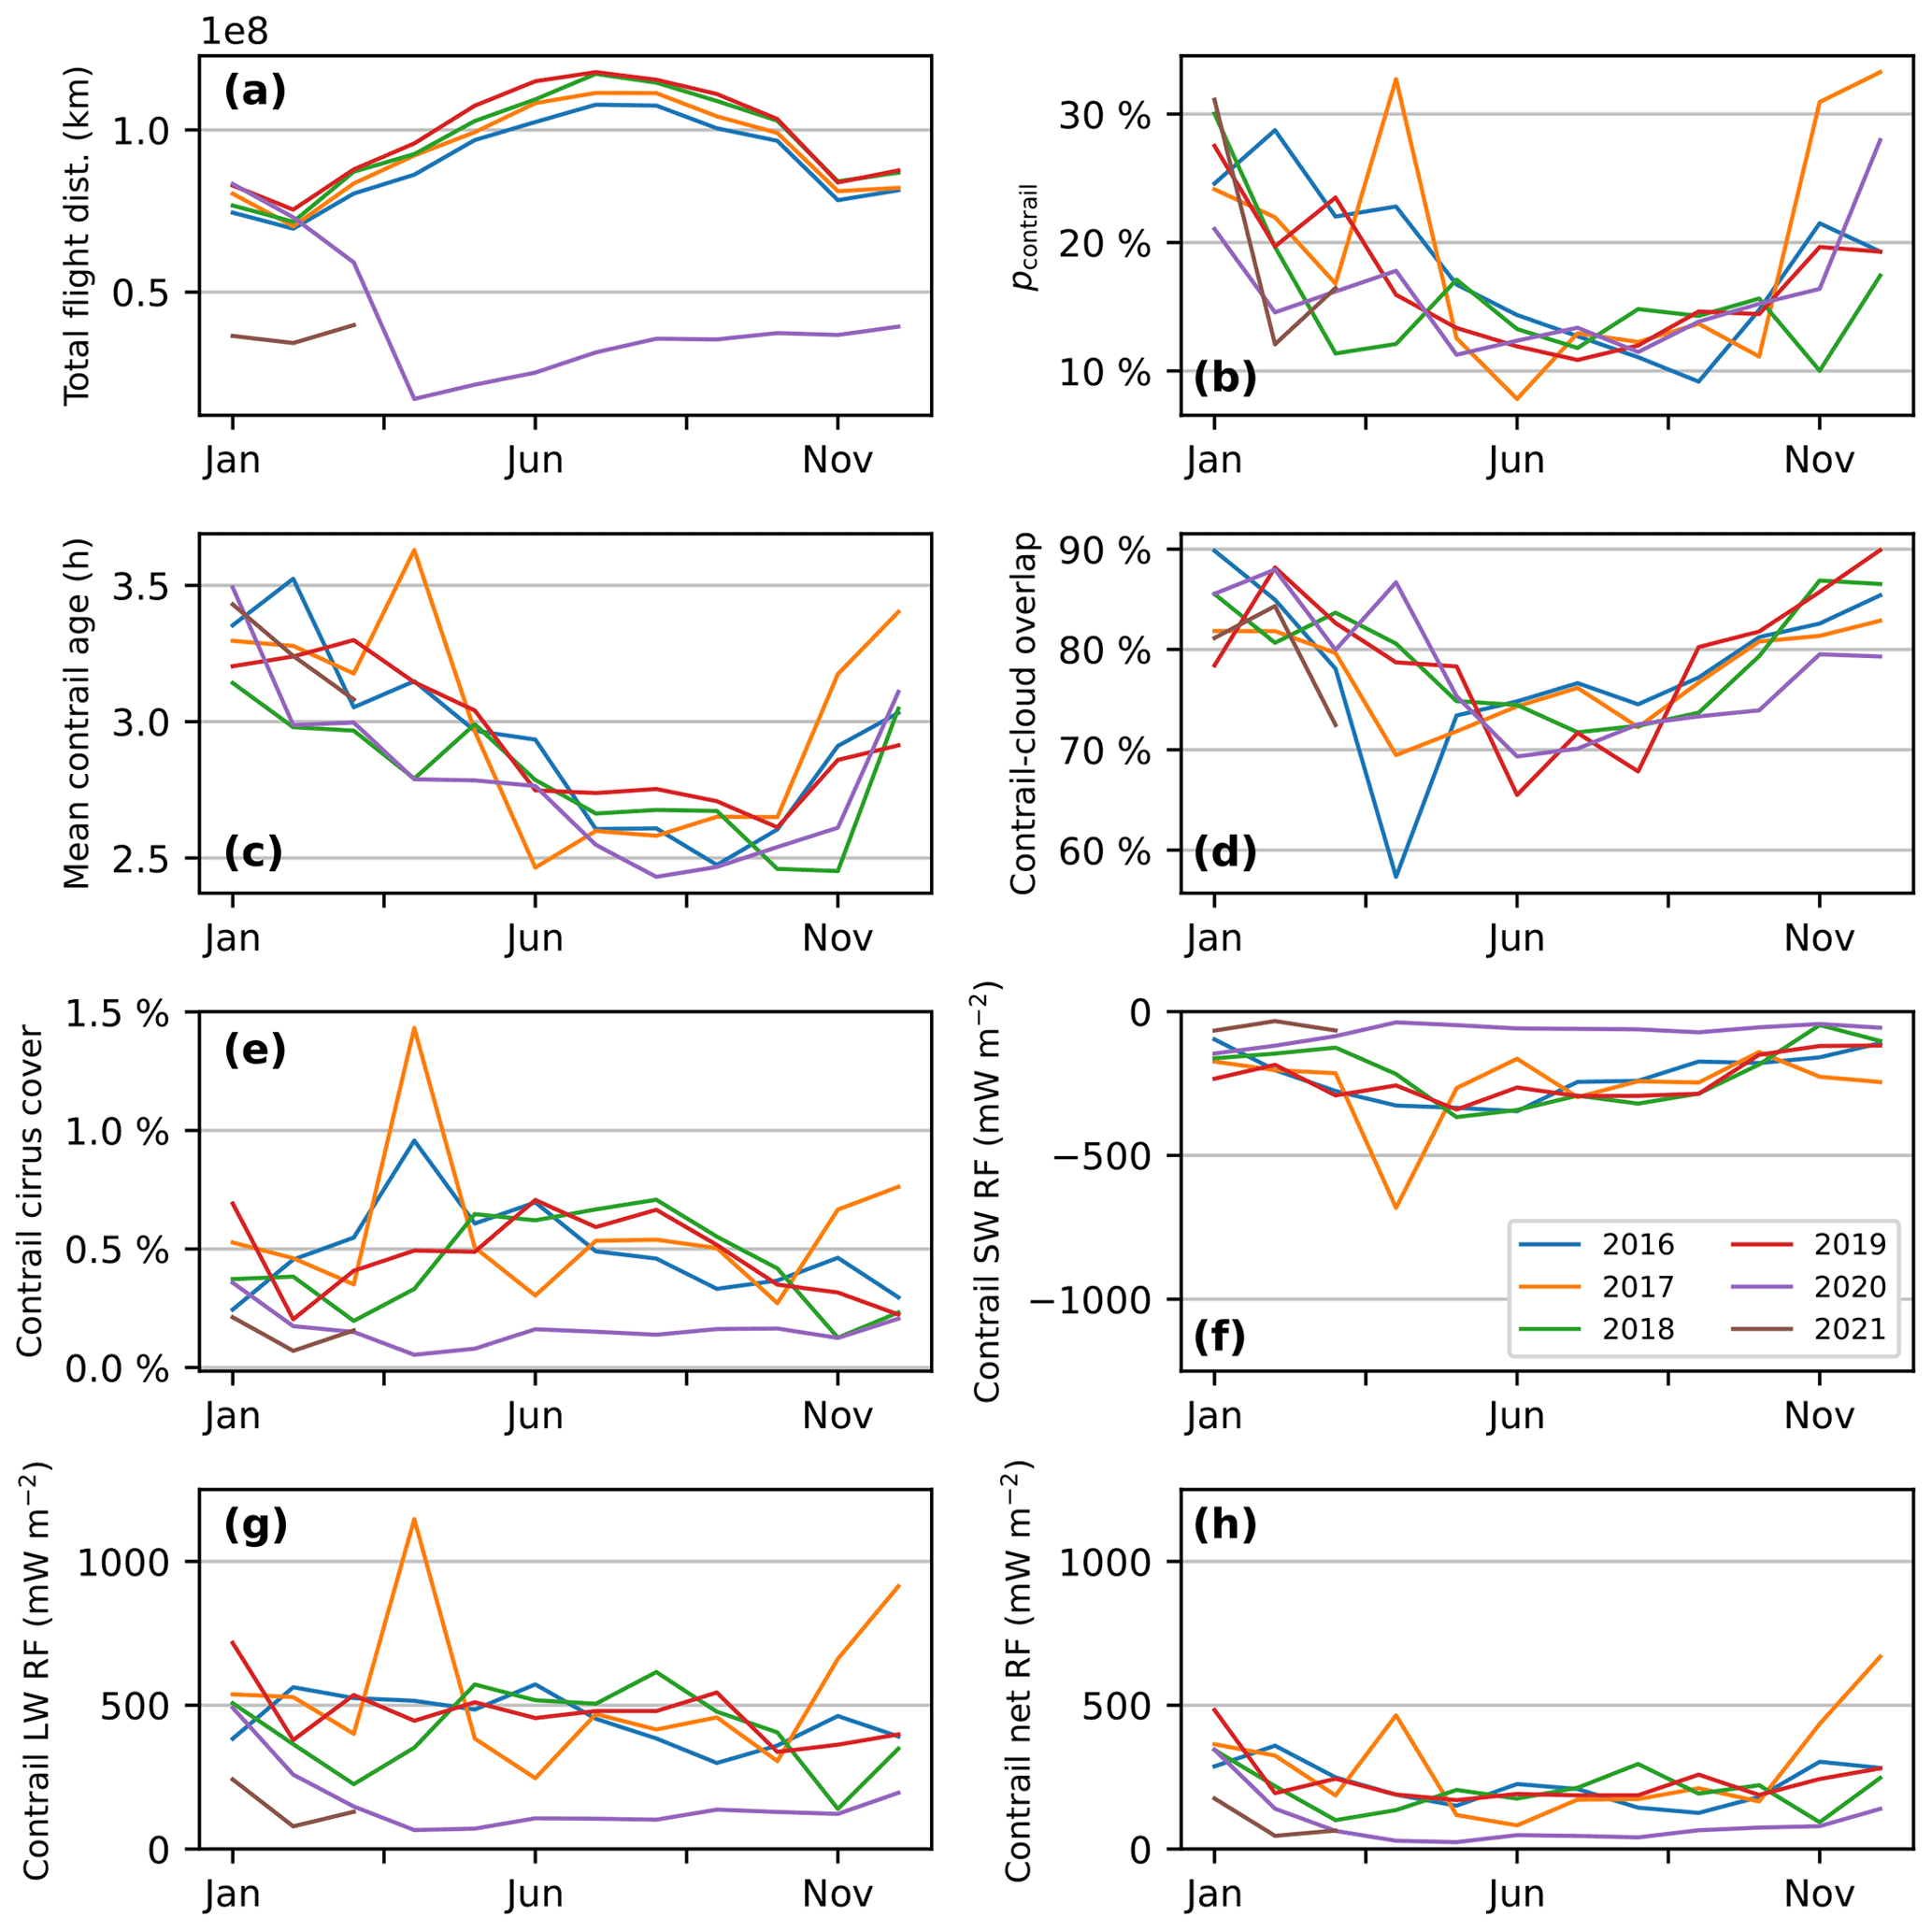
Figure 1Monthly statistics in the North Atlantic region from January 2016 to March 2021, including the (a) total flight distance; (b) percentage of the flight distance forming persistent contrails (pcontrail); (c) mean contrail age; (d) percentage of the contrail area overlapping with natural cirrus; (e) contrail cirrus cover; and (f) contrail cirrus SW RF, (g) LW RF and (h) net RF. Additional variables that are not presented in this figure are available in Fig. S14 (Sect. S4).

Figure 2Cumulative density function of the total EFcontrail vs. the percentage of flights. Individual coloured lines represent the results for each year (2016–2020) in the North Atlantic, and the black line shows the results from an earlier study in Japanese airspace (Teoh et al., 2020b).
An earlier study highlighted that contrails that form over the North Atlantic can exhibit a net cooling effect under cloud-free conditions (Sanz-Morère et al., 2021). However, our analysis of the hourly mean contrail cirrus net RF suggests that these cooling periods occur infrequently (∼13 % in 2019; Fig. 3) because around 70 % (summer) to 90 % (winter) of the contrail area overlaps with natural cirrus (Fig. 1d). The mean ERA5 natural cirrus coverage in this region varies between 40 % (summer) and 59 % (winter), and the contrail cirrus coverage generally peaks at around 0.7 % in the summer (Fig. 1e) because of the minimum natural cirrus cover and cloud–contrail overlap during this period.
Between 2016 and 2019, the mean contrail cirrus SW RF in springtime is around 16 % larger than summertime (−323 vs. −280 mW m−2 respectively; Fig. 1f) despite air traffic levels being 11 % below the summer peak and both seasons having a comparable mean solar direct radiation (SDR) (∼394 W m−2; Fig. S14i). This can be attributed to summertime meteorological conditions that are generally less favourable for contrail formation (pcontrail of 13 % in summer vs. 17 % in spring) and persistence (mean age of 2.7 vs. 3.0 h respectively). The contrail LW RF is dependent on the surface temperature and outgoing long-wave radiation (OLR), contributing to smaller seasonal fluctuations in the LW RF relative to the SW RF (Fig. 1g). When taken together, the mean contrail net RF peaks during the winter (302 mW m−2) and reaches a minimum in spring (196 mW m−2) (Fig. 1h). Figure 1 also shows outliers in pcontrail, contrail cirrus cover and RF values in April 2017, and this was primarily caused by large intersections between the ISSR and OTS (Fig. S15).
3.3 Conditions for forming strongly warming/cooling contrails
Figure 3a shows the contrail net RF and EFcontrail per contrail distance for each hour of 2019. There is a clear diurnal effect, where the mean net RF is ∼199 mW m−2 during daylight hours, increasing to ∼385 mW m−2 (and up to 2.6 W m−2) around ±1 h of the sunrise and sunset time, and then falls to 293 mW m−2 at night-time (periods where SDR =0; Fig. S16). The peak net RF around sunrise and sunset is partly attributable to the flight scheduling in this region: eastbound and westbound traffic activity is highest at around 03:00–06:00 and 12:00–16:00 UTC respectively (Fig. S5a). At night, the mean net RF is 24 % smaller than the peak values around sunrise and sunset because air traffic is at a minimum between 18:00 and 02:00 UTC, but contrails that persist during these times have the largest EFcontrail per contrail length, which is up to 1 order of magnitude larger than daytime values (Fig. 3b).
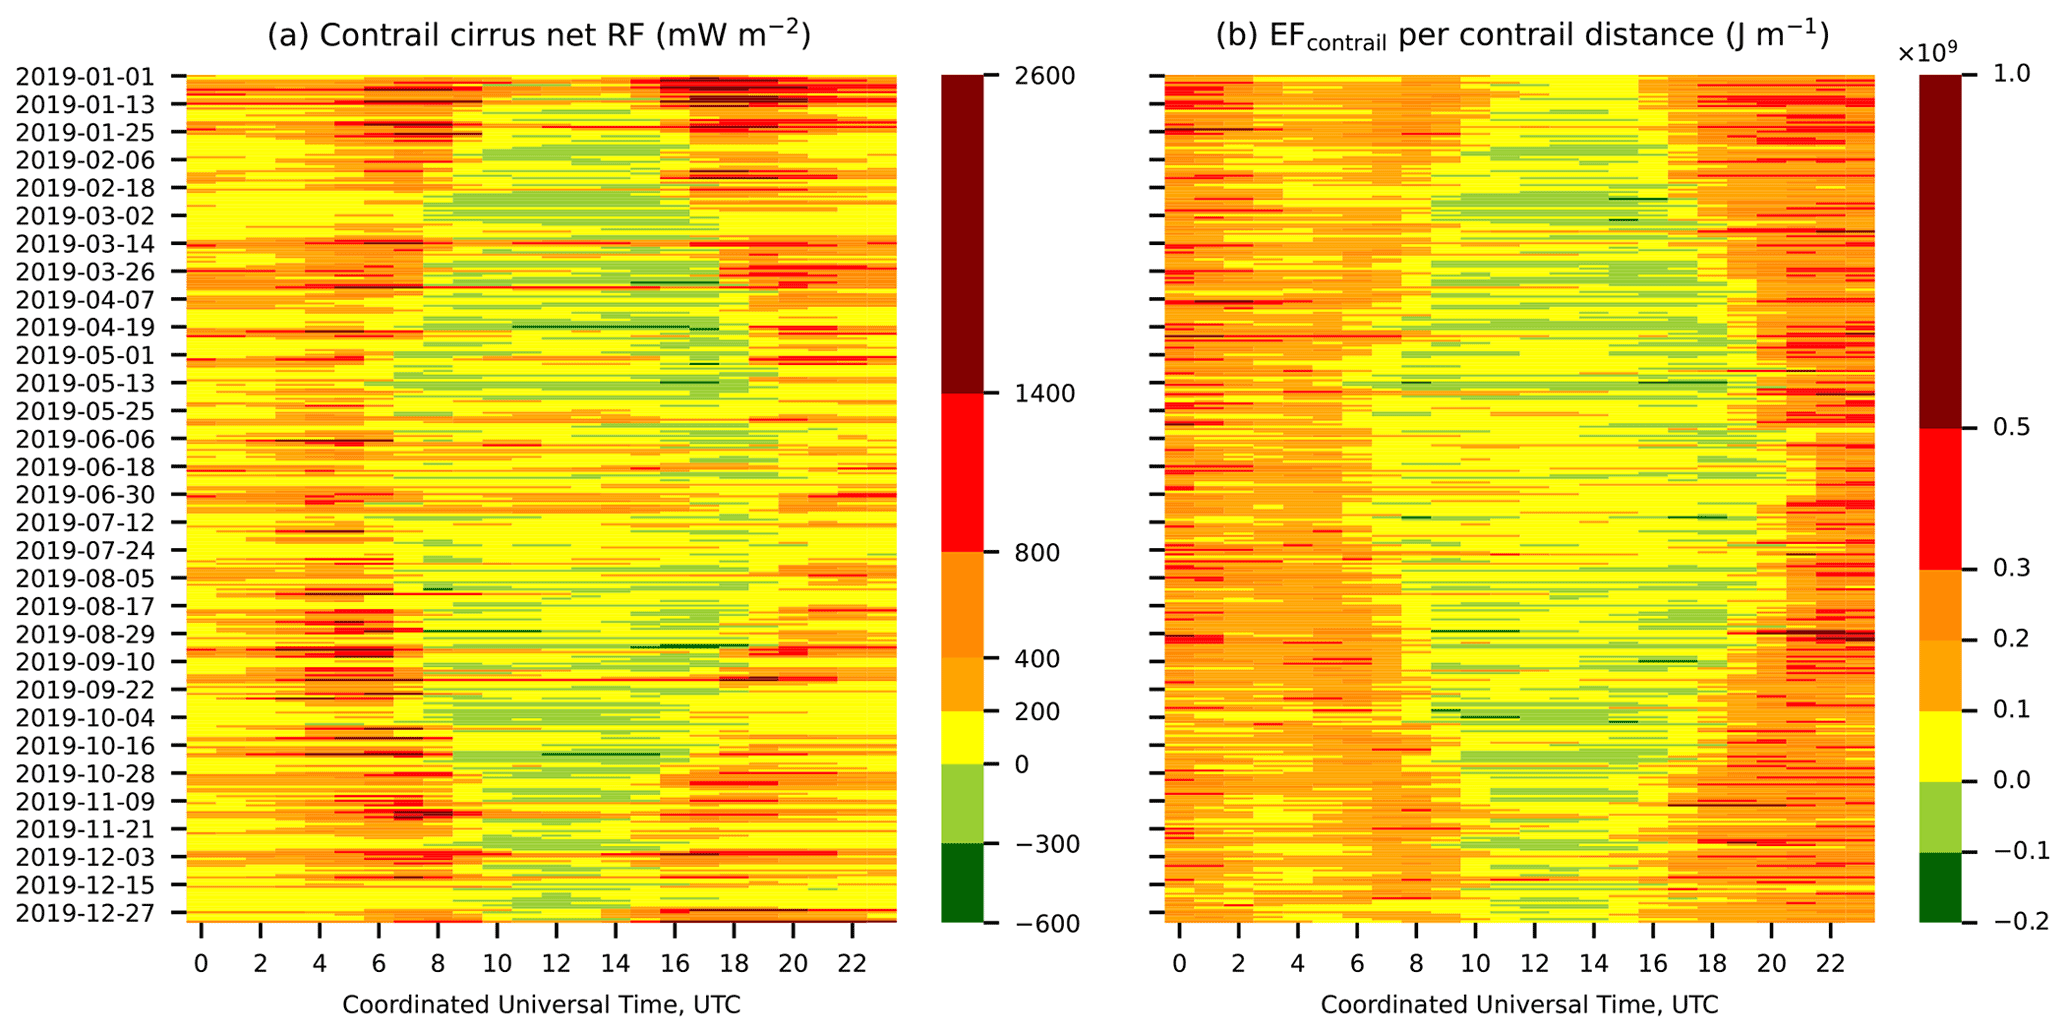
Figure 3The regional (a) contrail cirrus net RF and (b) EFcontrail per contrail distance in the North Atlantic flight corridor for each hour of 2019. The hourly mean SDR that is used to identify the sunrise and sunset times in this region is shown in Fig. S16 (Sect. S4).
The daytime contrail cirrus net RF also exhibits a large variability (Fig. 3a) and can be strongly warming (1086 mW m−2 at 14:00 UTC on 18 September 2019) or cooling (−594 mW m−2 at 10:00 UTC on 28 August 2019). Taking these two 1 h periods as a demonstrative example, they are similar in that the mean RHi and OLR at the contrail waypoints agree within 1.7 % and 6.7 % respectively (Fig. S18a, b). The SDR at 10:00 UTC on 28 August 2019 (net cooling) was 31 % smaller than at 14:00 UTC on 18 September 2019 (net warming) (Fig. S18c), which would work in favour of greater (negative) SW RF for the warming period. However, there was a lower percentage of cloud–contrail overlap on 28 August 2019 (68 % for August vs. 76 % for September; Fig. S17) and, thus, lower mean albedo along contrail waypoints (0.27 for August vs. 0.48 for September; Fig. S18d). Both of these differences were likely caused by a lower occurrence of low-level optically thick water clouds, which ultimately led to the different contrail net RF in the respective periods. A larger cloud–contrail overlap and albedo reduces the SW RF attributable to contrail cirrus (Schumann et al., 2012; Meerkötter et al., 1999; Sanz-Morère et al., 2021) and means that the LW RF dominated at 14:00 UTC on 18 September 2019.
The full dataset contains 1.27 million contrail-forming flights, and contrails formed by 79.7 % of these flights are warming (EFcontrail>0 J). Figure 4 compares the distribution of aircraft, traffic, meteorology and radiation variables for all contrail-forming flights as well as separately for flights with strongly warming contrails (EFcontrail>99th percentile for each year) and strongly cooling contrails (EFcontrail<1st percentile). Here, we show that the differences in EFcontrail can be grouped into four categories: (i) seasonal changes in meteorology and radiation, (ii) time of day, (iii) background cloud fields, and (iv) the nvPM number emissions from different aircraft types.
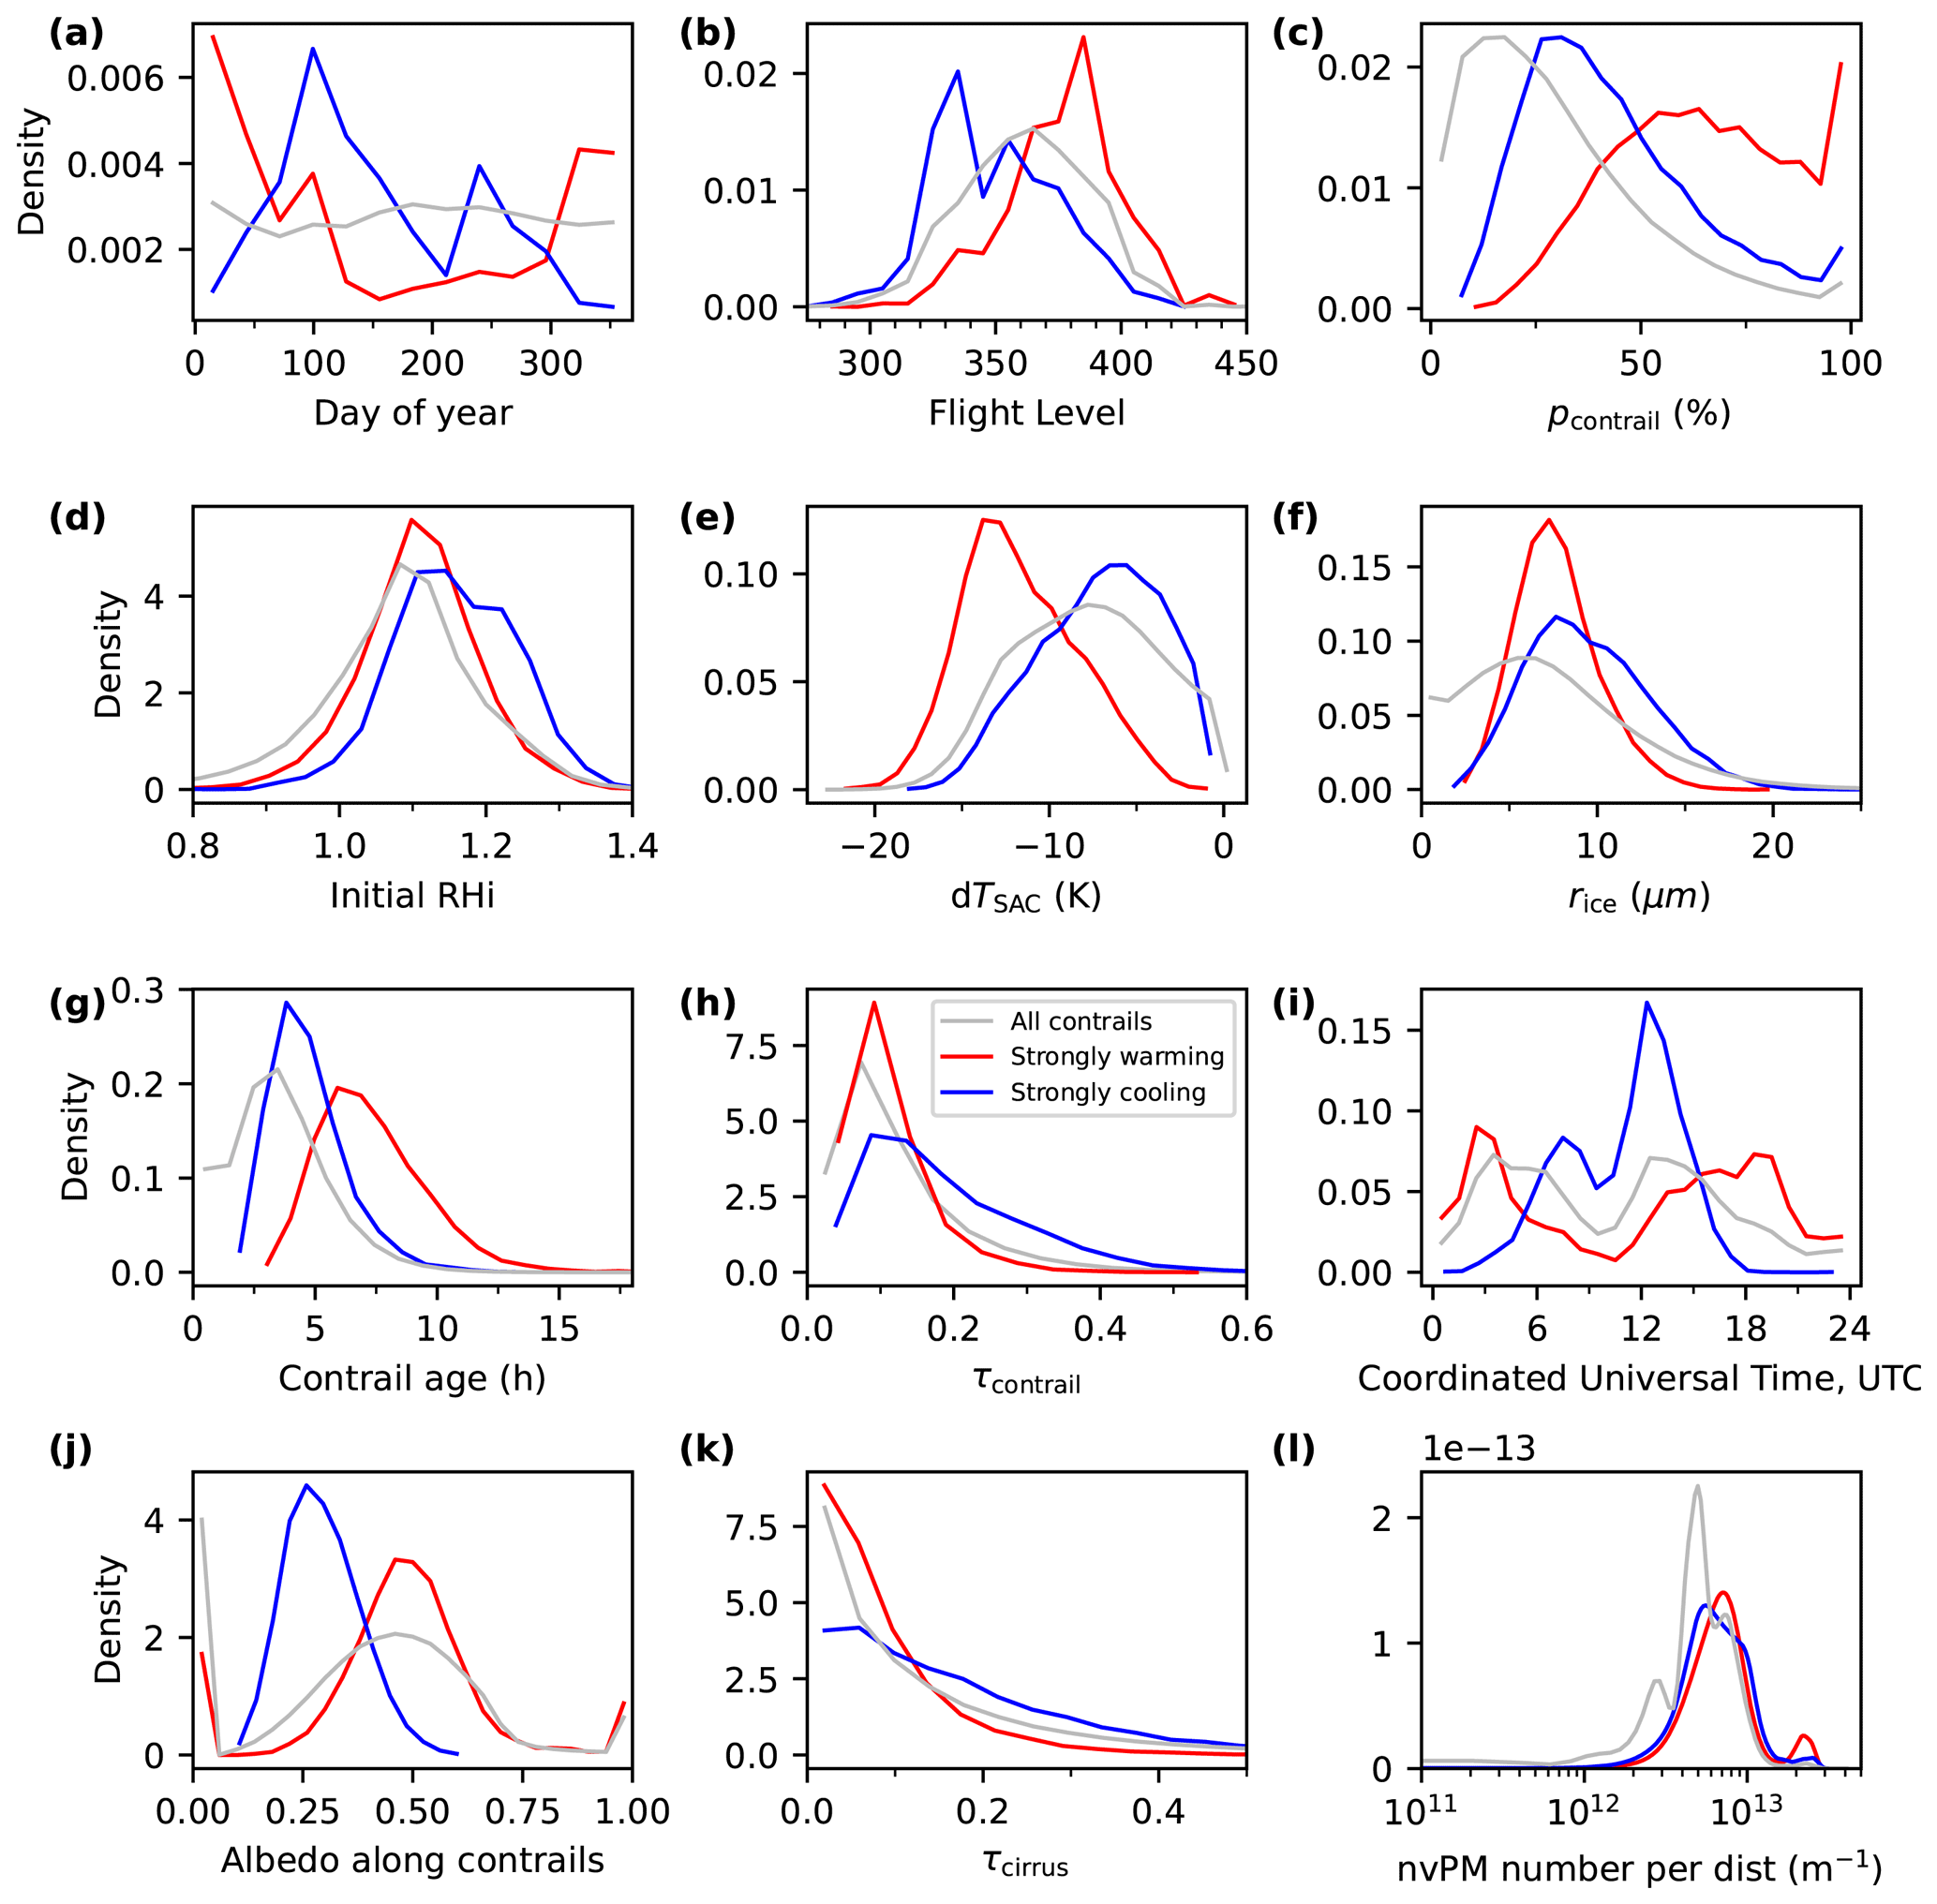
Figure 4Probability density functions of the aircraft, meteorology and contrail properties for all contrail-forming flights (grey lines), flights with strongly warming contrails (red lines, EFcontrail>99th percentile) and flights with strongly cooling contrails (blue lines, EFcontrail<1st percentile). The “time of day” variable in panel (i) represents the time when the flight is at its midpoint between the first and final recorded waypoints.
3.3.1 Seasonal changes in meteorology and radiation
Figure 4a–c show that strongly warming contrails are generally formed in wintertime and close to the tropopause (above FL350/35 000 ft/10.7 km) with a mean pcontrail of 65 %, whereas cooling contrails are primarily formed in spring and in the upper troposphere (below FL350/35 000 ft) with a mean pcontrail (43 %) that is larger than all contrail-forming flights (30 %). These differences can be attributed to seasonal changes in the ISSR coverage area and tropopause height (Fig. S13a). Conditions close to the tropopause tend to be drier than the upper troposphere, leading to strongly warming contrails having (i) a smaller amount of condensable water (initial RHi =111 %, and d K, as shown in Fig. 4d and e) relative to cooling contrails (RHi =116 %, and d K) and (ii) a smaller mean rice (7.7 vs. 9.5 µm for cooling contrails; Fig. 4f). For all contrail-forming flights, rice is correlated with the initial RHi (R=0.66), dTSAC (R=0.55) and τcontrail (R=0.59), and it is negatively correlated with the contrail age () (Fig. S19) because rice influences the ice crystal sedimentation rate. Therefore, the smaller rice for strongly warming contrails contributes to a larger mean contrail lifetime (7.3 vs. 4.7 h for cooling contrails; Fig. 4g) and a smaller mean τcontrail (0.11 vs. 0.19 for cooling contrails; Fig. 4h) relative to strongly cooling contrails. A smaller τcontrail reduces the contrail SW RF' more strongly than the LW RF' under clear-sky conditions and for the same surface albedo (Schumann et al., 2012).
Seasonal changes in SDR lead to a high proportion of strongly warming contrails forming in wintertime (Fig. 4a) when SDR is at a minimum (Figs. S14i, S16). In contrast, strongly cooling contrails predominantly occur in the spring rather than in the summer, despite both seasons having a comparable mean SDR (∼394 W m−2; Fig. S14i). This can be attributed to a lower mean OLR in spring (221 vs. 237 W m−2 in the summer; Fig. S14j), which reduces the mean contrail LW RF' by 23 % (4.9 vs. 6.3 W m−2 in the summer), and a larger mean contrail lifetime (3.0 vs. 2.7 h in the summer; Fig. 1c) that can increase the absolute magnitude of EFcontrail.
3.3.2 Time of day
The time of day is a key determinant of EFcontrail (Fig. 4i). Flights with strongly warming contrails tend to occur between 15:00 and 04:00 UTC, and the mean contrail lifetime of 7.3 h (Fig. 4g) suggests that these contrails spread and persist through the night. In contrast, strongly cooling contrails are predominantly formed by flights that traverse the airspace between 06:00 and 15:00 UTC with a shorter contrail lifetime (4.7 h), thereby maximising the SW RF' and sublimating before nightfall.
3.3.3 Background cloud field
Contrails forming above low-level cloud (indicated by a high mean albedo of 0.47; Fig. 4j) are more likely to be strongly warming because the incoming SDR would have been reflected by the low-level cloud regardless of the presence of contrails, thereby reducing the contrail SW RF'. In contrast, strongly cooling contrails are more common over regions with little low-level cloud, where a strong albedo contrast with the dark ocean surface (mean underlying albedo of 0.29; Fig. 4j) leads to a maximum SW RF'. Strongly cooling contrails are also more likely when formed below high-level cirrus with a higher mean overlying natural cirrus optical depth (τcirrus) of 0.17, which is around 2 times larger than for strongly warming contrails (0.081) (Fig. 4k). This is because, for high-level cirrus, albedo (driving SW RF) depends less strongly on optical depth compared with the dependence of emissivity (driving LW RF) on the optical depth (Wallace and Hobbs, 2006). Therefore, a higher τcirrus increases the emissivity of the overlying high-level cirrus and reduces the LW RF' that can be attributed to the underlying contrail, while the smaller rate of increase in cirrus albedo (relative to its emissivity) allows some incoming solar radiation to reach the underlying contrail, such that the contrail SW RF' is reduced by a smaller degree relative to the reduction in its LW RF'.

Figure 5The (a) contrail ice crystal radius (rice), (b) age, (c) optical depth (τcontrail) and (d) EFcontrail per flight distance vs. nvPM number emissions per distance travelled. Each data point represents the annual mean values for different aircraft types, and the error bars represent 1 standard deviation.
3.3.4 Influence of nvPM emissions
Strongly warming contrails tend to be associated with a mean nvPM number emissions value per unit distance travelled (1.1×10¹³ m−1) that is 14 % and 34 % larger relative to strongly cooling contrails (8.9×10¹² m−1) and all contrail-forming flights (6.8×10¹² m−1) respectively (Fig. 4l). Comparing the effects of different aircraft types shows that 43.4 % (17.4 %) of flights with strongly warming (cooling) contrails are powered by one engine combustor type, the phase 5 rich–quench–lean combustor, which has one of the highest nvPM EIn in the ICAO EDB (ranging from 0.7 to 1.4×10¹⁵ kg−1) (EASA, 2021). In particular, while one specific very large wide-body aircraft is only used in 2.4 % of all flights, it accounted for 18.0 % (6.4 %) of flights with strongly warming (cooling) contrails (Fig. S20, Table S5). This aircraft has the highest nvPM number emissions per distance ( m−1), which is the product of the nvPM EIn and fuel consumption, relative to other aircraft types (mean of 3.9×10¹² m−1). This leads to smaller rice, as the fixed ambient vapour is distributed to more particles; longer contrail lifetimes, due to the lower sedimentation rate of particles with smaller rice; and larger τcontrail, due to the Twomey effect (Fig. 5). Indeed, in situ contrail measurements have shown that the τcontrail from different aircraft types with different nvPM emissions can vary by up to a factor of 4 (Jeßberger et al., 2013). These processes increase the magnitude and variability of EFcontrail for aircraft with higher nvPM emissions (Fig. 5d), and the sign depends on a trade-off between τcontrail and lifetime: a higher τcontrail increases the SW RF' more strongly than the LW RF' and can produce a larger cooling effect during the day (Schumann et al., 2012), but a longer lifetime can also cause the contrail to be strongly warming as it spreads and persists into the night. In contrast, contrails formed from aircraft types with smaller nvPM emissions are neither strongly cooling nor strongly warming (Fig. 5d). A separate comparison by EFcontrail per passenger kilometre shows that one specific medium wide-body aircraft has the highest value (6.7×10⁵ J m−1) and that the very large wide-body aircraft mentioned above (4.5×10⁵ J m−1) is close to the median value for the 18 aircraft types considered in Table S5.
3.4 Meteorological uncertainties
The ERA5 ensemble spread represents the observation uncertainties (provided to the data assimilation system) and model state uncertainties in the reanalysis (Hersbach et al., 2020). We propagate these uncertainties to estimates of the annual emissions and contrail properties for 2019. Figure 6 shows that uncertainties derived from the ensembles are small for the total fuel consumption, CO2, NOx and nvPM number emissions (within ±0.01 % relative to the ensemble mean), whereas the fleet-aggregated contrail properties have larger uncertainty bounds of up to ±8 %. Uncertainty in the 2019 contrail cirrus net RF (216–238 mW m−2; Table S6) is smaller than the inter-annual variability between 2016 and 2019 (204–280 mW m−2; Table 1).
The lower spatio-temporal resolution of the ensembles relative to the HRES leads to differences in the simulated contrail properties. Figure 6 shows that the ensemble mean τcontrail is 2.6 % larger than the nominal HRES simulation, which influenced the SW RF (+31 %) more strongly than the LW RF (+12 %) (Schumann et al., 2012). Although the range of net RF from the ensembles (216–238 mW m−2) encompasses the nominal HRES value (235 mW m−2), the net RF from 9 of 10 ensemble member is below the HRES value.
To evaluate the consistency in contrail prediction for specific flights, we compared the set of flights with EFcontrail>95th percentile in the nominal HRES simulation with each ensemble simulation (5 % of all contrail-forming flights) and found that 36.9 % of these flights have an EFcontrail>95th percentile in all 10 ensemble members. The characteristics of flights with strongly warming/cooling contrails in each ensemble member (Fig. S21) are generally consistent with the HRES (Fig. 4). However, unlike the HRES, the ensembles do not predict the occurrence of strongly warming or cooling contrails before dawn or dusk respectively (Fig. 4i vs. Fig. S21i). This is likely due to the lower spatio-temporal resolution of the ensembles relative to the HRES, making the former less capable of capturing sub-grid areas where RHi <1, thereby causing an overprediction of the mean contrail age (+7.7 % relative to the HRES; Fig. 6d) and a change in the sign of EFcontrail as contrails persist through dawn/dusk. This also caused the percentage of flights accounting for 80 % of the annual EFcontrail in the ensembles (∼8.6 %; Table S6) to be lower than the HRES (12.0 %; Table 1).
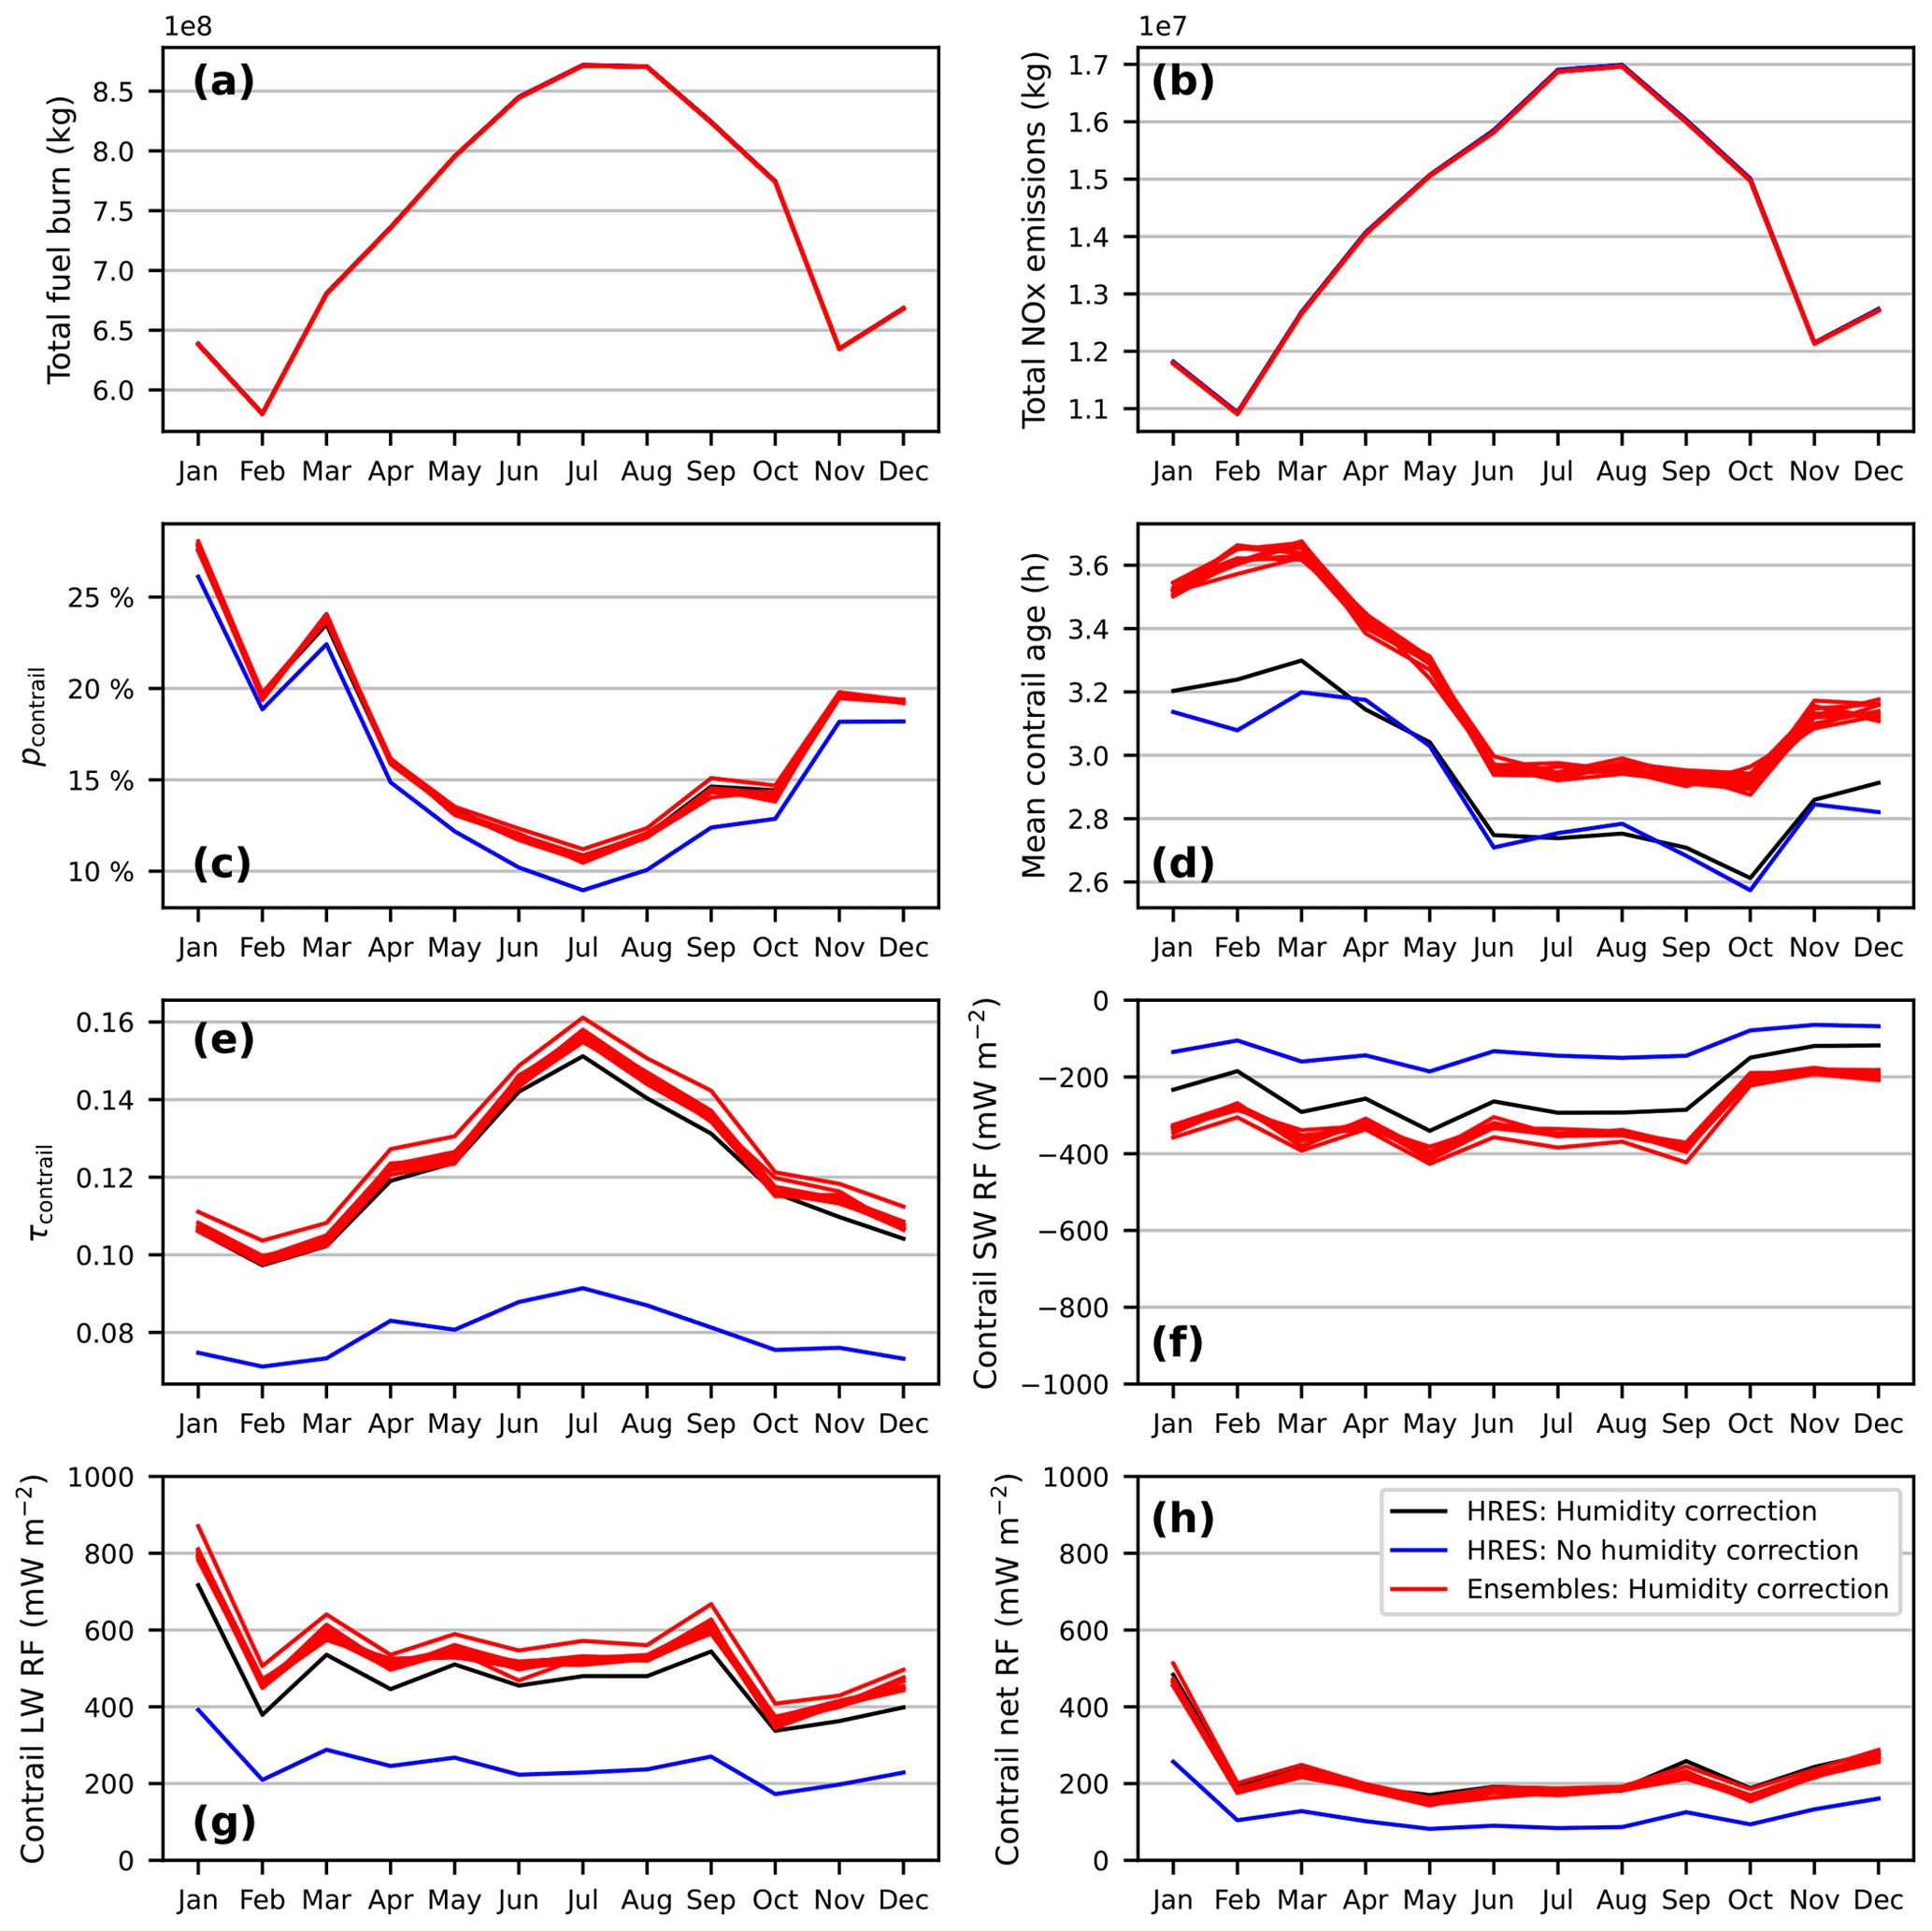
Figure 6Uncertainty and sensitivity analysis comparing the emissions and contrail statistics in the North Atlantic region for 2019. Contrails are simulated using meteorological data from the ERA5 HRES with humidity correction (as outlined in Sect. 2.2; black lines), data from the ERA5 HRES without humidity correction (blue lines) and data from the ERA5 10-member ensemble with humidity correction, where individual red lines represent the results for each ensemble member.
3.5 Sensitivity analysis
To evaluate the sensitivity of contrail results to the ERA5 humidity correction, we simulated contrails for 2019 without any correction (Figs. 6, S22). With no corrections applied, pcontrail decreased from 16.2 % in the nominal simulation to 14.7 %, and there was a 34 % and 8.9 % reduction in τcontrail (0.08 without vs. 0.12 with correction) and the mean contrail age (3.2 h without vs. 3.5 h with correction) respectively. On the other hand, corrections applied to the humidity fields increase saturation above 120 % (Fig. S11), and contrails formed in these regions could have a shorter lifetime than in the simulation without humidity correction (Fig. S25a) as the ice particles would grow to larger rice and, thus, experience a higher sedimentation rate. When taken together, these effects caused the annual mean contrail cirrus net RF (121 mW m−2) to be 49 % smaller than in our nominal simulation (235 mW m−2). Both results are within the range of earlier studies that estimated the North Atlantic contrail cirrus net RF to be between 100 and 360 mW m−2 (Burkhardt and Kärcher, 2011; Chen and Gettelman, 2013; Bock and Burkhardt, 2019; Schumann and Graf, 2013) and confirm that the contrail climate forcing is highly sensitive to the humidity fields.
The assumption of a constant nvPM EIn (1015 kg−1) for all waypoints leads to higher fleet-aggregated contrail properties and climate forcing than in the nominal case. pcontrail remains unchanged because the SAC does not depend on the nvPM EIn (Schumann, 1996); however, the higher initial contrail ice particle number (+25 % relative to the nominal simulation) led to a 3.4 %, 7.4 % and 14 % increase in the mean contrail lifetime, τcontrail and annual mean net RF (267 mW m−2) respectively. When the comparison is made for individual flights, however, a constant nvPM EIn leads to more significant differences in the initial ice crystal number (up to m−1), rice (±14 µm), τcontrail (±0.78), lifetime (±10 h) and net RF' (±30 W m−2) (Fig. S23) compared with the nominal case. These results suggest that the new ICAO EDB nvPM database, which captures the emissions profile for specific aircraft–engine types, is critical in identifying flights with the largest EFcontrail. A separate simulation assessing the aircraft mass assumptions (high/low mass at the initial waypoint), which influence the nvPM EIn and wake vortex dynamics, leads to a ±7 % sensitivity in the annual mean contrail cirrus net RF relative to the nominal simulation.
The simulated contrail outputs are less sensitive to pactivation (see Eq. 2), and an assumption of pactivation=1 changes the annual mean contrail cirrus net RF by +0.81 % (237 mW m−2) relative to the nominal simulation because only 24.8 % of all flights form contrails near the SAC threshold temperature (). For these flights, the sensitivity to pactivation was also relatively small for other contrail properties, including initial ice crystal number (+14 % on average), rice (−3.7 %), contrail age (+2.8 %), τcontrail (+5.0 %) and net RF' (+0.55 %) (Fig. S24).

Figure 7Comparison of the annual contrail cirrus net RF in the North Atlantic provided by (i) the nominal simulations using the ERA5 HRES (2016–2020), (ii) the ERA5 10-member ensemble and (iii) the sensitivity analyses for 2019.
We quantified aviation emissions and contrail climate forcing in the North Atlantic from January 2016 to March 2021. From 2016 to 2019, the total CO2 and NOx emissions grew by 3.1 % and 4.5 % yr−1 respectively, followed by a significant decline of 71 % and 74 % respectively in 2020 due to the COVID-19 pandemic. Figure 7 shows that the inter-annual variability in the annual mean contrail cirrus net RF (204–280 mW m−2, between 2016 and 2019) is larger than the ensemble uncertainties for 2019 (216–238 mW m−2). The 2016–2019 nominal contrail cirrus net RF (204–280 mW m−2) from our study is larger than the range of global values reported in previous studies (33–189 mW m−2) because of the higher relative air traffic density in the North Atlantic, but it is within the range of earlier estimates for the North Atlantic (70–360 mW m−2) (Chen and Gettelman, 2013; Schumann et al., 2015; Schumann and Graf, 2013; Burkhardt and Kärcher, 2011; Bock and Burkhardt, 2019). Our estimate is smaller than the 2006 North Atlantic estimates from Schumann and Graf (2013) (240–360 mW m−2) because our study uses a larger spatial domain (Fig. S5b). However, our contrail net RF estimates increase to 281–386 mW m−2 if we apply the same domain as Schumann and Graf (2013), showing consistency between the two studies. Figure 7 also shows that the contrail cirrus net RF is most sensitive to the ERA5 humidity correction, followed by the nvPM EIn and aircraft mass assumptions, and is least sensitive to pactivation. Without correction of the humidity fields, the estimated contrail cirrus net RF is halved relative to the simulation where correction to humidity is applied. However, our analysis of in situ humidity measurements and the known limitations of the ERA5 products (Sects. 2.2, S3) gives confidence in the fact that the uncertainty in contrail cirrus net RF is more accurately characterised by the simulations only when humidity correction is applied.
The set of factors associated with strongly warming/cooling contrails can be explained by diurnal and seasonal patterns in meteorology and radiation, background cloud fields, and the nvPM emissions profile from different aircraft types, and these have implications for contrail mitigation. On average, 12 % of all flights in this region cause 80 % of the annual EFcontrail (Table 1), and this subset of flights (with large EFcontrail forecasts) could be supported by changes to the airline flight plan and tactical trajectory adjustments based on up-to-date meteorological forecasts (Molloy et al., 2022). More generally, the OTS in Shanwick and Gander (which is currently designed for the safe and efficient flow of traffic based on meteorological conditions), indicative airline flight plans and other operational factors could also be optimised pre-tactically to minimise both fuel consumption and EFcontrail whenever possible (Molloy et al., 2022). For example, the OTS could minimise flight distances in regions with large dTSAC (Fig. 4e) as well as above low-level water clouds with high albedo (Fig. 4j). Diversions around regions with very high ice supersaturation (RHi >120 %) might not be necessary because of a higher probability of forming contrails with shorter lifetimes (Fig. S25a). In addition to trajectory modifications, an unsophisticated approach might minimise the number of flights at selected times of the day (i.e. dusk) or season (i.e. winter) when the risk of forming strongly warming contrails is greatest (Fig. 4a, i).
Future research should be directed towards the following: (i) quantifying the overall uncertainty in the simulated contrail climate forcing by propagating all of the uncertainties/sensitivities from different input parameters, including meteorology, nvPM emissions and aircraft mass assumptions; (ii) improvements in data assimilation and humidity representation in numerical weather prediction models; (iii) the development of a decision-making framework that accounts for the overall climate forcing and meteorological uncertainties (Sect. 3.4 and 3.5), where flights are only diverted when their net climate benefits can be determined with a high degree of confidence; and (iv) quantification of the effectiveness of the different mitigation options proposed above.
Emissions and contrail model codes are available for scientific research purposes from the authors upon request.
Flight trajectory data are commercially sensitive and are available from NATS upon reasonable request (george.koudis@nats.co.uk). IAGOS data were created with support from the European Commission; national agencies in Germany (BMBF), France (MESR) and the UK (NERC); and the IAGOS member institutions (https://www.iagos.org/organisation/members/, last access: 3 January 2022). The participating airlines (Deutsche Lufthansa, Air France, Austrian Airlines, China Airlines, Iberia, Cathay Pacific, Air Namibia and Sabena) have supported IAGOS by carrying the measurement equipment free of charge since 1994; the data are available at https://doi.org/10.25326/20 (Boulanger et al., 2020) and https://doi.org/10.25326/06 (Boulanger et al., 2018). This document has been created with or contains elements of Base of Aircraft Data (BADA) Family 4 Release 4.2, which has been made available to Imperial College London by EUROCONTROL. EUROCONTROL has all relevant rights to BADA. © 2019 The European Organisation for the Safety of Air Navigation (EUROCONTROL). All rights reserved.
The supplement related to this article is available online at: https://doi.org/10.5194/acp-22-10919-2022-supplement.
RT, US and MEJS conceptualised the study, developed the methodology and undertook the investigation. RT, US and MS were responsible for software development and data curation. RT and MEJS created or sourced the figures. JM and GK provided the air traffic dataset. RT wrote the original manuscript. RT, US, EG, MS, JM, GK, CV and MEJS reviewed and edited the manuscript. MEJS acquired funding. All authors have read and agreed upon the published version of the paper.
The contact author has declared that none of the authors has any competing interests.
EUROCONTROL shall not be liable for any direct, indirect, incidental, or consequential damages arising out of or in connection with this document, including with respect to the use of BADA. This document contains modified Copernicus Climate Change Service information 2022. Neither the European Commission nor ECMWF is responsible for any use that may be made of the Copernicus information or data it contains.
Publisher’s note: Copernicus Publications remains neutral with regard to jurisdictional claims in published maps and institutional affiliations.
The authors thank Susanne Rohs and the IAGOS team for providing early access to the latest IAGOS dataset, which contains more flights and valid water vapour measurements. We thank Ian Poll for reviewing an earlier version of the paper.
Edward Gryspeerdt was supported by a Royal Society University Research Fellowship (grant no. URF/R1/191602).
This paper was edited by Andreas Petzold and reviewed by Xavier Vancassel and one anonymous referee.
Abrahamson, J. P., Zelina, J., Andac, M. G., and Vander Wal, R. L.: Predictive Model Development for Aviation Black Carbon Mass Emissions from Alternative and Conventional Fuels at Ground and Cruise, Environ. Sci. Technol., 50, 12048–12055, https://doi.org/10.1021/acs.est.6b03749, 2016.
Agarwal, A., Meijer, V. R., Eastham, S. D., Speth, R. L., and Barrett, S. R. H.: Reanalysis-driven simulations may overestimate persistent contrail formation by 100–250 %, Environ. Res. Lett., 17, 014045, https://doi.org/10.1088/1748-9326/AC38D9, 2022.
Bickel, M., Ponater, M., Bock, L., Burkhardt, U., and Reineke, S.: Estimating the Effective Radiative Forcing of Contrail Cirrus, J. Climate, 33, 1991–2005, https://doi.org/10.1175/JCLI-D-19-0467.1, 2019.
Bock, L. and Burkhardt, U.: Contrail cirrus radiative forcing for future air traffic, Atmos. Chem. Phys., 19, 8163–8174, https://doi.org/10.5194/acp-19-8163-2019, 2019.
Boies, A. M., Stettler, M. E. J., Swanson, J. J., Johnson, T. J., Olfert, J. S., Johnson, M., Eggersdorfer, M. L., Rindlisbacher, T., Wang, J., and Thomson, K.: Particle emission characteristics of a gas turbine with a double annular combustor, Aerosol Sci. Technol., 49, 842–855, https://doi.org/10.1080/02786826.2015.1078452, 2015.
Boulanger, D., Blot, R., Bundke, U., Gerbig, C., Hermann, M., Nédélec, P., Rohs, S., and Ziereis, H.: IAGOS final quality controlled Observational Data L2 – Time series, Aeris [data set], https://doi.org/10.25326/06, 2018.
Boulanger, D., Thouret, V., and Petzold, A.: IAGOS Data Protal, AERIS [data set], https://doi.org/10.25326/20, 2020.
Bräuer, T., Voigt, C., Sauer, D., Kaufmann, S., Hahn, V., Scheibe, M., Schlager, H., Diskin, G. S., Nowak, J. B., DiGangi, J. P., Huber, F., Moore, R. H., and Anderson, B. E.: Airborne Measurements of Contrail Ice Properties–Dependence on Temperature and Humidity, Geophys. Res. Lett., 48, e2020GL092166, https://doi.org/10.1029/2020GL092166, 2021a.
Bräuer, T., Voigt, C., Sauer, D., Kaufmann, S., Hahn, V., Scheibe, M., Schlager, H., Huber, F., Le Clercq, P., Moore, R. H., and Anderson, B. E.: Reduced ice number concentrations in contrails from low-aromatic biofuel blends, Atmos. Chem. Phys., 21, 16817–16826, https://doi.org/10.5194/acp-21-16817-2021, 2021b.
Burkhardt, U. and Kärcher, B.: Global radiative forcing from contrail cirrus, Nat. Clim. Change, 1, 54–58, https://doi.org/10.1038/nclimate1068, 2011.
Burkhardt, U., Bock, L., and Bier, A.: Mitigating the contrail cirrus climate impact by reducing aircraft soot number emissions, npj Clim. Atmos. Sci., 1, 1–7, https://doi.org/10.1038/s41612-018-0046-4, 2018.
Caiazzo, F., Agarwal, A., Speth, R. L., and Barrett, S. R. H.: Impact of biofuels on contrail warming, Environ. Res. Lett., 12, 114013, https://doi.org/10.1088/1748-9326/aa893b, 2017.
Chen, C.-C. and Gettelman, A.: Simulated radiative forcing from contrails and contrail cirrus, Atmos. Chem. Phys., 13, 12525–12536, https://doi.org/10.5194/acp-13-12525-2013, 2013.
DuBois, D. and Paynter, G.: ”Fuel Flow Method2” for Estimating Aircraft Emissions, J. Aerosp., 115, 1–14, 2006.
Durdina, L., Brem, B. T., Setyan, A., Siegerist, F., Rindlisbacher, T., and Wang, J.: Assessment of Particle Pollution from Jetliners: from Smoke Visibility to Nanoparticle Counting, Environ. Sci. Technol., 51, 3534–3541, https://doi.org/10.1021/acs.est.6b05801, 2017.
EASA: Aircraft Engine Emissions Databank (07/2021) [data set], https://www.easa.europa.eu/domains/environment/icao-aircraft-engine-emissions-databank, last access: 17 August 2021.
ECMWF: The Copernicus Programme: Climate Data Store [data set], https://cds.climate.copernicus.eu/#!/home (last access: 15 February 2022), 2021.
EUROCONTROL: User Manual for the Base of Aircraft Data (BADA) Revision 3.15. EEC Technical/Scientific Report No. 19/03/18-45. EUROCONTROL Experimental Centre (EEC), https://www.eurocontrol.int/model/bada (last access: 17 August 2021), 2019.
EUROCONTROL: User Manual for the Base of Aircraft Data (BADA) Family 4. EEC Technical/Scientific Report No. 12/11/22-58. EUROCONTROL Experimental Centre (EEC), https://www.eurocontrol.int/model/bada (last access: 17 August 2021), 2016.
Freeman, S., Lee, D. S., Lim, L. L., Skowron, A., and León, R. R. De: Trading off Aircraft Fuel Burn and NOx Emissions for Optimal Climate Policy, Environ. Sci. Technol., 52, 2498–2505, https://doi.org/10.1021/ACS.EST.7B05719, 2018.
Gettelman, A., Chen, C.-C., and Bardeen, C. G.: The climate impact of COVID-19-induced contrail changes, Atmos. Chem. Phys., 21, 9405–9416, https://doi.org/10.5194/acp-21-9405-2021, 2021.
Gierens, K., Schumann, U., Helten, M., Smit, H., and Marenco, A.: A distribution law for relative humidity in the upper troposphere and lower stratosphere derived from three years of MOZAIC measurements, Annales Geophysicae, 17, 1218–1226, https://doi.org/10.1007/s00585-999-1218-7, 1999.
Gierens, K., Matthes, S., and Rohs, S.: How Well Can Persistent Contrails Be Predicted?, Aerosp., 7, 169, https://doi.org/10.3390/AEROSPACE7120169, 2020.
Hersbach, H., Bell, B., Berrisford, P., Hirahara, S., Horányi, A., Muñoz-Sabater, J., Nicolas, J., Peubey, C., Radu, R., Schepers, D., Simmons, A., Soci, C., Abdalla, S., Abellan, X., Balsamo, G., Bechtold, P., Biavati, G., Bidlot, J., Bonavita, M., De Chiara, G., Dahlgren, P., Dee, D., Diamantakis, M., Dragani, R., Flemming, J., Forbes, R., Fuentes, M., Geer, A., Haimberger, L., Healy, S., Hogan, R. J., Hólm, E., Janisková, M., Keeley, S., Laloyaux, P., Lopez, P., Lupu, C., Radnoti, G., de Rosnay, P., Rozum, I., Vamborg, F., Villaume, S., and Thépaut, J. N.: The ERA5 global reanalysis, Q. J. Roy. Meteor. Soc., 146, 1999–2049, https://doi.org/10.1002/qj.3803, 2020.
Hoinka, K. P., Reinhardt, M. E., and Metz, W.: North Atlantic air traffic within the lower stratosphere: Cruising times and corresponding emissions, J. Geophys. Res.-Atmos., 98, 23113–23131, https://doi.org/10.1029/93JD02262, 1993.
ICAO: Effects of Novel Coronavirus (COVID-19) on Civil Aviation: Economic Impact Analysis, Montreal, Canada, https://www.icao.int/sustainability/Documents/COVID-19/ICAO COVID 2021 04 08 Economic Impact TH Toru.pdf (last access: 17 August 2021), 2021.
Jeßberger, P., Voigt, C., Schumann, U., Sölch, I., Schlager, H., Kaufmann, S., Petzold, A., Schäuble, D., and Gayet, J.-F.: Aircraft type influence on contrail properties, Atmos. Chem. Phys., 13, 11965–11984, https://doi.org/10.5194/acp-13-11965-2013, 2013.
Kärcher, B.: Formation and radiative forcing of contrail cirrus, Nat. Commun., 9, 1824, https://doi.org/10.1038/s41467-018-04068-0, 2018.
Kärcher, B. and Yu, F.: Role of aircraft soot emissions in contrail formation, Geophys. Res. Lett., 36, L01804, https://doi.org/10.1029/2008GL036649, 2009.
Kleine, J., Voigt, C., Sauer, D., Schlager, H., Scheibe, M., Jurkat-Witschas, T., Kaufmann, S., Kärcher, B., and Anderson, B. E.: In Situ Observations of Ice Particle Losses in a Young Persistent Contrail, Geophys. Res. Lett., 45, 13553–13561, https://doi.org/10.1029/2018GL079390, 2018.
Kyprianidis, K. G. and Dahlquist, E.: On the trade-off between aviation NOx and energy efficiency, Appl. Energ., 185, 1506–1516, https://doi.org/10.1016/J.APENERGY.2015.12.055, 2017.
Lee, D. S., Fahey, D. W., Skowron, A., Allen, M. R., Burkhardt, U., Chen, Q., Doherty, S. J., Freeman, S., Forster, P. M., Fuglestvedt, J., Gettelman, A., De León, R. R., Lim, L. L., Lund, M. T., Millar, R. J., Owen, B., Penner, J. E., Pitari, G., Prather, M. J., Sausen, R., and Wilcox, L. J.: The contribution of global aviation to anthropogenic climate forcing for 2000 to 2018, Atmos. Environ., 244, 117834, https://doi.org/10.1016/J.ATMOSENV.2020.117834, 2021.
Lewellen, D. C.: Persistent contrails and contrail cirrus. Part II: Full lifetime behavior, J. Atmos. Sci., 71, 4420–4438, https://doi.org/10.1175/JAS-D-13-0317.1, 2014.
Lobo, P., Durdina, L., Smallwood, G. J., Rindlisbacher, T., Siegerist, F., Black, E. A., Yu, Z., Mensah, A. A., Hagen, D. E., and Miake-Lye, R. C.: Measurement of aircraft engine non-volatile PM emissions: Results of the aviation-particle regulatory instrumentation demonstration experiment (A-PRIDE) 4 campaign, Aerosol Sci. Technol., 49, 472–484, https://doi.org/10.1080/02786826.2015.1047012, 2015.
Mannstein, H., Brömser, A., and Bugliaro, L.: Ground-based observations for the validation of contrails and cirrus detection in satellite imagery, Atmos. Meas. Tech., 3, 655–669, https://doi.org/10.5194/amt-3-655-2010, 2010.
Meerkötter, R., Schumann, U., Doelling, D. R., Minnis, P., Nakajima, T., and Tsushima, Y.: Radiative forcing by contrails, Ann. Geophys., 17, 1080–1094, https://doi.org/10.1007/s00585-999-1080-7, 1999.
Molloy, J., Teoh, R., Harty, S., Koudis, G., Schumann, U., Poll, I., and Stettler, M. E. J.: Design Principles for a Contrail-Minimizing Trial in the North Atlantic, Aerospace, 9, 375, https://doi.org/10.3390/AEROSPACE9070375, 2022.
Moore, R. H., Thornhill, K. L., Weinzierl, B., Sauer, D., D'Ascoli, E., Kim, J., Lichtenstern, M., Scheibe, M., Beaton, B., and Beyersdorf, A. J.: Biofuel blending reduces particle emissions from aircraft engines at cruise conditions, Nature, 543, 411–415, https://doi.org/10.1038/nature21420, 2017.
Myhre, G., Shindell, D., Bréon, F.-M., Collins, W., Fuglestvedt, J., Huang, J., Koch, D., Lamarque, J.-F., Lee, D., Mendoza, B., Nakajima, T., Robock, A., Stephens, G., Takemura, T., and Zhang, H.: Anthropogenic and Natural Radiative Forcing, in: Climate Change 2013: The Physical Science Basis. Contribution of Working Group I to the Fifth Assessment Report of the Intergovernmental Panel on Climate Change, Cambridge University Press, Cambridge, UK, 665 pp., 2013.
Nuic, A., Poles, D., and Mouillet, V.: BADA: An advanced aircraft performance model for present and future ATM systems, Int. J. Adapt. Control, 24, 850–866, https://doi.org/10.1002/acs.1176, 2010.
Parr, W. C. and Schucany, W. R.: Minimum distance and robust estimation, J. Am. Stat. Assoc., 75, 616–624, https://doi.org/10.1080/01621459.1980.10477522, 1980.
Petzold, A., Ogren, J. A., Fiebig, M., Laj, P., Li, S.-M., Baltensperger, U., Holzer-Popp, T., Kinne, S., Pappalardo, G., Sugimoto, N., Wehrli, C., Wiedensohler, A., and Zhang, X.-Y.: Recommendations for reporting ”black carbon” measurements, Atmos. Chem. Phys., 13, 8365–8379, https://doi.org/10.5194/acp-13-8365-2013, 2013.
Petzold, A., Neis, P., Rütimann, M., Rohs, S., Berkes, F., Smit, H. G. J., Krämer, M., Spelten, N., Spichtinger, P., Nédélec, P., and Wahner, A.: Ice-supersaturated air masses in the northern mid-latitudes from regular in situ observations by passenger aircraft: vertical distribution, seasonality and tropospheric fingerprint, Atmos. Chem. Phys., 20, 8157–8179, https://doi.org/10.5194/acp-20-8157-2020, 2020.
Ponater, M., Bickel, M., Bock, L., and Burkhardt, U.: Towards Determining the Contrail Cirrus Efficacy, Aerospace, 8, 42, https://doi.org/10.3390/AEROSPACE8020042, 2021.
Quaas, J., Gryspeerdt, E., Vautard, R., and Boucher, O.: Climate impact of aircraft-induced cirrus assessed from satellite observations before and during COVID-19, Environ. Res. Lett., 16, 064051, https://doi.org/10.1088/1748-9326/ABF686, 2021.
Rädel, G. and Shine, K. P.: Validating ECMWF forecasts for the occurrence of ice supersaturation using visual observations of persistent contrails and radiosonde measurements over England, Q. J. Roy. Meteor. Soc., 136, 1723–1732, https://doi.org/10.1002/qj.670, 2010.
Reutter, P., Neis, P., Rohs, S., and Sauvage, B.: Ice supersaturated regions: properties and validation of ERA-Interim reanalysis with IAGOS in situ water vapour measurements, Atmos. Chem. Phys., 20, 787–804, https://doi.org/10.5194/acp-20-787-2020, 2020.
Sanz-Morère, I., Eastham, S. D., Allroggen, F., Speth, R. L., and Barrett, S. R. H.: Impacts of multi-layer overlap on contrail radiative forcing, Atmos. Chem. Phys., 21, 1649–1681, https://doi.org/10.5194/acp-21-1649-2021, 2021.
Schumann, U.: On conditions for contrail formation from aircraft exhausts, Meteorol. Z., 5, 4–23, https://doi.org/10.1127/metz/5/1996/4, 1996.
Schumann, U.: A contrail cirrus prediction model, Geosci. Model Dev., 5, 543–580, https://doi.org/10.5194/gmd-5-543-2012, 2012.
Schumann, U. and Graf, K.: Aviation-induced cirrus and radiation changes at diurnal timescales, J. Geophys. Res.-Atmos., 118, 2404–2421, https://doi.org/10.1002/jgrd.50184, 2013.
Schumann, U. and Heymsfield, A. J.: On the lifecycle of individual contrails and contrail cirrus, Meteorol. Monogr., 58, 3.1–3.24, https://doi.org/10.1175/amsmonographs-d-16-0005.1, 2017.
Schumann, U. and Mayer, B.: Sensitivity of surface temperature to radiative forcing by contrail cirrus in a radiative-mixing model, Atmos. Chem. Phys., 17, 13833–13848, https://doi.org/10.5194/acp-17-13833-2017, 2017.
Schumann, U., Mayer, B., Graf, K., and Mannstein, H.: A parametric radiative forcing model for contrail cirrus, J. Appl. Meteorol. Clim., 51, 1391–1406, https://doi.org/10.1175/JAMC-D-11-0242.1, 2012.
Schumann, U., Jeßberger, P., and Voigt, C.: Contrail ice particles in aircraft wakes and their climatic importance, Geophys. Res. Lett., 40, 2867–2872, https://doi.org/10.1002/grl.50539, 2013.
Schumann, U., Penner, J. E., Chen, Y., Zhou, C., and Graf, K.: Dehydration effects from contrails in a coupled contrail–climate model, Atmos. Chem. Phys., 15, 11179–11199, https://doi.org/10.5194/acp-15-11179-2015, 2015.
Schumann, U., Baumann, R., Baumgardner, D., Bedka, S. T., Duda, D. P., Freudenthaler, V., Gayet, J.-F., Heymsfield, A. J., Minnis, P., Quante, M., Raschke, E., Schlager, H., Vázquez-Navarro, M., Voigt, C., and Wang, Z.: Properties of individual contrails: a compilation of observations and some comparisons, Atmos. Chem. Phys., 17, 403–438, https://doi.org/10.5194/acp-17-403-2017, 2017.
Schumann, U., Poll, I., Teoh, R., Koelle, R., Spinielli, E., Molloy, J., Koudis, G. S., Baumann, R., Bugliaro, L., Stettler, M., and Voigt, C.: Air traffic and contrail changes over Europe during COVID-19: a model study, Atmos. Chem. Phys., 21, 7429–7450, https://doi.org/10.5194/acp-21-7429-2021, 2021.
Stettler, M. E. J., Eastham, S., and Barrett, S. R. H.: Air quality and public health impacts of UK airports. Part I: Emissions, Atmos. Environ., 45, 5415–5424, https://doi.org/10.1016/j.atmosenv.2011.07.012, 2011.
Stettler, M. E. J., Boies, A., Petzold, A., and Barrett, S. R. H.: Global civil aviation black carbon emissions, Environ. Sci. Technol., 47, 10397–10404, https://doi.org/10.1021/es401356v, 2013.
Stuber, N., Forster, P., Rädel, G., and Shine, K.: The importance of the diurnal and annual cycle of air traffic for contrail radiative forcing, Nature, 441, 864–867, https://doi.org/10.1038/nature04877, 2006.
Szopa, S., Naik, V., Adihikary, B., Artaxo, P., Berntsen, T., Collins, W., Fuzzi, S., Gallardo, L., Kiendler-Scharr, A., Klimont, Z., Liao, H., Unger, N., and Zanis, P.: Short-Lived Climate Forcers, in: Climate Change 2021: The Physical Science Basis. Contribution of Working Group I to the Sixth Assessment Report of the Intergovernmental Panel on Climate Change, Cambridge, UK, New York, NY, USA, 817–922, 2021.
Teoh, R., Stettler, M. E. J., Majumdar, A., Schumann, U., Graves, B., and Boies, A.: A methodology to relate black carbon particle number and mass emissions, J. Aerosol Sci., 132, 44–59, https://doi.org/10.1016/J.JAEROSCI.2019.03.006, 2019.
Teoh, R., Schumann, U., and Stettler, M. E. J.: Beyond Contrail Avoidance: Efficacy of Flight Altitude Changes to Minimise Contrail Climate Forcing, Aerospace, 7, 121, https://doi.org/10.3390/aerospace7090121, 2020a.
Teoh, R., Schumann, U., Majumdar, A., and Stettler, M. E. J.: Mitigating the Climate Forcing of Aircraft Contrails by Small-Scale Diversions and Technology Adoption, Environ. Sci. Technol., 54, 2941–2950, https://doi.org/10.1021/acs.est.9b05608, 2020b.
Tompkins, A. M., Gierens, K., and Rädel, G.: Ice supersaturation in the ECMWF integrated forecast system, Q. J. Roy. Meteor. Soc., 133, 53–63, https://doi.org/10.1002/qj.14, 2007.
Voigt, C., Kleine, J., Sauer, D., Moore, R. H., Bräuer, T., Le Clercq, P., Kaufmann, S., Scheibe, M., Jurkat-Witschas, T., Aigner, M., Bauder, U., Boose, Y., Borrmann, S., Crosbie, E., Diskin, G. S., DiGangi, J., Hahn, V., Heckl, C., Huber, F., Nowak, J. B., Rapp, M., Rauch, B., Robinson, C., Schripp, T., Shook, M., Winstead, E., Ziemba, L., Schlager, H., and Anderson, B. E.: Cleaner burning aviation fuels can reduce contrail cloudiness, Commun. Earth Environ., 2, 1–10, https://doi.org/10.1038/s43247-021-00174-y, 2021.
Wallace, J. M. and Hobbs, P. V.: Atmospheric Science: An Introductory Survey, Second Edition, Elsevier Academic Press, Amsterdam, 1–488, https://doi.org/10.1016/C2009-0-00034-8, 2006.
Wey, C. C., Anderson, B. E., Hudgins, C., Wey, C., Li-Jones, X., Winstead, E., Thornhill, L. K., Lobo, P., Hagen, D., and Whitefield, P.: Aircraft particle emissions experiment (APEX), Technical Memorandum (TM), NASA/TM-2006-214382, National Aeronautics and Space Administration (NASA), 2006.
Wilhelm, L., Gierens, K., and Rohs, S.: Weather Variability Induced Uncertainty of Contrail Radiative Forcing, Aerosp. 2021, 8, 332, https://doi.org/10.3390/AEROSPACE8110332, 2021.
Wilkerson, J. T., Jacobson, M. Z., Malwitz, A., Balasubramanian, S., Wayson, R., Fleming, G., Naiman, A. D., and Lele, S. K.: Analysis of emission data from global commercial aviation: 2004 and 2006, Atmos. Chem. Phys., 10, 6391–6408, https://doi.org/10.5194/acp-10-6391-2010, 2010.