
the Creative Commons Attribution 4.0 License.
the Creative Commons Attribution 4.0 License.
 | 15 Jul 2026
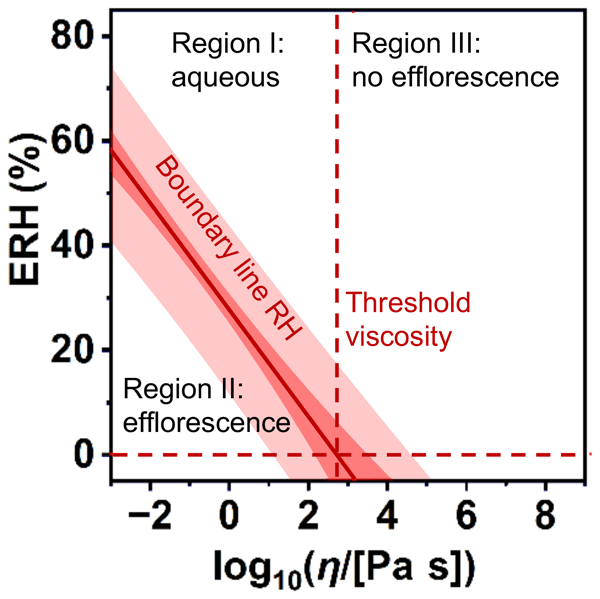
Characterizing efflorescence regimes in organic–inorganic aerosols using thermodynamically modeled viscosity
Shanshan Chen
Shu-Feng Pang
Pai Liu
Yun-Hong Zhang
Atmospheric aerosols, especially internally mixed organic–inorganic aerosols, exhibit complex phase behaviors that affect their size evolution, optical properties, and chemical reactivity, ultimately impacting climate and human health. Although parameterizations for secondary organic aerosol phase state exist, quantitative descriptions of efflorescence behavior in organic–inorganic aerosols remain underdeveloped. Herein, we evaluated chemical parameters, including O:C ratio, organic mass fractions, glass transition temperature (Tg), and viscosity (η), and identified aerosol viscosity as the primary variable associated with efflorescence relative humidity (ERH) in organic–inorganic aerosols. We developed a viscosity–ERH framework, which defines boundary conditions that separate viscosity-humidity space into three empirical regions. Above the fitted line, aerosols remain in an aqueous state, whereas below the line, efflorescence occurs. Additionally, efflorescence is unlikely to occur when η exceeds a threshold value (). The predicted boundary line was validated using an independent dataset, and a multivariate regression model incorporating η and Tg improved the statistical performance of the boundary line but was limited by Tg parameterization for complex organic–inorganic mixtures. Our findings highlight the association between aerosol viscosity and efflorescence and emphasize the need to develop improved aerosol viscosity measurement techniques to better constrain aerosol phase behavior in atmospheric models.
- Article
(1712 KB) - Full-text XML
-
Supplement
(1699 KB) - BibTeX
- EndNote


Atmospheric aerosols significantly influence climate and human health through both direct and indirect effects. They directly influence the energy balance by absorbing and scattering solar radiation and indirectly affect the climate by acting as cloud condensation nuclei (CCN), thereby altering cloud microphysical properties such as droplet size, lifetime, and optical characteristics (Boreddy et al., 2014; Fan et al., 2010; Knopf and Alpert, 2023; Novo et al., 2021; Pöschl, 2005; Shrivastava et al., 2017; Smith et al., 2021). Among aerosol physicochemical properties, phase state (liquid, solid, or semi-solid) is particularly important, as it governs hygroscopicity, optical properties, and heterogeneous reactivity (Fard et al., 2018; Freedman et al., 2024; Novo et al., 2021). Moreover, aerosol phase transition significantly affects viral activity during transmission (Oswin et al., 2022). Consequently, aerosol phase states substantially impact climate, air quality, and human health (Reid et al., 2018).
Atmospheric aerosols, particularly internally mixed secondary aerosols composed of organic and inorganic components, exhibit diverse phase states, including liquid, liquid–liquid phase-separated, semi-solid, amorphous solid, and crystalline solid, which govern their physicochemical properties (Novo et al., 2021). For instance, aerosols undergoing efflorescence (i.e., crystallization) and deliquescence exhibit hysteresis in particle size and water content in response to relative humidity (RH) variations (Choi and Chan, 2002; Guo et al., 2020). In contrast, amorphous organic aerosols generally do not exhibit the pronounced discontinuous hysteresis associated with efflorescence and deliquescence of crystalline particles. However, semi-solid or glassy amorphous particles may still show gradual, kinetically driven hysteresis in water uptake and release because of slow diffusion and equilibration (Koop et al., 2011). Thus, effloresced (or crystallized) aerosols display fundamentally different hygroscopic behaviors from amorphous ones, introducing uncertainties in predicting mixing aerosol water uptake and particle size under varying RH conditions because phase transitions and kinetic limitations can lead to different water contents and growth factors during hygroscopic cycles (Marcolli and Krieger, 2006; Mikhailov et al., 2009).
Aerosol particles consisting of more than a single phase may have crystalline as well as amorphous phases. It is important to note that, in internally mixed organic–inorganic aerosols, the onset of phase transitions such as deliquescence and efflorescence typically occur only in specific components rather than the entire particle. For example, crystalline inorganic salts or hydrates may undergo deliquescence or crystallization, while the remaining particle matrix can persist in an amorphous, semi-solid, or aqueous state (Hodas et al., 2016).
However, internally-mixed organic–inorganic aerosols are chemically complex, often containing thousands of distinct organic species, of which only about 10 % have been identified (Hallquist et al., 2009). This limited chemical characterization constrains our ability to accurately predict aerosol phase states. Existing parameterization models based on organic aerosol properties, such as molecular weight and oxygen-to-carbon ratio (O:C ratio) (Shiraiwa et al., 2017), elemental composition (DeRieux et al., 2018), and volatility (Li et al., 2020; Zhang et al., 2019) to predict the glass transition temperature (Tg), have been established to predict the phase state of organic aerosols but these models typically neglect efflorescence. Consequently, current parameterizations fail to distinguish between crystalline and amorphous solid states of internally mixed organic–inorganic aerosols and overlook the hysteresis in particle size and water uptake during efflorescence-deliquescence cycles. This may lead to biases in describing atmospheric aerosol phase behavior, hygroscopicity, and optical properties, affecting our understanding of particle aging via both physical and chemical processes in the atmosphere.
While laboratory studies have provided substantial data on efflorescence in mixed organic–inorganic aerosols, a comprehensive understanding of the factors influencing efflorescence remains limited (Cai et al., 2017; Ma et al., 2021b; Wang et al., 2017). Efflorescence involves the formation of crystalline nuclei from a supersaturated solution and proceeds through kinetically controlled nucleation and crystal growth that requires overcoming an energy barrier. This process is governed by a combination of thermodynamic driving forces and kinetic limitations.
Component diffusion regulates the mobility of ions and molecules and therefore affects the rate at which crystalline nuclei can form and grow; higher viscosity generally suppresses diffusion and delays efflorescence (Ji et al., 2017; Mikhailov et al., 2009). Chemical composition, including solute concentration, solubility, and vapor pressure, influences the degree of supersaturation and thus the thermodynamic driving force for crystallization (Cohen et al., 1987; Gupta et al., 2015). In addition, molecular interactions within the particle phase can either facilitate or hinder the structural rearrangement required for nucleation, while interfacial properties such as surface tension affect the nucleation energy barrier by altering the energetic cost of forming a new phase interface (Davis et al., 2015; Ma et al., 2021a; Mikhailov et al., 2009).
Thermodynamic constraints further require that efflorescence and crystallization can only occur when the aqueous phase becomes supersaturated with respect to the relevant solid phase; otherwise, efflorescence is thermodynamically inhibited. Once supersaturation is achieved, nucleation and crystal growth proceed through kinetically controlled processes (Bouzidi et al., 2022; Marcolli and Krieger, 2006). The corresponding transition point, described by the efflorescence relative humidity (ERH), is therefore strongly influenced by these factors, which are modulated by the properties of organic components, and the hydration state of the inorganic salts.
The O:C ratio is widely used as an indicator of organic compound polarity (Yu et al., 2021). Previous studies have shown that increasing the mass fraction of organic compounds (ωorg), particularly with high-viscosity organics, can significantly alter mass transport processes, and thereby affect phase transition (Parsons et al., 2004; Shiraiwa et al., 2013; Virtanen et al., 2010; Wang et al., 2017; Zobrist et al., 2011). Under such conditions, efflorescence may be kinetically suppressed because of limited molecular diffusion, causing aerosol particles to remain in an amorphous semisolid or glassy state; in this case, their phase-state evolution is more appropriately characterized with reference to the glass transition temperature (Tg) (Berkemeier et al., 2016; Koop et al., 2011; Song et al., 2016b; Tong et al., 2011). However, direct and reliable measurements of the viscosity of atmospheric aerosols under atmospherically relevant conditions remain challenging (Fitzgerald et al., 2016; Hosny et al., 2016), particularly because water uptake can continuously modify particle composition, phase state, and molecular mobility (Sheldon et al., 2023; Zobrist et al., 2008). This has resulted in limited observational data and motivated the use of thermodynamic models, such as AIOMFAC, to predict the viscosity of organic–inorganic mixed aerosols (Lilek and Zuend, 2022).
In this study, we develop a framework to predict efflorescence in organic–inorganic aerosols by integrating literature-reported ERH data and evaluating key physicochemical parameters, with particular emphasis on aerosol viscosity (η) and the combined effects of Tg, O:C ratio, and ωorg. This framework constrains the efflorescence phase transition in viscosity–humidity space and provides a quantitative description of boundaries separating aqueous, efflorescence and non-efflorescence states. The result improves the representation of aerosol phase behavior by using ambient RH and thermodynamically modeled viscosity, and offers constraints for atmospheric processes such as gas–particle partitioning, heterogeneous chemistry, and cloud formation.
2.1 The dataset for the parameterization
We compiled aerosol ERH data from our previous studies and peer-reviewed literature identified through Web of Science using keywords: aerosol, hygroscopic, and efflorescence. All studies were laboratory-based, with ERH measured using IR spectroscopy (Braban and Abbatt, 2004; Cai et al., 2017; Ghorai et al., 2014; Ji et al., 2017; Ma et al., 2021b; Shi et al., 2017; Wang et al., 2017; Wu, 2017; Xu et al., 2022), Raman spectroscopy (Chang, 2020; Hu et al., 2025; Ushijima et al., 2021; Wang, 2018; Yu et al., 2012), optical microscopy (Bertram et al., 2011; Huang et al., 2024; Parsons et al., 2004) or Hygroscopicity Tandem Differential Mobility Analyzer (HTDMA) (Laskina et al., 2015). In multicomponent organic–inorganic particles, multiple ERH may exist due to different salts crystallizing at distinct RH levels, and efflorescence typically occurs over a RH range. In this study, “aerosol ERH” is defined as the mean value of this transition range, serving as a simplified but effective macroscopic parameter for the overall phase transition of the particle.
A total of 102 ERH data points for organic–inorganic mixture aerosols were collected: 66 ERH points for the training set (Table S1 in the Supplement) and the remaining 36 points for the validation set (Table S2). The training set includes aerosol compositions containing 14 organic compounds (composed of C, H, and O) and 4 inorganic salts (ammonium sulfate, ammonium nitrate, sodium chloride, and potassium chloride) mixed in varying ratios. All ERH data in the training set were from our previous studies, and all corresponding viscosity data were derived using the AIOMFAC model. The particles investigated in our previous studies typically range from 1–10 µm in diameter. The validation set contains 36 ERH data from systems involving 12 organic compounds and 4 inorganic salts (Table S2), selected from studies that either reported both aerosol ERH and viscosity or observed no efflorescence. For dataset included in this study, experiments were conducted over several hours with slow RH change rate () to ensure near-equilibrium conditions. Although these timescales are shorter than typical atmospheric aerosol lifetimes (days to weeks), previous studies have shown that nucleation induction times in high-viscosity systems can be extremely long due to diffusion limitations. (Raes, 2000; Wang et al., 2017) Therefore, the suppression of efflorescence at high viscosity reported in the cited studies is likely a fundamental kinetic constraint rather than an artifact of limited experimental duration. Moreover, the empirical data utilized to derive the regression model in this study were all obtained within a temperature range of 298±10 K.
Key physicochemical parameters for describing aerosol ERH include the O:C ratio of the organic compound in the mixture:
where NO,org and NC,org are the number of oxygen and carbon atoms in the organic compound, respectively. Other parameters include ωorg, fractional Tg at ERH (Tg(ωorg)), and viscosity.
2.2 AIOMFAC model
Aerosol viscosity at the corresponding ERH and 298 K was estimated using the Aerosol Inorganic–Organic Mixtures Functional Groups Activity Coefficients (AIOMFAC) model. (Zuend et al., 2008, 2011) AIOMFAC is a thermodynamics-based group-contribution framework developed for aqueous organic–inorganic mixtures. To predict the viscosity of complex organic–inorganic mixtures, the AIOMFAC-VISC framework conceptually divides the mixture into two distinct sub-systems. For the aqueous inorganic (electrolyte) sub-system, it employs a semi-empirical model based on Eyring's absolute rate theory, which relates viscosity to the molar Gibbs energy of activation for viscous flow (Δg*) taking into account temperature, ion activities, and ionic strength. Conversely, for the aqueous organic sub-system, the model relies on a combinatorial-activity-weighted approach based on functional group contributions. (Gervasi et al., 2020) Adopting the UNIFAC concept, AIOMFAC segments organic molecules into functional subgroups, treating the liquid mixture as a “solution of groups” to manage chemical complexity. (Fredenslund et al., 1975; Hansen et al., 1991) In our study, the viscosity of mixed organic–inorganic phases was estimated using the default “aquelec” (electrolyte-aware water) approach in AIOMFAC-web. This method represents the effects of ions by first computing the viscosity of the aqueous electrolyte mixture (excluding organics), and then using that sub-system's viscosity to represent a modified viscosity of water in the calculation of the electrolyte-free organic sub-system. Validation against experimental data (e.g., Fig. 11 in Lilek and Zuend, 2022) has demonstrated that the aquelec approach accurately characterizes the viscosity of internally mixed aerosols such as sucrose-nitrate systems, establishing it as a robust tool for our predictions (Lilek and Zuend, 2022; Song et al., 2021; Zuend et al., 2011).
Accordingly, viscosity calculations were performed by specifying the functional groups of the organic components, inorganic salt composition, organic-to-inorganic ratio (OIR, molar ratio of organic compounds to inorganic salts, excluding water), and a series of organic molar fractions in the solute mixture, xorg, where the solute consists of organic compounds and inorganic salts, ranging from 0.01–0.99 in increments of 0.01. For each system, the viscosity corresponding to the water activity closest to the literature reported ERH (within ±0.5 % RH) was selected. For example, in a 1,2,6-hexanetriol and ammonium sulfate (1:1) mixture, we defined 1,2,6-hexanetriol as 2 CH2(OH), 1 CH(OH), 1 C and 3 OH. The viscosity of the mixture system was evaluated at a water activity of 0.47, which closely matches the ERH value in the literature (47.4 %). Functional group definitions for all organic components are listed in Table S3. To assess the uncertainty associated with the thermodynamic state predictions, the sensitivity of viscosity () was calculated for each mixture. This metric quantifies the variation in predicted viscosity resulting from a ±2 % perturbation in aerosol water mass fraction and serves as a proxy for uncertainty related to compositional variability. The corresponding values are listed in Table S1.
2.3 Calculation of the glass transition temperature (Tg(ωorg))
Multiple parameterizations exist for estimating the glass transition temperature (Tg) of organic compounds, utilizing predictors such as chemical structure, volatility, or melting point (Tm) (Armeli et al., 2023; Galeazzo and Shiraiwa, 2022; Koop et al., 2011; Li et al., 2020). Recent machine-learning models based on chemical structure do not strictly require Tm information, though including it as an optional parameter can further improve predictive accuracy (Armeli et al., 2023). The framework proposed by Armeli et al. comprises four distinct modes, contingent upon the specific input parameters available for a given compound: the Functional Group Mode (FGM) and the SMILES Mode (SM). Each mode features a variant that includes melting temperature as an additional feature (FGM with Tm; SM with Tm) and a version that operates without it (FGM no Tm; SM no Tm). The Tg values and parameters calculated according to the methodology of Armeli et al. (2023) are summarized in Tables S4–S7.
The volatility-based parameterization developed by Li et al. (Eq. 2) predicts Tg from the saturation mass concentration (C0).
C0 was estimated as a function of C, O, N, S numbers of the organic compound (, Eq. 3) (Donahue et al., 2011; Li et al., 2016):
Here, is the reference carbon number; nC, nO, nN, and nS denote the number of carbon, oxygen, nitrogen, and sulfur atoms, respectively; b coefficients (bC, bO, bN, and bS) denote atomic contributions fitted via multi-linear least squares analysis from 30 000 compounds across multiple classes (CH, CHO, CHN, CHON, CHOS, and CHONS). (Li et al., 2016) b(CO) represents the carbon–oxygen nonideality.
A comparison between the experimentally measured Tg values of the organic compounds and the predictions derived from the methods of both Li et al. (2020) and Armeli et al. (2023) is presented in Table S7.
The presence of inorganic salts (e.g., sodium nitrate) has been demonstrated to modulate the Tg of organic–inorganic mixtures; specifically, depending on the effective Tg of inorganic salt, the Tg of the mixture can be either elevated or depressed. (Dette and Koop, 2015) Typically, the Tg of organic–inorganic mixtures is calculated using the Gordon–Taylor equation (Gordon and Taylor, 1952):
where Tg represents the glass transition temperature of the dry binary mixture, Tg1 and Tg2 are the Tg values of the respective pure compounds, ω1 and ω2 denote the mass fractions of the two components, and k is the Gordon–Taylor constant. However, the experimental data of glass transition temperature of inorganic compounds is limited, we thus employ the glass transition temperature of the organic-water system (Tg,org-water) as a proxy for the overall mixture Tg when analyzing the correlation between efflorescence relative humidity (ERH) and Tg. In Eq. (4), the parameters ω2 and Tg2 are substituted with the mass fraction ωorg and the glass transition temperature Tg(ωorg) of the organic component, respectively, where ωorg is the organic mass fraction calculated via the AIOMFAC model at aerosol ERH. Tg,w is the glass transition temperature of pure water (136 K) (Kohl et al., 2005), while kGT (the Gordon–Taylor constant) is assumed to be 2.5 for organic–water mixtures (Koop et al., 2011; Zobrist et al., 2008). These two values are substituted for Tg1 and k in the equation, with ω1 calculated as (1−ωorg). As reported by Koop et al. (Dette and Koop, 2015), the Tg of NaNO3 is specified as 290 K. Using this reported Tg value for NaNO3 together with kGT=0.5, we calculated the Tg for dry glycerol/NaNO3 and dry sucrose/NaNO3 mixtures across a range of mixing ratios (Fig. S1 in the Supplement), It should be noted that assuming a constant Gordon–Taylor parameter (kGT=2.5) for all organic–water mixtures represents a generalized simplification. The kGT value essentially parameterizes the interaction strength between water and the specific organic solute. Consequently, for organic mixtures with highly complex or varying oxygenated functional groups, the actual kGT value may deviate from this assigned average (typically estimated within a range of 2.5±1.0). This variability introduces a potential, albeit minor, source of uncertainty into the Tg-based model predictions presented in this study.
In addition to the approach used here for estimating Tg(ωorg), the glass transition temperature of the entire mixture, including contributions from inorganic ions, could also be derived from the predicted mixture viscosity. This can be achieved by combining AIOMFAC-VISC viscosity predictions with an assumed fragility parameter within the Vogel–Tammann–Fulcher framework. (DeRieux et al., 2018) However, the pure-component viscosity parameterization for organics implemented in AIOMFAC-web may be less accurate than more recent approaches (Armeli et al., 2023). Moreover, for the purposes of the present regression model, estimating Tg from mixture viscosity is likely redundant, as it does not provide additional predictive power beyond viscosity itself.
3.1 Correlation between ERH and physicochemical parameters
Herein, we focus on the efflorescence of the inorganic component in internally mixed organic–inorganic aerosols. Therefore, we examined the correlation between mean ERH and key physicochemical parameters describing the organic components in organic–inorganic mixture aerosols: O:C ratio, ωorg, and Tg(ωorg) (Fig. 1).
Linear regression analysis using the training set (66 data points) showed no significant correlations between aerosol ERH and any of O:C, ωorg, or Tg(ωorg) individually (R2<0.15; Table S8). Multivariate regression considering the combined influence of three parameters provided only a limited improvement (R2=0.18, Table S9). According to the nested cross-validated model evaluation reported by Armeli et al. (Armeli et al., 2023) for the full dataset, the SMILES mode with Tm showed the highest predictive accuracy among the four modes. Therefore, the Tg values calculated using the SMILES mode with Tm were selected for comparison with the parameterization developed by Li et al. (2020). The results, presented in Fig. 1c, demonstrate that neither methodology yields a statistically significant correlation. Furthermore, analyses employing alternative FGM and SMILES models for Tg estimation, and Tg values for organic–inorganic mixtures were also investigated (Fig. S2). Similarly, no discernible correlation with ERH was observed.
When we color-coded the training dataset in Fig. 1b–d based on aerosol viscosity (the logarithm of viscosity estimated using the AIOMFAC, log 10η), a clear trend emerged: aerosols with lower viscosity generally exhibited higher ERH, while those with higher viscosity tended to have lower ERH. This trend is further supported by the scatter plot of aerosol ERH versus viscosity (Fig. 1a), which shows an apparent negative correlation. These results indicate that viscosity may play a key regulatory role in aerosol efflorescence and could be a critical predictor for ERH. We also note that the RH dependence of aerosol viscosity can contribute in the observed viscosity–ERH correlation, and we will discuss this in detail in the following section.
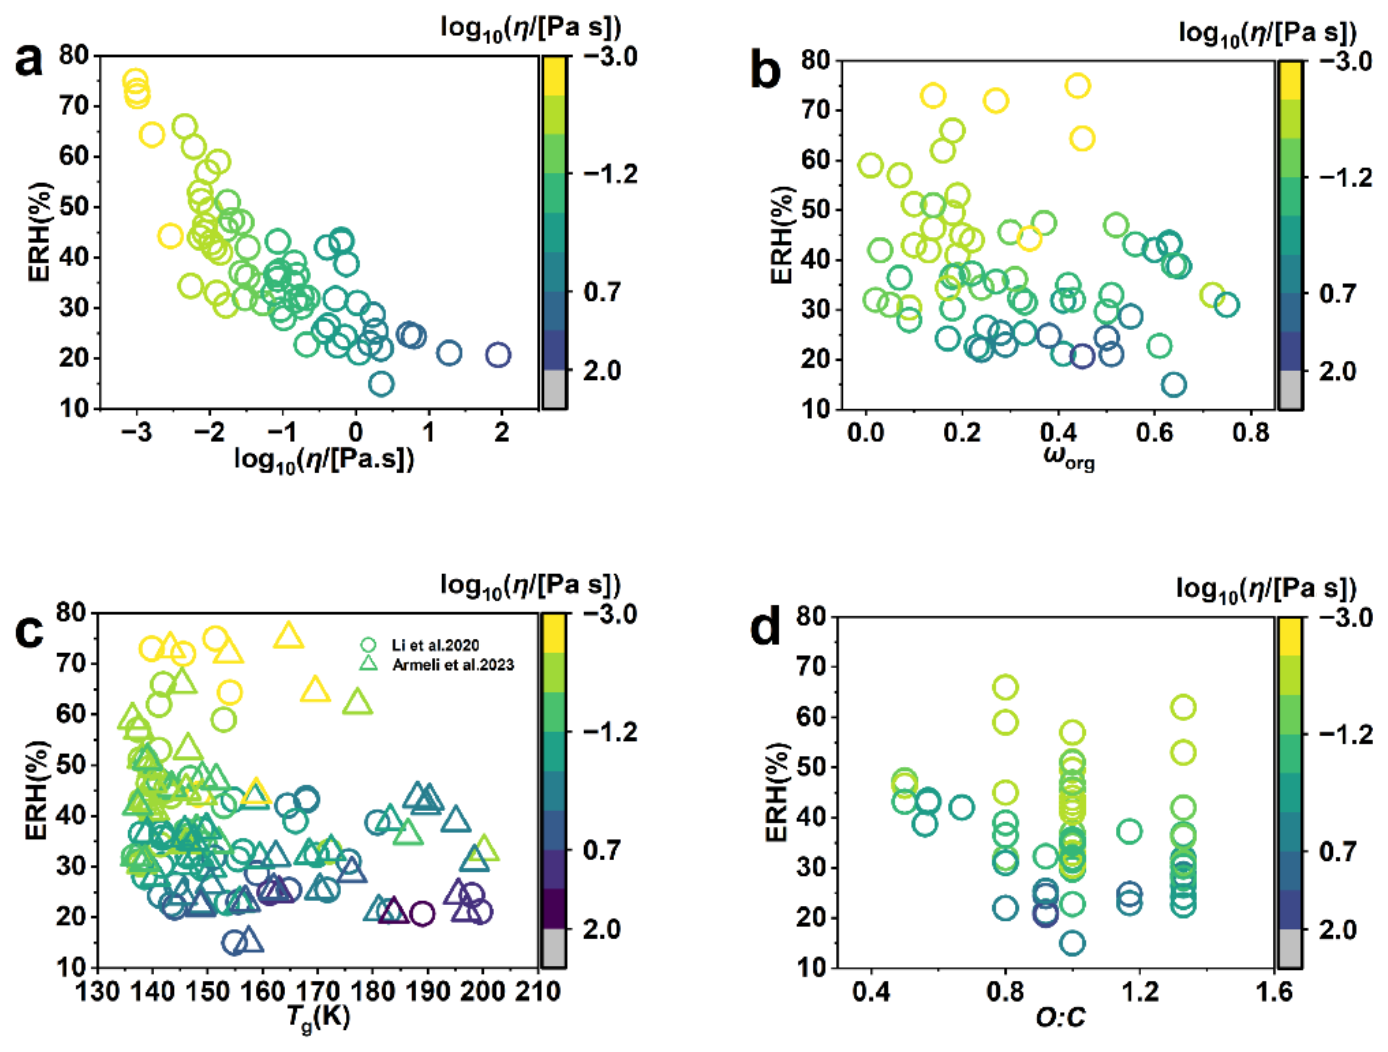
Figure 1Relationships between the ERH of organic–inorganic mixed aerosols. (a) the logarithm of viscosity (), (b) the organic mass fraction (ωorg), (c) the glass transition temperature (Tg(ωorg), K) calculated using the methods of Li et al. (2020) and Armeli et al. (2023), respectively, and (d) O:C ratio. The color bar denotes the aerosol viscosity in (). All empirical ERH values were measured within a temperature range of 298±10 K, and all viscosity values were calculated at 298 K.
3.2 Characterizing Efflorescence regimes in viscosity-humidity space
Building on the correlation between viscosity and mean ERH values presented in Fig. 1, we develop a viscosity–ERH framework (Fig. 2) that establishes quantitative boundary lines in viscosity–humidity space. The boundary lines distinguish efflorescence and non-efflorescence regions, providing a simplified yet physically constrained representation of aerosol phase-transition behavior. The fitted equation for the boundary line is
The R2 of the linear fit is 0.65, which suggests a significant correlation between aerosol viscosity and aerosol ERH. This indicates that aerosol viscosity serves as a useful descriptor of efflorescence behavior across diverse organic–inorganic systems. Interestingly, we found that although aerosol efflorescence occurs due to the crystallization of aqueous inorganic salt, the correlation between aerosol viscosity and the normalized aerosol ERH defined as (where ERHIng is the efflorescence relative humidity of the corresponding inorganic salt system) was even weaker (R2=0.59, Fig. S3). Moreover, the linear fit for organic–ammonium sulfate systems exhibits a similar correlation between ERH and viscosity, with comparable R2, slope, and intercept to those obtained for the full dataset (Fig. S4). Since the AIOMFAC calculation accounts for inorganic salts, these results suggest that the observed viscosity–ERH relationship is broadly consistent across the inorganic salts represented in this study.
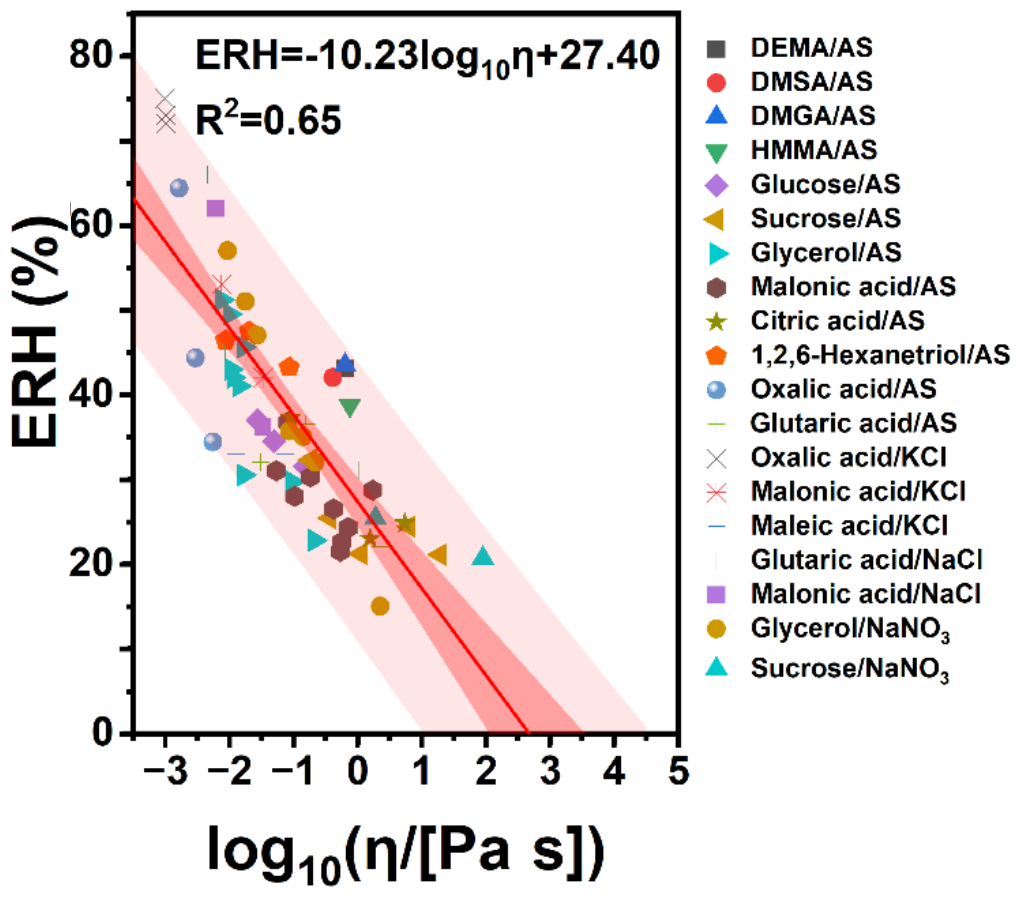
Figure 2Linear fitting of aerosol ERH for different organic–inorganic aerosols by using viscosity (log 10η) as the predictor. Data points are color- and shape-coded to distinguish between different organic and inorganic aerosol species. The red solid line represents the linear regression fit between viscosity and ERH. The dark pink band indicates the 95 % confidence interval, while the light pink band shows the prediction interval. AS refers to ammonium sulfate, DEMA represents Diethyl malonic acid, DMSA represents 2,2-Dimethyl succinic acid, DMGA represents 3,3-Dimethyl glutaric acid, HMMA represents DL-4-Hydroxy-3-methoxymandelic acid and DHBA represents 2,5-Dihydroxybenzoic acid. All empirical ERH values were measured within a temperature range of 298±10 K, and all viscosity values were calculated at 298 K.
The resulting viscosity–ERH framework provides a quantitative boundary for characterizing efflorescence regimes in viscosity–humidity space and for assessing the likelihood of efflorescence under a given combination of viscosity and ambient RH. Notably, the fitted relationship intersects ERH=0 at a viscosity reaches 4.76×10² Pa s, with a corresponding 95 % confidence interval is . Within the dataset examined here, aerosols with viscosities above this threshold did not exhibit measurable efflorescence. Accordingly, this threshold can be interpreted as a practical boundary separating efflorescence and non-efflorescence regions, suggesting that organic–inorganic aerosols with viscosities exceeding 4.76×10² Pa s are unlikely to undergo efflorescence. The complete viscosity–ERH model is expressed as:
It should be emphasized that the empirical data utilized to derive this regression model were obtained at a constant temperature of 298 K. Given the well-established temperature dependence of both ERH and viscosity, the applicability of the current framework is limited to standard room temperature conditions (298 K). Extrapolating this model to broader temperature regimes would necessitate further temperature-specific calibrations.
The uncertainty of the framework reflects the scatter of the experimental ERH data, the stochastic nature of nucleation, and the uncertainty in AIOMFAC-predicted viscosity. The current analysis is mainly applicable to internally mixed organic–inorganic aerosols containing ammonium sulfate, ammonium nitrate, sodium chloride, or potassium chloride, with organic components primarily consisting of water-soluble C, H, and O, containing compounds, such as dicarboxylic acids and sugars.
To further examine the structure underlying the observed relationship, we analyzed (i) viscosity variations for fixed chemical systems across RH (20 %–60 %) and (ii) the relationship between viscosity evaluated at fixed RH (from 20 %–90 %) and ERH across different compositions. The slopes of the viscosity–RH relationships for representative systems range from −10 to −60 (Table S12 and Fig. S7); therefore, the fitted relation between ERH and viscosity can be interpreted as an apparent representation of the combined effects of compositional variability across different aerosol compositions.
The correlation between viscosity and ERH is greatly reduced when RH is held constant (Fig. S8). However, we found that the reduction is not uniform across RH. The highest correlations occur at intermediate RH values that overlap with the ERH range of many atmospheric aerosol systems (R2=0.29 at RH=60 % and R2=0.24 at RH=50 %), whereas substantially weaker correlations are observed at RH values well below or above the typical ERH range (e.g., R2=0.15 at RH=20 % and R2=0.08 at RH=90 %). Although these correlations remain weak overall and are insufficient to establish an independent predictive relationship, they suggest that viscosity may still contribute to variations in observed ERH under conditions relevant to efflorescence. We therefore interpret these results as indicating that the RH dependence of viscosity explain the majority of the observed viscosity–ERH relationship, while the potential contribution from viscosity itself cannot be excluded and warrants further investigation.
Accordingly, this consolidates the interpretation of the viscosity–ERH framework as an empirical boundary representation in viscosity–humidity space that captures variability arising from organic composition and organic–inorganic interactions. In this framework, aerosol viscosity is not regarded as a standalone predictor of ERH, rather, ambient RH and aerosol viscosity are treated as independent inputs, and their position relative to the fitted boundary is used to characterize the expected aerosol state (aqueous, efflorescing, or highly viscous/non-efflorescing).
We further performed multivariate regression incorporating viscosity (log 10η), O:C ratio, ωorg, and Tg(ωorg) as independent variables. The four-variable model demonstrated an improved R2 of 0.69, which is significantly different from the ERH-viscosity model (Sig. F change<0.05, Table S10) due to the major contribution of viscosity and Tg(ωorg) (both showed p<0.05, Table S10). We therefore established a bivariate viscosity–Tg–ERH model, and the analysis of variance (ANOVA) showed a Sig. F change (0.949) much greater than 0.05 with the same R2 of 0.69. This indicated that there was no significant difference between the viscosity–Tg–ERH model and the four-variable model (Table S11), and O:C and ωorg did not significantly improve predictive performance. The viscosity–Tg–ERH model is expressed as:
Although adding parameters typically increases the coefficient of determination (R2) by capturing additional variance, the inclusion of Tg(ωorg) improved R2 by only 0.04. In contrast, the viscosity–ERH framework achieves comparable explanatory capability while requiring fewer assumptions. As a result, it provides a simpler and more broadly applicable approach for characterizing efflorescence regimes and phase-transition boundaries across diverse internally mixed organic–inorganic aerosols.
Moreover, the viscosity–Tg–ERH model exhibits practical limitations. The Tg(ωorg) does not account for the effects of inorganic salts due to the limited availability of apparent Tg values for inorganic components. As shown in Fig. S1, we estimated the Tg of organic/NaNO3 mixtures by incorporating the Tg of pure NaNO3 into the Gordon–Taylor framework, using a kGT value of 0.5 extrapolated from Dette and Koop. (Dette and Koop, 2015) The result indicates that, regardless of whether the Tg of pure inorganic salt or water is used, the calculated Tg(ωorg) exhibits no apparent correlation with ERH.
We also note that other parameters, such as aerosol pH, can affect the ERH of organic/inorganic aerosol (Sun et al., 2023); however, to the best of our knowledge, no consistent trend has been established regarding the direction or magnitude of this effect, since the influence of pH is highly dependent on the specific organic composition. Given that the modeled viscosity accounts for organic functional groups, the influence of pH may be implicitly reflected within the overall model uncertainty. Future studies should incorporate more inorganic Tg data and systematically investigate pH effects to provide more accurate Tg(ωorg) and pH values and better evaluate the role of both parameters in the viscosity–ERH relationship.
We then validated the established viscosity–ERH model using an independent dataset (32 data points) compiled from the literature. As depicted in Eq. (6), a threshold viscosity of 4.76×10² Pa s distinguishes between crystallized and amorphous solid phases in atmospheric aerosols. Figure 3a compares the experimentally measured ERH in the validation set with model predictions. For (data points to the left of the red dashed line), all validation data fall within the predicted confidence intervals, supporting the consistency of the viscosity–ERH relationship across independent datasets.
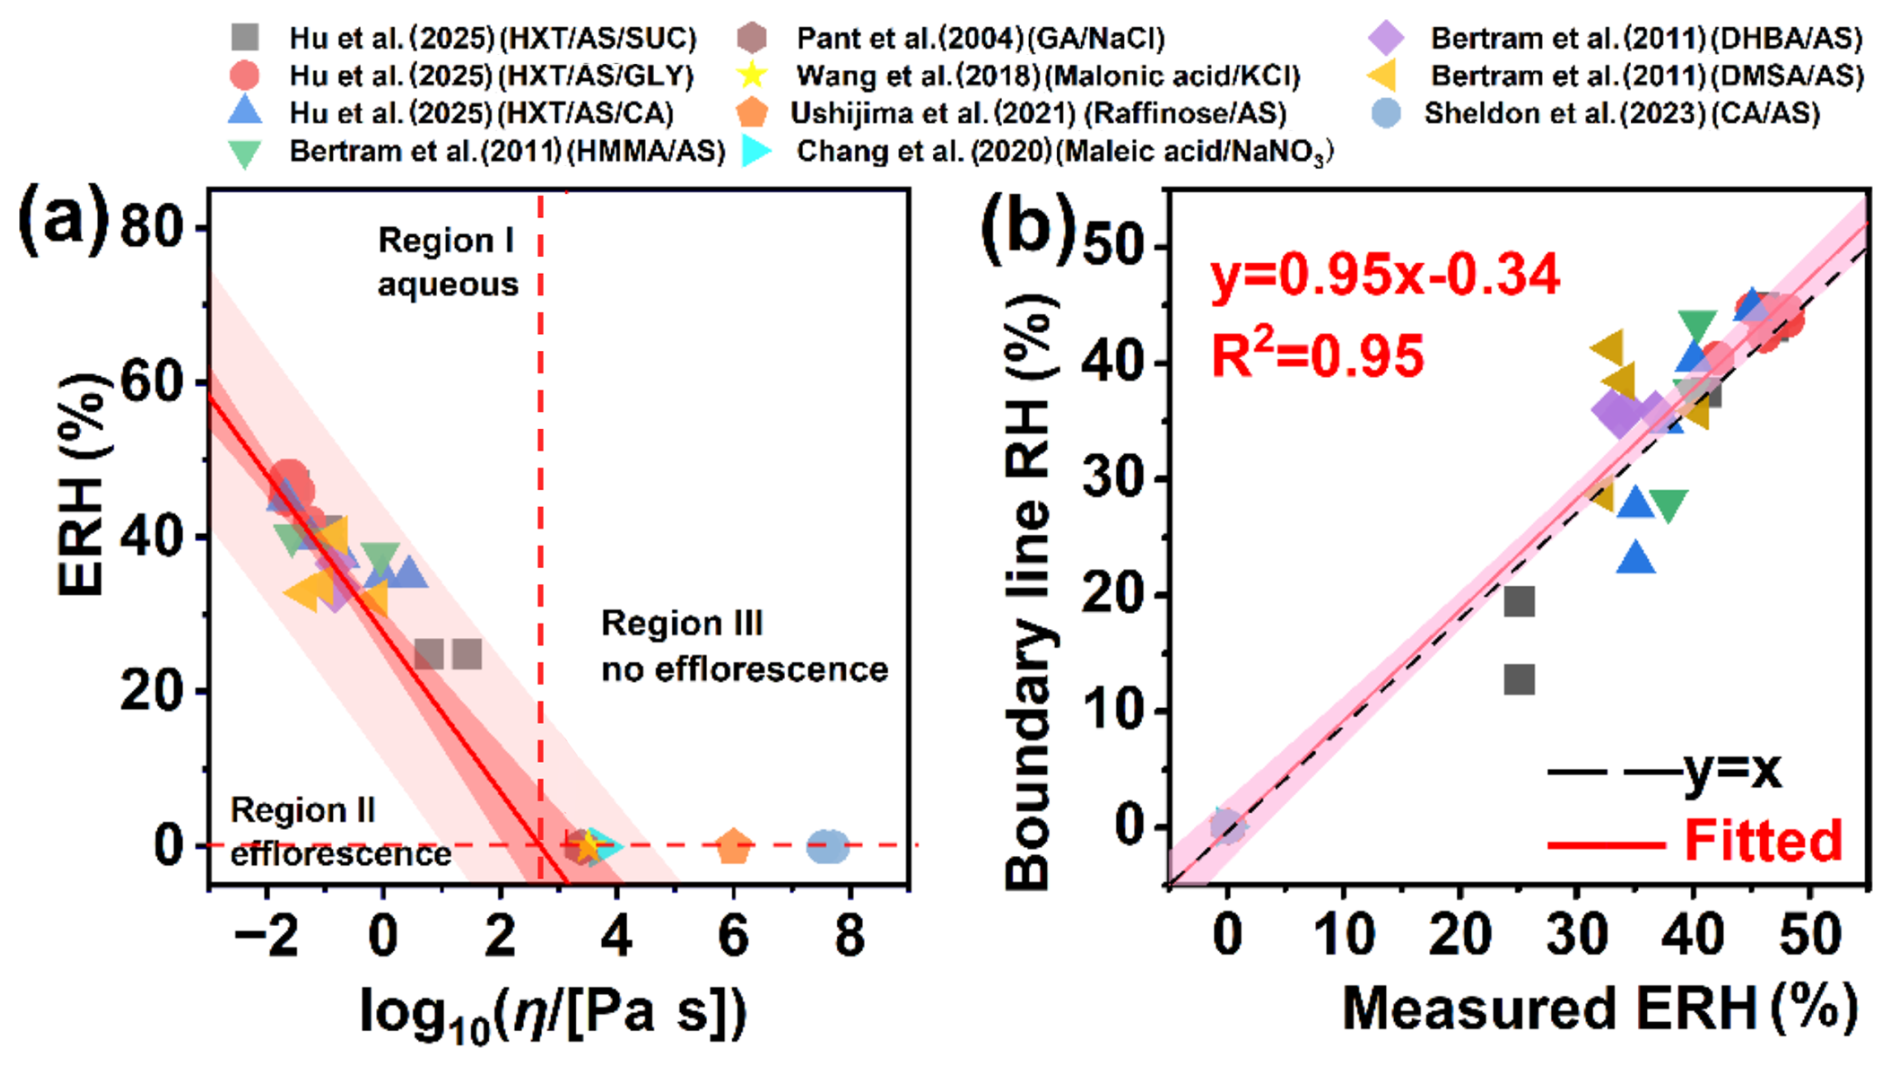
Figure 3(a) Comparison between the validation dataset and viscosity–ERH boundary framework (Eq. 5), showing three distinct regions in viscosity–humidity space: Region I (aqueous state), Region II (efflorescence-favorable conditions), and Region III (non-efflorescence or highly viscous state). (b) Comparison between experimentally measured ERH values and the boundary line RH values derived from the viscosity–humidity relationship. The black dashed line denotes the y=x reference line, and the red line represents the linear regression fit to the data, along with the corresponding coefficient of determination, R2=0.95. The pale pink shading represents the 95 % confidence interval. DEMA represents Diethyl malonic acid, DMSA represents 2,2-Dimethyl succinic acid, DMGA represents 3,3-Dimethyl glutaric acid, HMMA represents DL-4-Hydroxy-3-methoxymandelic acid and DHBA represents 2,5-Dihydroxybenzoic acid, CA represents citric acid, SUC represents Sucrose, GA represents glutaric acid, HXT represents 1,2,6-hexanetriol. All empirical ERH values were measured within a temperature range of 298±10 K, and all viscosity values were calculated at 298 K.
The viscosity–ERH relationship defines a boundary line and a threshold value in viscosity–humidity space, which can be used in combination with ambient RH value and aerosol viscosity to interpret aerosol phase behavior within three distinct regions (Fig. 3a). In Region I (above the red regression line), aerosols remain in an aqueous state. In Region II (below the regression boundary but with ), aerosols are kinetically favorable for nucleation and crystal growth, corresponding to efflorescence. In Region III (), aerosols remain in a highly viscous state and do not exhibit measurable efflorescence, instead forming amorphous solids.
To validate the viscosity–ERH boundary framework derived from linear regression (Eq. 6), we compared the experimentally measured ERH values with the boundary line RH estimated from the fitted relationship (Fig. 3b). The data points cluster around the y=x reference line (black dashed line), with the fitted line (red solid line) showing close alignment and a slope near unity (R2=0.95), indicating strong consistency between the empirical ERH values and the viscosity–ERH boundary representation. When excluding the (0,0) data points (Fig. S5), the slope remains close to unity, while the coefficient of determination decreases but remains significant (R2=0.68), reflecting increased scatter at low ERH conditions. In addition, the viscosity–Tg–ERH framework was evaluated using the same dataset, excluding systems for which Tg could not be estimated. This extended framework shows comparable consistency with the experimentally reported ERH values (Fig. S6).
3.3 Physical interpretation of the viscosity–ERH framework
Aerosol efflorescence is a kinetically controlled process involving: (1) formation of critical crystal nuclei in supersaturated droplets; (2) subsequent crystal growth, and (3) water evaporation (Zhang et al., 2012). In highly viscous aerosols, mass transfer limitations significantly alter nucleation dynamics, making nucleus formation the rate-limiting step (Ji et al., 2017; Wang et al., 2017). Turnbull and others showed that the nucleation rate can be expressed as the product of a pre-exponential factor and two thermally activated rate terms (Hollomon and Turnbull, 1953; Kelton et al., 1983; Turnbull, 1969):
where W(T) represents the kinetic barrier associated with atomic rearrangement, and ΔG(T) is the thermodynamic free energy barrier for nucleus formation. The term represents the thermally activated atomic rearrangement rate (i.e., atomic mobility) in liquids and is inversely related to viscosity (η−1). Here, we introduce an approximate proportional relationship between the kinetic barrier term and the logarithm of viscosity:
where A is a constant linking with −log 10η. Substituting this relation into Eq. (8) and taking log 10 gives:
The viscosity–ERH framework established in this study is qualitatively consistent with Eq. (10), in which increasing viscosity is associated with reduced molecular mobility and lower effective nucleation rates. In this context, log 10η can be viewed as a practical indicator for the kinetic energy barrier W(T) on nucleation and crystal growth. The intercept achieved in Eq. (5) can therefore be associated with . However, as discussed in Sect. 3.2, the observed viscosity–ERH relationship is strongly influenced by the RH dependence of viscosity. Therefore, the present results should not be simply interpreted as establishing a unique mechanistic relationship between viscosity and ERH. Rather, the viscosity–ERH framework provides an empirical description of the conditions under which efflorescence may occur for a broad range of internally mixed organic–inorganic aerosol systems. At the critical viscosity threshold, the aerosol transitions from a liquid to a semi-solid phase, creating an immense kinetic barrier to molecular diffusion. Consequently, the nucleation induction time is prolonged so significantly that efflorescence is effectively inhibited, even over the extended residence times typical of aerosols in the atmosphere (days to weeks).
Thermodynamics-based approaches, such as that described by Hodas et al. (2016), predict salt crystallization and ERH based on the degree of supersaturation relative to the ion activity product (IAP) at the point of saturation of the species involved in the crystalline phase (i.e., IAPsat). These frameworks capture the fundamental requirement that crystallization can only occur when the aqueous phase becomes thermodynamically supersaturated with respect to the relevant solid phase.
In this study, we consider aerosol conditions near ERH, where particles are expected to exhibit high ionic strength due to reduced water content. Under these conditions, efflorescence can be viewed as a coupled thermodynamic–kinetic process. Thermodynamic supersaturation provides the driving force necessary for crystallization, whereas nucleation and crystal growth remain subject to kinetic limitations. Thus, thermodynamic and kinetic perspectives are complementary: thermodynamic conditions determine whether crystallization is possible, while kinetic factors influence when crystallization occurs. In this context, aerosol viscosity is considered as a practical descriptor of molecular mobility and diffusion limitations, rather than a standalone determinant of efflorescence.
While the viscosity–ERH framework characterizes distinct efflorescence regimes across diverse aerosol systems, its application to predicting aerosol phase behavior in viscosity–humidity space has inherent limitations. As highlighted by previous studies (Ciobanu et al., 2010; Kuwata and Martin, 2012), in complex organic–inorganic systems, liquid–liquid phase separation (LLPS) frequently occurs, forming core-shell morphologies. In such core-shell aerosols, the inner aqueous inorganic-rich phase may maintain a low, liquid-like viscosity comparable to that of pure inorganic droplets, yet still exhibit a suppressed ERH. This suppression can arise because the organic coating alters the interfacial energy or acts as a physical barrier, independent of the inner core's viscosity (Ciobanu et al., 2010). Consequently, the occurrence of efflorescence is influenced by a combination of thermodynamic driving force, particle morphology, interfacial properties, particle size, and molecular mobility. The viscosity–ERH framework presented here should therefore be viewed as an empirical boundary description of observed aerosol behavior rather than a complete mechanistic model of crystallization.
Our results demonstrate that aerosol viscosity provides a useful framework for characterizing efflorescence behavior in internally mixed organic–inorganic aerosols. Although inclusion of both viscosity and Tg slightly improves model performance, the viscosity–ERH framework offers broader applicability and greater simplicity for diverse aerosol systems. The framework remains valuable for describing aerosol phase transitions because it organizes observed behavior into distinct regimes in viscosity–humidity space and defines boundary lines separating different phase states. Within the dataset examined here, three behavioral regions are identified: (i) an aqueous regime above the fitted boundary line, (ii) an efflorescence regime below the boundary line when viscosity remains below the threshold value, and (iii) a non-efflorescence regime at viscosities exceeding approximately 4.76×10² Pa s. This provides a physically constrained representation of aerosol phase-transition behavior.
Regional viscosity predictions by Zhang et al. suggest that in southern and northeastern China (Zhang et al., 2024), SOA are predominantly liquid or have low viscosities (<104 Pa s); in central and northeastern China, SOA typically exhibit semi-solid viscosities (105−108 Pa s); while highly viscous or glassy SOA (η>108 Pa s) are mainly present in the northwest. Although SOA viscosity may significantly increase by several orders of magnitude as water content (and consequently aerosol water activity) decreases (Hosny et al., 2016; Renbaum-Wolff et al., 2013; Saukko et al., 2012; Song et al., 2016a; Yli-Juuti et al., 2017), SOA tend to become more oxidized and internally mixed with secondary inorganic aerosols during atmospheric aging. This aging process significantly lowers the overall viscosity of SOA due to the greater hygroscopicity of more oxygenated organics and inorganic salts (Dette and Koop, 2015). Consequently, in more developed and urbanized regions like southern and northeastern China, atmospheric aerosols are more likely to undergo efflorescence and crystallization, leading to hysteresis in aerosol size and water contents during humidification and dehumidification processes. From a broader atmospheric perspective, the implications of aerosol phase state should be considered on regional to global scales. Shiraiwa et al. (2017) showed that SOA phase state varies strongly with relative humidity and temperature, with SOA in the planetary boundary layer being predominantly liquid in humid tropical and polar regions, semi-solid in mid-latitudes, and solid over dry lands, while SOA in the middle and upper troposphere are expected to be mostly glassy. The hysteresis induced by aerosol efflorescence has important implications for modeling aerosol size evolution, optical properties, and chemical reactivity.
It is important to note that the aerosol viscosities in this study were derived from thermodynamic model predictions, as in-situ measurement techniques for atmospheric aerosol viscosity remain largely unavailable. Although substrate-based methods – such as poke-flow cytometry and fluorescence lifetime imaging microscopy (FLIM) – have been successfully employed to determine SOA viscosity under laboratory conditions, substrate effects must be carefully considered (Grayson et al., 2015; Hosny et al., 2013). This highlights an urgent need to develop techniques that can directly measure aerosol viscosity at a given RH in ambient environments and to validate viscosity-dependent phase transition predictions. Optical tweezers is a promising tool for quantitative viscosity measurements of levitated particles; however, the technique requires further advancement to measure submicron organic aerosols in real atmospheric conditions (Reid et al., 2014). Analyses in this study suggest a possible contribution of viscosity, particularly at RH values relevant to efflorescence, but the available evidence is not sufficiently conclusive to establish such a relationship. Therefore, whether viscosity can ultimately serve as a more direct mechanistic predictor of ERH remains an important topic for future investigation. Furthermore, quantitative evaluation is needed to assess the extent to which viscosity-based predictive tools for aerosol phase state influence simulations of climate and air quality.
The data supporting this article have been included in the main text and as part of the Supplement: Tables S1–S12, Fig. S1–S8.
The supplement related to this article is available online at https://doi.org/10.5194/acp-26-9967-2026-supplement.
SC and QH analyzed and visualized the data and wrote the original draft. SC conducted the experiments and model calculations. QH created the original research framework. QH and YL reviewed and edited the paper. QH, PL, and YHZ supervised the study. All authors discussed the results and contributed to the article editing.
The contact author has declared that none of the authors has any competing interests.
Publisher's note: Copernicus Publications remains neutral with regard to jurisdictional claims made in the text, published maps, institutional affiliations, or any other geographical representation in this paper. The authors bear the ultimate responsibility for providing appropriate place names. Views expressed in the text are those of the authors and do not necessarily reflect the views of the publisher.
We gratefully acknowledge the foundational model developed by Andreas Zuend, which served as an essential tool for our viscosity calculations. We thank Ying Li for providing feedback on an earlier draft of the manuscript. We also thank Thomas Koop for assisting us on the Tg calculation. During the preparation of this work the authors used Generative Pretrained Transformer 4 (GPT-4) to detect and correct grammatical errors in the draft. After using this tool/service, the authors reviewed and edited the content as needed and take full responsibility for the content of the publication.
This research has been supported by the National Natural Science Foundation of China, Youth Science Fund Project (grant-nos. 22406010, 42127806, and 42075110).
This paper was edited by Chiara Giorio and reviewed by six anonymous referees.
Armeli, G., Peters, J.-H., and Koop, T.: Machine-learning-based prediction of the glass transition temperature of organic compounds using experimental data, ACS Omega, 8, 12298–12309, https://doi.org/10.1021/acsomega.2c08146, 2023.
Berkemeier, T., Steimer, S. S., Krieger, U. K., Peter, T., Pöschl, U., Ammann, M., and Shiraiwa, M.: Ozone uptake on glassy, semi-solid and liquid organic matter and the role of reactive oxygen intermediates in atmospheric aerosol chemistry, Phys. Chem. Chem. Phys., 18, 12662–12674, https://doi.org/10.1039/C6CP00634E, 2016.
Bertram, A. K., Martin, S. T., Hanna, S. J., Smith, M. L., Bodsworth, A., Chen, Q., Kuwata, M., Liu, A., You, Y., and Zorn, S. R.: Predicting the relative humidities of liquid-liquid phase separation, efflorescence, and deliquescence of mixed particles of ammonium sulfate, organic material, and water using the organic-to-sulfate mass ratio of the particle and the oxygen-to-carbon elemental ratio of the organic component, Atmos. Chem. Phys., 11, 10995–11006, https://doi.org/10.5194/acp-11-10995-2011, 2011.
Boreddy, S. K. R., Kawamura, K., Mkoma, S., and Fu, P.: Hygroscopic behavior of water-soluble matter extracted from biomass burning aerosols collected at a rural site in Tanzania, East Africa, J. Geophys. Res.-Atmos., 119, 12233–12245, https://doi.org/10.1002/2014JD021546, 2014.
Bouzidi, H., Fayad, L., Coeur, C., Houzel, N., Petitprez, D., Faccinetto, A., Wu, J., Tomas, A., Ondráček, J., Schwarz, J., Ždímal, V., and Zuend, A.: Hygroscopic growth and CCN activity of secondary organic aerosol produced from dark ozonolysis of γ-terpinene, Sci. Total Environ., 817, 153010, https://doi.org/10.1016/j.scitotenv.2022.153010, 2022.
Braban, C. F. and Abbatt, J. P. D.: A study of the phase transition behavior of internally mixed ammonium sulfate – malonic acid aerosols, Atmos. Chem. Phys., 4, 1451–1459, https://doi.org/10.5194/acp-4-1451-2004, 2004.
Cai, C., Luan, Y.-M., Shi, X.-M., and Zhang, Y.: (NH4)2SO4 heterogeneous nucleation and glycerol evaporation of (NH4)2SO4-glycerol system in its dynamic efflorescence process, Chem. Phys., 483, 140–148, https://doi.org/10.1016/j.chemphys.2016.12.003, 2017.
Chang, P.: Study on single aerosol particle by spontaneous and stimulated Raman spectroscopy, PhD Dissertation, Beijing Institute of Technology, http://10.0.7.53:88/urmp/xwlwindex/index/detail_paper.do?RUID=15b6fd2a7205000&dmcode=870000&cxsid=xwlw (last access: 15 December 2025), 2020.
Choi, M. Y. and Chan, C. K.: The effects of organic species on the hygroscopic behaviors of inorganic aerosols, Environ. Sci. Technol., 36, 2422–2428, https://doi.org/10.1021/es0113293, 2002.
Ciobanu, V. G., Marcolli, C., Krieger, U. K., Zuend, A., and Peter, T.: Efflorescence of ammonium sulfate and coated ammonium sulfate particles: evidence for surface nucleation, J. Phys. Chem. A, 114, 9486–9495, https://doi.org/10.1021/jp103541w, 2010.
Cohen, M. D., Flagan, R. C., and Seinfeld, J. H.: Studies of concentrated electrolyte solutions using the electrodynamic balance. 3. Solute nucleation, J. Phys. Chem., 91, 4583–4590, https://doi.org/10.1021/j100301a031, 1987.
Davis, R. D., Lance, S., Gordon, J. A., Ushijima, S. B., and Tolbert, M. A.: Contact efflorescence as a pathway for crystallization of atmospherically relevant particles, P. Natl. Acad. Sci. USA, 112, 15815–15820, https://doi.org/10.1073/pnas.1522860113, 2015.
DeRieux, W.-S. W., Li, Y., Lin, P., Laskin, J., Laskin, A., Bertram, A. K., Nizkorodov, S. A., and Shiraiwa, M.: Predicting the glass transition temperature and viscosity of secondary organic material using molecular composition, Atmos. Chem. Phys., 18, 6331–6351, https://doi.org/10.5194/acp-18-6331-2018, 2018.
Dette, H. P. and Koop, T.: Glass formation processes in mixed inorganic/organic aerosol particles, J. Phys. Chem. A, 119, 4552–4561, https://doi.org/10.1021/jp5106967, 2015.
Donahue, N. M., Epstein, S. A., Pandis, S. N., and Robinson, A. L.: A two-dimensional volatility basis set: 1. organic-aerosol mixing thermodynamics, Atmos. Chem. Phys., 11, 3303–3318, https://doi.org/10.5194/acp-11-3303-2011, 2011.
Fan, J., Comstock, J. M., and Ovchinnikov, M.: The cloud condensation nuclei and ice nuclei effects on tropical anvil characteristics and water vapor of the tropical tropopause layer, Environ. Res. Lett., 5, 044005, https://doi.org/10.1088/1748-9326/5/4/044005, 2010.
Fard, M. M., Krieger, U. K., and Peter, T.: Shortwave radiative impact of liquid–liquid phase separation in brown carbon aerosols, Atmos. Chem. Phys., 18, 13511–13530, https://doi.org/10.5194/acp-18-13511-2018, 2018.
Fitzgerald, C., Hosny, N. A., Tong, H., Seville, P. C., Gallimore, P. J., Davidson, N. M., Athanasiadis, A., Botchway, S. W., Ward, A. D., Kalberer, M., Kuimova, M. K., and Pope, F. D.: Fluorescence lifetime imaging of optically levitated aerosol: a technique to quantitatively map the viscosity of suspended aerosol particles, Phys. Chem. Chem. Phys., 18, 21710–21719, https://doi.org/10.1039/c6cp03674k, 2016.
Fredenslund, A., Jones, R. L., and Prausnitz, J. M.: Group-contribution estimation of activity coefficients in nonideal liquid mixtures, AIChE J., 21, 1086–1099, https://doi.org/10.1002/aic.690210607, 1975.
Freedman, M. A., Huang, Q., and Pitta, K. R.: Phase transitions in organic and organic/inorganic aerosol particles, Annu. Rev. Phys. Chem., 75, 257–281, https://doi.org/10.1146/annurev-physchem-083122-115909, 2024.
Galeazzo, T. and Shiraiwa, M.: Predicting glass transition temperature and melting point of organic compounds via machine learning and molecular embeddings, Environ. Sci.: Atmos., 2, 362–374, https://doi.org/10.1039/D1EA00090J, 2022.
Gervasi, N. R., Topping, D. O., and Zuend, A.: A predictive group-contribution model for the viscosity of aqueous organic aerosol, Atmos. Chem. Phys., 20, 2987–3008, https://doi.org/10.5194/acp-20-2987-2020, 2020.
Ghorai, S., Wang, B., Tivanski, A., and Laskin, A.: Hygroscopic properties of internally mixed particles composed of NaCl and water-soluble organic acids, Environ. Sci. Technol., 48, 2234–2241, https://doi.org/10.1021/es404727u, 2014.
Gordon, M. and Taylor, J. S.: Ideal copolymers and the second-order transitions of synthetic rubbers, I. non-crystalline copolymers, J. Appl. Chem., 2, 493–500, https://doi.org/10.1002/jctb.5010020901, 1952.
Grayson, J. W., Song, M., Sellier, M., and Bertram, A. K.: Validation of the poke-flow technique combined with simulations of fluid flow for determining viscosities in samples with small volumes and high viscosities, Atmos. Meas. Tech., 8, 2463–2472, https://doi.org/10.5194/amt-8-2463-2015, 2015.
Guo, Y., Wang, N., Pang, S., and Zhang, Y.: Hygroscopic properties and compositional evolution of internally mixed sodium nitrate-amino acid aerosols, Atmos. Environ., 242, 117848, https://doi.org/10.1016/j.atmosenv.2020.117848, 2020.
Gupta, D., Kim, H., Park, G., Li, X., Eom, H.-J., and Ro, C.-U.: Hygroscopic properties of NaCl and NaNO3 mixture particles as reacted inorganic sea-salt aerosol surrogates, Atmos. Chem. Phys., 15, 3379–3393, https://doi.org/10.5194/acp-15-3379-2015, 2015.
Hallquist, M., Wenger, J. C., Baltensperger, U., Rudich, Y., Simpson, D., Claeys, M., Dommen, J., Donahue, N. M., George, C., Goldstein, A. H., Hamilton, J. F., Herrmann, H., Hoffmann, T., Iinuma, Y., Jang, M., Jenkin, M. E., Jimenez, J. L., Kiendler-Scharr, A., Maenhaut, W., McFiggans, G., Mentel, Th. F., Monod, A., Prévôt, A. S. H., Seinfeld, J. H., Surratt, J. D., Szmigielski, R., and Wildt, J.: The formation, properties and impact of secondary organic aerosol: current and emerging issues, Atmos. Chem. Phys., 9, 5155–5236, https://doi.org/10.5194/acp-9-5155-2009, 2009.
Hansen, H. K., Rasmussen, P., Fredenslund, A., Schiller, M., and Gmehling, J.: Vapor–liquid equilibria by UNIFAC group contribution. 5. Revision and extension, Ind. Eng. Chem. Res., 30, 2352–2355, https://doi.org/10.1021/ie00058a017, 1991.
Hodas, N., Zuend, A., Schilling, K., Berkemeier, T., Shiraiwa, M., Flagan, R. C., and Seinfeld, J. H.: Discontinuities in hygroscopic growth below and above water saturation for laboratory surrogates of oligomers in organic atmospheric aerosols, Atmos. Chem. Phys., 16, 12767–12792, https://doi.org/10.5194/acp-16-12767-2016, 2016.
Hollomon, J. H. and Turnbull, D.: Nucleation, Prog. Met. Phys., 4, 333–388, https://doi.org/10.1016/0502-8205(53)90020-3, 1953.
Hosny, N. A., Fitzgerald, C., Tong, C., Kalberer, M., Kuimova, M. K., and Pope, F. D.: Fluorescent lifetime imaging of atmospheric aerosols: a direct probe of aerosol viscosity, Faraday Discuss., 165, 343–356, https://doi.org/10.1039/C3FD00041A, 2013.
Hosny, N. A., Fitzgerald, C., Vyšniauskas, A., Athanasiadis, A., Berkemeier, T., Uygur, N., Pöschl, U., Shiraiwa, M., Kalberer, M., Pope, F. D., and Kuimova, M. K.: Direct imaging of changes in aerosol particle viscosity upon hydration and chemical aging, Chem. Sci., 7, 1357–1367, https://doi.org/10.1039/C5SC02959G, 2016.
Hu, S., Fan, R., Wu, L., Li, Y., Zhang, B., Yuan, Z., Li, Q., Ma, S., Zhao, Z., and Xu, T.: Influence of amorphous humic acid solids on the phase transition behavior of nitrate aerosols, J. Phys. Chem. A, 129, 5617–5627, https://doi.org/10.1021/acs.jpca.5c03039, 2025.
Huang, Q., Pitta, K. R., Constantini, K., Ott, E.-J. E., Zuend, A., and Freedman, M. A.: Experimental phase diagram and its temporal evolution for submicron 2-methylglutaric acid and ammonium sulfate aerosol particles, Phys. Chem. Chem. Phys., 26, 2887–2894, https://doi.org/10.1039/D3CP04411D, 2024.
Ji, Z.-R., Zhang, Y., Pang, S.-F., and Zhang, Y.-H.: Crystal nucleation and crystal growth and mass transfer in internally mixed sucrose/NaNO3 particles, J. Phys. Chem. A, 121, 7968–7975, https://doi.org/10.1021/acs.jpca.7b08004, 2017.
Kelton, K. F., Greer, A. L., and Thompson, C. V.: Transient nucleation in condensed systems, J. Chem. Phys., 79, 6261–6276, https://doi.org/10.1063/1.445731, 1983.
Knopf, D. A. and Alpert, P. A.: Atmospheric ice nucleation, Nat. Rev. Phys., 5, 203–217, https://doi.org/10.1038/s42254-023-00570-7, 2023.
Kohl, I., Bachmann, L., Hallbrucker, A., Mayer, E., and Loerting, T.: Liquid-like relaxation in hyperquenched water at≤140 K, Phys. Chem. Chem. Phys., 7, 3210–3220, https://doi.org/10.1039/B507651J, 2005.
Koop, T., Bookhold, J., Shiraiwa, M., and Pöschl, U.: Glass transition and phase state of organic compounds: dependency on molecular properties and implications for secondary organic aerosols in the atmosphere, Phys. Chem. Chem. Phys., 13, 19238–19255, https://doi.org/10.1039/C1CP22617G, 2011.
Kuwata, M. and Martin, S. T.: Phase of atmospheric secondary organic material affects its reactivity, P. Natl. Acad. Sci. USA, 109, 17354–17359, https://doi.org/10.1073/pnas.1209071109, 2012.
Laskina, O., Morris, H. S., Grandquist, J. R., Qin, Z., Stone, E. A., Tivanski, A. V., and Grassian, V. H.: Size matters in the water uptake and hygroscopic growth of atmospherically relevant multicomponent aerosol particles, J. Phys. Chem. A, 119, 4489–4497, https://doi.org/10.1021/jp510268p, 2015.
Li, Y., Pöschl, U., and Shiraiwa, M.: Molecular corridors and parameterizations of volatility in the chemical evolution of organic aerosols, Atmos. Chem. Phys., 16, 3327–3344, https://doi.org/10.5194/acp-16-3327-2016, 2016.
Li, Y., Day, D. A., Stark, H., Jimenez, J. L., and Shiraiwa, M.: Predictions of the glass transition temperature and viscosity of organic aerosols from volatility distributions, Atmos. Chem. Phys., 20, 8103–8122, https://doi.org/10.5194/acp-20-8103-2020, 2020.
Lilek, J. and Zuend, A.: A predictive viscosity model for aqueous electrolytes and mixed organic–inorganic aerosol phases, Atmos. Chem. Phys., 22, 3203–3233, https://doi.org/10.5194/acp-22-3203-2022, 2022.
Ma, S., Pang, S., Li, J., and Zhang, Y.: A review of efflorescence kinetics studies on atmospherically relevant particles, Chemosphere, 277, 130320, https://doi.org/10.1016/j.chemosphere.2021.130320, 2021a.
Ma, S., Chen, Z., Pang, S., and Zhang, Y.: Observations on hygroscopic growth and phase transitions of mixed 1, 2, 6−hexanetriol ∕ (NH4)2SO4 particles: investigation of the liquid–liquid phase separation (LLPS) dynamic process and mechanism and secondary LLPS during the dehumidification, Atmos. Chem. Phys., 21, 9705–9717, https://doi.org/10.5194/acp-21-9705-2021, 2021b.
Marcolli, C. and Krieger, U. K.: Phase changes during hygroscopic cycles of mixed organic/inorganic model systems of tropospheric aerosols, J. Phys. Chem. A, 110, 1881–1893, https://doi.org/10.1021/jp0556759, 2006.
Mikhailov, E., Vlasenko, S., Martin, S. T., Koop, T., and Pöschl, U.: Amorphous and crystalline aerosol particles interacting with water vapor: conceptual framework and experimental evidence for restructuring, phase transitions and kinetic limitations, Atmos. Chem. Phys., 9, 9491–9522, https://doi.org/10.5194/acp-9-9491-2009, 2009.
Novo, N., Carotenuto, A., Mensitieri, G., Fraldi, M., and Pugno, N.: Modeling of virus survival time in respiratory droplets on surfaces: a new rational approach for antivirus strategies, Frontiers in Materials, 8, 631723, https://doi.org/10.3389/fmats.2021.631723, 2021.
Oswin, H. P., Haddrell, A. E., Otero-Fernandez, M., Mann, J. F. S., Cogan, T. A., Hilditch, T. G., Tian, J., Hardy, D., Hill, D. J., Finn, A., Davidson, A. D., and Reid, J. P.: Reply to Klein et al.: the importance of aerosol pH for airborne respiratory virus transmission, P. Natl. Acad. Sci. USA, 119, e2212556119, https://doi.org/10.1073/pnas.2212556119, 2022.
Parsons, M. T., Knopf, D. A., and Bertram, A. K.: Deliquescence and crystallization of ammonium sulfate particles internally mixed with water-soluble organic compounds, J. Phys. Chem. A, 108, 11600–11608, https://doi.org/10.1021/jp0462862, 2004.
Pöschl, U.: Atmospheric aerosols: composition, transformation, climate and health effects, Angew. Chem. Int. Edit., 44, 7520–7540, https://doi.org/10.1002/anie.200501122, 2005.
Raes, F.: Formation and cycling of aerosols in the global troposphere, Atmos. Environ., 34, 4215–4240, https://doi.org/10.1016/S1352-2310(00)00239-9, 2000.
Reid, J. P., Power, R. M., Cai, C., Zhang, C., Mcgloin, D., and Mazilu, M.: Micro-rheology and interparticle interactions in aerosols probed with optical tweezers, P. Soc. Photo.-Opt. Ins., XI, 91641W, https://doi.org/10.1117/12.2061018, 2014.
Reid, J. P., Bertram, A. K., Topping, D. O., Laskin, A., Martin, S. T., Petters, M. D., Pope, F. D., and Rovelli, G.: The viscosity of atmospherically relevant organic particles, Nat. Commun., 9, 956, https://doi.org/10.1038/s41467-018-03027-z, 2018.
Renbaum-Wolff, L., Grayson, J. W., Bateman, A. P., Kuwata, M., Sellier, M., Murray, B. J., Shilling, J. E., Martin, S. T., and Bertram, A. K.: Viscosity of α -pinene secondary organic material and implications for particle growth and reactivity, P. Natl. Acad. Sci. USA, 110, 8014–8019, https://doi.org/10.1073/pnas.1219548110, 2013.
Saukko, E., Lambe, A. T., Massoli, P., Koop, T., Wright, J. P., Croasdale, D. R., Pedernera, D. A., Onasch, T. B., Laaksonen, A., Davidovits, P., Worsnop, D. R., and Virtanen, A.: Humidity-dependent phase state of SOA particles from biogenic and anthropogenic precursors, Atmos. Chem. Phys., 12, 7517–7529, https://doi.org/10.5194/acp-12-7517-2012, 2012.
Sheldon, C. S., Salazar, J., Palacios Diaz, T., Morton, K., Davis, R. D., and Davies, J. F.: Correlating the viscosity and rate of water diffusion in semisolid gel-forming aerosol particles, ACS Earth Space Chem., 7, 2311–2320, https://doi.org/10.1021/acsearthspacechem.3c00241, 2023.
Shi, X.-M., Wu, F.-M., Jing, B., Wang, N., Xu, L.-L., Pang, S.-F., and Zhang, Y.-H.: Hygroscopicity of internally mixed particles composed of (NH4)2SO4 and citric acid under pulsed RH change, Chemosphere, 188, 532–540, https://doi.org/10.1016/j.chemosphere.2017.09.024, 2017.
Shiraiwa, M., Zuend, A., Bertram, A. K., and Seinfeld, J. H.: Gas-article partitioning of atmospheric aerosols: interplay of physical state, non-ideal mixing and morphology, Phys. Chem. Chem. Phys., 15, 11441–11453, https://doi.org/10.1039/C3CP51595H, 2013.
Shiraiwa, M., Li, Y., Tsimpidi, A. P., Karydis, V. A., Berkemeier, T., Pandis, S. N., Lelieveld, J., Koop, T., and Pöschl, U.: Global distribution of particle phase state in atmospheric secondary organic aerosols, Nat. Commun., 8, 15002, https://doi.org/10.1038/ncomms15002, 2017.
Shrivastava, M., Cappa, C. D., Fan, J., Goldstein, A. H., Guenther, A. B., Jimenez, J. L., Kuang, C., Laskin, A., Martin, S. T., Ng, N. L., Petaja, T., Pierce, J. R., Rasch, P. J., Roldin, P., Seinfeld, J. H., Shilling, J., Smith, J. N., Thornton, J. A., Volkamer, R., Wang, J., Worsnop, D. R., Zaveri, R. A., Zelenyuk, A., and Zhang, Q.: Recent advances in understanding secondary organic aerosol: Implications for global climate forcing, Rev. Geophys., 55, 509–559, https://doi.org/10.1002/2016RG000540, 2017.
Smith, J. N., Draper, D. C., Chee, S., Dam, M., Glicker, H., Myers, D., Thomas, A. E., Lawler, M. J., and Myllys, N.: Atmospheric clusters to nanoparticles: Recent progress and challenges in closing the gap in chemical composition, J. Aerosol Sci., 153, 105733, https://doi.org/10.1016/j.jaerosci.2020.105733, 2021.
Song, M., Liu, P. F., Hanna, S. J., Zaveri, R. A., Potter, K., You, Y., Martin, S. T., and Bertram, A. K.: Relative humidity-dependent viscosity of secondary organic material from toluene photo-oxidation and possible implications for organic particulate matter over megacities, Atmos. Chem. Phys., 16, 8817–8830, https://doi.org/10.5194/acp-16-8817-2016, 2016a.
Song, Y. C., Haddrell, A. E., Bzdek, B. R., Reid, J. P., Bannan, T., Topping, D. O., Percival, C., and Cai, C.: Measurements and predictions of binary component aerosol particle viscosity, J. Phys. Chem. A, 120, 8123–8137, https://doi.org/10.1021/acs.jpca.6b07835, 2016b.
Song, Y.-C., Lilek, J., Lee, J. B., Chan, M. N., Wu, Z., Zuend, A., and Song, M.: Viscosity and phase state of aerosol particles consisting of sucrose mixed with inorganic salts, Atmos. Chem. Phys., 21, 10215–10228, https://doi.org/10.5194/acp-21-10215-2021, 2021.
Sun, J., Hu, Y., Cao, X., Pang, S.-F., Liu, P., Huang, Q., and Zhang, Y.-H.: Role of WSOCs and pH on ammonium nitrate aerosol efflorescence: insights into secondary aerosol formation, Environ. Sci. Technol., 57, 20074–20084, https://doi.org/10.1021/acs.est.3c07603, 2023.
Tong, H.-J., Reid, J. P., Bones, D. L., Luo, B. P., and Krieger, U. K.: Measurements of the timescales for the mass transfer of water in glassy aerosol at low relative humidity and ambient temperature, Atmos. Chem. Phys., 11, 4739–4754, https://doi.org/10.5194/acp-11-4739-2011, 2011.
Turnbull, D.: Under what conditions can a glass be formed?, Contemp. Phys., 10, 473–488, https://doi.org/10.1080/00107516908204405, 1969.
Ushijima, S. B., Huynh, E., Davis, R. D., and Tolbert, M. A.: Seeded crystal growth of internally mixed organic–inorganic aerosols: impact of organic phase state, J. Phys. Chem. A, 125, 8668–8679, https://doi.org/10.1021/acs.jpca.1c04471, 2021.
Virtanen, A., Joutsensaari, J., Koop, T., Kannosto, J., Yli-Pirilä, P., Leskinen, J., Mäkelä, J. M., Holopainen, J. K., Pöschl, U., Kulmala, M., Worsnop, D. R., and Laaksonen, A.: An amorphous solid state of biogenic secondary organic aerosol particles, Nature, 467, 824–827, https://doi.org/10.1038/nature09455, 2010.
Wang, L.-N., Cai, C., and Zhang, Y.-H.: Kinetically determined hygroscopicity and efflorescence of sucrose-ammonium sulfate aerosol droplets under lower relative humidity, J. Phys. Chem. B, 121, 8551–8557, https://doi.org/10.1021/acs.jpcb.7b05551, 2017.
Wang, X.: Study on the hygroscopicity of mixed aerosols composed of organic acids and inorganic salts by Raman spectroscopy, PhD Dissertation, Beijing Institute of Technology, http://10.0.7.53:88/urmp/xwlwindex/index/detail_paper.do?RUID=22ad63060003a0c351&dmcode=870000&cxsid=xwlw (last access: 12 December 2025), 2018.
Wu, F.: Thermodynamics and Kinetics Research of Mixed Inorganic/Glutaric acid Aerosols in the Hygroscopic Process, PhD Dissertation, Beijing Institute of Technology, http://10.0.7.53:88/urmp/xwlwindex/index/detail_paper.do?RUID=20d6b9b900036cc351&dmcode=870000&cxsid=xwlw (last access: 15 December 2025), 2017.
Xu, Y., Liu, P., Ma, S., Pei, W., Pang, S., and Zhang, Y.: Efflorescence kinetics of aerosols comprising internally-mixed ammonium sulfate and water-soluble organic compounds, Atmos. Environ., 274, 119007, https://doi.org/10.1016/j.atmosenv.2022.119007, 2022.
Yli-Juuti, T., Pajunoja, A., Tikkanen, O.-P., Buchholz, A., Faiola, C., Väisänen, O., Hao, L., Kari, E., Peräkylä, O., Garmash, O., Shiraiwa, M., Ehn, M., Lehtinen, K., and Virtanen, A.: Factors controlling the evaporation of secondary organic aerosol from α-pinene ozonolysis, Geophys. Res. Lett., 44, 2562–2570, https://doi.org/10.1002/2016GL072364, 2017.
Yu, J.-Y., Zhang, Y., Zeng, G., Zheng, C.-M., Liu, Y., and Zhang, Y.-H.: Suppression of NaNO3 crystal nucleation by glycerol: micro-raman observation on the efflorescence process of mixed glycerol/NaNO3/water droplets, J. Phys. Chem. B, 116, 1642–1650, https://doi.org/10.1021/jp210824e, 2012.
Yu, Z., Jang, M., and Madhu, A.: Prediction of phase state of secondary organic aerosol internally mixed with aqueous inorganic salts, J. Phys. Chem. A, 125, 10198–10206, https://doi.org/10.1021/acs.jpca.1c06773, 2021.
Zhang, R., Khalizov, A., Wang, L., Hu, M., and Xu, W.: Nucleation and growth of nanoparticles in the atmosphere, Chem. Rev., 112, 1957–2011, https://doi.org/10.1021/cr2001756, 2012.
Zhang, Y., Nichman, L., Spencer, P., Jung, J. I., Lee, A., Heffernan, B. K., Gold, A., Zhang, Z., Chen, Y., Canagaratna, M. R., Jayne, J. T., Worsnop, D. R., Onasch, T. B., Surratt, J. D., Chandler, D., Davidovits, P., and Kolb, C. E.: The cooling rate-and volatility-dependent glass-forming properties of organic aerosols measured by broadband dielectric spectroscopy, Environ. Sci. Technol., 53, 12366–12378, https://doi.org/10.1021/acs.est.9b03317, 2019.
Zhang, Z., Li, Y., Ran, H., An, J., Qu, Y., Zhou, W., Xu, W., Hu, W., Xie, H., Wang, Z., Sun, Y., and Shiraiwa, M.: Simulated phase state and viscosity of secondary organic aerosols over China, Atmos. Chem. Phys., 24, 4809–4826, https://doi.org/10.5194/acp-24-4809-2024, 2024.
Zobrist, B., Marcolli, C., Pedernera, D. A., and Koop, T.: Do atmospheric aerosols form glasses?, Atmos. Chem. Phys., 8, 5221–5244, https://doi.org/10.5194/acp-8-5221-2008, 2008.
Zobrist, B., Soonsin, V., Luo, B. P., Krieger, U. K., Marcolli, C., Peter, T., and Koop, T.: Ultra-slow water diffusion in aqueous sucrose glasses, Phys. Chem. Chem. Phys., 13, 3514–3526, https://doi.org/10.1039/C0CP01273D, 2011.
Zuend, A., Marcolli, C., Luo, B. P., and Peter, T.: A thermodynamic model of mixed organic-inorganic aerosols to predict activity coefficients, Atmos. Chem. Phys., 8, 4559–4593, https://doi.org/10.5194/acp-8-4559-2008, 2008.
Zuend, A., Marcolli, C., Booth, A. M., Lienhard, D. M., Soonsin, V., Krieger, U. K., Topping, D. O., McFiggans, G., Peter, T., and Seinfeld, J. H.: New and extended parameterization of the thermodynamic model AIOMFAC: calculation of activity coefficients for organic-inorganic mixtures containing carboxyl, hydroxyl, carbonyl, ether, ester, alkenyl, alkyl, and aromatic functional groups, Atmos. Chem. Phys., 11, 9155–9206, https://doi.org/10.5194/acp-11-9155-2011, 2011.