
the Creative Commons Attribution 4.0 License.
the Creative Commons Attribution 4.0 License.
 | 15 Jul 2026
Refining simulated mineral dust composition through modified size distributions: dual validation with mineral-specific and elemental observations
Sofía Gómez Maqueo Anaya
Sudharaj Aryasree
Konrad Kandler
Eduardo José dos Santos Souza
Khanneh Wadinga Fomba
Dietrich Althausen
Maria Kezoudi
Matthias Faust
Bernd Heinold
Ina Tegen
Moritz Haarig
Holger Baars
Kerstin Schepanski
Two 2022 measurement campaigns in Cape Verde provided a unique opportunity to collect mineral dust aerosols from multiple Saharan source regions and characterize their composition. Mineral dust aerosols comprise a complex assemblage of minerals with distinct physico-chemical properties and differentiated climatic impacts through interactions with radiation, cloud microphysics, and atmospheric chemistry. A crucial physical property governing these interactions is the particle size distribution (PSD), influencing aerosol optical properties, transport, and deposition. Although contemporary atmospheric models have begun integrating mineralogical data into their dust aerosol representations, implementation faces complications due to variations in dust emission parameterizations, making compatibility with soil mineralogical databases model-dependent.
This work addresses the challenges encountered when incorporating mineralogical information into the COSMO5.05-MUSCAT atmospheric model, which employs the Marticorena and Bergametti (1995) dust emission scheme. We present an improved approach that refines the translation of mineralogical soil PSDs into emitted aerosol PSDs. This improved approach is evaluated using historical Saharan dust measurements and new mineralogical observations from the JATAC2022 and DUSTRISK2022 campaigns. Model performance is assessed using a dual validation framework considering both mineral-resolved and elemental composition. The elemental validation provides additional constraints on model performance, exposing biases in composition that mineral-only comparisons may obscure due to the aggregate nature of mineral dust particles. Results indicate that the proposed modification substantially improves representation of phyllosilicates (illite, kaolinite, and smectite), quartz, and feldspar, while biases in iron, calcium, and magnesium highlight fundamental challenges in representing the heterogeneous internal structure of natural dust particles.
- Article
(7006 KB) - Full-text XML
- BibTeX
- EndNote


Mineral dust aerosol is the most abundant atmospheric aerosol type by mass (Kinne et al., 2006) and exerts widespread influence on the Earth system. By scattering and absorbing solar and terrestrial radiation, dust modifies atmospheric heating rates, alters cloud microphysical processes, and perturbs the surface energy balance (Stocker et al., 2013; Kok et al., 2023). Despite this recognized role, large uncertainties remain in quantifying the net radiative forcing by dust. These uncertainties arise from the complex variability of dust properties during emission and transport, including particle size distribution (PSD), morphology, mixing state, and mineralogical composition (Huneeus et al., 2011; Mahowald et al., 2014, 2026; Di Biagio et al., 2020).
Mineralogical composition has emerged as a key factor in constraining dust–climate interactions. Different minerals govern how dust interacts with radiation, clouds, and other atmospheric constituents. For instance, small variations in the abundance of iron oxide-bearing minerals can strongly amplify shortwave absorption and alter dust's radiative properties (Balkanski et al., 2007; Gómez Maqueo Anaya et al., 2025; Li et al., 2024; Miffre et al., 2023; Obiso et al., 2024; Sokolik and Toon, 1999; Zhang et al., 2024), while silicate minerals differ in their potential to act as ice-nucleating particles (INPs) or cloud condensation nuclei (CCN) under varying conditions (Chatziparaschos et al., 2023; Harrison et al., 2019; Kelly et al., 2007; Murray et al., 2012). Yet, most chemistry transport models treat dust as homogeneous with respect to its composition, neglecting the strong spatial and temporal variability of mineral fractions. This simplification introduces biases in estimates of dust absorption, cloud interactions, and downstream impacts such as nutrient deposition (Kok et al., 2023).
Incorporating mineralogical detail into models is therefore essential, but it depends critically on how the PSD of individual minerals in soils is represented. The PSD controls not only transport and deposition but also the mineral dust particles' interaction with radiation. A central challenge is that the PSD of airborne dust does not directly reflect the PSD of the parent soil: during emission, processes such as soil texture effects, interparticle cohesion, wind friction velocity, and fragmentation and saltation dynamics reshape the particle size distribution (Marticorena and Bergametti, 1995; Kok, 2011). These nonlinear processes lead to size-dependent shifts in mineralogical composition, making the link between soil and atmospheric mineralogy far from trivial.
The particle size distribution of mineral dust fundamentally governs its atmospheric residence time and transport dynamics. Coarse-grained minerals such as quartz, feldspars, and calcite tend to be removed quickly by gravitational settling, resulting in higher concentrations near source regions. In contrast, finer clay-sized phyllosilicates, defined herein as the group of illite, kaolinite, and smectite, remain suspended for longer periods and thus constitute a major fraction of the dust transported to remote areas (Lawrence and Neff, 2009).
Despite the importance of these size-dependent dynamics, the Soil Mineral Atlases (SMAs), a generic term for databases describing the mineralogical composition of soils that are currently employed in atmospheric models, rely on a simplified classification of soil mineralogy into only two size fractions, clay (defined as particles with diameters up to 2.5 µm) and silt (particles with diameters between 2.5–50 µm) (diameter size ranges follow the convention used by Nickovic et al., 2012). This framework introduces structural uncertainties and subsequent biases in model simulations. A notable consequence of this resolution limit is the representation of quartz; by assuming a constant mineral proportion across broad size ranges, models fail to capture the size-dependent distributions observed in empirical studies (Kandler et al., 2007, 2009; Panta et al., 2023). This often results in a systematic overestimation of quartz mass fractions in coarser bins and a corresponding underestimation in finer fractions (Perlwitz et al., 2015a, b).
To mitigate these discrepancies, several models have moved toward mineral-specific PSD transformations based on the Brittle Fragmentation Theory (BFT) (Kok, 2011). This approach provides a semi-direct framework for predicting size-resolved emission fluxes (e.g., Gonçalves Ageitos et al., 2023; Menut et al., 2020; Scanza et al., 2015; Perlwitz et al., 2015a). However, a significant number of models continue to rely on the parameterization scheme developed by Marticorena and Bergametti (1995). While robust for bulk soil properties, this scheme cannot directly provide mineral-specific fluxes, particularly when constrained by the incomplete mineralogical information inherent in standard SMAs. Assessing the implications of these contrasting emission strategies is essential for accurate mineral-resolved simulations, yet systematic evaluations of their impact remain limited.
In a previous study, Gómez Maqueo Anaya et al. (2024) implemented a mineralogical composition module for Saharan dust simulations within COSMO5.05-MUSCAT (COnsortium for Small-scale MOdelling v5.05-MUltiScale Chemistry Aerosol Transport). Building on that work, this article addresses a central methodological question: how should the transformation of the PSD from soil to atmosphere be represented within the COSMO5.05-MUSCAT dust emission framework to ensure a realistic reproduction of mineralogy-based dust properties? To this end, we evaluate two PSD transformation approaches based on the Marticorena and Bergametti (1995) emission scheme, coupled with the mineralogical database GMINER (Nickovic et al., 2012).
Specifically, we contrast two modeling schemes, hereafter referred to as the “original” and “modified” approaches. The “original” scheme, following Gómez Maqueo Anaya et al. (2024), maps the mineral soil PSD directly onto the aerosol size distribution. While this method adequately represents clay-sized minerals, it shows marked discrepancies for silt-sized fractions when compared with observations. To improve this representation, the “modified” scheme introduces refinements to the treatment of mineral soil PSD via a redistribution of mineral fractions informed by the application of the BFT. The details of this modification, along with the specific model configurations and experimental runs, are described in Sect. 2.
The performance of the two schemes is assessed against three observational datasets of complementary scope and resolution. First, a compilation of regional North African in-situ aerosol measurements is used to evaluate the geographical variability of mineralogical patterns across Saharan and Sahelian source and deposition regions, providing a broad-scale benchmark for comparing the two schemes. This is followed by comparisons with concurrent in-situ observations from two campaigns in Cabo Verde: the Joint Aeolus Tropical Atlantic Campaign (JATAC, June 2022) and DUSTRISK (January–February 2022). JATAC 2022 provides vertically size-resolved measurements of both mineralogical composition and elemental mass concentrations across multiple altitudes, while DUSTRISK 2022 offers size-segregated elemental mass concentrations, enabling evaluation of the model's chemical tracers from surface sampling. The measurement methodologies, instrumentation for size-segregation, and associated uncertainties for both campaigns are detailed in Sect. 3.
The strategy for model evaluation, including the metrics used for validation and the procedure for comparing grid-cell results to point measurements, is outlined in Sect. 4. Following this, the validation results are presented in two steps: Sect. 5.1 addresses mineralogical composition, beginning with the regional North African compilation and followed by a detailed assessment of the JATAC 2022 results; Sect. 5.2 then evaluates elemental composition against both JATAC 2022 and DUSTRISK 2022 campaigns. Together, these comparisons allows us to assess whether the BFT-informed redistribution effectively bridges the gap between soil mineralogy and airborne dust composition across different transport conditions and measurement methodologies.
2.1 COSMO5.05-MUSCAT
The chemistry transport model used in this study is the MUltiScale Chemistry Aerosol Transport (MUSCAT) coupled online with the COnsortium for Small-scale MOdelling (COSMO) v5.05 model. COSMO, developed by the German Weather Service (Deutscher Wetterdienst, DWD), is a non-hydrostatic regional weather prediction model that solves the fundamental equations of atmospheric dynamics on a terrain-following grid (Baldauf et al., 2011). MUSCAT is the online-coupled chemistry transport component, computing the atmospheric transport of aerosols through time-dependent mass balance equations driven by COSMO meteorological fields (Heinold et al., 2011; Wolke et al., 2012). In this work, mineral dust aerosols are represented as passive tracers, i.e., they are not subject to chemical aging or chemically reactive transformations.
The coupled atmosphere-aerosol model system, COSMO-MUSCAT, has been widely applied and evaluated for Saharan dust studies. Previous validation efforts have demonstrated its capability to reproduce dust source activation, transatlantic transport, and regional dust transport under different meteorological conditions (Heinold et al., 2011; Schepanski et al., 2009; Tegen et al., 2013; Schepanski et al., 2016, 2017). The specific configuration used here has been further evaluated against atmospheric dust loading observations for the North Africa region in Gómez Maqueo Anaya et al. (2024) and Gómez Maqueo Anaya et al. (2025).
The atmospheric life cycle of dust aerosols in MUSCAT is represented through a set of physical parameterizations dynamically coupled to COSMO meteorology and updated at every advection step. The main processes include: (1) dust emission, parameterized following Tegen et al. (2002) with modifications to incorporate mineralogical soil fractions as described in Gómez Maqueo Anaya et al. (2024); (2) aerosol transport, solved using a third-order upwind advection scheme with time-splitting integration (Wolke and Knoth, 2000); and (3) aerosol deposition, accounting for both dry and wet removal processes. Dry deposition is parameterized following the formulations of Seinfeld and Pandis (2016) and Zhang et al. (2001), while wet deposition (including in-cloud scavenging or rainout, and below-cloud scavenging or washout) follows the approaches of Berge (1997) and Jakobsen et al. (1997), with detailed implementation described in Heinold et al. (2011).
2.2 Dust emission scheme
Dust emission is a non-linear process initiated when near-surface wind velocity generate sufficient vertical shear stress at the soil surface to initiate particle mobilization. In COSMO-MUSCAT, threshold friction velocities are calculated following the parameterization of Marticorena and Bergametti (1995), which accounts for size-resolved soil particle mobilization and depends on soil texture, surface roughness, vegetation, and soil moisture.
Emission fluxes are then computed iteratively using the scheme of Tegen et al. (2002), first implemented in COSMO-MUSCAT by Heinold et al. (2007). Fluxes scale with the cube of the wind friction velocity, derived from COSMO-simulated near-surface winds, and are further modulated by vegetation cover and soil moisture. Particle uplift occurs when the effective friction velocity exceeds the size-dependent threshold (), which is controlled by the erodible particle diameter (Dp), the aerodynamic roughness length of the total surface (Z0), and the smoother, erodible fraction roughness length (z0s).
To account for the sheltering effect of roughness elements, a drag partitioning approach is utilized. This method defines an effective friction velocity (), representing the total friction velocity required to mobilize size-dependent particles on a rough surface. It is related to the smooth-surface threshold friction velocity (), which is the threshold required for mobilizing the same particles under idealized, flat, conditions, via:
where feff is the effective drag partition factor (ranging from 0–1). This factor accounts for the reduction in wind erosive potential due to surface roughness and it is calculated following Marticorena and Bergametti (1995) as:
For bare desert surfaces, the aerodynamic roughness length (Z0) is prescribed as 0.001 cm, following the recommendation of Darmenova et al. (2009), while z0s is obtained from global satellite-derived dataset (Prigent et al., 2005). The value of is calculated as a function of particle diameter (Dp), particle density, and air density (ρa), representing a balance between aerodynamic and gravitational forces.
The actual surface friction velocity exerted by the atmosphere (U*) is estimated from COSMO's 10 m wind speed components (u10, v10) and air density. These are combined to determine an effective wind speed at height Z, denoted as U(Z). Assuming adiabatic conditions and a logarithmic wind profile within the boundary layer, U* is calculated as:
where κ=0.4 is the Von Karman's constant, and Z represents the height of the first model layer.
Dust emission is triggered when this surface friction velocity exceeds the size-dependent threshold friction velocity (). This process is further modulated by local soil conditions such as moisture, which is accounted by an additional coefficient in the threshold calculation, following Fécan et al. (1999).
Once the threshold is surpassed, the emitted flux is represented as the horizontal particle flux (G), which scales with the cube of the friction velocity and accounts for the soil particle size distribution:
where g is gravitational acceleration, and Brel−i represents the relative basal surface area of size fraction i. In MUSCAT, the soil is represented by 196 discrete size fractions.
Because the threshold friction velocity does not scale linearly with particle diameter, an accurate representation of the soil size distribution is required. In the Marticorena and Bergametti (1995) parametrization, the soil particle mass size distribution (PSD) is modeled using a multi-modal log-normal distribution:
where j denotes the size mode (clay, silt, sand in the present MUSCAT setup) mj is the mass fraction of mode j, σ is the geometric standard deviation (set to 2.0 independent of the mode), and MMDj are the mass median diameters, set to 2.0 µm (clay), 15.0 µm (silt), and 150.0 µm (sand), respectively.
To determine the basal (projected) surface area distribution, the PSD is transformed assuming spherical particles of uniform density:
The total basal surface area (Bt) is obtained by integrating Eq. (6) across all particle sizes. Normalizing dBt(Dpi) by Bt yields the relative basal surface area distribution Brel−i, which is used in Eq. (4) to allocate the horizontal flux across particle sizes.
Saltation and particle bombardment processes (Marticorena and Bergametti, 1995) are incorporated by iteratively adjusting Brel−i for each size class, accounting for the momentum transfer from saltating particles to finer dust grains. Following this adjustment, the total horizontal flux is computed.
The fraction of the horizontal flux that becomes airborne is parameterized as a vertical dust flux (F):
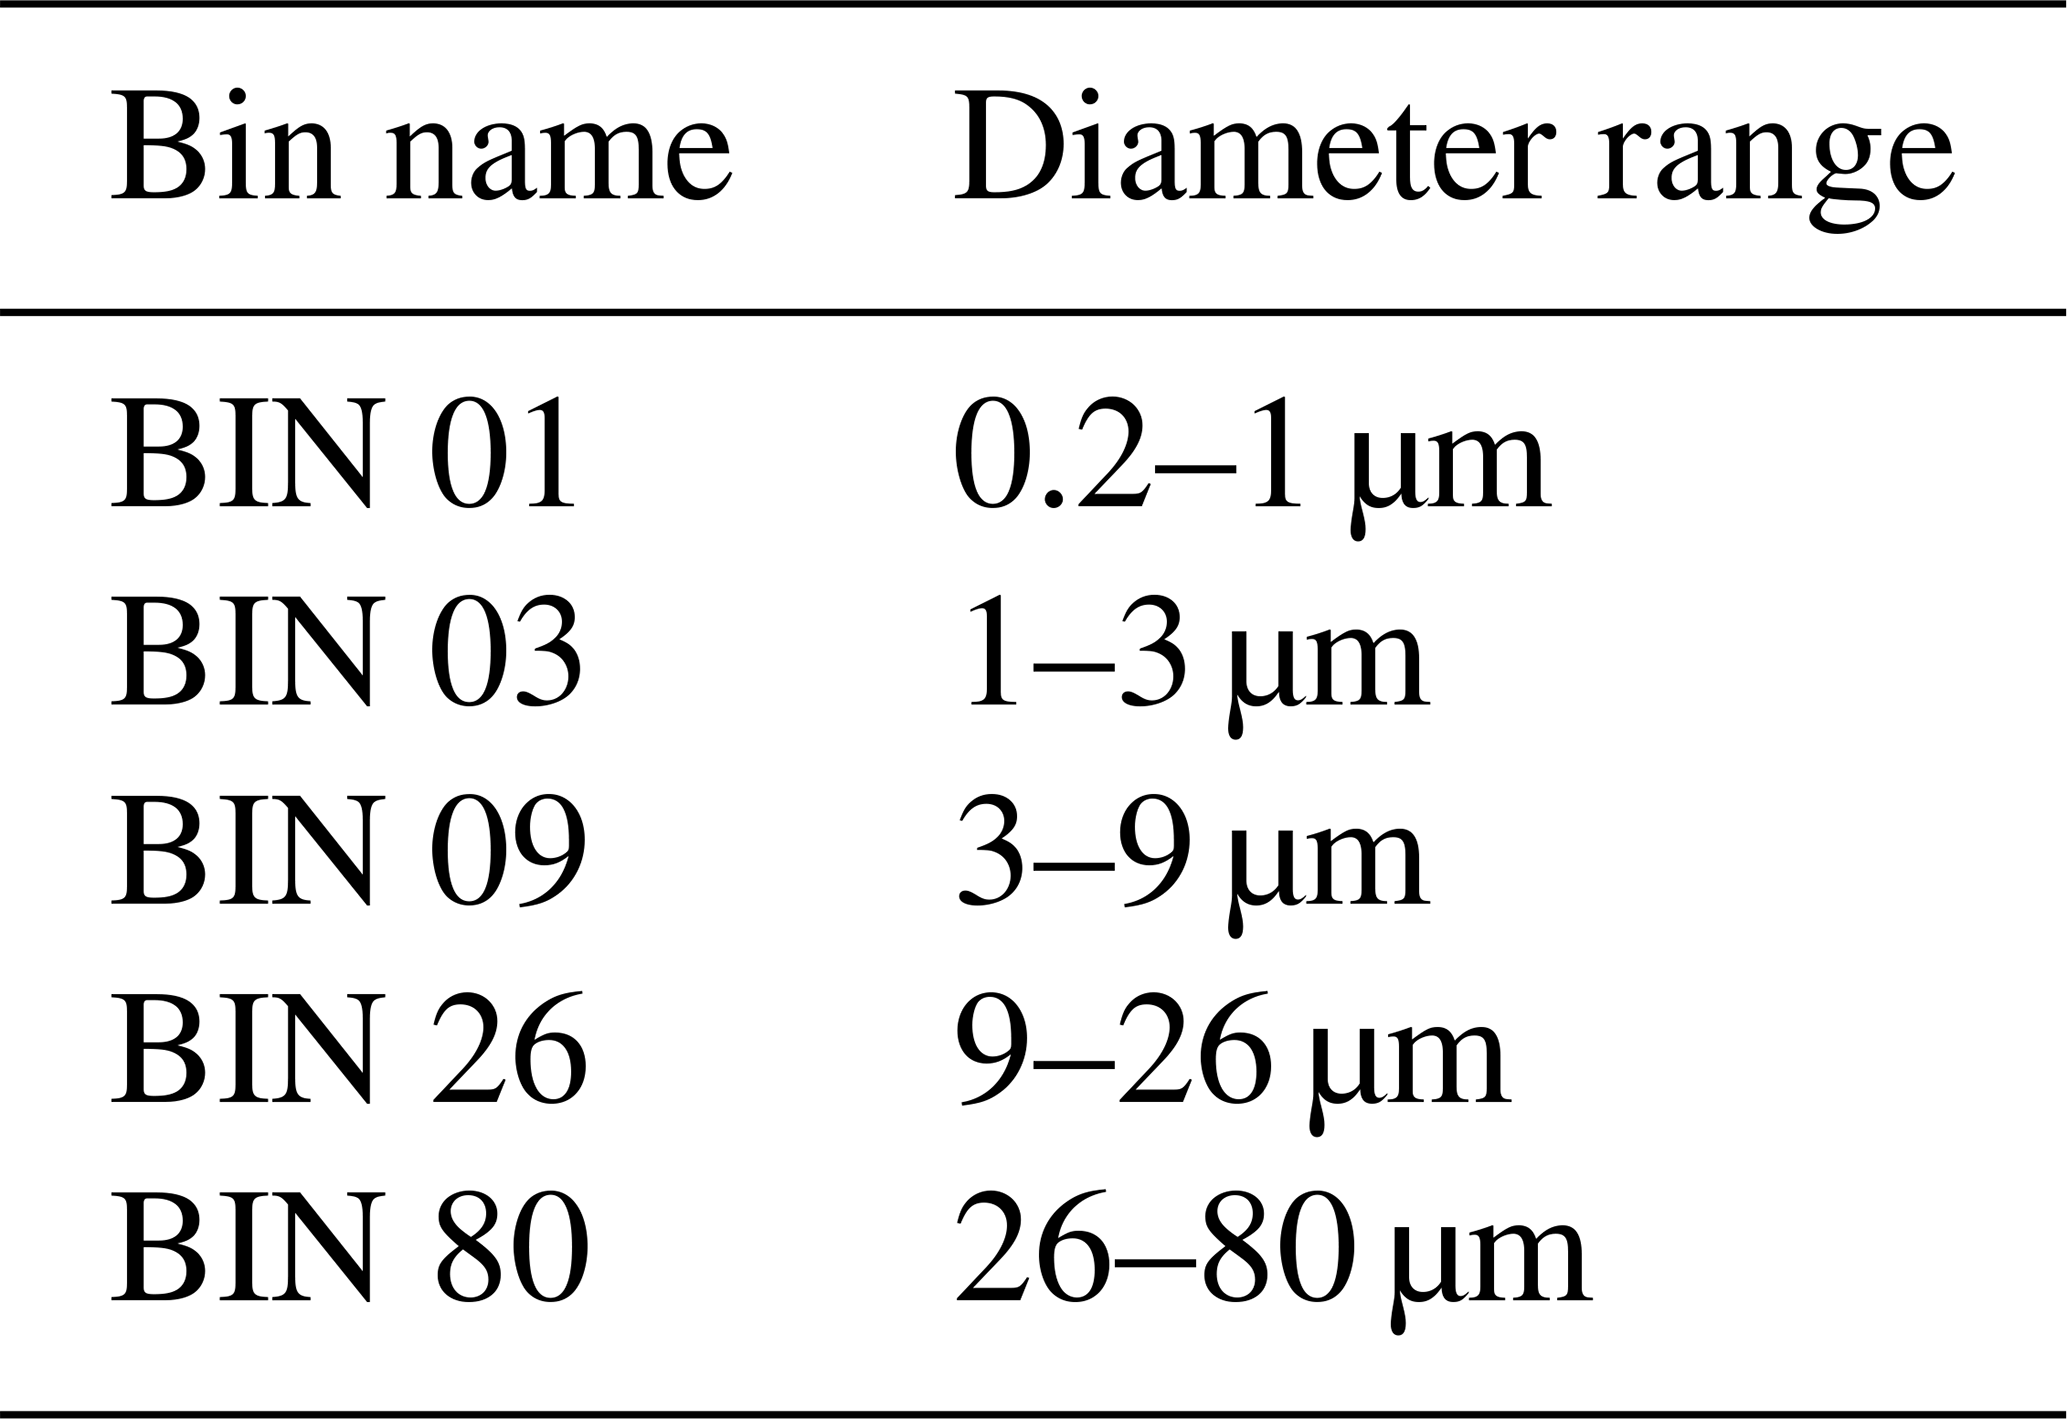
where ω is the sandblasting efficiency, prescribed per soil type based on the local clay, silt, and sand fractions (Tegen et al., 2002). Aeff denotes the erodible surface area, Asnow is the snow-covered fraction, and Iθ represents a soil moisture correction following Fécan et al. (1999). The vertical flux is then partitioned into five transport-relevant size bins (Table 1) to generate size-resolved dust fluxes for atmospheric injection.
Table 1Definition of MUSCAT five independent size classes for mineral dust aerosol transport. Their size limits are indicated.
The overall magnitude and spatial variability of emissions are determined by the interplay of these surface conditions. The influence of vegetation cover on Aeff is threshold-dependent. In desert regions, dust emission is inhibited once fractional vegetation cover exceeds 0.5; below this threshold, the erodible area is scaled linearly to account for the partial sheltering of the surface (Tegen et al., 2002). Similarly, Iθ reduces emissions linearly once soil moisture exceeds a critical threshold determined. While snow cover also inhibits dust emissions, its parametrization is deactivated in this model configuration given its negligible influence over the Sahara Desert. Together with the particle size distribution and surface roughness, these factors control the efficiency and spatial heterogeneity of dust emissions in the model.
2.3 Mineralogical composition modification
In the “original” approach by Gómez Maqueo Anaya et al. (2024), mineralogical fractions are prescribed by directly mapping the mineral soil particle size distribution (PSD) from GMINER (Nickovic et al., 2012) onto the mineral-resolved aerosol PSD as represented by the upper panel of Fig. 1. A key limitation of this approach is that the modifications to the bulk PSD caused by the emission process do not affect the mineral-resolved PSD. This overlooks the fact that the emission process explicitly alters the overall dust PSD, as predicted by dust emission theories (Kok et al., 2012; Marticorena and Bergametti, 1995; Shao et al., 2011).
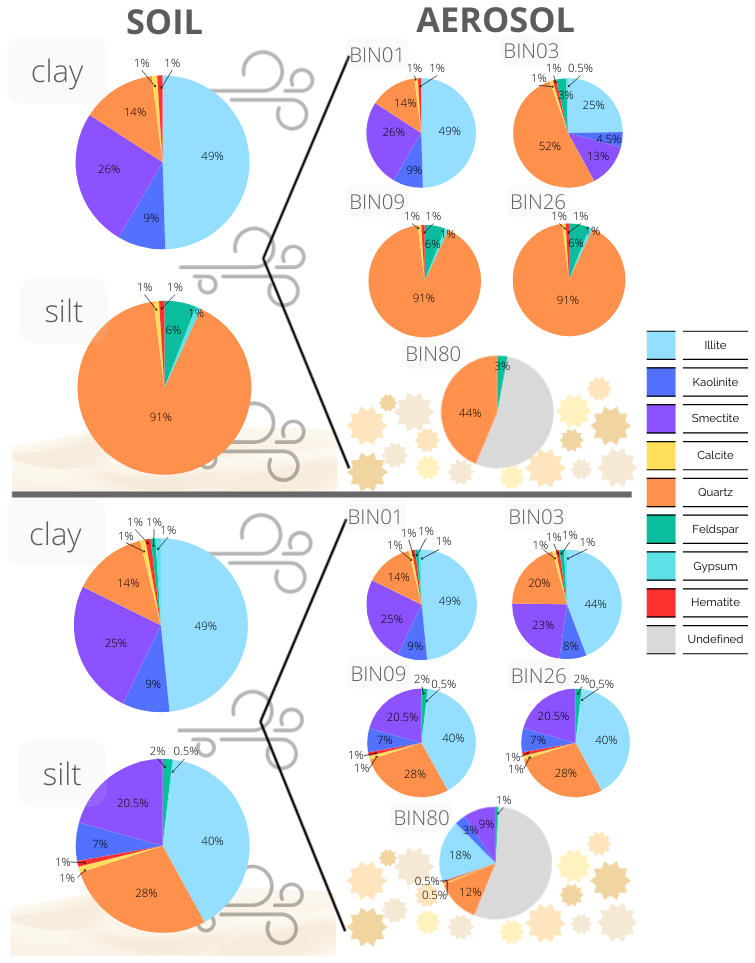
Figure 1Mineralogical composition of soil and emitted dust particles. Larger pie charts represent the mineral fractions in the soil distribution, where clay is defined as particles with diameters below 2.5 µm and silt particles between 2.5 and 50 µm. Smaller pie charts represent the mineral fractions of aerosols per size bin as classified in MUSCAT (Table 1). Particles exceeding 50 µm diameter are not classified by mineral component and are labeled as “undefined”. The upper panel shows the “original” mineral soil PSD as obtained by GMINER and the subsequent mineral fractions in the aerosol bins mimicking that distribution. The lower panel shows the modifications to the soil mineralogy distribution and resulting aerosol fractions following the parametrizations of Perlwitz et al. (2015a) and Gonçalves Ageitos et al. (2023).
This inconsistency stems from the structure of GMINER in combination with Marticorena and Bergametti (1995)'s emission scheme, since GMINER provides mineralogical mass fractions only for the finest soil classes (silt and clay). These are assumed to represent the airborne dust range, given their capacity to remain suspended for several days. However, the emission scheme of Marticorena and Bergametti (1995) (Eqs. 5–6) requires the full soil PSD to represent saltation and bombardment processes. Larger soil particles, although not staying airborne, are essential because their impacts release smaller fragments that otherwise could not overcome interparticle cohesion forces via wind induced friction velocity only (Marticorena and Bergametti, 1995; Iversen and White, 1982).
Consequently, a consistent application of the Marticorena and Bergametti (1995) scheme is not possible with GMINER alone, since the database lacks information on the coarser soil fractions. Figure 2 illustrates this limitation for a representative Saharan grid cell, highlighting the substantial portion of the soil PSD that is missing when mineral fractions are restricted to only the two finest classes.
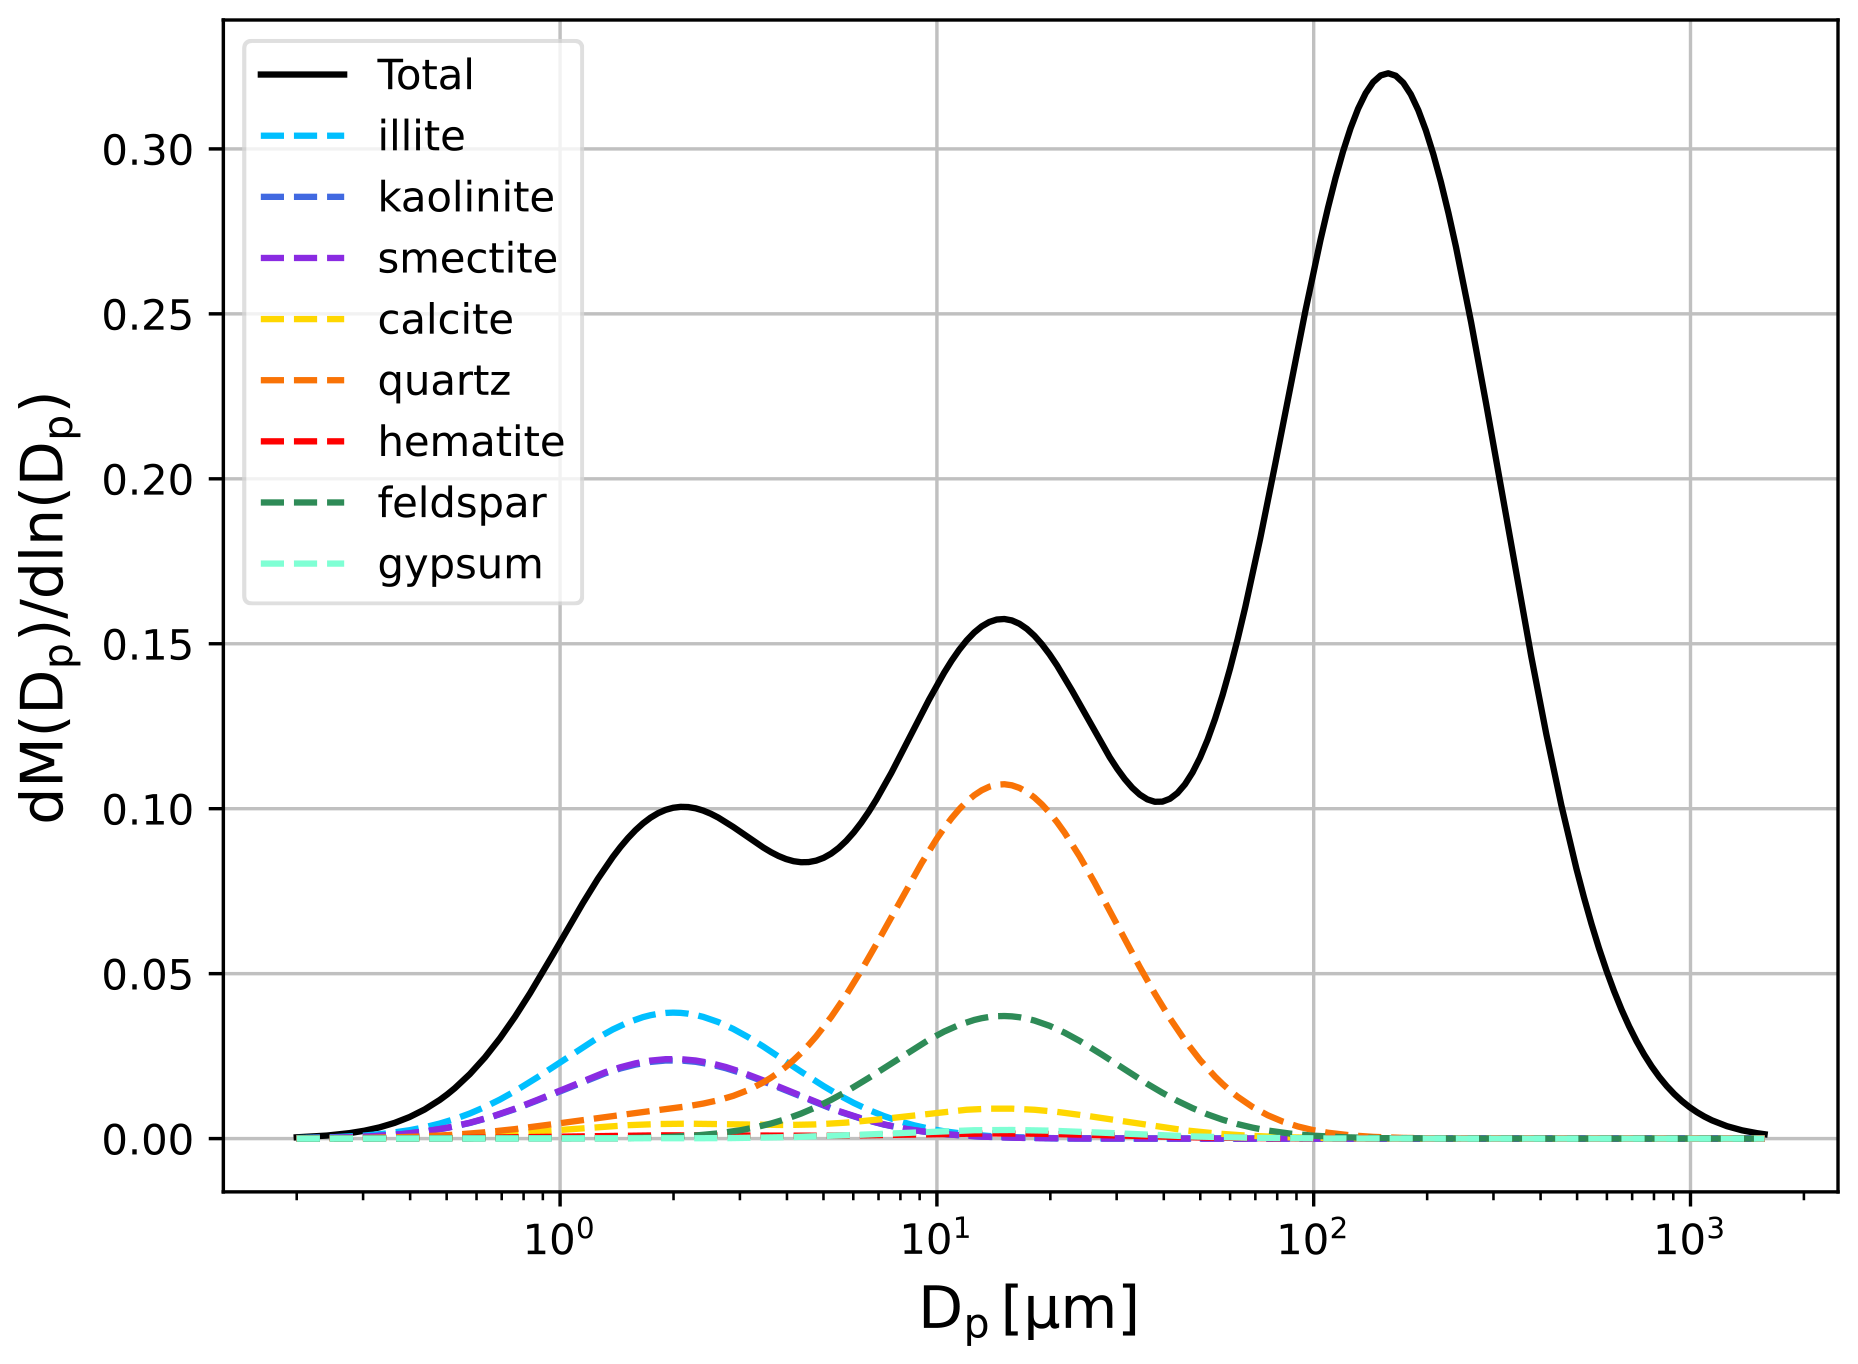
Figure 2Mass size distribution of soil particles at a representative Saharan grid cell (22.45° N, 20.9° E). The black solid line represents the total distribution obtained from the SoilGrids database (Poggio et al., 2021), exhibiting three distinct modes corresponding to clay, silt and sand fractions. Dashed colored lines indicate the mineral specific mass size distributions as described by the GMINER database. Figure from Gómez Maqueo Anaya (2025).
The emission scheme inherently favors silt-sized particles, which require relatively low wind stress for entrainment and are small enough to remain airborne, as illustrated by the threshold friction velocity function (in Fig. 1 of Marticorena and Bergametti, 1995). This aerodynamic preference becomes problematic when GMINER assigns minerals exclusively to silt or clay size classes. Treating these mineral-resolved PSDs as representative of the full soil PSD within the Marticorena and Bergametti (1995) framework introduces systematic biases: clay-sized minerals experience artificially suppressed emissions due to high cohesion thresholds that rely on larger saltating particles to be broken, while silt-sized minerals are prone to overestimation in the absence of coarser, non-erodible grains. Accurate dust emission calculations therefore require a complete soil PSD, where larger particles mobilize finer fractions via saltation bombardment (Kok et al., 2012; Marticorena and Bergametti, 1995). This issue is compounded by the methodology used to construct GMINER: wet sieving mechanically disaggregates soil samples, increasing the apparent fraction of clay-sized particles relative to undisturbed soils (Perlwitz et al., 2015a). While airborne clay-sized fractions generally match source soils and are preserved during transport (Caquineau et al., 1998; Lafon et al., 2004), silt-sized mineral distributions show poorer agreement, partly due to biases introduced by wet-sieving (Perlwitz et al., 2015a).
To address these issues, several modeling studies have incorporated mineral-specific transformations from soil to aerosol PSDs (e.g., Perlwitz et al., 2015a, b; Gonçalves Ageitos et al., 2023; Pérez García-Pando et al., 2016; Scanza et al., 2015; Li et al., 2021). These approaches build on the Brittle Fragmentation Theory (BFT) of Kok (2011), which posits that for the finest particles, the emitted size distribution is largely independent of soil properties and wind speed. BFT conceptualizes emission as a sequence of energetic collisions between saltating aggregates, producing fragments that predominantly fall below a characteristic size threshold. The resulting particle number concentration N is inversely proportional to the square of the particle diameter Dp, modulated by an exponential cutoff controlled by a characteristic aggregate diameter Dc, as expressed in the following relation:
where Ds represents a scalar diameter within the “indivisible” size range. Particles at or below this scale are considered primary grains resistant to further fragmentation due to inherent particle cohesion. Following Kok (2011), the probability of finding such indivisible grains at a specific size Ds is dictated by the PSD of the fully dispersed, wet-sieved soil. Incorporating this distribution, the emitted number size distribution is formalized as:
where cN is a normalization factor, and p(Ds) represents the probability density function derived from the wet-sieved PSD. In this integral, Ds serves as the scalar integration variable representing the diameters of the constituent primary grains. This formulation captures the physical constraint that an emitted aggregate of size Dp can only be composed of indivisible components smaller than or equal to itself Ds≤Dp. The integral term (the cumulative distribution function of the soil minerals) thus reduces the emission of small particles if the soil lacks sufficient fine indivisible grains, while the exponential cutoff suppresses the emissions of very large diameters.
The BFT posits that the emitted number concentration of small dust particles is largely independent of the undispersed soil size distribution, with Dc estimated at 12±1 µm (Kok, 2011). In this framework, the PSD of emitted aggregates is skewed toward larger diameters compared to wet-sieved soil, consistent with observations by Kandler et al. (2009) and Enete (2012), which indicate that saltation-driven fragmentation preserves a greater fraction of mass in the silt-size range than suggested by wet-sieved samples. Perlwitz et al. (2015a) further show that roughly 45 % of the silt-sized emitted mass originates from aggregated indivisible particles that would be classified as clay-sized in wet-sieved soils. To reconcile this discrepancy, they proposed an empirical correction that reallocates a fraction of clay-sized minerals from wet-sieved soils to the silt fraction, particularly phyllosilicates (illite, kaolinite, and smectite), which are categorized in GMINER exclusively in clay size classes but contribute to silt-sized emissions in reality.
This adjustment is quantified using Eq. (9) to derive a generalized ratio of emitted clay- to silt-sized particles, assumed to be spatially invariant and independent of local soil conditions. This simplifying assumption has been adopted in several modeling studies (Albani et al., 2014; Perlwitz et al., 2015a, b; Scanza et al., 2015; Pérez García-Pando et al., 2016; Gonçalves Ageitos et al., 2023). However, it applies only to particles below 20 µm, as larger particles are more sensitive to site-specific emission factors such as wind speed, soil properties, and surface roughness. Since GMINER defines the silt class up to 50 µm, a further adjustment is needed for particles in the 20–50 µm range. Perlwitz et al. (2015a) addressed this by scaling the clay contribution using measurements from Kandler et al. (2009), which provided empirical data on the coarse-mode mineral distribution of freshly emitted dust. Using Eq. (9), they estimated a clay-to-silt ratio of 0.05 for diameters below 20 µm. When integrated over the full 0–50 µm range and volume-normalized to account for the coarser fraction, this corresponds to approximately 1.3 % of the total emitted mass being attributed to the clay mineral fraction.
This methodology rests on two critical assumptions. First, it assumes that the PSD measured at Tinfou by Kandler et al. (2009) is representative of other dust source regions. While this may not hold universally, the observed increase in silt fraction with particle diameter is consistent with the physical principle that the threshold friction velocity for emission decreases with particle size (Marticorena and Bergametti, 1995; Iversen and White, 1982). The approach also assumes that the emitted PSD is primarily determined by mineral-specific fragmentation, neglecting wind speed variations. This assumption is reasonable for particles below 20 µm, where Eq. (9) offers a reliable approximation, but becomes less reliable for coarser particles where emission dynamics are more sensitive to environmental conditions. Second, the model neglects modifications to the PSD caused by gravitational settling during transport to the Tinfou observation site. This simplification is justified by focusing only on measurements taken during high-concentration dust events, which are presumed to reflect recently emitted aerosols with minimal transport-induced size sorting.
This methodology is implemented here as the “modified” approach, in which the dispersed soil size distribution from the GMINER SMA is adjusted to more realistically represent the aerosol size distribution observed in atmospheric dust. The formulation follows Perlwitz et al. (2015a), based on BFT. From GMINER, the mass fraction of each mineral k in the conceptual clay (0–2.5 µm) and silt (2.5–50 µm) size categories is denoted by and , respectively. It should be noted that these two broad categories are used for the mineralogical reallocation process and are distinct from the five discrete aerosol transport bins defined in Table 1. These fractions are normalized for each soil type st (arid soil type provided by FAO74) such that:
with 8 minerals considered. To better reflect the emitted PSD, the BFT-based method distributes all minerals across both size categories, including those originally classified exclusively as clay- or silt-sized in GMINER.
To assign mineral fractions to the actual aerosol size categories, soil texture information from the SoilGrids database (Poggio et al., 2021) is incorporated. Let mc(sx) and ms(sx) denote the soil mass fractions of clay- and silt-sized particles, normalized such that:
The combined soil mineral mass fraction in each size category at each location is then computed by weighting the GMINER mineral fractions by the local soil texture proportions:
This ensures that the total soil mineral mass fraction across both reallocation size classes sums to unity:
In this formulation, soil mineral mass fractions vary spatially according to two factors: the arid soil type (st), which governs mineralogical composition, and the soil texture class (sx), which determines the relative abundance of clay- and silt-sized particles.
Once the soil mineral fractions are obtained from Eq. (12), the next step is to derive the emitted mass fraction of each mineral in the clay and silt size SMA categories. Denote by ϕc and ϕs the total emitted mass fractions of clay- and silt-sized aerosols, constrained by:
These totals are composed of contributions from all minerals k. Let and represent the emitted clay- and silt-sized fractions attributable to mineral k. They satisfy:
and consequently:
Thus, the emitted mineral mass fractions across all species and size classes sum to unity. Following the BFT-based formulation, the global clay-sized emission fraction is prescribed as ϕc=0.013, constant across all locations. The contribution of mineral k to clay-size emissions is therefore:
meaning that the proportion of emitted clay-sized dust mirrors the clay mineral fractions of the fully dispersed soil. In this context, the fully dispersed soil represents a theoretical, maximally dispersed state, a conceptual limit where all aggregates are broken down into their primary, indivisible constituents.
With ϕc prescribed, the total silt-sized fraction follows implicitly as:
For each mineral, the emitted silt-sized fraction has two sources: (1) particles originally present in the soil in the silt-size range, and (2) primary clay minerals that are emitted within larger silt-sized aggregates during the saltation-driven fragmentation of the parent soil. To account for this, the model performs an empirical reallocation where a fraction of the soil's clay mineral mass is transferred into the silt-sized aerosol population. This is expressed as:
where γk is a mineral-specific reaggregation coefficient quantifying the clay-to-silt transfer, and ϑ is a normalization constant ensuring that the sum of all equals ϕs.
For simplicity, γk is assumed constant across minerals, with the exception of feldspar, gypsum, and quartz. Feldspar is typically overrepresented in the silt fraction due to its fragmentation behavior, while gypsum is soluble and exhibits distinct disaggregation and spatial patterns (Perlwitz et al., 2015a). Quartz, which dominates the coarse end of the size spectrum and shows little evidence of disaggregation, is prescribed with γquartz=0.
Notably, feldspar and gypsum require special treatment since they are present in both clay and silt fractions of atmospheric aerosols (e.g., Enete, 2012) but are absent from the clay fraction in the GMINER SMA. Consequently, Eq. (17) cannot be applied directly. Instead, their clay-size fractions are estimated following the approach of Gonçalves Ageitos et al. (2023), which uses proxy minerals and scaling ratios: for feldspar, the extension into the clay fraction is scaled according to the quartz clay-to-silt ratio:
and for gypsum, the calcite clay-to-silt ratio is used:
To conserve the total clay-size mass balance (Eq. 10), the phyllosilicate fractions in the clay category are proportionally reduced by soil type.
Once these database gaps are addressed, the emitted silt-sized fraction of mineral k is expressed based on Eqs. (12) and (19) as:
In this formulation, γk acts to suppress the silt-size emissions of minerals such as quartz, while extending the contribution of clay-rich species (e.g., phyllosilicates) into the silt range. This redistribution reflects the contrasting aggregation behaviors of different minerals: quartz remains largely intact during saltation, whereas clay-mineral constituents are emitted as part of larger silt-sized aggregates rather than as fully dispersed fine particles.
A schematic representation of the “modified” approach is shown in the lower panel of Fig. 1. In this framework, a substantial reduction of the quartz fraction is introduced, along with a redistribution of minerals across size classes. Specifically, phyllosilicates are incorporated into the silt fraction, while feldspar and gypsum are extended into the clay fraction. The application of Eqs. (22)–(21) thereby entails a relative decrease of feldspar and gypsum within the silt-size range, resulting from the additional contribution of phyllosilicates.
After constructing the adjusted mineral soil PSD, which better represents the composition of mineral aerosols at larger sizes, it is incorporated into the COSMO5.05-MUSCAT emission scheme. The underlying emission algorithm remains unchanged from the implementation described by Gómez Maqueo Anaya et al. (2024): the vertical emission flux in each MUSCAT size bin is scaled by the corresponding soil mineral fraction, with each mineral assigned to its own bin within the respective size category (see Table 1). In the revised configuration, the mineralogical SMA is updated to reflect the modified PSD, and additional bins are introduced to represent minerals that now occur simultaneously in both clay and silt size ranges.
To verify the “modified” mineral approach, the scheme was compared against the MONARCH reference for Haplic Xerosols in the northwestern Sahara (Gonçalves Ageitos et al., 2023). Despite differences in bin resolution and emission parameterizations, both models demonstrate a consistent redistribution pattern, specifically, the shifting of phyllosilicates toward silt-sized categories and a proportional reduction in quartz. The resulting mineralogical shift from soil to emitted aerosol for this soil type is illustrated in Fig. B1 in Appendix B.
2.4 Input files and simulation setup
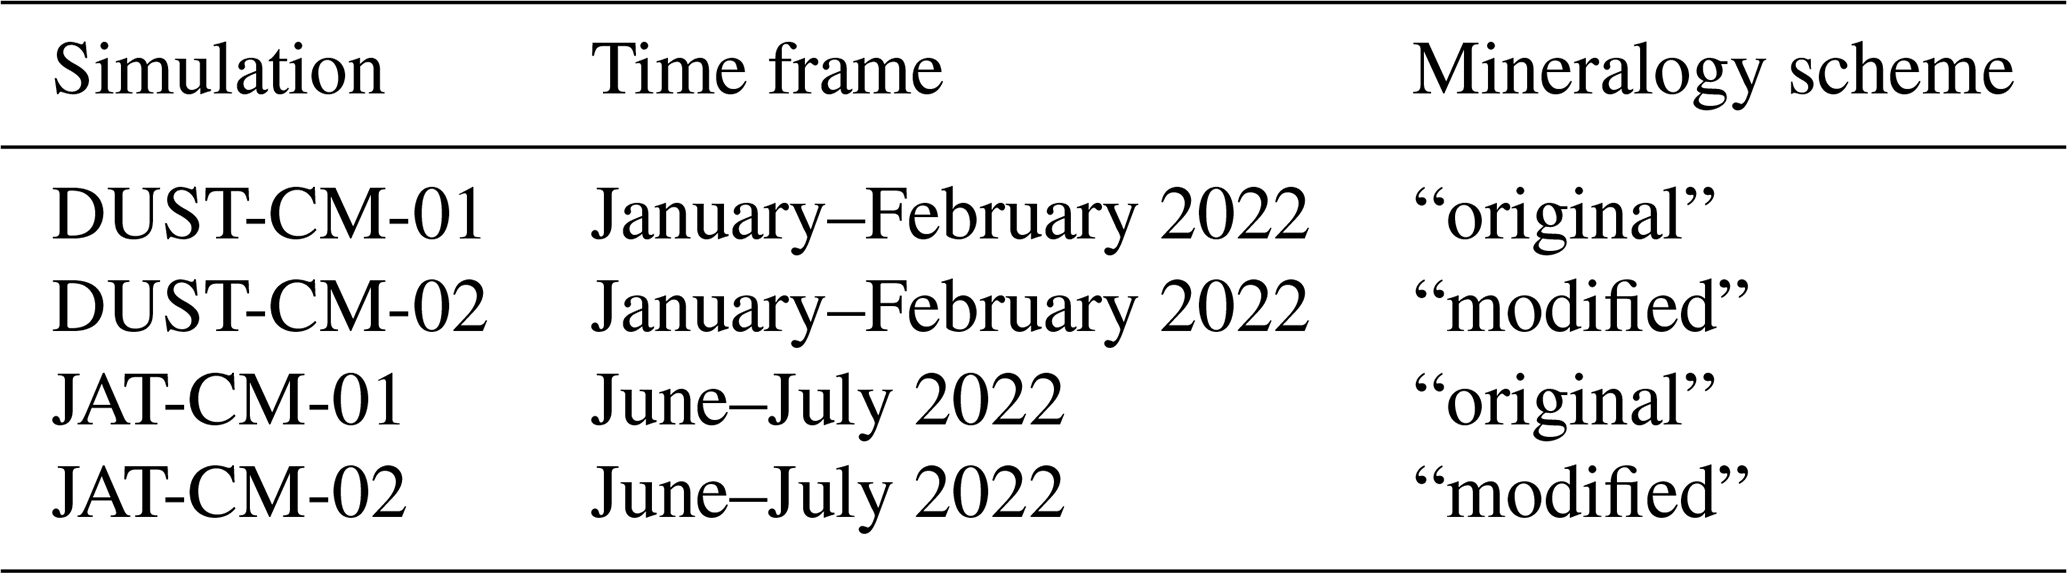
Mineralogical dust simulations were conducted using a consistent COSMO5.05-MUSCAT physical configuration. The experimental design varied across two primary dimensions: the simulation period and the mineralogical scheme. To match the observational campaigns, simulations were performed for January–February 2022 (DUSTRISK) and June–July 2022 (JATAC). For each of these periods, the two distinct mineralogical composition approaches, the “original” and “modified” schemes, were applied. The simulation experiments are summarized in Table 2.
Table 2Summary of simulations used for measurement comparison. Domain and all input files remain consistent across model runs. For a detailed description of the differences between mineralogy schemes, refer to Sect. 2.3.
The COSMO5.05-MUSCAT model domain is set up to cover the majority of the Sahara Desert and extend westward over the Atlantic Ocean to include the Cape Verde archipelago. The domain is bounded by 30.75° W–39.32° E and 38.49° N–0.38° S as represented in Fig. 3. Simulations are conducted at a horizontal resolution of 0.25° (approximately 28 km), with a vertical discretization of 40 layers. The lowest, surface level, model layer has a thickness of 20 m.
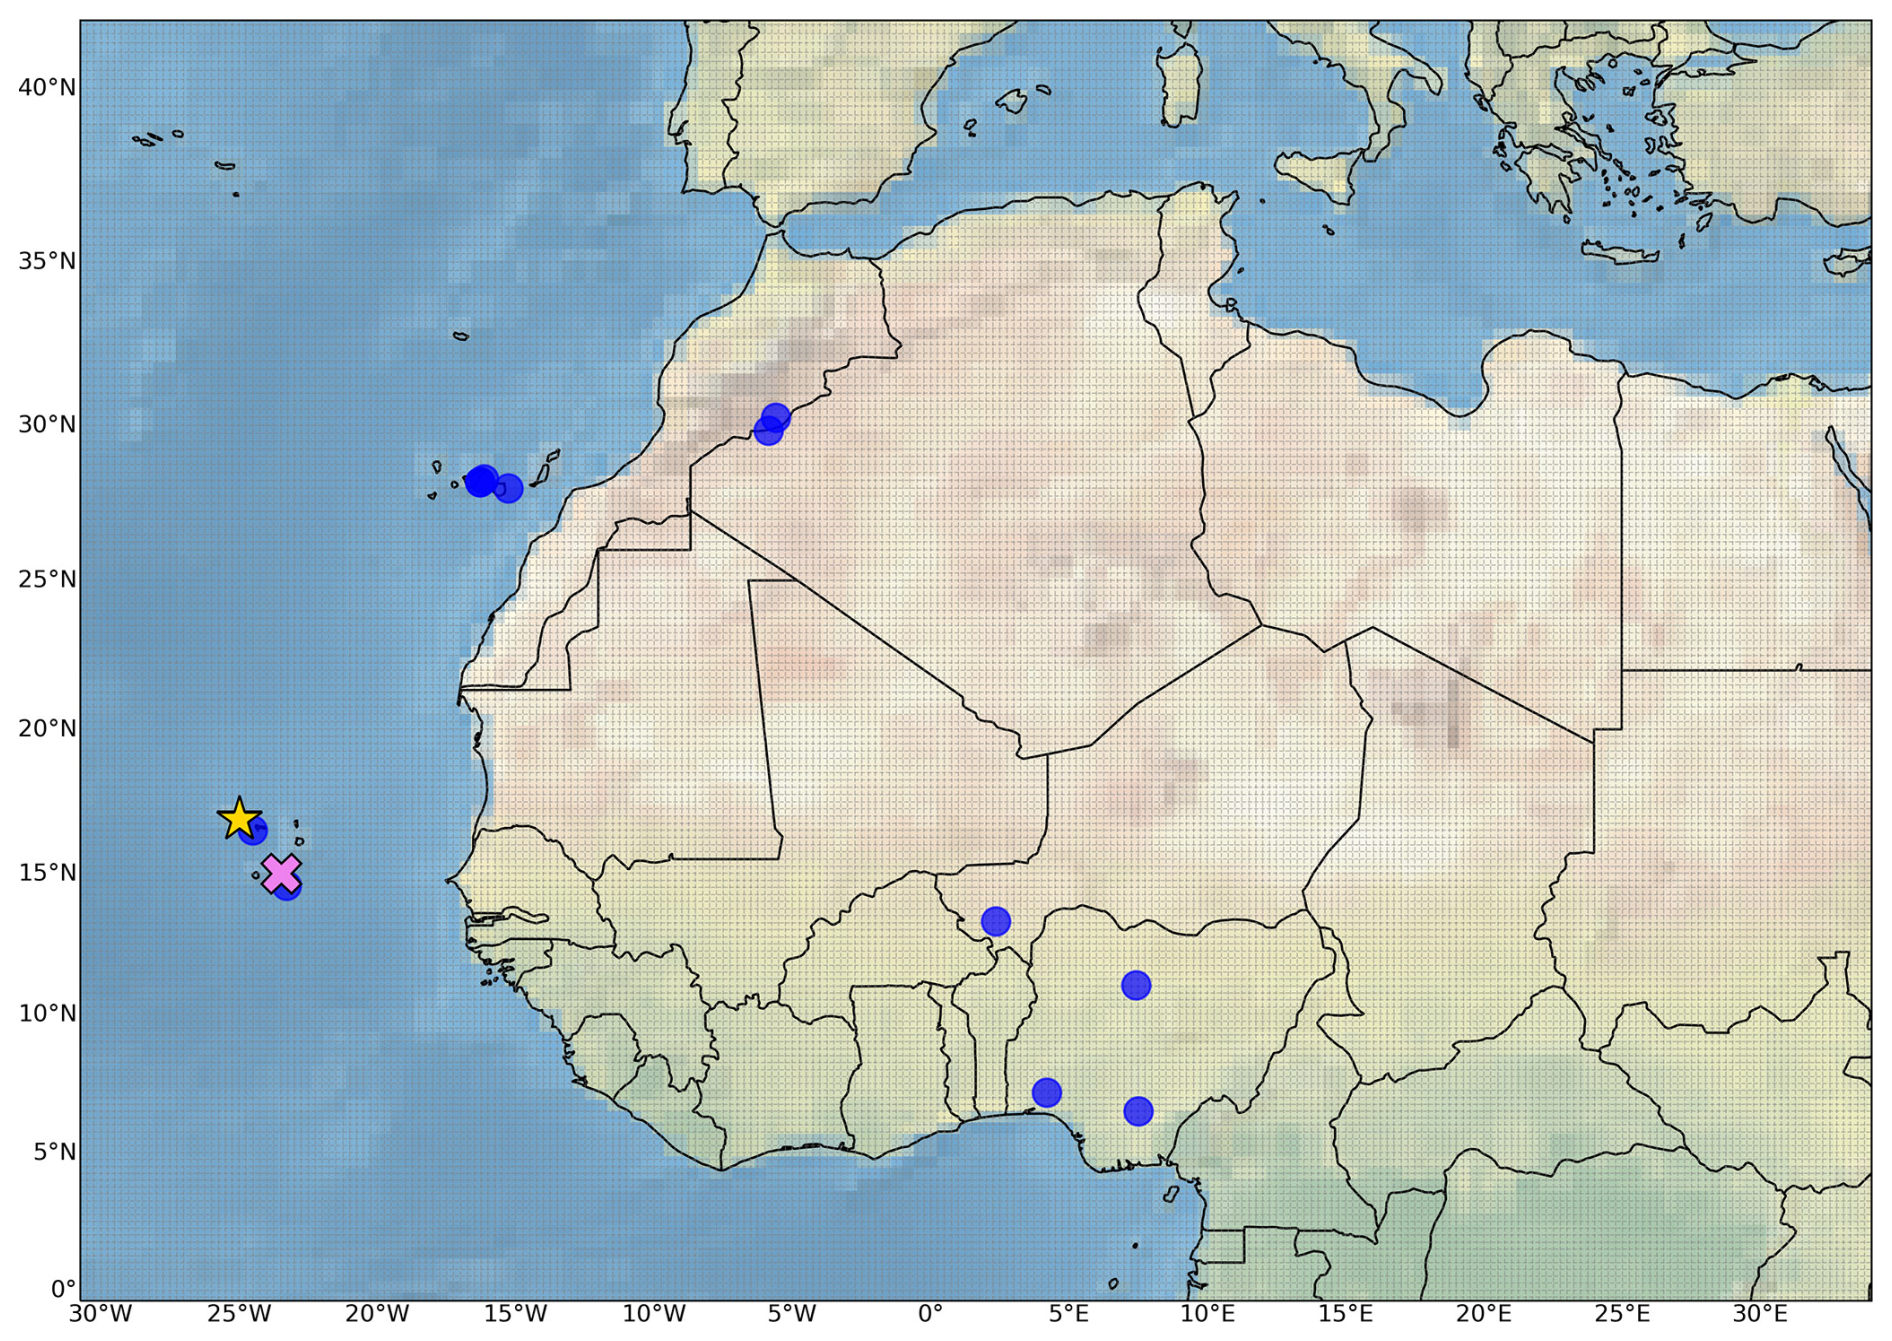
Figure 3Simulation domain for COSMO5.05-MUSCAT, featuring a 0.25° resolution grid in gray dotted lines. The yellow star identifies São Vicente (Cabo Verde), the site of the JATAC 2022, while the violet × indicates Praia (Santiago, Cabo Verde), where the DUSTRISK 2022 measurements were conducted. Blue dots show the locations of a measurement compilation utilized for a broader model validation.
Meteorological initial and boundary conditions for COSMO5.05-MUSCAT are provided by the DWD in the form of 3 hourly meteorological fields. To maintain realistic atmospheric conditions, the model is re-initialized every 48 h using overlapping cycles. Each 48 h cycle begins with a 24 h spin-up phase, during which only the COSMO5.05 meteorological model is active. Following this spin-up, MUSCAT is coupled to COSMO5.05 for the remaining 24 h to simulate aerosol transport and interactions. Only the output from these second-day simulations, when both COSMO5.05 and MUSCAT are fully coupled, is used for analysis. Continuity between cycles is ensured by starting each new COSMO5.05 run 24 h prior to the end of the previous MUSCAT simulation, while MUSCAT continues using its own prognostic fields from the preceding cycle as initial conditions. The entire simulation period is preceded by a 15 d intial spin-up, and results are outputted at 1 h intervals.
The MUSCAT dust emission scheme is controlled by external soil-related datasets. Vegetation cover is prescribed using the FCOVER product from the Copernicus Global Land Service (Fuster et al., 2020), which provides fractional green vegetation coverage. Soil moisture input is taken from ERA5-Land hourly reanalysis data (Muñoz Sabater and Copernicus Climate Change Service, 2019), specifically utilizing the volumetric soil water content of the 7 cm uppermost soil layer. Soil texture and mineralogical composition are provided by the SoilGrids and GMINER databases (Poggio et al., 2021; Nickovic et al., 2012), respectively, and implemented via the two distinct modeling approaches detailed in Sect. 2.3. Aerodynamic roughness lengths are provided through the dataset of Prigent et al. (2005).
These datasets, combined with the model's spatial constraints, restrict dust activation exclusively to continental source regions. Furthermore, the spatial distribution of active dust emission sources is constrained by the MSG-SEVIRI dust source activation frequency map by Schepanski et al. (2007).
3.1 JATAC 2022
During the JATAC 2022 campaign, in-situ recollection of mineral dust aerosols were performed using Unmanned Aerial Vehicles (UAVs) over São Vicente, Cape Verde, (indicated by the yellow star in Fig. 3) throughout June 2022. The Cyprus Institute conducted 25 UAV flights, each equipped with Optical Particle Counters (OPCs) for fine- and coarse-mode height-resolved PSD observations. Dust particles were collected from the atmospheric layers using onboard impactor samples (Marinou et al., 2023), with a Giant Particle Collector (GPaC) capable of capturing particle diameters from nanometers up to tens of micrometers (Kezoudi et al., 2025, 2021). The GPaC's upper size limit depends on airspeed, pressure, and temperature; as a reference, during the SAMUM-2 campaign, particles up to 28.5 µm were successfully collected (Lieke et al., 2011).
Two OPCs were mounted on each UAV. The Universal Cloud and Aerosol Sounding System counted aerosols with diameters from 0.28–17.0 µm, while the Printed Optical Particle Spectrometer measured number concentrations in the 0.14–3 µm range (Kezoudi et al., 2021). OPC measurements were used to validate PSDs derived from collected dust samples, following the methodology of Panta et al. (2023).
Aerosol chemical composition and single-particle characteristics were analyzed using a scanning electron microscope coupled with Scanning Electron Microscope-Energy Dispersive X-ray spectrometry (SEM-EDX) to determine particle size, shape, and elemental composition. Back-scattered images were used to study particles with projected area diameters (PAD) >0.5 µm, where PAD (, with Ap as the particle area) closely approximates aerodynamic diameter for dust (Aryasree et al., 2024; Kandler et al., 2018). SEM-EDX provides normalized atomic percentages for elements including: F, Na, Mg, Al, Si, P, S, Cl, K, Ca, Ti, V, Cr, Mn, Fe, Zn, and Pb. This method allows detection of particles up to 30 µm, with measurement precision for major compounds within 2 % relative standard deviation (RSD), while minor compounds range from 10 %–20 % for particles>3 µm, and can exceed to 100 % for the smallest particles. Diameter measurement uncertainty decreases with size, from ∼1.5 % RSD at 2 µm to <1 % for particle diameters>3 µm (Kandler et al., 2018).
Impactor sampler collected 18 samples, and analyzed size, shape and elemental composition for 25 000 single particles during the measurement period. Samples with a low number of particles (<500) were discarded to ensure reliable statistics while counting/grouping each particle group. This screening protocol resulted in a final validation dataset comprising 17 high-quality samples.
To enable a consistent comparison between measurements and model output, the observed minerals are classified into the same mineral classes available in the GMINER soil database. This ensures that the measured and simulated mineral categories are directly comparable, avoiding ambiguities arising from differences in mineral classification. Size-segregated chemical compositions (same as Table 1) were determined for the primary dust aerosol minerals: illite, kaolinite, smectite, quartz, feldspar, calcite, gypsum and hematite were derived by defining ideal elemental compositions for each modeled mineral, accounting for common impurities associated with each mineral phase (Table A1 in Appendix A). Individual measured particles are then matched to the nearest ideal composition, and counting statistics for each mineral group are used to estimate uncertainty via two-sided 95 % confidence intervals under a binomial assumption.
For iron oxide minerals such as hematite, the ratio reported in Table A1 reflects the iron oxide content from a single-particle perspective. However, a significant fraction of iron in dust occurs within the crystal lattice of other minerals (Lafon et al., 2004; Zhang et al., 2015), necessitating an alternative approach to estimate total iron oxide content.
Following Aryasree et al. (2024), we use two parameters: (i) the total iron oxide percentage (Feoxides), which accounts for iron present either as pure oxy-hydroxides (e.g., hematite, goethite) or incorporated within mineral lattices, and (ii) the total Fe index, defined as the atomic ratio of Fe to the sum of all quantified elements. The total iron oxide percentage is calculated as:
where mFeox% and mFe% are the mass fractions of iron oxides and elemental iron relative to the total dust mass, respectively, obtained from Table 3 in Di Biagio et al. (2019) for different Saharan source regions. MFe is the estimated Fe mass within a single particle from SEM-EDX measurements, and Mdry is the particle's dry mass.
Using this formulation, mass percentages for both total iron oxide and hematite are derived. For hematite specifically, hematite mass fraction from Di Biagio et al. (2019) is used to substitute mFeox% in Eq. (23). The uncertainty arising from the representative ratio of iron oxide content from 19 desert dust types given by Table 3 in Di Biagio et al. (2019) which is generally less than 15 %. For us, this is a systematic error, as we apply the same ratio to all samples.
Additionally, elemental mass concentrations are provided for the species most commonly associated with mineral dust, including Si, Al, Fe, Ca, K, Mg and S. Both mineralogical and elemental data are partitioned into the MUSCAT size bins up to BIN26.
3.2 DUSTRISK 2022 campaign
The DUSTRISK 2022 campaign took place in the Cape Verde archipelago during January and February 2022. Particulate matter was sampled at two distinct sites, referred to as inflow and outflow, on the island of Santiago (Cabo Verde). The inflow site (14°54′32′′ N, 23°30′54′′ W, indicated by the violet × in Fig. 3) was positioned in the city of Praia, on the northeastern coast, directly facing the ocean.
The sampling site was strategically positioned to intercept air masses dominated by the prevailing northeast trade winds, which transport Saharan mineral dust directly from the African continent. Located upwind of both the urban center of Praia and the island's interior, the site is well-situated to ensure that collected aerosols represent long-range continental transport with minimal interference from local island soils. Although minor anthropogenic contributions from nearby urban areas cannot be entirely discounted, the site's orientation ensures that local influences remain negligible, as corroborated by previous studies (Cardoso et al., 2018; Fomba et al., 2025). In contrast, the outflow site is positioned downwind of the major metropolitan area and is significantly more susceptible to local anthropogenic and local dust emissions (Bredeck et al., 2024; Souza et al., 2025). To ensure direct comparability with model simulations that represent only continental dust sources, this analysis focuses exclusively on measurements from the inflow site.
Particulate matter (PM) samples were collected using Digitel DHA-80 high-volume samplers (Walter Riemer Mess Technik, Germany) operating at an average flow rate of 500 L min−1. At each site, separate PM2.5 and PM10 samplers were deployed. Sampling typically occurred over 24 h periods (noon to noon); however, during pronounced dust events, sampling duration was shortened to capture peak concentrations. All samples were collected on Ahlstrom micro-quartz fiber filters (MK 360) (Bredeck et al., 2024; Souza et al., 2025).
Elemental concentrations were determined using Total reflection X-Ray Fluorescence (TXRF) spectroscopy, following the methodology described by Fomba et al. (2020). Filter samples of 1.5 cm2 area were prepared by digesting three 8 mm spots per filter in a mixture (0.375 and 1.125 mL, respectively) using a microwave digester (Mars 6, CEM, Germany). Internal standards (ScCo at 10 µL) were added to the digested solutions, which were then applied to siliconized quartz carriers, dried at 80 °C, and analyzed using a Bruker S4 T-STAR instrument. This procedure determined concentrations of Al, Ti, Ca, K, Mg, S, Si, Cr, Mn, and Fe. To ensure precision and account for potential sample heterogeneity, each carrier was analyzed at two rotational positions (0 and 90°). Measurement uncertainty was quantified by calculating the relative error between these replicates, revealing a dependency on mass loading: uncertainties reached up to 15 % for samples with very high dust load () while remaining below 6 % for samples with low dust concentrations typically below 38 µg m−3. These variations are attributed to instrumental limitations previously characterized in (Fomba et al., 2020).
Notably, blank silicon measurements for the filters and TXRF sample carriers showed significant, non-reproducible variations due to inconsistent filter densities and surface reflectance. The resulting uncertainties were too high for a meaningful comparison; therefore, silicon was excluded from the analysis. To isolate the mineral dust signal from the background aerosol, the total mineral dust mass concentration was reconstructed from the remaining elemental data following the procedure of Souza et al. (2025). In this approach, the concentrations of key crustal elements (Al, Fe, Ca, Ti) are adjusted for their common oxide forms to estimate the total mineral mass. The dust concentrations were quantified using the stoichiometric relationship for crustal elements following Deabji et al. (2021) and Souza et al. (2025):
Following established classification for mineral dust events in the Cabo Verde region (Souza et al., 2025), a mineral dust mass concentration threshold of was applied. The threshold was chosen based on long-term analysis of PM10 concentrations at the CVAO sampling site, during which dust concentrations were consistently high. This threshold, combined with air mass back-trajectory analysis, serves to distinguish significant long-range transported dust events from maritime background or local aerosols. This screening resulted in a final validation set consisting of 34 PM2.5 and 45 PM10 filter samples.
4.1 Evaluation methodology
To ensure a robust comparison between COSMO5.05-MUSCAT simulations and in-situ observations, the model output is spatio-temporally sampled to align with the specific characteristics of each measurement campaign. Spatially, model variables were extracted from the grid cells corresponding to the geographic coordinates of the sampling sites. Temporally, hourly model outputs were averaged over the specific integration times of the filter samples. This alignment accounts for varying sampling durations, ranging from the high-frequency UAV cycles during JATAC 2022 to the day-long ground-based periods of the DUSTRISK 2022 campaign. To ensure temporal concurrency, a rounding convention is applied: if a sampling interval began or ended within 30 min of a full hour, the nearest hourly model timestep is used to define the averaging window. For example, a sampling period from 10:00–12:15 GMT (time zone throughout) is matched with the model average from 10:00–12:00, while a period from 10:10–12:36 is matched with the 10:00–13:00 simulated average.
For the compilation of North African mineralogical measurements, where exact temporal matching is often not possible due to the lack of concurrent simulated data, the time dimension is constrained by selecting observations from the same seasons as the simulation period. Furthermore, the comparison is restricted to sites and dust trajectories similar to those simulated, ensuring that the emission sites to measurement place pathways in the model are representative of the taken measurements, as detailed in the following section.
It is important to note that the “original” mineralogy scheme (Gómez Maqueo Anaya et al., 2024) possesses structural constraints regarding the simulation-to-measurements comparisons. Specifically, phyllosilicates are restricted to the clay and fine-silt fractions (BIN01 and BIN03), while minerals such as feldspar and gypsum are defined with no mass in the clay-sized fraction (BIN01). These inherent model configurations limit the scope of certain comparisons where observations report these minerals in size fractions not supported by the scheme's internal mapping.
Beyond these structural constraints, the definition of the simulated mineral mass concentrations also requires clarification. The simulated mineral mass fraction is defined as the ratio of a given mineral's mass to the total dust mass fraction within the size range used for comparison. For example, for bulk comparisons, this ratio is computed by summing the mineral mass across all size bins in which it is simulated and dividing by the total dust mass summed across all size bins. Importantly, this definition is applied consistently even when a mineral is not represented across the full size spectrum; in such cases, the denominator still comprises the total dust mass over all size bins. This approach implicitly assumes that the simulated minerals collectively account for the entirety of the dust mass. However, it should be noted that additional minerals present in the observations but not represented in the model also contribute to the measured total dust mass. Since these non-simulated minerals cannot be quantified within the modeling framework, their contribution introduces and inherent but unquantifiable offset between the simulated and observed mineral mass fractions.
The agreement between simulated (y) and observed (x) mineralogical and elemental concentrations is quantified using the Mean Bias (MB), the Pearson correlation coefficient (r), and an orthogonal distance regression. The correlation coefficient r serves as a measure of spatial agreement, evaluating the model's ability to replicate the geographical variability and regional distribution of mineral dust signatures across the study domain. The Pearson correlation coefficient is defined as:
where and represent the mean values of the simulated and observed datasets, respectively, and n is the number of paired spatial samples.
To account for uncertainties inherent to the baseline measurements (x), the linear model is fitted using an orthogonal distance regression rather than ordinary least squares, which minimizes residuals in both axes simultaneously and thereby prevents attenuation bias in the slope estimation. The linear model takes the form:
where m is the slope and b is the intercept, obtained by minimizing the weighted sum of squared orthogonal residuals:
where are weights inversely proportional to the observational variance of each measurement.
The slope and intercept derived from this fit are reported alongside the Mean Bias (MB) in the results tables. The MB identifies systematic over- or underestimations and is defined as:
4.2 Compilation of North Africa mineralogical measurements
Model outputs from DUST-CM-01 and DUST-CM-02 (see Table 2) are compared against a compilation of in-situ aerosol mineralogical measurements. The simulated period (January–February 2022) was specifically selected for two reasons. First, it enables a direct comparison with the “original” mineralogy scheme presented by Gómez Maqueo Anaya et al. (2024), ensuring that any differences in model performance can be attributed to the updated mineralogical parametrization rather than to variations in meteorological forcing. Second, although an additional modeling period covering Northern Hemispheric (NH) summer conditions is available, it was not employed here since the measurement campaigns most representative of NH summer dust transport were already matched to source regions and transport pathways compatible with the January–February period through our classification methodology, rendering the additional period unnecessary for the present evaluation.
The core of this compilation is based on the global dataset of Perlwitz et al. (2015b), subsetted to include only locations within the modeling domain, and further expanded with one additional dataset from the Atlas Mountains region in Morocco (Panta et al., 2023). Measurements predating the 1980 s were excluded, as the absence of satellite imagery prior to this period prevents reliable identification of dust emission events and source regions. This expanded dataset is publicly available via the zenodo repository (https://doi.org/10.5281/zenodo.21132304, Gómez Maqueo Anaya et al., 2026b), and the corresponding measurement locations are represented by blue dots in Fig. 3.
The subsequent systematic processing is illustrated in Fig. 4, which delineates the pathways for both in-situ observations (gray arrows) and COSMO5.05-MUSCAT simulation results (green arrows). The first decision step depends on the number of distinct dust events captured by each dataset. Measuring campaigns that sampled more than two distinct dust events are categorized as long-term campaigns, for which average mineral mass fractions at the measurement location grid cell are computed over the entire simulation period and compared directly against observations. This approach was applied to the datasets of Adedokun et al. (1989), Enete (2012), Formenti et al. (2008), Kandler et al. (2009, 2011), Møberg et al. (1991) and Panta et al. (2023).
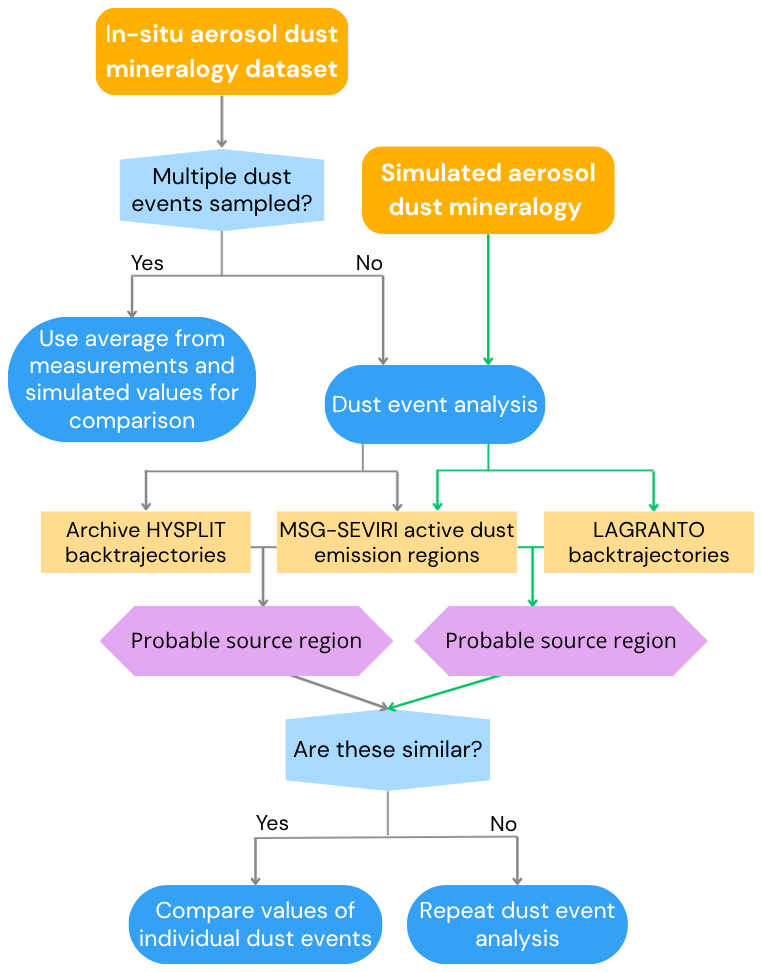
Figure 4Schematic representation of the workflow used to select and compare in-situ mineral dust measurements with COSMO5.05-MUSCAT simulations. Primary datasets are displayed in yellow boxes with slanted corners and bold text. The analysis pathway for simulated mineralogy is depicted by green lines and arrows, while the in-situ measurement selection process is indicated by gray lines and arrows. Decision points are represented by blue hexagons, procedural steps by blue octagons, supplementary datasets by yellow rectangular boxes, and final outcomes by lavender octagons.
In contrast, shorter campaigns covering two or fewer dust events required a more detailed matching procedure, initiating the “dust event analysis” workflow illustrated in Fig. 4. This methodology integrates HYSPLIT back trajectories (Stein et al., 2015) with satellite-derived dust emission records from the MSG-SEVIRI Dust RGB product (EUMETSAT) to identify probable source regions, following the approach of Schepanski et al. (2007), recently applied in Souza et al. (2025).
To ensure a like-for-like comparison, simulated dust plumes were selected only when their transport pathways and source regions were consistent with the specific observed events, with model output extracted from the grid cell corresponding to the geographic coordinates of each measurement site. The “dust event analysis” workflow, illustrated in Fig. 4, begins by identifying the probable source region of the observed sample using HYSPLIT back-trajectories (Stein et al., 2015) intersected with dust emission records from the MSG-SEVIRI Dust RGB product. Simultaneously, backward trajectories for simulated dust events were computed using the LAGRANTO tool (Miltenberger et al., 2013), driven by COSMO5.05 meteorological fields. Comparison with measurements proceeded only when the simulated and observed plumes originated from the same dust source region, thereby allowing for the direct matching of individual plume signatures with high-resolution model outputs.
Three campaigns required this rigorous event-based matching procedure: Alastuey et al. (2005), Jeong and Achterberg (2014), and Kandler et al. (2007). For Alastuey et al. (2005), which predates the MSG-SEVIRI record, Meteosat-7 natural color imagery was utilized to track the specific plume transported from southern Algeria to Tenerife on 29 July 2002. For the remaining campaigns, observed plumes were individually matched to simulated events by ensuring that both the HYSPLIT (observational) and LAGRANTO (model) back-trajectories intersected with the same active MSG-SEVIRI dust emission areas. The resulting compilation spans multiple seasons and years; while Saharan dust transport pathways exhibit pronounced seasonal variability (Barkan et al., 2004; Schepanski et al., 2009), the event-based matching procedure applied to the NH summer measurements ensures that the simulated and observed plumes originate from the same source region, mitigating potential biases introduced by seasonal differences in dust emission patterns.
To ensure a robust comparison between varying measurement techniques and model outputs, size-matching was performed based on the reported diameter ranges. For each comparison, the simulated mineral mass fraction was calculated by integrating the mass of a specific mineral across the relevant model bins and dividing this sum by the total simulated dust mass within those same bins. Minerals absent from a given size bin in the model are excluded from the comparison at that size, meaning that differences in mineral implementation between schemes affect the number of available data points. For campaigns reporting bulk measurements, model values were integrated across all available size bins (BIN01 through BIN80). For measurements classified as “clay”, the mass fraction was derived from , while “silt” classifications were compared to the average of . For the campaign reporting high-resolution size distributions (Panta et al., 2023), model bins were matched to the closest reported diameter ranges: 0–1 µm is compared to BIN01; 1–2 µm to BIN03; 4–8 µm to BIN09; 8–16 µm to BIN26; and 32–64 µm to BIN80.
For the evaluation metrics, measurement sites are grouped by geographical region to reflect the commonality of dust sources and transport pathways. Group 1 comprises sites in the Sahel, specifically Niger and Nigeria; group 2 covers the receptor islands of the Canary Islands and Cabo Verde, and group 3 gathers sites surrounding the Atlas Mountains in Morocco. Given the limited number of data points within each group, the linear fit and correlation coefficient do not provide statistically meaningful information, and only the mean bias is reported for these grouped comparisons.
Following these size-matching and spatio-temporal constraints, the final size selected mineral mass fraction comparison is performed using the model output from the specific grid cell corresponding to each measurement site. While measurement uncertainties were not consistently reported across all original studies, they have been included in the comparison with simulated data whenever available.
Despite these rigorous criteria, inherent uncertainties remain. Meteorological anomalies or atypical seasonal transport patterns in the historical data may not be fully captured by the January–February 2022 simulation period. Furthermore, several sites are located near major dust sources where local emissions may dominate the observed mineralogy in ways the model's spatial resolution cannot fully resolve (e.g., Formenti et al., 2008; Kandler et al., 2009; Møberg et al., 1991; Panta et al., 2023). Finally, inconsistencies in particle size classification across datasets, such as varying definitions for “bulk”, “clay”, and “silt” fractions, introduce additional uncertainty. While model bins were mapped to these categories as previously described, the sensitivity of these boundaries (e.g., 2.0 vs. 2.5 µm) highlights the necessity for high-resolution, well-characterized, and concurrent datasets, such as those obtained during the DUSTRISK 2022 and JATAC 2022 campaigns.
4.3 Application to Cape Verde measurement campaigns
4.3.1 Mineralogy comparison
Within the Cape Verde campaigns, mineralogical measurements were exclusively available from the JATAC 2022 dataset. For this evaluation, simulated mineral mass fractions from the JAT-CM-01 and JAT-CM-02 experiments were compared against the in-situ observations by extracting model variables from the grid cells corresponding to São Vicente. To ensure temporal and vertical alignment, the model output is averaged over the specific sampling intervals and the documented altitude ranges of the UAV flights.
In terms of particle size, the JATAC 2022 observations are inherently compatible with the MUSCAT bin definitions, requiring no additional size-matching adjustments. However, BIN80 (32–64 µm) is excluded from the assessment due to the analytical detection limits of the substrate composition methodology (see Sect. 3). Consequently, each specific mineral mass fractions derived from the validated samples is directly matched to its corresponding simulated mass value up to BIN26 to evaluate the model's mineralogical representation.
4.3.2 Elemental comparison
Elemental compositions were evaluated for both the DUSTRISK and JATAC 2022 campaigns. To enable direct comparison with the filter-based measurements, simulated mineral mass concentrations were converted into elemental mass fractions using the stoichiometric percentages defined in Table 3. For each element, the total simulated mass is calculated by summing the contributions from all relevant minerals, which is then normalized by the total simulated dust mass to yield an elemental mass fraction. We focus our analysis on Fe, Si, Al, Mg, K, Ca, and S, as these elements serve as key tracers for mineral identification and source attribution in Saharan dust studies (Kandler et al., 2018; Formenti et al., 2011; Panta et al., 2023).
Table 3Mass percentage of key elements found in the COSMO5.05-MUSCAT simulated minerals. The smectite and feldspar groups are represented by a 1:1 averages of nontronite and montmorillonite, in the case of smectite and of microcline (K-feldspar) and albite (Na-feldspar) for feldspar. This selection is based on common mineralogical assemblages observed in Saharan dust aerosols (Scheuvens et al., 2013; Formenti et al., 2011, 2014).
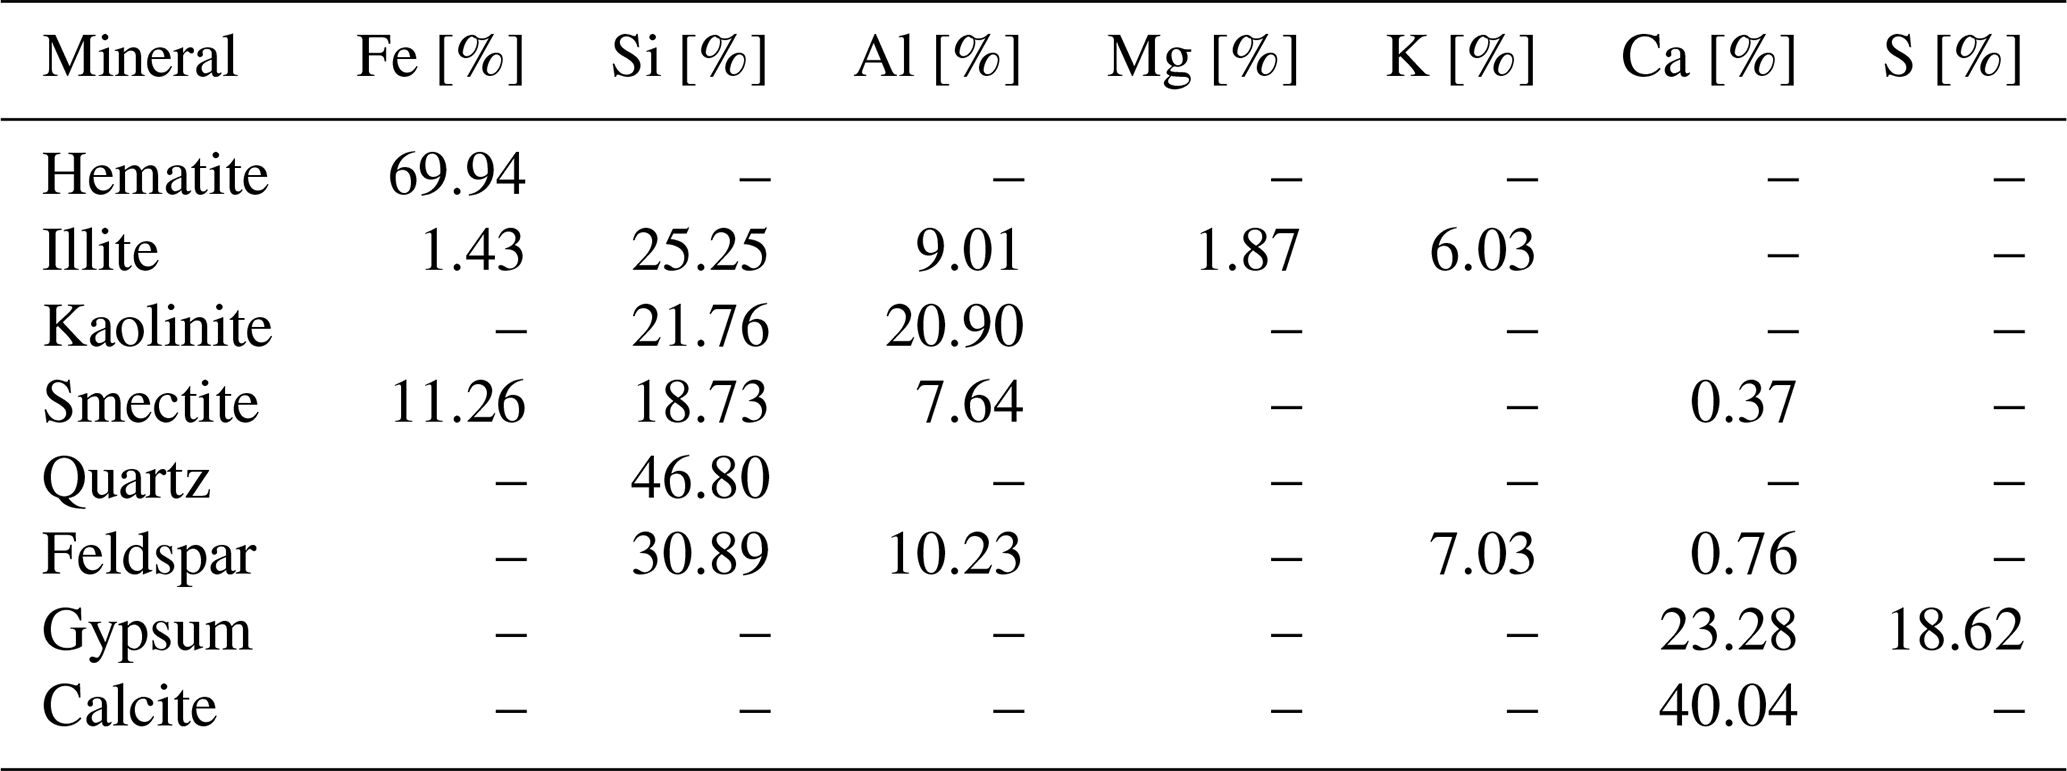
Feldspar and smectite exhibit significant natural variability in their elemental ratios; their stoichiometric coefficients were therefore selected to reflect the chemical signatures most commonly observed in the North African and Saharan source regions. For smectite, an average of nontronite and montmorillonite was applied. Although Mg-rich smectites are also present in the Sahara, their sources, such as ancient lake basins, are located far from Cabo Verde and would require an uncommon transport pathway to reach the archipelago, making a significant contribution unlikely. For feldspar an average of microcline and albite was selected to represent the K- and Na-feldspars characteristic of Saharan dust (e.g., Kandler et al., 2007; Formenti et al., 2014; Scheuvens et al., 2013).
It should be noted that the values in Table 3 are derived from the stoichiometric formulae of the respective minerals, whereas the identification criteria in Table A1 additionally incorporate characteristic elemental tracers for each mineral group. Alternative tracer selections have been employed in other modeling studies (Menut et al., 2020; Mahowald et al., 2026); the tracers used here were hand-selected to best reflect the mineralogical signatures expected for Saharan dust reaching the Cabo Verde receptor site.
The size-matching procedure is adjusted to reflect the specific sampling characteristics of each campaign:
-
DUSTRISK: Observational elemental masses from inflow sites were normalized by the total measured mass. To match the reported size fractions, model outputs were aggregated into PM2.5 () and PM10 ().
-
JATAC: No size-matching adjustments were required, as the measurement characteristics align directly with the MUSCAT bin definitions from BIN01 to BIN26.
5.1 Mineralogy
To evaluate the performance of the “modified” mineralogical scheme, we compare the simulated dust composition against two distinct observational benchmarks. First, we assess the model's ability to capture the general characteristics of North African mineral dust using a comprehensive compilation of historical aerosol measurements from across the region as described in Sect. 4.2. This provides a baseline for regional performance. Second, we evaluate the scheme's precision during a specific transport event using high-resolution mineralogical data from the JATAC 2022 campaign. Together, these comparisons provide a complementary validation of the model's capacity to represent both the broad regional characteristics and the episodic variability of dust mineralogy.
5.1.1 Compilation of North Africa aerosol mineralogical measurements
The two simulations covering the DUSTRISK 2022 period, CM-DUST-01 (“original” scheme) and DUST-CM-2 (“modified” scheme), are evaluated here. Only mean biases are reported per site group, as sample sizes preclude a statistically meaningful correlation analysis (Table 4); the full per-mineral dataset is shown in Fig. 5, where yellow stars denote DUST-CM-02 and error bars represent observational uncertainties where available. As expected from the structural changes introduced in the “modified” scheme (Sect. 2.3), the transition from DUST-CM-01 to DUST-CM-02 results in a redistribution of mass among mineral species, with higher simulated mass fractions for illite and kaolinite and lower fractions for quartz and feldspar.
Table 4Mean bias (MB) of the mineral mass fractions for the “original” (DUST-CM-01, abbreviated CM-01) and “modified” (DUST-CM-02, abbreviated CM-02) schemes, evaluated against the North African measurement compilation. Results are organized by geographical group as defined in Sect. 4.2: group 1 (Sahel: southern Niger and Nigeria), group 2 (receptor islands: Canary Islands and Cabo Verde), and group 3 (Atlas Mountains region, Morocco). The number of observation points used for each comparison is indicated in the parentheses superscript (n).
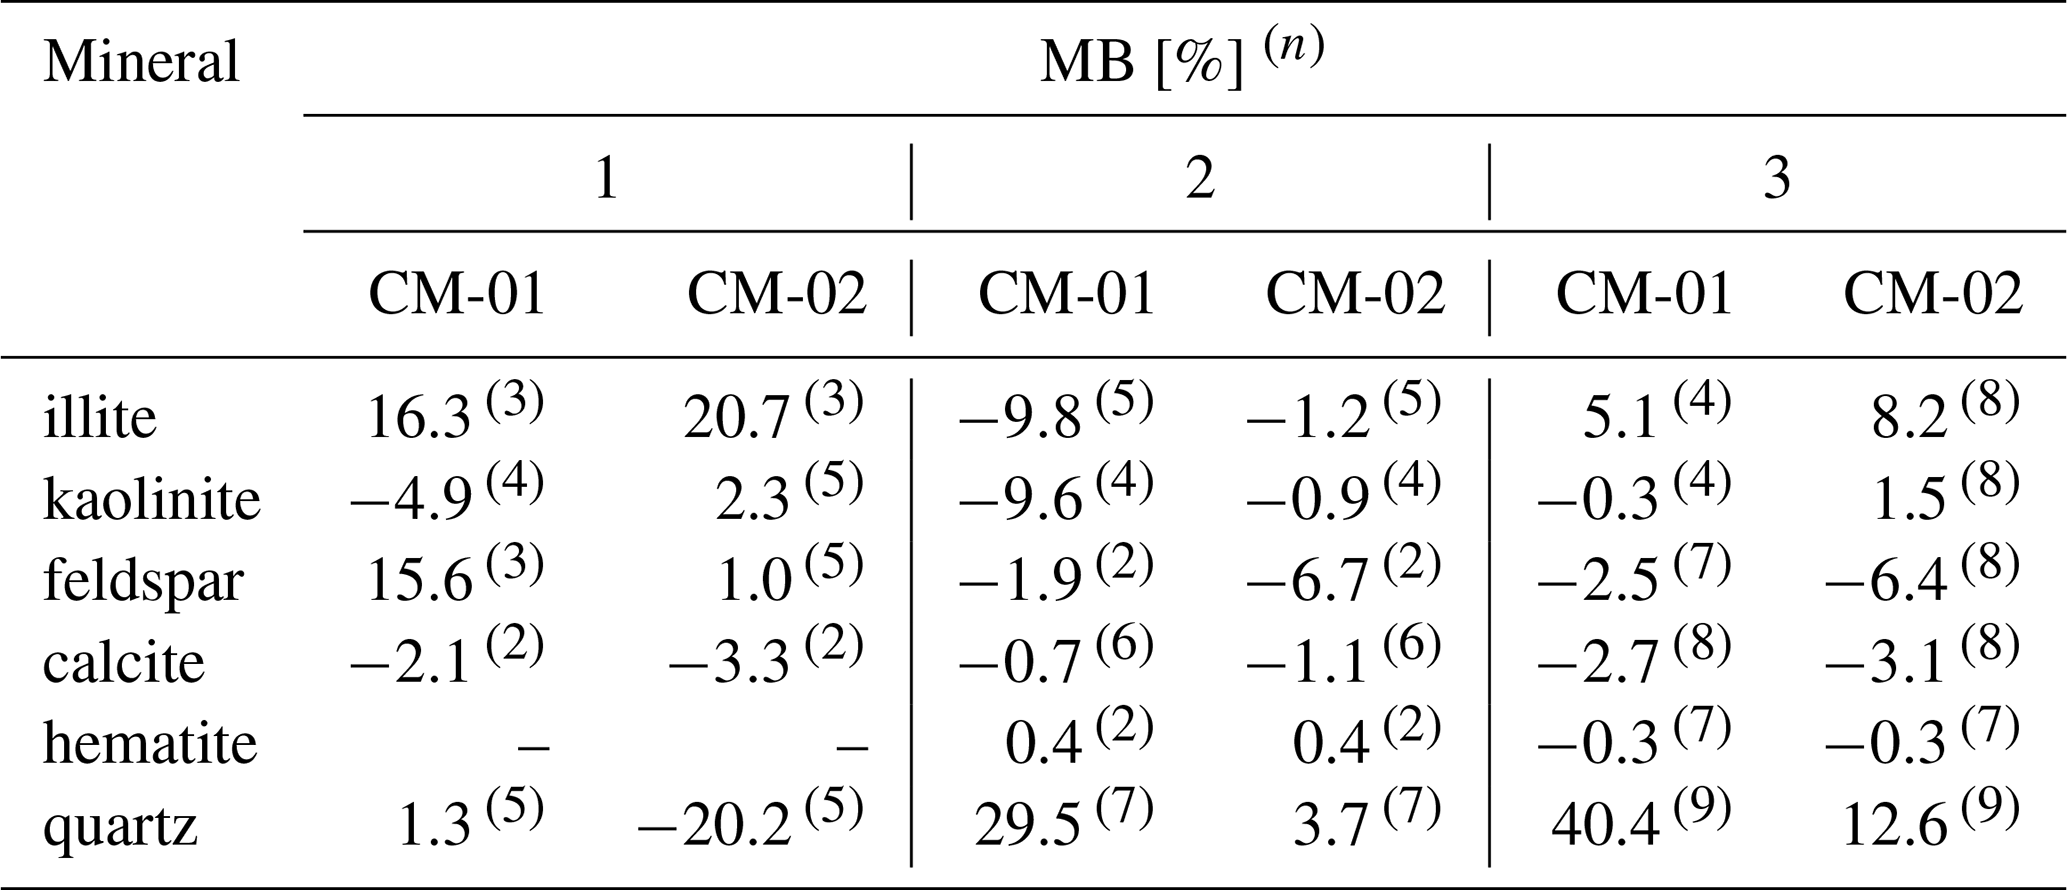
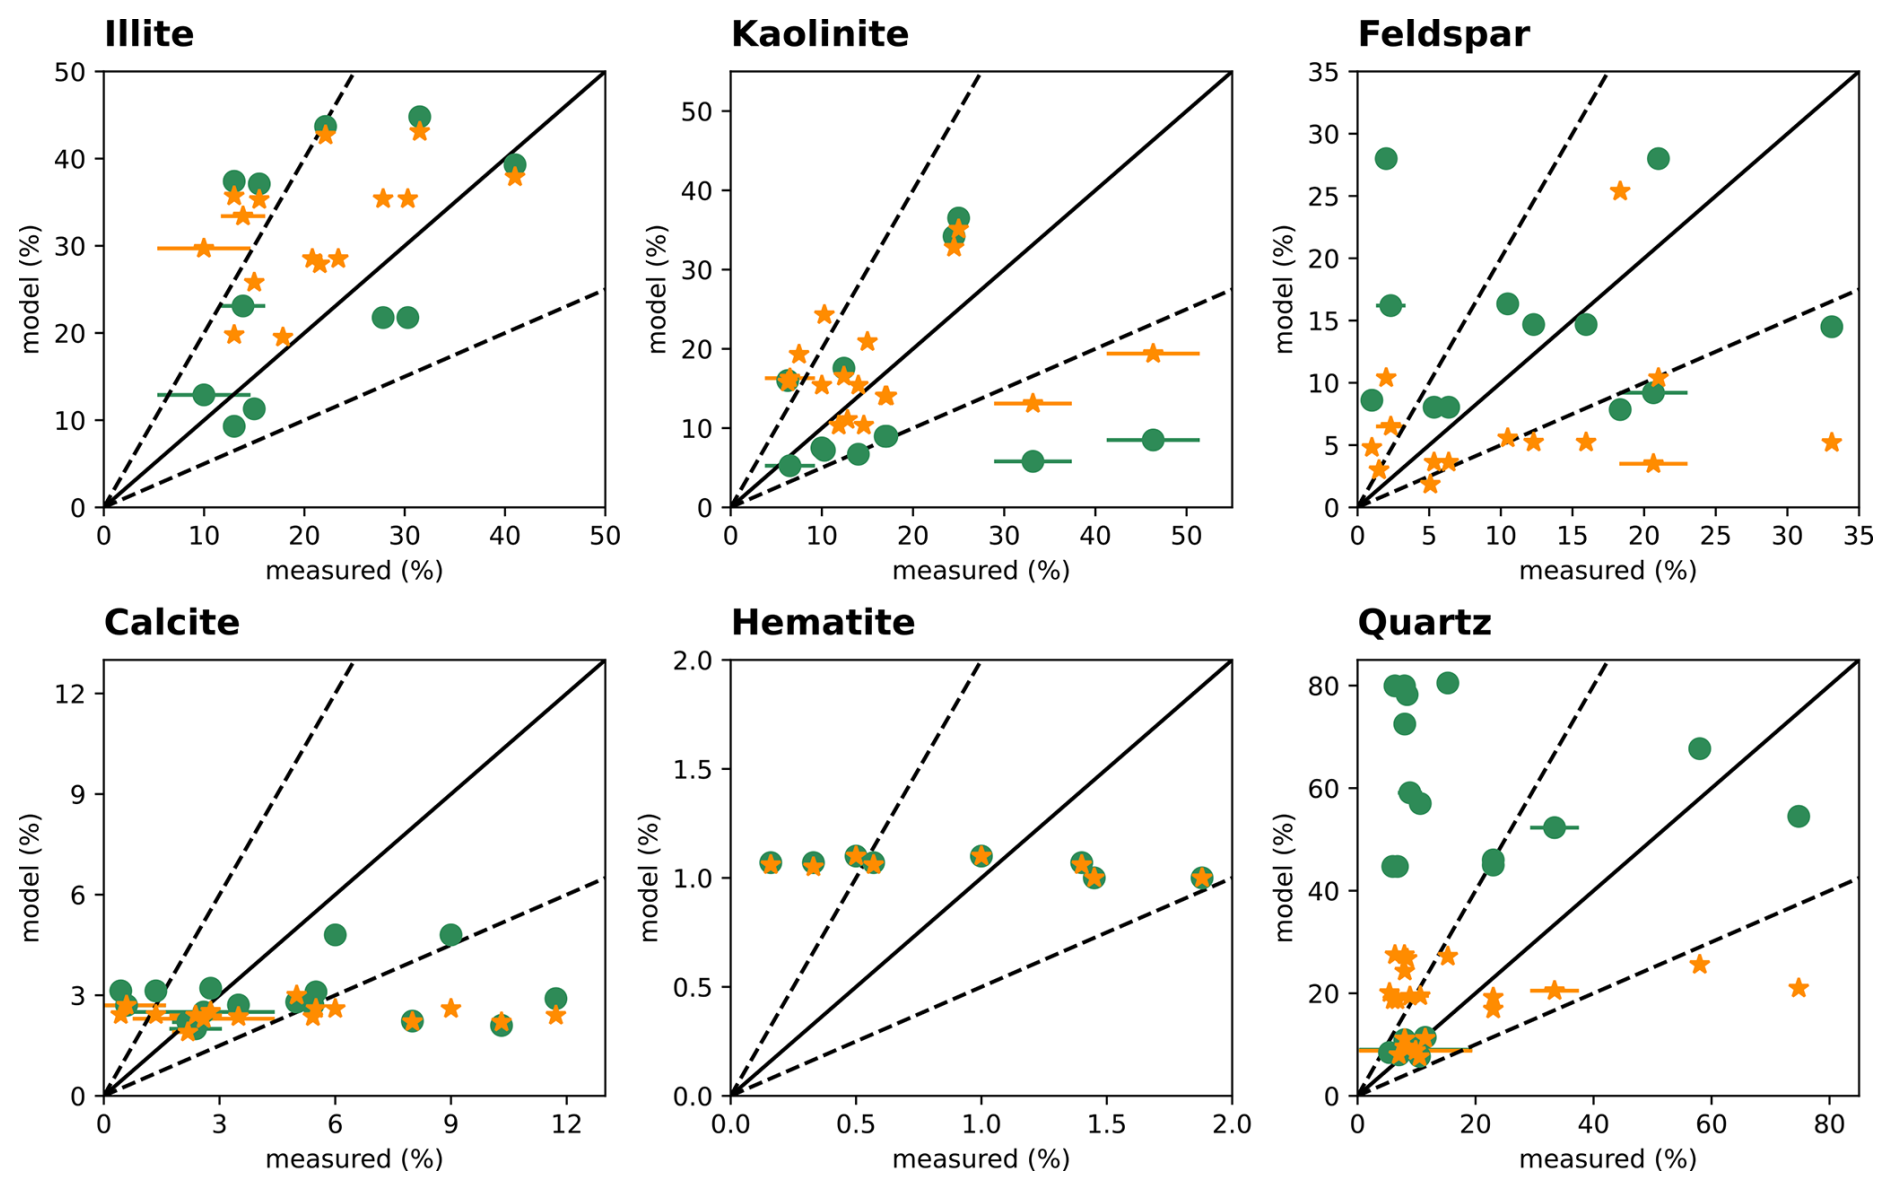
Figure 5Scatterplots of mineral mass percentages of illite, kaolinite, feldspar, calcite, hematite and quartz measured vs. simulated values. Results from the “original” simulation (DUST-CM-01) are shown as green solid dots, while the “modified” approach (DUST-CM-02) is illustrated by yellow solid stars. The dashed lines represent the 1:2 and 2:1 ratios between simulated and observed values. Error bars indicate observational uncertainties as reported in the original studies; where no error bars are present, uncertainties were not provided in the source data. The comparison includes both bulk and size-segregated measurements, with model bins aggregated to match reported diameter ranges as detailed in Sect. 4.2.
When evaluated against the North African measurement compilation (Fig. 5), the redistribution of mineral mass in DUST-CM-02 leads to mixed results across mineral species and measurement groups (Table 4). The most striking improvement is observed for quartz, where the reduced simulated mass fractions in DUST-CM-02 substantially decrease the systematic overestimation present in DUST-CM-01. For groups 2 and 3, the MB drops from 29.5 % to 3.7 % and from 40.4 % to 12.6 %, respectively, representing a considerable reduction in bias. For group 1, however, the modest overestimation in DUST-CM-01 (1.3 %) becomes a notable underestimation in DUST-CM-02 (−20.2 %), suggesting that quartz content in those measurement points may be higher than captured by the “modified” scheme, possibly reflecting proximity to quartz-rich source regions where quartz is measured before significant deposition or long-range transport has occurred.
For illite, DUST-CM-02 shows a clear improvement for group 2, notably the group where measurements are predominantly from long-range transport, reducing the MB from −9.8 % to −1.2 %. For groups 1 and 3, the already positive biases increase slightly, from 16.3 % to 20.7 % and from 5.1 % to 8.2 %, respectively. The increase in data points for group 3, from n=4 to n=8 is due to the “modified” scheme extending the size range over which illite is simulated, enabling comparisons previously excluded due to the absence of simulated illite at those sizes. Notably, the overestimation does not increase proportionally to the added points, suggesting that the newly included size bins do not systematically worsen the bias. The persistent overestimation in groups 1 and 3 may partially reflect localized emissions from areas with relatively low illite content, including the southern Niger region of the Sahel and southeastern region off the Atlas Mountains (Nickovic et al., 2012). These discrepancies must be partly attributed to the broad mineralogical definition of illite group, which complicates unique identification (Rieder et al., 1998, and references therein).
Kaolinite follows a broadly similar pattern, with DUST-CM-02 reducing underestimation across all groups and yielding the closest overall agreement with observations in the compilation. As with illite, the increase in data points in groups 1 and 3 reflects the extended size coverage of the “modified” scheme.
For feldspar, DUST-CM-02 produces a marked improvement for group 1, reducing the MB from 15.6 % to 1 %, while also expanding the number of available data points. Group 1 is located in region of relatively low feldspar content (Nickovic et al., 2012), and since high quartz abundance is generally associated with lower feldspar content (Scheuvens et al., 2013), the reduction in simulated feldspar mass in DUST-CM-02 is most consistent with the mineralogical characteristics of this regions. In contrast, groups 2 and 3 show a notable increase in model negative biases indicating that “modified” scheme does not adequately represent feldspar content in regions where higher abundances are expected, nor along the long-range transport pathways that connect these source areas to the receptor sites.
The representation of calcite and hematite remains a challenge. Calcite shows a consistent but modest increase in underestimation across all groups in DUST-CM-02, with the MB shifting from −2.1 % to −3.3 % for group 1, from −0.7 % to −1.1 % for group 2 and from −2.7 % to −3.1 % for group 3. Notably, the largest absolute bias occurs in Group 1, where low calcite content is expected from the surrounding soil mineralogy (Nickovic et al., 2012), suggesting that even small reductions in simulated calcite mass are sufficient to generate a discernible bias in low-abundance regions. While the changes are small in absolute terms, their systematic direction suggests that the mass redistribution in the “modified” scheme reduces calcite representation by reallocating emission mass towards phyllosilicates. Hematite biases, on the other hand, remain unchanged between schemes with non-negligible MB values across available groups. The insensitivity of the scheme change is expected, as hematite is not directly reallocated; nonetheless, the persistent biases and limited variability in the simulated values raise questions about the model's ability to accurately capture the spatially variable hematite content characteristic of Saharan dust sources.
Spatial scale mismatches between point observations and model grid-cell averages should also be considered when interpreting these results. The FRAGMENT campaign (Panta et al., 2023), which added ∼40 % more data to the reference set (Fig. 5 in Gómez Maqueo Anaya et al., 2024), was conducted in the Drâa Valley, Morocco, near active dust source regions where small-scale convective emission events can produce highly local mineralogical signatures that the model's at 28 km spatial resolution cannot resolve. Similarly, several other measurement campaigns in the compilation were conducted close to dust sources, reflecting local emissions rather than regional transported mineral fractions the model is designed to simulate. Seasonal coverage also plays a role: while some campaigns spanned transitional months with shifts in dominant source regions, the simulations are restricted to NH winter (January–February), potentially missing these seasonal variations (Gebauer et al., 2026). Nonetheless, DUST-CM-02 provides a more robust baseline for mineralogical validation than its predecessor, and by identifying where temporal and spatial representativeness limit the model-observation agreement, this analysis clarifies the specific observational constraints needed to further reduce uncertainty in mineral dust modeling.
5.1.2 Comparison with JATAC 2022
The JATAC 2022 campaign provides size-resolved mineralogical measurements that allow a detailed evaluation of both the “original” (JAT-CM-01; Gómez Maqueo Anaya et al., 2024) and “modified” (JAT-CM-02; Sect. 2.3) schemes across individual mineral species. Results for phyllosilicates (individually and grouped as “clay minerals”) are presented in Fig. 6, while Fig. 7 shows the comparisons for quartz, calcite, feldspar, and gypsum, and Fig. 8 shows the comparison for hematite. The summary of the statistical metrics, including the mean bias (MB) and the slope and intercept of the uncertainty-weighted linear fit, is provided in Table 5 for all mineral species and size bins. The size-matching procedure follows the methodology described in Sect. 4.3, with measurements binned to match the COSMO5.05-MUSCAT size categories (BIN01 through BIN26).
Table 5Statistical metrics for the “original” (JAT-CM-01) and “modified” (JAT-CM-02) model schemes evaluated against JATAC 2022 mineral measurements: mean bias (MB), and the slope (m) and intercept (b) of the observational uncertainty weighted linear fit (mx+b). The default number of data points is n=17; deviations are indicated by a superscript.
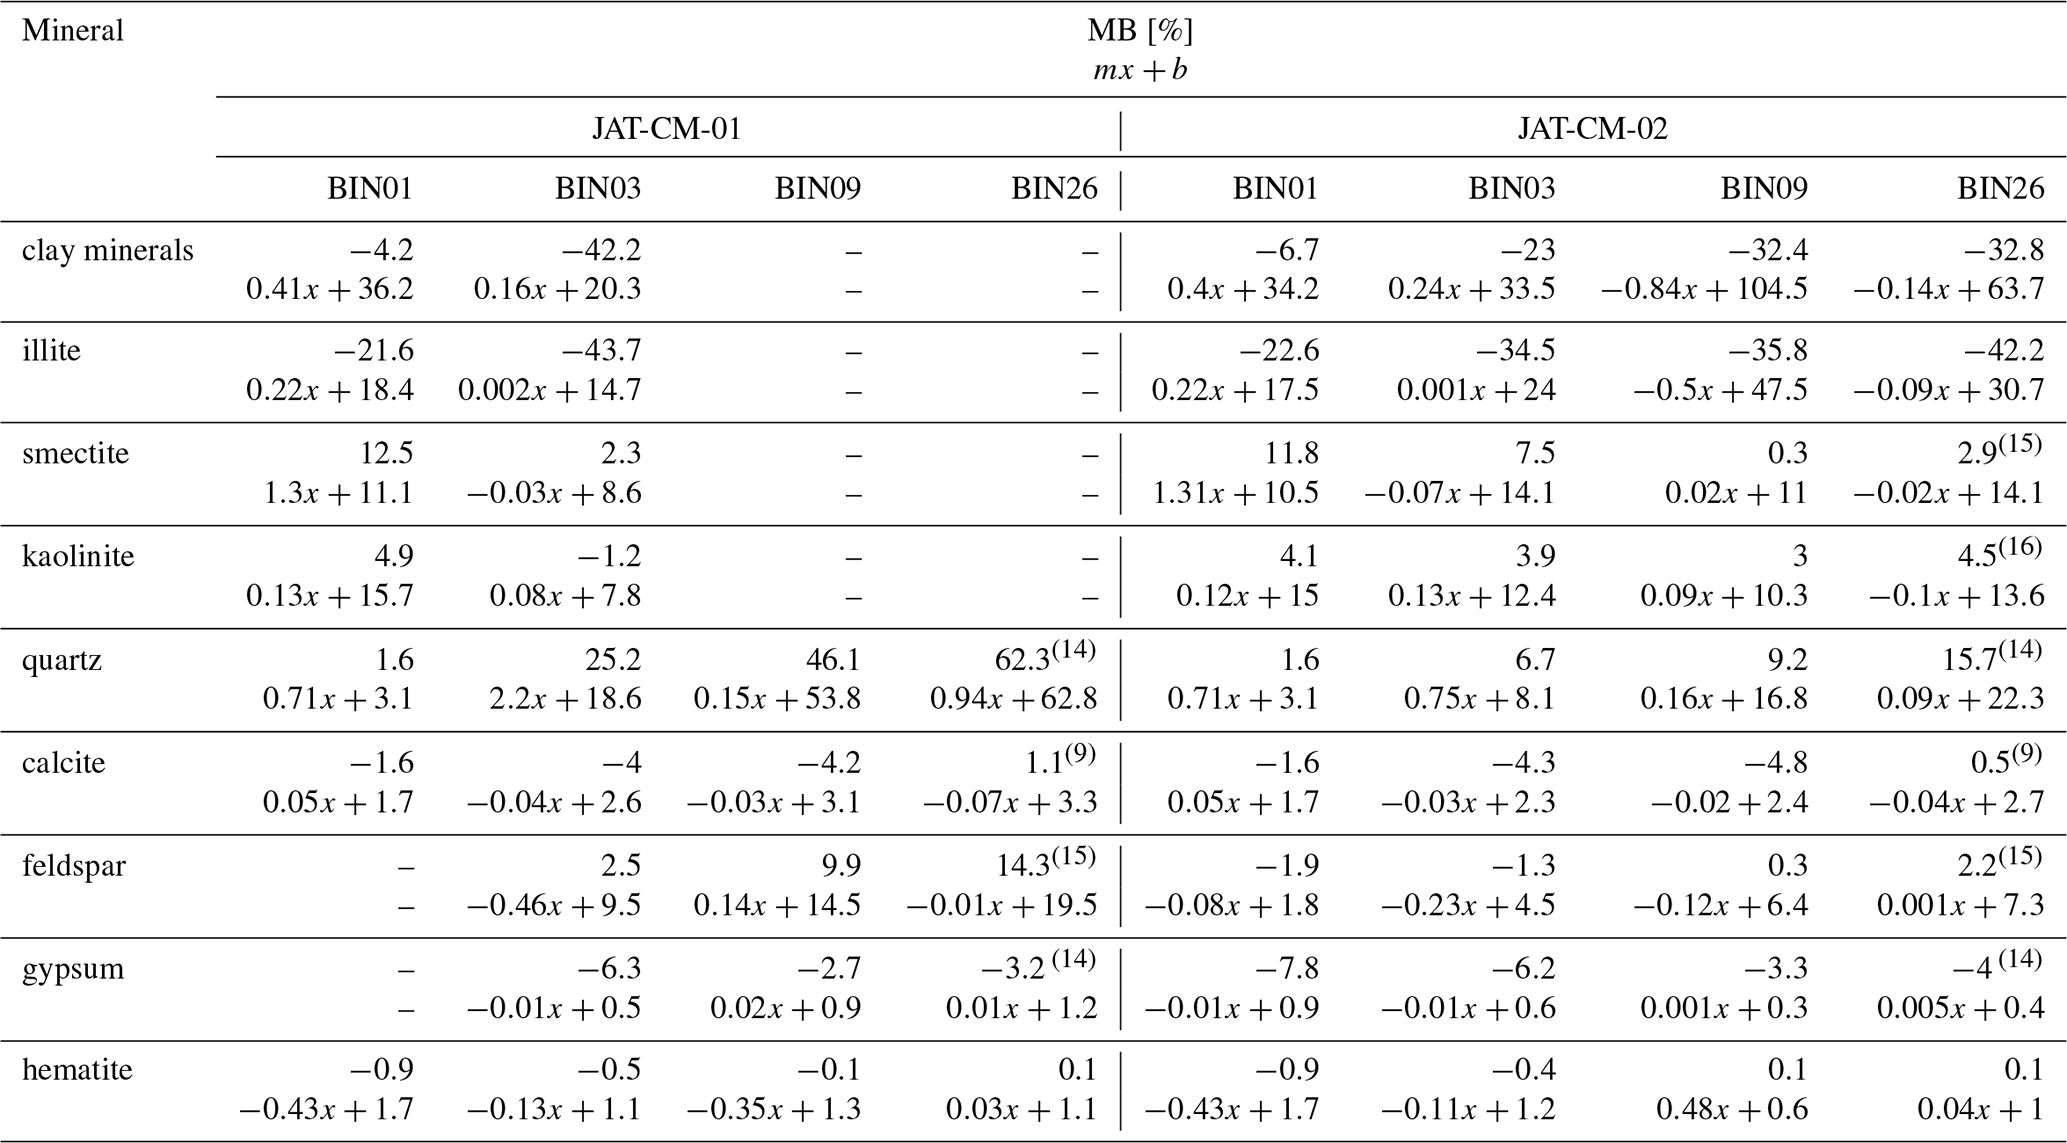
The first notable feature in Fig. 6 is that the observational uncertainties reported for BIN26 are too large to support any meaningful model diagnostic from these data. For the grouped phyllosilicates, the model generally underestimates the total mass fraction across all size ranges. A key functional improvement of the “modified” scheme (JAT-CM-02) is the redistribution of these minerals into coarser size bins, enabling a direct comparison beyond the sub-2.5 µm fraction where the “original” scheme was restricted. In the finest fraction (BIN01), both approaches show a similar underrepresentation with MB values of −4.2 % for JAT-CM-01 and −6.7 % for JAT-CM-02. However, in BIN03, JAT-CM-02 reduces the underestimation by half compared to JAT-CM-01 (−23 % vs. −42.2 %), suggesting that the “modified” scheme more accurately captures the mass distribution in coarser fractions. Within the expanded comparison size range, the model underestimation remains consistent across the coarser size bins (Table 5). Regarding the linear fit, the slope in BIN01 is similar between schemes (0.41x+36.2 for JAT-CM-01 and 0.40x+34.2 for JAT-CM-02; Table 5), reflecting the concentration of most measured values around the 80 % mass fraction (Fig. 6) which limits the dynamic range available for regression at this size. Spatial correlations (rp) are highest in BIN01, nonetheless, and similarly insensitive to the scheme differences (Fig. 6). In BIN03, the slope improves with the “modified” scheme (from 0.16x+20.3 to 0.24x+33.5), consistent with the reduction in MB, suggesting that JAT-CM-02 better captures the spatial variability of the phyllosilicate mass fractions at this size despite the persistent underestimation, an improvement not reflected in rp value. (Table 5 and Fig. 6).
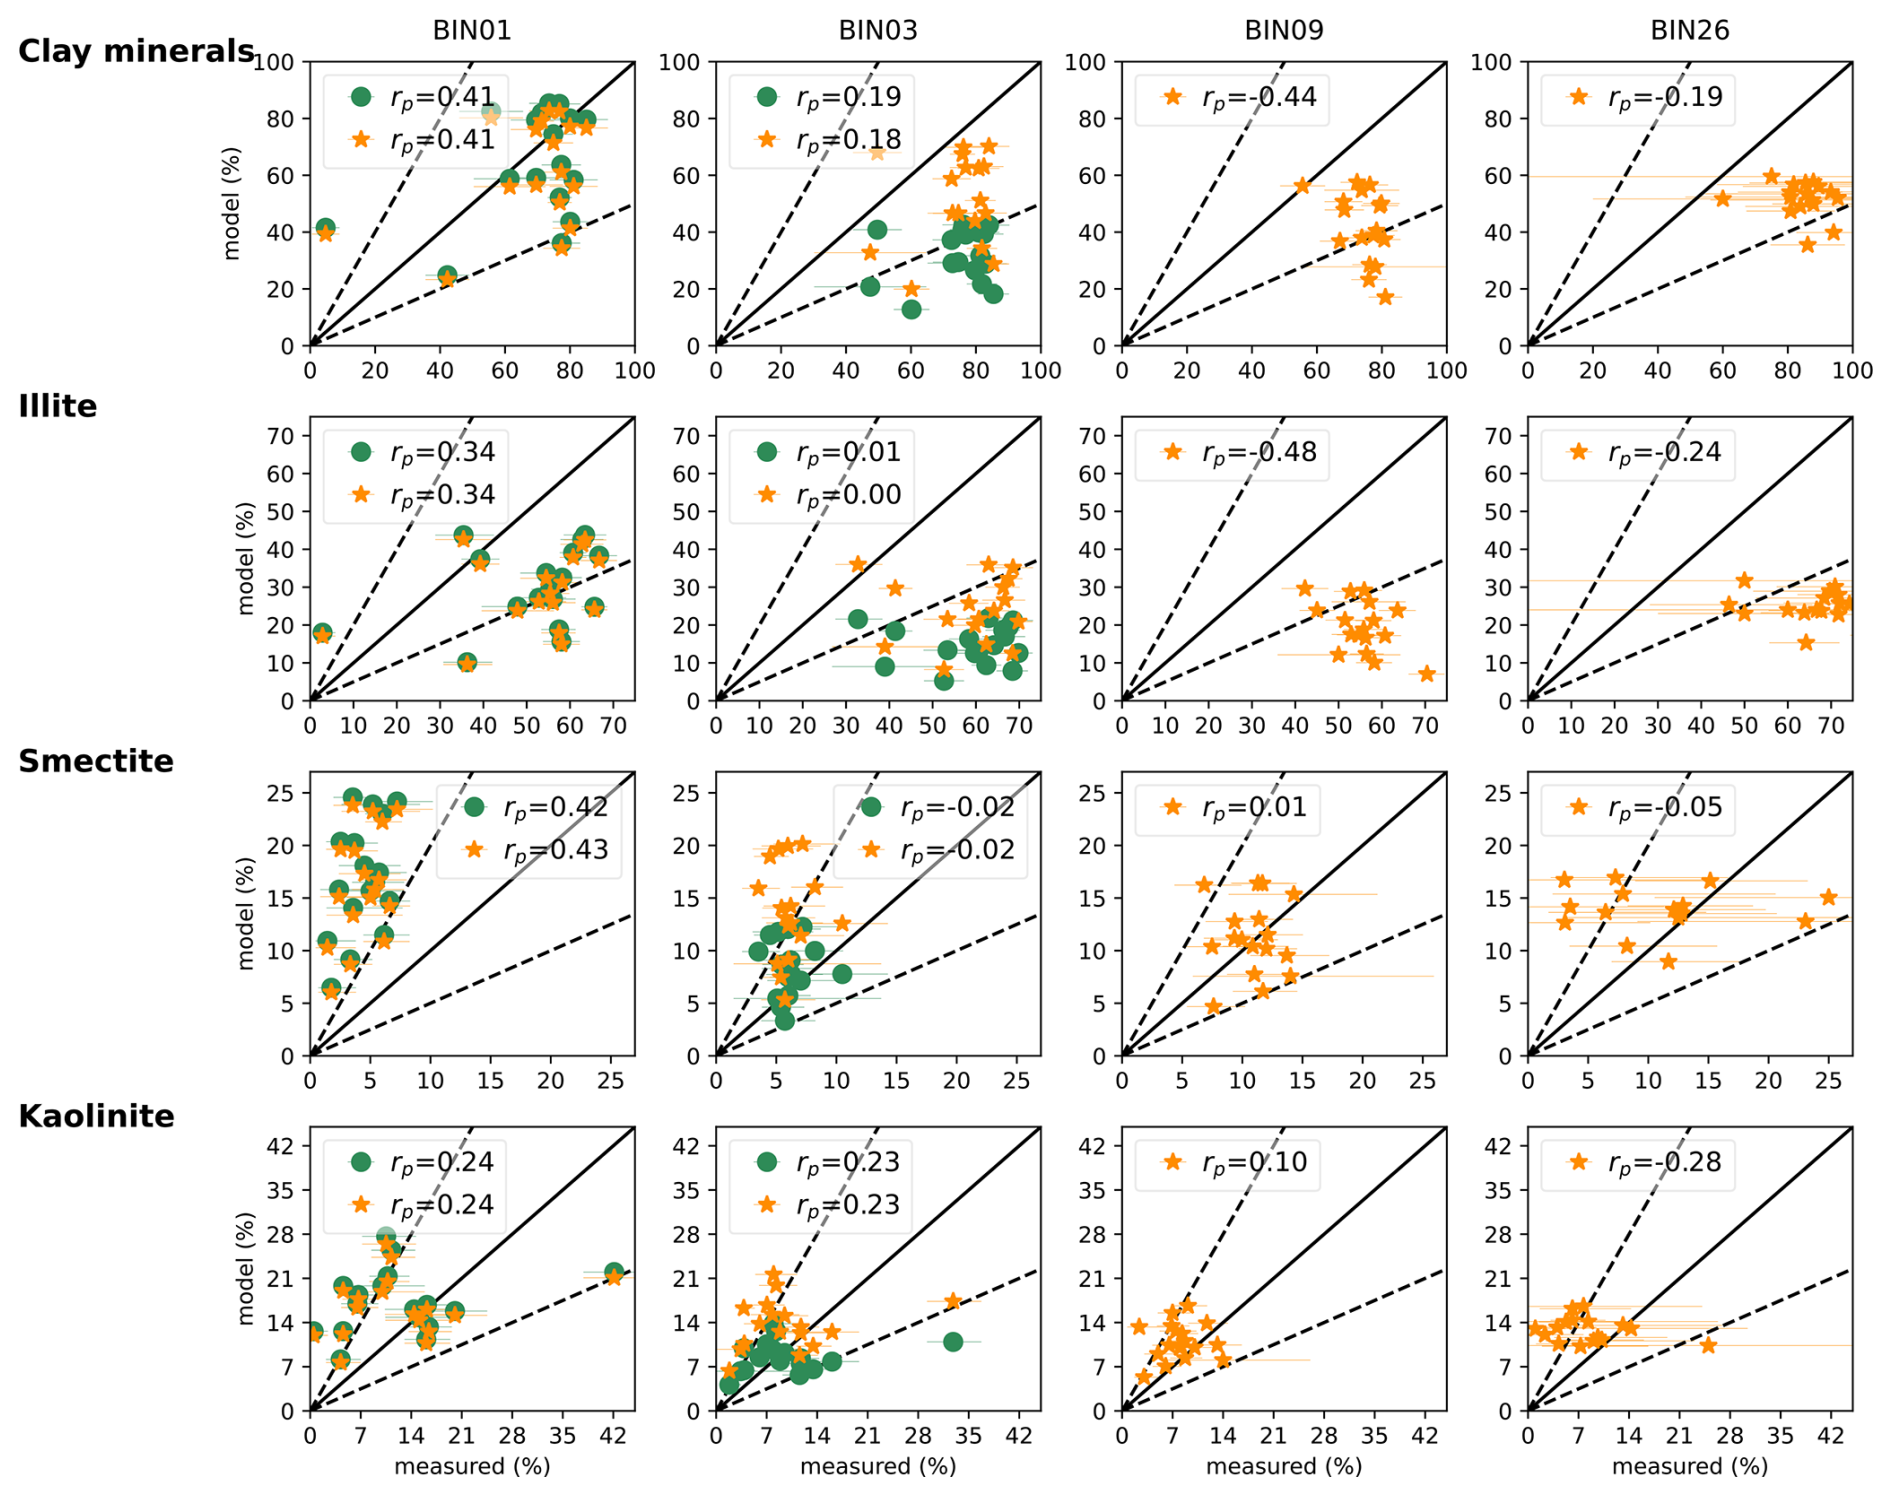
Figure 6Scatterplots of minerals mass percentages for the grouped “clay minerals”, illite, smectite, and kaolinite vs. simulated by COSMO5.05-MUSCAT. “original” mineral emission scheme (JAT-CM-01) in green solid dots while the “modified” version (JAT-CM-02) is shown in yellow solid stars. The titles of the columns are size classifications from COSMO5.05-MUSCAT, the diameter ranges they represent are described in Table 1. The dashed lines represent the ratios of 2:1 and 1:2 between the simulated and observed mineral percentages. The error bars represent the lower and upper limits of the confidence intervals (between 2.5 % and 97.5 %). Uncertainty-weighted linear fits are reported in Table 5 but omitted from the figure for clarity, as the limited dynamic range in several size bins renders them visually uninformative.
Regarding individual species, measured illite fractions during JATAC 2022 were notably high, falling above the typical ranges in the North African compilation (Fig. 5). This likely reflects the frequent aggregate nature of mineral dust aerosols, which are predominantly composed of Si- and Al-rich mineral particles, making phyllosilicates, and illite in particular, readily identifiable but difficult to distinguish unambiguously in the single-particle SEM-EDX analysis (Rieder et al., 1998). Furthermore, despite illite being a clay mineral, airborne dust measurements have consistently reported illite fractions well above what clay-size constraints would suggest (e.g., Panta et al., 2023). This discrepancy may partly arise from the wet-sieving methodology used to characterize soil mineralogy, as discussed in Sect. 2.3. The presence of illite in coarser size fractions is further explained by its tendency to form stable platelets and aggregates that survive natural wind-driven disaggregation, whereas mechanical and chemical treatment in soil analyses is more likely to break up such structures. SEM images of coarse illite-bearing particles collected during JATAC 2022 (Fig. C1) illustrate the size and variety of shapes these particles exhibit, including platelet-like and aggregate morphologies. Platelet-shaped particles likely are assigned to a larger size bin than the one that would match their actual volume-equivalent, which may be substantially smaller than that of a sphere of equivalent bin diameter as assumed in the model. As a result, the equivalent-volume sphere of such a platelet would fall into a smaller size bin, meaning that the measurement and the model are not directly comparable for these coarse, non-spherical particles, introducing an additional source of uncertainty for the comparison at these sizes.
Notwithstanding these complexities, both schemes systematically underestimate illite across all size bins. In BIN01, the MB values are similar between schemes, and the slopes of the linear fit are likewise nearly identical, indicating that the “modified” scheme introduces no meaningful change at this size. In BIN03, JAT-CM-02 reduces the underestimation from MB values of −43.7 % to −34.5 %, though the near-zero slopes in both cases (0.002x+14.7 and 0.001x+24) suggest that neither scheme captures the spatial variability of illite at this size, with the intercept dominating the fit. Within the expanded size range enabled by JAT-CM-02, the underestimation remains substantial and increases with particle size, with negative slopes for the coarser bins indicating an inverse relationship between simulated and observed values (Table 5). The Pearson correlation coefficient (rp) confirms this in BIN09 and remain insensitive to the choice of scheme for smaller size bins, with the strongest correlations and lowest mean biases occurring in BIN01 (Fig. 6 and Table 5).
Conversely, smectite and kaolinite are generally overestimated across both simulations. For smectite, the MB in BIN01 shows little change between schemes, with nearly identical slopes, indicating that JAT-CM-02 introduces no meaningful change at this size. In BIN03, the overestimation increases from 2.3 % to 7.5 % under JAT-CM.02, with near-zero slopes in both cases, suggesting that neither scheme captures the spatial variability of smectite at this size. Within the expanded size range, BIN09 shows near-neutral biases and negative rp values, indicating that the model reproduces the mean smectite fraction reasonably well at coarser sizes but without spatial skill. For kaolinite, the MB improves slightly in BIN01, with slopes and rp values remaining low and stable between schemes. In BIN03, JAT-CM-02 over corrects, shifting a slight underestimation (−1.2 %) to an overestimation (3.9 %), though the slope improves modestly; notably, kaolinite is the only individual phyllosilicate that retains weak but stable spatial correlation at this size bin. In BIN09, kaolinite remains moderately overestimated (3 %) (Fig. 6 and Table 5).
As expected, the spatial correlations for the grouped phyllosilicate category are similar to those of the individual species, since rp is primarily governed by the geographical distribution of minerals in the parent soil, which is unchanged between schemes. While the “modified” scheme redistributes emitted mineral mass across size bins, it does not alter the underlying source patterns, and spatial correlations would therefore be expected to remain stable if the PSD redistribution scaled uniformly across the domain. However, nearly all rp values for the coarser size bins are negative, suggesting that the redistribution might be introducing spatially variable shifts in mineral mass that are inconsistent with observations. Notably, the strongest negative correlation in the entire dataset occurs for illite in BIN09 (), indicating that the model systematically places coarse illite mass in locations where observations suggest it should be low, and vice versa (Fig. 6). This likely reflects the constraining transport behavior between the model and reality: the model treats minerals as discrete spherical particles subject to gravitational settling, whereas in reality, coarse illite is predominantly transported as aggregates and within a variety of shapes (Fig. C1), enabling longer travel distances than an equivalent single spherical particle would achieve. Small errors in simulated emission locations or transport pathways are therefore amplified in the spatial distribution at receptor sites. Additionally, the redistribution of mass into coarse bins is derived from fine-fraction soil data via wet-sieving and one measurement campaign, which may systematically overestimate coarse illite in certain source areas and underestimate it in others. Finally, while the model's dust transport performance has been evaluated against AERONET AOT observations for this period and shows reasonable agreement (Gómez Maqueo Anaya et al., 2025), day-to-day shifts in circulation patterns not fully resolved by the meteorological driver, partly due to its spatial resolution, could result in incorrect source-receptor attribution for individual measurement events, introducing spatial mismatches independent of the mineralogical scheme.
These findings are consistent with those of Gonçalves Ageitos et al. (2023), who showed that the GMINER SMA (Nickovic et al., 2012) generally outperforms Journet et al. (2014) SMA in reproducing the spatial distribution of phyllosilicates, despite a tendency to overestimate kaolinite and smectite while underestimating illite across the Sahara. Their analysis further showed that for fine clay-sized fractions, illite is often overestimated near sources but underestimated during long-range transport, whereas coarser silt-sized illite is systematically underestimated. Together, these results suggest that while the mass redistribution introduced by JAT-CM-02 improves the size representation of phyllosilicates, and some mass biases, it may also amplify existing uncertainties in the regional source functions, particularly for illite, where the limitations of the underlying soil mineralogical database remain the dominant source of error.
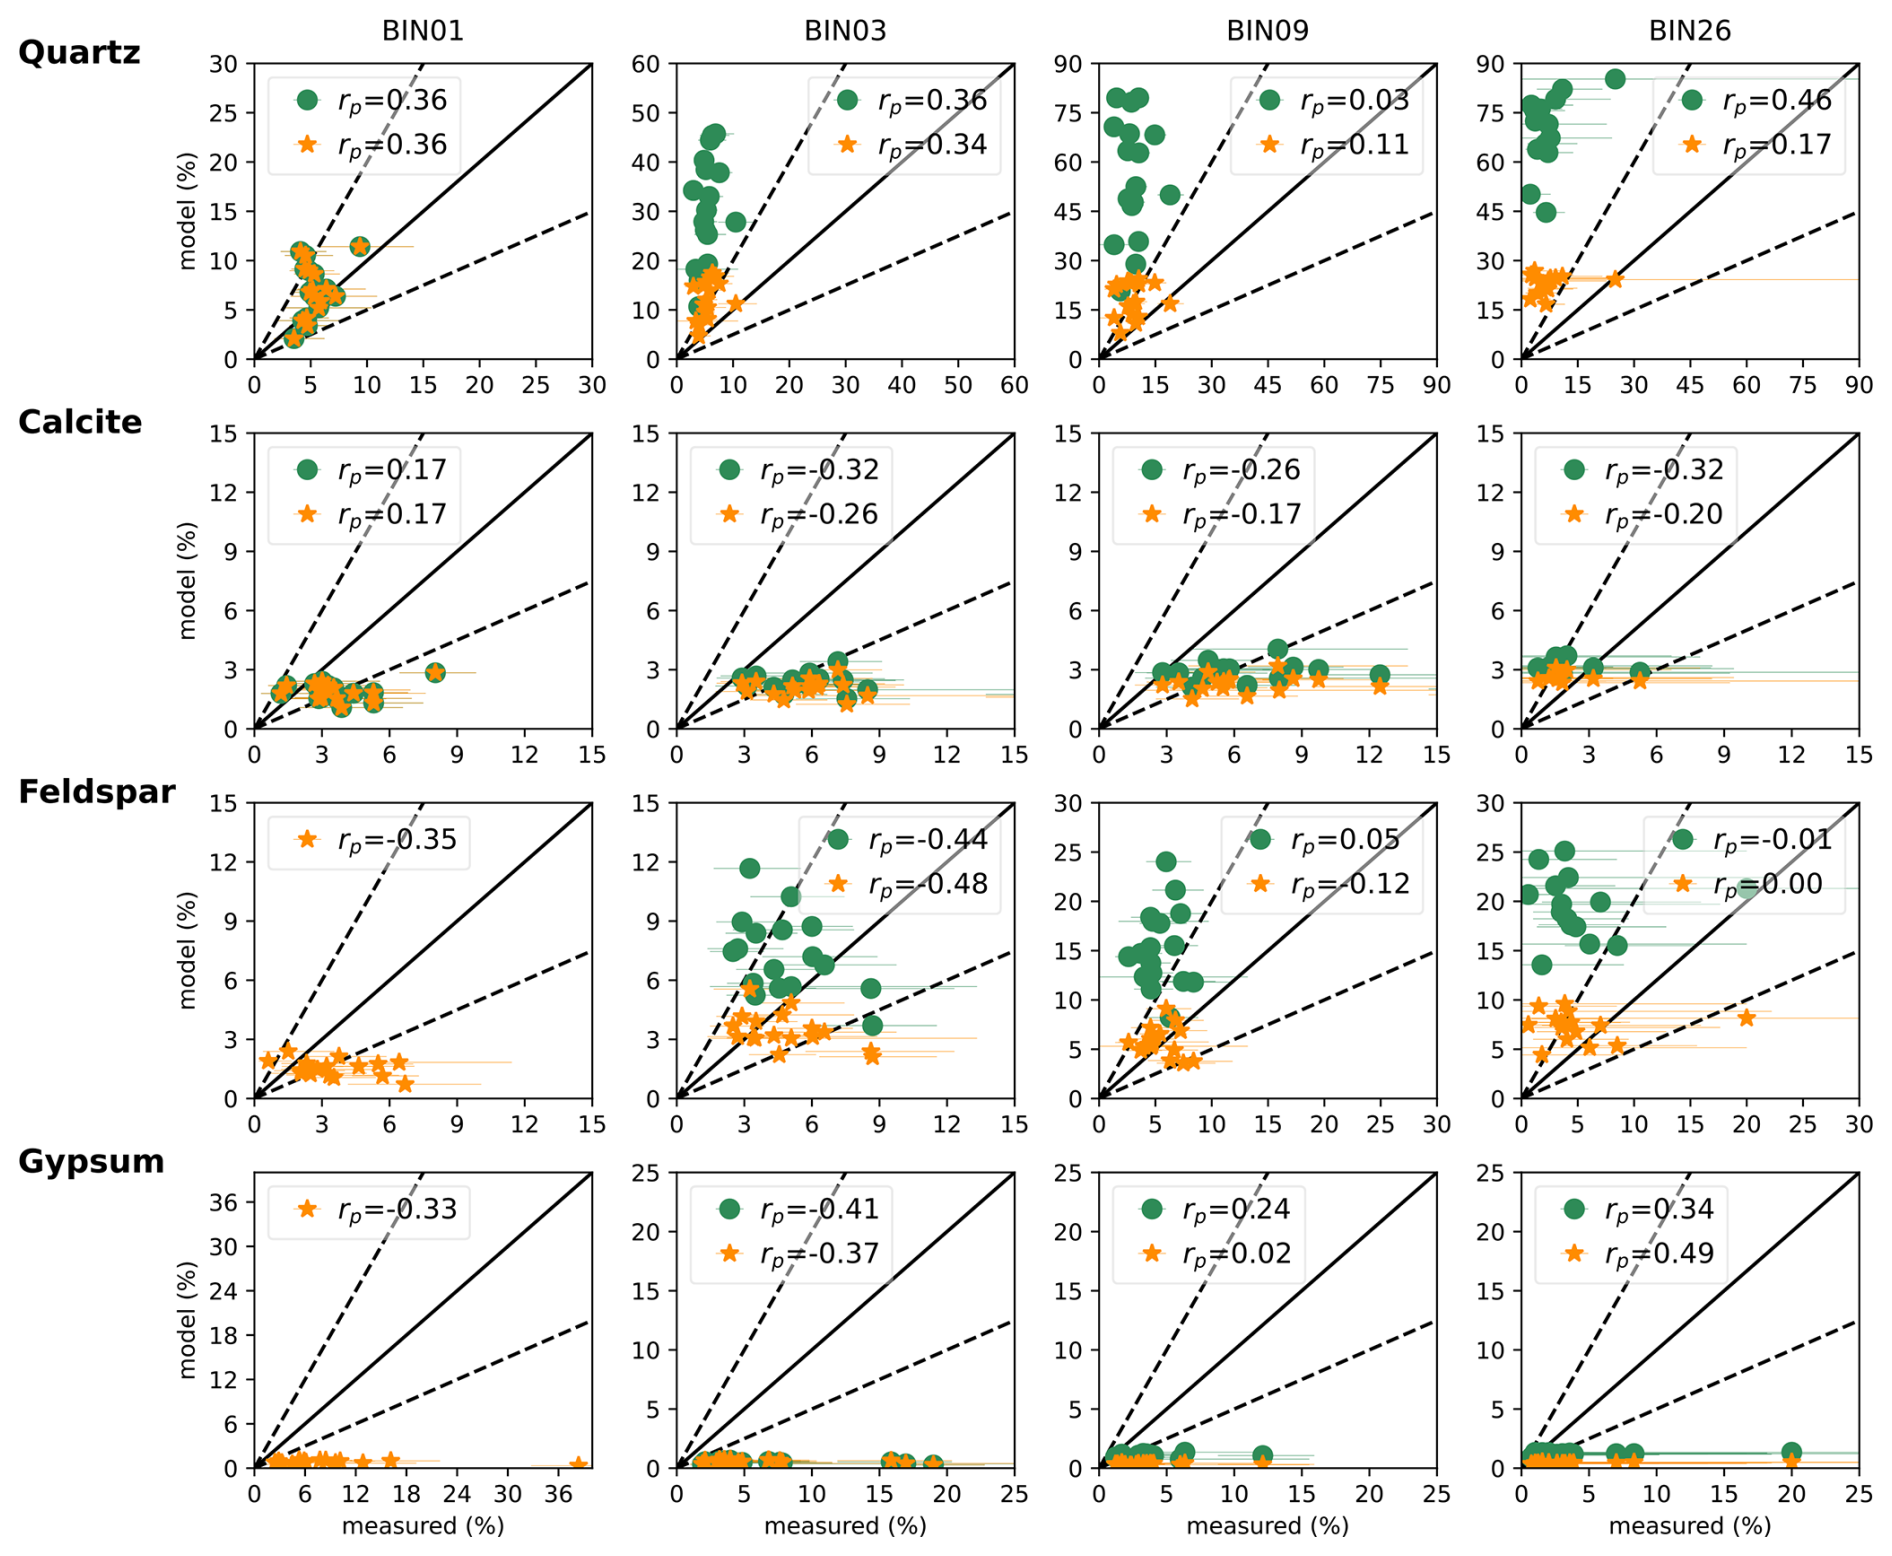
Figure 7As in Fig. 6 but for quartz, calcite, feldspar, and gypsum. Note: Axis scales vary between panels to optimize the visibility of the fine fractions for quartz, feldspar and gypsum.
For the non-phyllosilicates minerals shown in Fig. 7, JAT-CM-02 produces the most susbtantial improvements for quartz and feldspar, while calcite and gypsum remain largely unchanged between schemes. Quartz is strongly overestimated in JAT-CM-01 from BIN03 onward, with MB values of 25.2 %, 46.1 %, and 62.3 % for BIN03, BIN09, and BIN26, respectively, accompanied by a slope of 2.2x in BIN03 indicating that the model greatly amplifies the observed spatial variability at that size. JAT-CM-02 substantially reduces these biases to 6.7 %, 9.2 % and 15.7 %, with the slope of BIN03 returning to a more physically plausible 0.75x. In BIN01, both schemes produce identical results, confirming that the modification does not affect its finest fraction (Table 5). Despite these improvements, overestimation persists across all size bins in JAT-CM-02, and spatial correlations remain weak and highly variable. The correlation for BIN09 improves modestly under JAT-CM-02, but decreases importantly for BIN26 (Fig. 7). The sharp decline in quartz correlation for BIN26 likely reflects the reduction in simulated coarse-mode mass in JAT-CM-02: while this correction brings the mass bias closer to observations, it simultaneously weakens the spatial signal of the quartz plume, making the correlation increasingly sensitive to localized transport mismatches and the preferential deposition of coarse particles on a discrete spherical particle simulation scheme before reaching distant measurement sites.
Similarly, feldspar shifts from strong overestimation in JAT-CM-01, with MB values of 2.5 %, 9.9 % and 14.3 % for BIN03, BIN09, BIN26, respectively, to near-neutral biases across all sizes in JAT-CM-02 (−1.9 %, −1.3 %, 0.3 %, 2.2 % for BIN01 throughout BIN26), representing one of the most consistent quantitative improvements of the “modified” scheme (Table 5). Interestingly, this contrast with the broader North African compilation, where the same mass reductions exacerbated existing underestimations in groups 2 and 3 (Table 4), highlighting the regional dependence of the scheme's performance. The worsening in group 2 is particularly noteworthy given that it includes Cabo Verde measurements, suggesting that the observational dataset or sampling conditions underlying that group may differ in other ways that resulted in higher concentration of feldspar measured than what was measured during JATAC 2022. Regardless, the quantitative improvements at JATAC are not reflected in the spatial correlations, which show no meaningful change across any size bin; as with most other minerals, the large observational uncertainties in BIN26 further limit the spatial diagnostic at that size (Fig. 7).
Calcite and gypsum remain consistently underestimated across all size fractions in both schemes, with biases generally worsening under JAT-CM-02. For calcite, the MB values are nearly identical between schemes across all bins, with near-zero slopes throughout, indicating that neither scheme captures any spatial variability in calcite distribution (Table 5). These results are consistent with previous findings for 2–20 µm particles (Gonçalves Ageitos et al., 2023) and with the broader North African measurement compilation comparison (Fig. 5). Correlation coefficients for calcite either remain negative for the majority of the sizes, with only slight improvements for JAT-CM-02. Gypsum underestimation is similarly persistent, with near-zero slopes across all bins reflecting an absence of spatial skill in both schemes. The underestimation is slightly exacerbated in JAT-CM-02, and it is particularly noteworthy in BIN01 (). Interestingly, the highest correlation value in the dataset occurs for JAT-CM-02 in BIN26, though the combination of large observational uncertainties and gross underestimation at that size precludes any meaningful interpretation. The highest correlation value in the dataset occurs for JAT-CM-02 in BIN26, though the combination of large observational uncertainties and gross underestimation at that size precludes any meaningful interpretation.
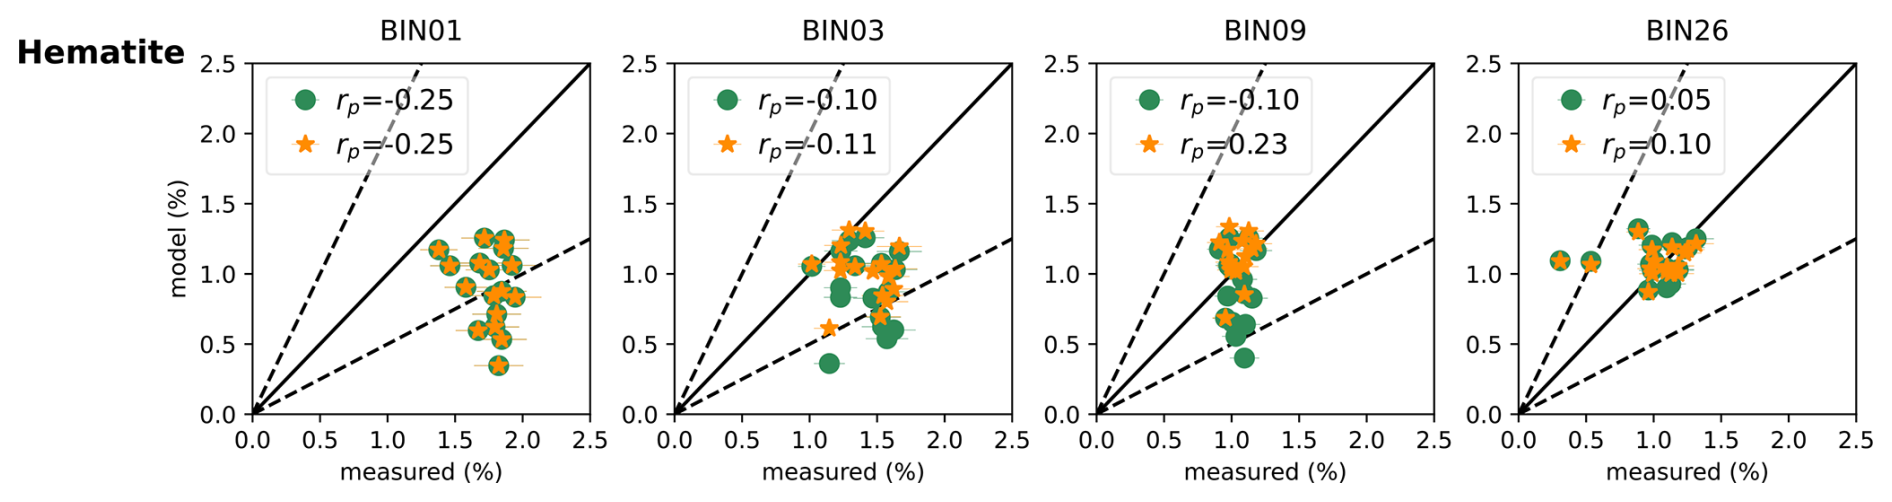
Hematite (Fig. 8) shows near-identical performance between schemes across all sizes, with both JAT-CM-01 and JAT-CM-02 producing MBs of −0.9 % and identical slopes for BIN01. In BIN03, the bias reduces marginally from −0.5 % to −0.4 % and similarly small changes in the slope. The most notable difference between schemes occurs in BIN09, where the linear fit changes from to 0.48x+0.6 in JAT-CM-02, accompanied by a change in rp from −0.1 to 0.23. This sign reversal in both the slope and the correlation coefficient represents the only instance where the “modified” scheme produces a clear improvement in spatial representation. In BIN26, both schemes converge to near-zero biases and near-zero slopes, with no meaningful difference between them (Table 5 and Fig. 8). Overall, despite the persistent negative slopes in the finer fractions, likely reflecting the dual occurrence of hematite as discrete particles and within the lattice structure of other minerals (Lafon et al., 2004; Zhang et al., 2015), hematite shows encouraging agreement with observations, supporting the scheme's robustness for applications sensitive to dust optical properties (e.g., Gómez Maqueo Anaya et al., 2025).
Averaged over the JATAC 2022 simulation period, the JAT-CM-02 produces substantial increases in phyllosilicate mass relative to JAT-CM-01, with illite, kaolinite, smectite, collectively showing 130 % more mass, alongside a modest changes in hematite (5 %). Conversely, quartz (−61 %), feldspar (−56 %), calcite (−14 %), and gypsum (−17 %) all decline significantly.
Collectively, these results suggest that the mass redistribution introduced by the “modified” scheme effectively reduces systematic magnitude biases for quartz and feldspar at the JATAC 2022 measurement sites, but spatial correlations remain limited primarily by uncertainties in the underlying soil mineralogy maps rather than by the emission scheme itself. The treatment of dust as discrete spherical particles further contributes to spatial misrepresentation, as it neglects the aggregate nature of mineral dust transport and the size-dependent settling behavior that arises from it. The persistent underestimation of calcite and gypsum, which appears to be a common feature across different atmospheric models and dust emission parametrizations (e.g., Gonçalves Ageitos et al., 2023), further supports this interpretation, pointing to the wet-sieving methodology used to construct soil mineralogical databases as a structural source of bias that propagates independently of the emission scheme.
5.2 Elemental composition
Simulated mineral compositions are converted into elemental abundances via the relationships in Table 3, providing a complementary and independent metric for evaluating model performance. While size-resolved elemental comparisons broaden the assessment, they introduce additional uncertainties: despite filtering for dust-dominated samples, contributions from minerals outside the modeling framework cannot be fully excluded. This is particularly relevant for the DUSTRISK 2022 dataset, collected near the surface during NH winter, where interference from local emissions or Sahelian biomass burning plumes is more likely (Tesche et al., 2011); the JATAC 2022 observations, made within the Saharan Air Layer during NH summer, are more representative of pure Saharan dust, though minor contamination during transport cannot be ruled out. It should also be noted that the simulated elemental compositions are sensitive to the assumed elemental fractions per mineral, for which different choices have been made across modeling studies (Menut et al., 2020; Mahowald et al., 2026); the compositions adopted here were selected as most representative of the mineralogical signatures expected at the Cabo Verde receptor site, as discussed in Sect. 4.3.
5.2.1 JATAC 2022
Figure 9 compares the observed and simulated concentrations of Si, Al, Fe, and Ca. For silicon (Si), the differences between the two schemes are negligible in BIN01, with both producing near-identical MB values and slopes (Table 6). In BIN03, JAT-CM-02 shifts the model from a slight overestimation (0.6 %) to an underestimation (−4.5 %), with the slope decreasing from 0.86x to 0.63x. In BIN09, this underestimation grows further (−5.9 %; Table 6), a result that initially seems to contradict the substantial quartz overestimation identified for these size categories (Table 5). Since quartz is not the only contributor to Si mass (Table 3), this underestimation likely reflects the compounded effect of stark reductions in both quartz and feldspar that are not fully compensated by the increase in phyllosilicates. This supports a hypothesis that non-simulated high-Si minerals, such as those in the mica (e.g., muscovite) or chlorite groups (Scheuvens et al., 2013), contribute to the measured Si signal in ways the model cannot reproduce. In the coarsest bin (BIN26), where observational uncertainties are relatively low for Si, JAT-CM-02 substantially reduce the overestimation from 13.6 % to 0.1 % (Table 6), directly mimicking the reduction in simulated coarse quartz mass. The improvement is reflected in the mean bias exclusively since the spatial correlation degrades modestly in BIN26 under JAT-CM-02 (Fig. 9). This shows that redistributing mineral abundances can effectively improve elemental mass representation even when spatial correlations stagnate or degrade, a trend consistent with the quartz comparison (Fig. 7).
Table 6Statistical metrics for the “original” (JAT-CM-01) and “modified” (JAT-CM-02) model schemes: mean bias (MB), and the slope (m) and intercept (b) of the elemental observational uncertainty weighted linear fit (mx+b). The number of data points is n=17.
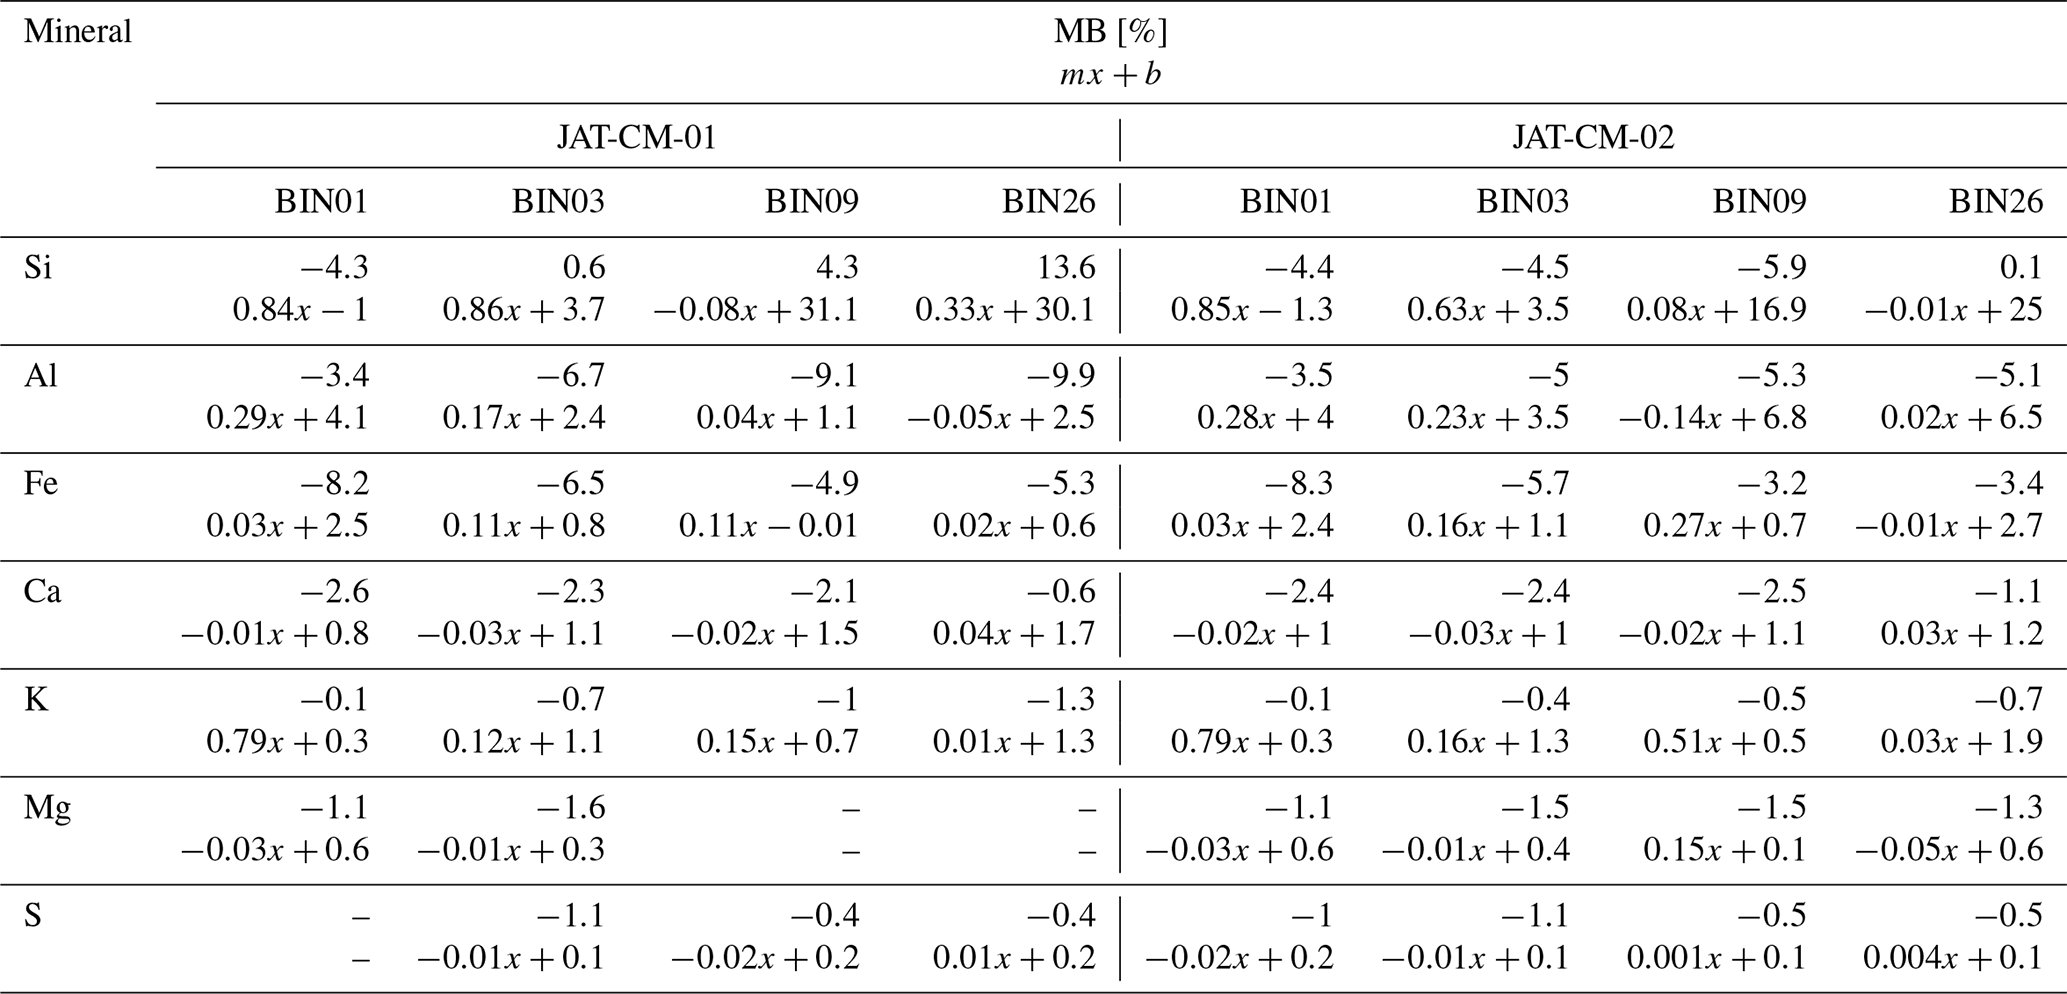
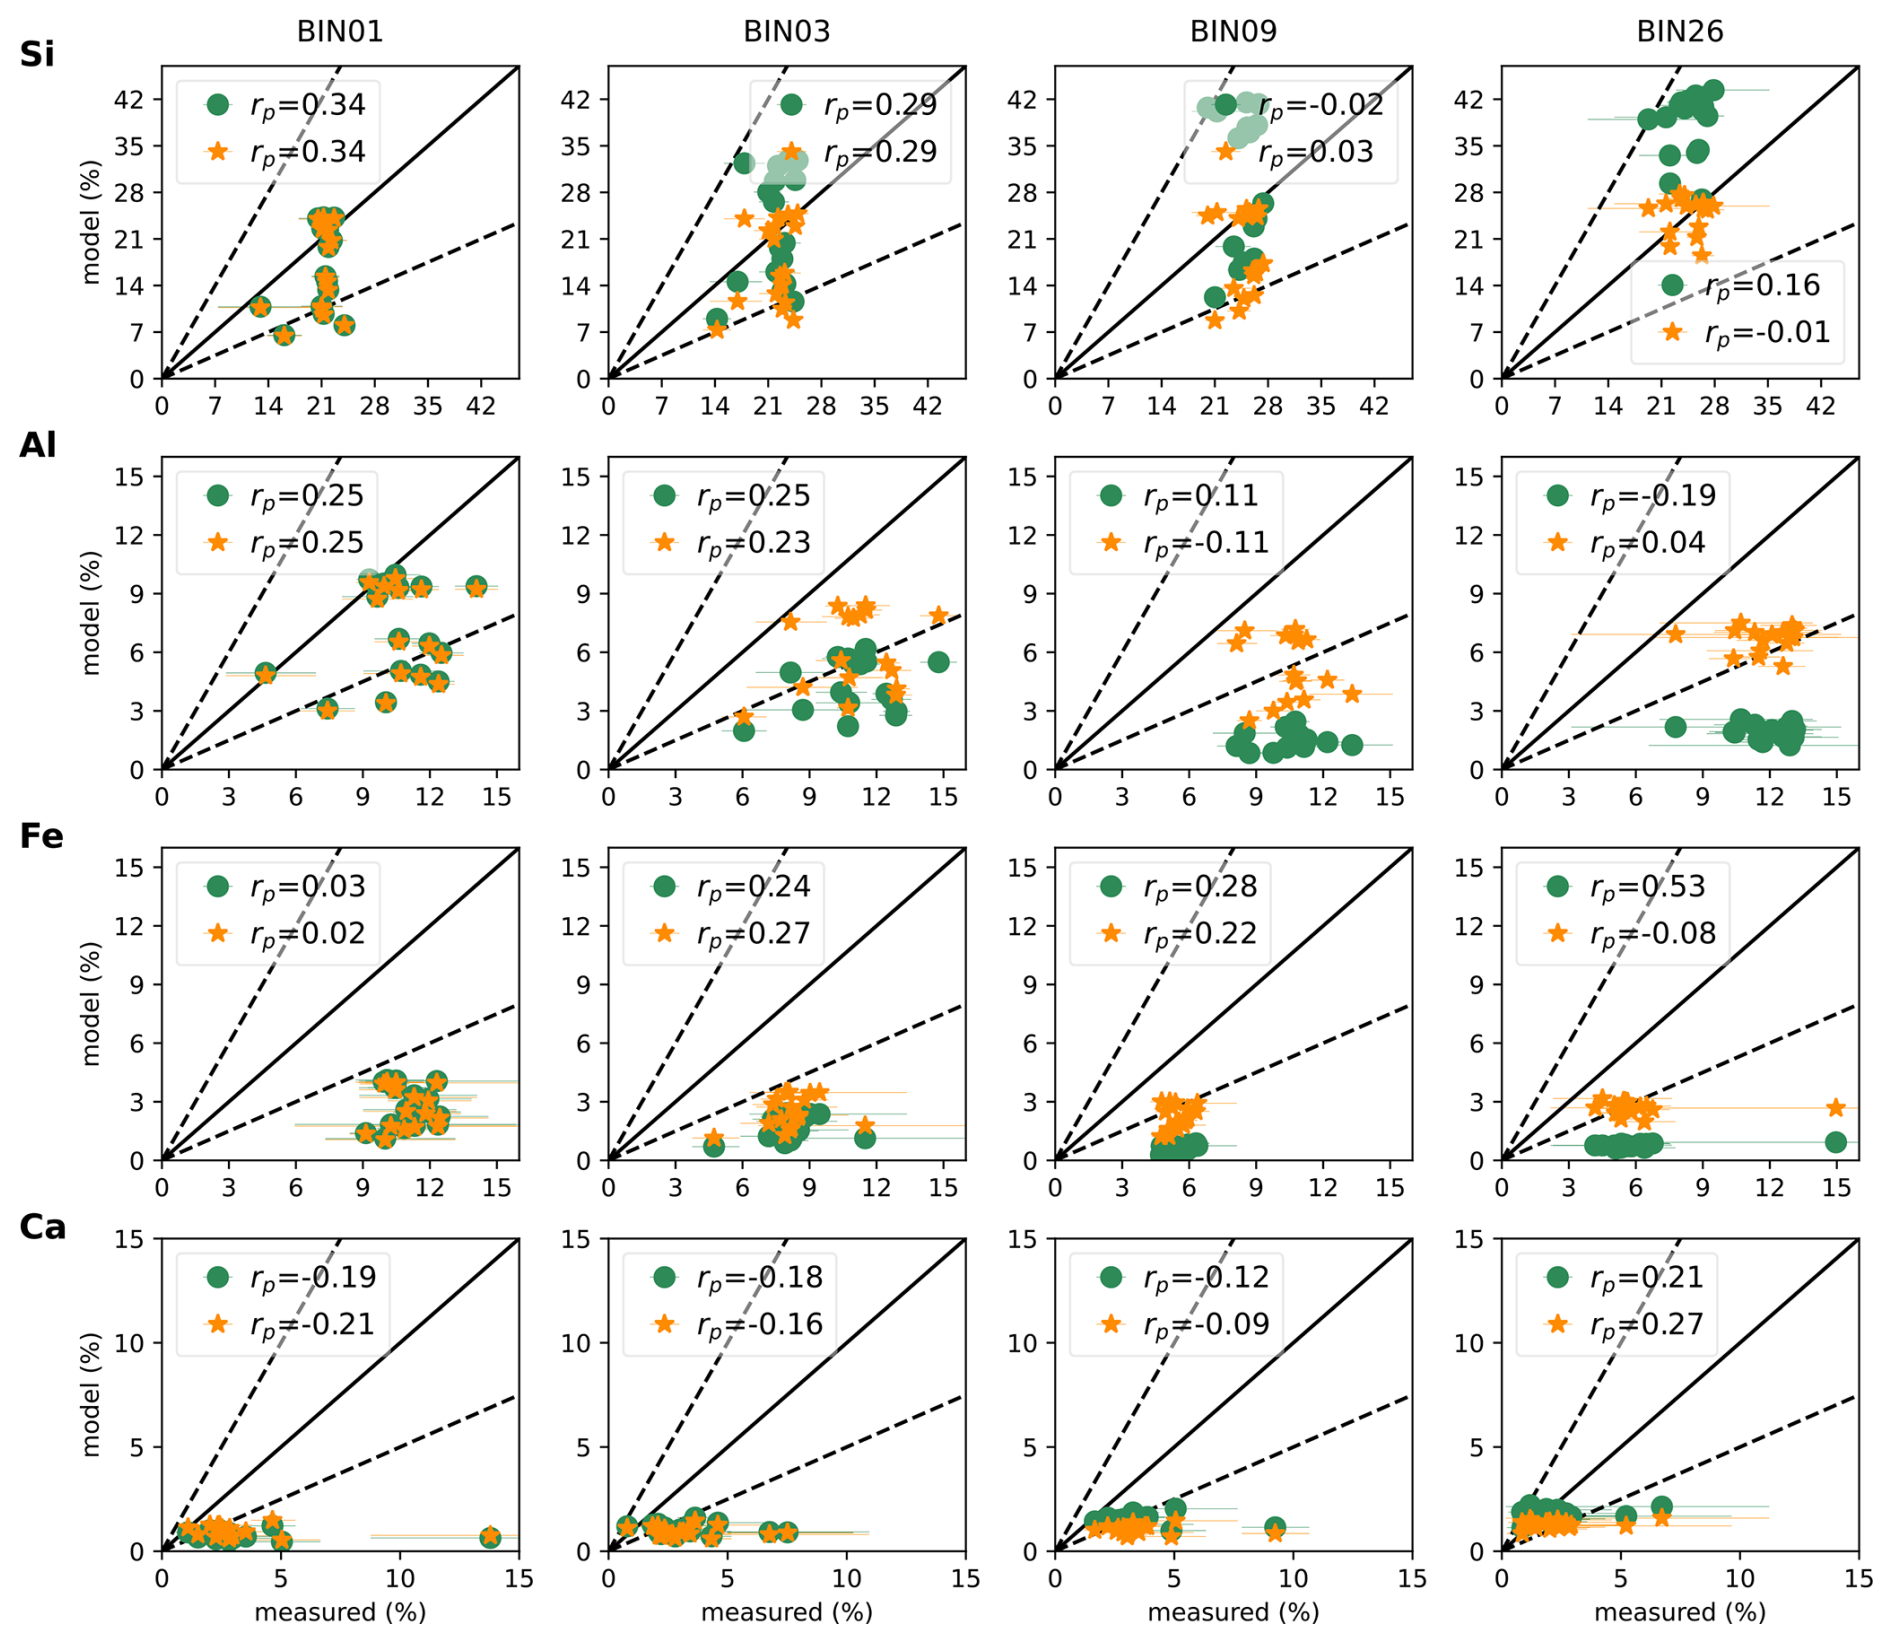
Figure 9Scatterplots of observed elemental mass percentages of Si, Al, Fe, and Ca against simulated by COSMO5.05-MUSCAT. Simulated values were derived by multiplying modeled mineral mass by their respective elemental compositions (detailed in Table 3). Green solid circles indicate the “original” mineral emission scheme (JAT-CM-01), while yellow solid stars represent the “modified” version (JAT-CM-02). The titles of the columns are size classifications from COSMO5.05-MUSCAT (Table 1). The dashed lines represent the ratios of 2:1 and 1:2 between the simulated and observed mineral percentages. The error bars represent the lower and upper limits of the confidence intervals (between 2.5 % and 97.5 %). Uncertainty-weighted linear fits are reported in Table 6 but omitted from the figure for clarity, as the limited dynamic range in several size bins renders them visually uninformative.
Aluminum exhibits a clear size-dependent improvement in mean bias under JAT-CM-02. While there is no meaningful change between scheme for BIN01, from BIN03 onward, JAT-CM-02 progressively reduces the underestimation, from −6.7 % to −5 % in BIN03, from −9.1 % to −5.3 % in BIN09, and from −9.9 % to −5.1 % in BIN26 (Table 6). This progressive improvement directly reflects the redistribution of clay minerals into larger size fractions, better capturing the aggregated state of phyllosilicates during emission and transport. Persistent underestimation across all bins may be partly attributed to high-Al non-simulated minerals such as chlorite (Scheuvens et al., 2013). The elemental perspective is particularly informative here: while the individual mineral comparisons suggest conflicting needs, more illite mass but less kaolinite and smectite (Table 5 and Fig. 6), the Al comparison more clearly indicates that a net increase in simulated Al-bearing mineral mass could improve the remaining bias, revealing an improvement direction that is partially obscured at the mineral level. These improvements in mass bias do not extend to the spatial correlation coefficients, which show a slight degradation under JAT-CM-02 from BIN03 onward. The spatial correlation for Al is inherently weak, likely because non-simulated minerals introduce spatial variability in the observed Al signal that the model cannot capture. The mass redistribution in JAT-CM-02, while improving the overall mass balance, does not resolve this structural limitation and marginally exacerbates the spatial mismatch, consistent with the pattern observed for Si (Fig. 9).
Iron (Fe) content remains substantially underestimated across all size bins in both schemes, though JAT-CM-02 produces meaningful reductions in bias from BIN03 onward. In BIN01, both schemes produce near-identical results, and among the improved bins, BIN09 shows the most notable gain in both mass bias and spatial skill, with the MB improving from −4.9 % to −3.2 % and the linear fit slope changing from 0.11x−0.01 to 0.27x+0.7 (Table 6). These improvements are consistent with the increased smectite mass in JAT-CM-02 (Table 5 and Fig. 6), given that smectite is the second largest contributor to the simulated Fe budget after hematite. A sensitivity study (not shown) in which smectite stoichiometry was replaced entirely by nontronite, the Fe-rich end-member, produced a consistent reduction in Fe underestimation across all size bins, in the order of 1.5 %, confirming that the assumed smectite composition is a meaningful source of uncertainty in the simulated Fe budget, though insufficient to fully resolve the persistent underestimation. However, these improvements in mass bias are not reflected in the Pearson correlation coefficients, which show a modest improvement only for BIN03 under JAT-CM-02, while deteriorating for the remaining bins. The most striking degradation occurs in BIN26, where rp drops from 0.53 in JAT-CM-01 to −0.08 in JAT-CM-02, suggesting that the addition of phyllosilicates to this mode is reducing the mass reduction but worsening the spatial signal (Fig. 9). Notably, the mineral-specific hematite comparison (Figs. 8 and 5) does not show a comparable level of underestimation, exposing a critical difference between mineralogical and elemental validation: reproducing hematite mass fractions reasonably well does not preclude a substantial underestimation of total Fe, a gap that cannot be fully compensated by the Fe contributions of other modeled minerals. This inconsistency reveals an inherent limitation of modeling frameworks that treat minerals as discrete particles with idealized uniform compositions, and underscores the value of elemental validation as a complementary diagnostic. Given iron's pivotal role in dust-atmosphere interactions (Journet et al., 2008; Lafon et al., 2004; Li et al., 2024, 2021; Song et al., 2024; Zhang et al., 2024), this distinction carries significant implications for radiative and biogeochemical modeling.
The calcium (Ca) comparison in Fig. 9 reveals a consistent underestimation across all size bins in both schemes, with JAT-CM-02 showing a marginal increase in underestimation relative to JAT-CM-01. The MB values remain stable across bins, ranging from −2.6 % to −0.6 % in JAT-CM-01 and from −2.4 % to −1.1 % in JAT-CM-02, with near-zero or slightly negative slopes throughout both schemes, indicating that neither captures any meaningful spatial variability in Ca distribution (Table 6). This result is consistent with the JATAC 2022 mineralogical analysis, where both schemes significantly underestimate the concentrations of calcite and gypsum, the primary Ca-bearing minerals currently simulated (Fig. 7). The bias is further exacerbated by the exclusion of dolomite, a major Ca-rich mineral in the Sahara (Formenti et al., 2014), not accounted for in the model simulations. Spatial correlations remain low or negative across most size bins, with no meaningful improvement under JAT-CM-02. A very slight improvement is observed in BIN09 and BIN26, though given the near-zero slopes and the known limitations of the Ca representation discussed above, these marginal gains are unlikely to reflect a genuine improvement in spatial skill and are more probably an artifact of the sampling distribution (Fig. 9).
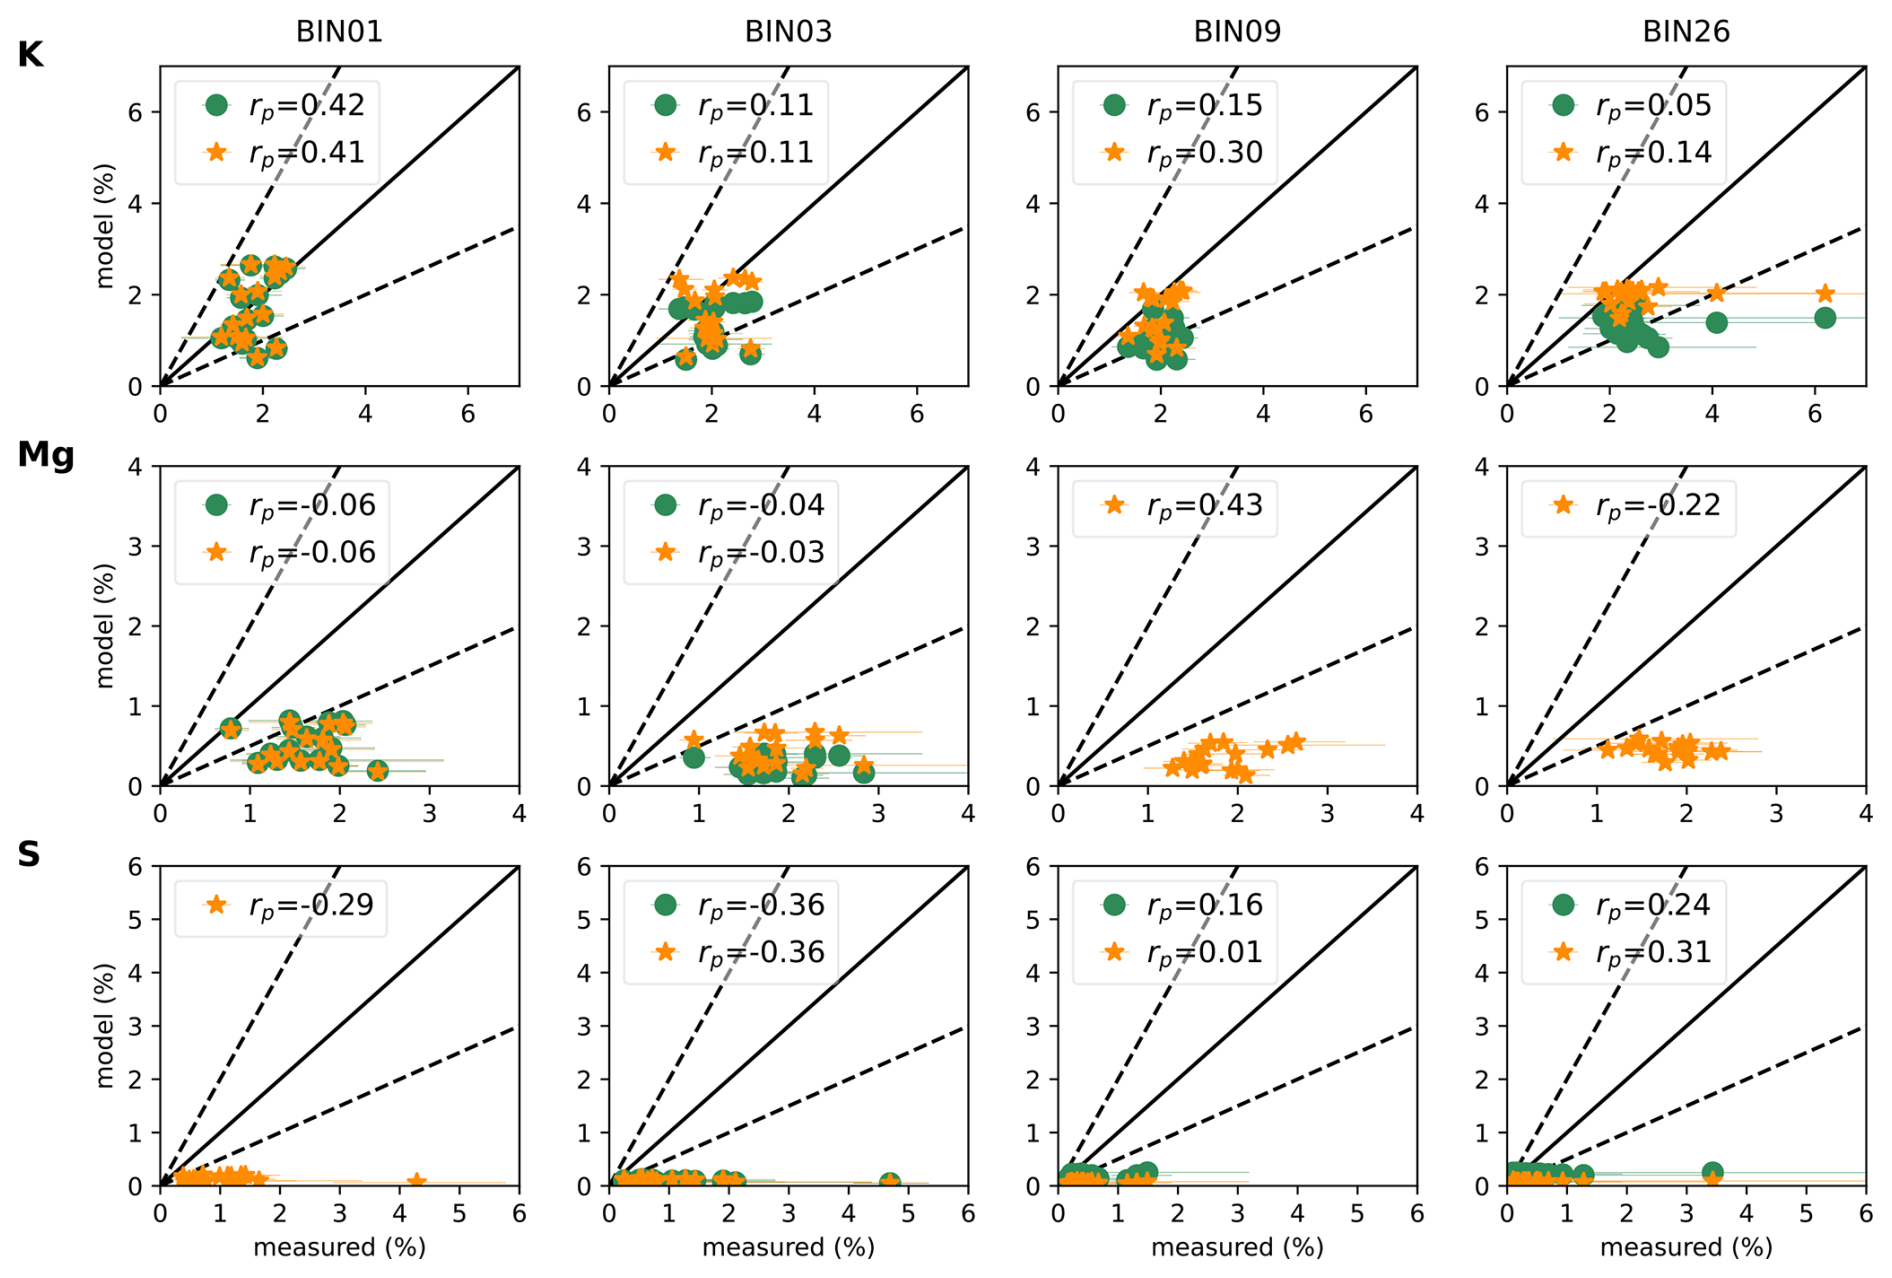
Figure 10 presents the scatterplots comparing simulated and measured content of K, Mg, and S. For potassium (K), JAT-CM-02 reduces the underestimation from BIN03 onward, with MB values remaining near-neutral across all bins. The most notable improvement occurs in BIN09, where the slope increases from 0.15x+0.7 to 0.51x+0.5, indicating considerably better spatial sensitivity under the “modified” scheme (Table 6). Spatial correlations remain unchanged between schemes for BIN01 and BIN03, but improve meaningfully for BIN09 and BIN26, consistent with the explicit inclusion of illite in these coarser fractions, though the BIN26 improvement should be interpreted with caution given the large observational uncertainties at that size (Fig. 10). Interestingly, while the mineral-specific feldspar comparison showed improved mean biases values but no meaningful gain in spatial skill under JAT-CM-02 (Fig. 7), the elemental K response is more robust in both MB and spatial skill, likely because K receives contributions from both feldspar and illite, as well as non-simulated minerals such as white mica. This contrasts with the weak to negative correlations seen for feldspar and illite individually (Figs. 7 and 6), and suggests that K serves as a more integrative diagnostic for assessing the combined redistribution of these two mineral groups.
Both emission schemes underestimate magnesium (Mg) across all size bins, with near-identical results between JAT-CM-01 and JAT-CM-02 in BIN01 and BIN03 and near-zero slopes throughout, indicating an absence of spatial skill at these sizes (Table 6). This persistent underestimation mirrors the results for illite, the sole Mg-bearing mineral currently simulated, which is dramatically underrepresented across all size bins (Fig. 6). Interestingly, while illite underestimation intensifies in the coarser size categories, this trend is not observed for Mg, suggesting either that illite is being misclassified in the measurements, a common challenge in complex mineralogical assemblages (e.g., Rieder et al., 1998), or that contributions from Mg-rich minerals absent from the model, such as dolomite (Formenti et al., 2014), partially offset the illite signal in the observations. JAT-CM-02 extends the comparison to BIN09 and BIN26, where the MB remains small and the moderate rp value in BIN09, supported by the highest slope of the Mg comparison, further supports the conclusion that including illite in larger size fractions is a more representative approach (Table 6 and Fig. 10).
Sulfur is consistently and substantially underestimated by the model across all size bins in both emission schemes, with near-zero slopes and similar MB values ranging from −0.4 % to −1.1 % (Fig. 10 and Table 6). The negligible differences between schemes and the absence of any spatial skill in either confirm that the “modified” scheme does not meaningfully alter the S budget, consistent with the limited changes observed for gypsum in the mineral comparison (Fig. 7 and Table 5). This persistent underestimation is directly attributable to the well-documented underrepresentation of gypsum in soil mineralogical databases (Gonçalves Ageitos et al., 2023), as discussed above.
Overall, the elemental validation reveals improvements in mass balance for Si, Al, and K with the “modified” scheme that are not always apparent from the mineral-level comparison alone, underscoring the added diagnostic value of this approach. However, spatial correlations (rp) remain limited across most elements and size bins, reflecting the combined influence of source map uncertainties, missing mineral phases, and transport errors.
5.2.2 DUSTRISK 2022 campaign
The scatterplots in Fig. 11 demonstrate marked differences in performance between the “original” (DUST-CM-01) and “modified” (DUST-CM-02) schemes across elemental composition and particle size categories.
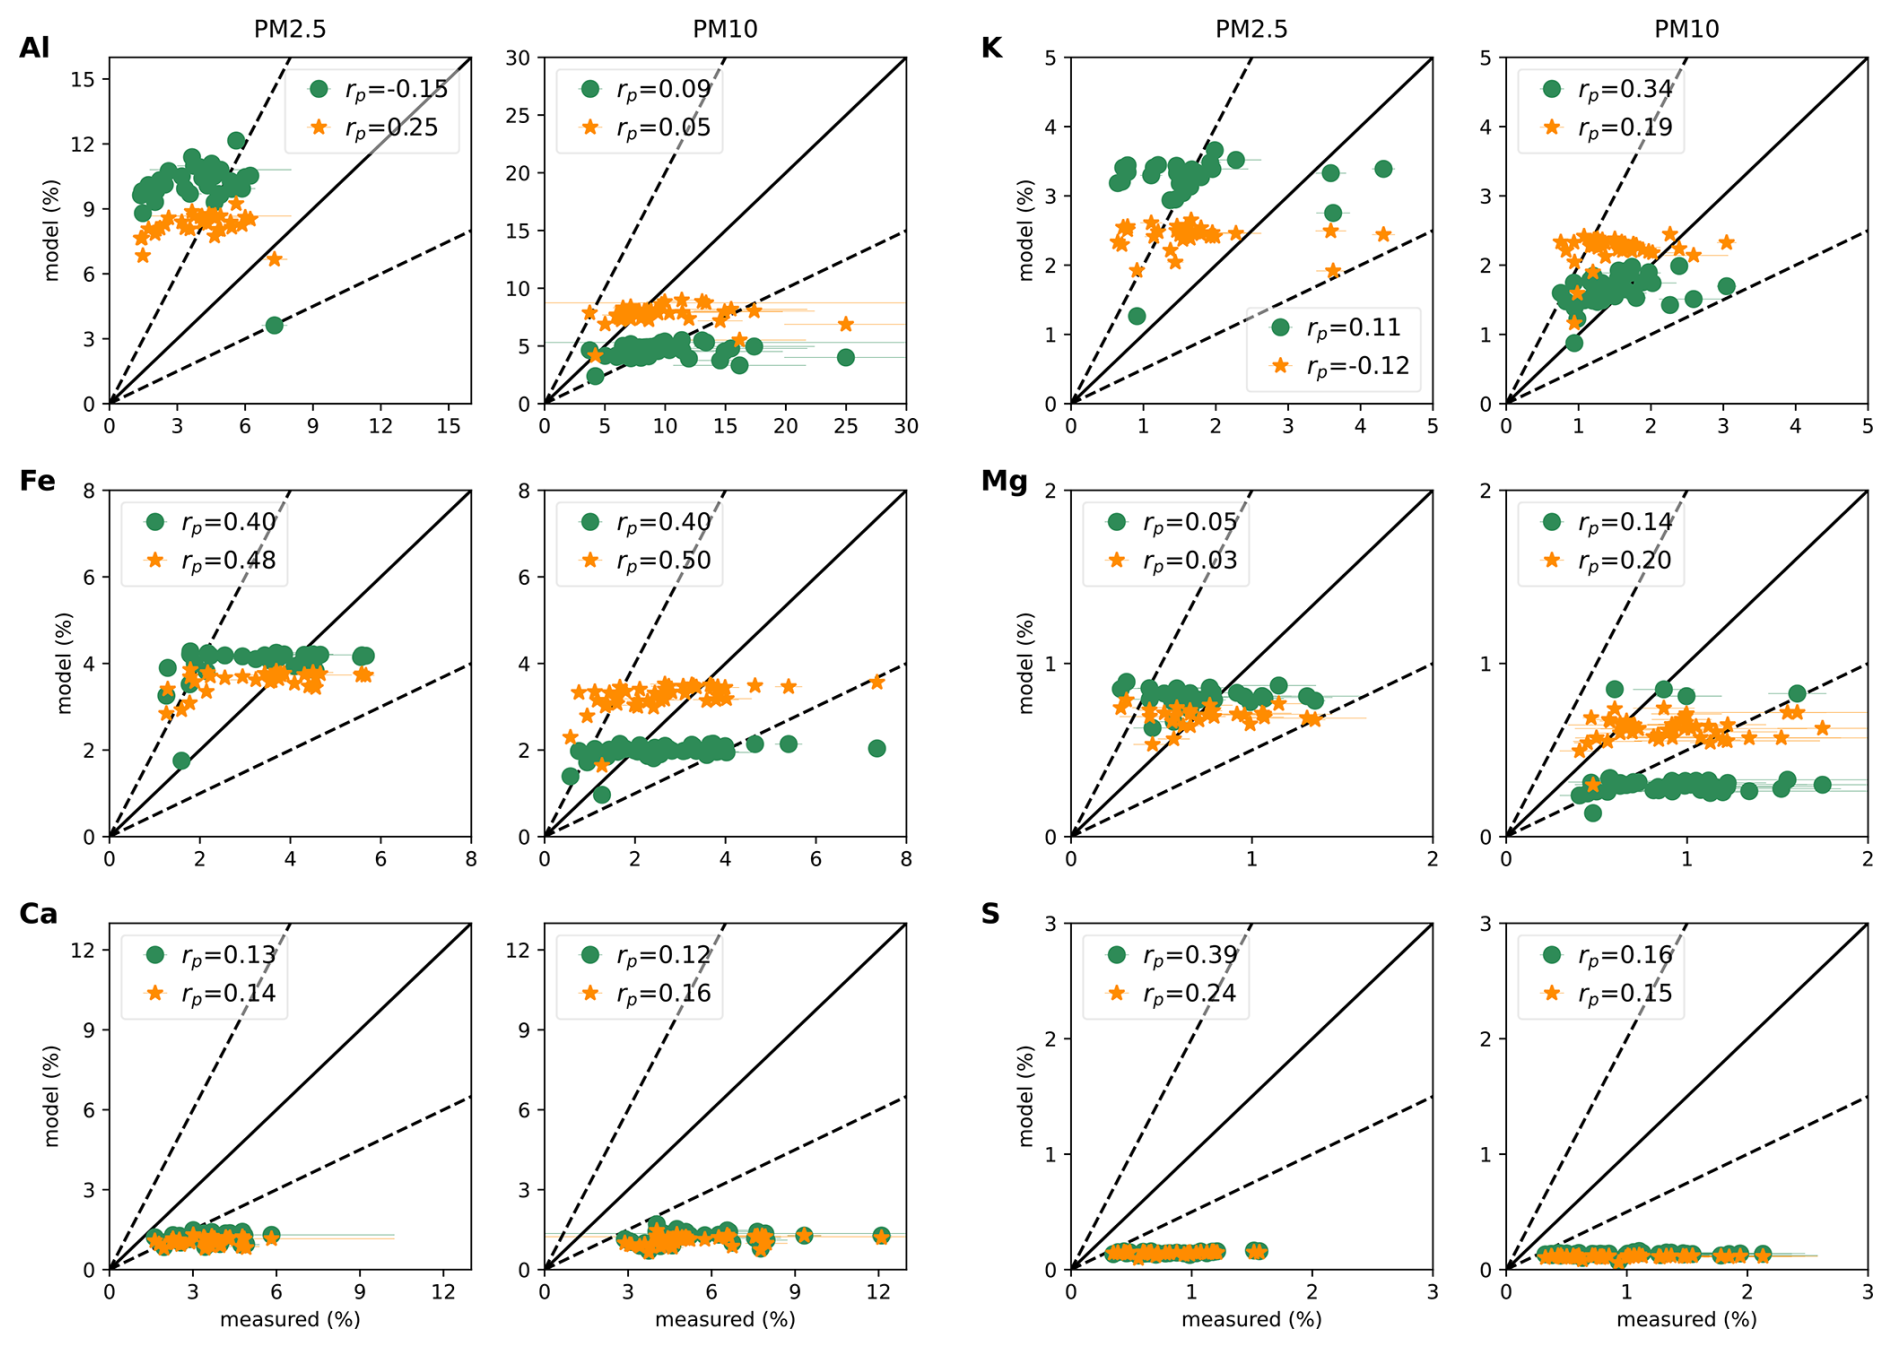
Figure 11Scatterplots comparing observed elemental mass percentages of Al, Fe, Ca, K, Mg, and S against simulated values from COSMO5.05-MUSCAT. Simulated values were derived by multiplying modeled mineral mass by their respective elemental compositions (detailed in Table 3). Green solid circles indicate the “original” mineral emission scheme (DUST-CM-01), while yellow solid stars represent the “modified” version (DUST-CM-02). Column headers denote size classifications based on in-situ filter measurements: PM2.5 and PM10. The error bars represent the measurements' standard deviation. Dashed lines mark the 2:1 and 1:2 ratios between simulated and observed mineral percentages. Note: Axis scales vary between PM2.5 and PM10 panels for Al to optimize the visibility. Uncertainty-weighted linear fits are reported in Table 7 but omitted from the figure for clarity, as the limited dynamic range in several size bins renders them visually uninformative.
For aluminum (Al), DUST-CM-02 improves the representation across both size fractions, though the nature of the improvement differs. In PM2.5, the “original” scheme overestimates Al (MB=6.1 %; ), with the negative slope indicating an inverse relationship between simulated and observed values. DUST-CM-02 reduces the overestimation (MB=4.3 %) and corrects the slope (0.09x+7.9), with a notably improved spatial correlation at this size (Table 7 and Fig. 11). In PM10, DUST-CM-01 underestimates Al (), which DUST-CM-02 reduces to −1.6 %, consistent with the increased phyllosilicates mass in the coarser fraction. Near-zero slopes in both schemes for PM10 indicate limited spatial skill, reflected as well in the rp values regardless of the scheme. This size-dependent pattern complicates the interpretation of the phyllosilicates simulation: the overestimation in PM2.5 is consistent with the individual smectite and kaolinite comparisons, which show positive biases in the fine fraction, while the underestimation in PM10 mirrors the illite behavior, where the model systematically underrepresents this mineral across all sizes (Fig. 6). While the PM10 improvement is consistent with the JATAC 2022 elemental comparison, the PM2.5 overestimation in both schemes is not observed for that dataset (Fig. 9), possibly reflecting methodological differences between the two campaigns, either in the collection stage, where JATAC 2022 size-resolved sampling may better capture the fine fraction, or in the measurement technique itself, as SEM-EDX analysis has known limitations in the fine size range (>1 µm; Laskin and Cowin, 2001; Kandler et al., 2018). The persistent near-zero slopes in PM10 and the consistent underestimation of Al in coarser sizes across both datasets suggest that the model may be missing a specific Al-rich coarse mineral phase, such as muscovite (Scheuvens et al., 2013).
Table 7Statistical metrics: mean bias (MB), slope (m) and intercept (b) for the linear fit of the simulated elemental mass fractions using the “original” (DUST-CM-01) and “modified” (DUST-CM-02) schemes. These are calculated against the DUSTRISK 2022 elemental measurements. The baseline number of observation points is n=34 for PM2.5, and n=45 for PM10, unless indicated otherwise by superscript parentheses.
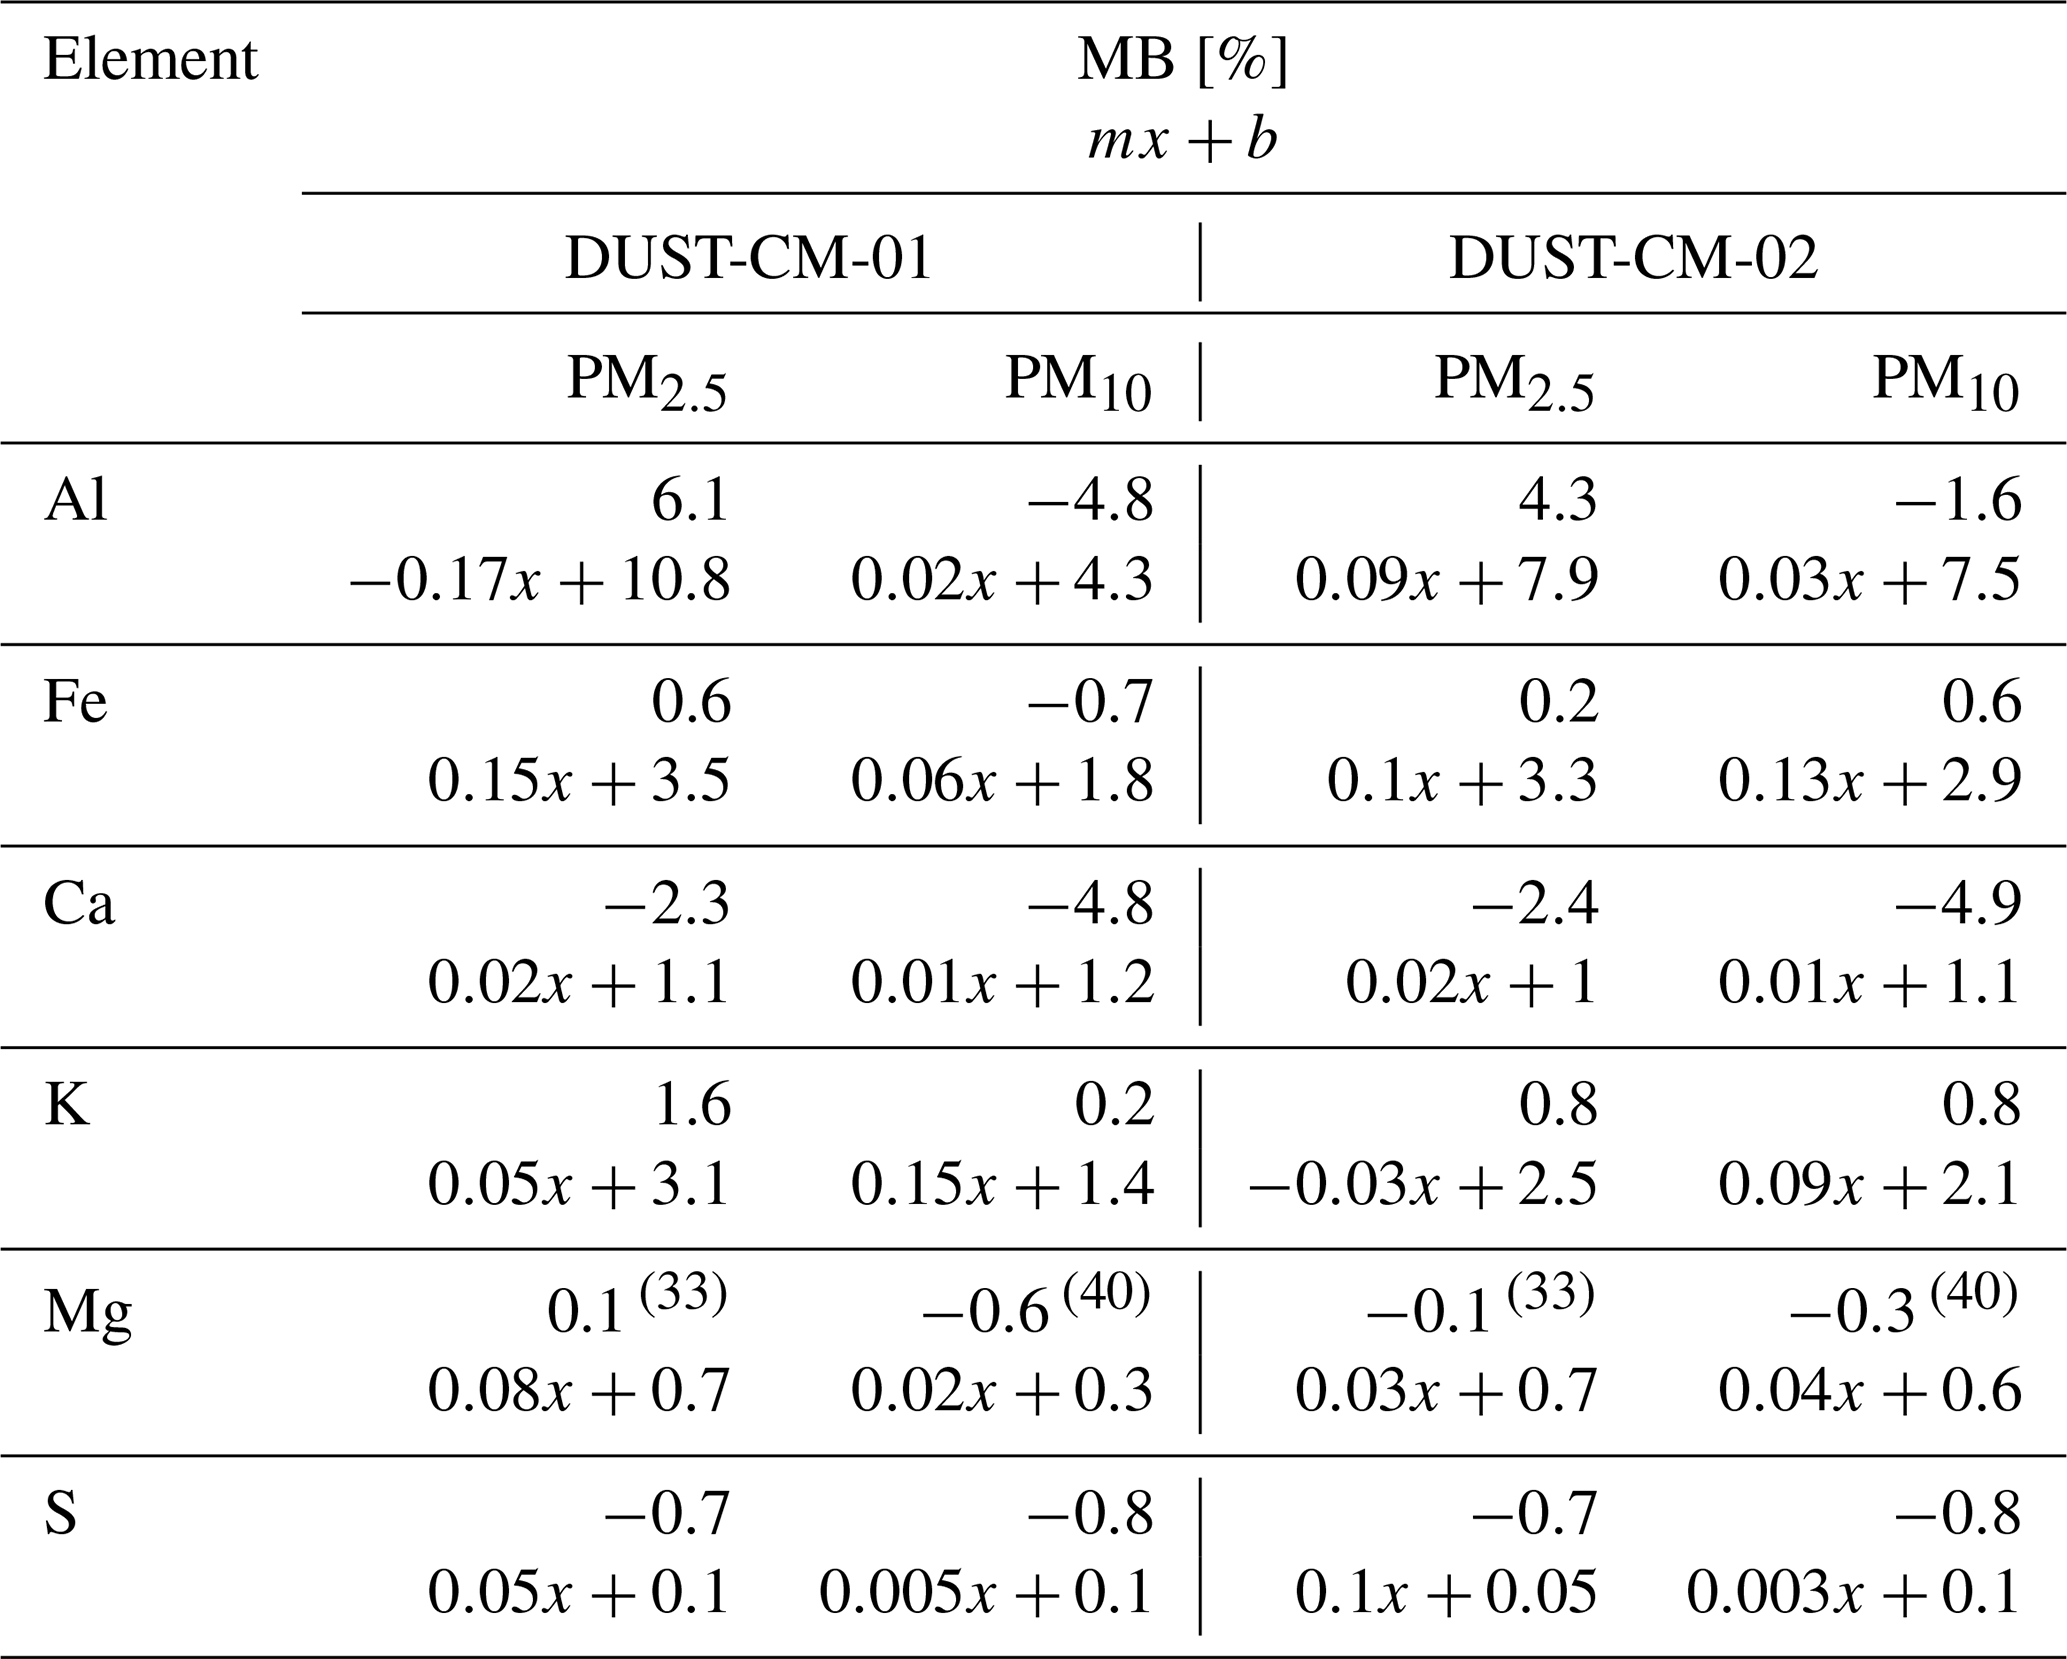
Iron (Fe) shows a striking contrast with the JATAC 2022 results: rather than the consistent underestimation observed in that dataset (Table 6 and Fig. 9), both schemes produce near-neutral biases for DUSTRISK 2022, with MB values of 0.6 % and −0.7 % for PM2.5 and PM10 in DUST-CM-01, and 0.2 % and 0.6 % in DUST-CM-02 (Table 7), though the model exhibits an inverse relationship between size fraction and mean bias, with PM2.5 showing slight overestimation and PM10 a slight underestimation. The slopes remain modest across both schemes and size fractions, though DUST-CM-02 shows a slight improvement in PM10 (0.06x+1.8 to 0.13x+2.9; Table 7). This marked improvement relative to JATAC 2022 may partly reflect the surface-level sampling during NH winter, where dust composition and Fe-bearing mineral contributions differ from the Saharan Air Layer conditions sampled during JATAC 2022, and where the coexistence of mineral dust with Fe-rich particles from anthropogenic or biomass burning sources at surface level may complicate the attribution of measured Fe to dust alone. The spatial correlations for Fe are the highest of all elements in the dataset, with rp values improving to 0.48 in PM2.5 and 0.5 in PM10 under DUST-CM-02 (Fig. 11), suggesting that the model captures the geographical distribution of Fe-bearing minerals reasonably well (Fig. 11 and Table 7).
Calcium (Ca) shows a consistent systematic underestimation across both schemes and size fractions as well as near-zero slopes for the corresponding linear fit equations which confirm the absence of any spatial skill (Fig. 11 and Table 7), directly mirroring the underrepresentation of calcite and gypsum discussed in earlier results (Figs. 5 and 7). The spatial correlations improve only marginally under DUST-CM-02 with the slightly larger gain in PM10, though both remain very low (Fig. 11). The similarity in correlation strength between size fractions stand in contrast to the predominantly negative correlations found for Ca in JATAC 2022 (Fig. 9), suggesting that the source regions and transport pathways sampled during DUSTRISK 2022 are more consistent with the spatial distribution of Ca-bearing minerals prescribed in the model, even if their absolute abundance remains underestimated.
The potassium (K) content illustrated in Fig. 11 reveals a size-specific and mixed response to the scheme change. In PM2.5, DUST-CM-02 reduces the overestimation from 1.6 % to 0.8 %, while in PM10, the MB remains near-neutral in DUST-CM-01 (0.2 %) and increases slightly to 0.8 % in DUST-CM-02 (Table 7). The linear fit equation and spatial correlation coefficient for PM10 under DUST-CM-02 slightly deteriorates, indicating that the mass redistribution disrupts the spatial signal previously captured at this size (Table 7 and Fig. 11). The bias reduction in PM2.5, stems from the net effect of the scheme change on K-bearing minerals, while feldspar decreases under the “modified” scheme, the JATAC 2022 results show an improvement in MB due to an increase on K fraction in BIN03, indicating that the feldspar reduction is offset by the concurrent increase in illite. Here, the feldspar reduction is not compensated by illite, suggesting that the overall mineralogical signature changes between NH winter and the NH summer Saharan conditions sampled during JATAC 2022 (Schepanski et al., 2009). This outcome is particularly noteworthy given the inconsistent performance of both feldspar and illite in the preceding mineral-level evaluation (Figs. 5–6), and illustrates how elemental comparisons can provide diagnostic insight that mineral-level evaluations alone may obscure, as the aggregated K signal integrates contributions from multiple minerals whose individual behaviors partially cancel out.
Magnesium (Mg) displays a size-dependent performance pattern analogous to that of aluminum (Fig. 11). Despite the clear illite underestimation identified in the mineral comparison (Fig. 6), the Mg elemental analysis reveals an overall improvement under DUST-CM-02. In PM2.5, the near-neutral bias in DUST-CM-01 (0.1 %), shifts to a negligible underestimation in DUST-CM-02 (−0.1 %), while in PM10 the underestimation is halved, with a modest slope improvement (Table 7). Compared to JATAC 2022, were Mg underestimation was more severe, the DUSTRISK 2022 biases are near-neutral, highlighting the variability across campaigns. Despite these differences in magnitude, both datasets show consistent size-dependent improvements and strengthened spatial correlations under DUST-CM-02, particularly for PM10 and BIN09 size categories (Figs. 11 and 10).
The consistently low rp for K and Mg in PM2.5 suggest that the simulated spatial distributions of these elements do not align with observations, pointing toward additional non-simulated sources. Given that the DUSTRISK 2022 observations coincide with NH winter, this decoupling could partly reflect contributions from Sahelian biomass burning (Tesche et al., 2011), a well-documented regional source of fine-mode K and Mg (Dang et al., 2022; Jahn et al., 2021). Although the near-neutral to positive mean biases would superficially argue against the need for additional mass, the poor spatial correlations suggest that the total observed K and Mg are governed by a combination of dust and non-simulated sources that the dust-only framework cannot reconcile.
Sulfur (S) remains systematically underestimated across both schemes and size fractions. The near-zero slopes throughout confirm the absence of spatial skill in both schemes, accompanied by a deterioration in rp values under DUST-CM-02 (Fig. 11 and Table 7). These results mirror the poor S performance observed in the JATAC 2022 dataset (Fig. 10) and are consistent with the well-documented underrepresentation of gypsum in soil mineralogical databases, as discussed above.
Averaged over the DUSTRISK 2022 simulation period, DUST-CM-02 produces substantial increases in phyllosilicate mass relative to DUST-CM-01, with illite, kaolinite, smectite, collectively showing 130 % more mass, consistent with the redistribution observed in the JATAC 2022 period. Unlike JATAC 2022, however, hematite and calcite also show modest mass increases, 17 % and 12 %, respectively, reflecting differences in the size bin elemental composition impact of the “modified” scheme between the two campaigns. Conversely, quartz (−53 %), feldspar (−50 %), and gypsum (−7 %) decline significantly, though the reductions are somewhat less pronounced than in JATAC 2022 period. These differences likely reflect the distinct source regions characteristic of NH winter dust transported compared to the NH summer conditions sampled during JATAC 2022.
The results demonstrate that adjusting the soil mineralogical PSD prior to emission flux calculations produces a more physically representative partitioning of mineral mass across size fractions. The most consequential improvement is the resolution of the systematic quartz overestimation, which propagates positively into the elemental Si budget and validates the core redistribution logic of the “modified” scheme. The concurrent increase in phyllosilicates mass across coarser size bins, consistent across both campaigns, further supports the hypothesis that aggregated phyllosilicates transport is better captured when the emitted PSD reflects a re-aggregated rather than fully dispersed soil. The elemental validation reinforces these findings: the consistent improvement in Al and Si contributions across size fractions and both campaigns confirms the cross-element coherence of the scheme, where improvements in mineral mass partitioning propagate predictably into elemental budgets.
However, improvements in elemental mass bias do not systematically translate into improved spatial correlations, revealing a disconnect between reproducing the total mass and the spatial distribution. This decoupling points to limitations in the underlying source maps and the omission of specific mineral phases, such as muscovite, rather than deficiencies in the emission scheme itself, which has been evaluated against AERONET aerosol optical thickness in previous work and shown to reproduce dust loading reasonably well (Gómez Maqueo Anaya et al., 2025, 2024). Nevertheless, it should be noted that even with a well-constrained emission scheme, errors in source attribution for specific events would produce spatial mismatches indistinguishable from mineralogical errors when evaluated against point measurements, underscoring the importance of constraining dust transport independently before attributing residual biases to the mineralogical composition.
The persistent underestimation of calcite and gypsum, reflected in the Ca and S elemental budgets, points to a structural limitation upstream of the emission scheme: both minerals are susceptible to dissolution during wet-sieving, causing their abundances to be systematically underrepresented in the GMINER SMA (Nickovic et al., 2012). This is consistent with findings from previous modeling studies, which show that Ca tends to be underestimated over North Africa regardless of the SMA employed, whether based on the Journet et al. (2014) compilation used in Menut et al. (2020) or the EMIT dataset (Green et al., 2020) applied in Mahowald et al. (2026), suggesting that the under-representation of calcite in existing soil mineralogy datasets is a systematic and widespread limitation. Given the high sensitivity of the model to initial assumptions on soil mineral distributions, achieving a good representation of the contribution of soluble minerals will ultimately require non-dispersive soil characterization techniques rather than refinements to the emission scheme.
Iron deserves particular attention given its pivotal role in dust-atmosphere interactions, from direct radiative effects to biogeochemical impacts on ocean productivity (Li et al., 2024, 2021; Song et al., 2024; Zhang et al., 2024). The JATAC 2022 elemental comparison reveals a consistent Fe underestimation despite reasonable agreement in the hematite content in mineral compositions. Since hematite is the dominant Fe-bearing mineral in the model, this discrepancy points to insufficient Fe contributions from secondary mineral hosts. Illite, which is severely underestimated, would reduce the Fe budget, while the overestimation of smectite would partly compensate; however, the unclear diagnostics of both minerals, given that the elemental signals associated with them do not reflect the same degree of bias as the minerals themselves (Al, K and Mg), make it difficult to attribute the Fe underestimation unambiguously to either. This suggests that omitted Fe-rich phases may play an equally important role. Taken together, these results indicate that accurate Fe simulation requires both a better constrained mineral inventory and a model representation that accounts for the heterogeneous distribution of Fe across mineral hosts, silicate aggregates, and nanoscale oxide coatings (Lafon et al., 2004; Zhang et al., 2015). The DUSTRISK 2022 period offers a contrasting picture, with low Fe mean biases and moderate spatial correlations that could reflect genuine seasonal differences in source region composition. The potential influence of Sahelian biomass burning during NH winter (Tesche et al., 2011) complicates this interpretation, though the good agreement of simulated Mg concentrations with observations alongside the overestimation of Al and K argues against a dominant biomass burning signal, suggesting that the improved Fe agreement is not the result of compensating errors.
The Mg results provide a further diagnostic insight: despite illite being the sole Mg-bearing mineral in the current model configuration, the simulated Mg underestimation is considerably less severe than would be expected from the illite underestimation alone. This discrepancy likely reflects the natural compositional variability of illite in Saharan dust, which occurs as a mixed-layer silicate with heterogeneous Mg content rather than the fixed stoichiometry assumed in the model (Kandler et al., 2018).
Inter-campaign discrepancies further highlight that model validation is inherently sensitive to factors beyond the emission scheme. The shift from Al underestimation in JATAC 2022 to overestimation in the finest fraction of DUSTRISK 2022 likely reflects methodological differences in fine particle sampling between campaigns, including measurement uncertainties associated with SEM-EDX characterization of small particles, rather than a change in model behavior.
Taken together, these results demonstrate both progress and remaining challenges in modeling dust mineralogy. The “modified” scheme clearly improves the size-resolved representation of phyllosilicates, quartz, and feldspar across both mineral and elemental scales. However, persistent biases in iron, calcium, magnesium, and sulfur point to inherent limitations in representing the heterogeneous internal mixing and complex speciation of natural mineral dust. These findings indicate that future progress will require a more complete mineral inventory, particularly for Fe-rich, Mg-bearing, and soluble mineral phases, alongside soil characterization approaches that better preserve the in-situ abundance of dissolution-prone minerals, and observational constraints spanning multiple seasons and source regions to capture the full compositional complexity of mineral dust.
The elemental validation approach employed here offers a complementary and underutilized pathway for model evaluation. Converting simulated mineral compositions to elemental mass fractions exposes discrepancies between mineral- and elemental-level performance that mineral-only comparisons would miss, while also enabling validation against the extensive body of XRF and electron microscopy measurements in the literature. The Fe results exemplify the diagnostic value of this dual framework: the divergence between mineral- and elemental-level performance reveals complexities in dust composition, such as heterogeneous Fe distribution across mineral hosts, that direct mineral measurements alone cannot capture, underscoring its potential for advancing mineralogical representation in atmospheric models.
Future progress will require advances on multiple fronts. Improved soil mineralogical databases that preserve the in-situ abundance of soluble and the aggregates of fine-grained minerals, through non-dispersive characterization techniques are a prerequisite for correcting the structural biases in calcite, gypsum, and iron identified here. The emergence of hyperspectral retrievals from NASA's EMIT mission (Green et al., 2020), combined with field campaigns providing size-resolved mineral and elemental composition across multiple seasons and source regions, offers a promising pathway to better constrain emission parameterizations. At the modeling level, representing minerals as internally mixed aggregates rather than discrete homogeneous spherical particles will likely be necessary to reconcile the mineral-element discrepancies identified and to capture the compositional complexity of natural dust. Recent studies reinforce that refining soil mineral maps and dust size distributions is critical for advancing our understanding of dust's climatic and biogeochemical roles (Mahowald et al., 2026; Li et al., 2021, 2024; Obiso et al., 2024), and the dual mineral-elemental validation framework demonstrated here provides a transferable methodology for evaluating such improvements as they emerge.
Table A1Ideal elemental mass compositions used to identify modeled mineral classes, normalized to the sum of selected elements. Elements not shown are zero. Value ranges are derived from data by Journet et al. (2008) and https://webmineral.com/.
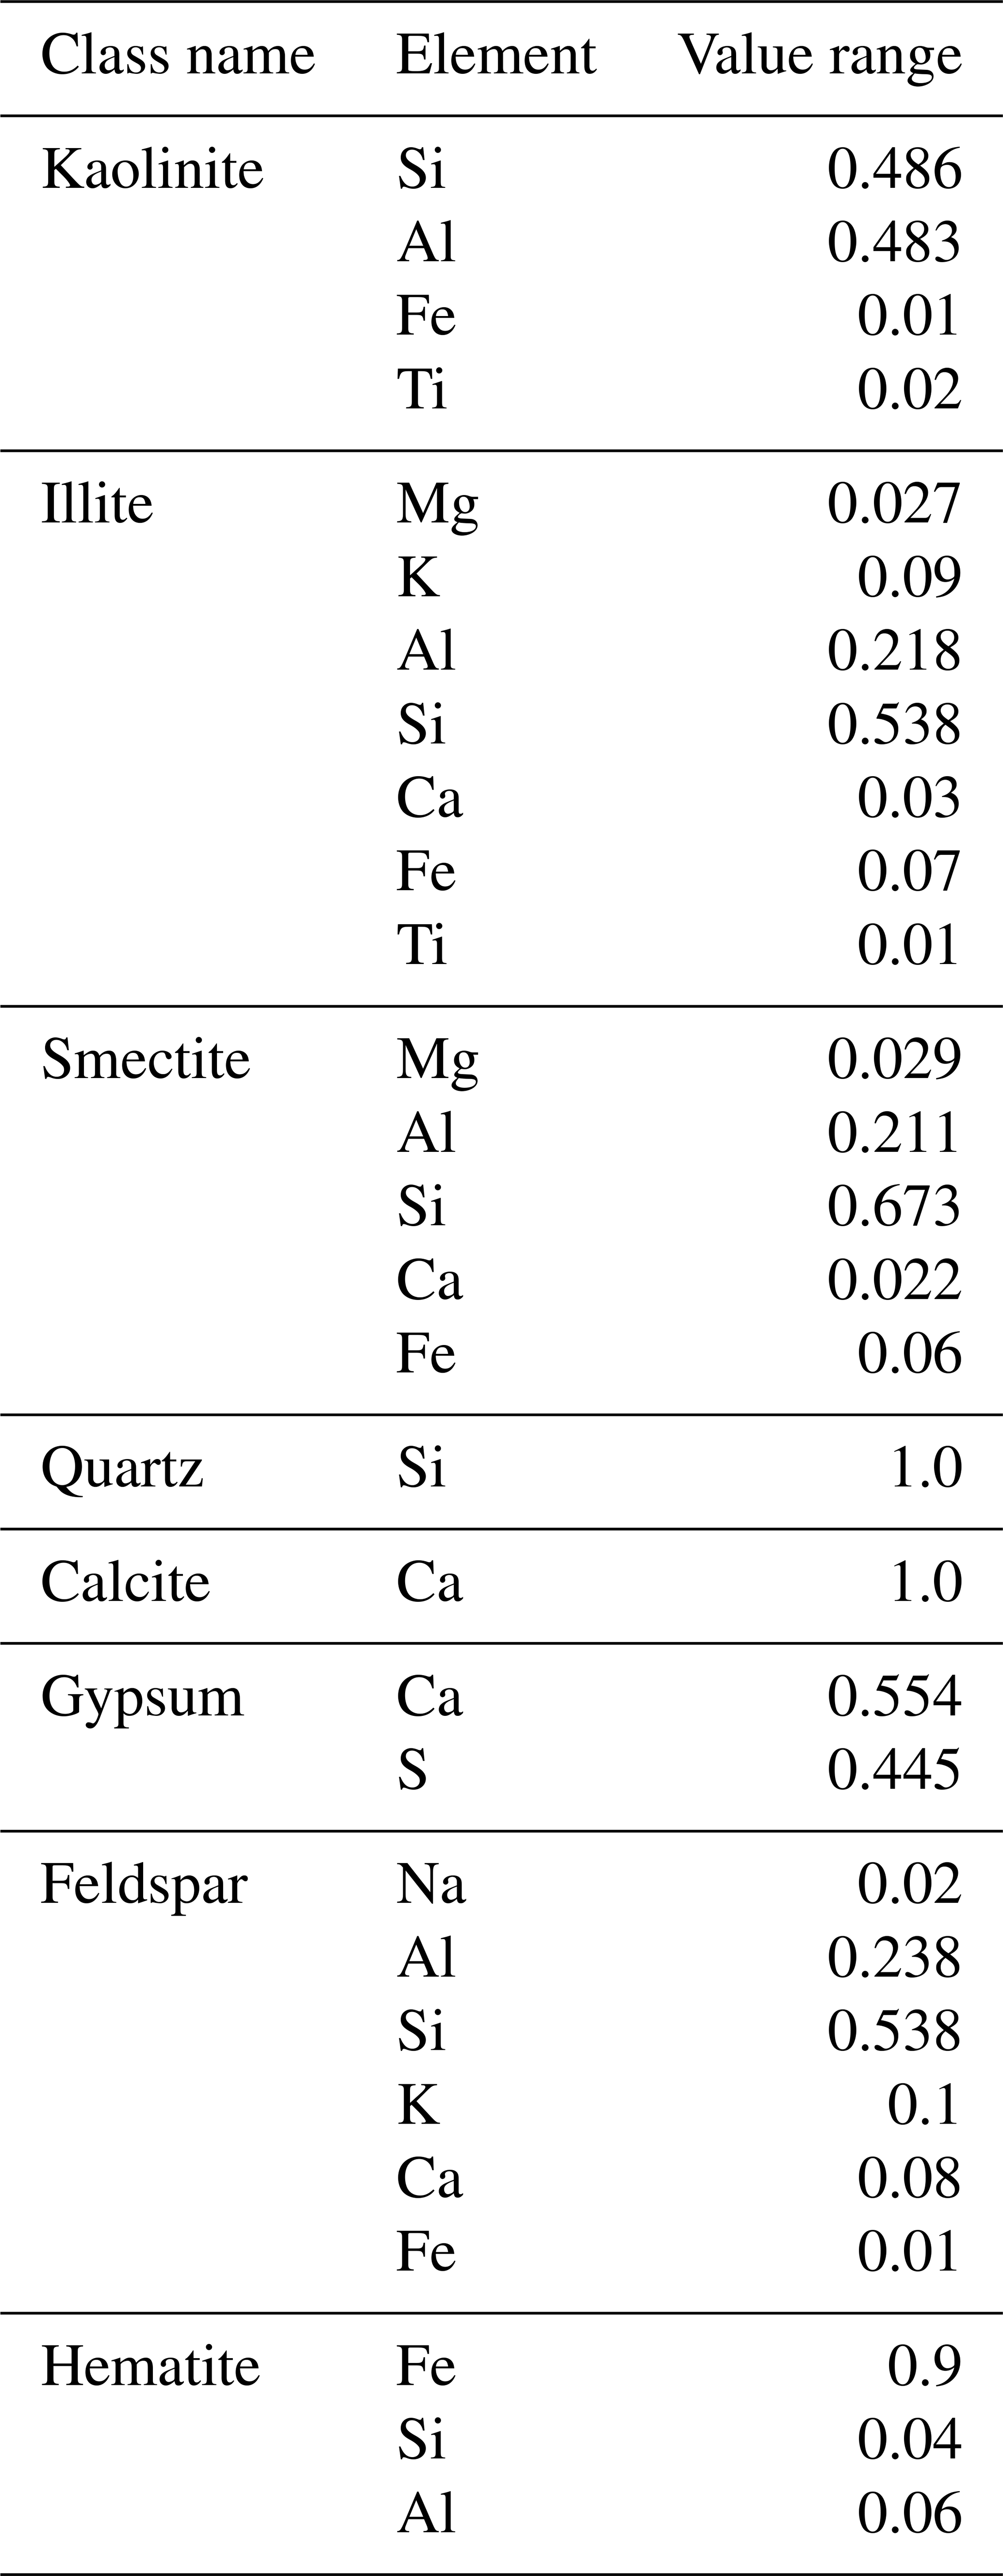
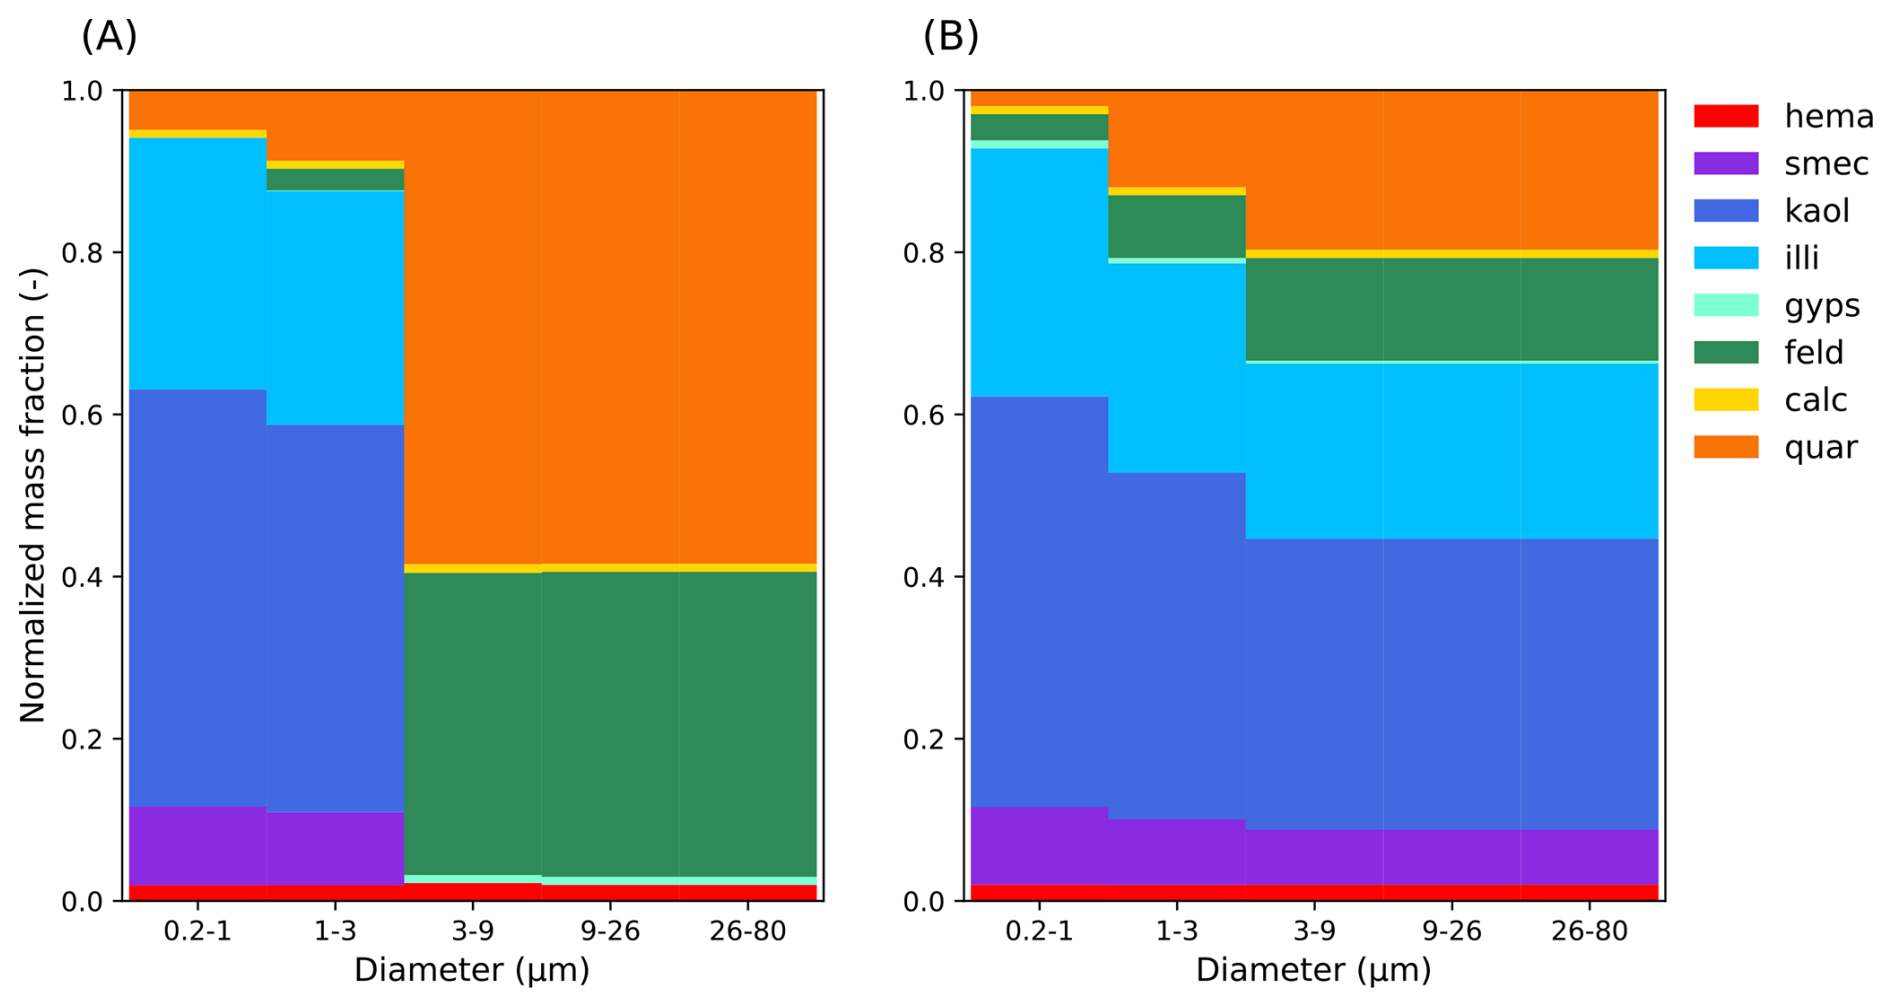
Figure B1Comparison of normalized mineral mass size distributions for the Haplic Xerosol soil type located in the northwestern Sahara (22.75° N, 6.5° W). Panel (A) illustrates the soil mineral physical size distributions (PSDs) according to the GMINER database. Panel (B) depicts the resulting emitted aerosol mineral PSDs, representing the initial state of the dust plume immediately following emission. The aerosol PSD is derived by applying the BFT-based modification approach (Perlwitz et al., 2015a; Gonçalves Ageitos et al., 2023) to the underlying soil data. Quar: quartz; calc: calcite; feld: feldspars; gyps: gypsum; illi: illite; kaol: kaolinite; smec: smectite; hema: hematite.
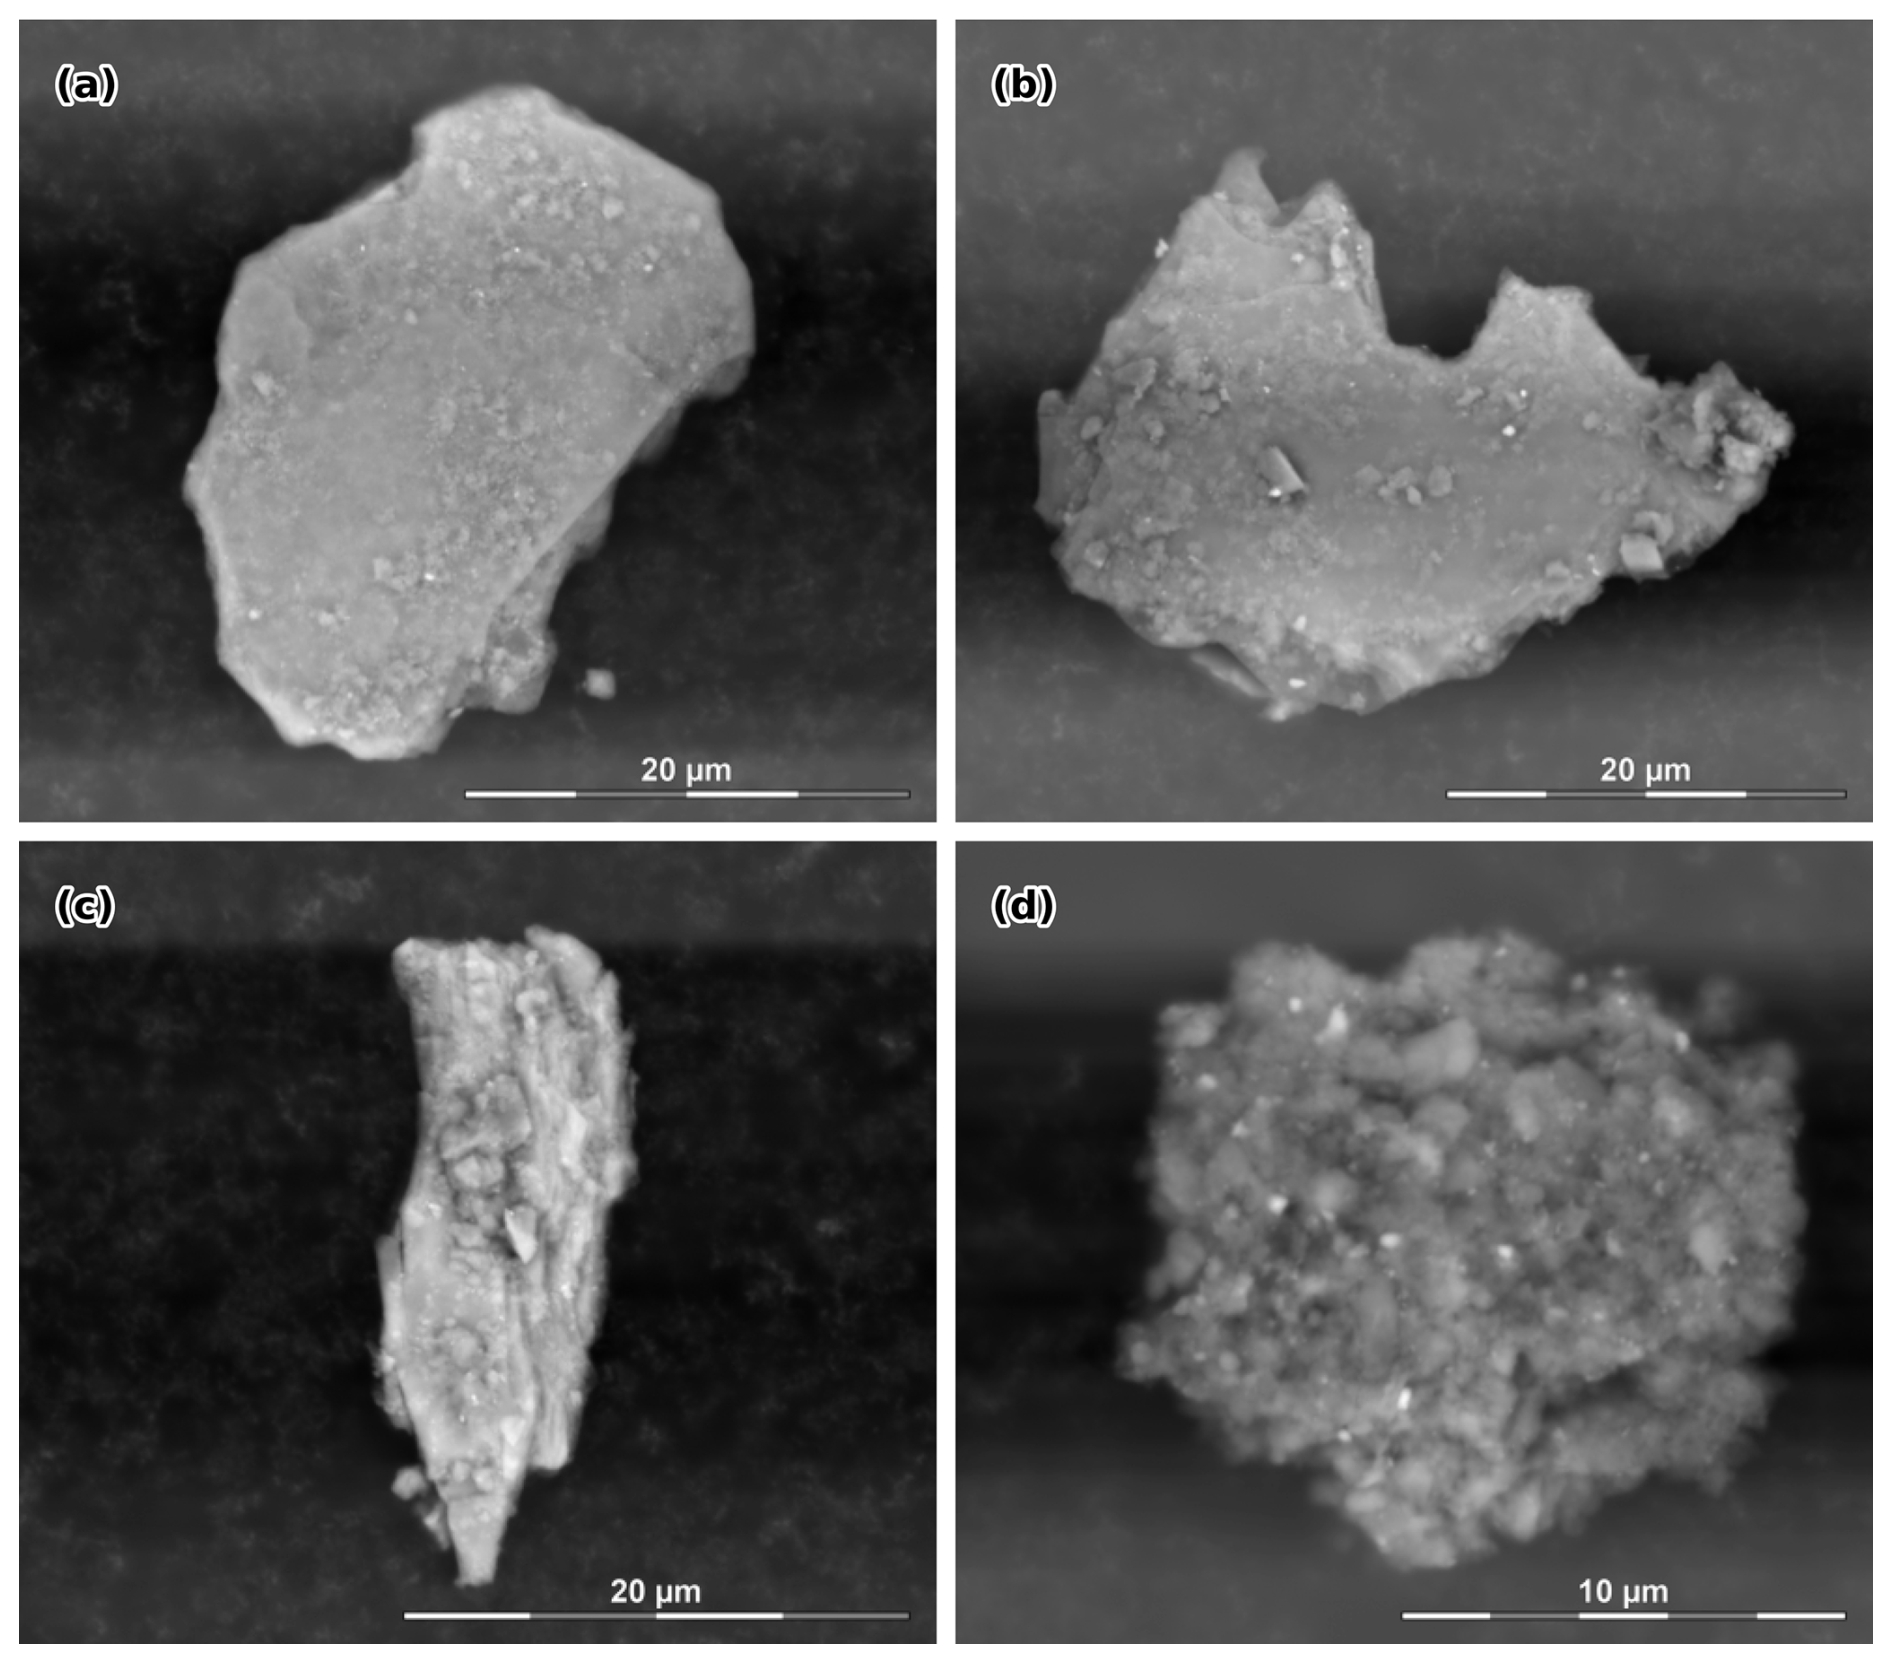
Figure C1Backscatter-electron images of large mineral dust particles with an illite-like composition, but different structure; sampled over São Vicente, Cabo Verde, on 17 June 2022 at an altitude of 2499–3384 m above sea level. The length given at the scale bar refers to its total length.
The version of code used for the modeled minerals is available at https://doi.org/10.5281/zenodo.20290654 (Gómez Maqueo Anaya et al., 2026a).
The dataset for reproducing the graphs presented here are available at https://doi.org/10.5281/zenodo.21132304 (Gómez Maqueo Anaya et al., 2026b).
SGMA drafted the manuscript. SA, KK, DA, MK, MH, IT, and KS reviewed and edited the manuscript. SGMA, HB, DA, BH, MH, and KS contributed to the conceptualization of the study. SGMA prepared the figures and organized the datasets. EJdSS and KWF were responsible for the elemental analysis of samples collected during the DUSTRISK 2022 campaign. SA and KK conducted the elemental analysis and mineral characterization of the samples collected by MK during the JATAC 2022 campaign. MF led the software development by restructuring the code associated with the MUSCAT dust emission scheme. SGMA, MF, BH, KS, and IT contributed to code development related to the inclusion of mineralogy. SGMA, SA, KK, and KS performed the formal data analysis.
The contact author has declared that none of the authors has any competing interests.
Publisher's note: Copernicus Publications remains neutral with regard to jurisdictional claims made in the text, published maps, institutional affiliations, or any other geographical representation in this paper. The authors bear the ultimate responsibility for providing appropriate place names. Views expressed in the text are those of the authors and do not necessarily reflect the views of the publisher.
This article is part of the special issue “The Joint Aeolus Tropical Atlantic Campaign (JATAC) (AMT/ACP inter-journal SI)”. It is not associated with a conference.
This study is done in the framework of the DUSTRISK (a risk index for health effects of mineral dust and associated microbes) project, funded by the Leibniz Collaborative Excellence Programme Project (grant number K255/2019).
This research has been supported by the German Federal Ministry for Economic Affairs and Energy (BMWi) (grant no. 50EE1721C). Furthermore, we also acknowledge the support through ACTRIS-2 under grant agreement no. 654109 from the European Union's Horizon 2020 research and innovation programme and ACTRIS PPP under the Horizon 2020 – Research and Innovation Framework Programme, H2020-INFRADEV-2016-2017, Grant Agreement number: 7395302.
We acknowledge and thank the team of OSCM/INMG for their crucial and ongoing support. We further thank ESA and the ASKOS/JATAC teams for the organization of the JATAC(s) campaign(s) and their continuous support.
Further thanks are due to the Deutscher Wetterdienst (DWD) for cooperation and support. We also gratefully acknowledge the Darmstadt Institute for their thorough analysis of the samples, for sharing the results, and for tailoring the analyses to the specific needs of this study. We further thank the National Observatory of Athens for collecting the samples.
Furthermore, ChatGPT and Gemini were utilized to rephrase and shorten sentences, as well to identify the appropriate prepositions.
This research has been supported by the Bundesministerium für Wirtschaft und Energie (grant no. 50EE1721C), the EU Horizon 2020 (grant no. 7395302), and the Leibniz Collaborative Excellence Programme Project (grant no. K255/2019).
This paper was edited by Lynn M. Russell and reviewed by Nicolás Cosentino and one anonymous referee.
Adedokun, J. A., Emofurieta, W. O., and Adedeji, O. A.: Physical, mineralogical and chemical properties of harmattan dust at Ile-Ife, Nigeria, Theor. Appl. Climatol., 40, 161–169, https://doi.org/10.1007/BF00866179, 1989. a
Alastuey, A., Querol, X., Castillo, S., Escudero, M., Avila, A., Cuevas, E., Torres, C., Romero, P.-M., Exposito, F., García, O., Pedro Diaz, J., Dingenen, R. V., and Putaud, J. P.: Characterisation of TSP and PM2.5 at Izaña and Sta. Cruz de Tenerife (Canary Islands, Spain) during a Saharan Dust Episode (July 2002), Atmos. Environ., 39, 4715–4728, https://doi.org/10.1016/j.atmosenv.2005.04.018, 2005. a, b
Albani, S., Mahowald, N. M., Perry, A. T., Scanza, R. A., Zender, C. S., Heavens, N. G., Maggi, V., Kok, J. F., and Otto-Bliesner, B. L.: Improved dust representation in the Community Atmosphere Model, J. Adv. Model. Earth Sy., 6, 541–570, https://doi.org/10.1002/2013MS000279, 2014. a
Aryasree, S., Kandler, K., Benker, N., Walser, A., Tipka, A., Dollner, M., Seibert, P., and Weinzierl, B.: Vertical Variability in morphology, chemistry and optical properties of the transported Saharan air layer measured from Cape Verde and the Caribbean, Roy. Soc. Open Sci., 11, 231433, https://doi.org/10.1098/rsos.231433, 2024. a, b
Baldauf, M., Seifert, A., Förstner, J., Majewski, D., Raschendorfer, M., and Reinhardt, T.: Operational Convective-Scale Numerical Weather Prediction with the COSMO Model: Description and Sensitivities, Mon. Weather Rev., 139, 3887–3905, https://doi.org/10.1175/MWR-D-10-05013.1, 2011. a
Balkanski, Y., Schulz, M., Claquin, T., and Guibert, S.: Reevaluation of Mineral aerosol radiative forcings suggests a better agreement with satellite and AERONET data, Atmos. Chem. Phys., 7, 81–95, https://doi.org/10.5194/acp-7-81-2007, 2007. a
Barkan, J., Kutiel, H., Alpert, P., and Kishcha, P.: Synoptics of dust intrusion days from the African continent into the Atlantic Ocean, J. Geophys. Res.-Atmos., 109, 2003JD004416, https://doi.org/10.1029/2003JD004416, 2004. a
Berge, E.: Transboundary air pollution in Europe, Part 2: Numerical addendum to emissions, dispersion and trends of acidifying and eutrophying agents, https://www.osti.gov/etdeweb/biblio/646220 (last access: 13 July 2026), 1997. a
Bredeck, G., Dos S. Souza, E. J., Wigmann, C., Fomba, K. W., Herrmann, H., and Schins, R. P.: The influence of long-range transported Saharan dust on the inflammatory potency of ambient PM2.5 and PM10, Environ. Res., 252, 119008, https://doi.org/10.1016/j.envres.2024.119008, 2024. a, b
Caquineau, S., Gaudichet, A., Gomes, L., Magonthier, M.-C., and Chatenet, B.: Saharan dust: Clay ratio as a relevant tracer to assess the origin of soil-derived aerosols, Geophys. Res. Lett., 25, 983–986, https://doi.org/10.1029/98GL00569, 1998. a
Cardoso, J., Almeida, S. M., Nunes, T., Almeida-Silva, M., Cerqueira, M., Alves, C., Rocha, F., Chaves, P., Reis, M., Salvador, P., Artiñano, B., and Pio, C.: Source apportionment of atmospheric aerosol in a marine dusty environment by ionic/composition mass balance (IMB), Atmos. Chem. Phys., 18, 13215–13230, https://doi.org/10.5194/acp-18-13215-2018, 2018. a
Chatziparaschos, M., Daskalakis, N., Myriokefalitakis, S., Kalivitis, N., Nenes, A., Gonçalves Ageitos, M., Costa-Surós, M., Pérez García-Pando, C., Zanoli, M., Vrekoussis, M., and Kanakidou, M.: Role of K-feldspar and quartz in global ice nucleation by mineral dust in mixed-phase clouds, Atmos. Chem. Phys., 23, 1785–1801, https://doi.org/10.5194/acp-23-1785-2023, 2023. a
Dang, C., Segal-Rozenhaimer, M., Che, H., Zhang, L., Formenti, P., Taylor, J., Dobracki, A., Purdue, S., Wong, P.-S., Nenes, A., Sedlacek III, A., Coe, H., Redemann, J., Zuidema, P., Howell, S., and Haywood, J.: Biomass burning and marine aerosol processing over the southeast Atlantic Ocean: a TEM single-particle analysis, Atmos. Chem. Phys., 22, 9389–9412, https://doi.org/10.5194/acp-22-9389-2022, 2022. a
Darmenova, K., Sokolik, I. N., Shao, Y., Marticorena, B., and Bergametti, G.: Development of a physically based dust emission module within the Weather Research and Forecasting (WRF) model: Assessment of dust emission parameterizations and input parameters for source regions in Central and East Asia, J. Geophys. Res.-Atmos., 114, https://doi.org/10.1029/2008JD011236, 2009. a
Di Biagio, C., Formenti, P., Balkanski, Y., Caponi, L., Cazaunau, M., Pangui, E., Journet, E., Nowak, S., Andreae, M. O., Kandler, K., Saeed, T., Piketh, S., Seibert, D., Williams, E., and Doussin, J.-F.: Complex refractive indices and single-scattering albedo of global dust aerosols in the shortwave spectrum and relationship to size and iron content, Atmos. Chem. Phys., 19, 15503–15531, https://doi.org/10.5194/acp-19-15503-2019, 2019. a, b, c
Di Biagio, C., Balkanski, Y., Albani, S., Boucher, O., and Formenti, P.: Direct Radiative Effect by Mineral Dust Aerosols Constrained by New Microphysical and Spectral Optical Data, Geophys. Res. Lett., 47, e2019GL086186, https://doi.org/10.1029/2019GL086186, 2020. a
Deabji, N., Fomba, K. W., El Hajjaji, S., Mellouki, A., Poulain, L., Zeppenfeld, S., and Herrmann, H.: First insights into northern Africa high-altitude background aerosol chemical composition and source influences, Atmos. Chem. Phys., 21, 18147–18174, https://doi.org/10.5194/acp-21-18147-2021, 2021. a
Enete, I.: Harmattan Dust: Composition, Characteristics and Effects on Soil Fertility in Enugu, Nigeria, British Journal of Applied Science and Technology, 2, 72–81, https://doi.org/10.9734/BJAST/2012/950, 2012. a, b, c
Fomba, K. W., Deabji, N., Barcha, S. E. I., Ouchen, I., Elbaramoussi, E. M., El Moursli, R. C., Harnafi, M., El Hajjaji, S., Mellouki, A., and Herrmann, H.: Application of TXRF in monitoring trace metals in particulate matter and cloud water, Atmos. Meas. Tech., 13, 4773–4790, https://doi.org/10.5194/amt-13-4773-2020, 2020. a, b
Fomba, K. W., Quaye, D. T., Achterberg, E. P., Marais, E., and Herrmann, H.: Saharan and Namib Dust Phosphorus Fluxes in the North and South Atlantic Regions, ACS Earth and Space Chemistry, 9, 1465–1478, https://doi.org/10.1021/acsearthspacechem.4c00411, 2025. a
Formenti, P., Rajot, J. L., Desboeufs, K., Caquineau, S., Chevaillier, S., Nava, S., Gaudichet, A., Journet, E., Triquet, S., Alfaro, S., Chiari, M., Haywood, J., Coe, H., and Highwood, E.: Regional variability of the composition of mineral dust from western Africa: Results from the AMMA SOP0/DABEX and DODO field campaigns, J. Geophys. Res.-Atmos., 113, https://doi.org/10.1029/2008JD009903, 2008. a, b
Formenti, P., Schütz, L., Balkanski, Y., Desboeufs, K., Ebert, M., Kandler, K., Petzold, A., Scheuvens, D., Weinbruch, S., and Zhang, D.: Recent progress in understanding physical and chemical properties of African and Asian mineral dust, Atmos. Chem. Phys., 11, 8231–8256, https://doi.org/10.5194/acp-11-8231-2011, 2011. a, b
Formenti, P., Caquineau, S., Desboeufs, K., Klaver, A., Chevaillier, S., Journet, E., and Rajot, J. L.: Mapping the physico-chemical properties of mineral dust in western Africa: mineralogical composition, Atmos. Chem. Phys., 14, 10663–10686, https://doi.org/10.5194/acp-14-10663-2014, 2014. a, b, c, d
Fuster, B., Sánchez-Zapero, J., Camacho, F., García-Santos, V., Verger, A., Lacaze, R., Weiss, M., Baret, F., and Smets, B.: Quality Assessment of PROBA-V LAI, fAPAR and fCOVER Collection 300 m Products of Copernicus Global Land Service, Remote Sens.-Basel, 12, 1017, https://doi.org/10.3390/rs12061017, 2020. a
Fécan, F., Marticorena, B., and Bergametti, G.: Parametrization of the increase of the aeolian erosion threshold wind friction velocity due to soil moisture for arid and semi-arid areas, Ann. Geophys., 17, 149–157, https://doi.org/10.1007/s00585-999-0149-7, 1999. a, b
Gebauer, H., Floutsi, A. A., Hofer, J., Haarig, M., Skupin, A., Engelmann, R., Jimenez, C., Wagner, R., and Baars, H.: Characterization of the annual cycle of atmospheric aerosol over Mindelo, Cabo Verde, by means of continuous multiwavelength lidar observations, Atmos. Chem. Phys., 26, 3439–3465, https://doi.org/10.5194/acp-26-3439-2026, 2026. a
Gómez Maqueo Anaya, S., Faust, M., Heinold, B., Schepanski, K., and Tegen, I.: Dustonly/Dustonly: v2.0 (Version v2.0), Zenodo [computer software], https://doi.org/10.5281/zenodo.20290654, 2026a. a
Gómez Maqueo Anaya, S., Dos Santos Souza, E. J., Fomba, K. W., Aryasree, S., and Kandler, K.: Datasets for “Refining simulated mineral dust composition through modified size distributions: dual validation with mineral-specific and elemental observations”, Zenodo [data set], https://doi.org/10.5281/zenodo.21132304, 2026b. a, b
Gonçalves Ageitos, M., Obiso, V., Miller, R. L., Jorba, O., Klose, M., Dawson, M., Balkanski, Y., Perlwitz, J., Basart, S., Di Tomaso, E., Escribano, J., Macchia, F., Montané, G., Mahowald, N. M., Green, R. O., Thompson, D. R., and Pérez García-Pando, C.: Modeling dust mineralogical composition: sensitivity to soil mineralogy atlases and their expected climate impacts, Atmos. Chem. Phys., 23, 8623–8657, https://doi.org/10.5194/acp-23-8623-2023, 2023. a, b, c, d, e, f, g, h, i, j, k
Green, R. O., Mahowald, N., Ung, C., Thompson, D. R., Bator, L., Bennet, M., Bernas, M., Blackway, N., Bradley, C., Cha, J., Clark, P., Clark, R., Cloud, D., Diaz, E., Ben Dor, E., Duren, R., Eastwood, M., Ehlmann, B. L., Fuentes, L., Ginoux, P., Gross, J., He, Y., Kalashnikova, O., Kert, W., Keymeulen, D., Klimesh, M., Ku, D., Kwong-Fu, H., Liggett, E., Li, L., Lundeen, S., Makowski, M. D., Mazer, A., Miller, R., Mouroulis, P., Oaida, B., Okin, G. S., Ortega, A., Oyake, A., Nguyen, H., Pace, T., Painter, T. H., Pempejian, J., Garcia-Pando, C. P., Pham, T., Phillips, B., Pollock, R., Purcell, R., Realmuto, V., Schoolcraft, J., Sen, A., Shin, S., Shaw, L., Soriano, M., Swayze, G., Thingvold, E., Vaid, A., and Zan, J.: The Earth Surface Mineral Dust Source Investigation: An Earth Science Imaging Spectroscopy Mission, in: 2020 IEEE Aerospace Conference, 1–15, https://doi.org/10.1109/AERO47225.2020.9172731, 2020. a, b
Gómez Maqueo Anaya, S.: Implementation of mineralogical composition of dust aerosol into COSMO-MUSCAT and application to interpret lidar data, Doctoral dissertation, University of Leipzig, https://nbn-resolving.org/urn:nbn:de:bsz:15-qucosa2-1034489 (last access: 13 July 2026), 2025. a
Gómez Maqueo Anaya, S., Althausen, D., Faust, M., Baars, H., Heinold, B., Hofer, J., Tegen, I., Ansmann, A., Engelmann, R., Skupin, A., Heese, B., and Schepanski, K.: The implementation of dust mineralogy in COSMO5.05-MUSCAT, Geosci. Model Dev., 17, 1271–1295, https://doi.org/10.5194/gmd-17-1271-2024, 2024. a, b, c, d, e, f, g, h, i, j, k
Gómez Maqueo Anaya, S., Althausen, D., Hofer, J., Haarig, M., Wandinger, U., Heinold, B., Tegen, I., Faust, M., Baars, H., Ansmann, A., Engelmann, R., Skupin, A., Heese, B., and Schepanski, K.: Investigating the link between mineral dust hematite content and intensive optical properties by means of lidar measurements and aerosol modeling, Atmos. Chem. Phys., 25, 9737–9764, https://doi.org/10.5194/acp-25-9737-2025, 2025. a, b, c, d, e
Harrison, A. D., Lever, K., Sanchez-Marroquin, A., Holden, M. A., Whale, T. F., Tarn, M. D., McQuaid, J. B., and Murray, B. J.: The ice-nucleating ability of quartz immersed in water and its atmospheric importance compared to K-feldspar, Atmos. Chem. Phys., 19, 11343–11361, https://doi.org/10.5194/acp-19-11343-2019, 2019. a
Heinold, B., Helmert, J., Hellmuth, O., Wolke, R., Ansmann, A., Marticorena, B., Laurent, B., and Tegen, I.: Regional modeling of Saharan dust events using LM-MUSCAT: Model description and case studies, J. Geophys. Res.-Atmos., 112, https://doi.org/10.1029/2006JD007443, 2007. a
Heinold, B., Tegen, I., Schepanski, K., Tesche, M., Esselborn, M., Freudenthaler, V., Gross, S., Kandler, K., Knippertz, P., Müller, D., Schladitz, A., Toledano, C., Weinzierl, B., Ansmann, A., Althausen, D., Müller, T., Petzold, A., and Wiedensohler, A.: Regional modelling of Saharan dust and biomass-burning smoke: Part 1: Model description and evaluation, Tellus B, 63, 781–799, https://doi.org/10.1111/j.1600-0889.2011.00570.x, 2011. a, b, c
Huneeus, N., Schulz, M., Balkanski, Y., Griesfeller, J., Prospero, J., Kinne, S., Bauer, S., Boucher, O., Chin, M., Dentener, F., Diehl, T., Easter, R., Fillmore, D., Ghan, S., Ginoux, P., Grini, A., Horowitz, L., Koch, D., Krol, M. C., Landing, W., Liu, X., Mahowald, N., Miller, R., Morcrette, J.-J., Myhre, G., Penner, J., Perlwitz, J., Stier, P., Takemura, T., and Zender, C. S.: Global dust model intercomparison in AeroCom phase I, Atmos. Chem. Phys., 11, 7781–7816, https://doi.org/10.5194/acp-11-7781-2011, 2011. a
Iversen, J. D. and White, B. R.: Saltation threshold on Earth, Mars and Venus, Sedimentology, 29, 111–119, https://doi.org/10.1111/j.1365-3091.1982.tb01713.x, 1982. a, b
Jahn, L. G., Jahl, L. G., Bland, G. D., Bowers, B. B., Monroe, L. W., and Sullivan, R. C.: Metallic and Crustal Elements in Biomass-Burning Aerosol and Ash: Prevalence, Significance, and Similarity to Soil Particles, ACS Earth and Space Chemistry, 5, 136–148, https://doi.org/10.1021/acsearthspacechem.0c00191, 2021. a
Jakobsen, H. A., Berge, E., and Jonson, J. E.: The Multi-layer Eulerian Model: Model Description and Evaluation of Transboundary Fluxes of Sulphur and Nitrogen for One Year, DNMI Research Report 49, Meteorological Synthesizing Centre-West, https://books.google.de/books?id=Lu8ivwEACAAJ (last access: 13 July 2026), eCE Co-Operative Programme for and Europe, Evaluation of the Long Range Transmission of Air Pollutants in and Meteorological Synthesizing Centre–West (Oslo, Norway), 1997. a
Jeong, G. Y. and Achterberg, E. P.: Chemistry and mineralogy of clay minerals in Asian and Saharan dusts and the implications for iron supply to the oceans, Atmos. Chem. Phys., 14, 12415–12428, https://doi.org/10.5194/acp-14-12415-2014, 2014. a
Journet, E., Desboeufs, K. V., Caquineau, S., and Colin, J.-L.: Mineralogy as a critical factor of dust iron solubility, Geophys. Res. Lett., 35, https://doi.org/10.1029/2007GL031589, 2008. a, b
Journet, E., Balkanski, Y., and Harrison, S. P.: A new data set of soil mineralogy for dust-cycle modeling, Atmos. Chem. Phys., 14, 3801–3816, https://doi.org/10.5194/acp-14-3801-2014, 2014. a, b
Kandler, K., Benker, N., Bundke, U., Cuevas, E., Ebert, M., Knippertz, P., Rodríguez, S., Schütz, L., and Weinbruch, S.: Chemical composition and complex refractive index of Saharan Mineral Dust at Izaña, Tenerife (Spain) derived by electron microscopy, Atmos. Environ., 41, 8058–8074, https://doi.org/10.1016/j.atmosenv.2007.06.047, 2007. a, b, c
Kandler, K., Schütz, L., Deutscher, C., Ebert, M., Hofmann, H., Jäckel, S., Jaenicke, R., Knippertz, P., Lieke, K., Massling, A., Petzold, A., Schladitz, A., Weinzierl, B., Wiedensohler, A., Zorn, S., and Weinbruch, S.: Size distribution, mass concentration, chemical and mineralogical composition and derived optical parameters of the boundary layer aerosol at Tinfou, Morocco, during SAMUM 2006, Tellus B, 61, 32, https://doi.org/10.1111/j.1600-0889.2008.00385.x, 2009. a, b, c, d, e, f
Kandler, K., Schütz, L., Jäckel, S., Lieke, K., Emmel, C., Müller-Ebert, D., Ebert, M., Scheuvens, D., Schladitz, A., Šegvić, B., Wiedensohler, A., and Weinbruch, S.: Ground-based off-line aerosol measurements at Praia, Cape Verde, during the Saharan Mineral Dust Experiment: microphysical properties and mineralogy, Tellus B, 63, 459–474, https://doi.org/10.1111/j.1600-0889.2011.00546.x, 2011. a
Kandler, K., Schneiders, K., Ebert, M., Hartmann, M., Weinbruch, S., Prass, M., and Pöhlker, C.: Composition and mixing state of atmospheric aerosols determined by electron microscopy: method development and application to aged Saharan dust deposition in the Caribbean boundary layer, Atmos. Chem. Phys., 18, 13429–13455, https://doi.org/10.5194/acp-18-13429-2018, 2018. a, b, c, d, e
Kelly, J. T., Chuang, C. C., and Wexler, A. S.: Influence of dust composition on cloud droplet formation, Atmos. Environ., 41, 2904–2916, https://doi.org/10.1016/j.atmosenv.2006.12.008, 2007. a
Kezoudi, M., Keleshis, C., Antoniou, P., Biskos, G., Bronz, M., Constantinides, C., Desservettaz, M., Gao, R.-S., Girdwood, J., Harnetiaux, J., Kandler, K., Leonidou, A., Liu, Y., Lelieveld, J., Marenco, F., Mihalopoulos, N., Močnik, G., Neitola, K., Paris, J.-D., Pikridas, M., Sarda-Esteve, R., Stopford, C., Unga, F., Vrekoussis, M., and Sciare, J.: The Unmanned Systems Research Laboratory (USRL): A New Facility for UAV-Based Atmospheric Observations, Atmosphere, 12, 1042, https://doi.org/10.3390/atmos12081042, 2021. a, b
Kezoudi, M., Papetta, A., Kandler, K., Ryder, C. L., Leonidou, A., Keleshis, C., Stopford, C., Thornberry, T., Mamouri, R.-E., Sciare, J., and Marenco, F.: Microphysical and Compositional Differences Between Saharan and Middle Eastern Dust Revealed by UAS Observations, EGUsphere [preprint], https://doi.org/10.5194/egusphere-2025-5234, 2025. a
Kinne, S., Schulz, M., Textor, C., Guibert, S., Balkanski, Y., Bauer, S. E., Berntsen, T., Berglen, T. F., Boucher, O., Chin, M., Collins, W., Dentener, F., Diehl, T., Easter, R., Feichter, J., Fillmore, D., Ghan, S., Ginoux, P., Gong, S., Grini, A., Hendricks, J., Herzog, M., Horowitz, L., Isaksen, I., Iversen, T., Kirkevåg, A., Kloster, S., Koch, D., Kristjansson, J. E., Krol, M., Lauer, A., Lamarque, J. F., Lesins, G., Liu, X., Lohmann, U., Montanaro, V., Myhre, G., Penner, J., Pitari, G., Reddy, S., Seland, O., Stier, P., Takemura, T., and Tie, X.: An AeroCom initial assessment – optical properties in aerosol component modules of global models, Atmos. Chem. Phys., 6, 1815–1834, https://doi.org/10.5194/acp-6-1815-2006, 2006. a
Kok, J. F.: A scaling theory for the size distribution of emitted dust aerosols suggests climate models underestimate the size of the global dust cycle, P. Natl. Acad. Sci. USA, 108, 1016–1021, https://doi.org/10.1073/pnas.1014798108, 2011. a, b, c, d, e
Kok, J. F., Parteli, E. J. R., Michaels, T. I., and Karam, D. B.: The physics of wind-blown sand and dust, Rep. Prog. Phys., 75, 106901, https://doi.org/10.1088/0034-4885/75/10/106901, 2012. a, b
Kok, J. F., Storelvmo, T., Karydis, V. A., Adebiyi, A. A., Mahowald, N. M., Evan, A. T., He, C., and Leung, D. M.: Mineral dust aerosol impacts on global climate and climate change, Nature Reviews Earth and Environment, 4, 71–86, https://doi.org/10.1038/s43017-022-00379-5, 2023. a, b
Lafon, S., Rajot, J.-L., Alfaro, S. C., and Gaudichet, A.: Quantification of iron oxides in desert aerosol, Atmos. Environ., 38, 1211–1218, https://doi.org/10.1016/j.atmosenv.2003.11.006, 2004. a, b, c, d, e
Laskin, A. and Cowin, J. P.: Automated Single-Particle SEM/EDX Analysis of Submicrometer Particles down to 0.1 µm, Anal. Chem., 73, 1023–1029, https://doi.org/10.1021/ac0009604, 2001. a
Lawrence, C. R. and Neff, J. C.: The contemporary physical and chemical flux of aeolian dust: A synthesis of direct measurements of dust deposition, Chem. Geol., 267, 46–63, https://doi.org/10.1016/j.chemgeo.2009.02.005, 2009. a
Li, L., Mahowald, N. M., Miller, R. L., Pérez García-Pando, C., Klose, M., Hamilton, D. S., Gonçalves Ageitos, M., Ginoux, P., Balkanski, Y., Green, R. O., Kalashnikova, O., Kok, J. F., Obiso, V., Paynter, D., and Thompson, D. R.: Quantifying the range of the dust direct radiative effect due to source mineralogy uncertainty, Atmos. Chem. Phys., 21, 3973–4005, https://doi.org/10.5194/acp-21-3973-2021, 2021. a, b, c, d
Li, L., Mahowald, N. M., Gonçalves Ageitos, M., Obiso, V., Miller, R. L., Pérez García-Pando, C., Di Biagio, C., Formenti, P., Brodrick, P. G., Clark, R. N., Green, R. O., Kokaly, R., Swayze, G., and Thompson, D. R.: Improved constraints on hematite refractive index for estimating climatic effects of dust aerosols, Communications Earth and Environment, 5, 295, https://doi.org/10.1038/s43247-024-01441-4, 2024. a, b, c, d
Lieke, K., Kandler, K., Scheuvens, D., Emmel, C., Von Glahn, C., Petzold, A., Weinzierl, B., Veira, A., Ebert, M., Weinbruch, S., and Schütz, L.: Particle chemical properties in the vertical column based on aircraft observations in the vicinity of Cape Verde Islands, Tellus B, 63, 497, https://doi.org/10.1111/j.1600-0889.2011.00553.x, 2011. a
Mahowald, N., Albani, S., Kok, J. F., Engelstaeder, S., Scanza, R., Ward, D. S., and Flanner, M. G.: The size distribution of desert dust aerosols and its impact on the Earth system, Aeolian Res., 15, 53–71, https://doi.org/10.1016/j.aeolia.2013.09.002, 2014. a
Mahowald, N. M., Li, L., Gonçalves Ageitos, M., Miller, R. L., Pérez García-Pando, C., Ginoux, P., Obiso, V., Brodrick, P. G., Clark, R. N., Desboeufs, K., Green, R. O., Okin, G. S., Thompson, D. R., Rathod, S., Gazel, E., Hornby, A., Journet, E., Alaimo, M. G., Alves, C., Alastuey, A., Artaxo, P., Baker, A. R., Barraza, F., Becagli, S., Buck, C. S., Calzolai, G., Chellam, S., Chen, Y., Chuang, P. Y., Cohen, D. D., Colombi, C., Diapouli, E., Dongarra, G., Eleftheriadis, K., Engelbrecht, J. P., Galy-Lacaux, C., Gaston, C., Gomez, D., González Ramos, Y., Hand, J., Harrison, R. M., Herut, B., Hopke, P. K., Kertesz, Z., Kyllönen, K., Lambert, F., Landing, W. M., Losno, R., Lucarelli, F., Maenhaut, W., Marsay, C., Matsui, H., Martin, R. V., Morera-Gómez, Y., Paytan, A., Prospero, J., Rodríguez, S., Sarthou, G., Shelley, R., Siefert, R. L., Smichowski, P., and Varrica, D.: Global Model Estimates of Atmospheric Al, Ca, Fe, Si, and Ti From Dust and Non-Dust Aerosols Informed by EMIT Surface Mineralogy and Evaluated Against Observations, Global Biogeochem. Cy., 40, e2025GB009033, https://doi.org/10.1029/2025GB009033, 2026. a, b, c, d, e
Marinou, E., Paschou, P., Tsikoudi, I., Tsekeri, A., Daskalopoulou, V., Kouklaki, D., Siomos, N., Spanakis-Misirlis, V., Voudouri, K. A., Georgiou, T., Drakaki, E., Kampouri, A., Papachristopoulou, K., Mavropoulou, I., Mallios, S., Proestakis, E., Gkikas, A., Koutsoupi, I., Raptis, I. P., Kazadzis, S., Baars, H., Floutsi, A., Pirloaga, R., Nemuc, A., Marenco, F., Kezoudi, M., Papetta, A., Močnik, G., Díez, J. Y., Ryder, C. L., Ratcliffe, N., Kandler, K., Sudharaj, A., and Amiridis, V.: An Overview of the ASKOS Campaign in Cabo Verde, in: 16th International Conference on Meteorology, Climatology and Atmospheric Physics – COMECAP 2023, MDPIp, 200, https://doi.org/10.3390/environsciproc2023026200, 2023. a
Marticorena, B. and Bergametti, G.: Modeling the atmospheric dust cycle: 1. Design of a soil-derived dust emission scheme, J. Geophys. Res.-Atmos., 100, 16415–16430, https://doi.org/10.1029/95JD00690, 1995. a, b, c, d, e, f, g, h, i, j, k, l, m, n, o, p, q
Menut, L., Siour, G., Bessagnet, B., Couvidat, F., Journet, E., Balkanski, Y., and Desboeufs, K.: Modelling the mineralogical composition and solubility of mineral dust in the Mediterranean area with CHIMERE 2017r4, Geosci. Model Dev., 13, 2051–2071, https://doi.org/10.5194/gmd-13-2051-2020, 2020. a, b, c, d
Miffre, A., Cholleton, D., Noël, C., and Rairoux, P.: Investigating the dependence of mineral dust depolarization on complex refractive index and size with a laboratory polarimeter at 180.0° lidar backscattering angle, Atmos. Meas. Tech., 16, 403–417, https://doi.org/10.5194/amt-16-403-2023, 2023. a
Miltenberger, A. K., Pfahl, S., and Wernli, H.: An online trajectory module (version 1.0) for the nonhydrostatic numerical weather prediction model COSMO, Geosci. Model Dev., 6, 1989–2004, https://doi.org/10.5194/gmd-6-1989-2013, 2013. a
Murray, B. J., O'Sullivan, D., Atkinson, J. D., and Webb, M. E.: Ice nucleation by particles immersed in supercooled cloud droplets, Chem. Soc. Rev., 41, 6519, https://doi.org/10.1039/c2cs35200a, 2012. a
Muñoz Sabater, J. and Copernicus Climate Change Service, S.: ERA5-Land hourly data from 2001 to present, https://doi.org/10.24381/CDS.E2161BAC, type: dataset, 2019. a
Møberg, J., Esu, I., and Malgwi, W.: Characteristics and constituent composition of Harmattan dust falling in Northern Nigeria, Geoderma, 48, 73–81, https://doi.org/10.1016/0016-7061(91)90007-G, 1991. a, b
Nickovic, S., Vukovic, A., Vujadinovic, M., Djurdjevic, V., and Pejanovic, G.: Technical Note: High-resolution mineralogical database of dust-productive soils for atmospheric dust modeling, Atmos. Chem. Phys., 12, 845–855, https://doi.org/10.5194/acp-12-845-2012, 2012. a, b, c, d, e, f, g, h, i
Obiso, V., Gonçalves Ageitos, M., Pérez García-Pando, C., Perlwitz, J. P., Schuster, G. L., Bauer, S. E., Di Biagio, C., Formenti, P., Tsigaridis, K., and Miller, R. L.: Observationally constrained regional variations of shortwave absorption by iron oxides emphasize the cooling effect of dust, Atmos. Chem. Phys., 24, 5337–5367, https://doi.org/10.5194/acp-24-5337-2024, 2024. a, b
Panta, A., Kandler, K., Alastuey, A., González-Flórez, C., González-Romero, A., Klose, M., Querol, X., Reche, C., Yus-Díez, J., and Pérez García-Pando, C.: Insights into the single-particle composition, size, mixing state, and aspect ratio of freshly emitted mineral dust from field measurements in the Moroccan Sahara using electron microscopy, Atmos. Chem. Phys., 23, 3861–3885, https://doi.org/10.5194/acp-23-3861-2023, 2023. a, b, c, d, e, f, g, h, i
Perlwitz, J. P., Pérez García-Pando, C., and Miller, R. L.: Predicting the mineral composition of dust aerosols – Part 1: Representing key processes, Atmos. Chem. Phys., 15, 11593–11627, https://doi.org/10.5194/acp-15-11593-2015, 2015a. a, b, c, d, e, f, g, h, i, j, k, l
Perlwitz, J. P., Pérez García-Pando, C., and Miller, R. L.: Predicting the mineral composition of dust aerosols – Part 2: Model evaluation and identification of key processes with observations, Atmos. Chem. Phys., 15, 11629–11652, https://doi.org/10.5194/acp-15-11629-2015, 2015b. a, b, c, d
Poggio, L., de Sousa, L. M., Batjes, N. H., Heuvelink, G. B. M., Kempen, B., Ribeiro, E., and Rossiter, D.: SoilGrids 2.0: producing soil information for the globe with quantified spatial uncertainty, SOIL, 7, 217–240, https://doi.org/10.5194/soil-7-217-2021, 2021. a, b, c
Prigent, C., Aires, F., Rossow, W. B., and Robock, A.: Sensitivity of satellite microwave and infrared observations to soil moisture at a global scale: Relationship of satellite observations to in situ soil moisture measurements, J. Geophys. Res.-Atmos., 110, https://doi.org/10.1029/2004JD005087, 2005. a, b
Pérez García-Pando, C., Miller, R. L., Perlwitz, J. P., Rodríguez, S., and Prospero, J. M.: Predicting the mineral composition of dust aerosols: Insights from elemental composition measured at the Izaña Observatory, Geophys. Res. Lett., 43, https://doi.org/10.1002/2016GL069873, 2016. a, b
Rieder, M., Cavazzini, G., D'yakonov, Y. S., Frank-Kamenetskii, V. A., Gottardi, G., Guggenheim, S., Koval’, P. W., Müller, G., Neiva, A. M. R., Radoslovich, E. W., Robert, J.-L., Sassi, F. P., Takeda, H., Weiss, Z., and Wones, D. R.: Nomenclature of the Micas, Clay. Clay Miner., 46, 586–595, https://doi.org/10.1346/CCMN.1998.0460513, 1998. a, b, c
Scanza, R. A., Mahowald, N., Ghan, S., Zender, C. S., Kok, J. F., Liu, X., Zhang, Y., and Albani, S.: Modeling dust as component minerals in the Community Atmosphere Model: development of framework and impact on radiative forcing, Atmos. Chem. Phys., 15, 537–561, https://doi.org/10.5194/acp-15-537-2015, 2015. a, b, c
Schepanski, K., Tegen, I., Laurent, B., Heinold, B., and Macke, A.: A new Saharan dust source activation frequency map derived from MSG-SEVIRI IR-channels, Geophys. Res. Lett., 34, https://doi.org/10.1029/2007GL030168, 2007. a, b
Schepanski, K., Tegen, I., and Macke, A.: Saharan dust transport and deposition towards the tropical northern Atlantic, Atmos. Chem. Phys., 9, 1173–1189, https://doi.org/10.5194/acp-9-1173-2009, 2009. a, b, c
Schepanski, K., Mallet, M., Heinold, B., and Ulrich, M.: North African dust transport toward the western Mediterranean basin: atmospheric controls on dust source activation and transport pathways during June–July 2013, Atmos. Chem. Phys., 16, 14147–14168, https://doi.org/10.5194/acp-16-14147-2016, 2016. a
Schepanski, K., Heinold, B., and Tegen, I.: Harmattan, Saharan heat low, and West African monsoon circulation: modulations on the Saharan dust outflow towards the North Atlantic, Atmos. Chem. Phys., 17, 10223–10243, https://doi.org/10.5194/acp-17-10223-2017, 2017. a
Scheuvens, D., Schütz, L., Kandler, K., Ebert, M., and Weinbruch, S.: Bulk composition of northern African dust and its source sediments – A compilation, Earth-Sci. Rev., 116, 170–194, https://doi.org/10.1016/j.earscirev.2012.08.005, 2013. a, b, c, d, e, f
Seinfeld, J. H. and Pandis, S. N.: Atmospheric Chemistry and Physics: From Air Pollution to Climate Change, 3rd edn., John Wiley & Sons, Hoboken, https://www.wiley.com/en-us/Atmospheric+Chemistry+and+Physics%3A+From+Air+Pollution+to+Climate+Change%2C+3rd+Edition-p-9781118947401 (last access: 13 July 2026), 2016. a
Shao, Y., Wyrwoll, K.-H., Chappell, A., Huang, J., Lin, Z., McTainsh, G. H., Mikami, M., Tanaka, T. Y., Wang, X., and Yoon, S.: Dust cycle: An emerging core theme in Earth system science, Aeolian Res., 2, 181–204, https://doi.org/10.1016/j.aeolia.2011.02.001, 2011. a
Sokolik, I. N. and Toon, O. B.: Incorporation of mineralogical composition into models of the radiative properties of mineral aerosol from UV to IR wavelengths, J. Geophys. Res.-Atmos., 104, 9423–9444, https://doi.org/10.1029/1998JD200048, 1999. a
Song, Q., Ginoux, P., Gonçalves Ageitos, M., Miller, R. L., Obiso, V., and Pérez García-Pando, C.: Modeling impacts of dust mineralogy on fast climate response, Atmos. Chem. Phys., 24, 7421–7446, https://doi.org/10.5194/acp-24-7421-2024, 2024. a, b
Souza, E. J. D. S., Fomba, K. W., Anaya, S. G. M., Schepanski, K., Freire, S. M., Materić, D., Reemtsma, T., and Herrmann, H.: Particle-bound mercury in Saharan dust-loaded particulate matter in Cabo Verde, J. Hazard. Mater., 487, 137053, https://doi.org/10.1016/j.jhazmat.2024.137053, 2025. a, b, c, d, e, f
Stein, A. F., Draxler, R. R., Rolph, G. D., Stunder, B. J. B., Cohen, M. D., and Ngan, F.: NOAA's HYSPLIT Atmospheric Transport and Dispersion Modeling System, B. Am. Meteorol. Soc., 96, 2059–2077, https://doi.org/10.1175/BAMS-D-14-00110.1, 2015. a, b
Stocker, T. F., Qin, D., Plattner, G.-K., Tignor, M., Allen, S. K., Boschung, J., Nauels, A., Xia, Y., Bex, V., and Midgley, P. M.: Climate Change 2013: The Physical Science Basis, Tech. rep., Intergovernmental Panel on Climate Change, Working Group I Contribution to the IPCC Fifth Assessment Report (AR5), Cambridge University Press, Cambridge, United Kingdom and New York, NY, USA, 1535 pp., ISBN 9781107057999, 2013. a
Tegen, I., Harrison, S. P., Kohfeld, K., Prentice, I. C., Coe, M., and Heimann, M.: Impact of vegetation and preferential source areas on global dust aerosol: Results from a model study, J. Geophys. Res.-Atmos., 107, AAC 14-1–AAC 14-27, https://doi.org/10.1029/2001JD000963, 2002. a, b, c, d
Tegen, I., Schepanski, K., and Heinold, B.: Comparing two years of Saharan dust source activation obtained by regional modelling and satellite observations, Atmos. Chem. Phys., 13, 2381–2390, https://doi.org/10.5194/acp-13-2381-2013, 2013. a
Tesche, M., Gross, S., Ansmann, A., Müller, D., Althausen, D., Freudenthaler, V., and Esselborn, M.: Profiling of Saharan dust and biomass-burning smoke with multiwavelength polarization Raman lidar at Cape Verde, Tellus B, 63, 649–676, https://doi.org/10.1111/j.1600-0889.2011.00548.x, 2011. a, b, c
Wolke, R. and Knoth, O.: Implicit–explicit Runge–Kutta methods applied to atmospheric chemistry-transport modelling, Environ. Modell. Softw., 15, 711–719, https://doi.org/10.1016/S1364-8152(00)00034-7, 2000. a
Wolke, R., Schröder, W., Schrödner, R., and Renner, E.: Influence of grid resolution and meteorological forcing on simulated European air quality: A sensitivity study with the modeling system COSMO–MUSCAT, Atmos. Environ., 53, 110–130, https://doi.org/10.1016/j.atmosenv.2012.02.085, 2012. a
Zhang, L., Gong, S., Padro, J., and Barrie, L.: A size-segregated particle dry deposition scheme for an atmospheric aerosol module, Atmos. Environ., 35, 549–560, https://doi.org/10.1016/S1352-2310(00)00326-5, 2001. a
Zhang, X. L., Wu, G. J., Zhang, C. L., Xu, T. L., and Zhou, Q. Q.: What is the real role of iron oxides in the optical properties of dust aerosols?, Atmos. Chem. Phys., 15, 12159–12177, https://doi.org/10.5194/acp-15-12159-2015, 2015. a, b, c
Zhang, Y., Saito, M., Yang, P., Schuster, G., and Trepte, C.: Sensitivities of Spectral Optical Properties of Dust Aerosols to Their Mineralogical and Microphysical Properties, J. Geophys. Res.-Atmos., 129, e2023JD040181, https://doi.org/10.1029/2023JD040181, 2024. a, b, c
- Abstract
- Introduction
- Model description and parametrizations
- Cape Verde measurement campaigns: in-situ aerosol measurements
- Model comparison framework
- Model validation
- Conclusions
- Appendix A: JATAC in-situ aerosol measurements: mineral phase criteria
- Appendix B: COSMO5.05-MUSCAT Haplic Xerosols
- Appendix C: High-resolution imagery of illite-like mineral dust
- Code availability
- Data availability
- Author contributions
- Competing interests
- Disclaimer
- Special issue statement
- Acknowledgements
- Financial support
- Review statement
- References
- Abstract
- Introduction
- Model description and parametrizations
- Cape Verde measurement campaigns: in-situ aerosol measurements
- Model comparison framework
- Model validation
- Conclusions
- Appendix A: JATAC in-situ aerosol measurements: mineral phase criteria
- Appendix B: COSMO5.05-MUSCAT Haplic Xerosols
- Appendix C: High-resolution imagery of illite-like mineral dust
- Code availability
- Data availability
- Author contributions
- Competing interests
- Disclaimer
- Special issue statement
- Acknowledgements
- Financial support
- Review statement
- References