
the Creative Commons Attribution 4.0 License.
the Creative Commons Attribution 4.0 License.
 | 14 Jul 2026
Characteristics of marine aerosols and cloud condensation nuclei measured during the cruise of R/V ISABU in 2024: from the East China Sea to the Indian Ocean
Chanwoo Ahn
Andrew Loh
Najin Kim
Un Hyuk Yim
Joon Geon An
Kyung Hwan Kim
Donghwi Kim
Do-Hyeon Park
Sun Choi
Marine aerosols and cloud condensation nuclei (CCN) exhibit significant spatial variability over the global ocean, but observational constraints remain limited by short-term or regionally confined measurements. This study offers a comprehensive examination of marine aerosols and CCN characteristics across the East China Sea, the South China Sea, the Strait of Malacca, and the Indian Ocean, based on continuous ship measurements during the transit voyage of the R/V ISABU in 2024. By applying a consistent observational and analytical framework, various characteristics were intercompared across different sea areas. Aerosol and CCN number concentrations varied by more than two orders of magnitude, with clear contrasts between continent-adjacent seas and the remote ocean. The Indian Ocean represented a clean marine background characterized by low aerosol number concentrations but high hygroscopicity. In contrast, a distinct volcanic-influence episode over the South China Sea exhibited exceptionally elevated CCN number concentrations. Differences in aerosol size distributions and hygroscopicity resulted in substantial regional variability in CCN activation. Furthermore, cluster analysis demonstrated that marine-origin air masses consistently possessed a higher activation efficiency than continental-origin air masses. These findings emphasize that the complex interactions among aerosol number concentration, size distribution, and hygroscopicity govern marine CCN characteristics, providing essential constraints for refining parameterizations of aerosol–cloud interactions in climate models.
- Article
(7294 KB) - Full-text XML
-
Supplement
(2023 KB) - BibTeX
- EndNote


Atmospheric aerosols play a critical role in cloud formation and evolution by acting as cloud condensation nuclei (CCN), thereby influencing cloud droplet concentration and size, albedo, cloud lifetime, and precipitation efficiency (Twomey, 1974; Albrecht, 1989). Therefore, aerosol–cloud interactions are recognized as one of the largest sources of uncertainty in climate prediction, particularly over marine regions where extensive low-level clouds are highly sensitive to aerosol perturbations (Carslaw et al., 2013; Bellouin et al., 2020; Forster et al., 2021; Chen et al., 2024). Despite their importance, substantial uncertainties remain in understanding how aerosol characteristics control CCN activity and cloud responses across different marine environments. Improving our understanding of the factors governing CCN activation is thus essential for reducing uncertainties in aerosol–cloud interactions.
At a given supersaturation, the ability of aerosols to act as CCN depends on their size, chemical composition, and mixing state (McFiggans et al., 2006). Larger particles are more likely to activate at lower supersaturations due to the smaller curvature effect. Chemical composition modulates aerosol's hygroscopicity (κ), and a higher κ generally corresponds to a lower critical supersaturation required for activation (Petters and Kreidenweis, 2007). Mixing state governs the heterogeneity of activation within an aerosol population (Wang et al., 2010). Together, these aerosol properties determine the activation behavior. For example, sea-salt-dominated environments typically exhibit large particles with high κ, facilitating efficient CCN activation (King et al., 2012; Gaston et al., 2018). Sulfate-rich aerosols, though generally smaller than sea salt, also contribute to CCN due to their high κ (Sanchez et al., 2018; Park et al., 2021). In contrast, increased contributions from organic aerosols can substantially reduce κ and induce large variations in CCN number concentrations (NCCN) depending on their relative abundance (Martin et al., 2011; Coggon et al., 2014). As such, even modest changes in marine aerosol characteristics can significantly alter CCN activity, ultimately modifying the properties of marine low-level clouds like stratocumulus and shallow cumulus clouds (Wood et al., 2015; Fan et al., 2016). Therefore, aerosol–cloud interactions over the ocean remain a key contributor to climate prediction uncertainty, underscoring the need for long-term, spatially extensive observations of aerosols and CCN.
In an effort to better characterize marine aerosols and CCN, ship-based observations have been conducted in various oceanic regions (Table 1). The following are some examples of Northern Hemisphere measurements. Park et al. (2020) reported that NCCN at 0.4 % supersaturation (SS) during a cruise from the Arctic Ocean to the Pacific Ocean were only 35 ± 40 cm−3 in Arctic marine air masses, increased to 71 ± 47 cm−3 in Arctic terrestrial inflow, and reached 204 ± 87 cm−3 in the Pacific Ocean. Gong et al. (2023) reported CN (condensation nuclei, total aerosols) number concentrations (NCN) and NCCN at 0.4 % SS of 5200 ± 3200 cm−3 and 1200 ± 750 cm−3, respectively, from ship measurements across the East China Sea–Yellow Sea–Bohai Sea. The average value of κ was 0.36 ± 0.21, excluding abnormally low κ values (<0.1). Ou et al. (2025) conducted two ship measurements in the South China Sea. In the summer, when the sea was influenced by terrestrial outflow from Luzon and Indochina, Aitken mode particle concentrations, κ, and CCN activation ratios () were elevated. In contrast, during the winter, air masses were dominantly influenced by East Asia and exhibited reduced κ for small particles, resulting in lower ratios. Nair et al. (2020) investigated continental influence over the northern Indian Ocean during winter using ship measurements. Under polluted continental air masses, NCCN at 0.4 %–0.6 % SS frequently exceeded 5000 cm−3, and the ratios were markedly low (∼0.25). Near the equator, however, NCCN were around 1000 cm−3 and ratios were much higher.
Table 1Mean aerosol and CCN number concentrations (NCN and NCCN), critical diameter (DC), and hygroscopicity (κ) across various marine regions in this study and previous studies.
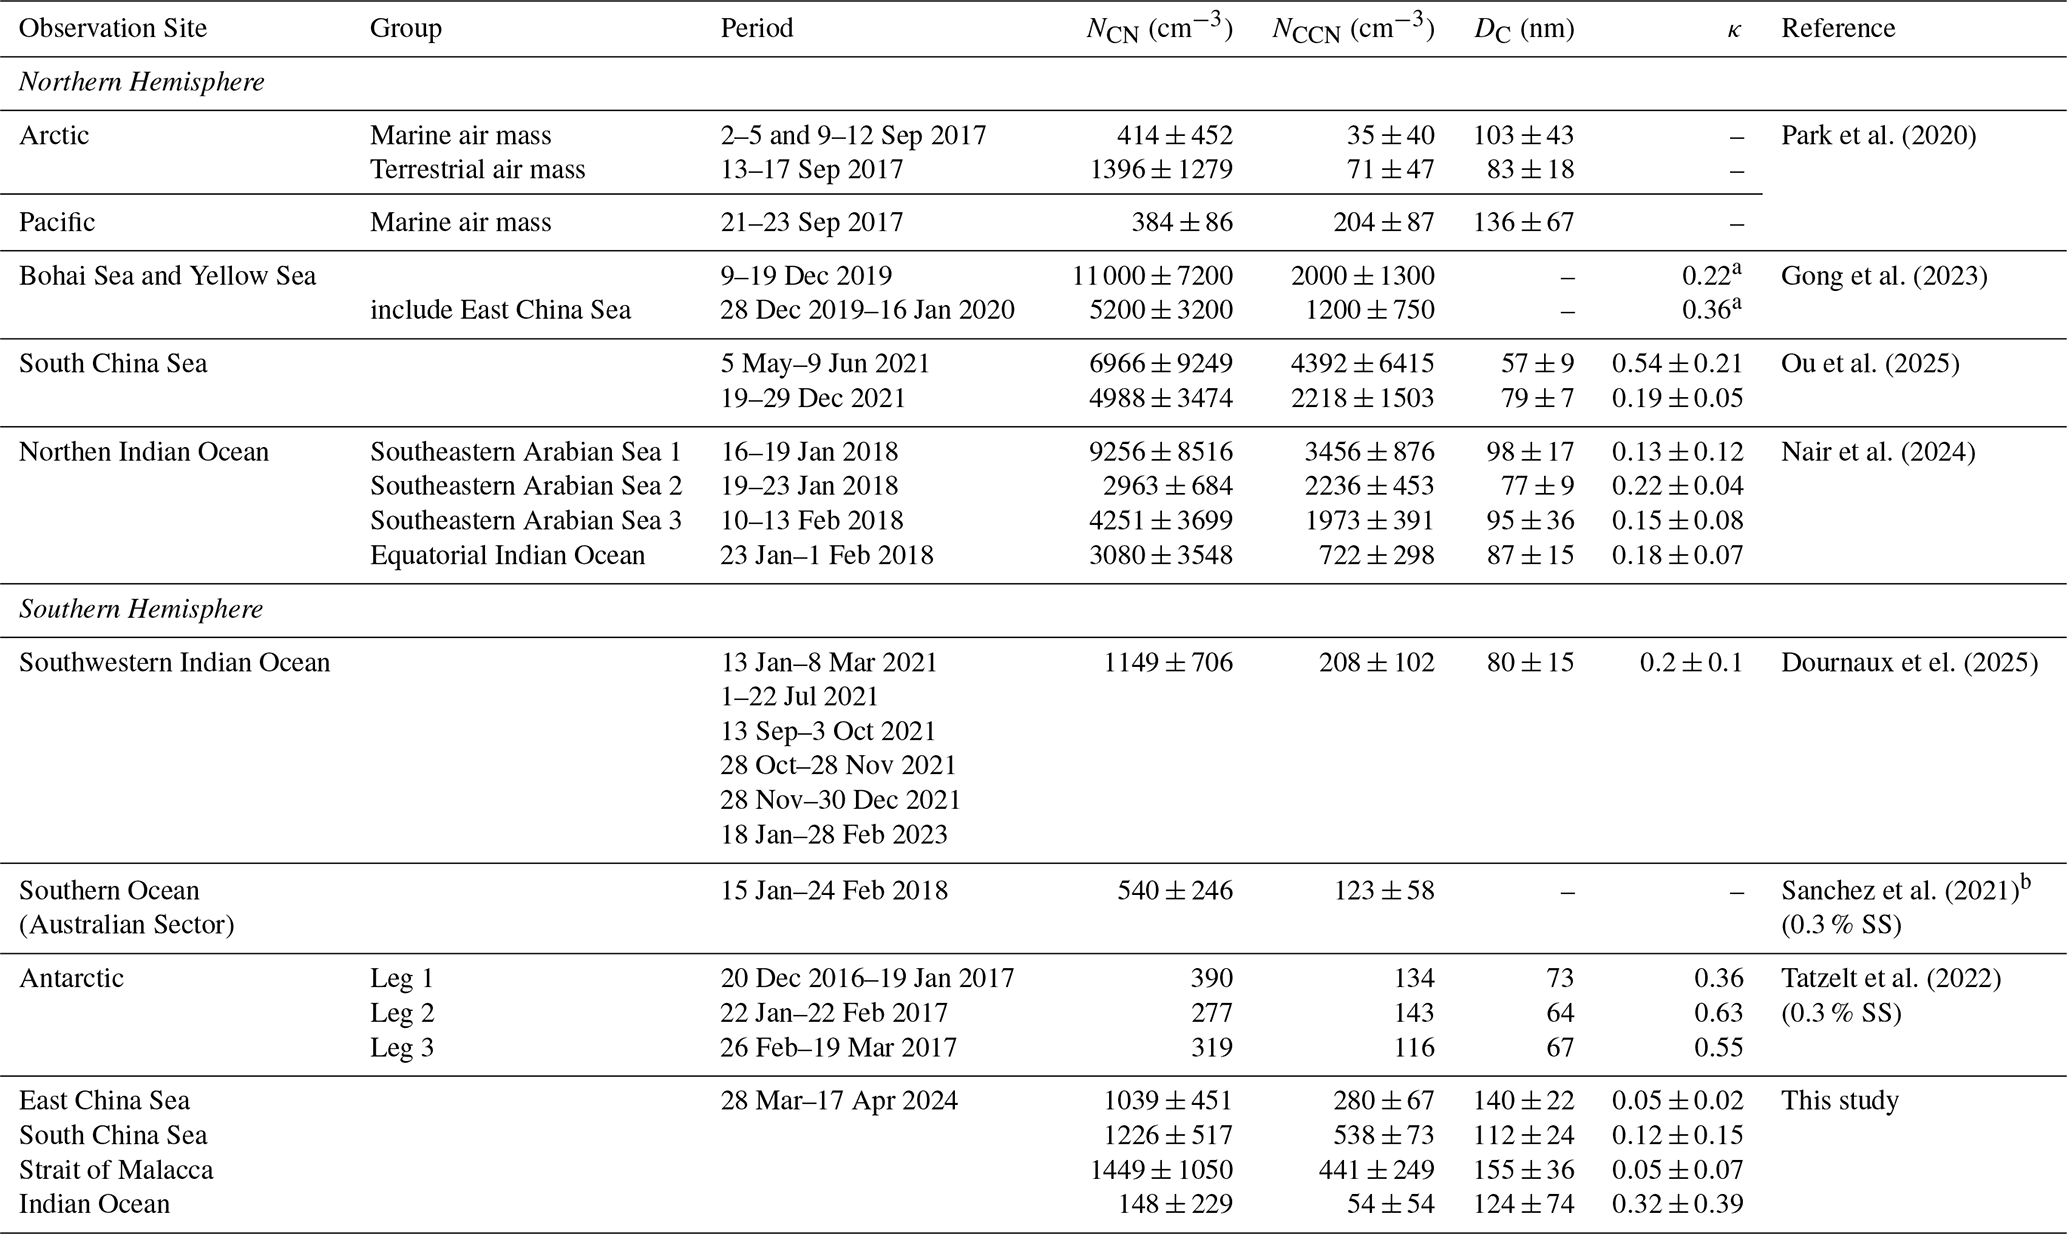
Note: The size ranges for NCN vary across the previous studies. NCCN, DC, and κ values are presented at 0.4 % SS for consistency. If the values at 0.4 % SS were unavailable, values at the closest supersaturation are provided, and the corresponding supersaturation is indicated in the reference column. a Mean values calculated by excluding values below 0.1. b While both ship and aircraft measurements were conducted in this study, only statistical values for the aircraft measurements were provided.
Meanwhile, the following are examples of Southern Hemisphere measurements. Dournaux et al. (2025) reported from recent long-term ship measurements in the southwestern Indian Ocean that submicron NCN ranged widely from ∼100 to over 3000 cm−3. However, NCCN at 0.4 % SS were more constrained, ranging from 60 to 500 cm−3, and κ values varied from 0.05 to 0.7, depending on the origin of the air masses. Sanchez et al. (2021), during a round trip between Tasmania and 62° S, showed that NCCN increased near the coasts of Australia and Antarctica, while the minimum concentration occurred in the midlatitude storm belt due to precipitation scavenging. They observed that κ values were higher at lower latitudes due to a greater proportion of sea salt. In contrast, at higher latitudes, κ values were lower, associated with increased organic aerosol contributions. Tatzelt et al. (2022), using circum-Antarctic ship measurements, reported that NCCN at 0.3 % SS varied from 3 to 590 cm−3. The κ values typically ranged from 0.2 to 0.9, indicating a broad spectrum of aerosol types, from organic-dominated to inorganic-dominated.
As summarized above, ship measurements conducted across the global ocean consistently demonstrate that NCCN in the marine boundary layer typically span roughly two orders of magnitude, from several tens to thousands per cubic centimeter, and that κ values vary significantly depending on the dominant aerosol components. These studies also confirmed that such variability is strongly linked to sea area, season, and the origin of air masses. However, most measurements have been limited to short-term campaigns focused on a specific sea area or a single ocean, and very few studies – such as Flores et al. (2020) – have examined diverse oceanic environments continuously using a single platform. This limitation makes it difficult to assess differences in aerosol and CCN characteristics across various sea areas and to evaluate variability associated with changes in sources from a unified perspective.
To address these gaps, this study presents continuous, simultaneous observations of aerosols and CCN across the East China Sea, the South China Sea, the Strait of Malacca, and the Indian Ocean during long-distance transit voyages of the research vessel ISABU in 2024. We comprehensively compared the characteristics of aerosols and CCN across the four regions, including aerosol size distribution, activation efficiency, κ, and CCN spectra, all derived using a consistent methodology. In addition, by analyzing the origins of air masses and aerosol sources, we systematically interpreted the regional variability in CCN characteristics. Finally, we discuss the similarities and differences between the characteristics observed in this study and those reported in previous research.
2.1 Overview of the campaign and measurement
2.1.1 Campaign information
In 2024, the Korea Institute of Ocean Science and Technology (KIOST) and the Korea Institute of Science and Technology (KIST) conducted joint comprehensive marine atmospheric observations onboard the R/V ISABU with a gross tonnage of 5894 tons, a length of 99.8 m, and a width of 18.0 m (Fig. S1 in the Supplement). The primary objective of this campaign was to jointly investigate interactions among marine biology, marine atmosphere, cloud formation, and climate change. This was achieved through simultaneous measurements of marine aerosols, CCN, ice-nucleating particles (INP), and gaseous species, as well as in situ observations of atmospheric photochemical processes.
The transit voyage departed from Jangmok Port (34.993° N, 128.676° E) in Geoje, Republic of Korea, on 28 March and arrived in Port Louis (20.152° S, 57.494° E), Mauritius, on 17 April, passing through the East China Sea, the South China Sea, the Strait of Malacca, and the Indian Ocean. The detailed cruise route and schedule are presented in Fig. 1 and Table S1 in the Supplement. The fact that measurements were conducted across diverse sea areas demonstrates the strength of this campaign, enabling consistent comparisons of regional characteristics.
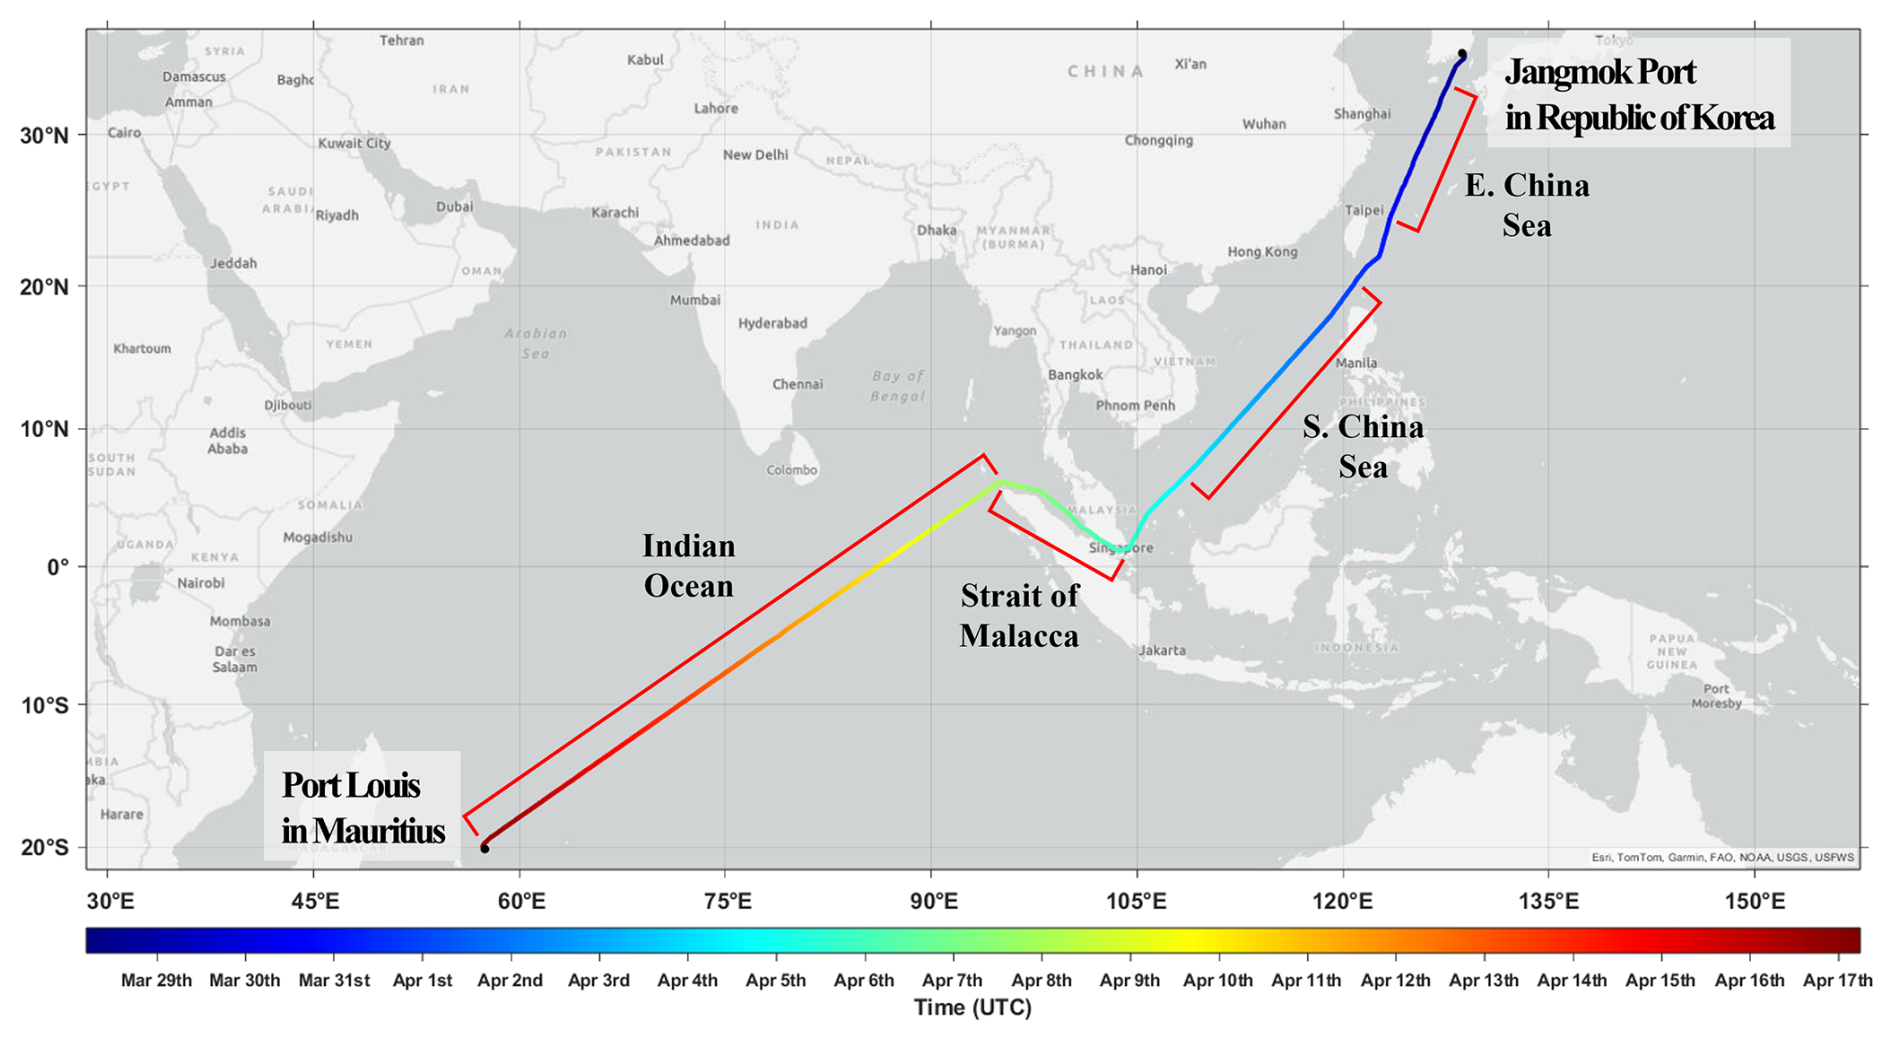
Figure 1Cruise route of the R/V ISABU in 2024, including regional classification (Source: Esri, TomTom, Garmin, FAO, NOAA, USGS, USFWS | Powered by Esri).
2.1.2 Measurement instruments
During the transit voyage of the R/V ISABU, various instruments were installed to measure both particulate and gaseous components in the atmosphere, as shown in Fig. S1. The observation room was located on the uppermost F-deck (approximately 20 m above sea level) to minimize the influences of sea-salt particles and ammonia emitted by the vessel. All aerosol observation instruments were connected via a conductive tube to reduce losses. To limit the effects of high ambient humidity, a diffusion dryer was installed upstream of each instrument inlet. Nevertheless, due to the substantial temperature difference between the room and the outside, condensation occasionally occurred inside the tube, requiring periodic checks and the removal of water.
Among the various instruments, a scanning mobility particle sizer (SMPS; model 3938L50, TSI Inc., USA) and a cloud condensation nuclei counter (CCNC; model CCN-200, Droplet Measurement Technologies, USA) were used in this study. SMPS, which consists of an electrostatic classifier (Model 3082, TSI Inc., USA) and a condensation particle counter (CPC; model 3750, TSI Inc., USA), measured the aerosol size distribution every 3 min. The measured aerosol size range was 10.6–478.3 nm, divided into 107 bins. However, occasional voltage instabilities occurred at the smallest size bins, so the 10.6–14.6 nm range was excluded when calculating NCN. Accordingly, NCN in this study refers to the total number concentration of aerosols larger than 15 nm. In addition, to investigate the size-resolved variations of aerosols, we categorized the SMPS size range into three modes: nucleation mode (15–25 nm), Aitken mode (25–100 nm), and accumulation mode (100–478.3 nm).
CCNC measured NCCN at a given supersaturation every second. Although the CCNC model used in this study consisted of two columns, only one was operated during the campaign due to a flow issue caused by a Nafion tube in the other. CCNC was set to run at supersaturations ranging from 0.2 % to 1.0 %, with increments of 0.2 %. The measurement durations were 12 min for 0.2 % SS and 5 min for the 0.4 %–1.0 % SS. Thus, the nominal total measurement cycle of CCNC was 32 min. However, the instrument software did not initiate measurements at the next supersaturation immediately after completing the previous one. That is, the measurement timer began only after the temperature gradient between the top and bottom of the column reached the set value for the next supersaturation. As a result, the actual total measurement cycle during the cruise was approximately 50 min.
Furthermore, the time required for temperature stabilization varied even at the same supersaturation. Therefore, for efficient data processing, we uniformly excluded the first 15 min of data at 0.2 % SS and the first 3 min of data at the other supersaturations, regardless of the actual measurement start time. The relatively longer exclusion period for 0.2 % SS was due to the substantial change in supersaturation from 1.0 % to 0.2 %. Unlike other changes, which took about 90 s to stabilize the temperature, this specific change required about 10 min. To ensure accurate measurements, we performed CCNC flow calibration and supersaturation calibration using (NH4)2SO4 before and after the campaign.
2.2 Data processing
2.2.1 Quality control
To ensure reliable measurement data and enable consistent comparisons across different sea areas, we conducted data quality control following the procedure described below.
First, since the ship plume stack was located behind the observation room, measurements might be contaminated by the vessel's exhaust when the wind blew rapidly from the stern (Fig. 2a). Therefore, data were excluded when the relative wind direction was between 150 and 270°, considering the relative positions of the inlet and plume stack. Fortunately, the wind blew from the bow during most of the cruise (Fig. 2b), and contamination by exhaust was minimal at 2.8 %.

Figure 2(a) Schematic diagram of the observation room and plume stack, and (b) relative wind rose plot during the transit voyage of the R/V ISABU. The red circle, blue square, and green arrow represent the plume stack, observation room, and the direction of inlets, respectively. The magenta circular sector indicates a range from 150 to 270°.
Second, temporary contamination could also occur due to ship maintenance activities such as painting and cleaning, cooking on board, or exhaust plumes from nearby ships (particularly in the Strait of Malacca). Such contamination was removed through a spike check. Using a 24 h moving window, any data point that deviated from the median by more than 3 times the scaled Median Absolute Deviation (MAD) was considered an outlier and excluded from the dataset.
Lastly, we corrected the SMPS data. Due to an unidentified issue, likely related to relative humidity, NCN occasionally exhibited a nearly order-of-magnitude change while maintaining a consistent size distribution (Fig. S2 in the Supplement). If these variations reflected real atmospheric changes, they should be clearly evident in the non-refractory PM1 data measured by the Aerosol Mass Spectrometer. However, since no such signal was observed (Fig. S3 in the Supplement), the SMPS data are presumed to be anomalous. Consequently, anomalous SMPS data were identified and corrected through comparison with the aerosol size distribution measured by the Aerodynamic Particle Sizer (APS). The corrected data were then validated against PM2.5 data obtained by the beta attenuation method before being used for this study (Fig. S4 in the Supplement). Details of the correction procedure are provided in the Supplement (Sect. S1).
After applying these three procedures (including the exclusion mentioned in Sect. 2.1.2 for the CCNC), 86.8 % of the SMPS data and 36.6 % of the CCNC data were used for analysis, which correspond to approximately 17.4 and 7.33 d of data, respectively.
2.2.2 Fitting of multiple lognormal modes
Merged SMPS–APS size distributions (15–3000 nm) were fitted with multiple lognormal modes to characterize the aerosol modal structure, where each mode was expressed as follows:
where Dp denotes the aerosol diameter. Nt,i, Dg,i, and σg,i are the total number concentrations, the geometric mean diameter, and the geometric standard deviation of mode i, respectively.
To better reproduce the broad large-particle shoulder, following the concept of Modini et al. (2015), the coarse mode was first fitted to the upper part of the size distribution (1000–2500 nm) using a constrained single lognormal mode, with bounds of Nt=0–20 cm−3, Dpg=500–1800 nm, and σg=1.5–3.0. These bounds were selected to allow a single broad mode to represent the observed coarse mode shoulder while minimizing interference from the dominant submicron modes. In addition, while the upper limit of the merged size distribution is 3000 nm, the coarse mode fitting was only performed up to 2500 nm to avoid overfitting in the 2500–3000 nm range, where number concentrations were negligible.
The fitted coarse mode was then subtracted, and the residual submicron distribution (15–1000 nm) was fitted with multiple lognormal modes. The maximum number of submicron modes was limited to three to preserve physically interpretable mode structures. The optimal number of modes was determined sequentially: when the addition of one extra mode decreased the RMSE by less than 10 %, the previous number of modes was selected as optimal. The parameter bounds for the submicron modes were basically Dpg=15–25 nm and σg=1.0–1.5 for the nucleation mode, Dpg=25–100 nm and σg=1.0–2.0 for the Aitken mode, and Dpg=100–500 nm and σg=1.0–2.0 for accumulation mode, with Nt=0–10 000 cm−3 for all three.
2.2.3 Critical diameter and hygroscopic parameter
To calculate the critical diameter (DC) at each supersaturation, we assumed that the aerosols were internally mixed and that larger aerosols would be preferentially activated due to smaller curvature effects. First, NCCN, originally recorded at 1 s intervals, were averaged to match the 3 min sampling interval of the SMPS. Then, NCN from the largest to the smallest diameter bins of the observed size distribution were cumulatively summed. As explained in Eq. (2), the diameter of the bin where the cumulative NCN first exceeded the NCCN was taken as DC.
The hygroscopicity parameter (κ) represents the relationship between dry diameter and CCN activity and was calculated according to Petters and Kreidenweis (2007):
where σs/a is the surface tension of the solution/air interface, and in this study, it was assumed to be 0.072 J m−2, corresponding to the surface tension of pure water. Mw=0.018 kg mol−1 and ρw=997 kg m−3 (at 273.15 K) are the molar mass and density of water, respectively. R=8.3145 is the universal gas constant. T is the temperature; in this study, the measured temperature was used. Sc refers to the supersaturation used in the calculation of the corresponding Dc.
2.2.4 Back-trajectories and clustering analysis
To identify the origin and transport pathway of air masses during the cruise, back trajectories at 100 m altitude were calculated using the Hybrid Single-Particle Lagrangian Integrated Trajectory (HYSPLIT) model (Stein et al., 2015). For these calculations, the coordinates of the research vessel at each hour were used as the starting location. The total run time was set to 72 h by default, but was extended to 120 h when additional analysis was required. The meteorological input for HYSPLIT was sourced from the Global Data Assimilation System (GDAS) model with a 1°×1° horizontal resolution.
To classify the origins of air masses over each sea area, k-means clustering analysis was conducted using the collected back-trajectory dataset. Fundamentally, clustering analysis requires all trajectories to share an identical starting location. However, because the starting locations of the acquired trajectories differed, the three-step preprocessing procedure (translation, vectorization, and standardization) was applied, as explained in detail in the Supplement (Sect. S2). The k-means clustering performed after this preprocessing had a limitation that it did not fully retain the actual geographic information of the trajectories. Therefore, while the k-means clustering results served as the primary basis, the geographic information of the original trajectories was additionally taken into account to finalize the classification.
3.1 Variations of aerosols and CCN
3.1.1 Spatiotemporal variability
Figure 3 presents the time series of aerosol size distribution (Fig. 3a), NCN and NCCN (Fig. 3b), temperature and relative humidity (RH) (Fig. 3c), true wind speed and direction (Fig. 3d), and precipitation and pressure (Fig. 3e) during the transit voyage of the R/V ISABU. Since the local time zone was adjusted five times in total (from UTC+9 to UTC+4), the Coordinated Universal Time (UTC) is shown in black along the bottom x axis, and the Local Time (LT) is shown in gray along the top x axis. The defined areas for each sea region are presented in Fig. 1.
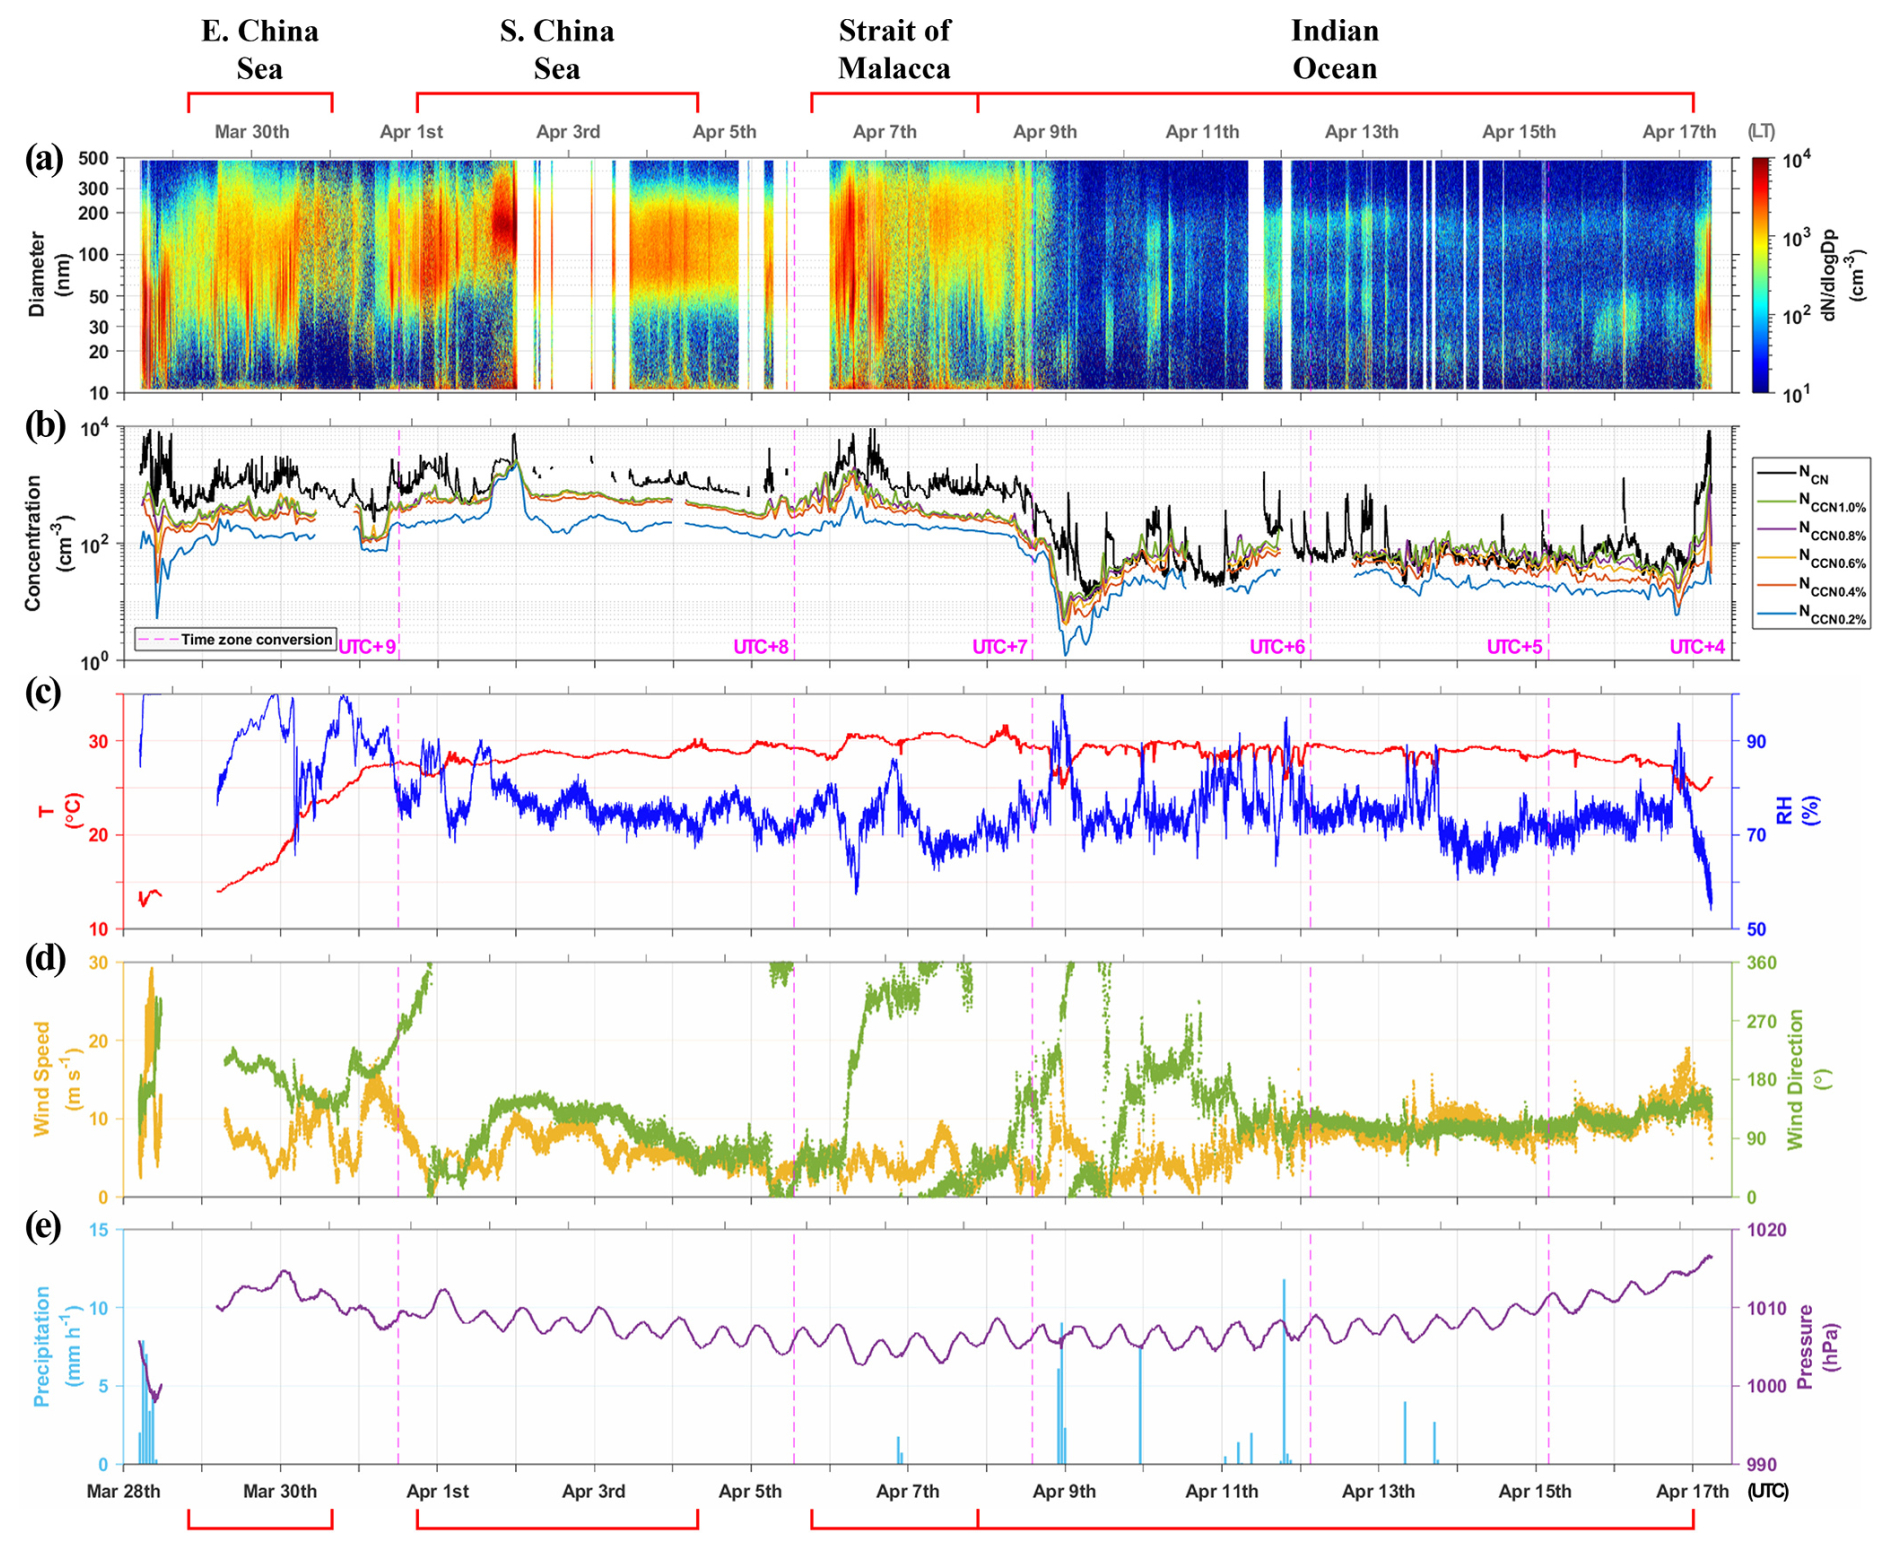
Figure 3Time series of (a) aerosol size distribution, (b) total aerosol and CCN number concentrations, (c) temperature and relative humidity (RH), (d) true wind speed and direction, and (e) precipitation and pressure during the transit voyage of the R/V ISABU. The top and bottom x axes are Local Time (LT) and Coordinated Universal Time (UTC), respectively, and the x axis tick marks indicate the midnight of each day. In (a) and (b), aerosol data gaps imply that there are anomalous observation data excluded from this study, as they did not satisfy the correction criteria. The vertical magenta dashed lines indicate the changes in the local time zone, with the applied time zone for each segment presented in (b).
NCN ranged from 11 to 9171 cm−3, with an average of 695 ± 889 cm−3, and exhibited a distinct contrast between the three seas–the East China Sea, the South China Sea, and the Strait of Malacca–and the Indian Ocean, with longitude 90° E serving as a dividing boundary (Fig. 4a). In terms of aerosol size, the particle size range was 50–300 nm until 9 April (i.e., at 90° E), excluding the first day of the cruise (28 March, LT), and thereafter it showed a slightly smaller range of 20–200 nm. The Aitken and accumulation modes also showed apparent differences across 90° E (Fig. 4d and e), indicating that the Indian Ocean is characterized by conditions close to those of a background atmosphere.
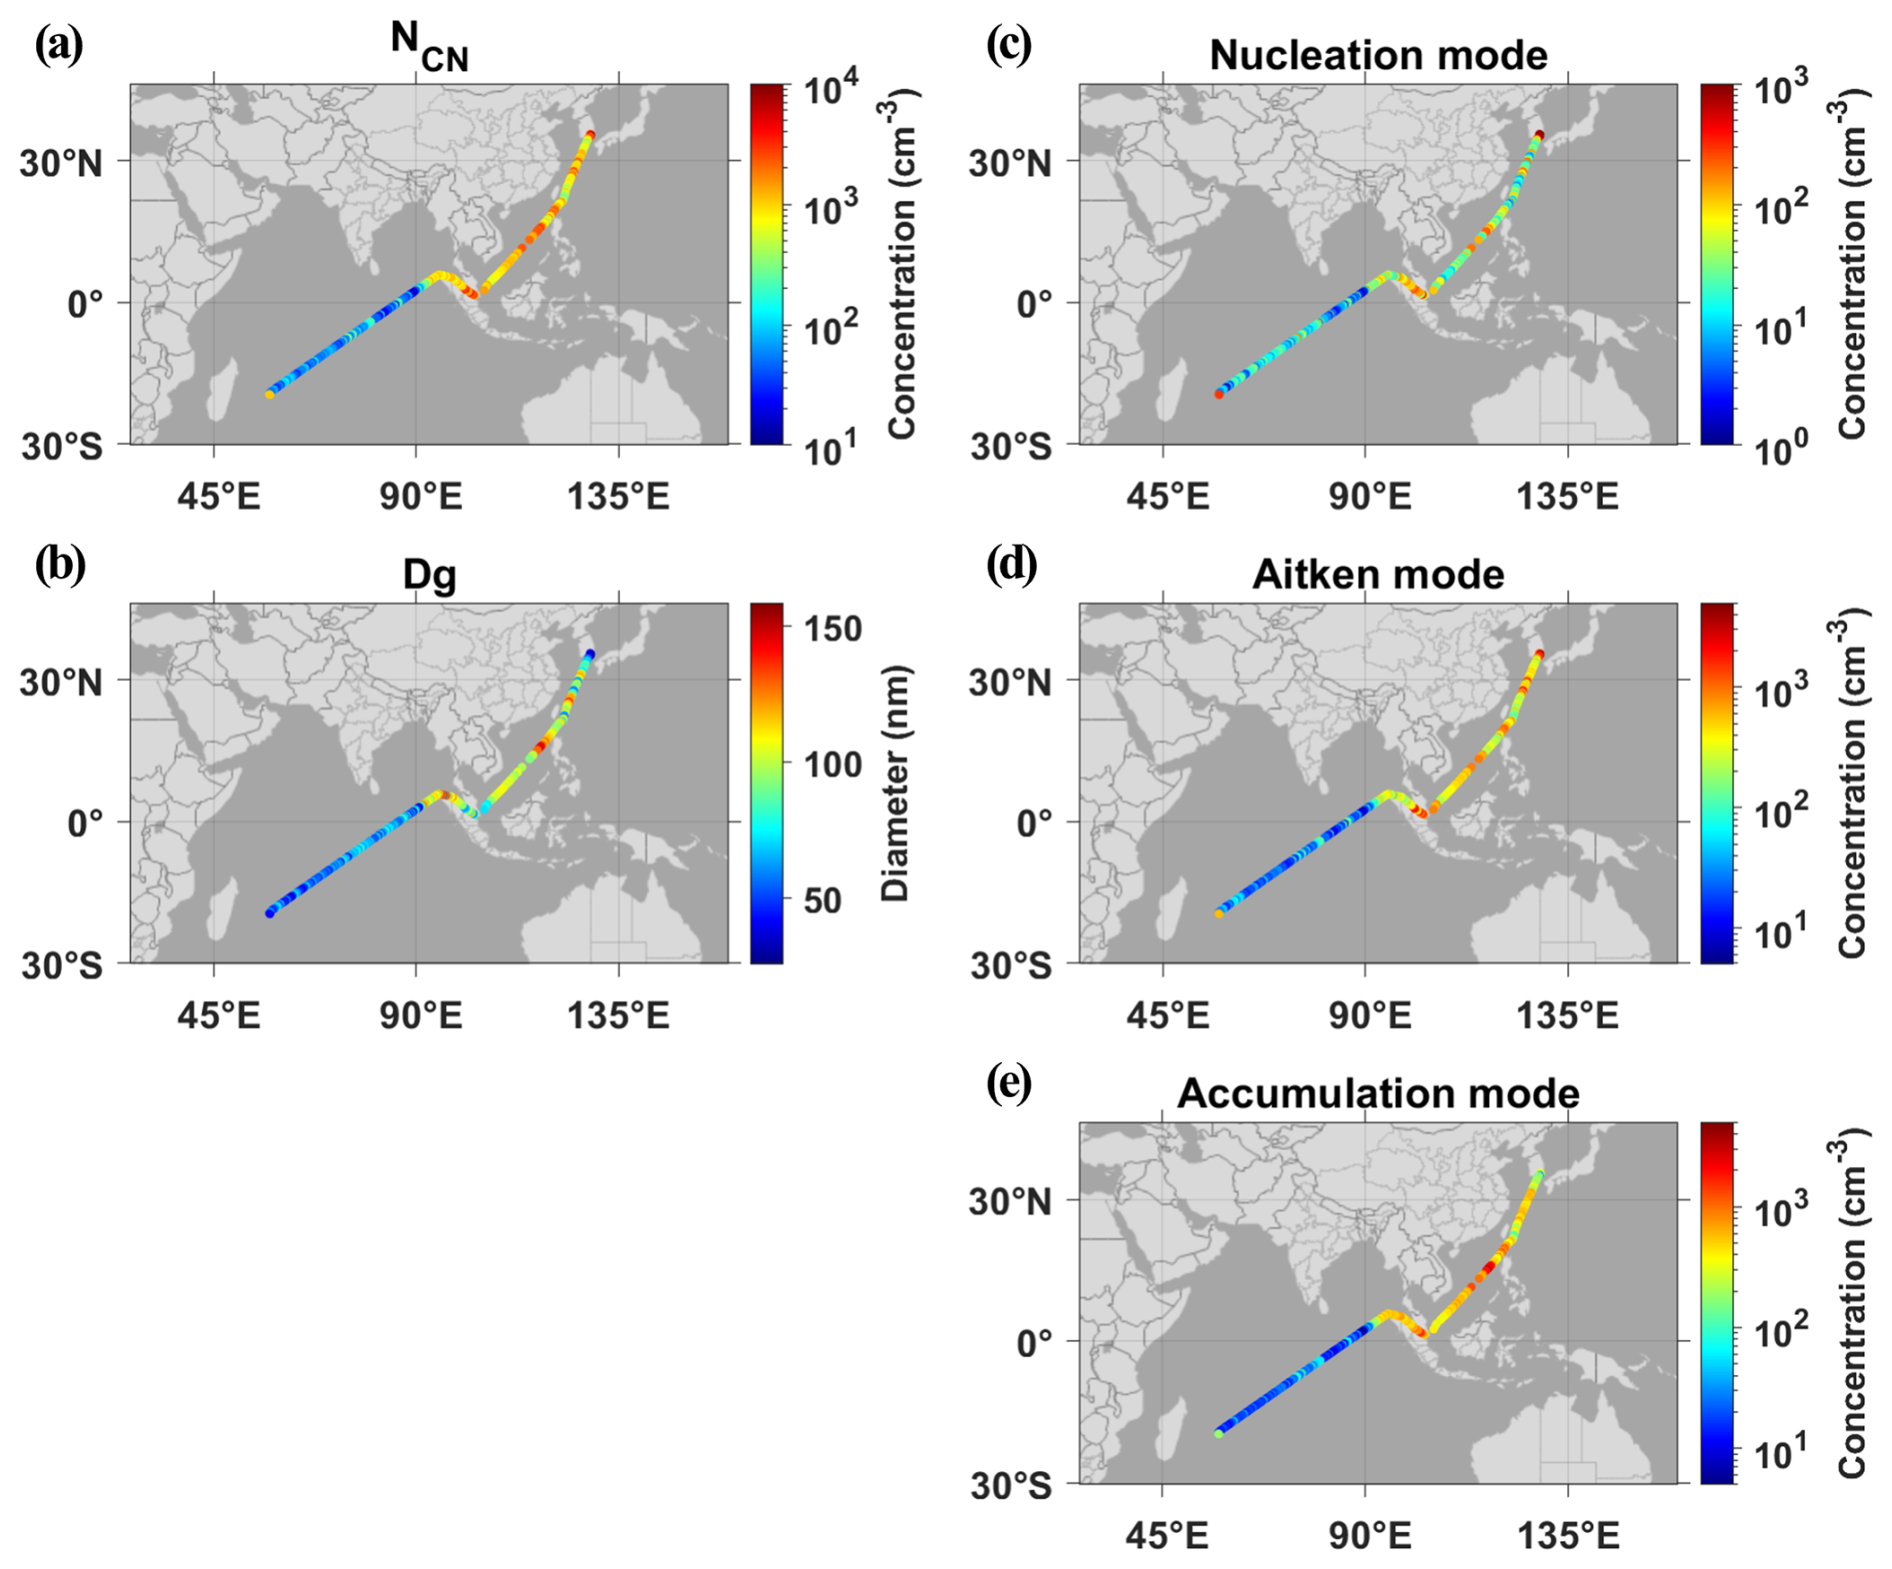
Figure 4Spatial distributions of (a) total aerosol number concentrations, (b) geometric mean diameter, and number concentrations of (c) nucleation mode (15–25 nm), (d) Aitken mode (25–100 nm), and (e) accumulation mode (100–500 nm) during the transit voyage of the R/V ISABU (from Natural Earth).
Meanwhile, NCCN ranged from 1 to 2407 cm−3 at 0.2 % SS and from 4 to 2670 cm−3 at 0.6 % SS, with averages of 146 ± 232 cm−3 and 323 ± 348 cm−3, respectively, and showed a clear contrast across 90° E (Figs. 5a, b and S5a in the Supplement). Although CCN covered a somewhat narrower concentration range than the total aerosols, the two concentrations exhibited remarkably similar spatiotemporal variability throughout the entire period. However, the ratios displayed the opposite trend, with notably higher ratios in the Indian Ocean than in other regions, particularly at higher supersaturation (Figs. 5c, d and S5b).
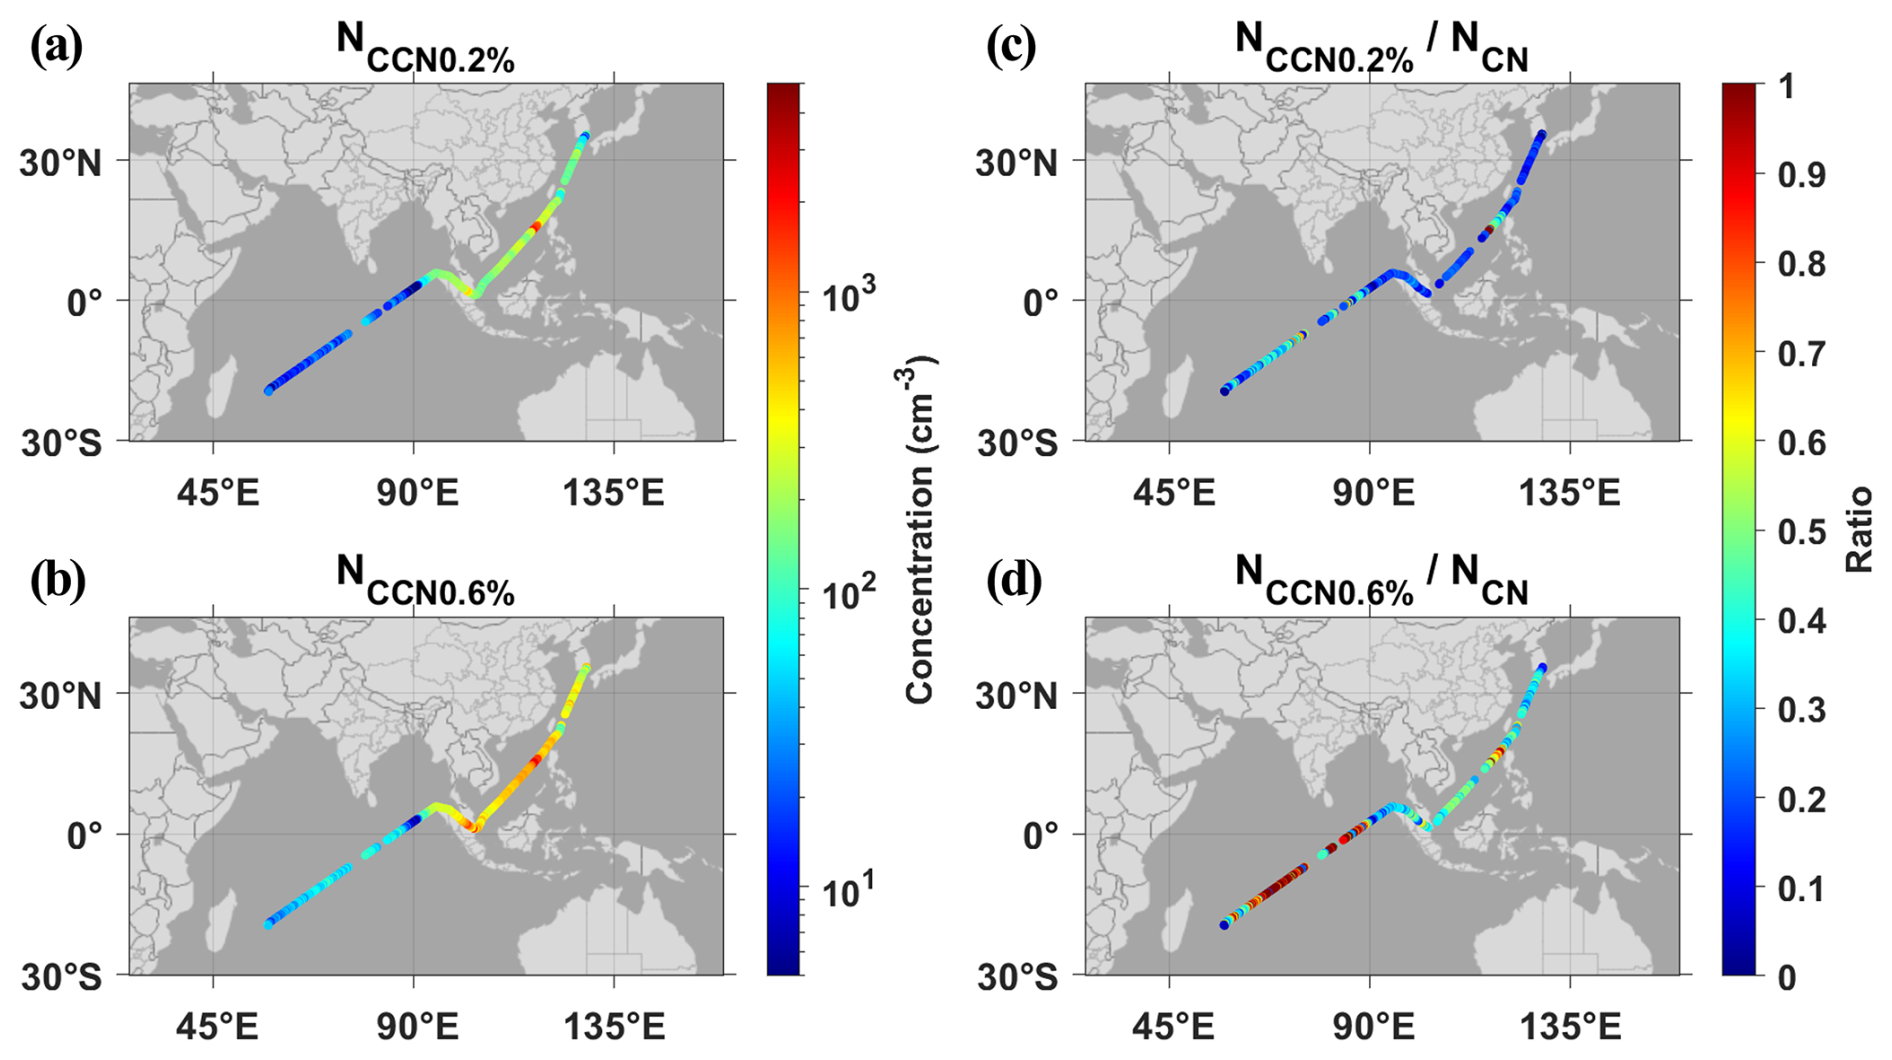
Figure 5Spatial distributions of (a, b) CCN number concentrations at 0.2 % and 0.6 % supersaturation and (c, d) their ratios to total aerosol number concentrations during the transit voyage of the R/V ISABU (from Natural Earth).
In the South China Sea, between 16:30 on 1 April and 02:30 on 2 April (UTC), a noticeable increase in both NCN and NCCN of nearly an order of magnitude was observed in the western part of Luzon Island, Philippines (near 15.5° N, 116.8° E), accompanied by high ratios. Notably, NCCN during this period reached its maximum value for the entire cruise. A crucial point is that this period was the only instance in which the NCCN at 0.2 % SS, where only relatively large aerosols can activate, were similar to NCCN at the other supersaturations (Fig. 3b). In fact, this enhancement was primarily driven by the accumulation mode (Fig. 4e), particularly by particles around 200 nm in diameter, consistent with the distribution of geometric mean diameter (Dg) presented in Fig. 4b. A detailed analysis of this phenomenon will be provided in Sect. 3.1.2.
Localized variation was observed within the Strait of Malacca. NCN were higher upon entering the strait from the South China Sea than upon exiting into the Indian Ocean (2153 ± 1257 cm−3 when entering vs. 901 ± 212 cm−3 when exiting). This pattern was also evident in the spatial distributions of the three aerosol modes. When combined with the aerosol size distribution, the contrast was particularly pronounced in the Aitken mode, suggesting influence from the ship exhaust. However, the distribution of the geometric mean diameter was larger when exiting the strait (85.6 ± 17.2 nm when entering vs. 113.5 ± 17.7 nm when exiting). This is because the ratio of Aitken mode to accumulation mode was lower upon exiting the strait (1.32 ± 0.80 when entering vs. 0.49 ± 0.20 when exiting). NCCN at 0.2 % SS exhibited a relatively uniform concentration within the strait, whereas NCCN at the other supersaturations were higher upon entering the strait (at 0.6 % SS, 753 ± 404 cm−3 when entering vs. 332 ± 57 cm−3 when exiting), consistent with the pattern of NCN. As a result, the ratios did not show substantial variations within the strait.
Over the Indian Ocean, on 9 April (UTC), NCN and NCCN decreased sharply, reaching their minimum values (NCN: 11 cm−3; NCCN at 0.2 % and 0.6 % SS: 1 and 3 cm−3, respectively) during the cruise. One contributing factor to this decrease was the wet deposition associated with intense precipitation. Beginning around 22:00 on 8 April (UTC), heavy rainfall occurred for about 2 h, with a peak precipitation rate of 60 mm h−1, likely scavenging a substantial fraction of atmospheric particles. Meanwhile, in the Indian Ocean, NCN and NCCN (at 0.2 % and 0.6 % SS) during non-precipitating periods were 150 ± 230, 30 ± 34, and 67 ± 60 cm−3, respectively, which were higher than the average values during the precipitating periods (130 ± 209, 11 ± 12, and 37 ± 36 cm−3). However, the difference between NCN and NCCN was similar across both periods. Separately, a reduction in number concentrations due to intense precipitation was also observed on the first day of the cruise over the Southern Sea area of Korea.
3.1.2 Special episode: Effect of Taal Volcano
During the period from 16:30 on 1 April to 02:30 on 2 April (UTC), high NCN and NCCN were observed as the R/V ISABU passed west of Luzon Island, Philippines. Compared with the periods before and after this event, NCN increased by approximately 1844 cm−3 (186 %), and NCCN at 0.2 % and 0.6 % SS increased by about 1167 cm−3 (398 %) and 1037 cm−3 (151 %), respectively.
The source of this high concentration was apparently the Taal volcano, located in the southern part of Luzon (14.010° N, 120.998° E). According to the Volcano Bulletins provided by the Philippine Institute of Volcanology and Seismology (PHIVOLCS), this active volcano exhibited intermittent eruptive activity throughout 2024. Notably, the highest SO2 flux of 18 639 tons in 2024 was observed on 28 March, just before the high-concentration period (Fig. S6 in the Supplement). Another substantial flux of over 10 000 tons was recorded two days later, on 30 March. To assess whether emissions from the Taal volcano could have influenced the South China Sea, a back trajectory analysis was conducted. The starting altitudes for the trajectories were set to 500, 750, and 1000 m, accounting for the volcano's elevation (311 m) and the reported plume heights (900–1200 m).
Figure 6a shows the air mass back trajectories originating from three starting heights above the Taal volcano. In all cases, the trajectories passed through the region where high NCCN at 0.2 % SS were observed. However, if an air mass passes over a specific region above the boundary layer (BL), it may not influence the surface. Therefore, ERA5 reanalysis data were used to compare the BL height at the location of the R/V ISABU with the heights of the trajectories (Fig. 6b). The red dots indicate the times and heights at which each trajectory was closest to the cruise route. Many of these points lie below the BL height (indicated by the blue line) during the high-concentration period (shaded in green). This confirms that the conditions were conducive to volcanic influence reaching the near-surface marine boundary layer.
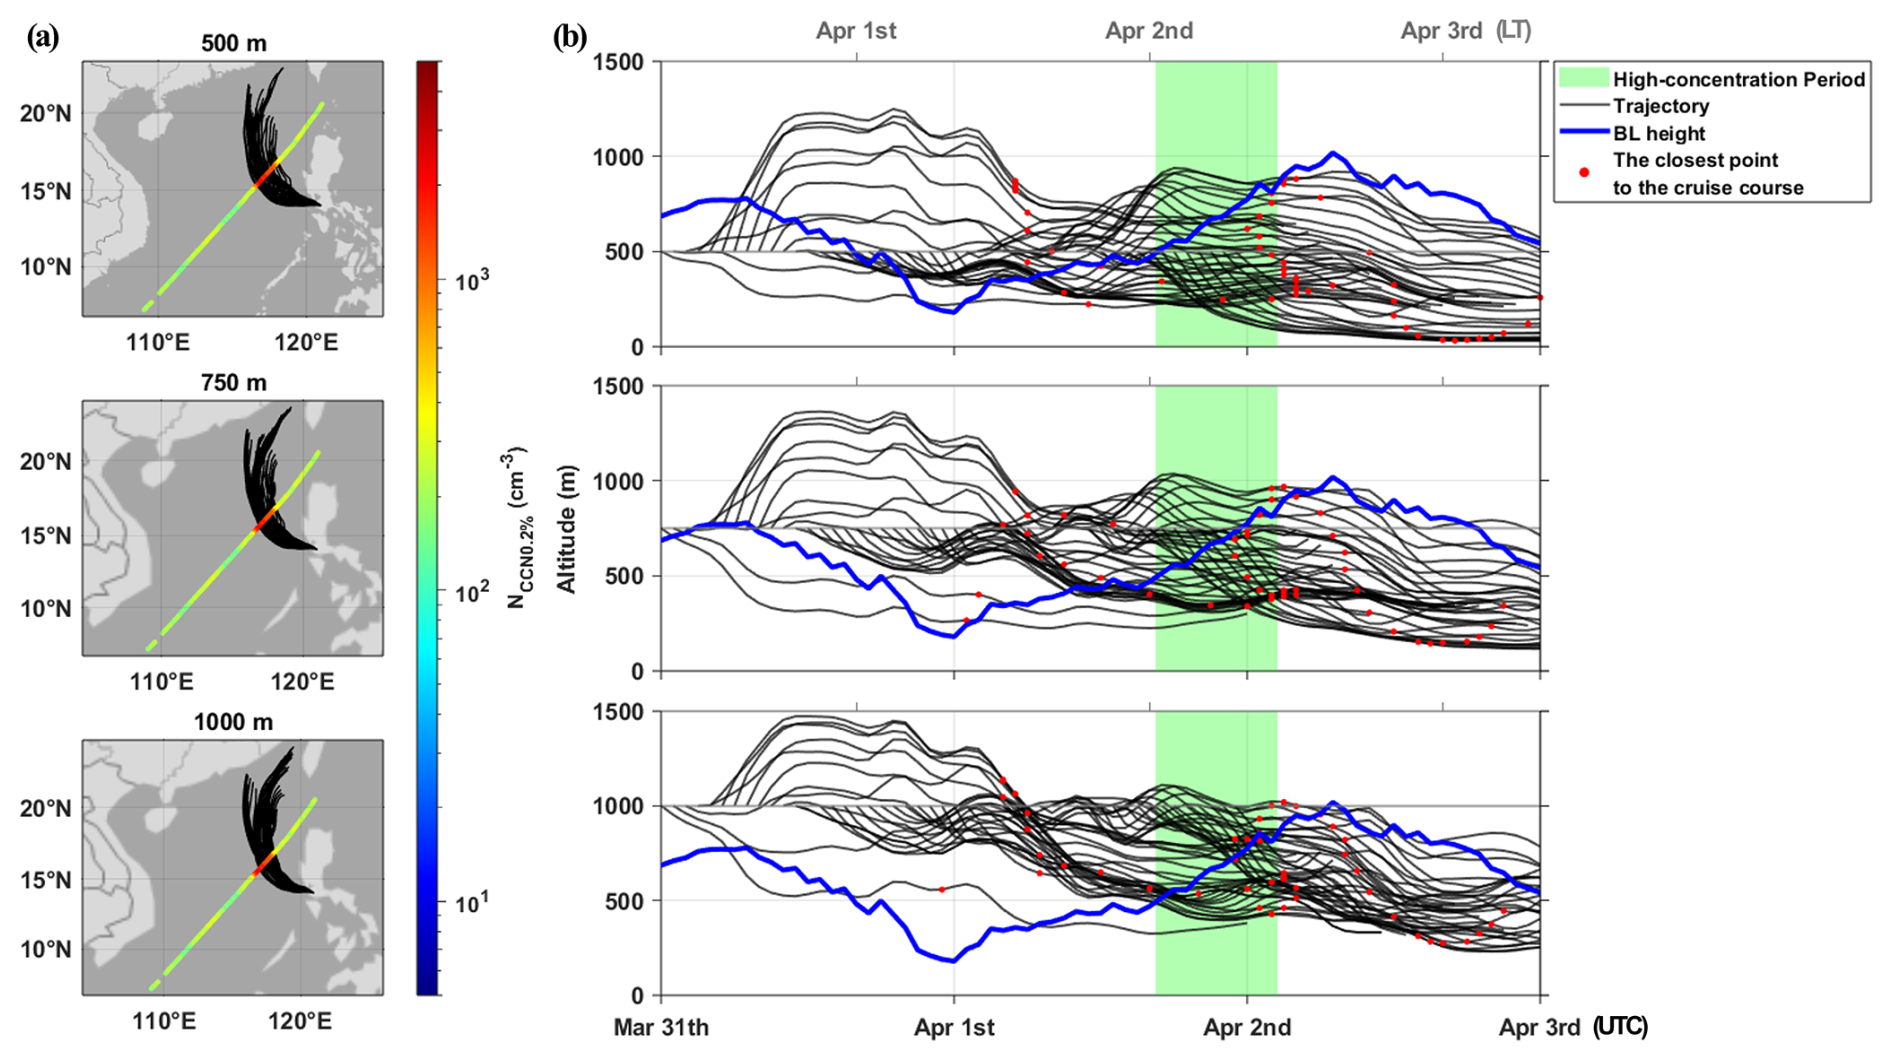
Figure 6(a) A total of 48 trajectories originating at 500, 750, and 1000 m above the Taal volcano at every hour from 00:00 on 31 March to 23:00 on 1 April (UTC). The color scale represents CCN number concentrations at 0.2 % supersaturation. Map data from Natural Earth. (b) Altitudes of trajectories and boundary layer height at the location of the R/V ISABU. The green shading indicates the volcanic-influence period from 16:30 on 1 April to 02:30 on 2 April (UTC). The red dots denote the times at which each trajectory was closest to the cruise route.
SO2 measured by the Air Quality Monitoring System (AQMS; Thermo Fisher Scientific Inc., USA) installed on the R/V ISABU also showed significantly elevated concentrations in the western part of Luzon (Fig. S7 in the Supplement), providing strong evidence that the Taal volcano was the source responsible for the high NCN and NCCN. Importantly, given that the observed geometric mean diameter was 141.2 ± 7.7 nm, the enhancement is unlikely to be due to primary volcanic particles such as volcanic ash, which typically have sizes of several micrometers. Instead, it was attributed to secondary aerosols formed and grown through photochemical reactions of the large amounts of SO2 emitted from the volcano (Boulon et al., 2011; Twigg et al., 2016).
3.2 Comparison of different sea areas
In the preceding section on spatiotemporal variations, we briefly examined the differences among the sea areas. However, because NCN and NCCN varied substantially across regions, we computed sea-area-specific statistics to enable quantitative comparisons of the various parameters. The period influenced by the Taal volcano was separated from the South China Sea area and treated as a distinct area. Additionally, to ensure a consistent comparison, periods affected by precipitation – accounting for 1.44 % of the period classified into specific marine regions (0.05 % in the Strait of Malacca and 1.39 % in the Indian Ocean) – were excluded from the analysis.
3.2.1 CN and CCN number concentrations
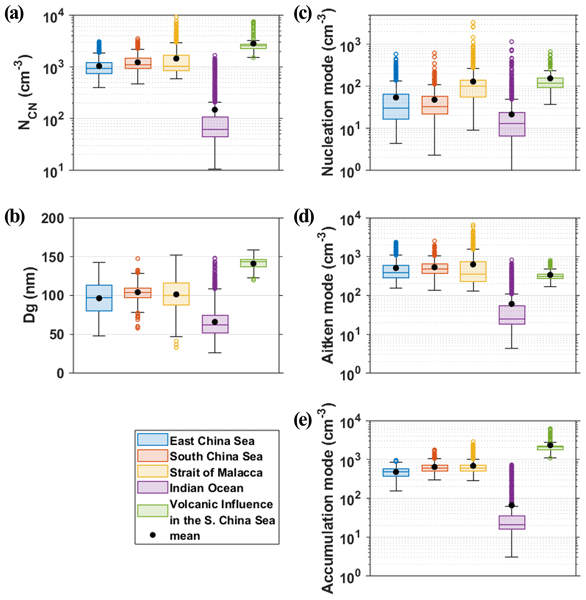
Figure 7a shows that NCN were markedly low in the Indian Ocean (148 ± 229 cm−3) and increased slightly in the order of the East China Sea, the South China Sea, and the Strait of Malacca. The volcanic-influence period exhibited the highest concentration of 2834 ± 1330 cm−3. The geometric mean diameter showed a pattern similar to that of NCN (Fig. 7b): it was the smallest in the Indian Ocean (65.9 ± 19.9 nm) and the largest during the volcanic-influence period (141.2 ± 7.7 nm). In the Indian Ocean, all three modes exhibited the lowest number concentrations among all sea areas. During the volcanic-influence period, the Aitken mode had the second-lowest number concentration (339 ± 124 cm−3, higher only than the Indian Ocean), whereas the accumulation mode showed an exceptionally high concentration (2339 ± 1127 cm−3). Given that approximately 80 % of the total aerosols were composed of accumulation mode particles, this finding is consistent with the geometric mean diameter results.
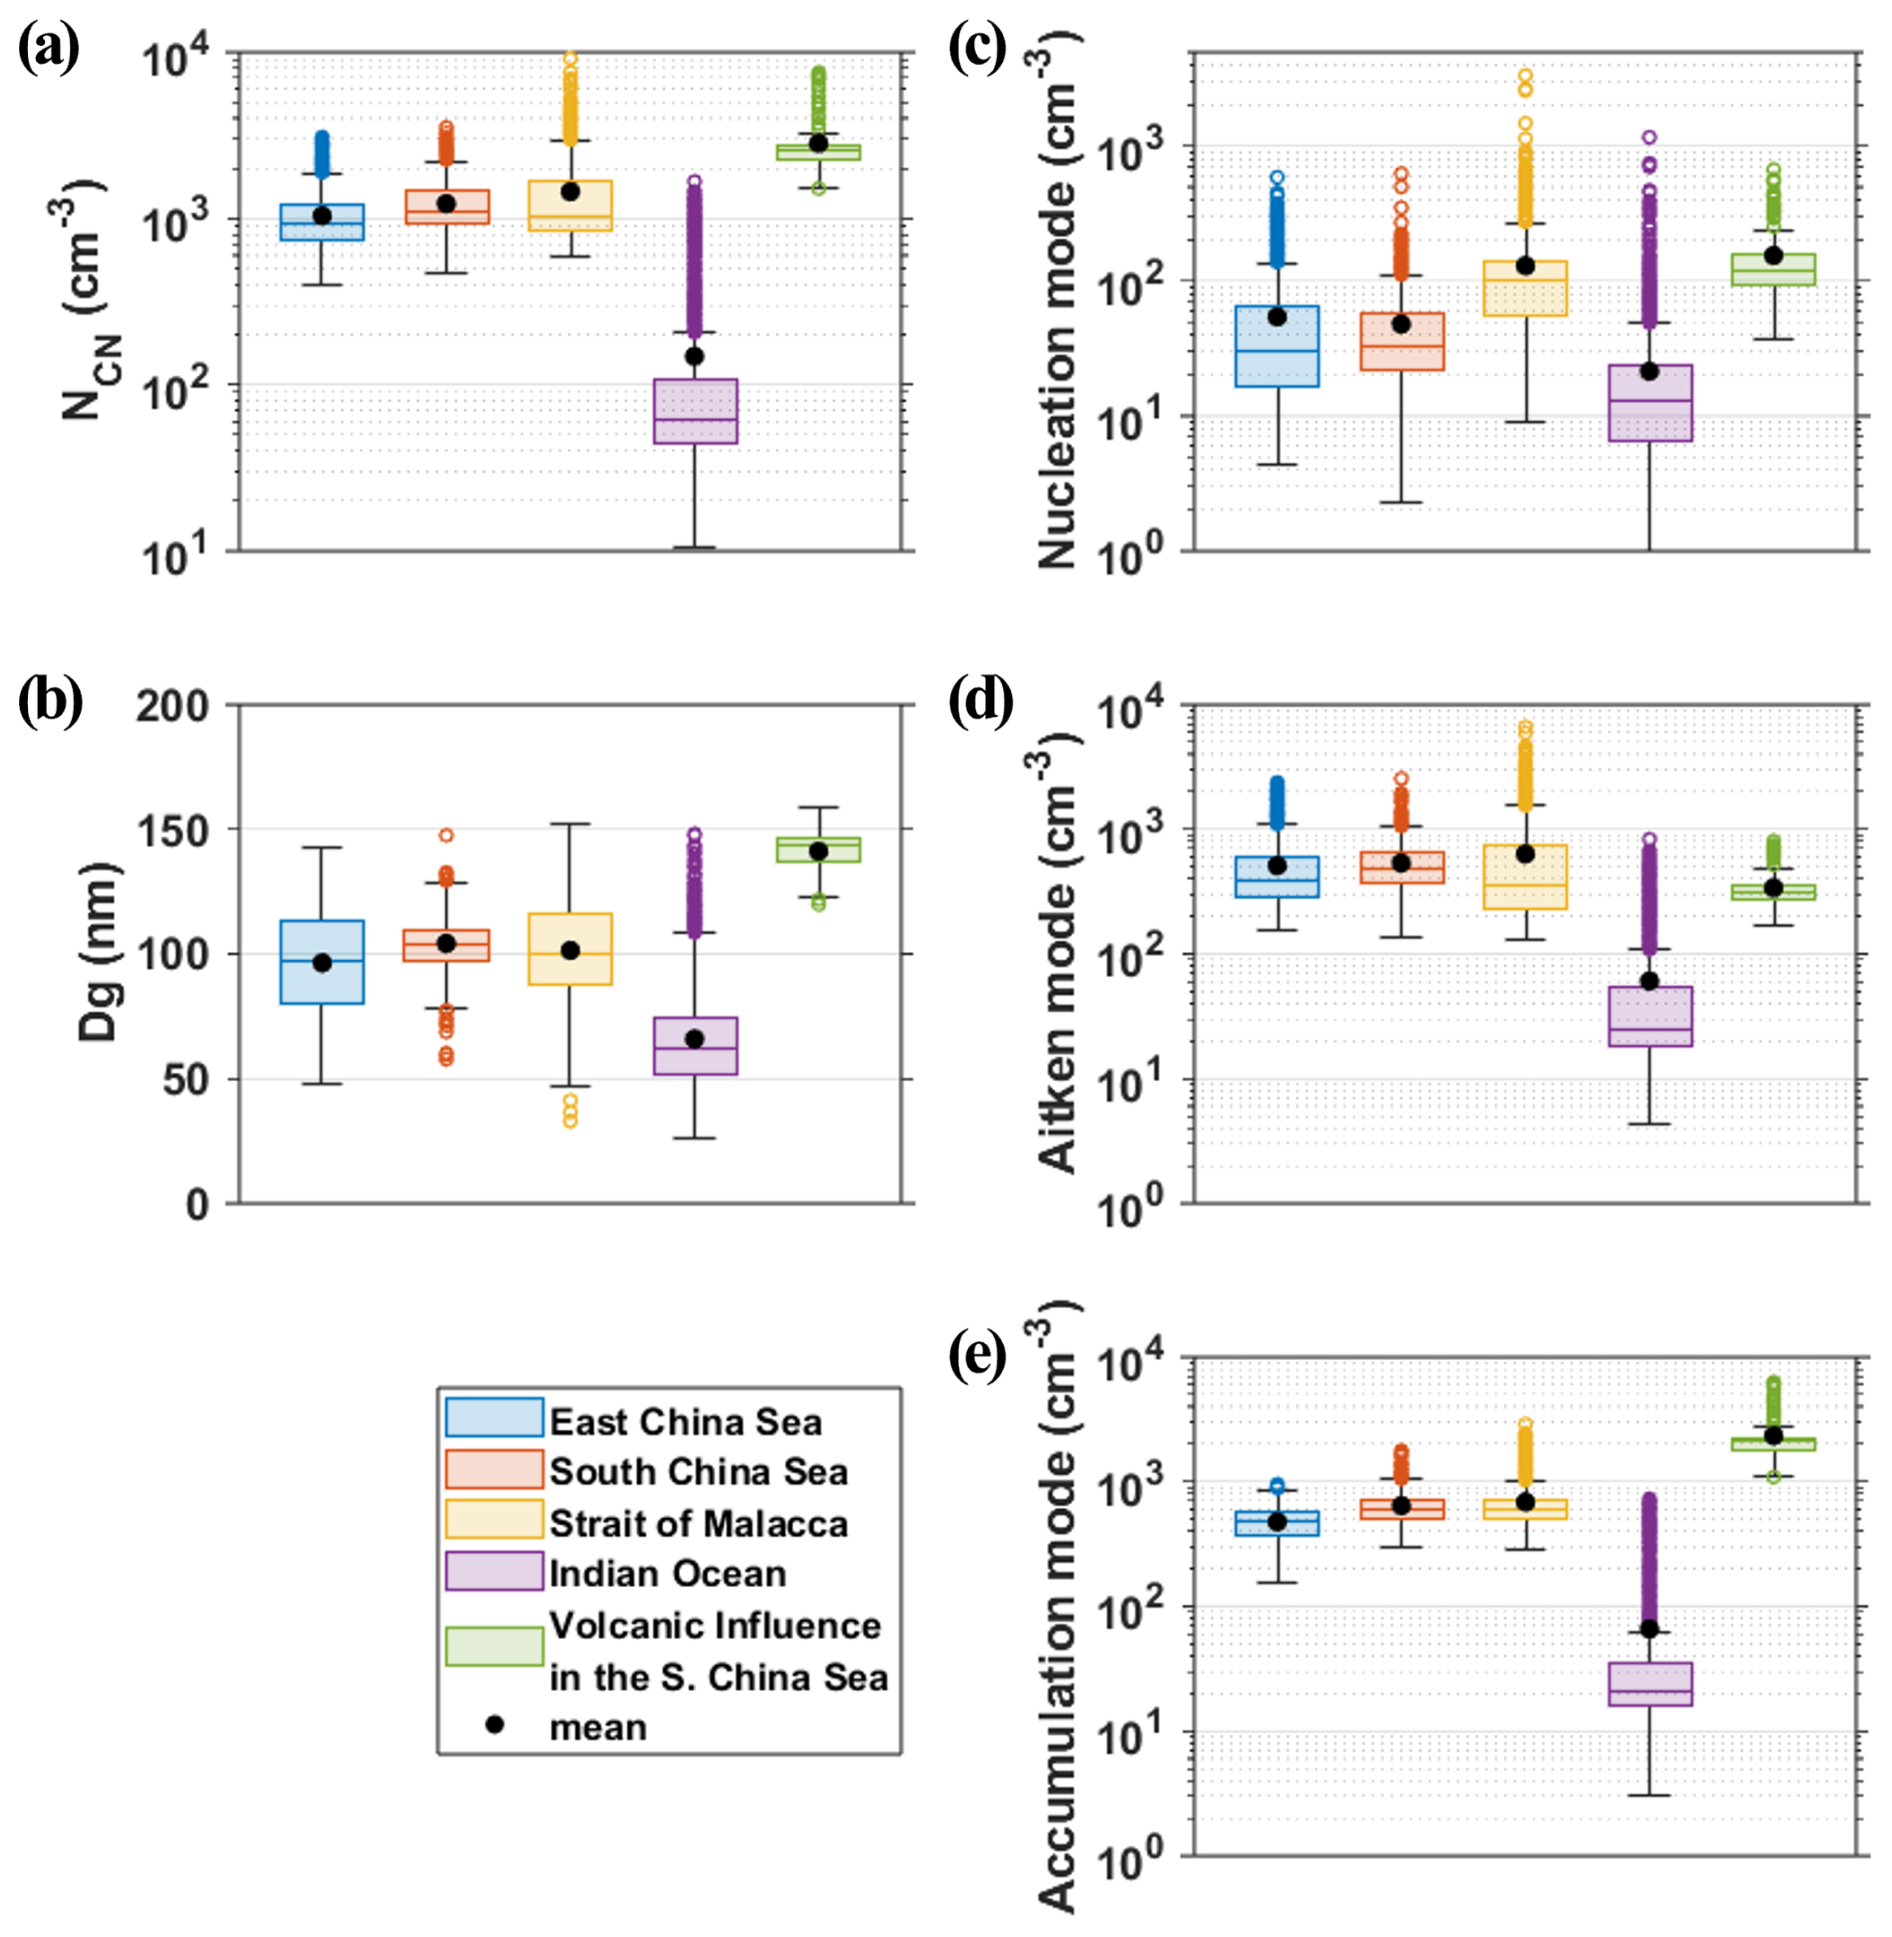
Figure 7Box plots of (a) total aerosol number concentrations, (b) geometric mean diameter, and (c) nucleation (15–25 nm), (d) Aitken (25–100 nm), and (e) accumulation (100–500 nm) mode number concentrations for each sea area. For the South China Sea, the volcanic-influence period was depicted separately. The horizontal line in each box and the black dots represent the median and mean values, respectively. The range of the box is from the 25th percentile to the 75th percentile (IQR). The whiskers extend away from the box to the two extreme values, but if there are data points that exceed 1.5×IQR from the upper or lower end of the box, they are shown as colored dots as outliers.
Meanwhile, the East China Sea, the South China Sea, and the Strait of Malacca had broadly comparable geometric mean diameters, differing by less than 10 nm. However, the number concentrations of each mode showed distinct differences among the three seas (Fig. 7c–e). The nucleation mode was the lowest in the South China Sea and the highest in the Strait of Malacca. In contrast, Aitken and accumulation modes were the lowest in the East China Sea, and although they were the highest in the Strait of Malacca, their differences relative to the South China Sea were minor.
Figure 8a and b present that NCCN were the lowest in the Indian Ocean (30 ± 34 cm−3 at 0.2 % SS and 67 ± 60 cm−3 at 0.6 % SS) and the highest in the South China Sea during the volcanic-influence period (1460 ± 473 cm−3 at 0.2 % SS and 1735 ± 469 cm−3 at 0.6 % SS). However, the ratios were the second highest in the Indian Ocean (Fig. 8c and d). In particular, the difference in the ratios at 0.6 % SS was considerably smaller than the difference in NCCN between the two regions. This suggests that, despite the smallest aerosol sizes in the Indian Ocean, a substantial fraction of the aerosols consisted of hygroscopic components and thus effectively acted as CCN. Meanwhile, the ratios at 0.2 % SS during the volcanic-influence period were exceptionally high, which was likely due to the contribution of hygroscopic sulfate aerosols in addition to the largest aerosol sizes.
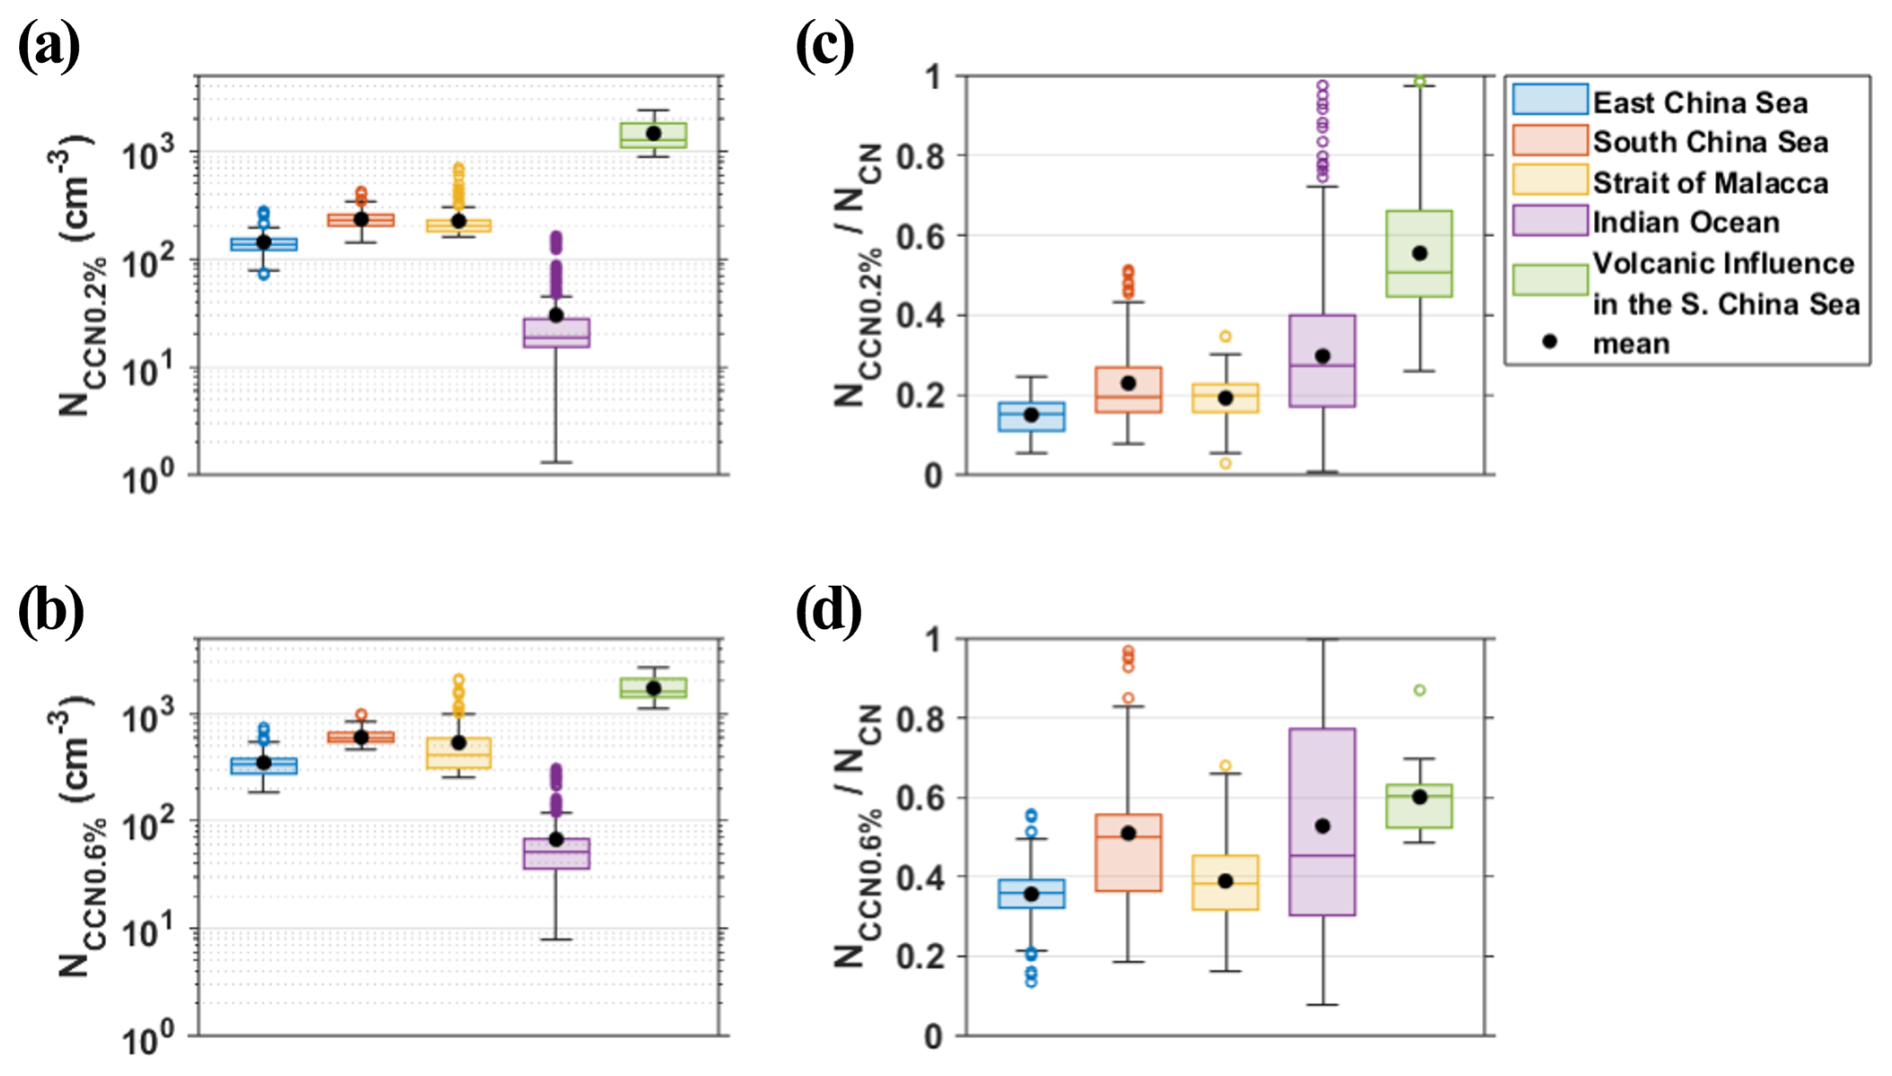
Figure 8Box plots of (a, b) CCN number concentrations at 0.2 % and 0.6 % supersaturation and (c, d) their ratios to the total aerosol number concentrations for each sea area. For the South China Sea, the volcanic-influence period was depicted separately. The horizontal line in each box and the black dots represent the median and mean values, respectively. The range of the box is from the 25th percentile to the 75th percentile (IQR). The whiskers extend away from the box to the two extreme values, but if there are data points that exceed 1.5×IQR from the upper or lower end of the box, they are shown as colored dots as outliers.
A notable feature emerged when comparing the South China Sea and the Strait of Malacca. Although NCN were slightly higher in the Strait of Malacca (1226 ± 517 cm−3 in the South China Sea vs. 1449 ± 1050 cm−3 in the Strait of Malacca), NCCN were actually slightly higher in the South China Sea (233 ± 47 cm−3 at 0.2 % SS and 601 ± 94 cm−3 at 0.6 % SS) than in the Strait of Malacca (225 ± 85 cm−3 at 0.2 % SS and 536 ± 353 cm−3 at 0.6 % SS). The ratios at both supersaturations were likewise higher in the South China Sea than in the Strait of Malacca. However, when accounting for measurement uncertainties, the ranges of both ratios at 0.2 % SS overlap slightly, whereas at 0.6 % SS, they remain distinct without overlap (Table S2 in the Supplement). Nevertheless, considering the similarity in the geometric mean diameter between the two regions (Fig. 7b), the difference in the ratios could be primarily governed by κ. This suggests that aerosols in the South China Sea were more hygroscopic and therefore more readily activated as CCN than those in the Strait of Malacca. The major source of aerosols in the Strait of Malacca is the substantial ship emissions emitted from heavy cargo traffic (Saputra et al., 2013; Geng et al., 2023). Given that such emissions are typically hydrophobic, it is reasonable to expect lower κ values in the Strait of Malacca than in the South China Sea.
NCCN observed in this study were broadly consistent with previous studies. In the East and South China Seas, NCCN has been reported to range from several hundred per cubic centimeter in remote areas (Atwood et al., 2017; Gong et al., 2023) to several thousand under continental influence (Gao et al., 2020; Ou et al., 2025). Those ranges were comparable to the results of this study (Figs. 8a, b and S8a in the Supplement). In contrast, in the Indian Ocean, which is considered a background environment, Dournaux et al. (2025) reported NCCN in the range of tens to a few hundred per cubic centimeter. These values were consistent not only with the present study but also with observations from other pristine marine regions (Park et al., 2020; Sanchez et al., 2021; Tatzelt et al., 2022).
3.2.2 Size distributions
Figure 9 shows the average aerosol size distribution for each sea area, along with the fitting results for each mode and their total sum. The fitting parameters for each mode and residuals are summarized in Table S3 in the Supplement. The nucleation mode was carefully interpreted, as it was fitted within a significantly restricted geometric mean diameter range (15–25 nm) to account for occasional voltage instabilities in the smallest size bins of the SMPS.

Figure 9Average aerosol size distributions (black circles) for each sea area along with the fitting results for each mode (green, blue, red, and cyan lines). The distribution for the sum of all modes is represented by a magenta line. For the South China Sea, the volcanic-influence period was depicted separately.
Submicron aerosols dominated the total number concentrations across all regions. In contrast, while the contribution of the coarse mode to the number concentrations was minor, these particles could play a substantial role in CCN activation at low supersaturations.
In the East China Sea, South China Sea, and Strait of Malacca, three submicron modes were observed, but the distributions were characterized by prominent Aitken and accumulation modes. Although the relative number concentrations and contributions of both modes varied somewhat among the sea areas, these distributions appeared to reveal the typical characteristics of anthropogenic influences and secondary aerosol formation (Bates et al., 2004; Seinfeld and Pandis, 2016; Ueda et al., 2016). Notably, the Aitken mode in the Strait of Malacca showed the largest geometric standard deviation of 1.98 among all fitting results, suggesting complex mixing of marine background aerosols, continental aerosols, and ship exhaust. Consequently, given that the majority of the accumulation mode particles can act as CCN, NCCN in these three regions are likely to be highly sensitive to the actual size and chemical composition of the Aitken mode, which accounts for a substantial fraction of the aerosol population.
In contrast, the Indian Ocean exhibited much lower number concentrations across all three submicron modes, but a relatively distinct separation among these modes. Especially, the accumulation mode made the most significant contribution (approximately half of the total), indicating that although NCN in the Indian Ocean were significantly low, a substantial fraction of the particles could act as CCN. However, according to previous studies (Kompalli et al., 2020; Dournaux et al., 2025), even in the Indian Ocean, the dominant aerosol mode can vary by region and air mass origin, with the Aitken mode sometimes prevailing and the nucleation mode not always being observed.
Finally, based on the residuals, the performance of the fitting for the volcanic-influence period was relatively poor compared with the other four regions (Table S3). Although four submicron peaks were identified in the measured size distribution (<40, ∼70, ∼170, and ∼400 nm), increasing the number of submicron modes from two to three reduced the RMSE by less than 10 %. Consequently, only the nucleation and accumulation modes were ultimately fitted, resulting in substantial underestimation at around 50 and 600 nm (Fig. S9 in the Supplement). Nevertheless, a distinct accumulation mode (Nt=2468 cm−3, Dpg=165.9 nm, and σg=1.43) was observed during the volcanic-influence period. This is because most aerosols during this period were likely sulfate-dominated particles (i.e., non-sea-salt sulfate aerosols), which originated from the oxidation of SO2 emitted by the Taal volcano and the subsequent condensation of the resulting H2SO4.
Overall, these results provide direct evidence that applying a single, uniform parameterization of marine aerosols in models is highly problematic and that at least regional differentiation is required to represent them. Moreover, these differences in aerosol size distributions across sea areas can lead to substantial variations in CCN efficiency for a given supersaturation condition, as evaluated in terms of κ and CCN spectra in the following section.
3.2.3 Critical diameter and hygroscopicity
Figure 10 presents the mean and uncertainty ranges of the DC and κ for each supersaturation for each sea area. Note that at lower supersaturations, the uncertainties in CCN measurements are greater. Moreover, since SMPS measures NCN in discrete size bins, DC can fluctuate significantly with only a slight change in NCCN when NCN are very low. The combined effects of these factors can result in considerable uncertainties at low supersaturation (i.e., 0.2 % SS), especially where NCN are very low (e.g., the Indian Ocean). Therefore, our interpretation focused primarily on trends and relative comparisons.
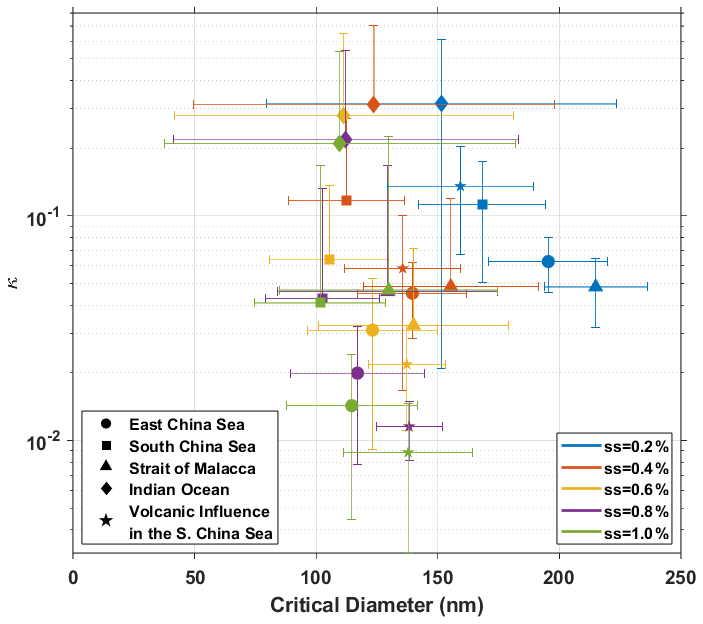
Figure 10Distributions of the DC and κ at given supersaturations for each sea area. The symbols represent the mean values, and the lengths of the error bars correspond to one standard deviation. For the South China Sea, the volcanic-influence period was depicted separately.
According to Köhler theory, higher supersaturations allow progressively smaller particles to activate; consequently, DC is smaller for higher supersaturation. As an exception, during the volcanic-influence period, similar DC were observed across the 0.4 %–1.0 % SS due to the very narrow distribution of the accumulation mode. Even at the same supersaturation, substantial differences in DC were evident among sea areas. Larger DC – such as those observed in the Strait of Malacca – indicate that only relatively large particles could act as CCN because they had low κ.
Interestingly, κ showed a decreasing trend with increasing supersaturation and spanned a wide range of 0.05–0.3, reflecting variations in aerosol composition and mixing state across sea areas and aerosol sizes. Higher κ values were observed in the Indian Ocean and at certain supersaturations in the South China Sea. This implies that aerosols of the same size in the two sea areas were more likely to activate as CCN at a given supersaturation compared to the other sea areas that showed lower κ values. These supersaturation-dependent DC–κ characteristics influence aerosol activation into CCN and ultimately shape patterns of CCN spectra.
The significantly low κ in the East China Sea was also reported by Gong et al. (2023). Rather than reflecting the extremely low intrinsic κ of aerosols, this was likely due to activation competition under high NCN conditions with limited water vapor availability, highlighting a limitation of the CCN-derived κ method. Although the κ calculation methods differ, the κ in the South China Sea reported in previous studies (Atwood et al., 2017; Ou et al., 2025) were higher than those obtained in this study. According to Nair et al. (2024) and Dournaux et al. (2025), κ values at 0.4 % SS obtained in the Equatorial and Southern Indian Ocean were similar to those derived in this study across the Indian Ocean.
3.2.4 CCN spectra
Figure 11 shows measured mean CCN spectra along with fittings by two- and three-parameter formulae. The Twomey formula (Twomey, 1959), where C and α are the fitting parameters, is the two-parameter formula. A three-parameter formula was proposed by Ji and Shaw (1998), where N, B, and β are the fitting parameters. These parameters and coefficients of determination for these fittings are summarized in Table 2.
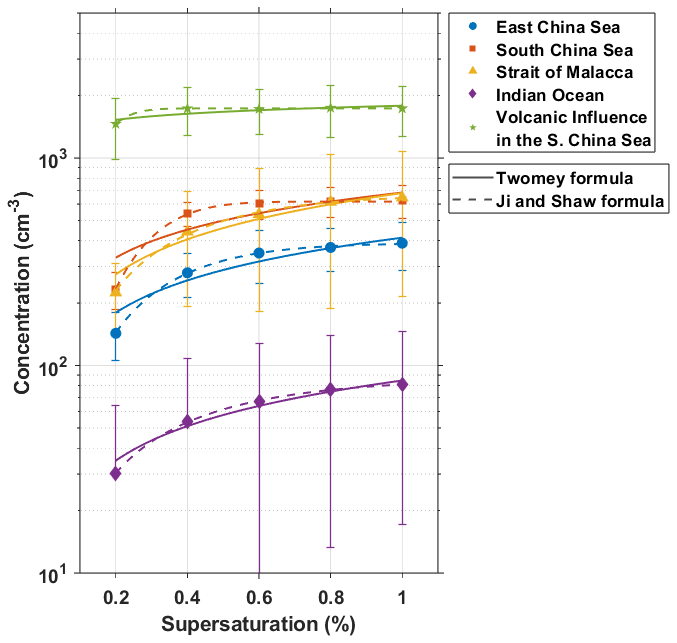
Figure 11Fitting results of the Twomey (solid line) and Ji and Shaw (dashed line) formulas for each sea area. For the South China Sea, the volcanic-influence period was depicted separately.
Table 2Total aerosol number concentrations and the coefficients of determination and parameters of CCN fitting for each sea area.
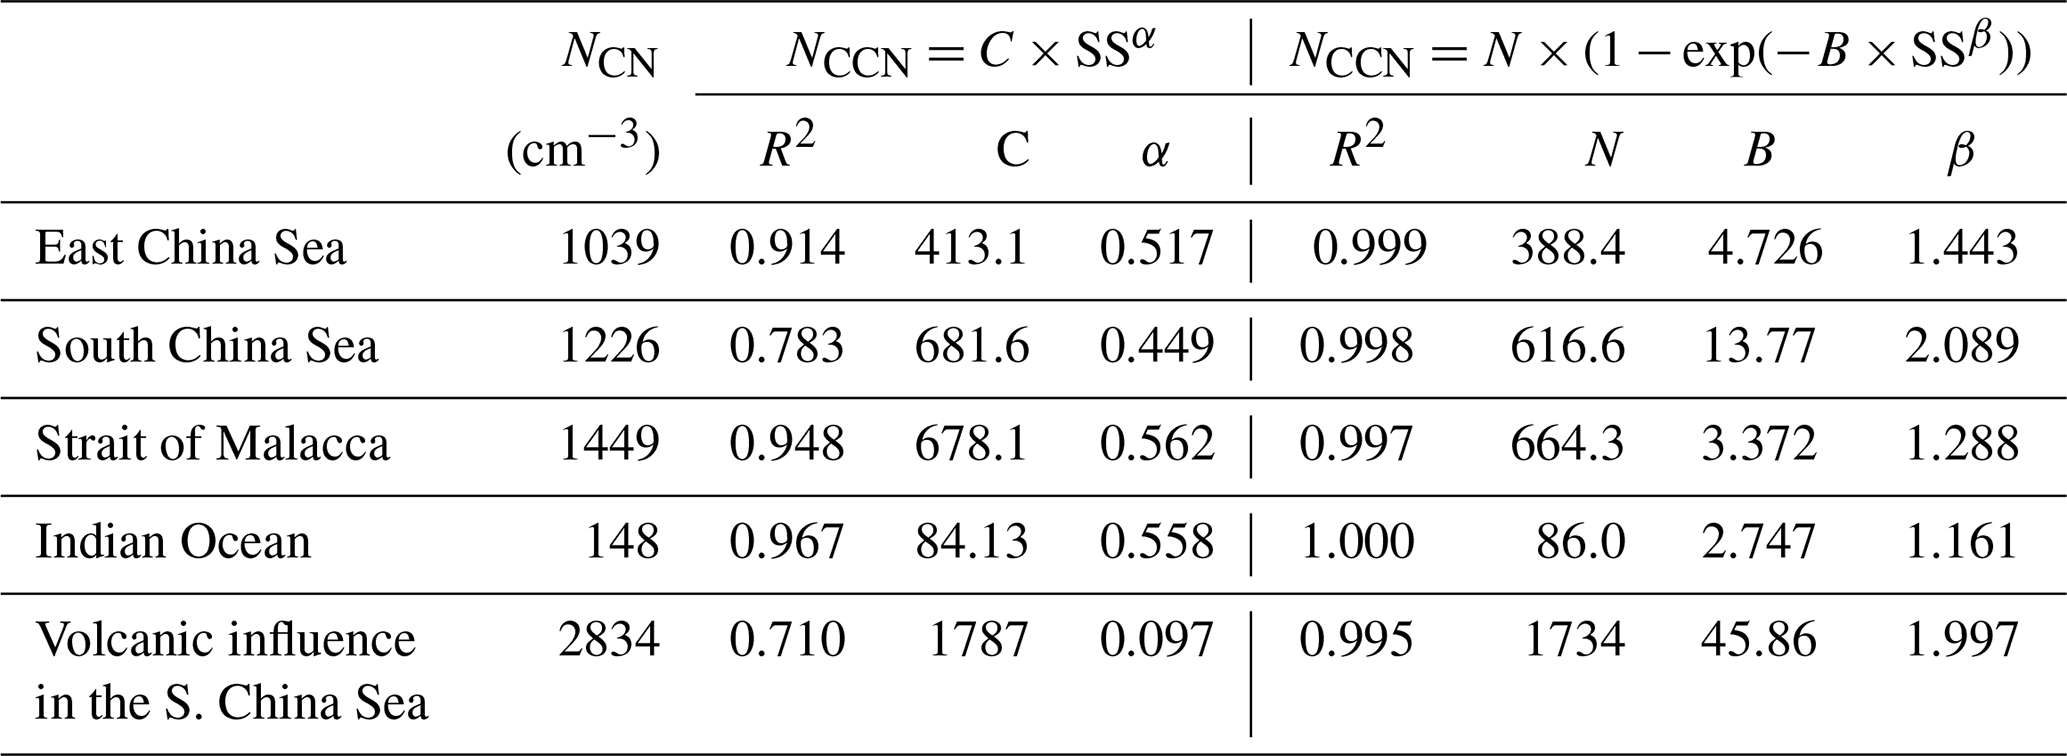
Note. For the South China Sea, the volcanic-influence period was depicted separately.
When applying the Twomey formula, relatively low coefficients of determination were obtained for the South China Sea and the volcanic-influence period (0.783 and 0.710, respectively). In contrast, the Ji and Shaw formula yields coefficients of determination close to unity across all regions. Although this improvement was expected, given the inclusion of an additional parameter, it highlights the limitations of the traditional Twomey formula. In particular, the Twomey formula tends to overestimate NCCN at low supersaturations representative of real atmospheric conditions, indicating that its application in cloud modeling requires careful consideration.
Meanwhile, as indicated by the fitted curves, the Ji and Shaw formula predicts that NCCN do not increase infinitely with increasing supersaturation but instead asymptotically converge toward the parameter N closely related to NCN and size distributions. Consequently, in regions with abundant CCN, such as the South China Sea and Strait of Malacca, the influence of aerosol variability on CCN is limited. In contrast, in regions with very low NCCN, such as the Indian Ocean, cloud properties can change significantly as they respond sensitively to aerosol variability.
Parameter β reflects the sensitivity of NCCN to supersaturation. β is directly related to DC. Larger β indicates that NCCN responds more strongly to supersaturation variations. The effect associated with differences in β was especially evident when comparing the South China Sea and the Strait of Malacca. Although the two sea areas exhibited similar N values, β was the highest in the South China Sea and the second lowest in the Strait of Malacca. As a result, NCCN differed substantially between the two sea areas at 0.4 % and 0.6 % SS. This contrast could be attributed to the smaller and narrowly distributed DC and the higher κ in the South China Sea than in the Strait of Malacca, leading to stronger supersaturation-dependent aerosol activation. These differences in β suggest that variations in updraft velocity or subtle changes in thermodynamic conditions can induce substantial differences in cloud microphysics.
In the Indian Ocean, mean CCN spectra of this study are similar to some of the aircraft CCN measurements during the 1999 INDOEX campaign (Hudson and Yum, 2002). These were classified as “Clean” at low altitudes south of the ITCZ over the Indian Ocean. Considering the gap of more than 20 years between these two observation periods, this consistent result provides strong evidence that the Indian Ocean is a pristine remote area.
3.3 Clustering analysis
During the cruise, air mass origins, even within the same sea area, could differ. Such variations could affect the observed characteristics of aerosols and CCN. Therefore, we performed k-means clustering on the 72 h back trajectories for the four sea areas (Fig. 12). The cluster numbers are assigned in chronological order.
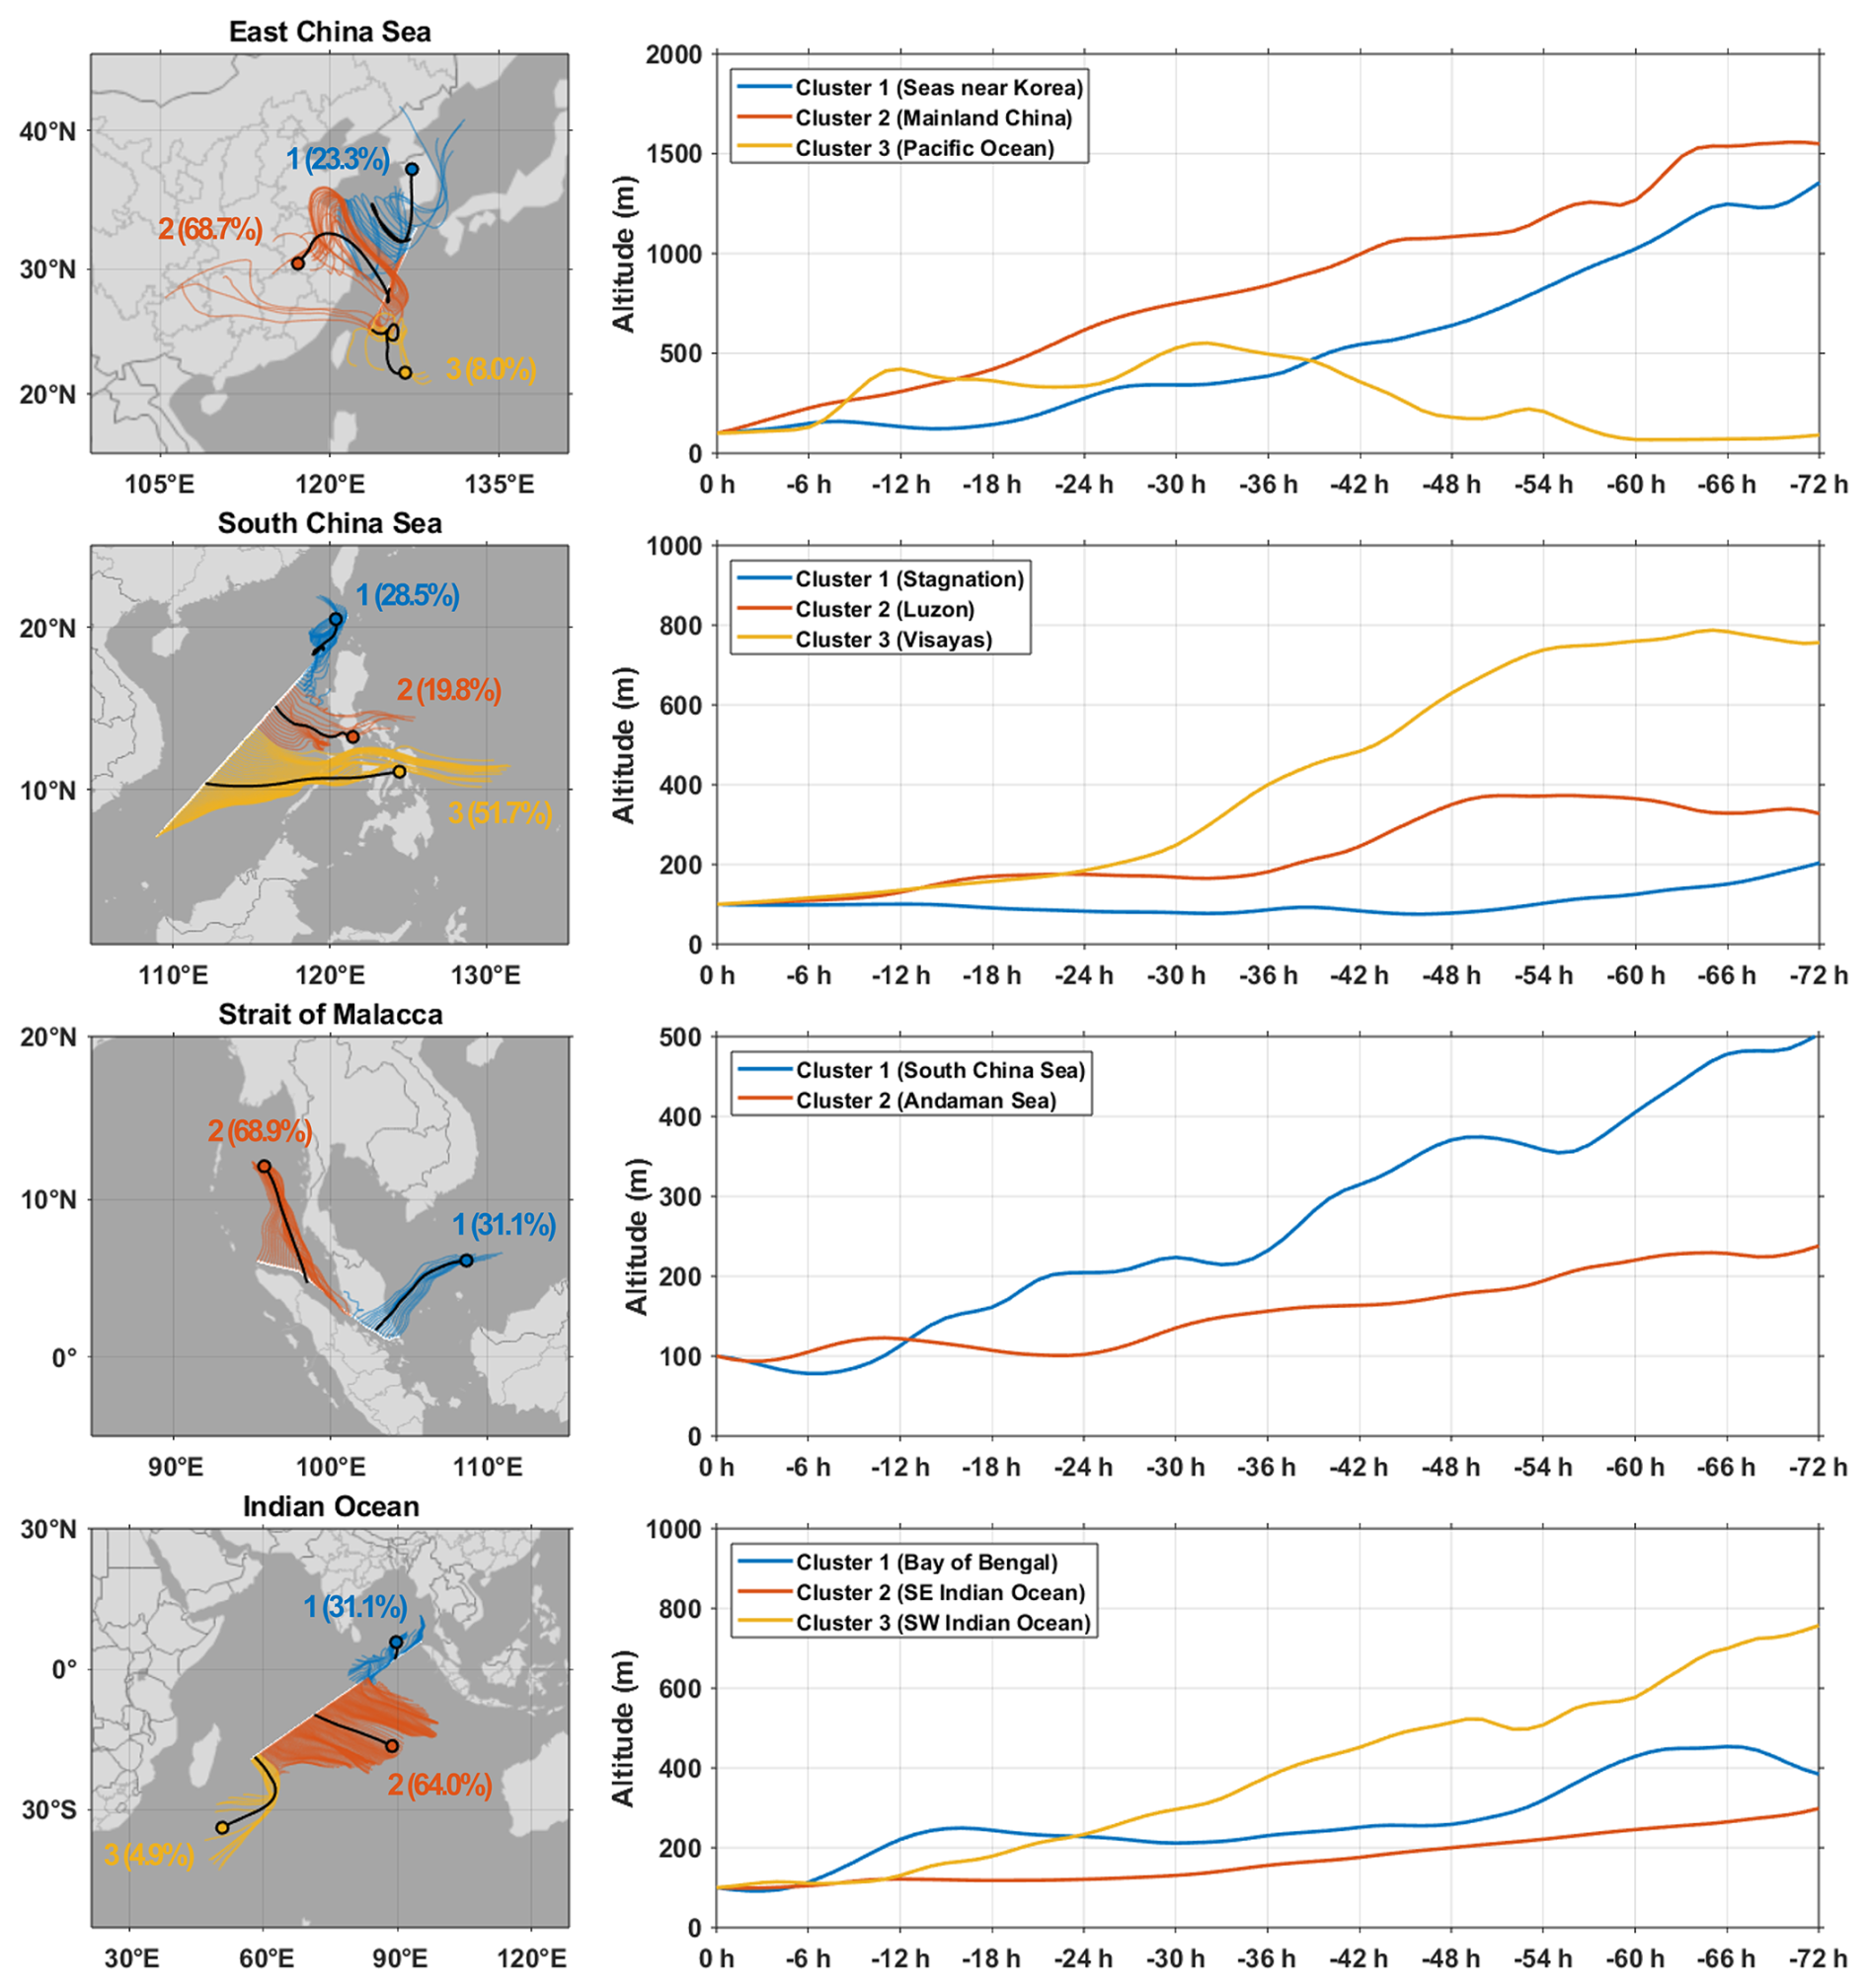
Figure 12Cluster analysis results for each sea area and mean altitude variations of 72 h back trajectories within each cluster. The thick black solid lines with dots at their ends represent the mean trajectories of each cluster. The percentages in parentheses indicate the proportion of trajectories assigned to each cluster. Map data from Natural Earth.
The East China Sea was divided into three clusters: seas near Korea (Cluster 1), Mainland China (Cluster 2), and the Pacific Ocean (Cluster 3). In contrast to the relatively low altitudes of Cluster 3, Clusters 1 and 2 were transported from altitudes above 1000 m. As shown in Table 3, NCN and NCCN were higher when air masses originated from the continent compared to when they originated from marine regions (Note that CCN data for the Cluster 3 period are unavailable due to a CCNC instrument error). However, the ratios were higher in Cluster 1, which contrasts with the larger geometric mean diameter in Cluster 2. Although this study does not include aerosol chemical composition data, these results suggest that CCN activation depends not only on particle size but also strongly on chemical composition. Furthermore, it can be inferred that marine-origin aerosols are likely composed of more hygroscopic components, including sea salt such as NaCl, than continental aerosols.
Table 3Mean aerosol number concentrations and geometric mean diameter, CCN number concentrations, and the CCN-to-aerosol ratio for each cluster in each sea area.
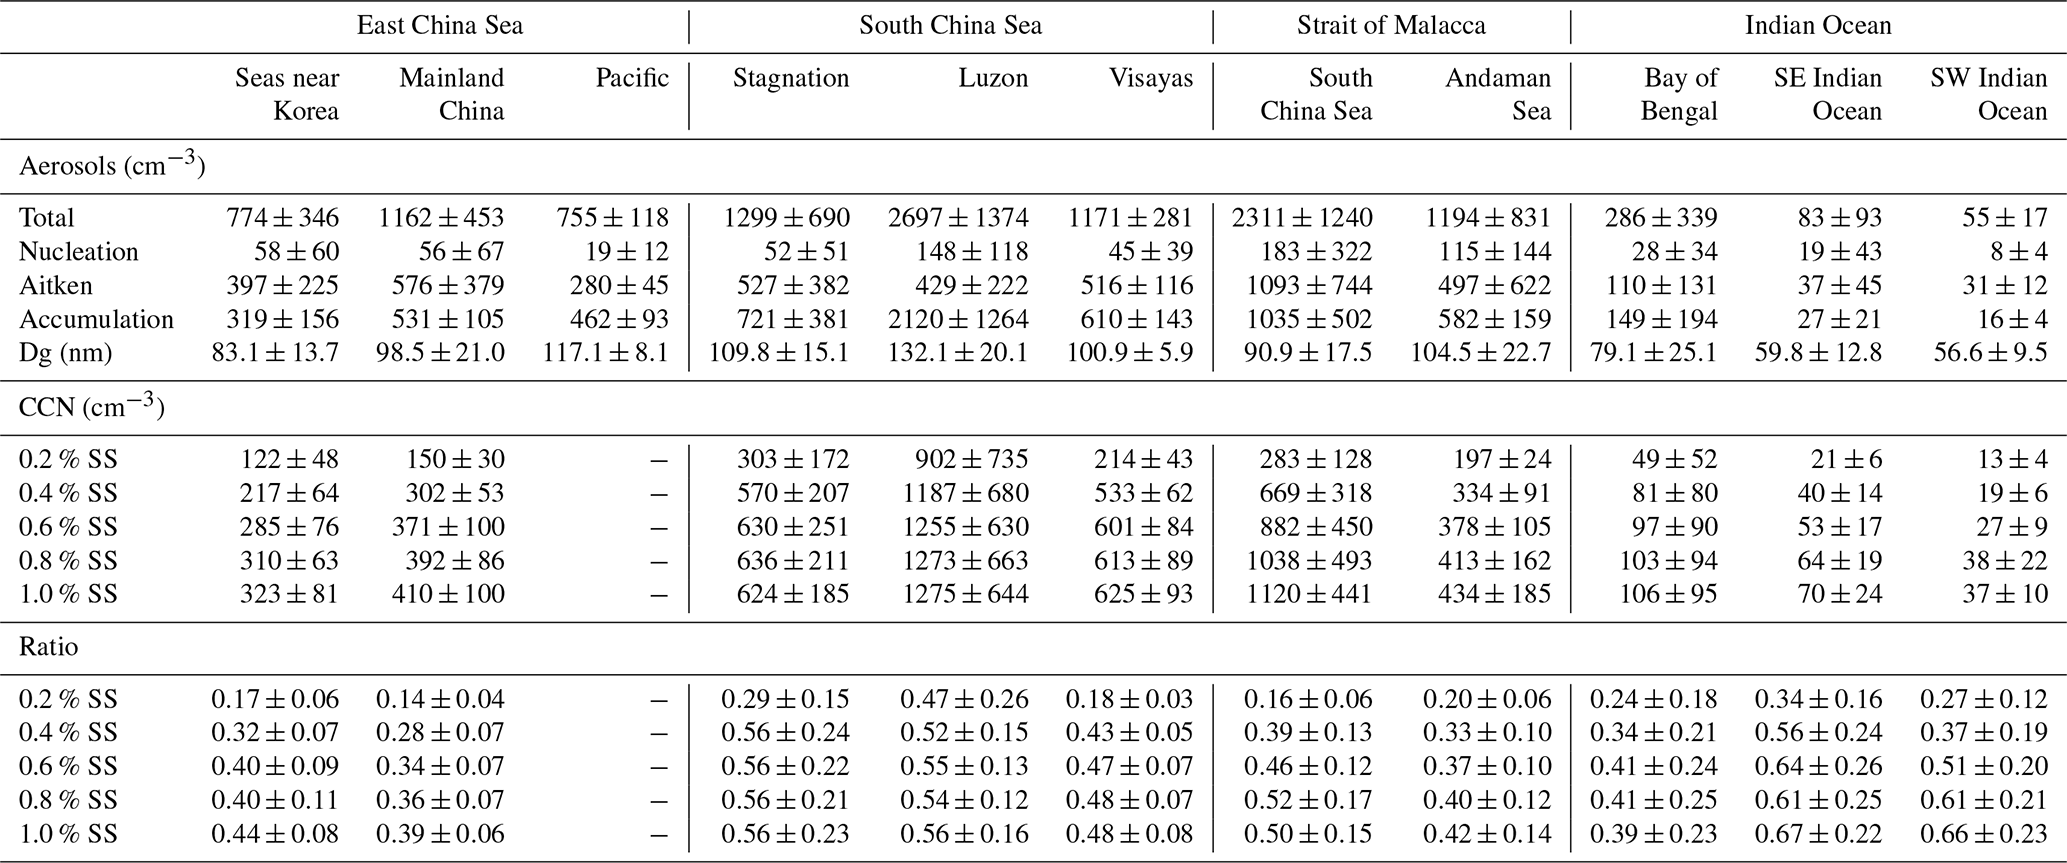
For the South China Sea, three clusters were also identified: stagnant air masses near the Philippines and Taiwan (Cluster 1); air masses originating from the western Pacific that passed over Luzon Island (Cluster 2); and air that passed over the Visayas Islands (Cluster 3). Although all three clusters were of marine origin, aerosol and CCN characteristics varied significantly depending on the regions traversed by the air masses. As described in Sect. 3.1.2, the influence of the Taal volcano led to an exceptionally high NCN of 2697 ± 1374 cm−3 during the Cluster 2 period. This enhancement was observed only in accumulation mode, resulting in geometric mean diameters that were 22.3 and 31.2 nm larger than those of Clusters 1 and 3, respectively. Moreover, NCCN during the Cluster 2 period were at least twice NCCN observed in Clusters 1 and 3, with the difference being particularly evident at 0.2 % SS. Meanwhile, Clusters 1 and 3 exhibited similar number concentrations of nucleation and Aitken modes, whereas those of the accumulation mode were approximately 100 cm−3 higher during the Cluster 1 period. Consequently, the geometric mean diameter in Cluster 1 was slightly larger than that in Cluster 3, and NCCN at 0.2 % SS were also higher during the Cluster 1 period. At other supersaturations, NCCN were comparable between Clusters 1 and 3, although all ratios were higher in Cluster 1.
The Strait of Malacca was divided into only two clusters, both of marine origin, but associated with different source regions: the South China Sea (Cluster 1) and the Andaman Sea (Cluster 2). Notably, unlike Cluster 2, which remained exclusively over the marine region, Cluster 1 traversed Peninsular Malaysia at low altitudes, indicating a potential terrestrial influence. As a result, not only NCN but also the number concentrations of each mode were approximately twice as high in Cluster 1. Although the geometric mean diameter was slightly larger in Cluster 2, NCCN across all supersaturations were also roughly twofold higher during the Cluster 1 period. The ratios, however, were higher during the Cluster 2 period at 0.2 % SS, while at the remaining four supersaturations, they were higher during the Cluster 1 period.
In the Indian Ocean, the air masses were categorized into three origins: the Bay of Bengal (Cluster 1), the southeastern Indian Ocean (Cluster 2), and the southwestern Indian Ocean (Cluster 3). As in the South China Sea, all clusters were of marine origin; however, unlike the South China Sea, extended back trajectories indicate that their origins may trace back to land (Fig. S10 in the Supplement). Despite the brief occurrence of the lowest NCN due to intense precipitation during the Cluster 1 period, mean NCN and NCCN were the highest among the three clusters. This is likely because the Bay of Bengal is adjacent to land, allowing continental aerosols to be transported under northerly winds. Consequently, the ratios were lower than those of the two clusters originating only from the Indian Ocean. Comparing the two Indian Ocean clusters, higher NCN and NCCN were observed in Cluster 2, which was influenced by southeasterly winds, with the difference particularly pronounced at 0.4 % SS. Back trajectories extended to 120 h further suggest that the Australian continent may have influenced the elevated number concentrations during the Cluster 2 period (Fig. S10).
This study presents a comprehensive analysis of marine aerosols and cloud condensation nuclei (CCN) characteristics across the East China Sea, the South China Sea, the Strait of Malacca, and the Indian Ocean, based on continuous measurements conducted during a long-distance transit voyage of the R/V ISABU operated by KIOST in 2024. The primary objective of this study was to address the limitations of previous marine observations, which were confined to a single sea area or short-term campaigns, and to robustly intercompare the characteristics of aerosols and CCN across various sea areas under a consistent observational and analytical framework. Furthermore, clustering analysis was applied to enable a multifaceted examination of variability within individual sea areas.
Throughout the entire observation period, total aerosol (CN) and CCN number concentrations (NCN and NCCN) exhibited significant spatiotemporal variability, ranging from tens (or even a single digit) to several thousand per cubic centimeter. The lowest NCN and NCCN occurred locally on 9 April due to a meteorological factor, intense precipitation. In contrast, the highest NCCN were observed regionally on 2 April while the vessel was cruising the western part of Luzon Island, Philippines. This high-concentration episode was driven by the Taal volcano located in the southern part of Luzon Island. It was the only period during which NCCN at 0.2 % supersaturation (SS) was comparable to NCCN at higher supersaturations.
Spatially, a distinct contrast in NCN and NCCN was observed across 90° E between continent-adjacent seas – the East China Sea, the South China Sea, and the Strait of Malacca – and the remote Indian Ocean. A similar contrast was observed in the CCN-to-aerosol () ratios across the same longitude; however, higher values were observed over the Indian Ocean. Together, these findings indicate that the Indian Ocean represents a clean background region distinct from other sea areas, characterized by low NCN but composed of hygroscopic particles.
A quantitative comparison of characteristics for each sea area shows that the East China Sea, the South China Sea, and the Strait of Malacca exhibited similar NCN and geometric mean diameters. These three regions were characterized by bimodal distributions with Aitken and accumulation modes, although their relative contributions varied slightly. However, NCCN were higher in the South China Sea than in the Strait of Malacca. This indicates that aerosols in the South China Sea were more hygroscopic and thus more readily activated into CCN than those in the Strait of Malacca, a conclusion supported by critical diameter and κ analyses.
Compared with other regions, the Indian Ocean exhibited NCN and NCCN that were nearly an order of magnitude lower. It was also the only region characterized by a distinct nucleation mode, resulting in the smallest geometric mean diameter among all regions. Nevertheless, the Indian Ocean showed the highest κ values, indicating that the aerosols were highly hygroscopic and that a more substantial fraction of the particles could act as CCN at a given supersaturation.
During the volcanic-influence period, NCN and NCCN, the ratios, and the geometric mean diameter were all at their highest levels. Since the majority of particles were in the accumulation mode and dominated by natural sulfate aerosols, NCCN and their ratios were especially elevated at 0.2 % SS. Taken together, these results demonstrate that in marine environments, various factors, such as aerosol number concentration, size distribution, and κ, play important roles in determining critical supersaturations for CCN activation.
Regarding CCN spectra, the classical Twomey formula failed to adequately capture the nonlinear increase in NCCN in some regions. In contrast, the Ji and Shaw formula demonstrated excellent agreement across all regions, including the volcanic-influence period. The parameter N, representing the upper limit of NCCN, was the smallest in the Indian Ocean, suggesting that cloud properties in the Indian Ocean can be more susceptible to aerosol variations. Although the South China Sea and the Strait of Malacca exhibited similar N values, the substantially larger β in the South China Sea reflected the sensitivity of NCCN to supersaturation. This is consistent with the smaller critical diameters and more hygroscopic aerosols observed in the South China Sea.
Clustering analysis showed that in both the East China Sea and the Indian Ocean, NCN and NCCN were higher when air masses originated from land than from the ocean. In contrast, the ratios were higher for marine-origin air masses, indicating that marine aerosols (especially sea salt such as NaCl) are more hygroscopic than continental aerosols. In the South China Sea and the Strait of Malacca, the results further demonstrate that, even for marine-origin air masses, the characteristics of aerosols and CCN can vary significantly depending on the regions traversed during transport. These findings suggest that it is essential to simultaneously consider the origins and transport pathways of air masses beyond the simple geographical classification of polluted and background areas.
The results of this study demonstrate that a single, uniform marine regime cannot represent the characteristics of marine aerosols and CCN; instead, they exhibit structurally distinct characteristics depending on the sea area and air mass origin. These measurement-based findings are expected to provide important constraints on improving climate and cloud models for simulating aerosol–cloud interactions in marine low-level clouds more realistically.
Nevertheless, this study was unable to resolve seasonal differences, nor did it include integrated analyses with other observational datasets (e.g., aerosol chemical composition, VOCs, or ice-nucleating particles). Therefore, future research should include comprehensive analyses integrating long-term, repeated measurements across multiple sea areas to better characterize the seasonal and interannual variability of aerosols and CCN. In addition, concurrent cloud microphysical observations are required to further elucidate aerosol–cloud interactions in greater depth.
The code and data used for figures and tables are available via https://doi.org/10.6084/m9.figshare.31315192 (Ahn et al., 2026). The SO2 flux and plume height data for the Taal Volcano used in Sect. 3.1.2 were obtained from the Volcano Bulletin of the Philippine Institute of Volcanology and Seismology (PHIVOLCS) and are available via https://wovodat.phivolcs.dost.gov.ph/bulletin/list-of-bulletin (last access: 6 February 2026). The back trajectory and height data for the air masses used in Sects. 3.1.2 and 3.3 were obtained using Version 5.1 of the HYSPLIT model from NOAA Air Resources Laboratory, and the HYSPLIT model is available via https://www.ready.noaa.gov/documents/Tutorial/html/install_win.html (last access: 6 February 2026). The BL height used in Sect. 3.1.2 was obtained from the ERA5 reanalysis data of the European Centre for Medium-Range Weather Forecasts and is available via https://doi.org/10.24381/cds.adbb2d47 (Hersbach et al., 2023).
The supplement related to this article is available online at https://doi.org/10.5194/acp-26-9857-2026-supplement.
CA, UHY, KHK, and SSY conceptualized the overall study. CA, AL, NK, JGA, KHK, DK, and DHP carried out the installation and calibration of instruments. CA, AL, and JGA performed measurements for cloud condensation nuclei, aerosol size distribution, and sulfur dioxide, respectively, during the cruise. CA, AL, and JGA processed and validated the observational datasets. CA developed methodology, performed data analysis, and visualized the results, with contributions from AL, NK, and SSY. UHY and SC acquired the funding, and UHY was responsible for ship cruise administration. CA wrote the original paper, and NK and SSY edited and revised the paper with contributions from all co-authors.
The contact author has declared that none of the authors has any competing interests.
Publisher's note: Copernicus Publications remains neutral with regard to jurisdictional claims made in the text, published maps, institutional affiliations, or any other geographical representation in this paper. The authors bear the ultimate responsibility for providing appropriate place names. Views expressed in the text are those of the authors and do not necessarily reflect the views of the publisher.
We are deeply grateful to the Korea Institute of Ocean Science and Technology and crew of the R/V ISABU for their assistance during the research cruise, including instrument installation. We also acknowledge the Philippine Institute of Volcanology and Seismology, the NOAA Air Resources Laboratory, and the European Centre for Medium-Range Weather Forecasts for providing Volcano Bulletins, the HYSPLIT model, and the ERA5 reanalysis data, respectively.
This research has been supported by the Korea Institute of Science and Technology (grant nos. 26E0111 and 2N47990), the Korea Institute of Ocean Science and Technology (grant no. PEA0272), and the Yonsei University (grant no. 2025-22-0242).
This paper was edited by Lynn M. Russell and reviewed by James Hudson and one anonymous referee.
Ahn, C., Loh, A., Kim, N., Yim, U. H., An, J. G., Kim, K. H., Kim, D., Park, D.-H., Yum, S. S., and Choi, S.: Characteristics of marine aerosols and cloud condensation nuclei measured during the cruise of R/V ISABU in 2024: from the East China Sea to the Indian Ocean, figshare [data set], https://doi.org/10.6084/m9.figshare.31315192, 2026.
Albrecht, B. A.: Aerosols, Cloud Microphysics and Fractional Cloudiness, Science, 245, 1227–1230, https://doi.org/10.1126/science.245.4923.1227, 1989.
Atwood, S. A., Reid, J. S., Kreidenweis, S. M., Blake, D. R., Jonsson, H. H., Lagrosas, N. D., Xian, P., Reid, E. A., Sessions, W. R., and Simpas, J. B.: Size-resolved aerosol and cloud condensation nuclei (CCN) properties in the remote marine South China Sea – Part 1: Observations and source classification, Atmos. Chem. Phys., 17, 1105–1123, https://doi.org/10.5194/acp-17-1105-2017, 2017.
Bates, T. S., Quinn, P. K., Coffman, D. J., Covert, D. S., Miller, T. L., Johnson, J. E., Carmichael, G. R., Uno, I., Guazzotti, S. A., Sodeman, D. A., Prather, K. A., Rivera, M., Russell, L. M., and Merrill, J. T.: Marine boundary layer dust and pollutant transport associated with the passage of a frontal system over eastern Asia, J. Geophys. Res.-Atmos., 109, D19S19, https://doi.org/10.1029/2003JD004094, 2004.
Bellouin, N., Quaas, J., Gryspeerdt, E., Kinne, S., Stier, P., Watson-Parris, D., Boucher, O., Carslaw, K. S., Christensen, M., Daniau, A.-L., Dufresne, J.-L., Feingold, G., Fiedler, S., Forster, P., Gettelman, A., Haywood, J. M., Lohmann, U., Malavelle, F., Mauritsen, T., McCoy, D. T., Myhre, G., Mülmenstädt, J., Neubauer, D., Possner, A., Rugenstein, M., Sato, Y., Schulz, M., Schwartz, S. E., Sourdeval, O., Storelvmo, T., Toll, V., Winker, D., and Stevens, B.: Bounding Global Aerosol Radiative Forcing of Climate Change, Rev. Geophys., 58, e2019RG000660, https://doi.org/10.1029/2019RG000660, 2020.
Boulon, J., Sellegri, K., Hervo, M., and Laj, P.: Observations of nucleation of new particles in a volcanic plume, P. Natl. Acad. Sci. USA, 108, 12223–12226, https://doi.org/10.1073/pnas.1104923108, 2011.
Carslaw, K. S., Lee, L. A., Reddington, C. L., Pringle, K. J., Rap, A., Forster, P. M., Mann, G. W., Spracklen, D. V., Woodhouse, M. T., Regayre, L. A., and Pierce, J. R.: Large contribution of natural aerosols to uncertainty in indirect forcing, Nature, 503, 67–71, https://doi.org/10.1038/nature12674, 2013.
Chen, Y., Haywood, J., Wang, Y., Malavelle, F., Jordan, G., Peace, A., Partridge, D. G., Cho, N., Oreopoulos, L., Grosvenor, D., Field, P., Allan, R. P., and Lohmann, U.: Substantial cooling effect from aerosol-induced increase in tropical marine cloud cover, Nat. Geosci., 17, 404–410, https://doi.org/10.1038/s41561-024-01427-z, 2024.
Coggon, M. M., Sorooshian, A., Wang, Z., Craven, J. S., Metcalf, A. R., Lin, J. J., Nenes, A., Jonsson, H. H., Flagan, R. C., and Seinfeld, J. H.: Observations of continental biogenic impacts on marine aerosol and clouds off the coast of California, J. Geophys. Res.-Atmos., 119, 6724–6748, https://doi.org/10.1002/2013JD021228, 2014.
Dournaux, M., Tulet, P., Pianezze, J., Brioude, J., Metzger, J.-M., Thyssen, M., and Athier, G.: Origin, size distribution, and hygroscopic properties of marine aerosols in the southwestern Indian Ocean: results of six campaigns of shipborne observations, Atmos. Chem. Phys., 25, 10315–10335, https://doi.org/10.5194/acp-25-10315-2025, 2025.
Fan, J., Wang, Y., Rosenfeld, D., and Liu, X.: Review of Aerosol–Cloud Interactions: Mechanisms, Significance, and Challenges, J. Atmos. Sci., 73, 4221–4252, https://doi.org/10.1175/JAS-D-16-0037.1, 2016.
Flores, J. M., Bourdin, G., Altaratz, O., Trainic, M., Lang-Yona, N., Dzimban, E., Steinau, S., Tettich, F., Planes, S., Allemand, D., Agostini, S., Banaigs, B., Boissin, E., Boss, E., Douville, E., Forcioli, D., Furla, P., Galand, P. E., Sullivan, M. B., Gilson, É., Lombard, F., Moulin, C., Pesant, S., Poulain, J., Reynaud, S., Romac, S., Sunagawa, S., Thomas, O. P., Troublé, R., de Vargas, C., Vega Thurber, R., Voolstra, C. R., Wincker, P., Zoccola, D., Bowler, C., Gorsky, G., Rudich, Y., Vardi, A., and Koren, I.: Tara Pacific Expedition's Atmospheric Measurements of Marine Aerosols across the Atlantic and Pacific Oceans, B. Am. Meteorol. Soc., 101, E536–E554, https://doi.org/10.1175/BAMS-D-18-0224.1, 2020.
Forster, P., Storelvmo, T., Armour, K., Collins, W., Dufresne, J.-L., Frame, D., Lunt, D. J., Mauritsen, T., Palmer, M. D., Watanabe, M., Wild, M., and Zhang, H.: The Earth's Energy Budget, Climate Feedbacks, and Climate Sensitivity, in: Climate Change 2021: The Physical Science Basis, Contribution of Working Group I to the Sixth Assessment Report of the Intergovernmental Panel on Climate Change, edited by: Masson-Delmotte, V., Zhai, P., Pirani, A., Connors, S. L., Péan, C., Berger, S., Caud, N., Chen, Y., Goldfarb, L., Gomis, M. I., Huang, M., Leitzell, K., Lonnoy, E., Matthews, J. B. R., Maycock, T. K., Waterfield, T., Yelekçi, O., Yu, R., and Zhou, B., Cambridge University Press, Cambridge, UK and New York, NY, USA, 923–1054, https://doi.org/10.1017/9781009157896.009, 2021.
Gao, Y., Zhang, D., Wang, J., Gao, H., and Yao, X.: Variations in Ncn and Nccn over marginal seas in China related to marine traffic emissions, new particle formation and aerosol aging, Atmos. Chem. Phys., 20, 9665–9677, https://doi.org/10.5194/acp-20-9665-2020, 2020.
Gaston, C. J., Cahill, J. F., Collins, D. B., Suski, K. J., Ge, J. Y., Barkley, A. E., and Prather, K. A.: The Cloud Nucleating Properties and Mixing State of Marine Aerosols Sampled along the Southern California Coast, Atmosphere-Basel, 9, 52, https://doi.org/10.3390/atmos9020052, 2018.
Geng, X., Haig, J., Lin, B., Tian, C., Zhu, S., Cheng, Z., Yuan, Y., Zhang, Y., Liu, J., Zheng, M., Li, J., Zhong, G., Zhao, S., Bird, M. I., and Zhang, G.: Provenance of Aerosol Black Carbon over Northeast Indian Ocean and South China Sea and Implications for Oceanic Black Carbon Cycling, Environ. Sci. Technol., 57, 13067–13078, https://doi.org/10.1021/acs.est.3c03481, 2023.
Gong, J., Zhu, Y., Chen, D., Gao, H., Shen, Y., Gao, Y., and Yao, X.: The occurrence of lower-than-expected bulk NCCN values over the marginal seas of China – Implications for competitive activation of marine aerosols, Sci. Total Environ., 858, 159938, https://doi.org/10.1016/j.scitotenv.2022.159938, 2023.
Hersbach, H., Bell, B., Berrisford, P., Biavati, G., Horányi, A., Muñoz-Sabater, J., Nicolas, J., Peubey, C., Radu, R., Rozum, I., Schepers, D., Simmons, A., Soci, C., Dee, D., and Thépaut, J.-N.: ERA5 hourly data on single levels from 1940 to present, Copernicus Climate Change Service (C3S) Climate Data Store (CDS) [data set], https://doi.org/10.24381/cds.adbb2d47, 2023.
Hudson, J. G. and Yum, S. S.: Cloud condensation nuclei spectra and polluted and clean clouds over the Indian Ocean, J. Geophys. Res.-Atmos., 107, 8022, https://doi.org/10.1029/2001JD000829, 2002.
Ji, Q. and Shaw, G. E.: On supersaturation spectrum and size distributions of cloud condensation nuclei, Geophys. Res. Lett., 25, 1903–1906, https://doi.org/10.1029/98GL01404, 1998.
King, S. M., Butcher, A. C., Rosenoern, T., Coz, E., Lieke, K. I., de Leeuw, G., Nilsson, E. D., and Bilde, M.: Investigating Primary Marine Aerosol Properties: CCN Activity of Sea Salt and Mixed Inorganic-Organic Particles, Environ. Sci. Technol., 46, 10405–10412, https://doi.org/10.1021/es300574u, 2012.
Kompalli, S. K., Nair, V. S., Jayachandran, V., Gogoi, M. M., and Babu, S. S.: Particle number size distributions and new particle formation events over the northern Indian Ocean during continental outflow, Atmos. Environ., 238, 117719, https://doi.org/10.1016/j.atmosenv.2020.117719, 2020.
Martin, M., Chang, R. Y.-W., Sierau, B., Sjogren, S., Swietlicki, E., Abbatt, J. P. D., Leck, C., and Lohmann, U.: Cloud condensation nuclei closure study on summer arctic aerosol, Atmos. Chem. Phys., 11, 11335–11350, https://doi.org/10.5194/acp-11-11335-2011, 2011.
McFiggans, G., Artaxo, P., Baltensperger, U., Coe, H., Facchini, M. C., Feingold, G., Fuzzi, S., Gysel, M., Laaksonen, A., Lohmann, U., Mentel, T. F., Murphy, D. M., O'Dowd, C. D., Snider, J. R., and Weingartner, E.: The effect of physical and chemical aerosol properties on warm cloud droplet activation, Atmos. Chem. Phys., 6, 2593–2649, https://doi.org/10.5194/acp-6-2593-2006, 2006.
Modini, R. L., Frossard, A. A., Ahlm, L., Russell, L. M., Corrigan, C. E., Roberts, G. C., Hawkins, L. N., Schroder, J. C., Bertram, A. K., Zhao, R., Lee, A. K. Y., Abbatt, J. P. D., Lin, J., Nenes, A., Wang, Z., Wonaschütz, A., Sorooshian, A., Noone, K. J., Jonsson, H., Seinfeld, J. H., Toom-Sauntry, D., Macdonald, A. M., and Leaitch, W. R.: Primary marine aerosol-cloud interactions off the coast of California, J. Geophys. Res.-Atmos., 120, 42824303, https://doi.org/10.1002/2014JD022963, 2015.
Nair, V. S., Jayachandran, V. N., Kompalli, S. K., Gogoi, M. M., and Babu, S. S.: Cloud condensation nuclei properties of South Asian outflow over the northern Indian Ocean during winter, Atmos. Chem. Phys., 20, 3135–3149, https://doi.org/10.5194/acp-20-3135-2020, 2020.
Nair, V. S., Ajith, T. C., Jayachandran, V. N., Kompalli, S. K., Gogoi, M. M., and Babu, S. S.: Effects of South Asian outflow on aerosol hygroscopicity and cloud droplet activation over the northern Indian Ocean, Atmos. Environ., 327, 120500, https://doi.org/10.1016/j.atmosenv.2024.120500, 2024.
Ou, H., Cai, M., Zhang, Y., Ni, X., Liang, B., Sun, Q., Mai, S., Sun, C., Zhou, S., Wang, H., Sun, J., and Zhao, J.: Measurement report: Cloud condensation nuclei (CCN) activity in the South China Sea from shipborne observations during the summer and winter of 2021 – seasonal variation and anthropogenic influence, Atmos. Chem. Phys., 25, 2495–2513, https://doi.org/10.5194/acp-25-2495-2025, 2025.
Park, J., Dall'Osto, M., Park, K., Gim, Y., Kang, H. J., Jang, E., Park, K.-T., Park, M., Yum, S. S., Jung, J., Lee, B. Y., and Yoon, Y. J.: Shipborne observations reveal contrasting Arctic marine, Arctic terrestrial and Pacific marine aerosol properties, Atmos. Chem. Phys., 20, 5573–5590, https://doi.org/10.5194/acp-20-5573-2020, 2020.
Park, K.-T., Yoon, Y. J., Lee, K., Tunved, P., Krejci, R., Ström, J., Jang, E., Kang, H. J., Jang, S., Park, J., Lee, B. Y., Traversi, R., Becagli, S., and Hermansen, O.: Dimethyl Sulfide-Induced Increase in Cloud Condensation Nuclei in the Arctic Atmosphere, Global Biogeochem. Cy., 35, e2021GB006969, https://doi.org/10.1029/2021GB006969, 2021.
Petters, M. D. and Kreidenweis, S. M.: A single parameter representation of hygroscopic growth and cloud condensation nucleus activity, Atmos. Chem. Phys., 7, 1961–1971, https://doi.org/10.5194/acp-7-1961-2007, 2007.
Sanchez, K. J., Chen, C.-L., Russell, L. M., Betha, R., Liu, J., Price, D. J., Massoli, P., Ziemba, L. D., Crosbie, E. C., Moore, R. H., Müller, M., Schiller, S. A., Wisthaler, A., Lee, A. K. Y., Quinn, P. K., Bates, T. S., Porter, J., Bell, T. G., Saltzman, E. S., Vaillancourt, R. D., and Behrenfeld, M. J.: Substantial Seasonal Contribution of Observed Biogenic Sulfate Particles to Cloud Condensation Nuclei, Sci. Rep.-UK, 8, 3235, https://doi.org/10.1038/s41598-018-21590-9, 2018.
Sanchez, K. J., Roberts, G. C., Saliba, G., Russell, L. M., Twohy, C., Reeves, J. M., Humphries, R. S., Keywood, M. D., Ward, J. P., and McRobert, I. M.: Measurement report: Cloud processes and the transport of biological emissions affect southern ocean particle and cloud condensation nuclei concentrations, Atmos. Chem. Phys., 21, 3427–3446, https://doi.org/10.5194/acp-21-3427-2021, 2021.
Saputra, H., Maimun, A., and Koto, J.: Estimation and Distribution of Exhaust Ship Emission from Marine Traffic in the Straits of Malacca and Singapore using Automatic Identification System (AIS) Data, J. Mek., 36, 86–104, 2013.
Seinfeld, J. H. and Pandis, S. N.: Atmospheric Chemistry and Physics: From Air Pollution to Climate Change, 3rd edn., John Wiley & Sons, Hoboken, NJ, USA, ISBN: 978-1-118-94740-1, 2016.
Stein, A. F., Draxler, R. R., Rolph, G. D., Stunder, B. J. B., Cohen, M. D., and Ngan, F.: NOAA's HYSPLIT Atmospheric Transport and Dispersion Modeling System, B. Am. Meteorol. Soc., 96, 2059–2077, https://doi.org/10.1175/BAMS-D-14-00110.1, 2015.
Tatzelt, C., Henning, S., Welti, A., Baccarini, A., Hartmann, M., Gysel-Beer, M., van Pinxteren, M., Modini, R. L., Schmale, J., and Stratmann, F.: Circum-Antarctic abundance and properties of CCN and INPs, Atmos. Chem. Phys., 22, 9721–9745, https://doi.org/10.5194/acp-22-9721-2022, 2022.
Twigg, M. M., Ilyinskaya, E., Beccaceci, S., Green, D. C., Jones, M. R., Langford, B., Leeson, S. R., Lingard, J. J. N., Pereira, G. M., Carter, H., Poskitt, J., Richter, A., Ritchie, S., Simmons, I., Smith, R. I., Tang, Y. S., Van Dijk, N., Vincent, K., Nemitz, E., Vieno, M., and Braban, C. F.: Impacts of the 2014–2015 Holuhraun eruption on the UK atmosphere, Atmos. Chem. Phys., 16, 11415–11431, https://doi.org/10.5194/acp-16-11415-2016, 2016.
Twomey, S.: The nuclei of natural cloud formation part II: The supersaturation in natural clouds and the variation of cloud droplet concentration, Geofis. Pura Appl., 43, 243–249, https://doi.org/10.1007/BF01993560, 1959.
Twomey, S.: Pollution and the planetary albedo, Atmos. Environ., 8, 1251–1256, https://doi.org/10.1016/0004-6981(74)90004-3, 1974.
Ueda, S., Miura, K., Kawata, R., Furutani, H., Uematsu, M., Omori, Y., and Tanimoto, H.: Number-size distribution of aerosol particles and new particle formation events in tropical and subtropical Pacific Oceans, Atmos. Environ., 142, 324–339, https://doi.org/10.1016/j.atmosenv.2016.07.055, 2016.
Wang, J., Cubison, M. J., Aiken, A. C., Jimenez, J. L., and Collins, D. R.: The importance of aerosol mixing state and size-resolved composition on CCN concentration and the variation of the importance with atmospheric aging of aerosols, Atmos. Chem. Phys., 10, 7267–7283, https://doi.org/10.5194/acp-10-7267-2010, 2010.
Wood, R., Wyant, M., Bretherton, C. S., Rémillard, J., Kollias, P., Fletcher, J., Stemmler, J., de Szoeke, S., Yuter, S., Miller, M., Mechem, D., Tselioudis, G., Chiu, J. C., Mann, J. A. L., O'Connor, E. J., Hogan, R. J., Dong, X., Miller, M., Ghate, V., Jefferson, A., Min, Q., Minnis, P., Palikonda, R., Albrecht, B., Luke, E., Hannay, C., and Lin, Y.: Clouds, Aerosols, and Precipitation in the Marine Boundary Layer: An ARM Mobile Facility Deployment, B. Am. Meteorol. Soc., 96, 419–440, https://doi.org/10.1175/BAMS-D-13-00180.1, 2015.