
the Creative Commons Attribution 4.0 License.
the Creative Commons Attribution 4.0 License.
 | 14 Jul 2026
Pollution transport and transformation over the Po Plain as revealed by airborne and ground-based measurements in July 2017 during EMeRGe
Costanza Civale
Maria Dolores Andrés Hernández
Jean-Philippe Putaud
Francesca Barnaba
Henri Diémoz
Johannes Schneider
Helmut Ziereis
Katharina Kaiser
Jörg Schmidt
Ovid Oktavian Krüger
Bruna Holanda
Robert Baumann
Benjamin Weyland
Eric Förster
Midhun George
Yangzhuoran Liu
Daniel Sauer
Jennifer Wolf
Annachiara Bellini
Birger Bohn
Klaus Pfeilsticker
John Philip Burrows
Airborne measurements provide valuable information about the vertical distribution of pollutants enabling the complex transport and dispersion pathways within and above the boundary layer (BL) to be investigated. In this study, the transport of pollution within the Po Plain, a major atmospheric pollution hotspot in Europe, was explored by exploiting airborne measurements made within the EMeRGe (Effect of Megacities on the transport and transformation of pollutants on the Regional to Global scales) project in combination with in situ and ground-based remote-sensing measurements over the whole Po basin. The analysis considers three areas where pollution, emission and mixing are dominated by different processes: the Gulf of Venice to the east, the central part of the Po Plain, and the Gulf of Genoa to the west. Wind fields and backward trajectories during the days of the flights indicate the impact of the sea and mountain breezes on the BL distribution of pollutants, and of synoptic scale transport above it. Overall, the extensive data set of primary and secondary trace gases and aerosols at different altitudes provides insight into the effect of vertical and horizontal dynamical mixing on the chemical processing of pollutants within the BL. In this context, mixing of pollution plumes during stagnant conditions within the BL, stratification, venting and export of pollutants towards the Adriatic coast were observed. In addition, desert dust layers of Saharan origin at different altitudes confirm the mixing of naturally occurring dust and its impact on air quality of the lowermost atmosphere over the Po Plain.
- Article
(10492 KB) - Full-text XML
-
Supplement
(4824 KB) - BibTeX
- EndNote


The Po Plain is the most densely populated area of Italy (Castaldini et al., 2019; Finardi et al., 2014) and its most important industrial and agricultural region. It includes the administrative districts of Piedmont, Lombardy, Emilia-Romagna, Veneto, and Friuli Venezia Giulia, which comprise the urban agglomerations of Turin, Milan, Bologna, and Venice. With a population of approximately 20 million people (Annuario statistico Italiano, ISTAT, 2022) and an average population density of 450 inhabitants km−2 (Castaldini et al., 2019; see also Sect. S1 in the Supplement), the Po Plain is one of the European major population centres (MPC) (see https://ineris.hal.science/ineris-00973562v1, last access: 5 October 2025; Molina and Molina, 2004; Gurjar and Lelieveld, 2005; CityZen, 2011; Butler et al., 2012). The Po Plain is located in the north of Italy, and borders France, Switzerland, Austria, and Slovenia. It is bounded by the Alps to the north and west, by the Apennines to the south, which separates the plain from the Gulf of Genoa and the Ligurian Sea, and by the Gulf of Venice and the Adriatic Sea to the east (see Fig. 1). The topography of the area leads to a limited dispersion of air masses to the northern, western, and southern sides of the Po Plain, although regular pollution transport from the valley to the pre-alpine and alpine areas via a daily mountain-breeze circulation has been documented (Tampieri et al., 1981; Diémoz et al., 2019a, b). Overall, weak winds and intense solar radiation particularly in summer dominate the meteorological conditions in the Po Plain (e.g., Finardi and Pellegrini, 2004; Raffaelli et al., 2020). Frequent anticyclones cause subsidence of warm air in the mid-troposphere and the development of a stable temperature inversion that traps air pollutants in the boundary layer (BL) (e.g., Finardi and Pellegrini, 2004), leading to pollution episodes in both winter and summer months (e.g., Baklanov et al., 2010; Finardi et al., 2014; Gonzalez Ortiz et al., 2019; Raffaelli et al., 2020). The high emission rates of pollutants from human activities e.g., industry, transport, domestic heating, use of air conditioning and agriculture (for the main emission sources see Sect. S2) combined with the topography of the area make the Po Plain one of the most polluted regions in Europe (e.g., Folberth et al., 2012; Gonzalez Ortiz et al., 2020; Targa et al., 2024).
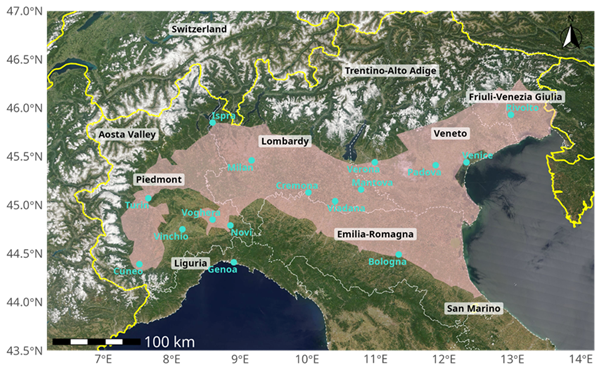
Figure 1Northern Italy and relevant administrative regions (from west to east) of: Liguria, Piedmont, Lombardy, Emilia-Romagna, Veneto, and Friuli-Venezia Giulia. The Po Plain is highlighted in brown. The Alpine range surrounds the Po Plain on the north and west, and the Apennines in the southwest. Source: MODIS/Terra background from https://worldview.earthdata.nasa.gov (last access: 19 June 2017).
Thermally- and pressure-driven circulation systems between mountains, plains, and the sea – such as mountain-valley circulation, sea breeze, and topographic venting from the BL to the free troposphere (FT) – cause complex patterns of the distribution of pollution (Henne et al., 2004). For example, pollutants emitted in the coastal areas (e.g., NOx, i.e., the sum of nitrogen monoxide NO and nitrogen dioxide NO2) are transported inland by sea-land breezes with pollutants emitted in the plain flowing towards the mountains, i.e., mountain venting (e.g., Diémoz et al., 2019a). Consequently, the oxidation of primary pollutants leads to the production of ozone (O3) and secondary aerosol along the mountain valleys (Henne et al., 2004; De Wekker et al., 2018). The compensating return circulation aloft subsides when flowing towards the sea, creating a vertical stratification in the upper coastal BL where O3 and aerosols accumulate in the first 1–5 km altitude above the coast and offshore. Reservoirs of pollutants aloft are then subject to transport along the coast or form a pool in the mountain valleys and may partially be entrained into the surface level on the following day when the BL rises because of convection. This day-night circulation pattern usually has a turnover time of 2–3 d, similar to that found on the northeastern coast of Spain (Millán et al., 1997, 2000, 2002; Yus-Díez et al., 2021) and on the eastern and western coasts of Italy (Georgiadis et al., 1994; Nyeki et al., 2002; Finardi et al., 2018). A vertical export of air from the BL to the FT also occurs during venting events (Rotach et al., 2004). As a consequence, NOx-rich air mixes in the FT with the high background concentrations of methane (CH4) and carbon monoxide (CO) which is expected to increase the tropospheric O3 column (Henne et al., 2004, 2005). The meso- or synoptic–scale horizontal mixing of air masses dominates the FT, contributing to the export of locally produced pollutants from the Po Plain to the north and east directions and above the Mediterranean basin. In this manner, the Po Plain pollution can affect the air quality of distant regions when re-entrained inside the BL (Henne et al., 2004; Weissmann et al., 2005; Diémoz et al., 2019a, b).
The atmospheric composition and distribution of pollutants in the Po Plain is constantly and extensively monitored at the surface and aloft by in-situ and remote-sensing observations (e.g., Folberth et al., 2012; Putaud et al., 2014; Ferrero et al., 2019; Gonzalez Ortiz et al., 2020; Bellini et al., 2024). Several studies targeting different pollutants and transport patterns from/to the Po Plain (e.g., Ambrosetti et al., 1998; Wotawa et al., 2000; Stortini et al., 2007; Highwood et al., 2007; Gohm et al., 2009; Barnaba et al., 2007, 2010) have been published. The production and dispersion of pollutants from the Po Plain to the neighbouring regions have also been intensively investigated. Several projects and campaigns have shown the transport of pollution in the Italian Pre-Alps, Alps, the Adriatic Sea, and other Italian regions as well as transboundary transport into neighbouring countries (see Sect. S3).
However, the vertical distribution of pollutants within and above the BL is not sufficiently or adequately known, limiting our knowledge of the complex transport and dispersion pathways in the Po Plain. The information provided by airborne measurements, although snap shots and scarce, is very valuable (e.g., Kaiser et al., 2015). In this context, airborne measurements in the Po Plain were carried out within the project EMeRGe (Effect of Megacities on the transport and transformation of pollutants on the Regional to Global scales) in July 2017 (Andrés Hernández et al., 2022). The objective of the EMeRGe measurement campaigns was to improve the current understanding of the photochemical and heterogeneous processing of pollution outflows from MPCs by exploiting airborne measurements made on board the High Altitude and Long Range Research aircraft (HALO, https://halo-research.de, last access: 5 October 2025).
The present study investigated the transport and transformation of pollutant emissions in the Po Plain by using aircraft-borne and ground-based instrumentation to extend our knowledge of summertime air pollution and the impact of the local meteorology and orography. A key focus was to identify the dominant transport and transformation patterns in the targeted region and to assess the impact of emissions from the diverse range of sources present. To achieve this goal, the EMeRGe airborne measurements of trace gases and aerosol particles in the lower troposphere and BL of the Po Plain were combined with those from relevant surface in situ and ground-based data from air quality measurement sites and research stations operating in July 2017 within the targeted area. Measurements of long-lived and reactive trace gases and particles were used to determine the time required for mixing and to assess boundary layer mixing dynamics.
The investigation explored three key topics:
-
The horizontal distribution of selected pollutants in the BL over such a complex terrain and the effect of mixing on the vertical distribution of pollutants. One focus was to asses the information provided by airborne observations with respect to the BL composition and on the distribution of emissions at the ground.
-
The identification of trans-regional and trans-boundary transport to and from the Po Plain.
-
The performance of dispersion models using CO as a tracer to identify the origin and transport pathways of pollution in a complex topography.
2.1 Observational data
The present investigation exploited a set of airborne and ground-based observations obtained in July 2017 from instrumentation on different platforms having different temporal sampling and spatial resolutions.
2.1.1 Airborne measurements of trace gases, aerosol particles, and meteorological variables
The HALO research aircraft was purchased as a result of a joint initiative of scientists at German universities and environmental and climate research institutions. It is owned and operated by the German Aerospace Centre (Deutsches Zentrum für Luft-und Raumfahrt/Institute of Atmospheric Physics of the German Aerospace Center, DLR). HALO is a Gulfstream G550 business jet modified and specifically equipped for scientific research. During the EMeRGe campaign in Europe, the HALO aircraft performed seven flights for a total of 53 flight hours covering a set of targeted MPCs in western Europe. A list of the in situ and remote-sensing instrumentation on board HALO used for the measurement of trace gases and aerosol particles as well as the basic aircraft data and ancillary measurements, with instrument details in the quoted literature, is provided elsewhere (Andrés Hernández et al., 2022). In the present study, only a subset of the trace gases measured by the HALO aircraft was selected to identify the transport of pollution in the BL. These were carbon monoxide (CO), carbon dioxide (CO2), sulphur dioxide (SO2), nitrogen monoxide (NO), total reactive nitrogen (NOy), O3, acetone (C3H6O), and the total sum of hydroperoxyl (HO2) and the organic peroxy (RO2) radicals which form NO2 in their reaction with NO (defined as RO). Non-refractory nitrate (NO), sulphate (SO), ammonium (NH), total organic aerosol (OA), 44 as a marker for oxidized organic aerosol (OOAm), and refractory black carbon (rBC) in the submicron aerosol fraction, as well as the particle number size distribution (from 10 nm to 2.5 µm) in situ measurements were additionally used for interpretation, in addition to nitrogen dioxide (NO2) and formaldehyde (HCHO) which were measured using an airborne mini-DOAS (Differential Optical Absorption Spectrometer) with a temporal sampling of 1 min. For clear skies the averaging volume of the NO2 mini-DOAS measurements is estimated in the perpendicular flight direction by the field of view of the telescope and in the horizontal by the distance the aircraft travelled during integration (∼ 7 km). The latter ranges between 10 to 25 km near the ground with considerably shorter photon path lengths occurring in the aerosol loaded and cloudy atmosphere. This inherent radiative transfer related averaging may smooth the actual mixing ratios over the observing kernel depending on the location of the pollutant layers with respect to the aircraft (for details, see Hüneke et al., 2017 and Kluge et al., 2020).
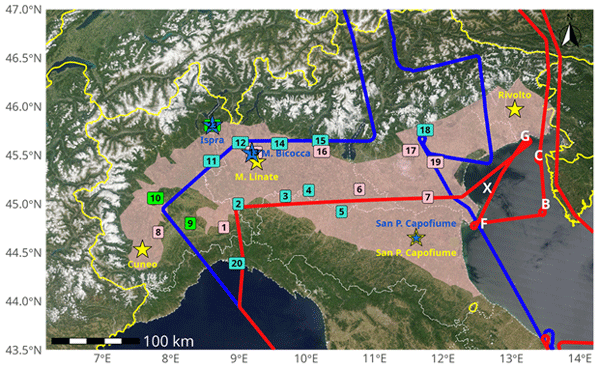
Two EMeRGe flights, E-EU-03 and E-EU-06, were carried out over the same geographical region and targeted specifically the Po Plain on 11 and 20 July 2017, respectively. Initially, HALO flew over the Alps, then along the Po Valley to the Mediterranean coast of Italy crossing the Italian Peninsula from west to east over Rome and then north along the Adriatic coast and crossing the Alps back to the HALO base in Germany (Andrés Hernández et al., 2022). Only the flight tracks that overflew the Po Plain were considered in this study, and are shown in Fig. 2. Letters and numbers are used to indicate the waypoints of the flight tracks (i.e., 6a to 6o for E-EU-06, see Table S2 in the Supplement for full details). The vertical and horizontal distribution of pollutants were investigated by flying at lower altitudes and incorporating shuttles (i.e., descent or ascent flight patterns between holding altitudes) in the tracks.
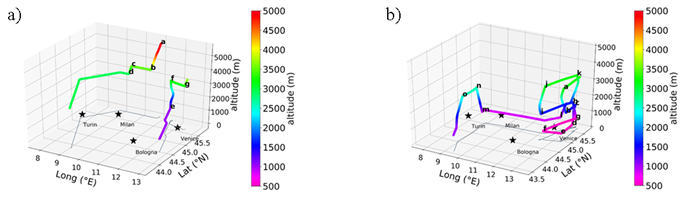
Figure 2Flight tracks from the EMeRGe flights (a) E-EU-03 on 11 July 2017, and (b) E-EU-06 on 20 July. The colour-code refers to flight altitude during the flight tracks considered in this study and the letters indicate the waypoints as mentioned in the text. All altitudes are above sea level (a.s.l.). The 2D flight track is shown in grey on the xy plane, main cities in the area are also reported (black stars) to facilitate geo-reference and comparison with Fig. 1.
2.1.2 In situ surface and ground-based remote sensing measurements
In Italy, air quality is monitored at the regional level by the local Environmental Protection Regional Agencies (ARPAs) measuring EU-legislated pollutants and meteorological variables in air quality networks (see Sects. S5 and S6). In this work, the hourly resolved data from ARPA traffic and background air quality monitoring network (AQMN) stations located in the proximity to the HALO flight tracks in the regions of Piedmont, Lombardy, Veneto, and Liguria were used (see Fig. 3). In addition, trace gas measurements of high accuracy and 10 min temporal sampling were provided by the regional background atmospheric observatory of the European Commission's Joint Research Centre (EC-JRC) in Ispra (https://abc-is.jrc.ec.europa.eu/, last access: 5 October 2025).
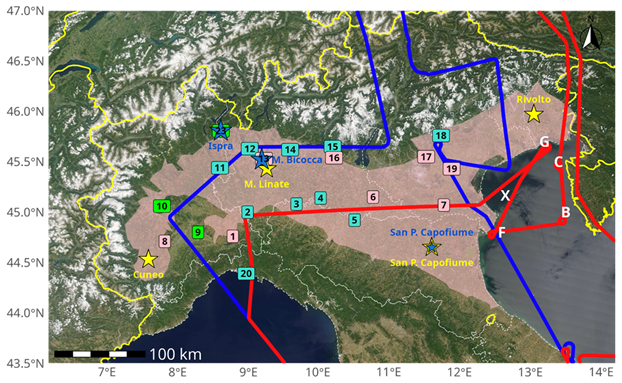
Figure 3Data sources used in this study, covering the whole area of the Po Plain: E-EU-03 (blue) and E-EU-06 (red) HALO flight tracks; AQMN traffic (pink squares), urban background (turquoise squares) and regional background (green squares) stations are identified by the station number (tabulated in the Supplement, Table S3); radiosonde stations (yellow stars) and LiDAR/ALC stations (blue stars). Geographical points indicated by white capital letters are used in the discussion of the E-EU-06 track (see Sect. 3). Map source: MODIS/Terra background from https://worldview.earthdata.nasa.gov (last access: 19 June 2017).
Aerosol profiles from selected ground-based active remote-sensing stations were used in support of the analysis (see Sect. S7). These were obtained by an aerosol LiDAR (Light Detection and Ranging) operating in Ispra in association with ACTRIS (Aerosol, Clouds and Trace gases Research Infrastructure, https://www.actris.eu, last access: 5 October 2025), and by an automated LiDAR-ceilometer (ALC) operating in Milan as part of ALICENET (Italian Automated LIdar-CEliometer NETwork, https://www.alice-net.eu, last access: 5 October 2025, Bellini et al., 2024). Both LiDAR and ALC profiles of the particle backscatter coefficient (βp) provided information about the presence of different aerosol stratifications within the BL and in the FT (see Fig. 3 for instrument location). In Ispra, profiles of the particle depolarisation ratio (δp) at specific measurement times were used to identify the presence of desert dust (particles of non-spherical shapes) within some specific aerosol layers (Wandinger, 2005), while high temporal sampling and continuous ALC profiles enabled the diurnal variability of the aerosol structures to be identified and the relevant diurnal evolution of the Mixed Aerosol Layer (MAL) to be inferred (in cloud-free conditions only) following the approach described in Bellini et al. (2024).
2.1.3 Meteorological soundings
The radiosonde stations selected for this study were Cuneo Levaldigi, Milano Linate, and Rivolto (see Fig. 3). For the determination of the height of the BL, two different methods were applied to the radiosonde in situ measurements of temperature (T), potential temperature (O) and relative humidity (RH) at 12:00 UTC on the days of flight. In the parcel method, the BL height is either defined as the elevation at which an ascending air parcel becomes neutrally buoyant (Hennemuth and Lammert, 2006) or to which an air parcel with surface temperature rises adiabatically from the ground by convection (Collaud Coen et al., 2014). The height of the BL is calculated as the intersection between the temperature profile and the dry adiabatic lapse rate starting at near-surface temperature (Seibert et al., 2000; Collaud Coen et al., 2014). In contrast, the gradient method defines the BL height as the height where the gradient of O is maximum (T gradient method), corresponding to the top of the capping inversion, or where the gradient of the RH is minimum or zero (RH gradient method), associated with a reduction in water vapour content (Hennemuth and Lammert, 2006; Wang and Wang, 2014). Among the methods applied to the radiosonde profiles to estimate the BL, the parcel method is considered the most reliable, but it has proven to fail when applied to a stable BL over land or sea. A cloud-topped BL is also hardly identifiable because of the complex structure associated with cloud layers (Seibert et al., 2000; Hennemuth and Lammert, 2006). Despite the limitations of single radiosonde profiles to describe the changes in space and time of the vertical structure of the atmosphere and to identify the limits of the BL in the presence of cloud layers (e.g., Seibert et al., 2000; Hennemuth and Lammert, 2006; Helbig et al., 2021), both methods agreed reasonably well for measurements made on the days studied.
2.2 Modelled estimation of transport patterns of pollution
The data interpretation and the estimation of pollution transport patterns during the E-EU-03 and E-EU-06 flights rely on the prevailing meteorological conditions before and during the measurements to determine the origin of the air masses probed. Following model-based tools were used:
- a.
FLEXTRA: backward trajectories.
The FLEXTRA backward-trajectories provided for EMeRGe were calculated with the FLEXTRA 5.0 trajectory model (see Stohl et al., 1995; Stohl and Wotawa, 1995; https://folk.nilu.no/~andreas/flextra.html, last access: 5 October 2019), using the European Centre for Medium-Range Weather Forecast (ECMWF, https://www.ecmwf.int/, last access: 5 October 2019) operational data set ERA5 meteorological data (see Hersbach et al., 2020) at 0.25° horizontal resolution (around 27.8 km). Trajectories were initialised every minute of the flight time and cover the trajectory over the 10 d prior to the locations.
- b.
COSMO: high resolution wind fields.
The COSMO-Model (Consortium for Small-scale Modeling, http://www.cosmo-model.org, last access: 6 April 2026), which offers a factor 10 higher spatial resolution than ERA5, was additionally employed in this study to ensure an accurate analysis of transport dynamics on the mesoscale, such as the valley-mountain breeze. COSMO is a non-hydrostatic, fully compressible, limited-area atmospheric prediction model. It is based on thermo-hydrodynamical equations for compressible flow in a moist atmosphere, formulated in rotated geographical coordinates and a generalised terrain following height coordinates. The data used by COSMO were provided for the period under investigation by the meteorological operational centre – air force meteorological service COMET. The present study considers the high-resolution version COSMO-I2 or COSMO-IT (2.8 km grid cells and 65 vertical levels) in its numerical weather prediction declination for the assessment of the wind field in the Po Plain area. Notably, as complete 3D fields (surface and vertical profiles) are released at 6 h intervals, the wind fields simulated at 09:00 and 12:00 UTC on 11 and 20 July were used, with altitude steps of 200 m between ground level and 2000 m. The origin of air masses is assessed in combination with the Lagrangian tool LAGRANTO (Sprenger and Wernli, 2015) integrating the COSMO wind fields and tracing 3D backward-trajectories for air masses. For this study, 12 h backward-trajectories were computed with a time step of 15 min, starting from the aircraft coordinates.
- c.
HYSPLIT: CO enhancements during transport.
The Lagrangian Particle Dispersion Model HYSPLIT (Draxler and Hess, 1997 (revised 2014); Stein et al., 2016) calculates the atmospheric dispersion of local emissions of CO, accumulated over 6 d of transport. HYSPLIT forward dispersion simulations (Marenco et al., 2006; Birmili et al., 2010) were used to estimate the contribution of CO emissions within the Po Plain (44–46° N, 7.5–13.5° E) at the time and place of the CO measurements aboard HALO, as well as the ages of the emissions. The forecast assumes the Po Plain to be a continuous emission source. The HYSPLIT simulated CO concentrations do not include accumulated “background” values due to the much longer lifetime of CO and are therefore not to be compared with absolute concentrations but rather with CO enhancements (i.e., ΔCO) in local plumes. HYSPLIT was driven by meteorological data from the operational ECMWF forecast (0–11 h forecast, 12-hourly update, interpolated at 0.1° horizontally, pressure levels, 1-hourly output). CO emission rates were taken from the EDGAR HTAP V2 emission inventory (http://edgar.jrc.ec.europa.eu/dataset_htap_v2, last access: 5 October 2018). Neither chemical reactions nor convection are modelled. The computation (core-model) and the visualisation (post-processing) were controlled by a specific client-server infrastructure developed at the Institute of Atmospheric Physics of the DLR for campaign support as well as post-campaign analysis.
2.3 Analysis approach using pollutant distribution and gradients within the BL during E-EU-06
The airborne trace gas and aerosol particle concentrations were analysed in three selected areas of the Po Plain (see Fig. 5) during the E-EU-06 flight to assess vertical gradients and the degree of mixing in the BL. Information about the vertical distribution of pollutants at the time of the flight was provided by measurements at different altitudes during the HALO shuttles.
Increases in the airborne mixing ratios of NOy, O3, and CO as well as in rBC and particulate nitrate concentrations inside the BL were attributed to HALO flying through plumes of pollution. Short-term variations in the relative concentrations of trace gases provided additional information about the origin and chemical transformation of the plumes during transport. In particular, the HCHO to NO2 ratio is an indicator of the sensitivity of O3 photochemical formation to NOx and VOC concentrations in the atmosphere. HCHO is an intermediate formed in the oxidation of most VOC and is often used as a proxy for the total VOC reactivity (Sillman, 1995). The HO2 formed by HCHO photolysis increases the rate of catalytic cycling of NO to NO2. A < 1 indicates a VOC-limited regime while a > 4 indicates a NOx-limited regime (e.g., Schroeder et al., 2017; Souri et al., 2020; Hong et al., 2021; Vazquez Santiago et al., 2024). Ratios between secondary and primary pollutants (, , , ) were used as indicators of pollution plume chemical processing.
The effective mixing of freshly emitted and aged pollution was evaluated from HYSPLIT CO dispersion simulations. The CO enhancement provided by HYSPLIT (ΔCO) was used as an indicator of the contribution of CO emissions within the Po Valley as well as of the age of the air masses mixed before the CO measurement point. This information was complemented by FLEXTRA back-trajectories and COSMO wind fields for identifying the origin and potential sources of pollution of the air masses probed on-board HALO. The comparability of FLEXTRA and LAGRANTO back-trajectories is discussed in Sect. 3.3.
3.1 Boundary layer meteorology during flights E-EU-03 and E-EU-06
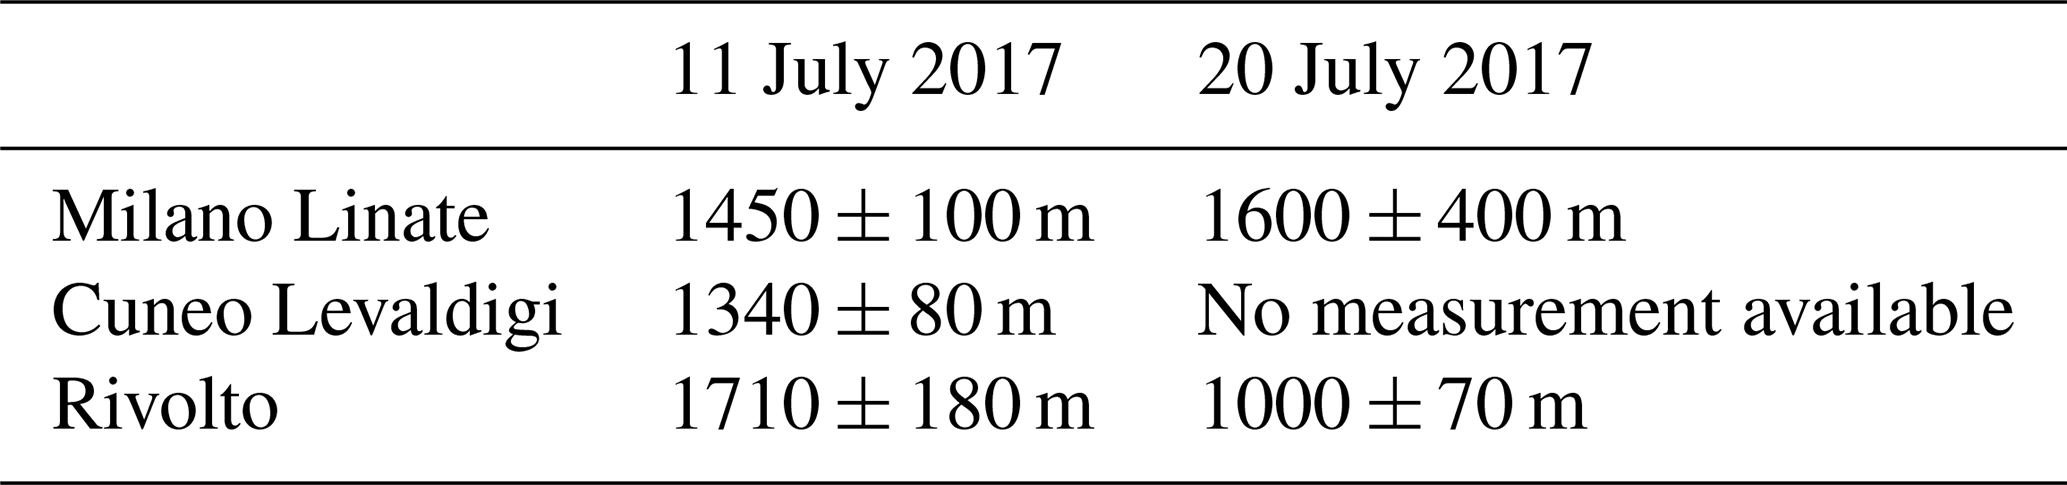
A main focus of the analysis is on the distribution of pollutants within the BL of the Po Plain. For this, the BL height was calculated from the air parcel and gradient methods applied to the radiosonde measurements in each station (see Table 1). Due to the presence of clouds, the RH gradient method underestimated the BL depth on 20 July and was thus not used for the BL estimate. The BL height values obtained in Table 1 are consistent with the available ground-based aerosol profile measurements.
According to the weather reports provided by the corresponding ARPAs, the weather was unstable on 11 July because of the passage of a low-pressure system, which came from Great Britain in the NW. The on-board measured photolysis frequency was used as a qualitative proxy metric for cloudiness during the flights while the vertical wind speed measured by HALO at the flight altitude was taken at comparable altitudes as an indicator of vertical transport within the BL (Fig. 4).
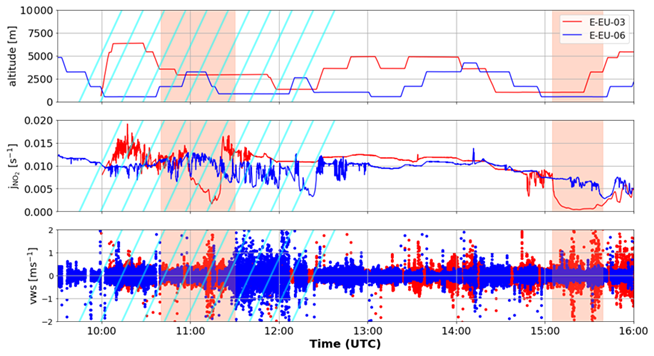
Figure 4Photolysis frequency (), flight altitude and vertical wind speed (vws) measured during the E-EU-03 flights (red) and the E-EU-06 flight (blue). The periods of the two flights above the Po Plain are shaded in coral and striped in cyan, respectively.
Table 1Average BL height at 12:00 UTC as estimated by using the parcel, the temperature gradient, and the relative humidity methods to the radiosonde measurements in Milano Linate, Cuneo Levaldigi, and Rivolto on the 11 and 20 of July. On 11 July the values are derived from the average of the three methods described in the Sect. 2.1 while the parcel and temperature gradient methods are used for the 20 July. The uncertainty on the values is the maximum error ((max value − min value)2).
As expected, the measured was lower when the E-EU-03 flight approached regions of unstable weather and turbulence in the surroundings of Cuneo (11:00–11:50 UTC) and Padova (from 15:15 UTC onward). This instability may have favoured the vertical dilution of emitted pollution in comparison to the 20 July, when anticyclonic conditions stabilized the atmosphere. During the E-EU-06, a pronounced variability was observed during passage through a cloud-covered sky south of Milan (around 12:00 UTC). In that case, in the lowermost levels flown by HALO (830–840 m approximately), the vertical wind speed (vws) and its variability were higher over the central Po Plain (−2 to +4 m s−1, 1 s values, time range 11:25–12:07 UTC) with respect to that observed above the sea over both the Gulf of Venice and the Gulf of Genoa (vws < 1 m s−1).
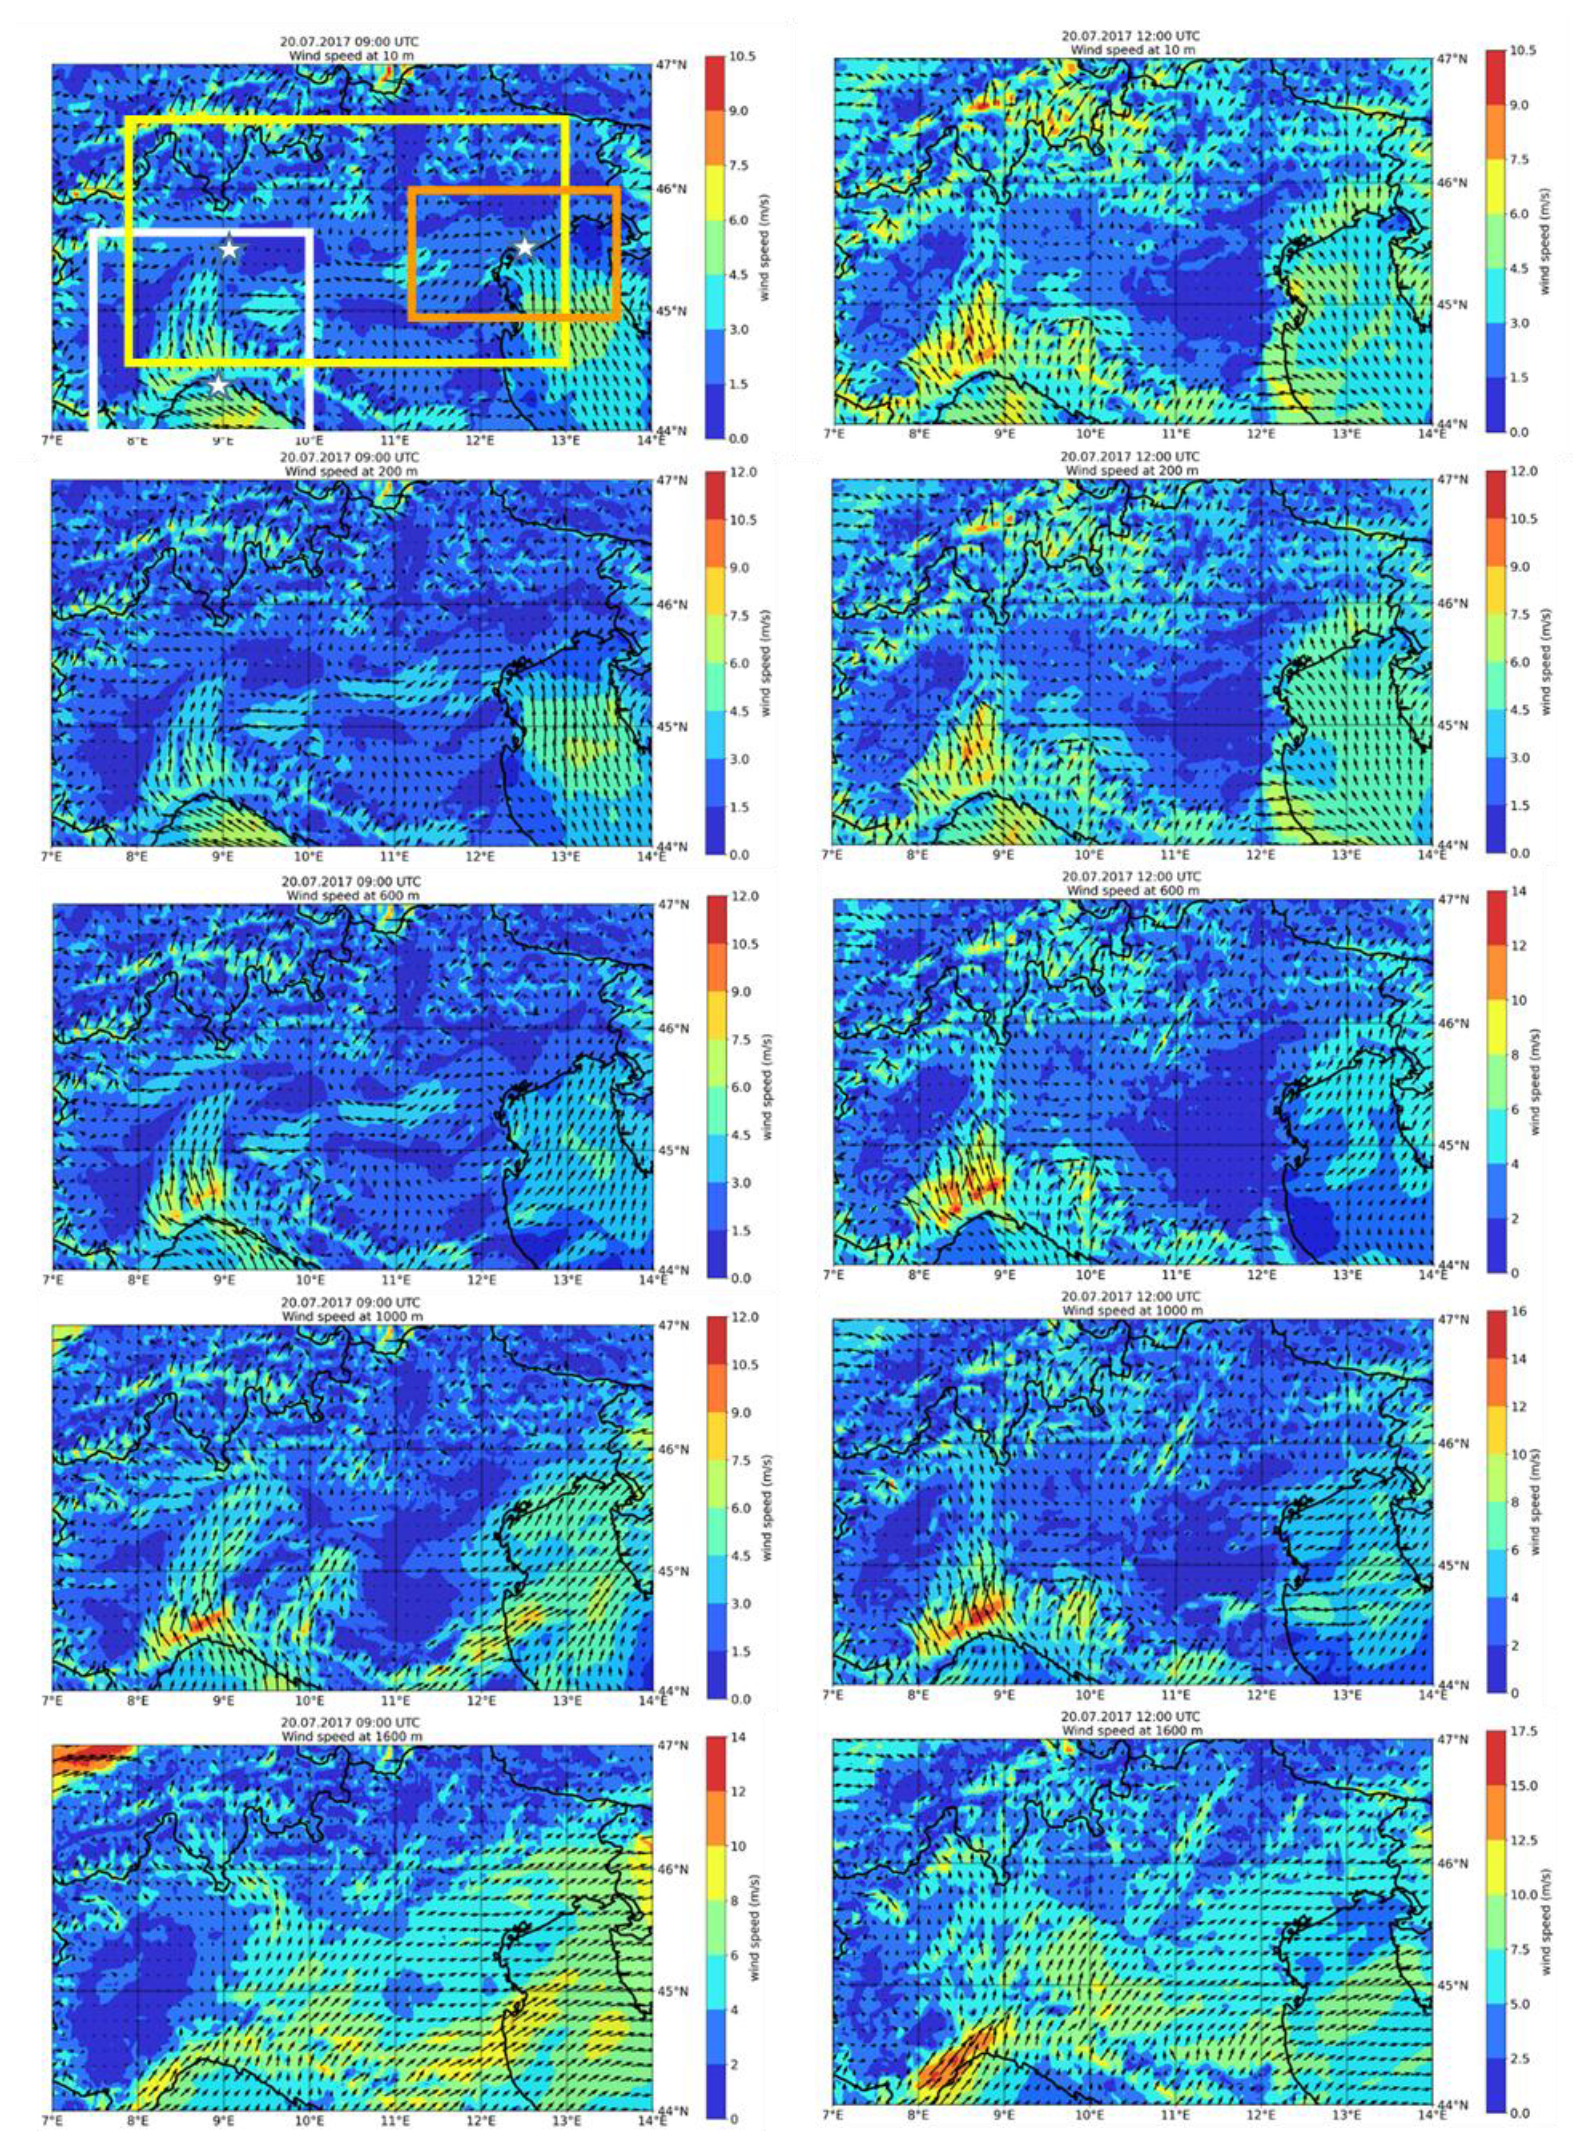
Figure 5Wind speed and direction from 10 m (top) to 1600 m (bottom) altitude above ground level (a.g.l.) simulated by COSMO on 20 July 2017 at 09:00 UTC (left) and 12:00 UTC (right) in Northern Italy. Boxes in the top left panel indicate the three geographical areas selected for this study: the Gulf of Venice (GV, orange), the Gulf of Genoa (GG, white) and the central Po Plain (CPP, yellow). Sea-land circulation dominates on the ground in the coastal areas and reverses in the GV from about 600 m. Please note the changes in the scale of the wind speed. White stars indicate the position of Genoa, Milan and Venice (from left to right).
In Fig. 5, the wind fields calculated by COSMO for the 20 July at 09:00 and 12:00 UTC provide evidence for the complex thermally and orographically driven air transport patterns over the Po Plain (see Sect. S10, Fig. S4 in the Supplement for the 11 July E-EU-03 flight). Inside the BL (<1000 m altitude), sea breeze regimes were observed, with stronger winds increasing with altitude over the Gulf of Genoa coastline (43.5–45° N; 8–10° E) and sea to land circulation up to approximately 600 m altitude over the Gulf of Venice coastline at the east (44–46° N; 12–14° E). In the upper layers of the BL (ca. 800–1000 m), an inland-bound breeze flows from the west coast to the mountains (8–10° E, 46° N) at 09:00 UTC and is still visible with slight changes in intensity and wind direction at 12:00 UTC. In the FT, the model computed eastwards to north-eastwards air transport following the dominant pattern previously observed over the Po Plain (Finardi et al., 2014 and Diémoz et al., 2019a, b), revealing a strong wind shear between ∼ 1000 and 1600 m a.s.l.
As HALO remained during the E-EU-03 above the BL except for the last flight tracks late in the afternoon, further data analysis will focus on E-EU-06, which remained mostly in the BL between 10:00 and 12:10 UTC. The investigated region was divided into three geographical partly overlapping areas (see Fig. 5 top left) marked by different mixing regimes: the two coastal areas of the Gulf of Venice (44.5–46° N; 11.5–13.5° E) and the Gulf of Genoa (43.5–45.5° N; 7.5–10° E), and the central part of the Po Plain (44.5–46.5° N; 8–13° E). These areas of study will hereafter be referred to as GV, GG, and CPP, respectively.
3.2 Vertical distribution and advection of pollutants in the Gulf of Venice (GV)
Figure 6 shows the spatial variation of NO, NOy, NO2, O3, CO, HCHO, C3H6O, SO2, RO, CO2 mixing ratios, and rBC, OA, NO, NH, and SO mass concentrations measured on board HALO over the GV during the EMeRGe E-EU-06 flight.
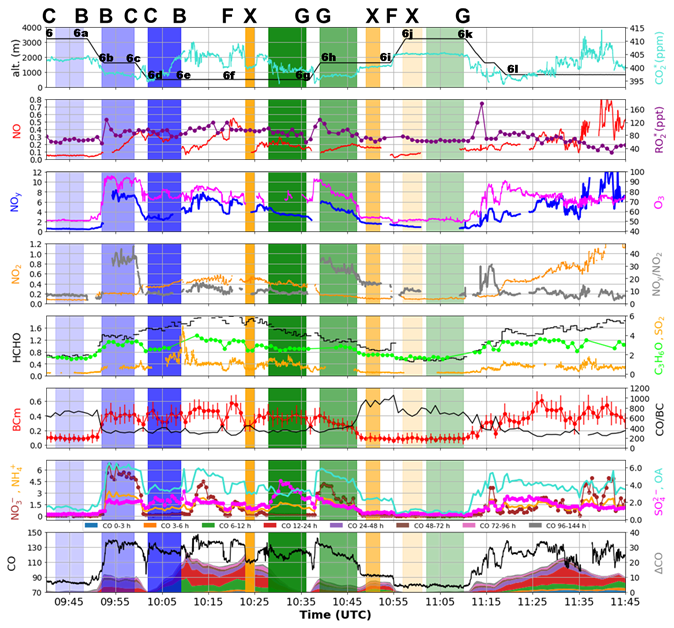
Figure 6Temporal and spatial variation of NO, NOy, NO2, O3, CO, HCHO, C3H6O, SO2 (all in ppbv, units not written in the axis for clarity), RO (in pptv), CO2 (in ppm) mixing ratios, and rBC, NO, NH, SO and OA mass concentrations (in µg m−3 STP) measured on board HALO over the Gulf of Venice (GV) during the EMeRGe E-EU-06 flight. HCHO and NO2 values are retrieved from mini-DOAS measurements. BCm are 1 min averages of rBC with 1σ error bars. The flight altitude and the changes in course and altitude (waypoints 6–6l) are indicated in the top panel. Blue, orange and green shaded coloured time windows highlight air masses each captured over the same geographical area (see Fig. 3) but at different heights (darker at lower altitudes). HYSPLIT simulations of the contribution of Po Valley emissions to the observed CO (i.e., ΔCO), coloured according to the estimated age are shown in the bottom panel. The geolocations B, C, F, X, and G as in Fig. 3 are shown in the top panel for clarity.
Measurements made over the same GV area at different heights are shaded with the same colour (darker shades at lower altitudes). Two shuttles were carried out over the GV (see Fig. 3):
-
from 09:42 to 10:10 UTC between B (45.0° N, 13.4° E) and C (45.4° N, 13.5° E) about 100 km off the Italian coast and along the Croatian west coast at 3230 m (6 to 6a), 1630 m (6b to 6c) and 520 m (6d to 6e);
-
from 10:21 to 11:10 UTC between F (44.9° N, 12.6° E) and G (45.6° N, 13.1° E) less than 35 km off the Italian coast at 520 m (6f to 6g), 1630 m (6h to 6i), and 3230 m (6j to 6k).
3.2.1 Shuttle B-C along the Croatian coast
In Fig. 7, the 3D distributions of CO, O3 and NO are plotted for shuttles 1 (waypoints 6 to 6e) and 2 (waypoints 6f to 6k). The transect between both shuttles in the marine BL across the Adriatic (6e to 6f) is analysed separately in Sect. 3.2.4.
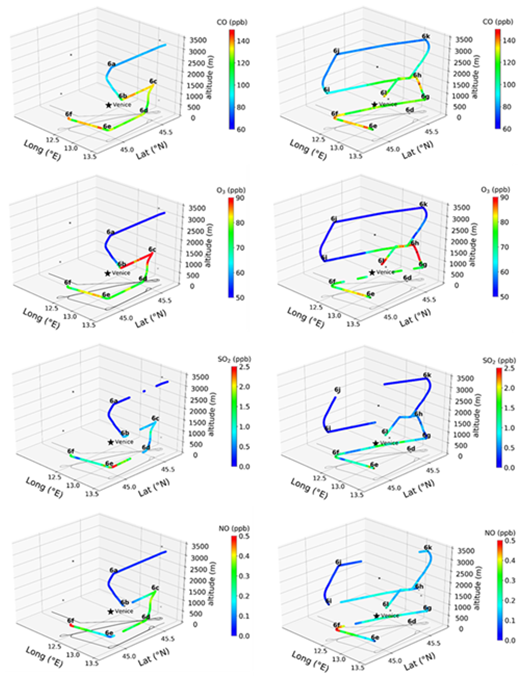
Figure 7Vertical distribution of CO, O3, SO2 and NO observed during the first (left; waypoints 6a to 6e) and second (right; waypoints 6f to 6k) shuttles during E-EU-06 on the 20 July 2017.
During the first shuttle (between points B–C in Fig. 3), the concentrations of gaseous and particulate species were deemed constant enough during the slots selected for each of the legs 6–6a, 6b–6c and 6d–6e to be averaged. The averages calculated for several species including CO, O3, C3H6O, particulate OA, NOy and particulate NO were higher at 1630 m in the FT (6b–6c) than at 530 m (6d–6e) in the BL. This was not the case for NO, NO2, SO2, HCHO, particulate SO and rBC (Fig. 6).
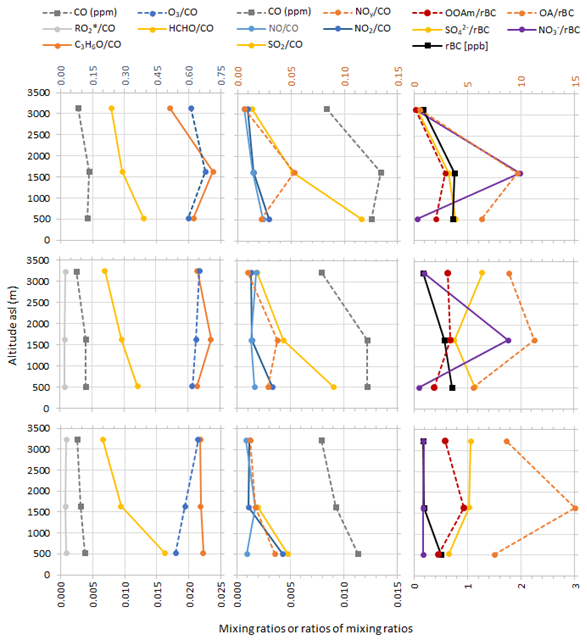
Figure 8Profiles of CO (ppm) and rBC (ppb), and molar ratios between selected species between B and C (top), G and X (middle) and X and F (bottom) in the GV. See Fig. 3 for the position of B, C, F, G and X. Dashed lines refer to the top x-axis.
As a consequence, (Table S5), , , , , and ratios (Fig. 8) were high at the 1630 m level (6b–6c). At 3230 m a.s.l., mixing ratios were less than in the BL for all species. ratios (Table S5) increased from 4 at 520 m, to 6 at 1630 m, and 8 at 3230 m, indicating that O3 photochemical production becomes increasingly NOx limited with altitude during this shuttle along the Croatian coast. The highest SO2 mixing ratios were observed when approaching waypoint 6e (B, 530 m) close to the Croatian coast at ∼ 10:10 UTC, suggesting a significant contribution from shipping (cargo ships and cruise ferry traffic), which has been attributed to be the main source of gaseous pollutants emissions in the GV (see https://www.port.venice.it/en/projects-and-sustainability/, last access: 5 October 2025, and Toscano, 2023). Due to instrumental zero calibration, NO and NOy data are not available for this period. Backward trajectories and wind maps indicate that air masses were lifted up from the sea surface to 520 m about 10–16 h before the measurements (left hand panel in Fig. 9), advected from the west in the FT (>2000 m) at 3230 m, lifted from the surface of the CPP at 1630 m. At this level, larger , , , , particulate and ratios (see Fig. 8 and Table S5) indicate enrichments in secondary pollutants, characteristic of photochemically processed air masses, across this leg. Furthermore, the HYSPLIT calculation of the CO enhancement also implies a significant contribution (10 ppbv) of emissions from the Po Valley, primarily from the previous 12–48 h for this leg (Fig. 6). In line with these observations, FLEXPART back-trajectories suggest that this polluted air mass probed at 1630 m originated from the surface in the CPP 12–24 h earlier, and travelled westwards before returning to GV above the Croatian coast. HYSPLIT 48 h forward trajectories show that it was exported westwards across borders without reaching the ground (Sect. S13).
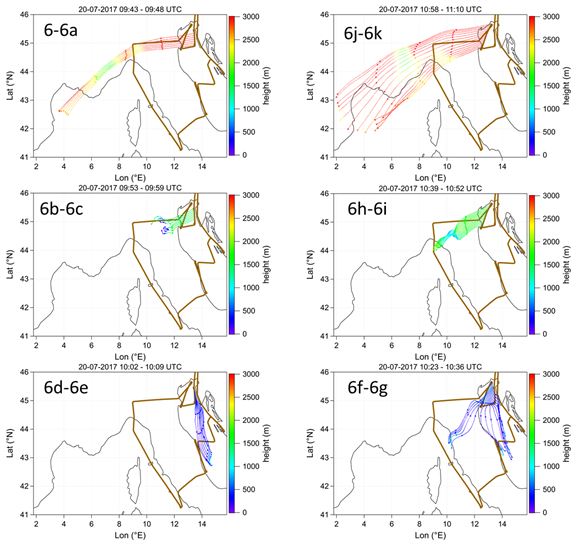
Figure 9Twenty four hours FLEXTRA backward trajectories for the first (left panel) and second (right panel) shuttles during the E-EU-06 flight. The waypoints for each level of the shuttle are indicated in each graph. The trajectories are started every two minutes at the HALO altitude within the time intervals indicated on the top of each graph. Dots mark the 6 h time steps along each trajectory. The flight track is indicated in brown.
3.2.2 Shuttle F–G along the Italian coast
During the second shuttle across GV, near the Italian coast (between points F–G in Fig. 3), the concentrations of the gaseous and particulate species changed significantly between waypoints 6h and 6i at 1630 m a.s.l. Each leg of the shuttle is covering the same spatial area but in the opposite temporal order, so that the area at the end of the leg at 520 m is overflown at the beginning of the leg at 1630 m and again at the end of the leg at 3230 m (see also HALO tracks in Fig. 2b). As in the previous shuttle, observations over the same GV area at different heights are shaded with the same colour (darker shade at lower altitudes) in Fig. 6. Further analysis was undertaken by splitting into two the legs between F and G at point X (Fig. 3), thus north and south of 45.13° N.
North of point X (X–G), the mixing ratios or accordingly the mass concentrations in the BL (520 m) and the FT (1630 m) were similar for CO, NO, O3, C3H6O, and rBC, whereas they were significantly lower at 1630 m for NO2, HCHO, and SO (Fig. 6). At 3230 m the concentrations or mixing ratios of all species were lower. Similarly to the first shuttle, particularly high , , , and ratios between X and G at 1630 m indicated a highly processed pollution plume. In contrast with carbon and nitrogen compounds, sulphur compounds (SO2 and SO) were not enhanced in this plume probed at 1630 m. In particular, SO2 mixing ratios and were a factor of ∼ 2 lower at 1630 m compared to 520 m a.s.l., which is consistent with sulphur-poor emissions and/or SO2 sinks such as oxidation by OH or uptake by dust or cloud droplets inside the BL. However, the lack of enrichment in SO suggests that SO2 oxidation followed by gas-to-particle conversion did not play a major role. The HYSPLIT simulations indicate a predominant contribution of emissions older than 24 h to a moderate (5 ppb) CO enhancement, characteristic of an aged pollution plume. This could be due to the fact that exceptional sources (i.e., not being part of the emission inventories) contributed to the observed CO mixing ratio. The observations were consistent with FLEXPART 96 h back-trajectories suggesting that the probed air mass was impacted by wildfire emissions in southern France 3–4 d earlier. In contrast, particularly high SO2 mixing ratios (Fig. 6) and ratios (Fig. 8) were observed in the BL (520 m) during this leg, being on average a factor of 2 higher than that in the FT (1630 m) (see Table S5). Backward trajectories (Fig. 9, bottom of the right panel) indicate that air masses travelled in the BL below 520 m a.s.l. during the previous 24 h, pointing at shipping as a major source of SO2. Port traffic and activities around the port of Venice have been found to impact negatively on the local air quality, especially in summer months when the meteorological conditions in the Mediterranean contribute to the formation of photochemically generated secondary pollutants and their accumulation in the lower tropospheric layers (Marmer and Langmann, 2005; Contini et al., 2011; Merico et al., 2021). Ship diesel engines are strong emitters of both primary and secondary PM. Primary PM in diesel are mostly emitted as ultra-fine particles and include soot, ash and a variety of organics as polycyclic aromatic hydrocarbons. Shipping secondary PM emissions include SO, NO and organics (Gobbi et al., 2020). From previous studies using high temporal resolution particle measurements at three sites on the coast of Venice, the mixing time of typical pollution plumes from ships with the surrounding air is between 20 min and one hour (Contini et al., 2011; Merico et al., 2021). This transport is confirmed by the COSMO wind direction and speed (see Figs. 5 and S5) at 12:00 UTC on 20 July 2017, that indicates SE (sea-land breeze) prevailing winds up to an altitude of 200 m, whereas SW winds were found to predominate between 500 and 2000 m.
As anticipated, the average values of CO, SO2, NO2, NOy, HCHO, C3H6O, O3, rBC, NO, SO, and OA mixing ratios or accordingly mass concentrations were all significantly smaller during the southern part (X–F) of the leg at 1630 m a.s.l. compared to the northern part (G–X). In contrast, concentrations at 520 m a.s.l. were all similar (or significantly greater for HCHO) in the south (X–F) compared to the north (G–X) part of the leg. Particularly high ratios (ranging from ∼ 9 to 10) resulting from rather low NO2 concentrations were observed between X and F at 1630 m, indicative of an aged pollutant plume. Backward trajectories indicate similar air mass origin to those observed further north (G–X) in the same leg, albeit not passing lower than ∼ 1200 m a.s.l., whereas at 520 m a.s.l. they indicate a slow motion of air masses from ground level around 45.0° N, 12.0° E during the previous 12 h. The air motion was therefore noticeably different between the BL at 520 m and the FT at 1620 m a.s.l. The HYSPLIT calculations indicate that the contribution of CO emissions from the Po Valley to the CO enhancement at 520 m a.s.l. (∼ 8 ppb) was primarily due to emissions within the last 6–24 h, with no significant contribution from more recent emissions, i.e., different again from what was computed for 1630 m a.s.l.
3.2.3 Comparison of the two shuttles across the GV
Similar mixing ratios were observed for each species at 3150 m above the GV during the two shuttles. The probed air masses were transported in the FT from ∼ SW at about 11 m s−1 (almost 1000 km d−1). Mixing ratios were much more variable at 1630 m where plumes of pollutants originating within the BL in the CPP (6b–6c along the Croatian coast) or transported in the FT from ∼ WSW (6h–6i, along the Italian coast), and travelling eastward were probed. In the BL (520 m), mixing ratios were again similar during the two shuttles, except for SO, whose concentration was on average twice as much along the Italian coast. The air masses probed in the BL had the same origin, travelling along the Italian east coast in the BL.
The pollution layers probed at 1630 m along segments B–C (6b–6c) and G–X resulted from significant chemical processing, as indicated by enhanced , , and ratios compared to that in the BL (Fig. 8, Table S6). The enrichments in O3, NOy, and NO were slightly higher along B–C than along G–X, with different air mass origins. There were no such enrichments in the FT (1630 m) compared to the BL (520 m) along X–F, except for O3, OA and OOAm.
Chemical processing of emissions during mixing is generally affected by ambient air conditions. In the lower FT (1600–2000 m), the relative humidity was higher than at the ground, and H2O mixing ratio increased with altitude (Fig. S7). Under high humidity conditions, transformation of NOx to HNO3 and subsequent transfer to aerosol phase is favoured (e.g., Guimbaud et al., 2002). Nitrate production in the entrainment zone of the BL has been previously documented in the area of Milan in summer (Curci et al., 2015). Based on WRF-Chem simulations at the regional scale, Curci et al. (2015) showed that coupling of chemistry and dynamics leads to a large NO spatial variability and positive vertical gradients over the whole Po Valley and Northern Adriatic in July. In particular, the rate of nitrate production is higher in the upper BL, where RH is above the ammonium nitrate deliquescence point (∼ 60 % RH, Talbot et al., 2016), which occurred in the plumes where NOy and NO enrichments were observed by HALO (Figs. S6 and S7). Interestingly, the HYSPLIT simulations do not capture the increase in CO observed at 1630 m between G and X, which may have a fresh anthropogenic origin given the increases in benzene and HCHO mixing ratios as measured by PTR-MS on board (Förster et al., 2023). In contrast, the biomass burning marker acetonitrile CH3CN did not show simultaneous enhancements despite the number of active wildfires at the time of the measurements. The polluted layer observed at this altitude may be a returning layer of pollution transported from inland to the coast as the result of combined breezes reinforced by upslope winds. This behaviour has been observed in other coastal areas (McKendry and Lundgren, 2000; De Wekker and Kossman, 2015). The air masses in the sea breeze travel inland during the morning and early afternoon by incorporating weaker up-slope circulatory cells (e.g., Millán et al., 2004). The mountain slopes act as convective–orographic chimneys that link the surface flows directly with their return flows aloft and lead to vertical recirculations of differently aged pollutants emitted along the coasts for several days. Similar land-sea breeze coastal shallow circulations were reported in southern West Africa (Flamant et al., 2018). The return layer is illustrated by 96 h back trajectories (Fig. S10) for B–C (waypoints 6b–6c) but not for F–G (6h–6i), where a general decrease in mixing ratios was observed around 10:50 UTC.
3.2.4 MBL transect B–F across the Adriatic Sea
During the westwards transect at 520 m a.s.l. from B to F (6e to 6f), a pollution plume was probed between 10:12 and 10:18 UTC with CO mixing ratios greater than 130 ppb. This plume was characterised by significant increases in CO, HCHO, C3H6O, O3, NO2, NOy, NO, and OA compared to the previous transect along the Adriatic coast at 520 m a.s.l. (6d–6e). Increases in , , ratios were also significant, pointing to a photochemically processed air mass. Notably, the ratio being 4.1 indicates that O3 photochemical production was NOx-limited at the time and location of the measurements (Table S5). HYSPLIT simulations suggest a 20 ppbv enhancement in CO due to emissions from the Po Valley primarily during 6 to 48 h prior to the measurements. FLEXPART 24 h backward trajectories (Fig. 10) confirm a slow motion to the sampling point of air masses originating from the surface in the CPP between approximately 44.0–44.6° N, and 10.0–12.5° E, a densely populated area (Fig. S1) including Modena, Bologna, and one of the busiest highways in Italy.
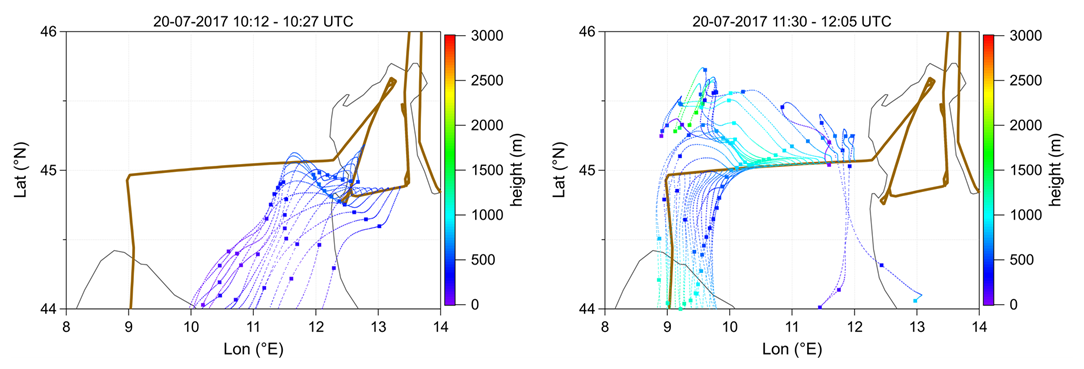
Figure 10Twenty-four hours FLEXTRA backward trajectories calculated for E-EU-06 on 20 July 2017 for the transect B–F (left) and when overpassing the CPP (right). The trajectories are started each minute at the HALO altitude within the time intervals indicated on the top of each graph. Dots mark the 6h time steps along each trajectory. The flight track is shown in brown.
A second pollution peak (CO = 135 ± 6 ppbv) was probed at the end of this transect around waypoint 6f. Both mixing ratios and the ratios between mixing ratios of different species were not significantly different from those in the previous plume, except for the NO mixing ratio and ratio, which were about twice as high, indicating a larger contribution of fresh emissions. This was confirmed by HYSPLIT simulations showing a significant contribution of 3–6 h CO old emissions from the Po Valley to the ΔCO. In contrast with the previous plume, backward trajectories indicate stagnant air masses for the previous 6 h, and contact with the surface at ∼ 45.0° N, 12.1° E (i.e., near Venice) about 12 h before the measurements. NO and SO2 peaks at 6f (520 m a.s.l.) could be associated with fresh local surface emissions. A significant contribution to air pollution of shipping and industrial activities around the ports of Venice and Marghera is consistent with the significant contribution of recently emitted air masses (3–6 h age) to the 20 ppb CO enhancement of Po Valley origin computed by HYSPLIT (see e.g., waypoint 6f in contrast to 6e).
Forward trajectories (Sect. S13) indicate that the two pollution plumes probed at 520 m above the GV and originating from the Po Valley would be transported back to the Po Valley in the BL within 12 to 18 h, before being exported to the Alps after 36 to 50 h.
3.3 Distribution of pollutants in the BL across the central Po Plain (CPP)
HALO flew within the BL at 840 m between 11:25 and 12:07 UTC (waypoints 6l–6m). The wind field simulations at the HALO flight altitude of 840 m ± 200 m evidence the difficulties in exactly assigning the origin of the air masses in this flight transect. According to COSMO simulations (Fig. 5 and Sect. S10), there was a light breeze (wind speed < 2 m s−1) with a SW component above 1200 m within the BL during the E-EU-06. The FLEXTRA trajectories indicate that the probed air masses mostly travelled across the CPP (see Fig. 10). However, the accuracy of the trajectories is limited by the prevailing low wind conditions during the E-EU-06 track. The comparison between 12 h backward trajectories calculated with LAGRANTO and FLEXTRA, initialized from the aircraft coordinates over the CPP (Fig. S11), shows reasonable agreement. However, the agreement deteriorates in the BL between 11–13° E, particularly with respect to the geographical extent of the trajectories. The observed differences may be related to slight discrepancies in the parameterisation of the vertical wind velocity considered by the models and the specific aircraft altitude. Indeed, in the regions where the discrepancies between the models are largest, the aircraft was flying close to the upper limit of the BL, where the strongest vertical gradients in horizontal wind velocity are expected, i.e., low wind velocities at lower altitudes and high wind velocities higher up. In this line, a sensitivity study of the COSMO wind field was carried out by perturbing the starting point of the COSMO-LAGRANTO backward trajectories on 20 July 2017 horizontally within a radius of 2000 m and vertically by ±200 m around the actual location and altitude of HALO, respectively (see Fig. S12).
Both COSMO and LAGRANTO SW flows at the top and above the BL are compatible with a SW synoptic scale circulation also transporting some desert dust (see Sect. 3.7 and Fig. S16). Furthermore, the results indicate that slow horizontal and vertical mixing resulted in a poorly or slowly mixed BL. This is further discussed in Sect. 3.6.
Selected mixing ratios of different species and ratios of mixing ratios obtained from airborne measurements during this east to west transect above the CPP are shown in Fig. 11. ratios (Table S6) ranging from 1 to 4 were the lowest observed during the whole E-EU-6 flight, and indicate that the O3 photochemical production regime could not be safely qualified as NOx- nor VOC-limited.
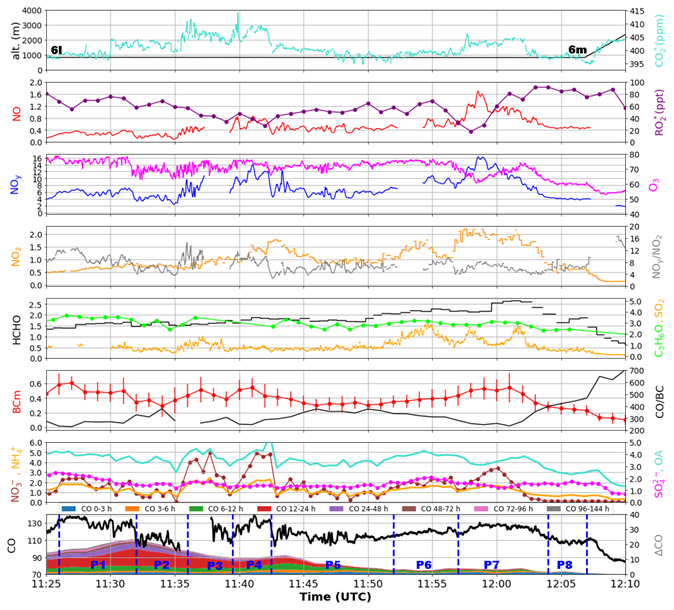
Figure 11Spatial and temporal variation of NO, NO2, NOy, O3, CO, HCHO, C3H6O, SO2, RO, and rBC, NO, NH, SO, and OA (in µg m−3 STP) observed on board HALO over the CPP during EMeRGe E-EU-06. The mixing ratios are in ppb if not indicated otherwise. HCHO and NO2 values are retrieved from mini-DOAS measurements. The flight altit1ude and the changes in course and altitude (waypoints 6l–6m) are marked in the top panel. The ratio is also shown. In the bottom panel HYSPLIT simulations of the contribution of Po Valley emissions (ΔCO) in different aged air masses to the observed CO (in black) are shown. Vertical blue lines mark the time intervals selected for the analysis (P1–P8, see text).
Pollution plumes were highlighted by averaging measurement data over 8 different periods (P) lasting ∼ 2 to 11 min (i.e., 16 to 80 km), primarily defined on the basis of CO variations, which were used as an indicator of ground-based pollution source emissions (see vertical blue lines in Fig. 11 and Table S6). Three of these periods: P2 (11:32–11:35 UTC), P5 (11:43–11:52 UTC) and P8 (12:03–12:07 UTC) with CO mixing ratios ≤ 115 ppbv were defined as local and temporary background. In these 3 periods, comparatively lower SO2, NO, NO2, NOy mixing ratios and NO, OA, and rBC mass concentrations were observed (Fig. 11). The HYSPLIT computed contributions of emissions from the Po Valley to the measured CO mixing ratios dropping from 20 ppbv during period P2, to 5 and 2 ppbv during periods P5 and P8, respectively, suggest that the causes for the relatively low CO mixing ratios observed during these 3 periods were probably different.
During period P1 between 11:26 and 11:32 UTC (from 12.33 to 11.83° E), CO mixing ratios >115 ppbv (average = 128 ± 7 ppbv) were measured quasi continuously. However, no significant enhancements in gaseous or particulate species with respect to CO and rBC, respectively, were observed during this period (see histogram in Fig. 12). and ratios were even significantly lower than in the periods defined as background. Backward trajectories suggest that the air mass sampled during P1 originated from the south and travelled within the BL below 500 m in the prior 12 to 18 h (Fig. 10). HYSPLIT simulations also indicate a large contribution (∼ 20 ppbv) of local emissions primarily during the previous 6 to 48 h to the measured CO mixing ratios. The composition of the air sampled during P1 is probably representative for the mid-day CPP regional pollutant mix. Low , and ratios suggest that this air mass was not much chemically processed.
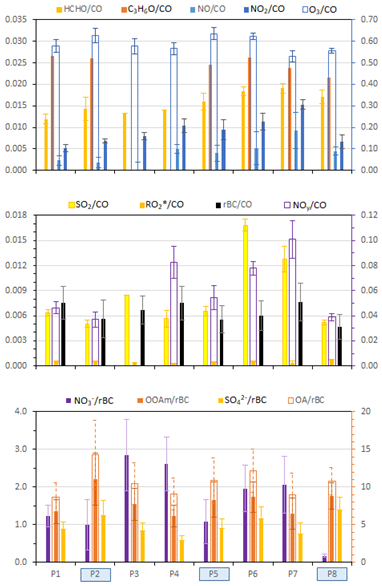
Figure 12Molar ratios between selected species measured along the transect over the CPP at 830–840 m a.s.l. Open bars refer to the right-hand y-axes. Periods defined as background are highlighted in blue in the x axis. The delimiting times are marked in Fig. 11 as blue lines in the bottom panel.
Period P3 between 11:36 and 11:39 UTC (from 11.50 to 11.26° E) was characterised by increases in SO2, NO, NOy, and particulate species (except SO), but cannot be further analysed due to the lack of simultaneous measurements of CO and nitrogen oxides during most of the period.
During period P4 (11:40–11:43 UTC) from 11.14 to 10.94° E, CO mixing ratios averaged 126 ± 9 ppbv. Increases in NO, NO2, NOy, NO, SO, OA and rBC were observed. However, only and were significantly larger while ratios were lower than in the so-called background periods. FLEXTRA backward trajectories (Fig. 10) indicate air masses coming from the BL in the CPP (around 45.5° N, 9.5° E) about 18 h before. These observations indicate that the probed air masses resulted from the processing of originally NOx rich emissions (e.g., from traffic). However, HYSPLIT calculates only a 10 ppbv CO increment coming from emissions in the Po Valley, primarily emitted 6–24 h prior to the measurements.
In contrast, the period P6 (11:53–11:57 UTC) between 10.03 and 9.72° E (CO = 119 ± 2 ppbv) is primarily characterised by increases in NO2 and SO2 mixing ratios. While ratios were on average not significantly larger than during the background P5 period, ratios reached the maximum mean value (0.017) observed over the CPP. Backward trajectories (Fig. 10) indicate that air masses travelled in the BL around Genoa (approx. 44.5° N, 9° E) about 12 h prior to the measurements, i.e., a drastic shift in air mass origin compared to P4 is observed. According to HYSPLIT, the ΔCO contribution of emissions from the Po Valley to the CO observed is less than 3 ppbv, and about half of this increase occurred during the last 6 h before the measurements.
High emission factors are characteristic of emissions from ships and refineries, which use higher sulphur-content fuels compared to e.g., road transport. Potential emission sources in the GG are the port of Genoa, a large European port involved in sea freight import-exports having a substantial amount of maritime traffic (Liguori and Zannetti, 2013; Marmer and Langmann, 2005), its surroundings, and the refinery IPLOM in Busalla (https://iplom.it/, last access: 5 October 2024, 44°34′54′′ N, 8°56′29′′ E).
During P7 (11:58–12:02 UTC, CO = 126 ± 2 ppbv) from 9.62 to 9.25° E, the highest NO, NO2, NOy, and HCHO mixing ratios of all transects in the BL over the CPP were measured. Two SO2 peaks were also observed at the beginning and the end of the period. In contrast, peaks in particulate species such as rBC and NO were similar to or lower than in the other pollution plumes. , and ratios were significantly higher than during the background periods, pointing to a mixture of fresh and aged emissions from combustion sources. ratios were significantly lower, and the lowest observed over the CCP (1.3), getting close to the threshold indicating a VOC-limited O3 production regime. The was significantly lower than in background conditions, and also the lowest observed over the CPP, suggesting the titration of O3 by NO as additionally indicated by the NO, O3, and RO observations. The two peaks in suggest that ship or refinery emissions were partially sampled. The advection of coastal emissions inland is confirmed by backward trajectories passing in the MBL over the GG within 12 h before the measurements, and by the HYSPLIT estimate of ∼ 50 % contribution of fresh emissions (<6 h) to the ΔCO from the Po Valley.
HYSPLIT forward trajectories suggest that the pollution plumes intercepted during the 840 m a.s.l. transect over the CPP were transported in different directions (see Sect. S13). The plume probed over the east of the CPP during P1, originating from further south, was transported over the Adriatic Sea, and turned back due to the daytime sea breeze to reach the surface level in the CPP about 36 h later. In contrast, chemically processed emissions from the CPP itself and more primary emissions from the GG port areas travelled in the CPP for 12–18 h in the BL before being exported to Switzerland and Austria across the Alps, probably due to the combined effect of daytime upslope winds and synoptic winds.
3.4 Vertical distribution and advection of pollutants in the Gulf of Genoa (GG)
HALO flew southwards from waypoint 6m (44.86° N, 8.97° E, 840 m a.s.l.) to waypoint 6n (44.63° N, 9.04° E, 2590 m a.s.l.) between 12:06 and 12:10 UTC. CO, SO2, NO2, NOy, RO, O3, rBC, OA, OOAm, and SO values significantly decreased during the ascent, while the NO concentration did not significantly change and remained around 0.06 µg m−3 STP. Across the southward transect at 2590 m a.s.l. between waypoints 6n and 6o (44.14° N, 9.05° E, 2590 m a.s.l.), mixing ratios of all species remained low and little variable. RO remained around 45 ± 13 pptv (Table S5). ratios were constantly greater than 4, characterising a NOx-limited photochemical O3 production regime. According to HYSPLIT simulations, the contribution of sources located in the Po Valley to ΔCO was negligible. There is no evidence that the air probed across this transect had recent contact with land for the previous 96 h, air masses travelling above 2000 m a.s.l. parallel to the French south coast coming from the Iberian Peninsula via the Baleares. During this transect above GG (upwind of the CPP) at 2580 m a.s.l., NO2, NOy, and O3 mixing ratios were higher than above GV (downwind of the CPP) at 3200 m a.s.l., while the values of CO, NO, SO2, HCHO, C3H6O, and the particulate species (NO, SO, rBC, OA, OOAm) were not significantly different. This means that on 20 July 2017 the CPP area did not appear to be a source of pollution in the FT above 2500 m a.s.l.
The ratio computed from E-EU-06 measurements remains between 0.03 and 0.12 within the BL. Above the BL, the concentration of both species decreases and their ratio remains around 0.01 at 2500 m in E-EU-06 and at 3000 m in E-EU-03. Apart from reflecting the shorter lifetime of NOy, this indicates the significance of additional long-range transport of CO in the upper levels eastwards from the south of France during both HALO flights. This long-range transported CO may be from forest fires in southeastern France, which was experiencing an exceptionally hot and dry summer in 2017, as later detected during HALO E-EU-07 and E-EU-09 flights downwind of Marseille, Nice and Saint Tropez on 24 and 28 July 2017 (Andrés Hernández et al., 2022).
3.5 Comparison of ground and airborne observations over the Po Plain
Vertical and horizontal gradients of pollutants are expected to depend on the efficiency of the mixing within the BL. If the time scales are shorter for the horizontal than for the vertical mixing within the BL, the distribution of trace gases above the surface may not reflect the allocation of the emissions at the ground but be more homogeneous over larger areas in the upper layers. Short-lived species may react completely before mixing by small-scale turbulent motions that consequently affect the production of secondary pollutants such as O3.
The mixing ratios of the primary pollutants (CO, NOx, rBC) investigated during the HALO flights were mostly higher in the BL than in the lower FT (Table S6). This is expected as emission sources are predominantly at the ground, and convective and advective mixing within the BL were slow over the Po Plain on 20 July 2017, as illustrated by a neutral thermal stability and no strong wind shear, at least between 10.25 and 12.25° E (Sect. S10). The weakness of the pollution vertical transport in the BL along the Po Plain was further highlighted by comparing measurement values at the surface with the airborne observations performed at 840 m a.s.l. NOx, CO, and O3 measured with 1 h resolution at the ARPA AQMN stations at altitudes between 10 and 250 m a.s.l. (see Table S3) in the proximity of the aircraft track were used for this purpose.
Looking at the Po Plain as a whole, it appears that the largest CO mixing ratios (300–500 ppbv) were observed at traffic sites (7, 13, 16, 17), with the exception of the traffic site 6, while the lowest (100–200 ppbv) were generally observed at rural and urban background sites (2, 3, 4, 15, 19, 23), with the exception of the rural background site 10 (Fig. 13). Note that according to Fig. 5, the station 10 at 250 m a.s.l. is potentially under the influence of the transport of pollution of coastal origin. The observed CO distribution roughly reflects the distance of each site to major combustion sources, i.e., predominantly road traffic in summer. CO mixing ratios measured at ∼ 800 m above the CPP (120 ± 8 ppbv) were not significantly different from those measured at 520 m a.s.l. in GV (126 ± 15 ppbv), and were independent from the CO mixing ratios measured at the overflown ground stations (100–400 ppbv). This might be explained by the large contribution of long-range transported and long-lived CO to the BL mixing ratios at 800 m above the ground. According to HYSPLIT simulations, emissions from the Po Valley actually accounted at the maximum for 15 % (20 ppb approximately) to the BL CO mixing ratios measured on-board the aircraft.
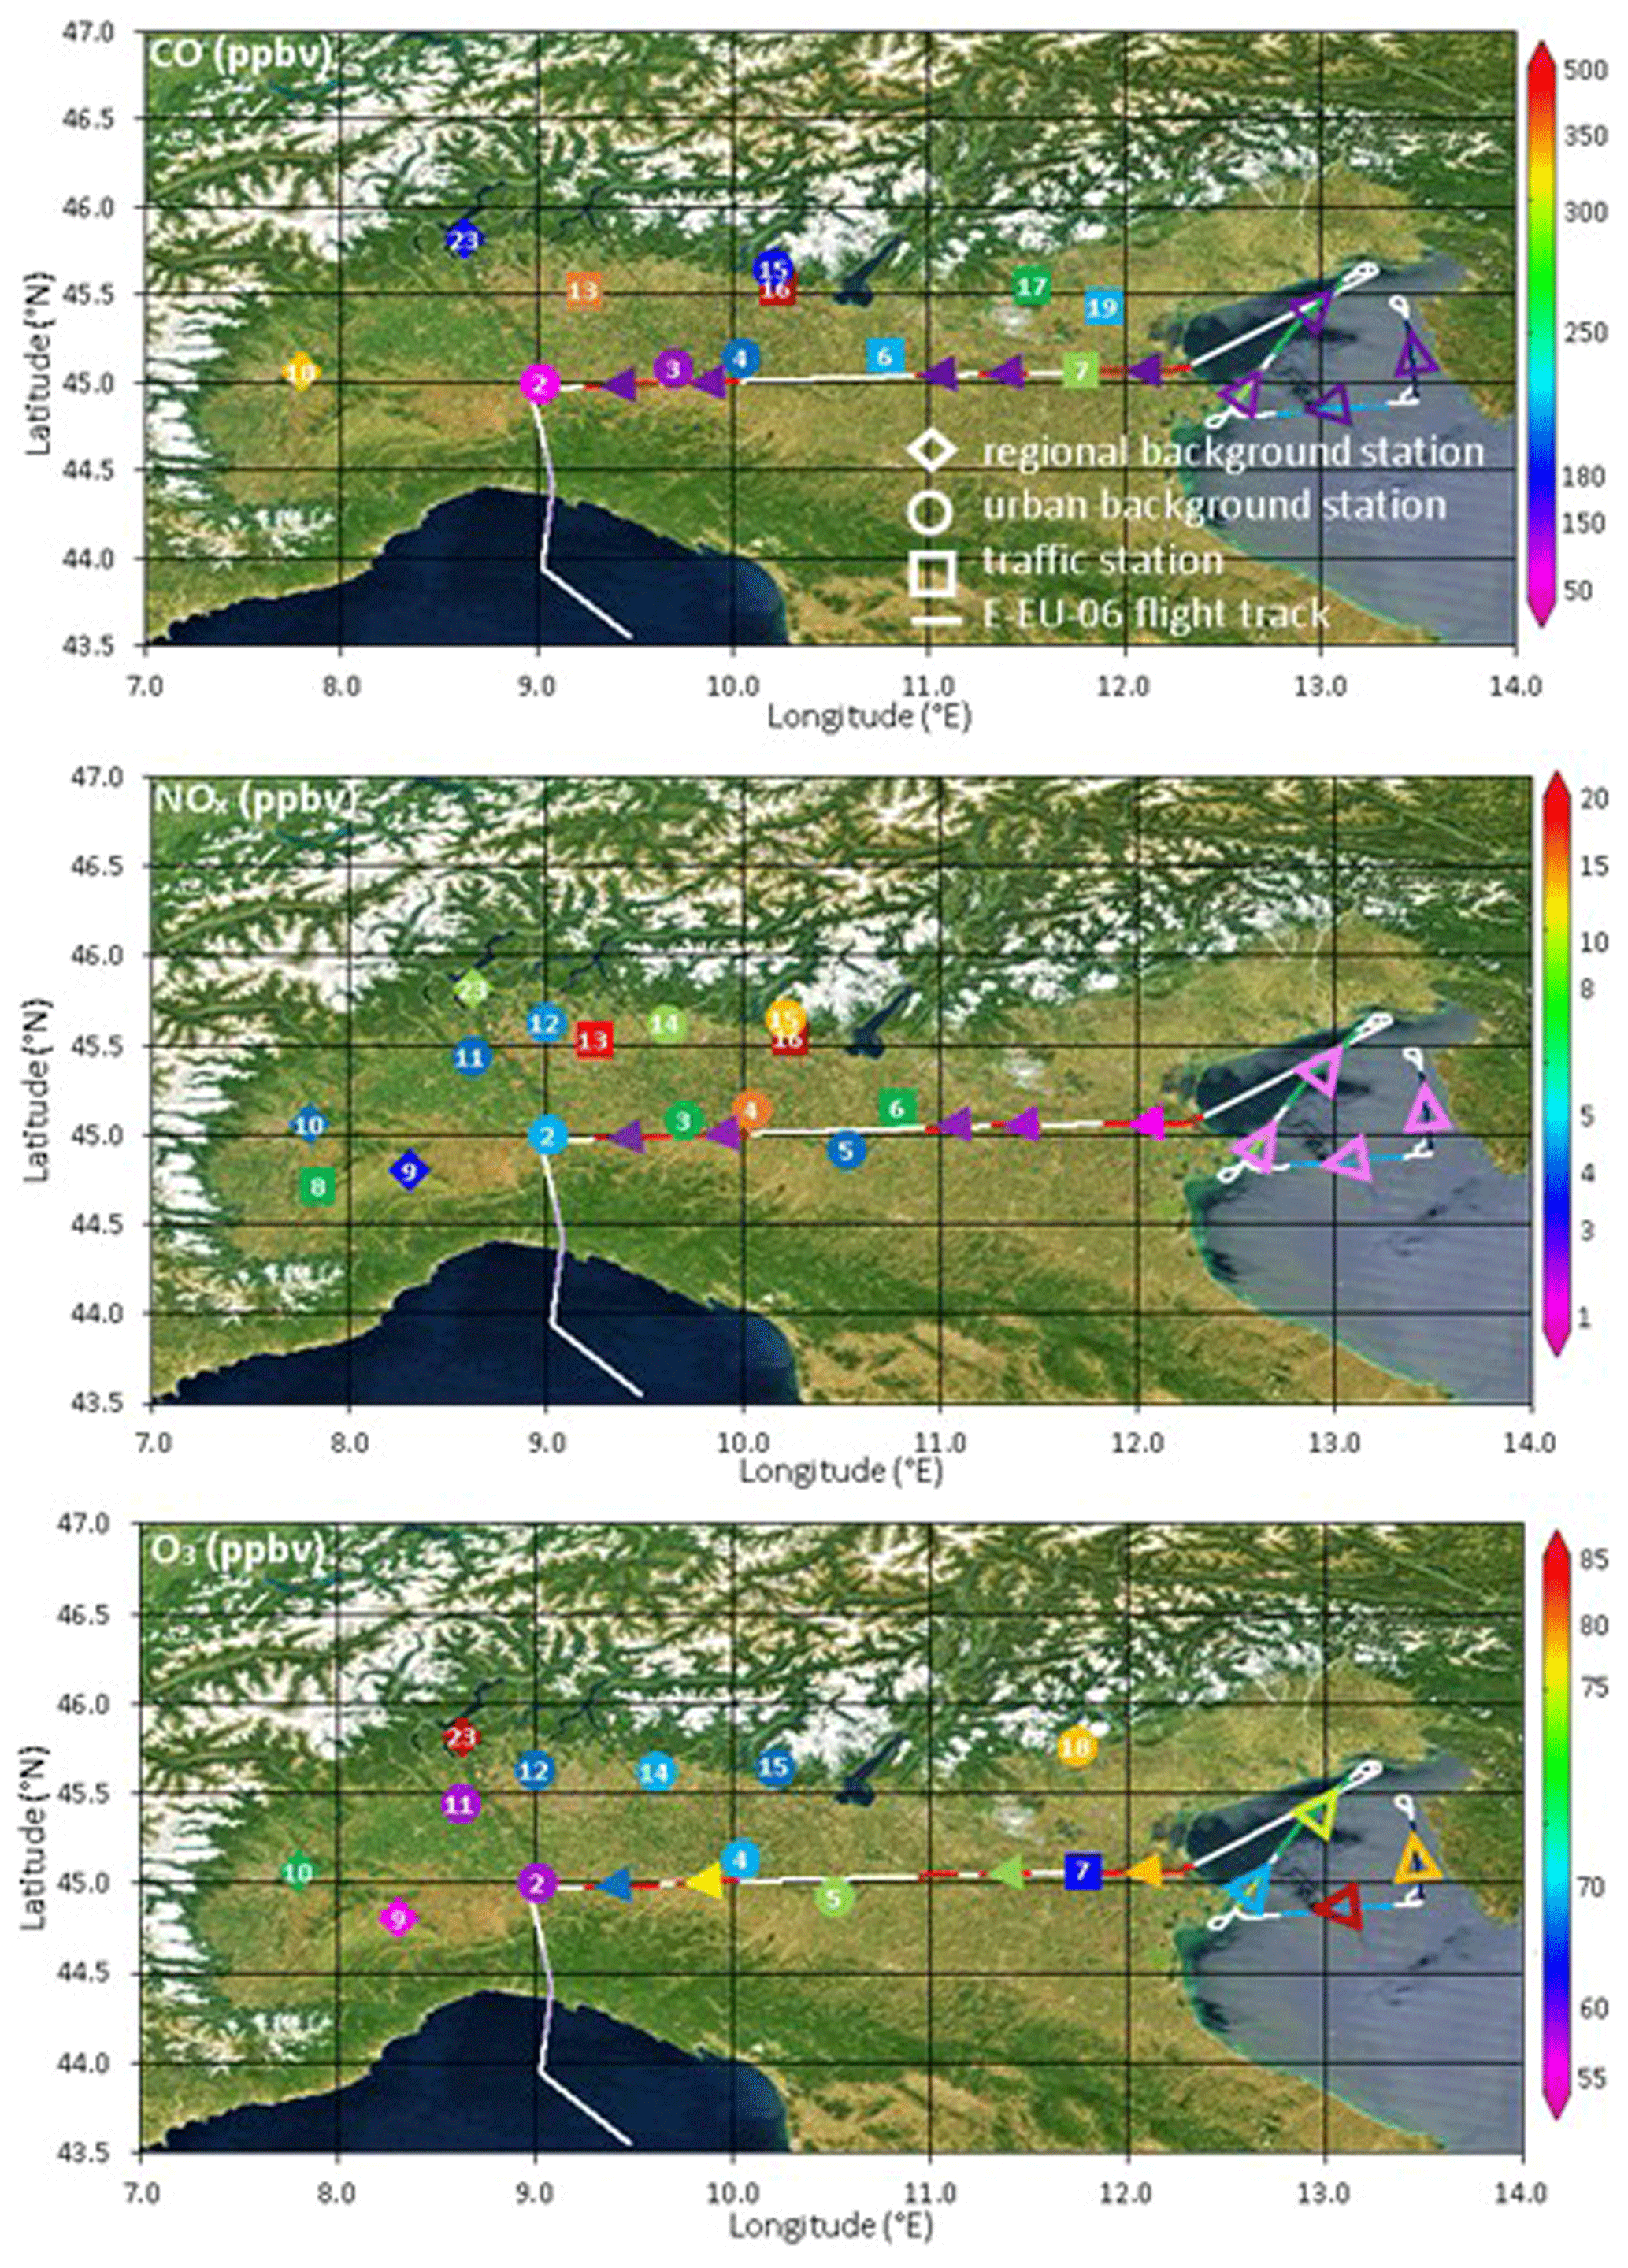
Figure 13Ground-based CO, NOx, and O3 mixing ratios (colour scales) at traffic (square), urban background (circle), and regional background (diamond) stations of the ARPA and ACTRIS networks at the time of the E-EU-06 overpass. Station numbers refer to Table S3. Also shown are the mixing ratios measured along the aircraft E-EU-06 track (line) at 520 m a.s.l. over the GV (open triangles) and 830–840 m a.s.l. above the CPP (solid triangles). Background map downloaded from Worldview (https://worldview.earthdata.nasa.gov/, last access: 19 June 2024).
Regarding NOx, high levels (30–60 ppbv) were observed at traffic sites 13 and 16, while moderate mixing ratios (10–12 ppbv) were measured at traffic sites 6 and 8. Lower values (5–10 ppbv) were observed at regional background sites. Unlike CO, mean NOx mixing ratios were significantly greater at ∼ 800 m above the CPP (1.4 ± 0.5 ppbv) compared to 520 m a.s.l. in GV (0.7 ± 0.1 ppbv), but 4 to 10 times less than at the air quality monitoring stations (5–15 ppbv), which were flown over, with no significant correlation between the ground level and airborne mixing ratios.
The lower horizontal variability in NO2 measured in the BL at ∼ 800 m a.g.l. compared to ground-level stations suggests again road traffic as the major NOx source in the CPP in summer. The significantly lower NO and NO2 mixing ratios measured on board HALO than at the ground around 11:30–12:00 UTC on 20 July 2017 (Fig. 13) suggest a decoupling between the ground and the aircraft altitude (∼ 800 m a.g.l.). Indeed, a 1D model simulating correctly the ground and aircraft level NOx mixing ratios, as well as the HNO3 mixing ratio at the aircraft altitude, indicates a BL mixing time of ∼ 30 h, i.e. inconsistent with the order of magnitude (30 min) stated by Wallace and Hobbs (2006). Back-trajectories also suggest that the air probed at 830 m a.s.l. over the CPP left the ground at least ∼ 24 h before (Fig. 9).
The variability of the 1 h-mean O3 mixing ratios at ground stations between 11:00 and 12:00 UTC is smaller (45–72 ppbv) than for CO and NOx. As expected, the highest mixing ratio was observed at the regional background station 23, where anthropogenic NOx and VOC have mixed upwind with biogenic VOCs (primarily isoprene). However, there is no correlation between the type of site and O3 concentrations across the whole Po Plain. O3 mixing ratios in the CPP at ∼ 800 m a.g.l. were significantly higher than at ground level (+8 %). This may imply incomplete mixing with the NOx ground emissions at the time of the flight and/or O3 photochemical production in O3 precursor rich air rising up by convection, and/or larger O3 sinks at the ground (titration by NO, dry deposition).
3.6 General features in the processing of the air masses over the Po Plain
Based on the ground-based and airborne observations described in the previous sections, some general features were identified in the transport and processing of pollution within the complex Po Plain. Besides information about the O3 and secondary aerosol formation potential of the air masses, the obtained data give some insights into the suitability of HYSPLIT and dispersion models to reproduce the observed pathways.
Considering the BL only, the air probed in GV was the most photochemically active as indicated by the radical observations. This resulted from the mixing of fresh emissions of primary pollutants with processed air masses, leading to the highest O3 formation potential. The HCHO to NO2 ratios were generally higher than in GG and CPP, and indicated a NOx limited production of O3. The difference in ratios in the BL between GV and CPP is consistent with RO mixing ratios being about 20 %–50 % higher in the former. The lower HCHO to NO2 ratios detected anywhere else indicate a transition regime between NOx and VOC limited production of O3 in the probed air masses with respect to the GV. The increase in NO to NO2 ratios in the GV transect with respect to the CPP was consistent with the increasing importance of fresh emissions in the transported air masses. The higher ratio between NO and SO2 additionally indicated the mix of combustion processes responsible for pollution, primarily the sulphur content of the fuel burnt. Concerning the origin of sulphur compounds in the BL, port traffic and activities were identified as the major source of SO2 across the Po Plain. The highest ratios were observed during 3 transects at 520 m a.s.l. over GV (range = 0.008–0.012) and in the west of the CPP at 830–840 m a.s.l. (0.013). In the first case, the air masses had been transported in the BL above the Adriatic Sea during the previous 24 h. In the western part of the HALO transect in the BL at ∼ 800 m a.g.l. above the CPP, the backward trajectories passed in the MBL over the port of Genoa in the GG within 12 h before the measurements. SO2 enrichments were not systematically accompanied by similar enrichments in SO as revealed by similar ratios in the GV and the CPP (ca. 0.95), probably due to the slow homogeneous oxidation of SO2 to SO (characteristic time during day in summer ≈ a couple of days). High ratios were also observed during this measurement campaign in “background” conditions in the BL (up to 1.4, see Sect. 3.3) and in the FT between 2600 and 3230 m a.s.l. (up to 2.3), which could also mask local photochemical SO production.
The mean NOy mixing ratio measured in the BL over the CPP was on average ∼ 50 % larger than over the coastal areas. This is explained not only by less BL venting and dilution in the CPP, but also by oxidation and subsequent processing of NOx-rich emissions leading to e.g., HNO3 and NO production. This resulted in higher mean and ratio in the CPP, albeit larger ratio punctually observed in the BL above GV. Similarly, increases in the and ratios were generally concurrent.
With regard to horizontal transport pathways, the observations indicate the contribution of fresh pollution advected from GG in the CPP. This was in agreement with model-based wind fields and thus with the HYSPLIT simulations showing a ∼ 50 % contribution of the Po Valley emissions to CO emitted recently (<6 h age). However, the CO emissions from the Po Valley advected to the measurement points at the western tip of the CPP were estimated by HYSPLIT to be less than 5 ppb, i.e., 4 % enhancement with respect to the total CO measured. This contribution is much lower than the 20 % maximum CO enhancement observed over the background periods in the CPP (see detailed analysis in Sect. 3.3).
Regarding vertical transport, the comparison between HALO measurements performed at the lowest flight altitudes (about 800 m a.s.l.) over the CPP and at ground stations showed inhomogeneities in the vertical distribution of several species mixing ratios, especially for CO and NOx, and to a lesser extent O3. Such inhomogeneities within the BL in urban areas with a complex distribution of emissions at the surface have already been addressed (Wang et al., 2021). Large eddy simulations suggest that the inefficient mixing of reactants such as e.g., NO and peroxy radicals can affect the production of secondary pollutants such as e.g., O3, especially when the location of anthropogenic NO emissions and biogenic VOC emissions are separated. Simulations by Wang et al. (2022) showed that O3 significantly increased with altitude (20 ppbv) between 100 and 800 m a.g.l. above Hong Kong in the polluted case (surface NO and NO2 of ∼ 30 ppbv), but not in the “clean” case (+1 ppb between 100 and 800 m a.g.l.), where NO and NO2 mixing ratios at the ground were 0.5 and 3 ppb, respectively. In polluted conditions, they computed a decrease in the O3 photochemical production rate due to radical species segregation ranging from 50 % at about 150 m to less than 20 % above 500 m over the urban area of Hong Kong. The NOx mixing ratios measured across the CPP on 20 July between 12:00 and 13:00 UTC ranged between the extremes of their simulations. However, measured and simulated radiosondes indicate that turbulence in the BL atmosphere over the CPP was well below the strong turbulent flow in the simulations of Wang et al. (2022). This may explain the small increase of O3 between the ground and 800 m a.g.l. over the CPP. Hůnová et al. (2023) showed non-uniform O3 concentration gradients and temporal changes in air columns of 2–8, 8–50 and 50–230 m from seven-year O3 measurements taken at four heights up to 230 m a.g.l. in a rural area in the Czech-Moravian Highlands.
In the FT, aged polluted layers were observed ca. 600 m above the top of the BL in GV. The HYSPLIT simulations did not capture the increases in CO observed, which suggests that a large source of CO was not part of the emission inventory, but assigned a higher relative contribution of emissions being > 24–48 h older than in the air within the BL below, which confirms the long-range transport of the air masses. ratios were on average particularly high in these layers (∼ 6 to 8), as compared to the BL underneath (∼ 4 at 520 m a.s.l.) and above the CPP (∼ 2 at 830–840 m a.s.l.), and well above the threshold (∼ 4) for considering O3 photochemical production to be NOx-limited. In line with these observations, FLEXPART 96 h backward trajectories suggest that a returning pollution layer originating from the surface in the CPP was earlier probed along the Croatian coast, while a polluted air mass coming from areas affected by wildfires in southern France 3–4 d before was intercepted along the Italian Adriatic coast.
3.7 Desert dust transport and secondary organic aerosol formation above the central Po Plain
Transport of desert dust to the Central Mediterranean and the Italian Peninsula is a frequent phenomenon, particularly in summer (Barnaba and Gobbi, 2004), when it is mainly associated with anticyclonic conditions (e.g., Gaetani et al., 2016). It also has important impacts on PM-air quality metrics (Pederzoli et al., 2010; Barnaba et al., 2022), as well as on the chemistry of the atmosphere, such as providing surface for heterogeneous reactions including O3 removal mechanisms from the gas phase (e.g., Zhu et al., 2010; Wang et al., 2017). Desert dust may also influence nitrate partitioning between gas and aerosol phase (e.g., Karydis et al., 2016), the heterogeneous formation of sulphate catalysed by iron (Itahashi et al., 2022) and the neutralization of acids such as HNO3 and H2SO4 (e.g., Athanasopoulou et al., 2016).
Elevated desert dust layers were observed by ground based remote sensing over the central Po Valley during the EMeRGe HALO flights (Andrés Hernández et al., 2022). In particular, Fig. 14 shows the complex aerosol stratification as observed on 20 July during the E-EU-06 HALO flight by the ALICENET ALC operating in Milan-Bicocca. Aerosol profiles from the LiDAR operating in Ispra at the time of the HALO overpass are reported in Fig. 15. The arrival of elevated, desert-dust layers over the CPP is documented to occur already the day before by the Milan ALC (see Fig. S16 showing the continuous evolution of the aerosol vertical profiles during the whole EMeRGe campaign in Europe: 11–20 July 2017). This is also in agreement to predictions by the multi-model desert dust forecasts (Basart et al., 2019) made available by the Dust Regional Center (https://dust.aemet.es/products/daily-dust-products, last access: 3 March 2026) and reported in Fig. S18.
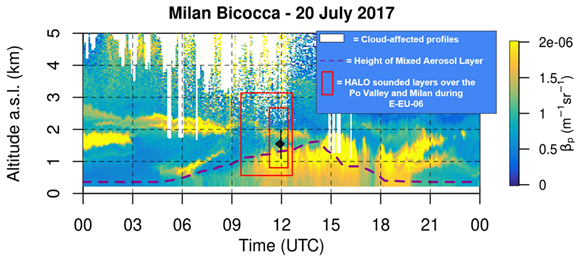
Figure 14Continuous (00:00–24:00 UTC, x-axis) vertical profiles (0–5 km a.s.l., y-axis) of aerosol backscatter at 1064 nm as observed by the ALICENET ALC system operating in Milan-Bicocca on 20 July 2017. Cloud-affected profiles are filtered out from the cloud base upwards (white areas). The height of the Mixed Aerosol Layer (MAL, dashed purple line), proxy of BLH, is derived from the ALICENET data processing (Bellini et al., 2024). BLH value derived at 12:00 UTC from radiosonde measurements in Milan is also reported (black diamond, see Table 1). Red boxes identify time-altitude windows sounded by HALO over the wider Po Valley (outer box) and Milan (inner box) areas.
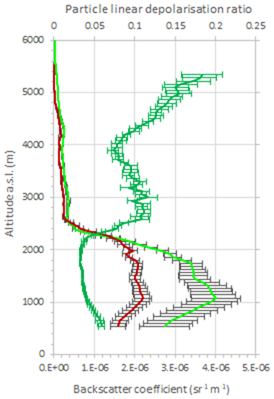
Figure 15Vertical profiles of the particle light backscatter coefficient at 1064 (red) and 532 (light green) nm (bottom x-axis), and the linear depolarization ratio (dark green, top x axis) at 532 nm measured by the aerosol LiDAR in Ispra on the 20 July between 11:01 and 13:01 UTC.
In particular, elevated aerosol layers up to 5000 m altitude are visible in the ALC and LiDAR traces (Figs. 14 and 15). The mineral dust nature of the particles is confirmed by the aerosol depolarization trace of the Ispra LiDAR, markedly increasing above 2500 m. In the morning, clouds are observed to form above 3000 m within the dust layer. During E-EU-06, HALO actually flew 60 km south of Milan and 90 km south of Ispra around 12:00 UTC at 830–840 m a.s.l. Particle number size distributions measured on board HALO when closer to Ispra and Milan showed a distinct coarse mode at 1.5 µm, similarly to what has been previously observed during the MINATROC campaign in a desert dust outbreak at Monte Cimone (Italy) in June–July 2000 (Van Dingenen et al., 2005). However, the contribution of coarse particles to the total particle number was limited (∼ 1/10 000) compared to what was previously measured (∼ 2/1000).
The number concentration of particles with diameters greater than 500 nm (Nd>500 nm) in the free troposphere is used as a proxy for the dust number concentration (DeMott et al., 2010; Weger et al., 2018; Zhang et al., 2019). For heterogeneous reactions, the surface area concentration is the decisive quantity and will be denoted here as dSd>500 nm. The HALO observations (Fig. 16) indicate a larger amount of dust in the upper levels: dSd>500 nm was ∼ 30 µm2 cm−3 at 1630 m a.s.l. above GV, and ∼ 20 µm2 cm−3 at 2600 m a.s.l. above GG while it was ∼ 10 µm2 cm−3 at 830–840 m a.s.l. above the CPP, where air masses coming from GG were advected. For comparison, the surface area due to the coarse mode desert dust observed in Monte Cimone (at 2165 m a.s.l.) in June–July 2000 was 44 µm2 cm−3 (Van Dingenen et al., 2005), but in that case the dust plume was more intense and vertically thick (reaching up to 8 km altitude, Gobbi et al., 2003) than the one probed during EMeRGe. In fact, on 20 July 2017, vertical mixing was not favoured by the high-pressure field extending from North Africa to northern Italy. Model-based data indeed show the gradient of the potential temperature to be neutral below 1000–1500 m during the HALO overpass above the CPP, whereas it was positive above 1500 m (Fig. S8). Thus, the atmospheric layering was very stable in the FT, likely inducing minor or no mixing of dust within the boundary layer air.
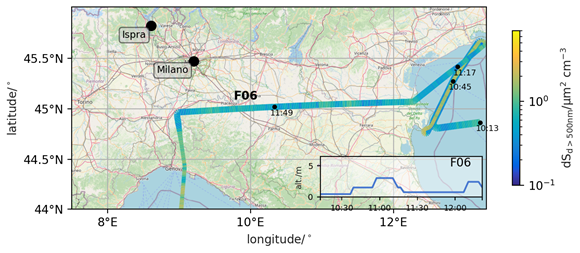
Figure 16Surface area concentration of particles with diameter larger than 500 nm measured by the optical particle counter on-board HALO along the flight track. Map data from OpenStreetMap (last access: 5 April 2024).
Although the aerosol optical depth of the dust layer was low, correlations between the amount of selected species and dSd>500 nm were further investigated in an attempt to find some indications of the effect of dust in heterogeneous processes. For this, HALO data across the Po Plain at 830–840 m altitude were selected when additional vertical information near the CPP was available. Figure 17 illustrates the measurement location and altitude as well as the vertical profile of dSd>500 nm (left column). The vertical profile shows that the main dust layer was above about 1650 m, in agreement with ALC data (Fig. 14) and the BL height of about 1600 m (Table 1), but HALO encountered air masses with significant amounts of particles with d>500 nm also below that height. The plots in the upper row of Fig. 17 show the gas-phase substances O3 and HCHO which both undergo heterogeneous reactions on dust (e.g., Wang et al., 2017) and should therefore decrease with increasing dust load. This behaviour is indeed observed above 1650 m (black dots), but not in the BL below 1600 m, where both species show a slightly positive correlation with dSd>500 nm. This may indicate that the BL source of both the particles with d>500 nm and the two gas-phase species was local pollution from the Po Plain, while above the boundary layer, heterogeneous removal of O3 and HCHO occurred.
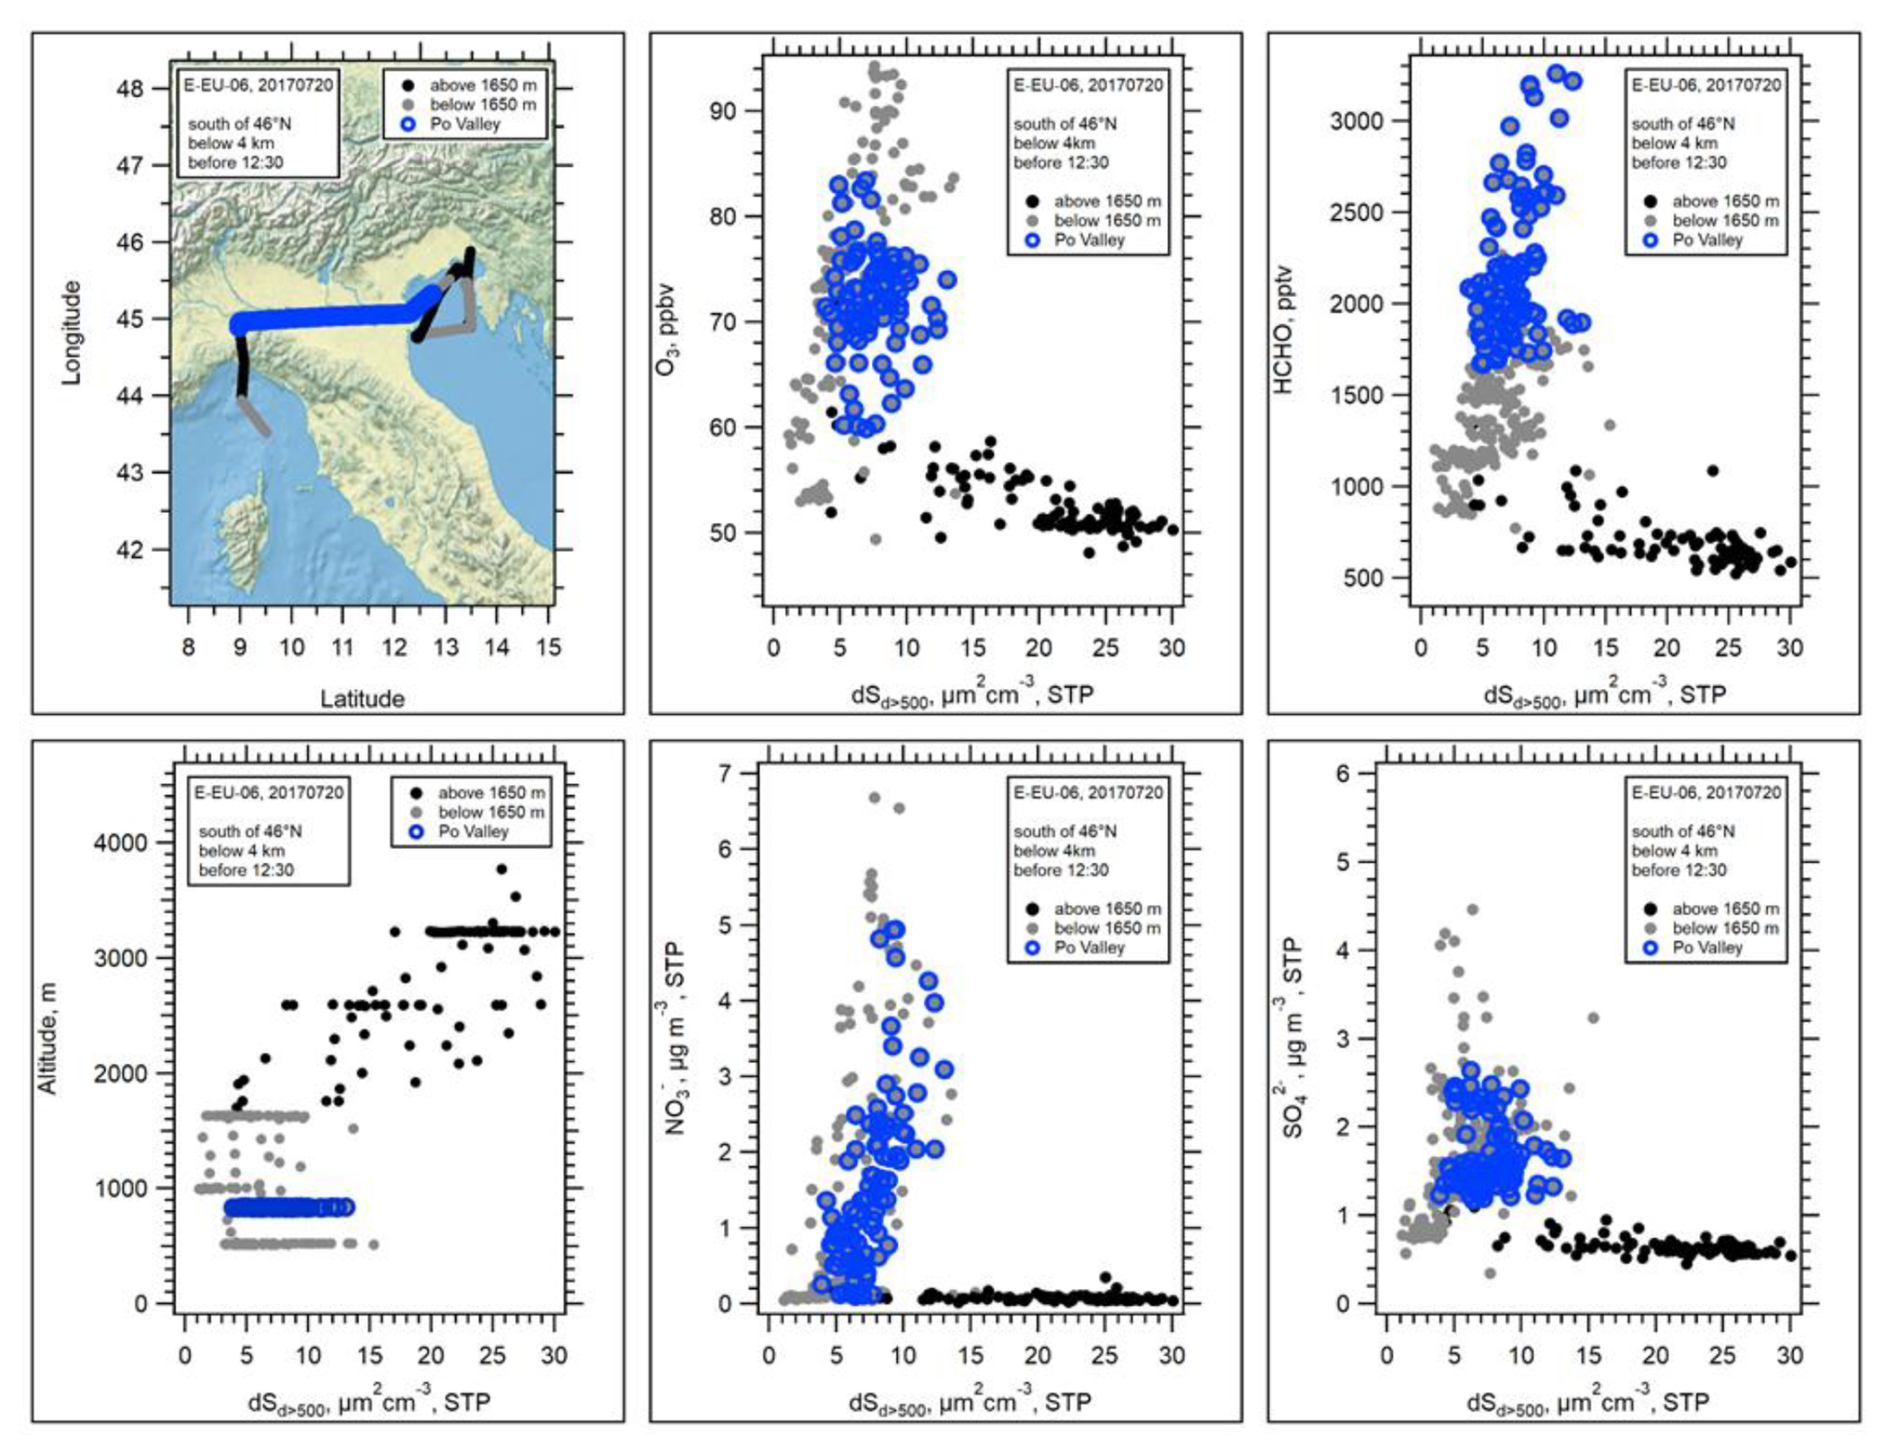
Figure 17Relation between mixing ratios or mass concentrations of selected species (O3, HCHO, NO, SO) and the surface area concentration of particles with diameter larger than 500 nm (dSd>500 nm) measured during E-EU-06 on 20 July 2017. On the left side, the flight location and the observed vertical distribution of particles are shown. Dots for flight altitudes below and above 1650 m are shown in grey and black respectively while the blue colour indicates the CPP crossing at 830–840 m. Public domain GIS data available in Wavemetrics IgorPro.
In contrast, NO and SO (lower row) show a positive correlation with dSd>500 nm in the BL over the Po Plain and the surrounding regions. Above the BL, where the particle surface area increased due to an increasing amount of dust particles (see LiDAR and ALC profiles in Fig. 14), both particulate species show no correlation with dSd>500 nm but remain constant at low concentration. Also, the mixing ratio of SO2, which is the precursor gas for sulphate production, does not show a negative correlation with dSd>500 nm above 1650 m (not shown). Whether the positive correlations in the BL are due to heterogeneous production or to common local sources cannot be answered from the current data set.
For all four species shown in Fig. 17, the slope of the correlation with dSd>500 nm changes clearly between the BL and the FT. These observations are of interest for the validation of surface loss processes on aerosol models.
Understanding the transport and transformation of pollutants is crucial for an adequate assessment of air quality and for the development of effective mitigation strategies for urban agglomerations. This is particularly important in the BL of highly polluted environments with complex topography.
The objective of this investigation was to undertake a case and investigate and characterise key primary and secondary pollutants in the Po Valley, which hosts large urban agglomerations, an effective megacity, and both industrial and intense agricultural activities. The study exploits the airborne observations of selected trace gases and particulate matter components during two EMeRGe flights carried out in the Po Plain from the Gulf of Venice to the Gulf of Genoa, and ground-based data from air quality and LiDAR networks in July 2017. The differences in mixing ratios and variability of the targeted species as well as the processing during the aging of the observed pollution plumes, as estimated by HYSPLIT dispersion simulations, provide valuable information about the degree of mixing of the emissions within the BL and their photochemical transformation during transport.
The observations of major air pollutants and short-lived climate forcer precursors such as NO, NO2, CO and SO2 at ground level indicated that the south of Lombardy and the surroundings of Milan are the most polluted areas in the central section of the Po Plain, CPP, which has a predominance of urban and traffic emission sources. The coastal areas of Genoa and Venice have in comparison significant emissions from shipping, as well as tourism and industrial activities near their ports.
Overall, stagnant conditions dominated in the CPP at the time of the investigated flights and advection of pollutants from the coastal areas into the CPP was favoured. Backward-trajectories indicated inland transport of emissions from the port of Genoa in agreement with the ground-based observations of pollutants and the SO2, CO and NOy plumes probed during the flights. In contrast, an apparent accumulation of local emissions was observed in the lower BL in the eastern part of the CPP, close to the Gulf of Venice. The stagnant conditions resulted in a decoupling between the lower and the upper part of the BL causing concentration negative gradients. Thus, the content of reactive primary pollutants such as NO, NO2 and SO2 in the air masses probed onboard HALO in the upper BL was above the levels measured at ground-based background stations but lower than elsewhere along the flight tracks. These gradients are interpreted as examples of the transformation of the primary pollutants having a lower time constant than that of the vertical mixing within the BL, which is generally estimated to be about 20 to 30 min. The distribution of secondary products and long-lived species such as O3 and CO provide additional information about the transport and transformation of the probed air masses. The O3 enhancements relative to the background in the lower and upper parts of the BL indicate that the photochemical processing of the emissions in the polluted plumes during the horizontal transport towards the Alps is similar to that during convective mixing in the BL of the Po Plain. Then again, vertical and horizontal gradients of long-lived species depend on the efficiency of the mixing within the BL.
Furthermore, the combined effect of Alpine venting and thermally driven advection to the coast resulted in a returning layer of pollution in the upper BL at 1600 m approximately. Another pollution layer coming from areas affected by wildfires in southern France was detected at 1600 m. These layers were identified by residual plumes of long-lived trace gases and O3 during the measurement period. These aged air masses are expected to be transported eastward by the synoptic-scale circulation over the Po Plain above 2000 m and to affect air quality in Eastern Europe if they are entrained back inside the BL.
The results show that HYSPLIT dispersion simulations using CO as a tracer provide a consistent picture with the regional transport and the degree of ageing of the observed pollution plumes but, importantly, are not able to simulate return layers close to the upper BL or exceptional events such as wildfires which are not part of the emission inventory.
In this context of transboundary transport above the BL, the free troposphere over the Po Plain was additionally affected by transport of dust from the Saharan desert. The results indicate that the synoptic conditions favoured dust transport and led to a stable layering, such that mixing of the dust layer with the Po Plain urban pollution was not favoured. Therefore, direct evidence of heterogeneous production of nitrate and sulphate on the dust surface in the dust layer above the BL was not observed.
Overall, the results obtained show the complexity of the transformation and transport of emissions from the Po Plain into the BL and the FT, which affects the primary and secondary air pollutants. The study reinforces the necessity and relevance of airborne measurements of trace gases and aerosol constituents at different altitudes in combination with multiple radio soundings as well as with remote sensing profiling of pollutants and meteorological variables to complement the observations at the ground in the assessment of air pollution build-up and its effects on health, ecosystem services and agriculture. In addition, this study shows how local circulation patterns strongly influence these processes in the Po Valley in summer. While atmospheric chemistry models have improved greatly, continued model development and experimental studies are still needed to better understand and predict pollution behaviour in complex terrain.
The EMeRGe data are available at the HALO database (https://doi.org/10.17616/R39Q0T, re3data.org, 2025) and can be accessed upon registration. Further data can be made available upon request to the corresponding author.
The supplement related to this article is available online at https://doi.org/10.5194/acp-26-9827-2026-supplement.
CC and MDAH prepared the manuscript with contributions from all co-authors, MDAH, JPP, FB and JPB supervised the findings of this study and contributed significantly to manuscript revisions. HD provided COSMO-LAGRANTO and RB the HYSPLIT CO-enhancement calculations. JS, HZ, KK, JS, OOK, BH, BW, EF, MG, YL, DS, JW, AB, BB, KP provided data used in the study. All authors have contributed to the manuscript, corrections, post-writing formatting, and revisions in reviewing and interpreting the results presented.
At least one of the (co-)authors is a member of the editorial board of Atmospheric Chemistry and Physics. The peer-review process was guided by an independent editor, and the authors also have no other competing interests to declare.
Publisher's note: Copernicus Publications remains neutral with regard to jurisdictional claims made in the text, published maps, institutional affiliations, or any other geographical representation in this paper. The authors bear the ultimate responsibility for providing appropriate place names. Views expressed in the text are those of the authors and do not necessarily reflect the views of the publisher.
This article is part of the special issue “Effect of Megacities on the Transport and Transformation of Pollutants at Regional and Global Scales (EMeRGe) (ACP/AMT inter-journal SI)”. It is not associated with a conference.
The authors thank all the teams and individuals without whom the EMeRGe campaign in Europe would not have been possible, especially the HALO flight coordination and BAHAMAS teams, and flight engineers. The contribution of local ARPA agencies by providing ground-based data from the Italian air quality network is gratefully acknowledged. Special thanks to Alessia Sannino and Antonella Boselli for providing the LiDAR data from Naples and San Pietro Capofiume and Angela Marinoni for the data of the GLWF flight on 20 July 2017. The authors are grateful to Alex de Meij (JRC) for providing them with meteorological reanalysis data generated by the EMEP MSC-W model.
Luca Di Liberto (CNR-ISAC) and Luca Ferrero (University of Milan-Bicocca) are acknowledged for their support in the collection of ALICENET data in Milan. Francesca Barnaba would like to thank the National Civil Aviation Agency (ENAC) for the support received in the authorization process of HALO flights over the Italian territory.
Dust images in Fig. S18 were provided by the WMO Barcelona Dust Regional Center and the partners of the Sand and Dust Storm Warning Advisory and Assessment System (SDS-WAS) for Northern Africa, the Middle East and Europe.
The authors gratefully acknowledge the NOAA Air Resources Laboratory (ARL) for the provision of the HYSPLIT transport and dispersion model and/or READY website (https://www.ready.noaa.gov, last access: 3 March 2026) used in this publication. They also gratefully acknowledge the Institute for Atmospheric and Climate Science, ETH Zurich, Switzerland, for the provision of the LAGRANTO software.
This project was in part funded by the State and University of Bremen, the DLR Institute of Physics of the Atmosphere and the EMeRGe Project, which was part of the German Research Foundation DFG Priority Program (Schwerpunktprogramm) SPP 1294 “Atmospheric and Earth System Research with HALO” – “High Altitude and Long Range Research Aircraft”. The funding of the HALO aircraft and the contributions to the various missions via DFG, the Max Planck Society (MPG), the Helmholtz-Gemeinschaft, and the Deutsches Zentrum für Luft- und Raumfahrt (DLR; all from Germany) are highly acknowledged.
The scientific work of Klaus Pfeilsticker and Benjamin Weyland was supported by the DFG grants PF-384/7-1, PF384/9-1, PF-384/16-1, PF-384/17, and PF-384/19. The scientific work of Katharina Kaiser and Johannes Schneider was supported by the DFG grants SCHN 1138/5-1 and BO 1829/10-1. The University of Bremen supported in part the EMeRGe measurements and the contributions made by Midhun George, Yangzhuoran Liu, M. Dolores Andrés Hernández, and John Phillip Burrows.
The article processing charges for this open-access publication were covered by the University of Bremen.
This paper was edited by James Lee and reviewed by two anonymous referees.
Ambrosetti, P., Anfossi, D., Cieslik, S., Graziani, G., Lamprecht, R., Marzorati, A., Nodop, K., Sandroni, S., Stingele, A., and Zimmermann, H.: Mesoscale transport of atmospheric trace constituents across the central Alps: TRANSALP tracer experiments, Atmos. Environ., 32, 1257–1272, https://doi.org/10.1016/S1352-2310(97)00185-4, 1998.
Andrés Hernández, M. D., Hilboll, A., Ziereis, H., Förster, E., Krüger, O. O., Kaiser, K., Schneider, J., Barnaba, F., Vrekoussis, M., Schmidt, J., Huntrieser, H., Blechschmidt, A.-M., George, M., Nenakhov, V., Harlass, T., Holanda, B. A., Wolf, J., Eirenschmalz, L., Krebsbach, M., Pöhlker, M. L., Kalisz Hedegaard, A. B., Mei, L., Pfeilsticker, K., Liu, Y., Koppmann, R., Schlager, H., Bohn, B., Schumann, U., Richter, A., Schreiner, B., Sauer, D., Baumann, R., Mertens, M., Jöckel, P., Kilian, M., Stratmann, G., Pöhlker, C., Campanelli, M., Pandolfi, M., Sicard, M., Gómez-Amo, J. L., Pujadas, M., Bigge, K., Kluge, F., Schwarz, A., Daskalakis, N., Walter, D., Zahn, A., Pöschl, U., Bönisch, H., Borrmann, S., Platt, U., and Burrows, J. P.: Overview: On the transport and transformation of pollutants in the outflow of major population centres – observational data from the EMeRGe European intensive operational period in summer 2017, Atmos. Chem. Phys., 22, 5877–5924, https://doi.org/10.5194/acp-22-5877-2022, 2022.
Athanasopoulou, E., Protonotariou, A., Papangelis, G., Tombrou, M., Mihalopoulos, N., and Gerasopoulos, E.: Long-range transport of Saharan dust and chemical transformations over the Eastern Mediterranean, Atmos. Environ., 140, 592–604, https://doi.org/10.1016/j.atmosenv.2016.06.041, 2016.
Baklanov, A., Lawrence, M., Pandis, S., Mahura, A., Finardi, S., Moussiopoulos, N., Beekmann, M., Laj, P., Gomes, L., Jaffrezo, J.-L., Borbon, A., Coll, I., Gros, V., Sciare, J., Kukkonen, J., Galmarini, S., Giorgi, F., Grimmond, S., Esau, I., Stohl, A., Denby, B., Wagner, T., Butler, T., Baltensperger, U., Builtjes, P., van den Hout, D., van der Gon, H. D., Collins, B., Schluenzen, H., Kulmala, M., Zilitinkevich, S., Sokhi, R., Friedrich, R., Theloke, J., Kummer, U., Jalkinen, L., Halenka, T., Wiedensholer, A., Pyle, J., and Rossow, W. B.: MEGAPOLI: concept of multi-scale modelling of megacity impact on air quality and climate, Adv. Sci. Res., 4, 115–120, https://doi.org/10.5194/asr-4-115-2010, 2010.
Barnaba, F. and Gobbi, G. P.: Aerosol seasonal variability over the Mediterranean region and relative impact of maritime, continental and Saharan dust particles over the basin from MODIS data in the year 2001, Atmos. Chem. Phys., 4, 2367–2391, https://doi.org/10.5194/acp-4-2367-2004, 2004.
Barnaba, F., Gobbi, G. P., and de Leeuw, G.: Aerosol stratification, optical properties and radiative forcing in Venice (Italy) during ADRIEX, Q. J. Roy. Meteor. Soc., 133, 47–60, https://doi.org/10.1002/qj.91, 2007.
Barnaba, F., Putaud, J. P., Gruening, C., dell'Acqua, A., and Dos Santos, S.: Annual cycle in co-located in situ, total-column, and height resolved aerosol observations in the Po Valley (Italy): Implications for ground-level particulate matter mass concentration estimation from remote sensing. J. Geophys. Res., 115, https://doi.org/10.1029/2009JD013002, 2010.
Barnaba, F., Romero, N. A., Bolignano, A., Basart, S., Renzi, M., and Stafoggia, M.: Multiannual assessment of the desert dust impact on air quality in Italy combining PM10 data with physics-based and geostatistical models, Environ. Int., 163, 107204, https://doi.org/10.1016/j.envint.2022.107204, 2022.
Basart, S., Nickovic, S., Terradellas, E., Cuevas, E., Pérez García-Pando, C., García-Castrillo, G., Werner, E., and Benincasa, F.: The WMO SDS-WAS Regional Center for Northern Africa, Middle East and Europe, E3S Web Conf., 99, 04008, https://doi.org/10.1051/e3sconf/20199904008, 2019.
Bellini, A., Diémoz, H., Di Liberto, L., Gobbi, G. P., Bracci, A., Pasqualini, F., and Barnaba, F.: ALICENET – an Italian network of automated lidar ceilometers for four-dimensional aerosol monitoring: infrastructure, data processing, and applications, Atmos. Meas. Tech., 17, 6119–6144, https://doi.org/10.5194/amt-17-6119-2024, 2024.
Birmili, W., Heinke, K., Pitz, M., Matschullat, J., Wiedensohler, A., Cyrys, J., Wichmann, H.-E., and Peters, A.: Particle number size distributions in urban air before and after volatilisation, Atmos. Chem. Phys., 10, 4643–4660, https://doi.org/10.5194/acp-10-4643-2010, 2010.
Butler, T. M., Stock, Z. S., Russo, M. R., Denier van der Gon, H. A. C., and Lawrence, M. G.: Megacity ozone air quality under four alternative future scenarios, Atmos. Chem. Phys., 12, 4413–4428, https://doi.org/10.5194/acp-12-4413-2012, 2012.
Castaldini, D., Marchetti, M., Norini, G., Vandelli, V., and Zuluaga Vélez, M. C.: Geomorphology of the central Po Plain, Northern Italy, J. Maps, 15, 780–787, https://doi.org/10.1080/17445647.2019.1673222, 2019.
CityZen: megaCITY – Zoom for the ENvironment (THEME FP7-ENV-2007.1.1.2.1: Megacities and Regional Hot-spots Air Quality and Climate), European Commission CORDIS Portal, https://cordis.europa.eu/project/id/212095 (last access: 1 July 2026), 2011.
Collaud Coen, M., Praz, C., Haefele, A., Ruffieux, D., Kaufmann, P., and Calpini, B.: Determination and climatology of the planetary boundary layer height above the Swiss plateau by in situ and remote sensing measurements as well as by the COSMO-2 model, Atmos. Chem. Phys., 14, 13205–13221, https://doi.org/10.5194/acp-14-13205-2014, 2014.
Contini, D., Gambaro, A., Belosi, F., De Pieri, S., Cairns, W. R. L., Donateo, A., Zanotto, E., and Citron, M.: The direct influence of ship traffic on atmospheric PM2.5, PM10 and PAH in Venice, J. Environ. Manage., 92, 2119–2129, 2011.
Curci, G., Ferrero, L., Tuccella, P., Barnaba, F., Angelini, F., Bolzacchini, E., Carbone, C., Denier van der Gon, H. A. C., Facchini, M. C., Gobbi, G. P., Kuenen, J. P. P., Landi, T. C., Perrino, C., Perrone, M. G., Sangiorgi, G., and Stocchi, P.: How much is particulate matter near the ground influenced by upper-level processes within and above the PBL? A summertime case study in Milan (Italy) evidences the distinctive role of nitrate, Atmos. Chem. Phys., 15, 2629–2649, https://doi.org/10.5194/acp-15-2629-2015, 2015.
DeMott, P. J., Prenni, A. J., Liu, X., Kreidenweis, S. M., Petters, M. D., Twohy, C. H., Richardson, M. S., Eidhammer, T., and Rogers, D. C.: Predicting global atmospheric ice nuclei distributions and their impacts on climate, P. Natl. Acad. Sci., 107, 11217–11222, 2010.
De Wekker, S. F. and Kossmann, M.: Convective boundary layer heights over mountainous terrain – a review of concepts, Front. Earth Sci., 3, 77, https://doi.org/10.3389/feart.2015.00077, 2015.
De Wekker, S. F. J., Kossmann, M., Knievel, J. C., Giovannini, L., Gutmann, E. D., and Zardi, D.: Meteorological Applications Benefiting from an Improved Understanding of Atmospheric Exchange Processes over Mountains, Atmosphere, 9, 371, https://doi.org/10.3390/atmos9100371, 2018.
Diémoz, H., Barnaba, F., Magri, T., Pession, G., Dionisi, D., Pittavino, S., Tombolato, I. K. F., Campanelli, M., Della Ceca, L. S., Hervo, M., Di Liberto, L., Ferrero, L., and Gobbi, G. P.: Transport of Po Valley aerosol pollution to the northwestern Alps – Part 1: Phenomenology, Atmos. Chem. Phys., 19, 3065–3095, https://doi.org/10.5194/acp-19-3065-2019, 2019a.
Diémoz, H., Gobbi, G. P., Magri, T., Pession, G., Pittavino, S., Tombolato, I. K. F., Campanelli, M., and Barnaba, F.: Transport of Po Valley aerosol pollution to the northwestern Alps – Part 2: Long-term impact on air quality, Atmos. Chem. Phys., 19, 10129–10160, https://doi.org/10.5194/acp-19-10129-2019, 2019b.
Draxler, R. and Hess, G.: Description of the HYSPLIT4 modeling system, NOAA Technical Memorandum, ERL, ARL-224, 1997, revised September 2014, https://repository.library.noaa.gov/view/noaa/31133/noaa_31133_DS1.pdf (last access: 5 October 2024), 1997.
Ferrero, L., Riccio, A., Ferrini, B. S., D'Angelo, L., Rovelli, G., Casati, M., Angelini, F., Barnaba, F., Gobbi, G. P., Cataldi, M., and Bolzacchini, E.: Satellite AOD conversion into ground PM10, PM2.5 and PM1 over the Po valley (Milan, Italy) exploiting information on aerosol vertical profiles, chemistry, hygroscopicity and meteorology, Atmos. Pollut. Res., 10, 1895–1912, 2019.
Finardi, S. and Pellegrini, U.: Systematic analysis of meteorological conditions causing severe urban air pollution episodes in the central Po Valley, in: Proceedings of the 9th Int. Conf. on Harmonisation within Atmospheric Dispersion Modelling for Regulatory Purposes, June 2004, Garmish-Partenkirchen, Germany, 250–254, http://www.harmo.org/conference.php?id=9 (last access: 5 October 2025), 2004.
Finardi, S., Silibello, C., D'Allura, A., and Radice, P.: Analysis of pollutants exchange between the Po Valley and the surrounding European region, Urban Clim., 10, 682–702, https://doi.org/10.1016/j.uclim.2014.02.002, 2014.
Finardi, S., Agrillo, G., Baraldi, R., Calori, G., Carlucci, P., Ciccioli, P., D'Allura, A., Gasbarra, D., Gioli, B., Magliulo, V., Radice, P., Toscano, P., and Zaldei, A.: Atmospheric dynamics and ozone cycle during sea breeze in a Mediterranean complex urbanized coastal site, J. Appl. Meteorol. Clim., 57, 1083–1099, https://doi.org/10.1175/JAMC-D-17-0117.1, 2018.
Flamant, C., Deroubaix, A., Chazette, P., Brito, J., Gaetani, M., Knippertz, P., Fink, A. H., de Coetlogon, G., Menut, L., Colomb, A., Denjean, C., Meynadier, R., Rosenberg, P., Dupuy, R., Dominutti, P., Duplissy, J., Bourrianne, T., Schwarzenboeck, A., Ramonet, M., and Totems, J.: Aerosol distribution in the northern Gulf of Guinea: local anthropogenic sources, long-range transport, and the role of coastal shallow circulations, Atmos. Chem. Phys., 18, 12363–12389, https://doi.org/10.5194/acp-18-12363-2018, 2018.
Folberth, G. A., Rumbold, S. T., Collins, W. J., and Butler, T. M.: Global radiative forcing and megacities, Urban Clim., 1, 4–19, https://doi.org/10.1016/j.uclim.2012.08.001, 2012.
Förster, E., Bönisch, H., Neumaier, M., Obersteiner, F., Zahn, A., Hilboll, A., Kalisz Hedegaard, A. B., Daskalakis, N., Poulidis, A. P., Vrekoussis, M., Lichtenstern, M., and Braesicke, P.: Chemical and dynamical identification of emission outflows during the HALO campaign EMeRGe in Europe and Asia, Atmos. Chem. Phys., 23, 1893–1918, https://doi.org/10.5194/acp-23-1893-2023, 2023.
Gaetani, M., Pasqui, M., Crisci, A., and Guarnieri, F.: A synoptic characterization of the dust transport and associated thermal anomalies in the Mediterranean basin, Int. J. Climatol., 36, 2779–2791, https://doi.org/10.1002/joc.3615, 2016.
Georgiadis, T., Giovanelli, G., and Fortezza, F.: Vertical layering of photochemical ozone during land-sea breeze transport, Il Nuovo Cimento C, 17, 371–375, https://doi.org/10.1007/BF02509176, 1994.
Gobbi, G. P., Barnaba, F., Van Dingenen, R., Putaud, J. P., Mircea, M., and Facchini, M. C.: Lidar and in situ observations of continental and Saharan aerosol: closure analysis of particles optical and physical properties, Atmos. Chem. Phys., 3, 2161–2172, https://doi.org/10.5194/acp-3-2161-2003, 2003.
Gobbi, G. P., Di Liberto, L., and Barnaba, F.: Impact of port emissions on EU-regulated and non-regulated air quality indicators: The case of Civitavecchia (Italy), Sci. Total Environ., 719, https://doi.org/10.1016/j.scitotenv.2019.134984, 2020.
Gohm, A., Harnisch, F., Vergeiner, J., Obleitner, F., Schnitzhofer, R., Hansel, A., Fix, A., Neininger, B., Emeis, S., and Schäfer, K.: Air Pollution Transport in an Alpine Valley: Results From Airborne and Ground-Based Observations, Bound.-Lay. Meteorol., 131, 441–463, https://doi.org/10.1007/s10546-009-9371-9, 2009.
Gonzalez Ortiz, A., Guerreiro, C., and Soares J. (EEA): Air quality in Europe – 2019 report, EEA Report No. 10/2019, European Environment Agency, Copenhagen, Denmark, https://www.eea.europa.eu/en/analysis/publications/air-quality-in-europe-2019 (last access: 24 June 2026), 2019.
Gonzalez Ortiz, A., Guerreiro, C., and Soares, J.: Air Quality in Europe – EEA: 2020 Report, Tech. rep. N09/2020, https://doi.org/10.2800/786656, 2020.
Guimbaud, C., Arens, F., Gutzwiller, L., Gäggeler, H. W., and Ammann, M.: Uptake of HNO3 to deliquescent sea-salt particles: a study using the short-lived radioactive isotope tracer 13N, Atmos. Chem. Phys., 2, 249–257, https://doi.org/10.5194/acp-2-249-2002, 2002.
Gurjar, B. R. and Lelieveld, J.: New directions: megacities and global change, Atmos. Environ., 39, 391–393, https://doi.org/10.1016/j.atmosenv.2004.11.002, 2005.
Helbig, M., Gerken, T., Beamesderfer, E. R., Baldocchi, D. D., Banerjee, T., Biraud, S. C., Brown, W. O. J., Brunsell, N. A., Burakowski, E. A., Burns, S. P., Butterworth, B. J., Chan, S., Davis, K. J., Desai, A. R., Fuentes, J. D., Hollinger, D. Y., Kljun, N., Mauder, M., Novick, K. A., Perkins, J. M., Rahn, D. A., Sanchez, C.-R., Santanello, J. A., Scott, R. L., Seyednasrollah, B., Stoy, P. C., Sullivan, R. C., Vilà-Guerau de Arellano, J., Wharton, S., Yi, C., and Richardson, A. D.: Integrating continuous atmospheric boundary layer and tower-based flux measurements to advance understanding of land-atmosphere interactions, Agr. Forest Meteorol., 307, https://doi.org/10.1016/j.agrformet.2021.108509, 2021.
Henne, S., Furger, M., Nyeki, S., Steinbacher, M., Neininger, B., de Wekker, S. F. J., Dommen, J., Spichtinger, N., Stohl, A., and Prévôt, A. S. H.: Quantification of topographic venting of boundary layer air to the free troposphere, Atmos. Chem. Phys., 4, 497–509, https://doi.org/10.5194/acp-4-497-2004, 2004.
Henne, S., Dommen, J., Neininger, B., Reimann, S., Staehelin, J., and Prévôt, A. S. H.: Influence of mountain venting in the Alps on the ozone chemistry of the lower free troposphere and the European pollution export, J. Geophys. Res., 110, D22307 https://doi.org/10.1029/2005JD005936, 2005.
Hennemuth, B. and Lammert-Stockschlaeder, A.: Determination of the Atmospheric Boundary Layer Height from Radiosonde and Lidar Backscatter, Bound.-Lay. Meteorol., 120, 181-0200, https://doi.org/10.1007/s10546-005-9035-3, 2006.
Hersbach, H., Bell, B., Berrisford, P., et al.: The ERA5 global reanalysis, Q. J. Roy. Meteor. Soc., https://doi.org/10.1002/qj.3803, 2020.
Highwood, E. J., Haywood, J. M., Coe, H., Cook, J., Osborne, S., Williams, P., Crosier, J., Bower, K., Formenti, P., McQuaid, J., Brooks, B., Thomas, G., Grainger, R., Barnaba, F., Gobbi, G. P., and De Leeuw, G.: Aerosol direct radiative impact experiment (ADRIEX) overview, Q. J. Roy. Meteor. Soc., 133, 3–15, 2007.
Hong, Q., Liu, C., Hu, Q., Zhang, Y., Xing, C., Su, W., Ji, X., and Xiao, S.: Evaluating the feasibility of formaldehyde derived from hyperspectral remote sensing as a proxy for volatile organic compounds, Atmos. Res., 264, https://doi.org/10.1016/j.atmosres.2021.105777, 2021.
Hüneke, T., Aderhold, O.-A., Bounin, J., Dorf, M., Gentry, E., Grossmann, K., Grooß, J.-U., Hoor, P., Jöckel, P., Kenntner, M., Knapp, M., Knecht, M., Lörks, D., Ludmann, S., Matthes, S., Raecke, R., Reichert, M., Weimar, J., Werner, B., Zahn, A., Ziereis, H., and Pfeilsticker, K.: The novel HALO mini-DOAS instrument: inferring trace gas concentrations from airborne UV/visible limb spectroscopy under all skies using the scaling method, Atmos. Meas. Tech., 10, 4209–4234, https://doi.org/10.5194/amt-10-4209-2017, 2017.
Hůnová, I., Brabec, M., and Malý, M.: Ambient ozone at a rural Central European site and its vertical concentration gradient close to the ground, Environ. Sci. Pollut. R., 30, 80014–80028, https://doi.org/10.1007/s11356-023-28016-8, 2023.
ISTAT: Annuario statistico Italiano, https://www.istat.it/?s=annuario+statistico+Italiano+2022 (last access: 5 May 2024), 2022.
Itahashi, S., Hattori, S., Ito, A., Sadanaga, Y., Yoshida, N., and Matsuki, A.: Role of Dust and Iron Solubility in Sulfate Formation during the Long-Range Transport in East Asia Evidenced by 17O-Excess Signatures, Environ. Sci. Technol., 56, 13634–13643, https://doi.org/10.1021/acs.est.2c03574, 2022.
Kaiser, J., Wolfe, G. M., Bohn, B., Broch, S., Fuchs, H., Ganzeveld, L. N., Gomm, S., Häseler, R., Hofzumahaus, A., Holland, F., Jäger, J., Li, X., Lohse, I., Lu, K., Prévôt, A. S. H., Rohrer, F., Wegener, R., Wolf, R., Mentel, T. F., Kiendler-Scharr, A., Wahner, A., and Keutsch, F. N.: Evidence for an unidentified non-photochemical ground-level source of formaldehyde in the Po Valley with potential implications for ozone production, Atmos. Chem. Phys., 15, 1289–1298, https://doi.org/10.5194/acp-15-1289-2015, 2015.
Karydis, V. A., Tsimpidi, A. P., Pozzer, A., Astitha, M., and Lelieveld, J.: Effects of mineral dust on global atmospheric nitrate concentrations, Atmos. Chem. Phys., 16, 1491–1509, https://doi.org/10.5194/acp-16-1491-2016, 2016.
Kluge, F., Hüneke, T., Knecht, M., Lichtenstern, M., Rotermund, M., Schlager, H., Schreiner, B., and Pfeilsticker, K.: Profiling of formaldehyde, glyoxal, methylglyoxal, and CO over the Amazon: normalized excess mixing ratios and related emission factors in biomass burning plumes, Atmos. Chem. Phys., 20, 12363–12389, https://doi.org/10.5194/acp-20-12363-2020, 2020.
Liguori, F. and Zannetti, M. (Eds.): Reducing atmospheric pollution in the Mediterranean port cities: The results of APICE project, APICE project final publication, 2013.
Marenco, F., Bonasoni, P., Calzolari, F., Ceriani, M., Chiari, M., Cristofanelli, P., D'Alessandro, A., Fermo, P., Lucarelli, F., Mazzei, F. and Nava, S.: Characterization of atmospheric aerosols at Monte Cimone, Italy, during summer 2004: source apportionment and transport mechanisms, J. Geophys. Res.-Atmos., 111, https://doi.org/10.1029/2006JD007145, 2006.
Marmer, E. and Langmann, B.: Impact of ship emissions on the Mediterranean summertime pollution and climate: A regional model study, Atmos. Environ., 39, 4659–4669, 2005.
McKendry, I. G. and Lundgren, J.: Tropospheric layering of ozone in regions of urbanized complex and/or coastal terrain: a review, Prog. Phys. Geogr., 24, 329–354, 2000.
Merico, E., Conte, M., Grasso, F. M., Cesari, D., Gambaro, A., Morabito, E., Gregoris, E., and Contini, D.: Trends of Shipping Impact to Particulate Matter in Two Adriatic Port-Cities, Environmental Sciences Proceedings, 8, 10, https://doi.org/10.3390/ecas2021-10343, 2021.
Millán, M. M., Salvador, R., Mantilla, E., and Kallos, G.: Photooxidant dynamics in the Mediterranean basin in summer: Results from European research projects, J. Geophys. Res., 102, 8811–8823, https://doi.org/10.1029/96JD03610, 1997.
Millán, M. M., Mantilla, E., Salvador, R., Carratalá, A., Sanz, M. J., Alonso, L., Gangoiti, G., and Navazo, M.: Ozone Cycles in the Western Mediterranean Basin: Interpretation of Monitoring Data in Complex Coastal Terrain, J. Appl. Meteorol., 39, 487–508, https://doi.org/10.1175/1520-0450(2000)039<0487:OCITWM>2.0.CO;2, 2000.
Millán, M. M., Sanz, M. J., Salvador, R., and Mantilla, E.: Atmospheric dynamics and ozone cycles related to nitrogen deposition in the western Mediterranean, Environ Pollut., 118, 167–186, https://doi.org/10.1016/s0269-7491(01)00311-6, 2002.
Millán, M. M., Estrela, M. J., Sanz, M. J., Mantilla, E., Martín, M., Pastor, F., Salvador, R., Vallejo, R., Alonso, L., Gangoiti, G., Ilardia, J. L., Navazo, M., Albizuri, A., Artíñano, B., Ciccioli, P., Kallos, G., Carvalho, R. A., Andrés, M. D., Hoff, A., Werhahn, J., Seufert, G., and Versino, B.: “Climatic feedbacks and desertification: The Mediterranean model”, J. Climate, 18, 684–701, https://doi.org/10.1175/JCLI-3283.1, 2004.
Molina, M. J. and Molina, L. T.: Megacities and Atmospheric Pollution, J. Air Waste Ma., 54, 644–680, https://doi.org/10.1080/10473289.2004.10470936, 2004.
Nyeki, S., Eleftheriadis, K., Baltensperger, U., Colbeck, I., Fiebig, M., Fix, A., Kiemle, C., Lazaridis, M., and Petzold, A.: Airborne Lidar and in-situ Aerosol Observations of an Elevated Layer, Leeward of the European Alps and Apennines, Geophys. Res. Lett., 29, 33-1–33-4, https://doi.org/10.1029/2002GL014897, 2002.
Pederzoli, A., Mircea, M., Finardi, S., di Sarra, A., and Zanini, G.: Quantification of Saharan dust contribution to PM10 concentrations over Italy during 2003–2005, Atmos. Environ., 44, 4181–4190, https//doi.org/10.1016/j.atmosenv.2010.07.031, 2010.
Putaud, J. P., Cavalli, F., Martins dos Santos, S., and Dell'Acqua, A.: Long-term trends in aerosol optical characteristics in the Po Valley, Italy, Atmos. Chem. Phys., 14, 9129–9136, https://doi.org/10.5194/acp-14-9129-2014, 2014.
Raffaelli, K., Deserti, M., Stortini, M., Amorati, R., Vasconi, M., and Giovannini, G.: Improving Air Quality in the Po Valley, Italy: Some Results by the LIFE-IP-PREPAIR Project, Atmosphere, 11, 429, https://doi.org/10.3390/atmos11040429, 2020.
re3data.org: HALO database, re3data.org – Registry of Research Data Repositories [data set], https://doi.org/10.17616/R39Q0T, 2025.
Rotach, M. W., Calanca, P., Graziani, G., Gurtz, J., Steyn, D. G., Vogt, R., Andretta, M., Christen, A., Cieslik, S., Connolly, R., De Wekker, S. F. J., Galmarini, S., Kadygrov, E. N., Kadygrov, V., Miller, E., Neininger, B., Rucker, M., Van Gorsel, E., Weber, H., Weiss, A., and Zappa, M.: Turbulence Structure and Exchange Processes in an Alpine Valley: The Riviera Project, B. Am. Meteorol. Soc., 85, 1367–1386, https://doi.org/10.1175/BAMS-85-9-1367, 2004.
Schroeder, J. R., Crawford, J. H., Fried, A., Walega, J., Weinheimer, A., and Wisthaler, A.: New insights into the column CH2O/NO2 ratio as an indicator of near-surface ozone sensitivity, J. Geophys. Res.-Atmos., 122, 8885–8907, https://doi.org/10.1002/2017jd026781, 2017.
Seibert, P., Beyrich, F., Gryning, S.-E., Joffre, S., Rasmussen, A., and Tercier, P.: Review and intercomparison of operational methods for the determination of the mixing height, Atmos. Environ., 34, 1001–1027, https://doi.org/10.1016/S1352-2310(99)00349-0, 2000.
Sillman, S.: The use of NOy, H2O2, and HNO3 as indicators for ozone-NOx hydrocarbon sensitivity in urban locations, J. Geophys. Res.-Atmos., 100, 14175–14188, https://doi.org/10.1029/94jd02953, 1995.
Souri, A. H., Nowlan, C. R., Wolfe, G. M., Lamsal, L. N., Miller, C. E. C., Gonzalez Abad, G., Janz, S. J., Fried, A., Blake, D. R., Weinheimer, A. J., Diskin, G. S., Liu, X., and Chance, K.: Revisiting the effectiveness of HCHO/NO2 ratios for inferring ozone sensitivity to its precursors using high resolution airborne remote sensing observations in a high ozone episode during the KORUS-AQ campaign, Atmos. Environ., 224, 117341, https://doi.org/10.1016/j.atmosenv.2020.117341, 2020.
Sprenger, M. and Wernli, H.: The LAGRANTO Lagrangian analysis tool – version 2.0, Geosci. Model Dev., 8, 2569–2586, https://doi.org/10.5194/gmd-8-2569-2015, 2015.
Stein, A., Draxler, R. R., Rolph, G. D., Stunder, B. J. B., Cohen, M., and Ngan, F.: NOAA's HYSPLIT Atmospheric Transport and Dispersion Modeling System, B. Am. Meteorol. Soc., 96, 2059–2077, https://doi.org/10.1175/BAMS-D-14-00110.1, 2016.
Stohl, A. and Wotawa, G.: A method for computing single trajectories representing boundary layer transport, Atmos. Environ., 29, 3235–3238, https://doi.org/10.1016/1352-2310(95)00259-2, 1995.
Stohl, A., Wotawa, G., Seibert, P., and Kromp-Kolb, H.: Interpolation errors in wind fields as a function of spatial and temporal resolution and their impact on different types of kinematic trajectories, J. Appl. Meteorol. Clim., 34, 2149–2165, https://doi.org/10.1175/1520-0450(1995)034<2149:IEIWFA>2.0.CO;2, 1995.
Stortini, M., Deserti, M., Bonafè, G., and Minguzzi, E.: Long-term simulation and validation of ozone and aerosol in the Po Valley, in: Developments in environmental sciences, edited by: Borrego C. and Renner, E., Elsevier, 6, 768–770, https://doi.org/10.1016/S1474-8177(07)06813-1, 2007.
Talbot, N., Kubelova, L., Makes, O., Cusack, M., Ondracek, J., Vodička, P., Schwarz, J., and Zdimal, V.: Outdoor and indoor aerosol size, number, mass and compositional dynamics at an urban background site during warm season, Atmos. Environ., 131, 171–184, https://doi.org/10.1016/j.atmosenv.2016.01.055, 2016.
Tampieri, F., Trombetti, F., and Scarani, C.: Summer daily circulation in the Po Valley, Italy, Geophys. Astro. Fluid, 17, 97–112, https://doi.org/10.1080/03091928108243675, 1981.
Targa, J., Colina, M., Banyuls, L., González Ortiz, A., and Soares, J.: Status report of air quality in Europe for year 2023, using validated and up-to-date data (ETC-HE Report 2024/5), European Topic Centre on Human Health and the Environment, Zenodo, https://doi.org/10.5281/zenodo.15172752, 2024.
Toscano, D.: The Impact of Shipping on Air Quality in the Port Cities of the Mediterranean Area: A Review, Atmosphere, 14, 1180, https://doi.org/10.3390/atmos14071180, 2023.
Van Dingenen, R., Putaud, J.-P., Martins-Dos Santos, S., and Raes, F.: Physical aerosol properties and their relation to air mass origin at Monte Cimone (Italy) during the first MINATROC campaign, Atmos. Chem. Phys., 5, 2203–2226, https://doi.org/10.5194/acp-5-2203-2005, 2005.
Vazquez Santiago, J., Hata, H., Martinez-Noriega, E., and Inoue, K., Ozone trends and their sensitivity in global megacities under the warming climate, Nat. Commun., https://doi.org/10.1038/s41467-024-54490-w, 2024.
Wandinger, U.: Introduction to lidar, in: Lidar: range-resolved optical remote sensing of the atmosphere, 1–18, New York, NY, Springer New York, https://doi.org/10.1007/0-387-25101-4_1, 2005.
Wang, X. Y. and Wang, K. C.: Estimation of atmospheric mixing layer height from radiosonde data, Atmos. Meas. Tech., 7, 1701–1709, https://doi.org/10.5194/amt-7-1701-2014, 2014.
Wang, Z., Pan, X., Uno, I., Li, J., Wang, Z., Chen, X., Fu, P., Yang, T., Kobayashi, H., Shimizu, A., Sugimoto, N., and Yamamoto, S.: Significant impacts of heterogeneous reactions on the chemical composition and mixing state of dust particles: A case study during dust events over northern China, Atmos. Environ., 159, 83–91, https://doi.org/10.1016/j.atmosenv.2017.03.044, 2017.
Wang, Y., Ma, Y.-F., Muñoz-Esparza, D., Li, C. W. Y., Barth, M., Wang, T., and Brasseur, G. P.: The impact of inhomogeneous emissions and topography on ozone photochemistry in the vicinity of Hong Kong Island, Atmos. Chem. Phys., 21, 3531–3553, https://doi.org/10.5194/acp-21-3531-2021, 2021.
Wang, Y., Brasseur, G. P., and Wang, T.: Segregation of atmospheric oxidants in turbulent urban environments, Atmosphere, 13, 315, https://doi.org/10.3390/atmos13020315, 2022.
Wallace, J. M. and Hobbs, P. V.: Atmospheric Science, An Introductory Survey, 2006 Elsevier, https://doi.org/10.1016/C2009-0-00034-8, 2006.
Weger, M., Heinold, B., Engler, C., Schumann, U., Seifert, A., Fößig, R., Voigt, C., Baars, H., Blahak, U., Borrmann, S., Hoose, C., Kaufmann, S., Krämer, M., Seifert, P., Senf, F., Schneider, J., and Tegen, I.: The impact of mineral dust on cloud formation during the Saharan dust event in April 2014 over Europe, Atmos. Chem. Phys., 18, 17545–17572, https://doi.org/10.5194/acp-18-17545-2018, 2018.
Weissmann, M., Braun, F. J., Gantner, L., Mayr, G. J., Rahm, S., and Reitebuch, O.: The Alpine Mountain–Plain Circulation: Airborne Doppler Lidar Measurements and Numerical Simulations, Mon. Weather Rev., 133, 3095–3109, 2005.
Wotawa, G., Kröger, H., and Stohl, A.: Transport of ozone towards the Alps – results from trajectory analyses and photochemical model studies, Atmos. Environ., 34, 1367–1377, https://doi.org/10.1016/S1352-2310(99)00363-5, 2000.
Yus-Díez, J., Ealo, M., Pandolfi, M., Perez, N., Titos, G., Močnik, G., Querol, X., and Alastuey, A.: Aircraft vertical profiles during summertime regional and Saharan dust scenarios over the north-western Mediterranean basin: aerosol optical and physical properties, Atmos. Chem. Phys., 21, 431–455, https://doi.org/10.5194/acp-21-431-2021, 2021.
Zhang, Y., Luo, G., and Yu, F.: Seasonal variations and long-term trend of dust particle number concentration over the northeastern United States. J. Geophys. Res.-Atmos., 124, 13140–13155, https://doi.org/10.1029/2019JD031388, 2019.
Zhu, S., Butler, T., Sander, R., Ma, J., and Lawrence, M. G.: Impact of dust on tropospheric chemistry over polluted regions: a case study of the Beijing megacity, Atmos. Chem. Phys., 10, 3855–3873, https://doi.org/10.5194/acp-10-3855-2010, 2010.