
the Creative Commons Attribution 4.0 License.
the Creative Commons Attribution 4.0 License.
 | 10 Jul 2026
The importance of aerosol and droplet microphysics for the properties and life cycle of radiation fog in the Po Valley
Hao Ding
Almuth Neuberger
Rahul Ranjan
Fredrik Mattsson
Liine Heikkinen
Karam Mansour
Stefano Decesari
Claudia Mohr
Alejandro Baró Pérez
Nazario Mastroianni
Paul Zieger
Ilona Riipinen
Annica M. L. Ekman
Employing high-resolution Large Eddy Simulation (LES) coupled with interactive aerosol and cloud microphysics schemes, this study investigates the influence of aerosol and droplet microphysics on the life cycle and properties of wintertime radiation fog in the Po Valley, Italy. For the simulated case, the results show that the main drivers of radiation fog onset and dissipation are nocturnal longwave cooling and surface warming, respectively. Increasing aerosol loading increases droplet number concentration, liquid water content, and fog optical thickness, which reduces droplet sedimentation rates and prolongs fog duration by up to 54 min. Overall, the microphysical influence of aerosols and droplets weakens under heavily polluted conditions. We also show that non-activated hydrated aerosols have a limited influence on total liquid water content and fog-layer mixing. However, they critically affect visibility and fog duration prediction, underscoring the importance of explicitly incorporating hydrated particles in fog forecasting and accurately representing aerosol composition. Additional sensitivity experiments reveal that the prescribed droplet spectral shape parameters significantly influence fog characteristics. Parameter settings that represent a broad droplet size spectrum overestimate the number of large droplets compared to observations, which increases mean droplet sedimentation rates and decreases mean liquid water content by up to 104 % and 78 %, respectively, compared to the settings that best represent the observed spectrum.
- Article
(7069 KB) - Full-text XML
-
Supplement
(6387 KB) - BibTeX
- EndNote


Fog is a common phenomenon in the atmospheric boundary layer, posing significant risks to transportation safety and public health due to low visibility and the accumulation of pollutants. Prolonged fog events can also adversely affect crop growth and agricultural productivity, leading to reduced yields. (Gultepe et al., 2007; Decesari et al., 2017; Leung et al., 2020; Bergot and Koracin, 2021; Lakra and Avishek, 2022). Radiation fog, one of the most frequent types of fog over land, forms primarily due to nocturnal surface radiative cooling, which leads to water vapor supersaturation and droplet formation. As the fog thickens, longwave radiative cooling at the fog top increases, promoting further condensation, while also inducing fog layer mixing through turbulence. The fog dissipation process is typically dominated by near-surface warming induced by shortwave radiation at sunrise, as well as turbulent entrainment of dry air at the fog top, reducing relative humidity and causing droplet evaporation (Gultepe et al., 2007; Bergot, 2013; Wainwright et al., 2021). Overall, the evolution of radiation fog is governed by a complex interplay of thermodynamic, dynamic, and microphysical processes in the boundary layer. These processes, including radiation, turbulent mixing, aerosol–droplet interactions, and surface exchange, are highly coupled yet nonlinear, making fog simulation and forecasting challenging (Gultepe et al., 2007; Haeffelin et al., 2010; Maronga and Bosveld, 2017; Mazoyer et al., 2019).
High-resolution large-eddy simulation (LES) models are useful tools for studying boundary-layer processes, including radiation fog, since they explicitly resolve large-scale turbulent eddies and represent supersaturation dynamics better than typical weather forecast and climate models. When coupled with radiation and aerosol–cloud microphysics schemes, LES models have been shown to represent the aforementioned nonlinear interactions and the life cycle of radiation fog reasonably well. LES has been used extensively to investigate the sensitivity of fog to meteorological conditions (e.g., surface forcing and advection) as well as aerosol properties (e.g., number concentration) (Bergot, 2013; Stolaki et al., 2015; Maalick et al., 2016). Nevertheless, the representation of aerosol-droplet-fog interactions remains one of the major uncertainties in the simulations (Boutle et al., 2022).
As a substrate for water vapor condensation, the hygroscopic growth and activation of aerosol particles are crucial for droplet formation. Previous modeling studies of aerosol-fog interactions have shown that higher aerosol number concentrations result in more activated droplets, increased liquid water content (LWC), and an optically thicker fog, which delays fog dissipation and thereby prolongs fog lifetime (Bott et al., 1990; Zhang et al., 2014; Stolaki et al., 2015; Maalick et al., 2016). Furthermore, non-activated hydrated aerosols, having grown to micron sizes, can also influence the optical properties of fog. These hydrated particles remain relatively small and have little effect on the longwave radiation budget and the optical thickening of fog (Boutle et al., 2018). However, due to their large number and high scattering and extinction efficiency, hydrated particles can substantially reduce visibility, even in the absence of activated droplets (Kokkola et al., 2003; Elias et al., 2009, 2015; Hammer et al., 2014). The ability of dry aerosol particles to take up water can be expressed by the hygroscopicity parameter (κ), which depends on the chemical composition and mixing state of the aerosol (Petters and Kreidenweis, 2007). Under highly polluted conditions, intense competition for water vapor due to the abundance of cloud condensation nuclei (CCN) leads to low ambient supersaturation values, which limits the number of activated fog droplets. Thus, in polluted environments and in relation to the size distribution, the chemical composition and hygroscopicity of aerosols have been suggested to play a limited role in droplet activation and fog processes (Bott, 1991; Mazoyer et al., 2019; Neuberger et al., 2025a). In contrast, under clean conditions and with higher supersaturation values, a larger fraction of hydrated particles is closer to the critical activation size, and the κ value would play a larger role for the number of droplets activated.
The shape of the droplet size distribution is also important for fog evolution, as it describes the distribution of LWC across droplets as well as the relationship between LWC and the droplet number concentration Nc (Mazoyer et al., 2022). For a droplet spectrum that follows a gamma distribution and a given Nc, larger shape parameters (i.e., α and ν in Sect. S1 in the Supplement) yield a narrower droplet spectrum, which typically suppresses autoconversion and sustains higher droplet number concentrations (Seifert and Beheng, 2001). Moreover, a narrow size distribution reduces the effective droplet radius, a key factor determining cloud and fog optical properties (Morrison and Grabowski, 2007). Previous studies have demonstrated that variations in droplet size distribution parameterizations can influence key fog processes, including collision-coalescence efficiency, sedimentation rates, and the vertical extent of the fog layer (Boutle et al., 2022; Pope and Igel, 2023). In previous numerical studies, shape parameters are often empirically prescribed based on the geographical region (e.g., Bari et al., 2015; Wurtz et al., 2021; Contreras Osorio et al., 2022), an idealized practice that limits their general applicability. Notably, even within a single fog event, shape parameters can exhibit considerable variability, with local values showing no clear correlation with droplet number concentrations (Miles et al., 2000; Geoffroy et al., 2010; Igel and van den Heever, 2017). Moreover, the spectral dispersion determined by the shape parameters also shows a non-monotonic relationship with the volume-mean droplet size, depending instead on the relative strength of processes such as condensation/evaporation, activation/deactivation, and entrainment-mixing that reshape the droplet size distribution (Wang et al., 2023). Despite the substantial uncertainties, there have been only a few numerical studies that examined how the fog life cycle is affected by the representation of the droplet size distribution.
In this study, we make use of LES and an extensive dataset of fog properties from the Fog and Aerosol Interaction Research Italy (FAIRARI) field campaign 2021/22 in the Po Valley (Neuberger et al., 2025b) to examine aerosol-fog interactions from a microphysical perspective. The FAIRARI dataset includes meteorological conditions, aerosol physicochemical properties, and droplet measurements, providing a basis for model initialization and serving as a reference for model evaluation. The dataset encompasses detailed information on the size distribution of aerosols and cloud droplets, making it particularly suitable for investigating fog microphysical features. The Po Valley is in general an interesting area for aerosol-fog interaction studies – it is a region of frequent radiation fog formation, and several field campaigns focusing on fog have been carried out there in the past (e.g., Fuzzi et al., 1992; Frank et al., 1998; Hamed et al., 2007; Decesari et al., 2017; Paglione et al., 2020). Furthermore, pollution levels today are much lower than in the 1980s (cf. Noone et al., 1992), which may influence the life cycle and properties of the fog. Despite the lower pollution levels, Neuberger et al. (2025a) showed that hydrated aerosols still have a substantial impact on fog microphysical properties in the region. Against this background, and based on sensitivity experiments using the LES, we aim to address the following questions:
-
What microphysical conditions are critical for capturing the general characteristics of the observed fog properties and life cycle?
-
How sensitive are the fog properties to aerosol physics, including the total particle number concentration, particle mean size, and modal width?
-
What is the role of aerosol chemistry for the fog properties under different pollution conditions, and what is the importance of hydrated aerosols?
-
How important is the model representation of the droplet size distribution, and how do variations in droplet microphysical parameters affect the fog behavior?
2.1 Case description
The FAIRARI campaign 2021/22 (Neuberger et al., 2025b) was conducted at the San Pietro Capofiume site (SPC, 44.65° N, 11.62° E) in Italy, which represents a background-polluted continental environment in the eastern Po Valley. The measured quantities and corresponding instruments used in this study are summarized in Sect. S2. We focus on three consecutive radiation fog events that took place during the winter of 2022, labeled as events 7, 8, and 9 (Neuberger et al., 2025b) (see Fig. 1a). The series of events began at 18:49 LST (local standard time, UTC+1) on 18 February, and the fog dissipated completely by 07:38 LST on 19 February, with a mean visibility (Vis) ranging between 66 and 151 m. The fog formation was triggered by longwave radiation loss and nocturnal surface cooling, leading to air saturation and aerosol activation. The near-surface layer was stably stratified, characterized by weak turbulence (mean turbulent kinetic energy, TKE ∼0.011 m2 s−2) and light winds (mean speed ∼ 0.6–0.9 m2 s−2), predominantly from the southeast to the south (125–200°). The stable conditions favored the accumulation of a high aerosol load (mean number concentration for particles with diameters 13.3–792 nm, Na∼6065 cm−3) and fog droplets (mean number concentration for droplets with diameters 2–60 µm, Nc ∼59 cm−3 and effective diameter, ED ∼ 13 µm) close to the surface and a progressively increasing optical thickness of the fog layer during the evening and early night.
The aerosol chemical composition in terms of mass was dominated by ammonium nitrate, ammonium sulfate, and organics, with minor fractions of chloride and black carbon (Fig. 2). The bulk median hygroscopicity parameter κ of the mixture, calculated using the Zdanovskii–Stokes–Robinson (ZSR) method (Stokes and Robinson, 1966), is approximately 0.45 during the fog events, indicating moderately hygroscopic aerosols. The relatively high κ promoted hygroscopic aerosol growth and the formation of non-activated hydrated particles (hereafter referred to as hydrated particles), which substantially influenced the fog microphysics, particularly droplet number concentration and effective diameter (see further discussion in Neuberger et al., 2025a). As a result of their hygroscopic growth, hydrated particles also contribute to a bimodal droplet size distribution (Figs. 1a and 3a).
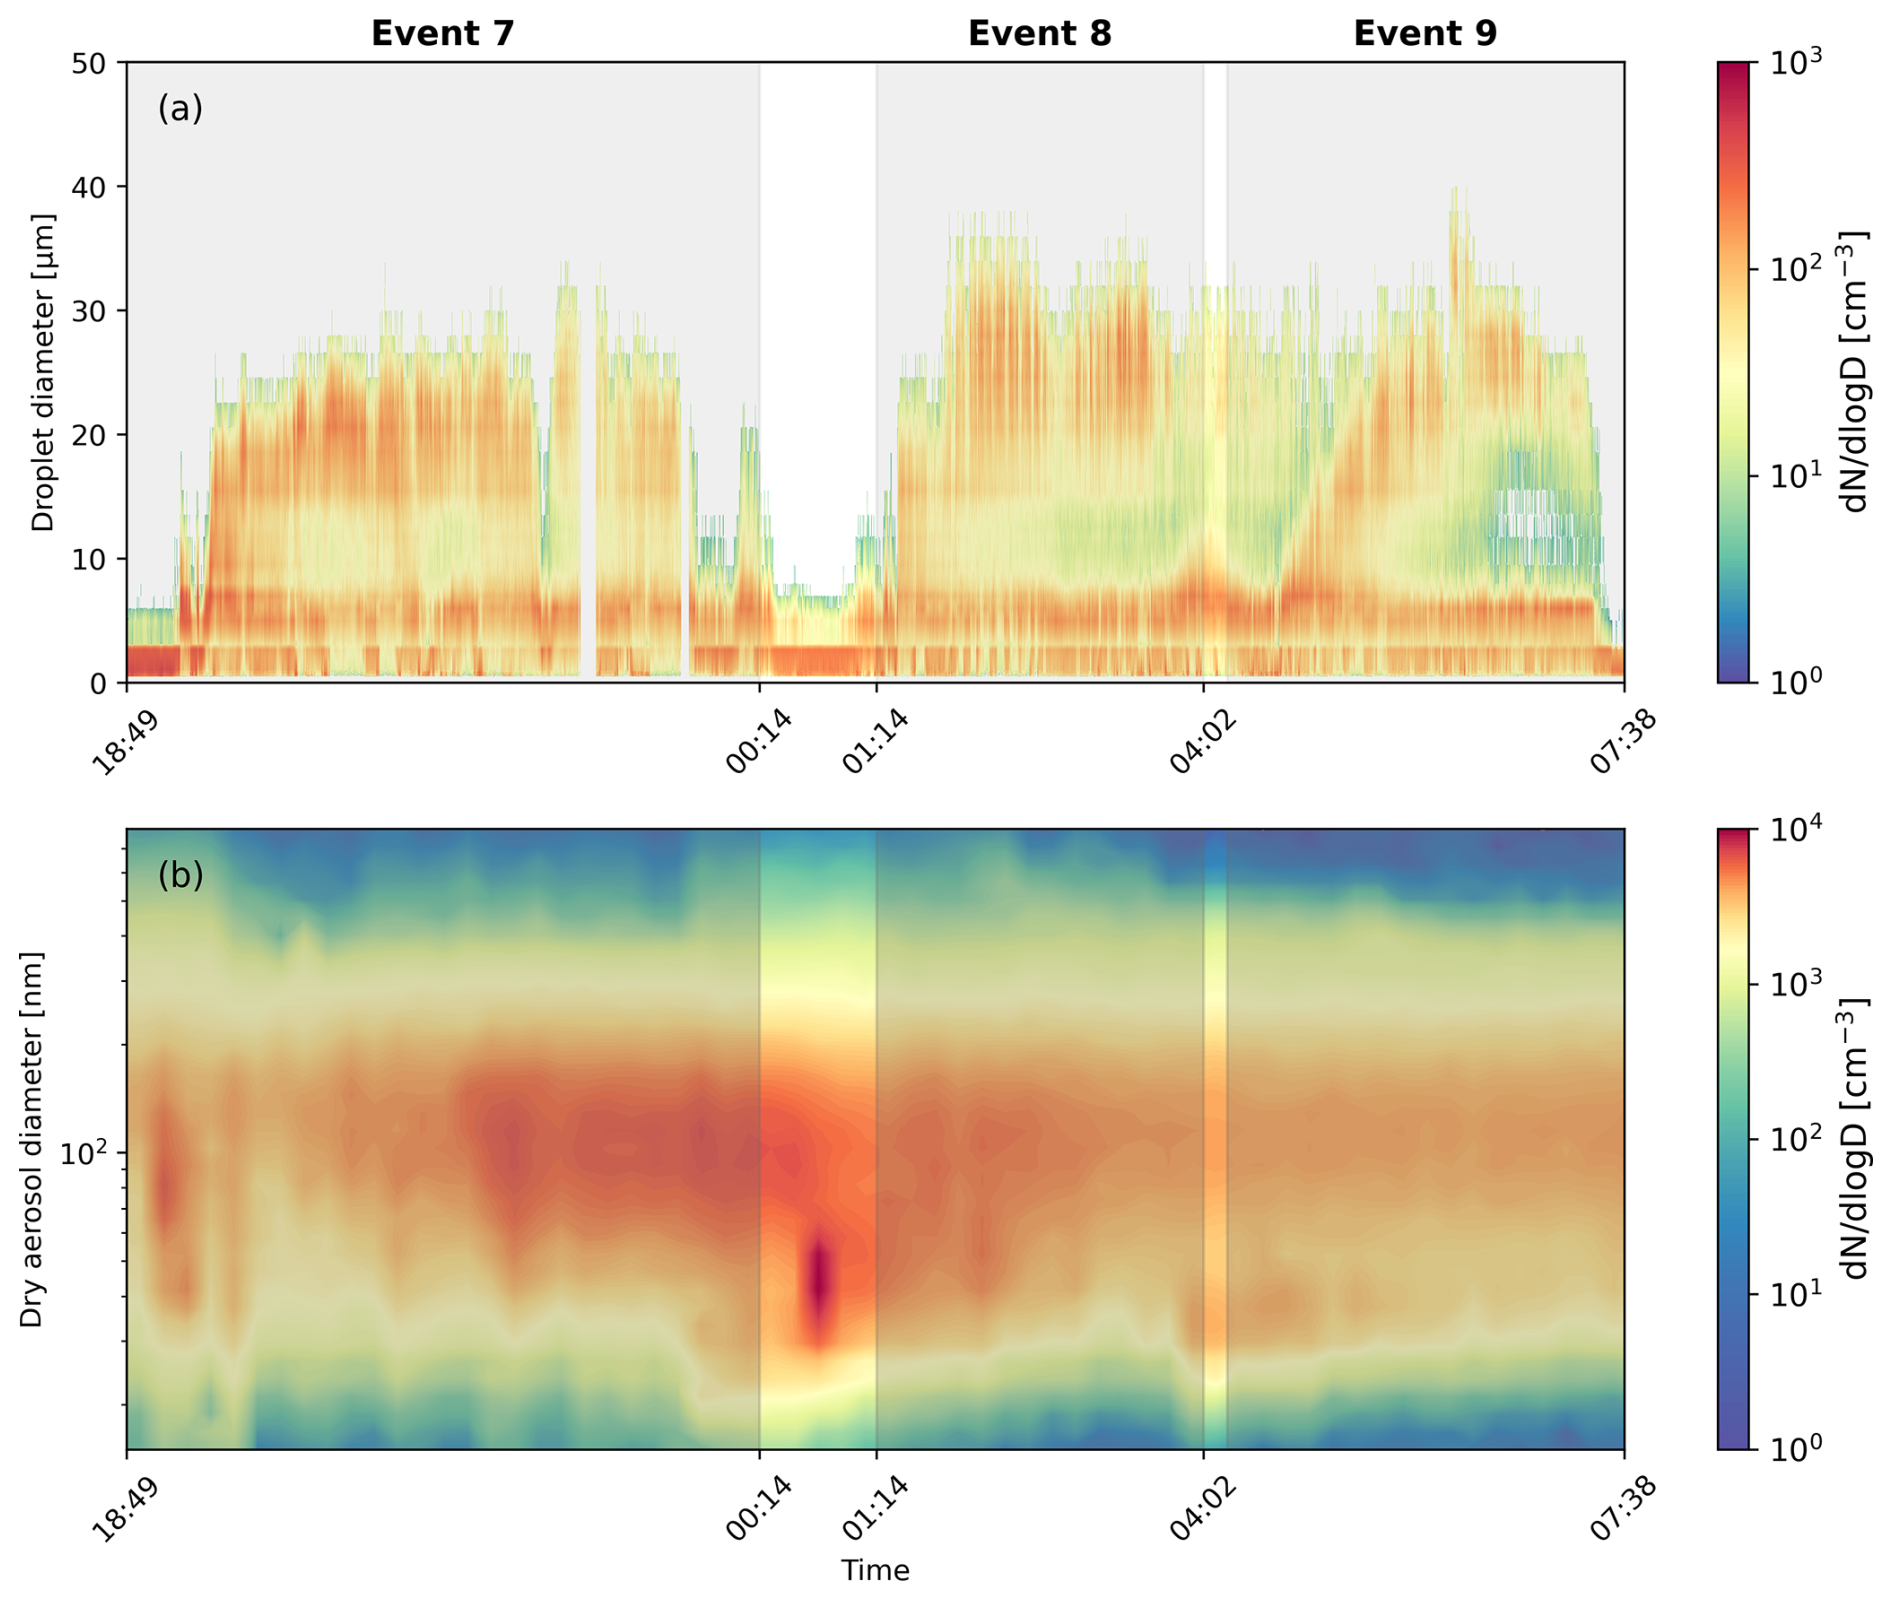
Figure 1Observed near-surface (a) droplet spectrum and (b) dry aerosol spectrum for fog events 7, 8, and 9 on 18–19 February 2022. The shaded gray areas indicate periods with fog (see also Neuberger et al., 2025b).
In this study, the observed wet critical activation size (i.e., the maximum size of non-activated hydrated particles) was determined using two approaches (see Neuberger et al., 2025a for details). The first approach followed Hammer et al. (2014), identifying the ambient activation diameter as the first local minimum from the right side of droplet size distribution; particles larger than this threshold were classified as activated droplets. The second approach employed a closure analysis, comparing the dry aerosol spectrum with the droplet spectrum. Assuming activation starting from the largest aerosols, the dry distribution was integrated until it matched the activated droplet number concentration, the resulting dry particle size was taken as the dry critical activation diameter, and the corresponding wet activation diameter was then calculated using κ-Köhler theory. For fog events 7–9, the wet activation diameters calculated using κ-Köhler theory resulted in a mean value of 9.7 µm (Neuberger et al., 2025a), based on which the observed wet particles were categorized into two groups: particles ranging from the typical lower measurement limit of fog monitors (2 µm) up to approximately 10 µm were counted as hydrated particles, while those larger than 10 µm were considered activated droplets. This classification generally agrees with the bimodal size distribution shown in Fig. 1a.
During the three fog events, two brief interruptions were observed (at 00:14–01:14 and 04:02–04:14 LST), corresponding to periods that did not meet the fog criteria of Vis ≤ 1 km and RH ≥ 90 % (Neuberger et al., 2025b). The first interruption was additionally characterized by a temporary disappearance of large droplets and a sharp decrease in LWC, leaving only residual haze particles (Fig. 1a). We suggest that these interruptions were caused by short-term near-surface warming that led to droplet evaporation, although the precise local meteorological drivers remain unclear (see Sect. 3.1).
2.2 Model description
The simulations were carried out using the MISU–MIT Cloud and Aerosol model (MIMICA; Savre et al., 2014), a three-dimensional LES code that solves the equations describing a non-hydrostatic, incompressible atmospheric system. The model employs a 1.5-order subgrid-scale turbulence closure scheme and computes surface fluxes using Monin–Obukhov similarity theory (Stull, 1988), enabling the representation of the exchange of momentum, heat, and moisture between the surface and atmosphere under specified surface forcing. Warm cloud microphysics is represented using a two-moment bulk scheme (Seifert and Beheng, 2001, 2006), which predicts the mass mixing ratios and number concentrations of hydrometeors. The mass distributions of cloud droplets and raindrops are described by gamma functions. Raindrop terminal velocities follow a power-law relationship (Seifert and Beheng, 2006; Savre et al., 2014), while cloud droplet terminal velocity is computed based on a generalized gamma distribution within the Stokes regime and is incorporated into the prognostic equations for droplet number concentration Nc and liquid mixing ratio Qc (see Sect. S1). Supersaturation is explicitly resolved using the pseudo-analytical approach of Morrison and Grabowski (2008), with its effects on condensation and evaporation integrated at each time step.
MIMICA includes an interactive aerosol scheme, where aerosols are described using a two-moment module with all aerosol modes following lognormal size distributions (Ekman et al., 2006). The aerosol number size distribution with respect to particle radius r in mode k is given by:
where Na,k is total aerosol number concentration, rg,k is geometric mean radius and σk is geometric standard deviation for mode k.
In the present study, the aerosol size distribution is represented by one mode, covering the measured size range of 13.3–792 nm. Aerosol hygroscopic growth and activation into droplets are calculated based on κ-Köhler theory (see Sect. S3). Consistent with the lower measurement threshold common in fog monitors (Neuberger et al., 2025a), particles with wet diameters larger than 2 µm are typically classified as fog droplets. To further investigate the role of fog droplets with different sizes in fog processes, and similar to the classification of observed wet particles, a detailed classification is applied here to the simulated wet particles: particles that have grown a wet diameter above 2 µm but do not reach the activation size are categorized as hydrated aerosols, whereas those exceeding the activation size (determined by κ-Köhler theory) are counted as activated droplets. Accordingly, the number concentration of total droplets Nc is the sum of hydrated aerosols Nc,hyd and activated droplets Nc,act:
Radiative transfer is computed using a four-stream scheme (Fu and Liou, 1993), which includes six bands for solar radiation and twelve bands for the infrared part. This scheme accounts for the radiative effects of cloud droplets and raindrops, allowing a dynamic coupling between radiation and cloud microphysical processes. Note that the aerosol particles do not directly affect the radiative transfer, only indirectly by altering the fog microphysical properties.
Based on the above schemes, the diagnosed microphysical quantities of total droplets are used to characterize the fog life cycle and optical properties. Fog periods are defined by a Vis ≤ 1 km and RH ≥ 90 % (Neuberger et al., 2025b), where the parameterized visibility Vis is calculated as a function negatively correlated with LWC and Nc (Gultepe et al., 2006):
where ρair is the air density and Qc is liquid mixing ratio. This parameterization is applicable for LWC in the range of 0.005–0.5 g m−3 and Nc within 1–400 cm−3.
The liquid water path LWP and optical thickness τ of the fog layer are calculated following Morrison and Grabowski (2007) and Brenguier et al. (2011) as:
where the fog top and base heights are determined from grid cells meeting the criteria: Nc,act≥1 cm−3 and Qc≥0.01 g kg−1 (Maronga and Bosveld, 2017); ρw is the density of liquid water, ρair the air density, and the droplet effective radius is calculated as .
2.3 Simulation setup
Our reference simulation was initialized at 18:00 LST on 18 February 2022 and continued until 14:00 LST the following day, with a temporal resolution of approximately 1.0 s. Simulation tests showed that this time step optimally balanced numerical accuracy in resolving the supersaturation evolution and computational efficiency. A coarser time step was found to overestimate local supersaturation and droplet activation (Schwarz et al., 2024). The simulation domain was 0.16 km × 0.16 km × 1.6 km, with a grid spacing of 5 m × 5 m × 2 m.
The initial vertical profiles of temperature and humidity were configured using a combination of radiosonde observations at SPC and ECMWF Reanalysis (ERA5, Hersbach et al., 2023). The radio sounding and reanalysis both indicated warm-air advection above the fog layer around 22:00 LST. To reproduce this feature, we applied nudging based on the ERA5 profiles between 21:30 and 22:30 LST, primarily for warm advection above 120 m (Fig. S1 in the Supplement). The initial horizontal wind field was set to zero, in agreement with observations and reanalysis that showed weak near-surface winds and wind shear. Since the series of fog events was mainly driven by radiative cooling with negligible vertical motion, the initial updraft was also set to zero. For the surface forcing, the surface skin temperature (SST) was prescribed using 3.5-m temperature observations starting from 18:00 LST (Fig. S2). Due to the absence of soil moisture observations, the baseline surface skin moisture (SSM) was also interpolated based on the 3.5-m data, which were saturated during nighttime. At sunrise, the 3.5-m humidity measurements remained saturated and were thus not representative of the response of soil moisture to shortwave heating. To account for surface heating and subsequent evaporation, we estimated the surface relative humidity RH (in %) after sunrise using the revised Tetens formula (Alduchov and Eskridge, 1996):
where the dew point temperature (Td) was approximated by the nocturnal minimum temperature. The influence of surface forcing is further discussed in Sects. 3.1 and S6, where sensitivity tests are labeled as SFC_SST and SFC_SSM.
The observed aerosol size distribution showed a relatively large variability during the series of fog events (see Fig. 1b), with total number concentrations ranging between 4067 and 9927 cm−3. Given the very low aerosol activation rate (<1 %, cf. Neuberger et al., 2025b), aerosol scavenging and regeneration processes were neglected, and the dry aerosol population was kept close to the fitted observational means during the simulations. In the lognormal distribution fitting, priority was placed on ensuring that the particle size distribution and spectral mean diameter of the accumulation mode matched the observed spectrum, as large particles in these size ranges dominated activation, as suggested by Neuberger et al. (2025a). Specifically, the total aerosol concentration was set to 5000 cm−3, the geometric mean radius to 48.2 nm, and the dimensionless geometric standard deviation to 1.9. The chemical composition of the aerosol mixture was prescribed as constant, based on the observational mean, represented by a molar weight of 49.35 g mol−1, a density of 1618.62 kg m−3, and an average κ of 0.45, with its individual chemical components shown in Fig. 2.
As mentioned in Sect. 2.2, the prescribed shape of the droplet size distribution in MIMICA follows a gamma distribution. Figure 3a shows the observed fog droplet size distribution, together with different idealized gamma distributions using a range of shape parameters. As discussed in Neuberger et al. (2025b), the observations show a clear bimodal droplet size distribution, with one peak around 6 µm, associated with non-activated hydrated particles, and a second peak around 10–40 µm, associated with activated fog droplets. For the reference simulation, we used a distribution with shape parameters α=3 and ν=1, which reasonably captures the observed mean activated droplet spectrum (Fig. 3). The peak associated with the hydrated aerosols is predicted in MIMICA by the aerosol module using κ-Köhler theory (see Sect. S3).
Additionally, given the small average droplet size and the correspondingly low collision efficiency and following the recommendation from Riipinen et al. (2026), the collision-coalescence process was turned off in MIMICA in the reference simulation (tests with collision-coalescence enabled are presented in Sect. S5). The droplet autoconversion term was also excluded due to the absence of precipitation in the observations. Notably, by deactivating these two processes, the droplet size distribution in the model can be maintained largely consistent with that implied by the prescribed shape parameters; otherwise, potential adjustments to the droplet size distribution through collision–coalescence and autoconversion could introduce inconsistencies with the droplet spectrum corresponding to sedimentation rates calculated based on the prescribed shape parameters.
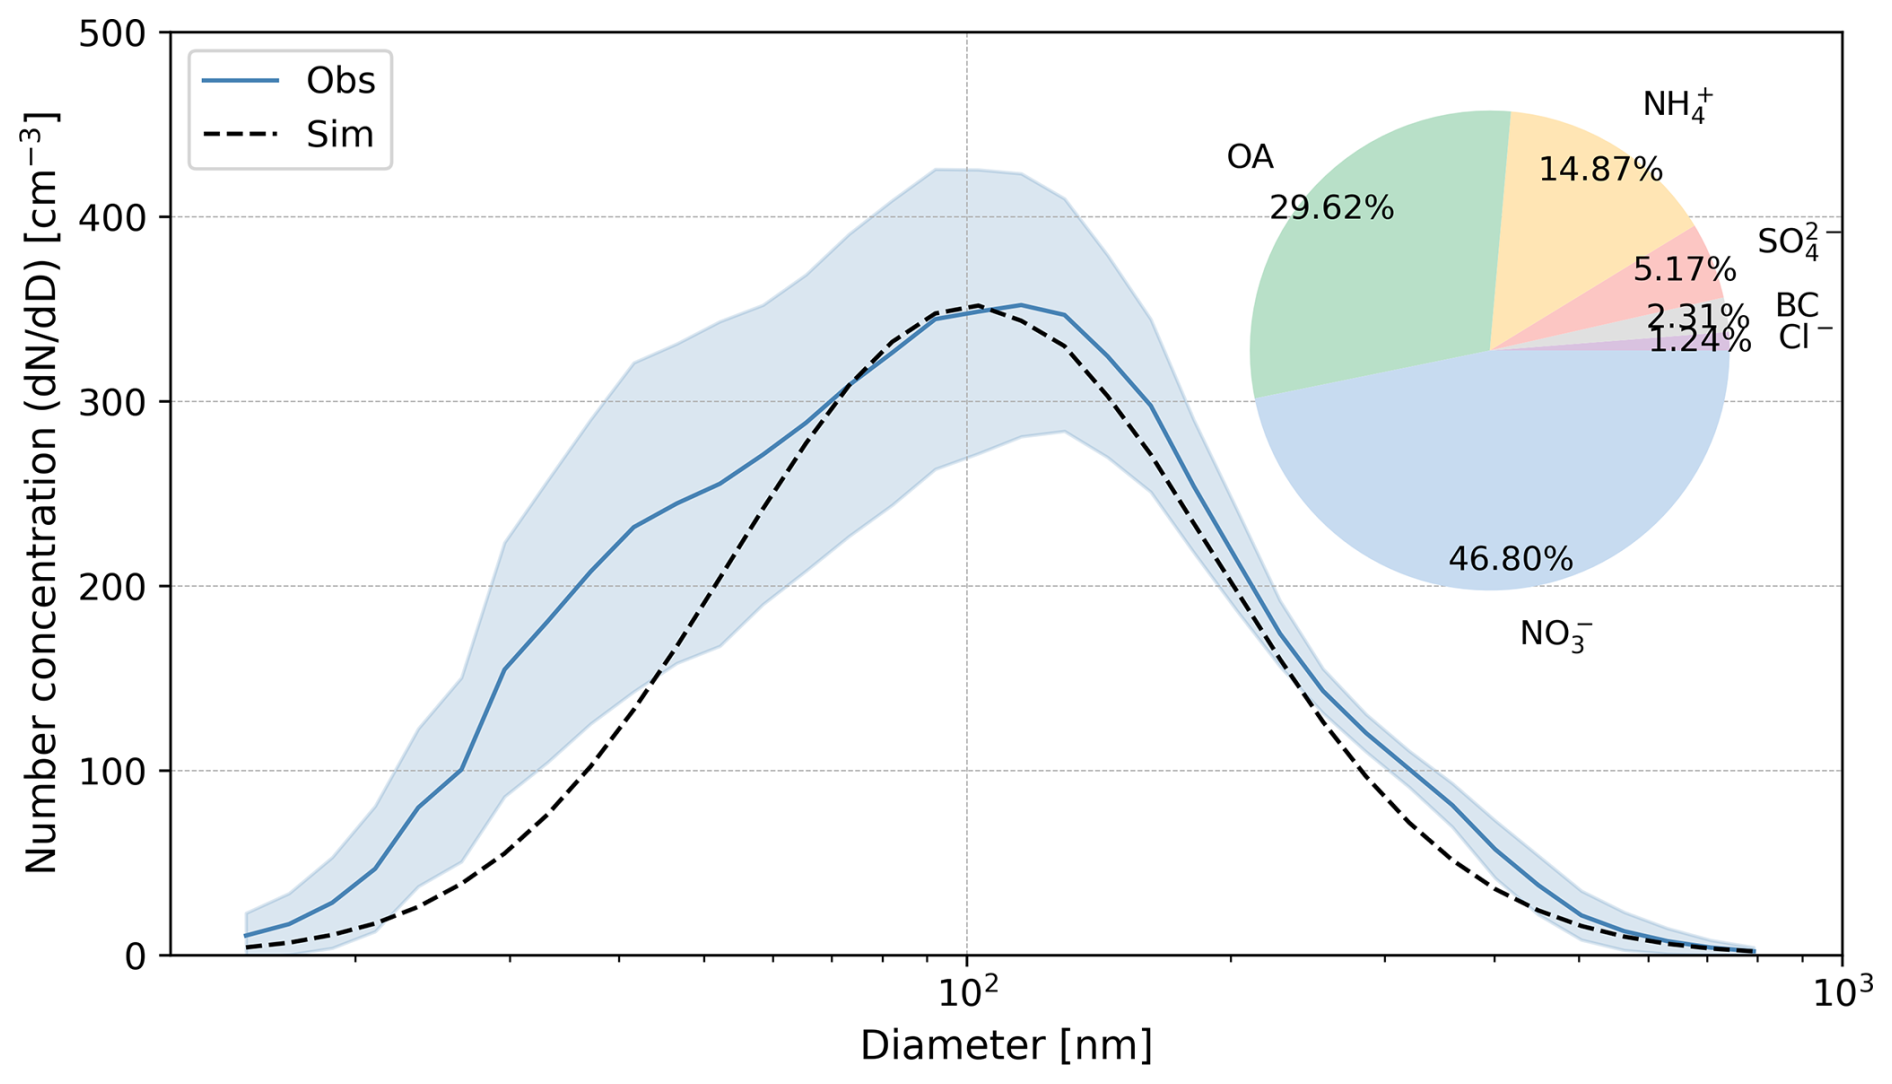
Figure 2Initial aerosol number size distribution and chemical composition mass fractions used in the reference simulation (Sim), fitted from the observed mean aerosol spectrum over the fog events (Obs), with the shaded area indicating ±1 SD.
2.4 Sensitivity experiments
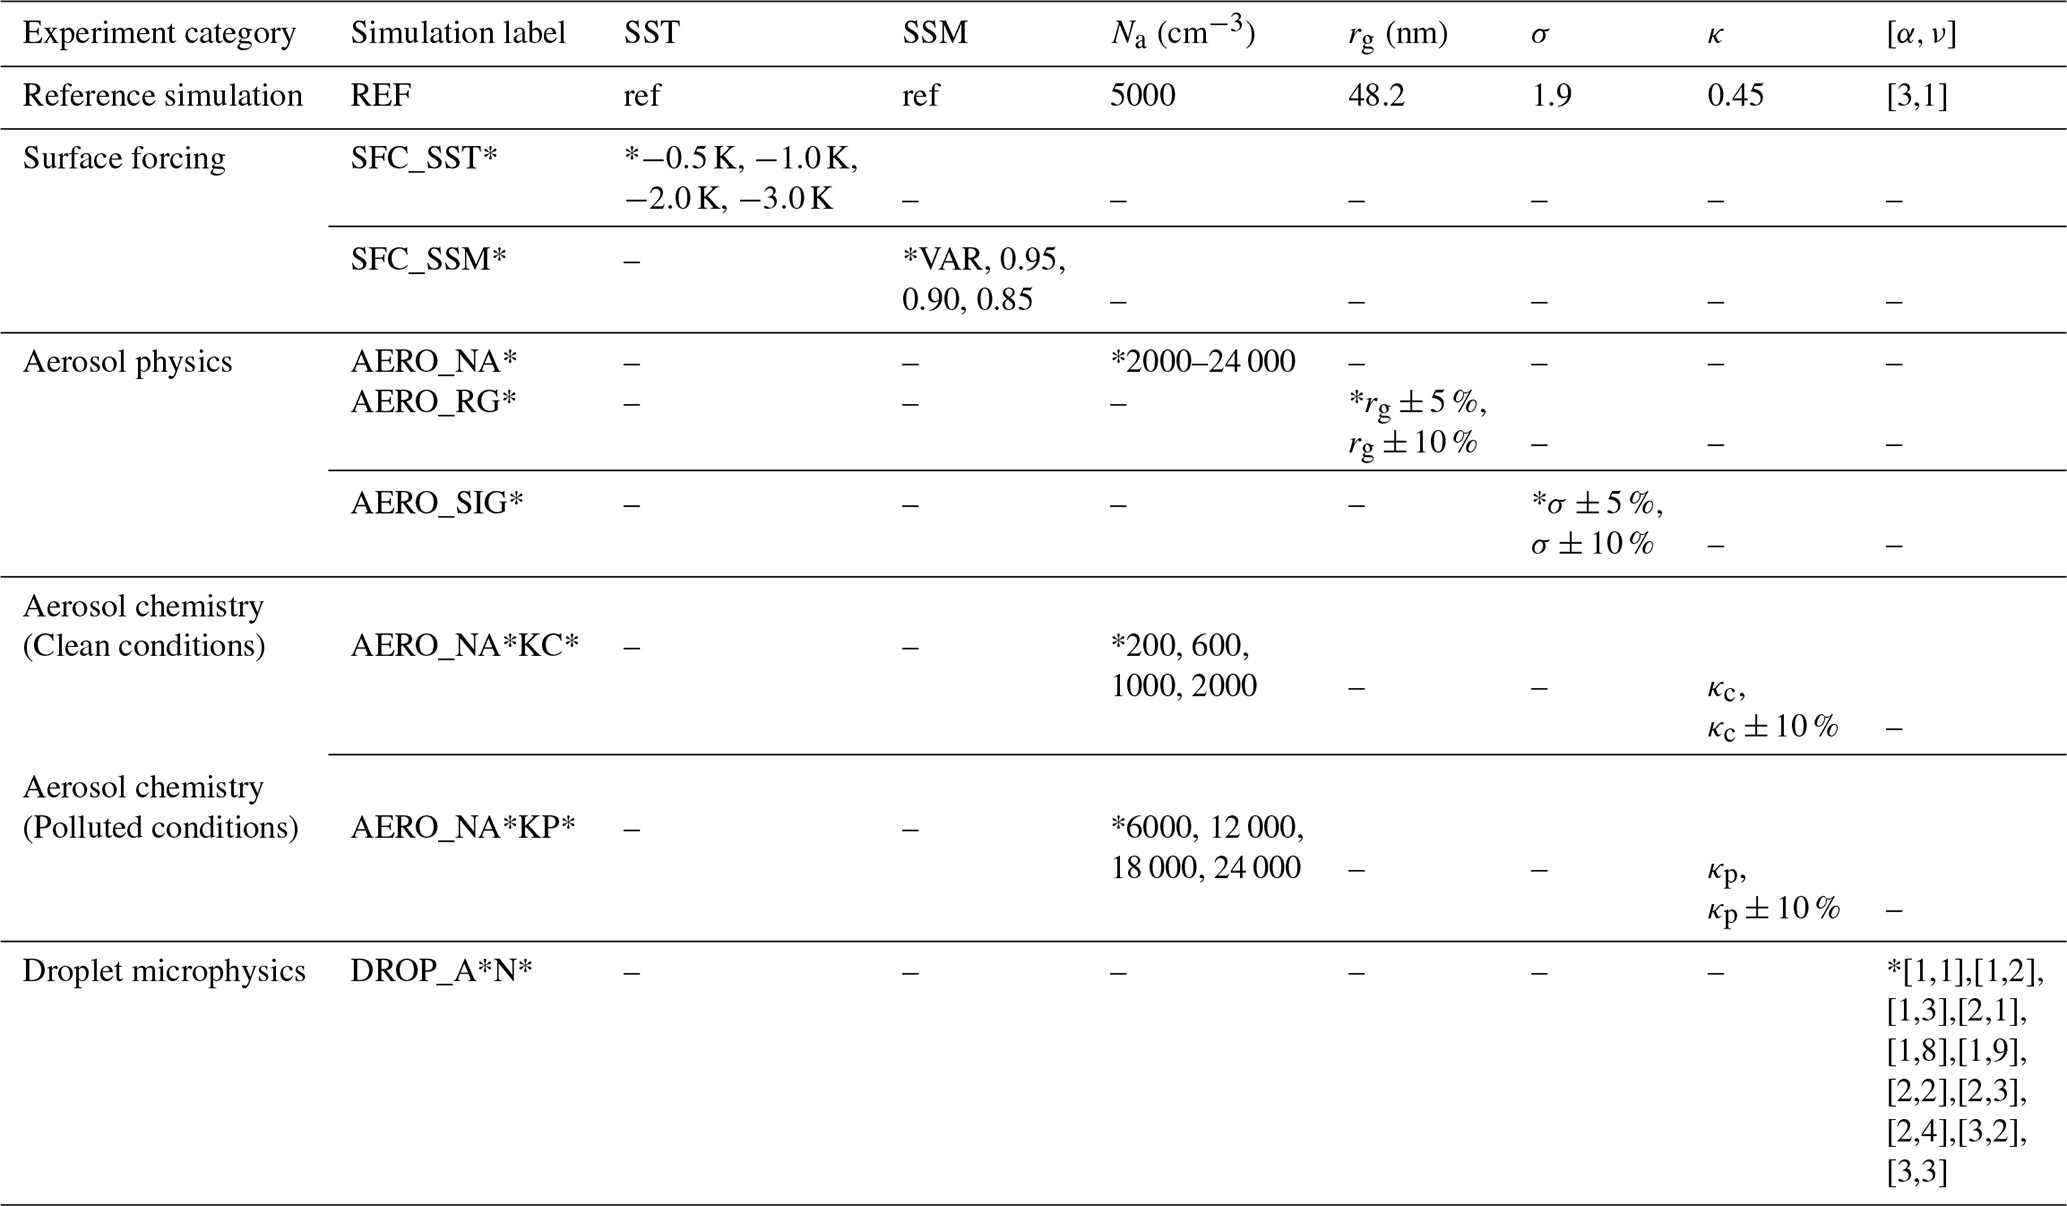
To address the research questions outlined in the introduction and, specifically, to quantify the responses of fog properties to variations in aerosol regimes and droplet microphysical representations, we conducted sensitivity experiments. To systematically evaluate the effects of individual parameters while minimizing parameter interactions, we implemented the one-at-a-time (OAT) sensitivity for the tests. An overview of the experimental design is given in Table. 1.
2.4.1 Aerosol physics
The aerosol size distribution critically determines both the number of CCN and their activation efficiency (Dusek et al., 2006; Rose et al., 2010). Here, we focus our analysis on changes in the total aerosol number concentration (Na). Similar to non-surface clouds, for a constant LWC, an increase in Na generally produces a higher concentration of smaller droplets, which enhances the cloud's optical thickness and impacts the radiative properties (Twomey, 1977). Furthermore, smaller droplet sizes also suppress autoconversion and the formation of precipitation, which reduces sedimentation rates and can lead to an extended residence time of liquid water (Albrecht, 1989; Yan et al., 2021), i.e. a longer fog duration (Stolaki et al., 2015; Maalick et al., 2016; Yan et al., 2020). For this study, Na was varied from 2000 to 24 000 cm−3 with 2000 cm−3 intervals (labeled as AERO_NA*). The chosen range of aerosol concentrations was based on observations from the Po Valley during the 1980s–1990s as well as the recent FAIRARI campaign (Noone et al., 1992; Neuberger et al., 2025b).
In the sub-micron size range, nucleation mode and Aitken mode particles typically originate from local emissions, whereas accumulation mode aerosols often undergo coagulation and long-range transport, and generally exhibit higher activation efficiency (Seinfeld and Pandis, 2016). For a log-normal aerosol size distribution, variations in modal composition are reflected in predefined geometric mean radius rg and standard deviation σ: smaller rg and σ values are usually associated with locally sourced, single-origin particles, whereas larger rg and σ indicate a greater contribution from accumulation mode particles that have aged, are internally mixed, and exhibit multi-source characteristics.
To investigate the response of fog to changes in the aerosol spectral parameters, sensitivity experiments were conducted by perturbing σ and rg by ±5 % and ±10 % within the observed range of variation for the fog events (denoted as AERO_SIG* and AERO_RG*, respectively). Positive perturbations shift the size distribution toward the accumulation mode, while negative perturbations enhance the relative contribution of nucleation and Aitken mode particles. The perturbed size distributions were compared with the observed spectrum, showing that the mean relative deviation (MRD, defined as the average of the relative errors across sizes normalized by the observational standard deviation) does not exceed 1.5 SD for negative perturbations while remaining below 0.7 SD for positive perturbations. The responses of fog properties to these perturbations are presented in Sect. S7.
2.4.2 Aerosol chemistry
Building upon the discussion in Sect. 1 regarding the role of aerosol chemical composition under different pollution conditions, we developed a series of κ perturbation experiments (±10 %, within the range observed during fog events 7–9) across varying aerosol loading to further quantify the impact. For typical clean conditions (Na<2000 cm−3), which are rarely observed in the Po Valley, the background aerosol composition was initialized using observations from the Hyytiälä site (Heikkinen et al., 2020), with a baseline bulk κ of 0.27, and Na set to 200, 600, 1000, and 2000 cm−3. For the polluted scenarios, the baseline aerosol composition and κ (0.45) were the same as in the reference simulation, while Na was set to 6000, 12 000, 18 000 and 24 000 cm−3. The simulations under clean and polluted conditions are labeled as AERO_NA*KC* and AERO_NA*KP*, respectively. Note that σ and rg were kept the same in all simulations here.
2.4.3 Droplet microphysics
To investigate the sensitivity of fog development to variations in the prescribed droplet size distribution, the observed mean droplet spectrum was fitted with a general gamma distribution. Based on the fitting results, as well as typical distributions reported in previous studies (e.g., Contreras Osorio et al., 2022), a series of α and ν shape parameter combinations (Fig. 3, labeled as DROP_A*N*, where A stands for α and N for ν) were selected and systematically evaluated. The results indicate that medium width spectrum combinations [2,3] and [2,4], as well as [3,1], which was used in the reference simulation, provide a good fit for the activated droplet range (diameter >10 µm) (Fig. 3b). The potential impact of wider spectrum combinations, which may be less physically realistic but have been adopted in previous studies (e.g., Contreras Osorio et al., 2022), was also examined.
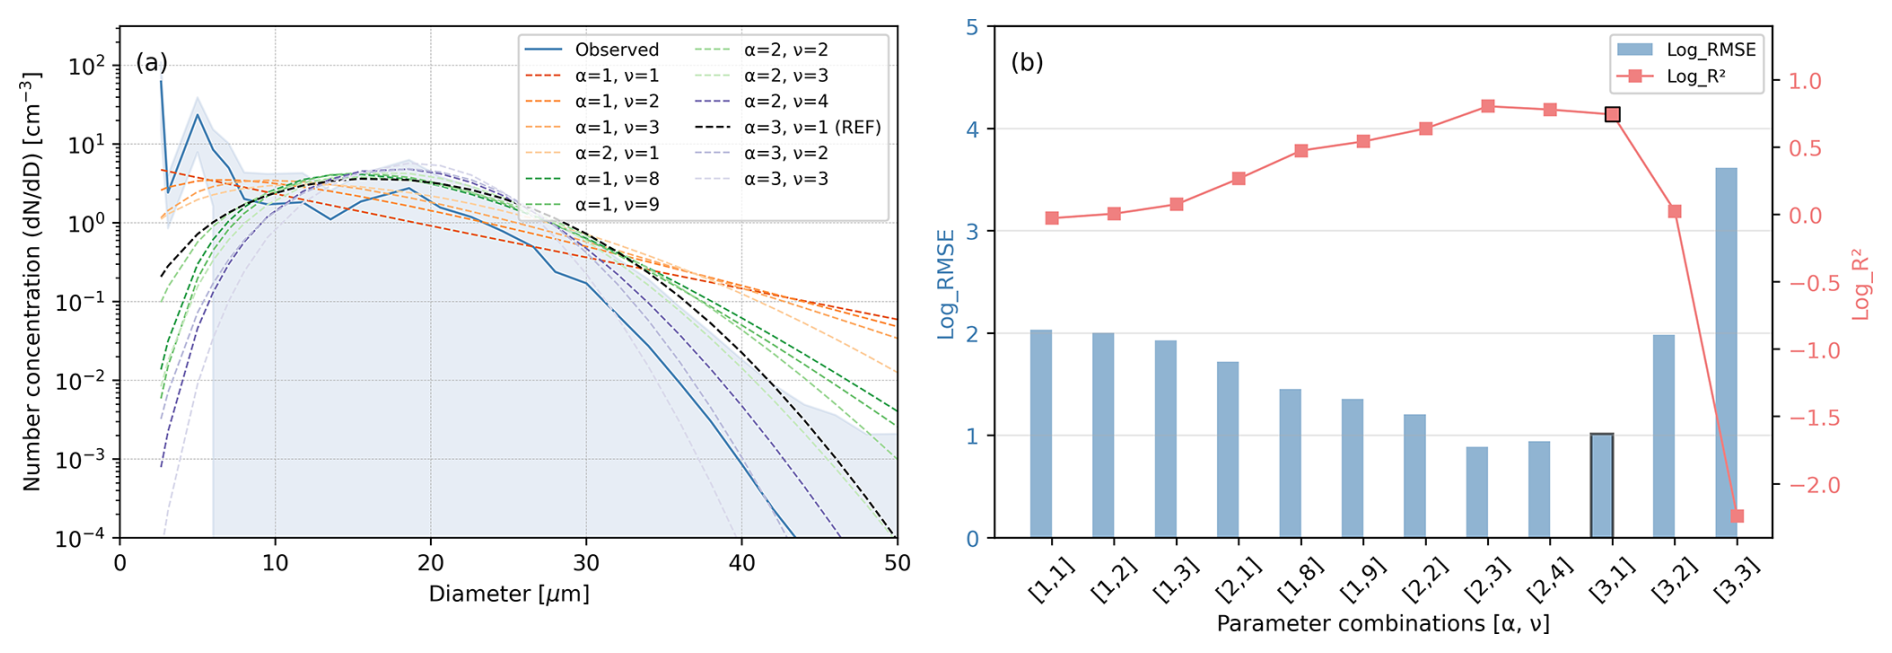
Figure 3(a) Comparison of observed mean droplet number size distribution (solid line) and model-fitted generalized gamma distributions (dashed lines) for different combinations of shape parameters α and ν. The shaded area represents ±1 SD. (b) Goodness-of-fit in log-space for the corresponding parameter combinations in the activated particle range (>10 µm), with blue bars representing the root mean square error (RMSE) and red lines representing the coefficient of determination (R2).
Table 1Summary of sensitivity experiments. Key parameters include SST (surface skin temperature) and SSM (surface skin moisture) for surface forcing; Na (aerosol number concentration), rg (geometric mean radius) and σ (geometric standard deviation) for aerosol log-normal distribution; and α,ν (shape parameters) for droplet gamma distribution.
3.1 Reference simulation
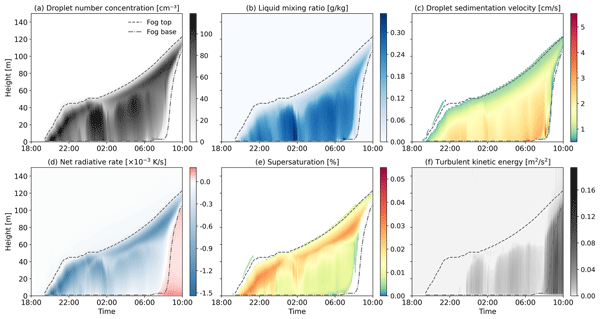
The reference simulation (REF, Fig. 4) serves as a baseline for our study and is compared to observational data (Figs. 5 and 6) to evaluate the model performance. Figure 4 shows the time height evolution of in-fog properties. Nocturnal longwave radiative cooling at the surface results in supersaturated air, droplet activation, and fog formation around 19:30 LST. The fog top lifting is mainly attributed to sustained radiative emission by the droplets, with additional contributions from air radiative loss and turbulent diffusion (Price, 2011; Dimitrelos et al., 2020). For the present case, the presence of advected warm air above the fog limits the vertical development. Neglecting the advection, and thus the entrainment of warm, dry air at the fog top, results in a considerably thicker fog layer and an extended fog lifetime compared to the REF simulation (see Sect. S5). As the fog develops and becomes optically thick, the region of strong radiative cooling shifts gradually from the surface to the fog top, where supersaturation and droplet concentrations reach peak levels. During the mature stage (e.g., 00:00–02:00 LST), the negative buoyancy generated by fog-top cooling, together with a weak surface warming (Fig. S2), renders the fog layer thermodynamically unstable and triggers convection. This enhances the mixing within the fog layer and suppresses droplet sedimentation, resulting in relatively high droplet number concentrations and liquid water content. After sunrise, near-surface warming induces droplet evaporation, leading to a decoupling of the fog layer from the surface. In addition, droplet sedimentation is found to play an important role in fog dissipation. If the sedimentation scheme is disabled (see Sect. S5), fog liquid water content, droplet number and geometrical thickness are significantly overestimated, and the dissipation is also delayed compared to observations.
The near-surface microphysics and visibility time series are evaluated against the observations in Fig. 5. MIMICA simulates the dissipation phase well, but the onset occurs approximately 41 min later than observed. This delay is likely related to uncertainties in the prescribed surface forcing, as the REF simulation relies on 3.5-m air temperature due to the absence of in-situ ground surface temperature measurements. In stable boundary layers, the ground surface is typically colder than the near-surface air and cools at a faster rate, as also reported in early Po Valley field campaigns (Wobrock et al., 1992). Sensitivity experiments with surface temperature perturbations of −0.5 to −3.0 K confirm that lowering the surface temperature results in earlier fog onset (see Fig. S4a), consistent with Price (2011), who noted that locally cooler or moister surfaces tend to favor fog formation.
The simulated near-surface supersaturation (0.0034 %–0.0294 %, mean 0.0129 %) is in reasonable agreement with observational supersaturation constraints (0.0117 %–0.0238 %, mean 0.0165 %; Neuberger et al., 2025a), indicating that the REF simulation realistically captures the local microphysical conditions governing droplet activation. The model also reproduces the observed mean droplet size reasonably well but overestimates the number of activated droplets and the liquid water content (Fig. 5c, a, and b, respectively), which is a common issue when using bulk microphysics schemes (Schwenkel and Maronga, 2019; Boutle et al., 2022). Another potential reason for the overestimate by MIMICA is that the model does not include a detailed parametrization of atmosphere–surface interactions. For example, processes such as droplet deposition at the surface and interception by vegetation are not represented (Katata, 2014). This overestimation is particularly pronounced for large droplets. As shown in Fig. 6, the simulated number concentration of droplets larger than 25 µm is substantially higher than observed, except for event 8. These large droplets dominate the total fog water and are most likely the primary reason for the positive modeled bias in liquid water mixing ratio (Fig. 5). However, the surface flux of water vapor also plays a crucial role in regulating the liquid water content. A series of sensitivity experiments was conducted, where the surface relative humidity was set to 85 %, 90 %, and 95 % (SSM_085, SSM_090, and SSM_095) and the nocturnal surface warming and evaporation processes based on Eq. (6) were refined (labeled as SSM_VAR). These adjustments effectively reduce droplet numbers and liquid water relative to REF, and in some cases (e.g., SSM_090 and SSM_085), the model has the potential to capture water loss and non-fog periods between fog events (see Sect. S6).
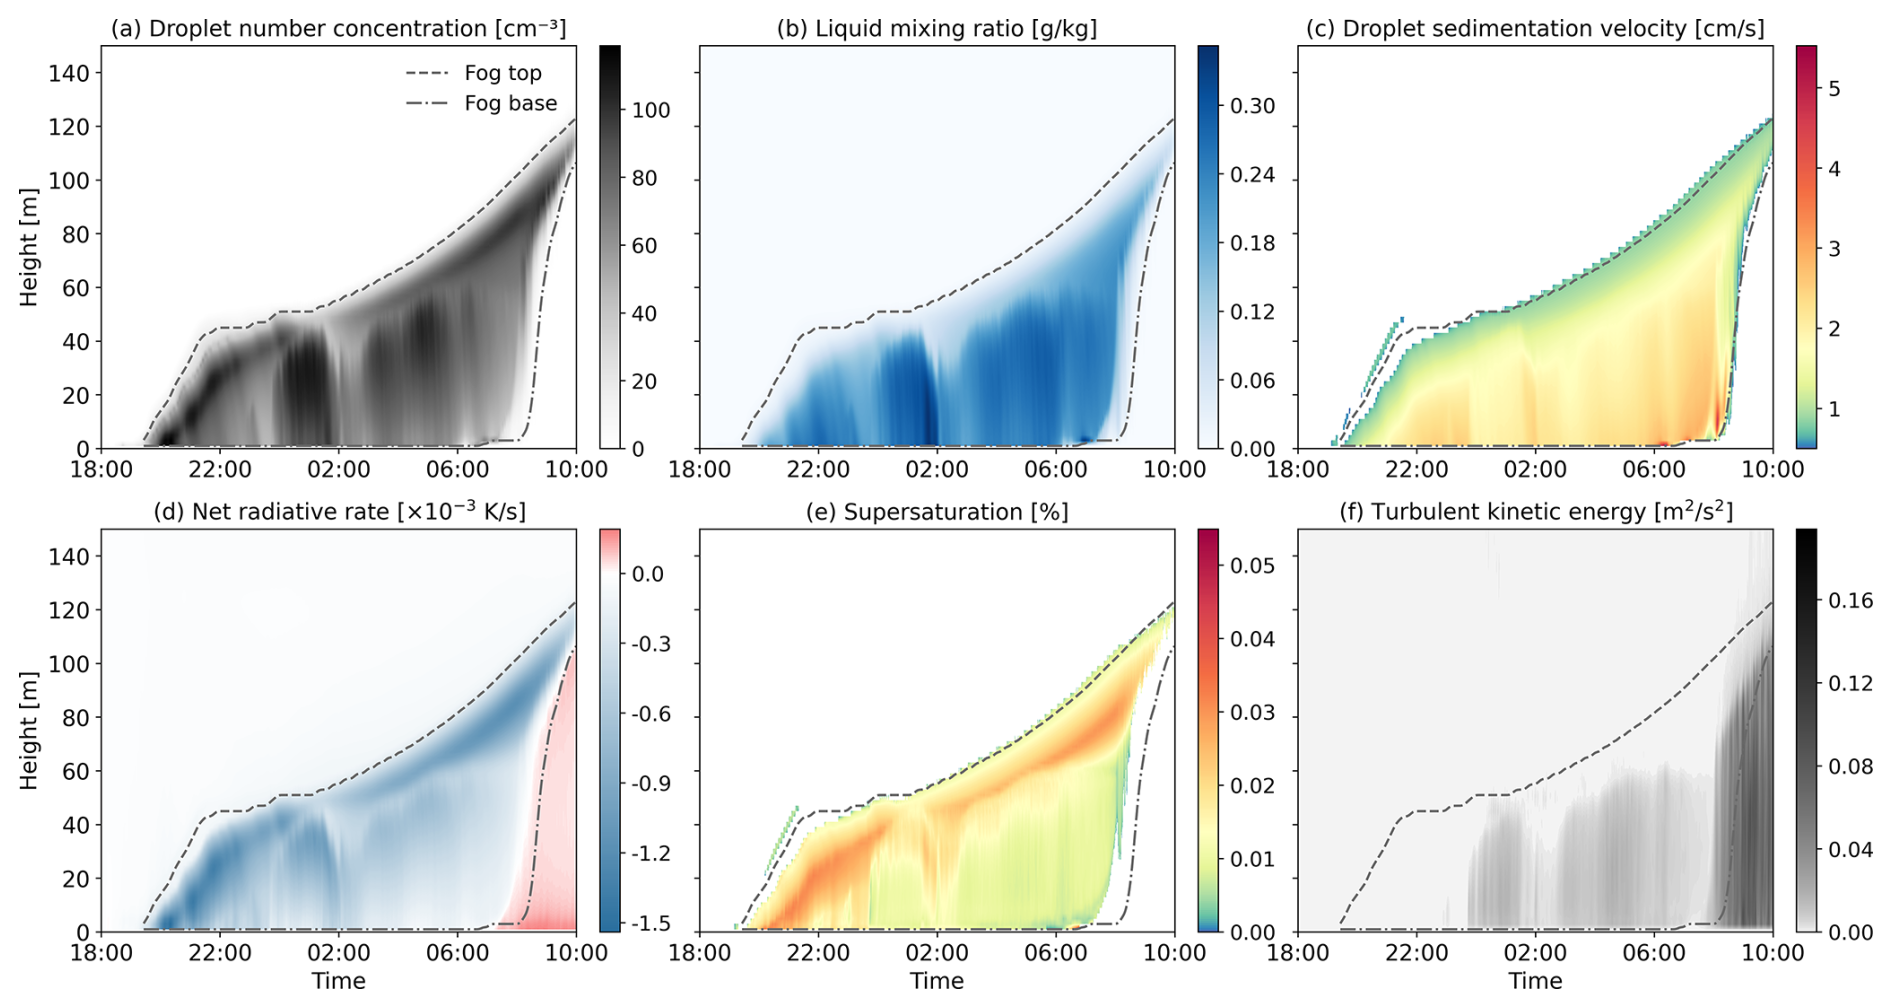
Figure 4Time–height cross-sections of horizontally averaged fog properties in the reference simulation: (a) droplet number concentration, (b) liquid water mixing ratio, (c) droplet sedimentation velocity, (d) net radiative temperature rate, (e) supersaturation and (f) turbulent kinetic energy. The fog top and base are shown as dashed and dash-dotted gray lines.
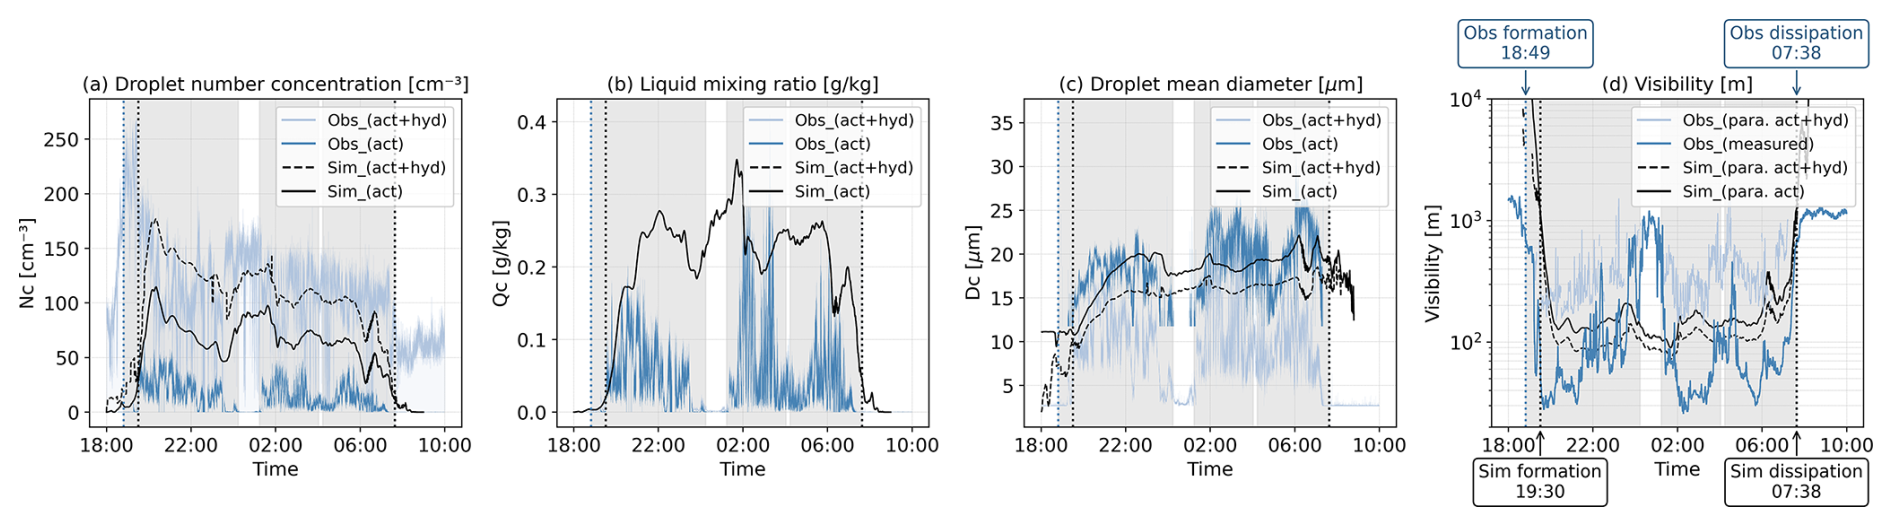
Figure 5Time series of near-surface (a) droplet number concentration, (b) liquid water mixing ratio, (c) droplet mean diameter and (d) measured and parameterized (para.) visibility from observations (obs) and simulations (sim) for the whole fog event, where “act” refers to activated droplets only and “act+hyd” includes both activated droplets and hydrated aerosols. The shaded gray areas indicate fog periods identified from the observation. Note that this figure differs slightly from Fig. 11 in Neuberger et al. (2025a) due to updated meteorological conditions and fog period criteria in the current study.
In contrast to the overestimation of activated droplets, MIMICA reproduces fewer hydrated particles than observed (Fig. 5), which is most likely because the hygroscopic growth factor in the model is calculated using a bulk-averaged method, that is, all dry particles take up water vapor with the same factor (see Sect. S3). In reality, due to the Kelvin effect, small particles have a high surface curvature, which increases their equilibrium vapor pressure and inhibits water uptake, whereas larger particles have lower curvature and can absorb water more easily. In other words, the hygroscopic growth factor should increase with particle size, meaning that larger particles should grow more than smaller ones (see the comparison between observed and simulated wet aerosols in Fig. 6). Note that when comparing the total number of droplets (i.e., hydrated particles + activated droplets), the model agrees well with observations, indicating that the high bias in activated droplets is partially compensated by the low bias of hydrated particles. Due to their small size, simulated hydrated particles do not contribute substantially to the total fog water content (<1 %). Consequently, and in line with Boutle et al. (2018), our simulations show that the development of a well-mixed fog layer is primarily driven by the activated droplets; deactivating the hygroscopic growth scheme in MIMICA has a negligible effect on fog thickness τ and liquid water path LWP (see Sect. S5).
The parameterized visibility from the simulation is generally higher than the observed one (Fig. 5d). This discrepancy can be partly attributed to the fact that extinction, as a function of wavelength and droplet size distribution (Koschmieder, 1924), is not explicitly resolved in MIMICA. Another reason is that in the observations the visibility sensor accounts also for extinction from very fine particles, whereas in the parameterization from Gultepe et al. (2006), only droplets larger than 2 µm are included. Additionally, neglecting the hydrated particles would result in a further overprediction of visibility (17.80 %–79.03 %, mean 39.64 %) and biases in fog period estimation (Fig. 5d).
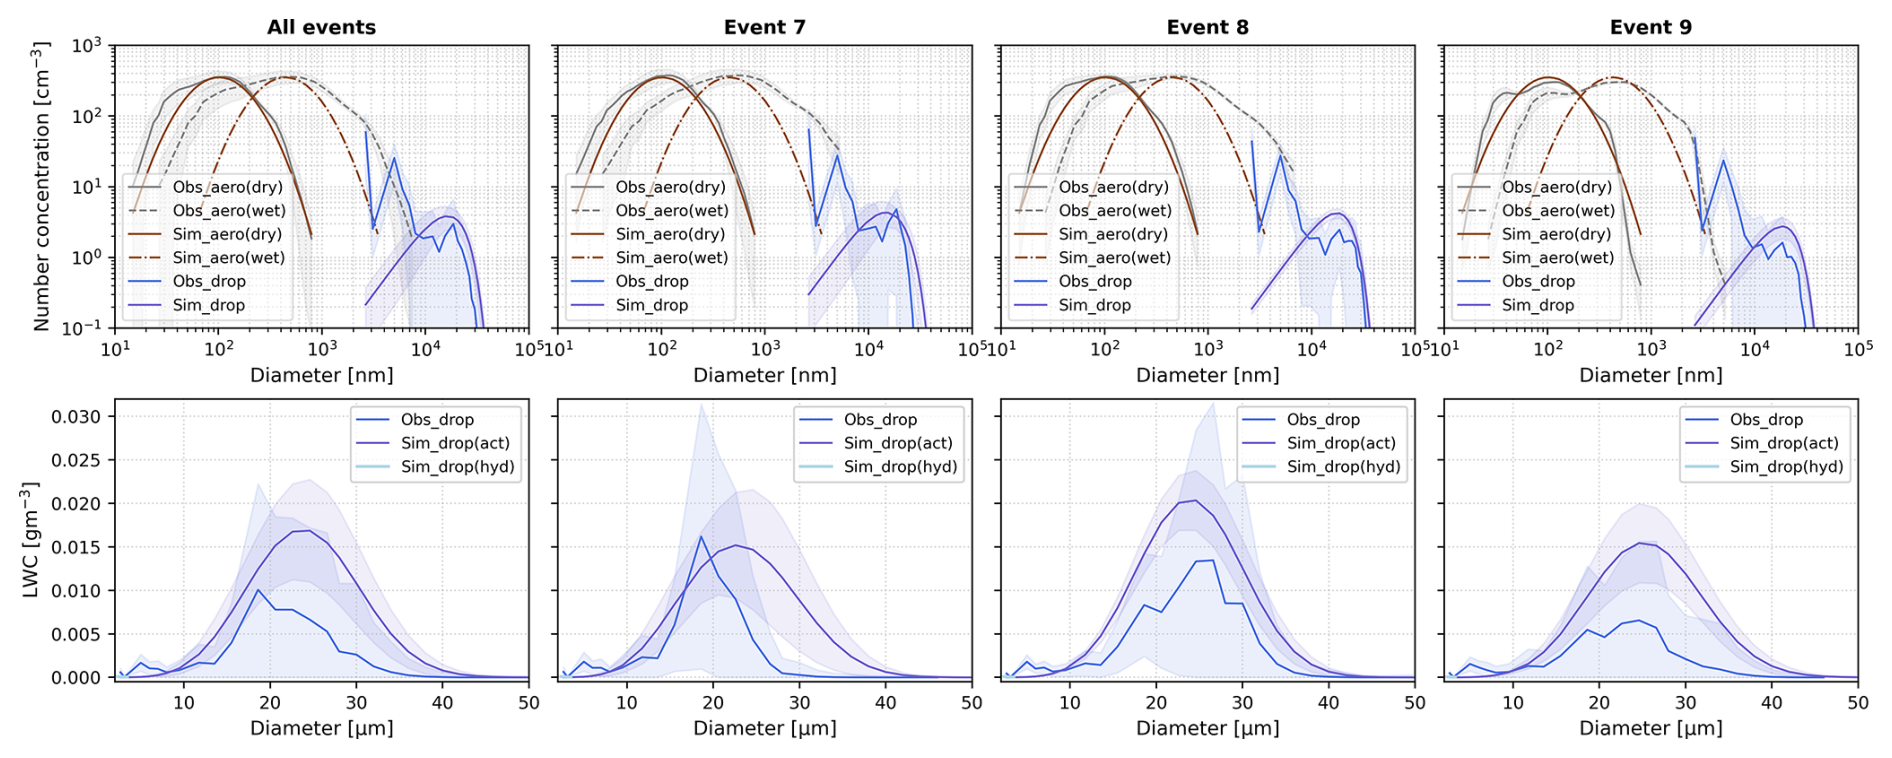
Figure 6Size distributions of observed (Obs) and simulated (Sim) aerosols and fog droplets, averaged over fog events 7, 8, and 9. Upper panel: number concentrations, lower panel: LWC. “Dry” and “wet” refer to aerosols before and after hygroscopic growth, respectively. Shaded areas indicate ±1 SD. Note that the LWC of simulated hydrated droplets (Sim_drop (hyd)) is visible only within a very narrow diameter range in the lower left corner of the LWC panel.
3.2 Sensitivity to aerosol physics
As described in Sect. 2.4.1, to assess the impact of aerosol number concentration Na on fog properties, we conducted the AERO_NA sensitivity experiments, with Na varying from 2000 to 24 000 cm−3 in 2000 cm−3 increments. With higher Na, the number of both activated and hydrated particles increases, resulting in a higher liquid water content and a decrease in visibility (Fig. 7c, d, h). At the same time, the longwave radiative cooling is enhanced, which increases negative buoyancy and elevates TKE, thereby promoting stronger fog layer mixing during the mature stage. Under conditions of nearly constant water vapor available for condensation, stronger competition for vapor reduces the mean droplet radius (Fig. 7e), which is consistent with the Twomey effect in clouds (Twomey, 1977), and was also observed during the field campaign (Neuberger et al., 2025a). In addition, enhanced competition suppresses ambient supersaturation, resulting in a smaller fraction of particles that can be activated (i.e., the activation fraction in Fig. 8a). The droplet conversion fraction, i.e., the ratio of the total droplet number to the aerosol number, also decreases with increasing Na; nevertheless, the relative contribution of hydrated particles to the total droplet population increases and becomes dominant at around Na=12 000 cm−3 (Fig. 8b). In other words, variations in total Nc are largely attributable to changes in the number of hydrated particles at high aerosol concentrations. Considering the underestimate of the hygroscopic growth factor noted in Sect. 3.1, their actual contribution should be higher, and the threshold Na where they start to dominate the total droplet number concentration is likely lower.
For cases with Na<14 000 cm−3, the fog lifetime is generally prolonged with increasing Na, manifested as slightly earlier formation and a more pronounced, delayed dissipation (Fig. 7a, b). The earlier onset is due to the reduction in visibility caused by the numerous hydrated particles under high Na conditions during the initial stage of the fog, when droplet activation has not yet become dominant. The delayed dissipation can, in our simulations, be attributed to the reduced sedimentation rates that extend the residence time of fog droplets (Fig. 7g), consistent with the cloud lifetime effect (Albrecht, 1989). The amount of shortwave radiation that reaches the surface is also reduced, which, in reality, should dampen surface warming and slow down droplet evaporation (Jia et al., 2019; Yan et al., 2020). However, in our simulations, the surface forcing was kept identical across all Na cases. Consequently, this type of suppression of near-surface droplet evaporation under high Na is not represented. The case Na=8000 cm−3 appears to stand out from the other cases, with fog dissipating about 7 minutes earlier than in Na=6000 cm−3. However, this difference is not significant. The behavior can be attributed to a slightly faster decrease in Nc and Qc in Na=8000 cm−3 than in Na=6000 cm−3 during the dissipation phase, which accelerates the increase in visibility above the 1 km threshold that is used to identify fog dissipation. The exact timing for when the visibility threshold is passed can be affected by small random perturbations that are used to initialize the model (e.g., in potential temperature). To examine the influence of the random perturbations, we performed duplicate simulations for Na=8000 cm−3 with different random perturbations. These two simulations did indeed show slightly different times for fog dissipation.
For Na>12 000 cm−3, the fog duration becomes almost insensitive to further increases in Na. The reason is that the aerosol activation transitions from an aerosol-limited to a supersaturation-limited regime at high aerosol concentrations. For a constant amount of condensable water vapor, the ambient supersaturation will decline and stabilize as Na increases (Fig. 7f), meaning that adding more aerosols will not lead to increased activation. This explains the pronounced decline in the relative sensitivity of Nc to changes in Na (Fig. 8c). Furthermore, since the change in Nc is small, the change in mean droplet size and sedimentation velocity (which is proportional to the square of the droplet size, see Sect. S1) also becomes small (Fig. 7g). Consequently, the visibility (Fig. 7h) becomes insensitive to increased Na, and the response of fog lifetime to Na becomes nonlinear.
This result shows that differences in sedimentation rates and the resulting impact on visibility become negligible under extremely high pollution conditions (Fig. 7g, h). Fig. 8c also shows that the relative sensitivity of Nc to changes in Na declines sharply at high Na, primarily due to the availability of water vapor and supersaturation.
Figure 9 shows the fog height and optical properties for the AERO_NA experiments. In contrast to Stolaki et al. (2015), where halving or doubling the CCN concentration was found to alter fog height by around 35 %, our results show a small influence of changing Na. When Na is doubled, the fog-top height increases on average by no more than 4 %. Even across all AERO_NA cases, the average fog top increase does not exceed 11 %. This suggests that the geometric thickness of the fog layer exhibits a relatively weak sensitivity to variations in Na, when only longwave emission by droplets and subsequent buoyancy-driven turbulent mixing are considered (and no other aerosol-driven radiative effects). By comparison, Na exerts a more pronounced effect on the LWP and fog optical thickness, where the elevated Nc and LWC with increasing Na are a result of not only more activation but also reduced sedimentation that prolongs the droplet residence time.
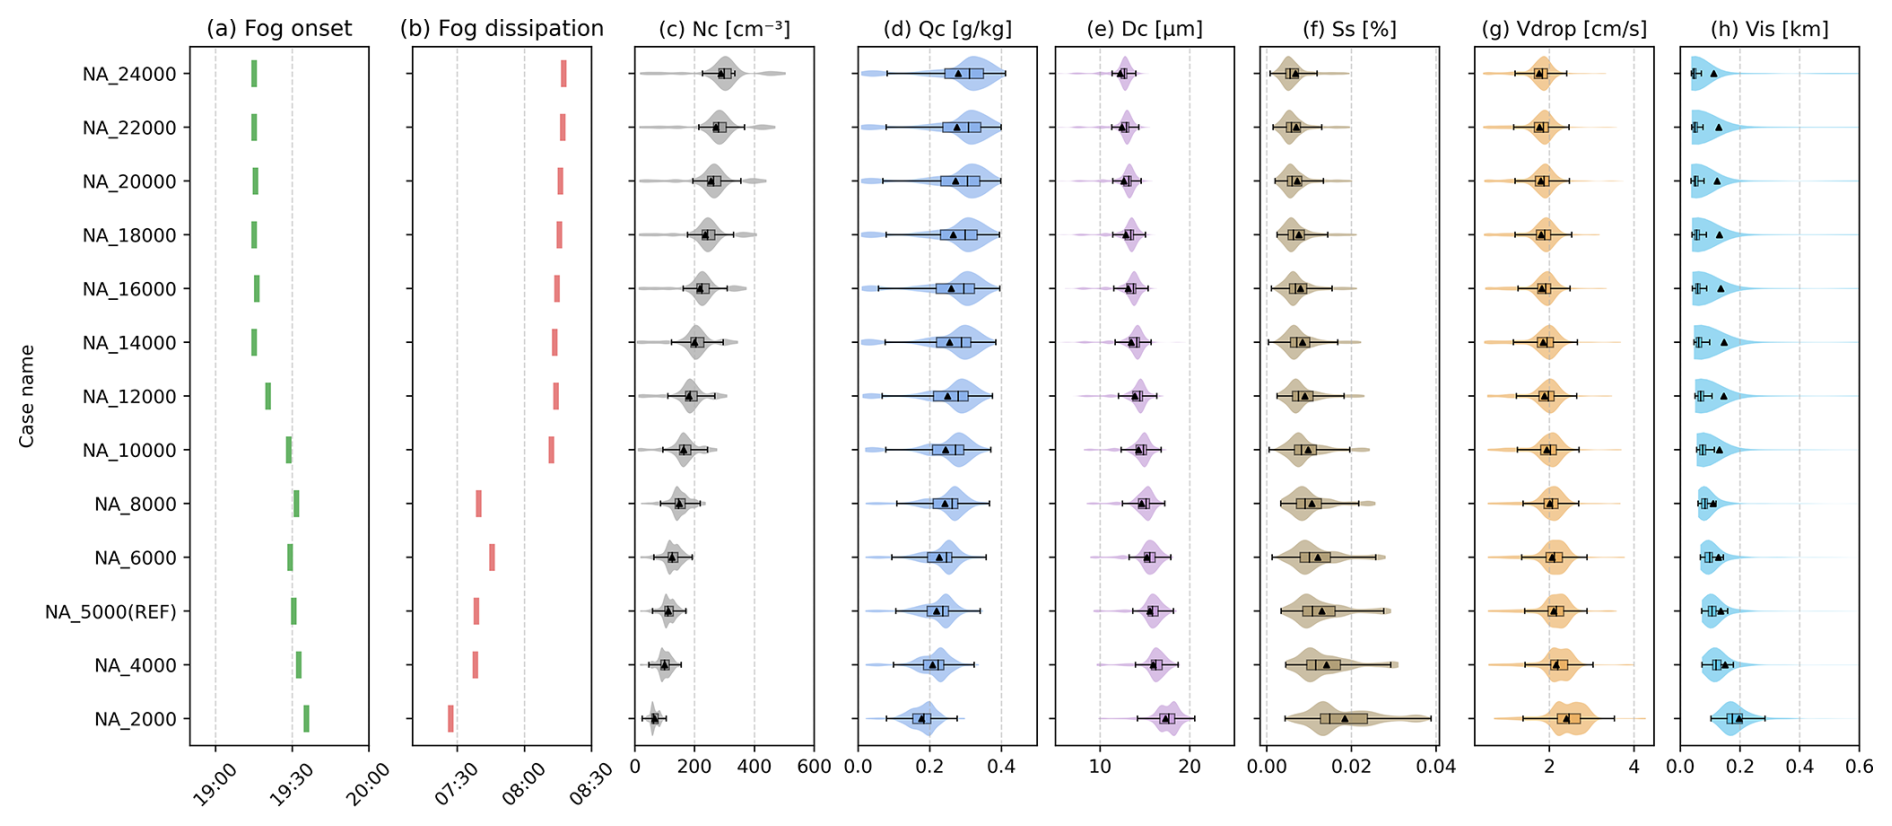
Figure 7Statistical near-surface fog properties in AERO_NA experiments: (a) fog onset time, (b) fog dissipation time, (c) total droplet number concentration Nc, (d) liquid water mixing ratio Qc, (e) mean droplet diameter Dc, (f) supersaturation “Ss”, (g) droplet sedimentation velocity Vdrop and (h) visibility Vis. Where both activated and hydrated particles are counted in the fog droplet category and the visibility parameterization, see Sect. 2.2. The boxes represent the 25–75th percentiles, whiskers the 5–95th percentiles, the solid line the median, and the black triangle the mean. Shaded areas illustrate the distribution of values.
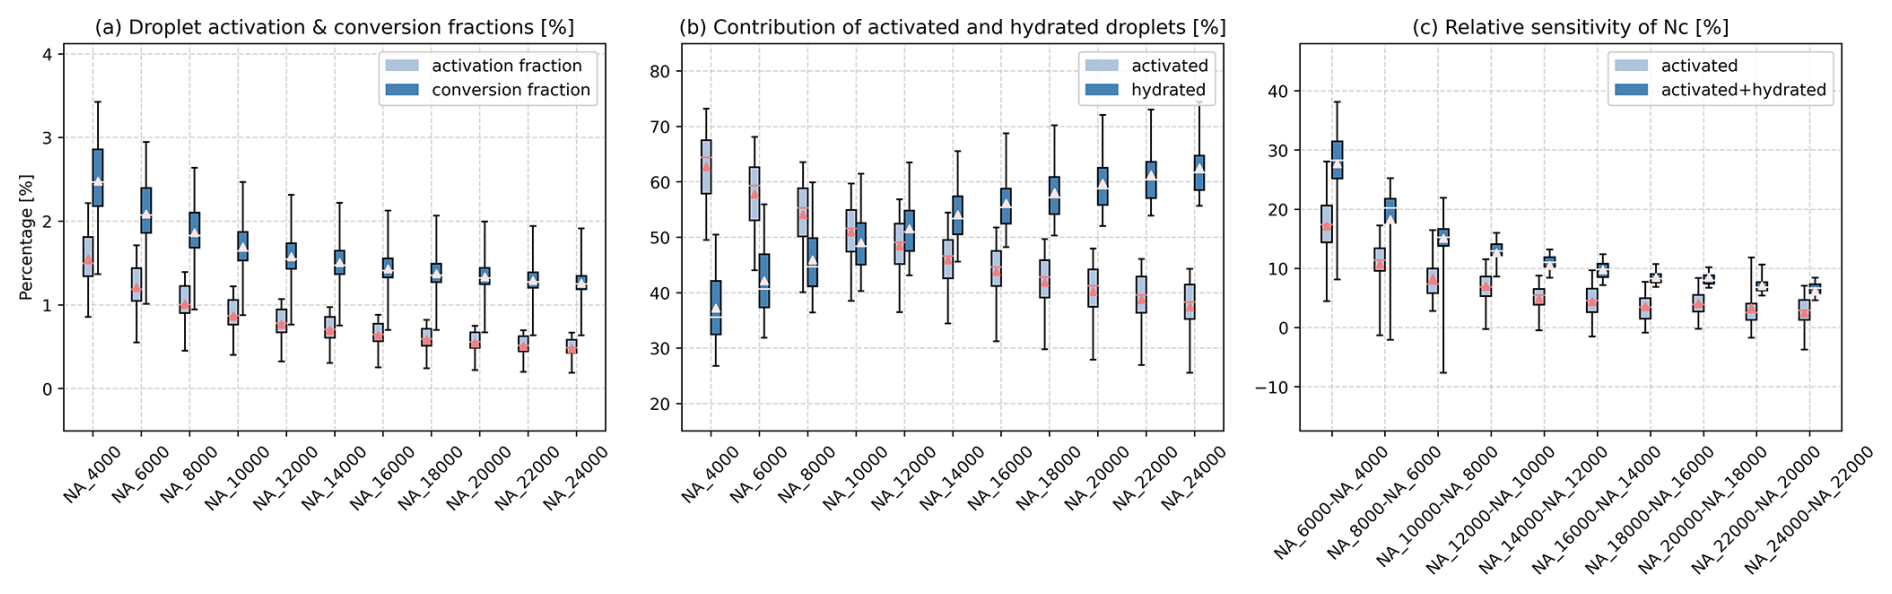
Figure 8Nc-related statistical results in the AERO_NA experiments: (a) droplet activation and conversion fraction, where the activation fraction %, and the conversion fraction %, (b) contribution of activated and hydrated particles to total droplet population, and (c) relative sensitivity of Nc with increased Na, which is quantified as the percentage change in Nc relative to the lower-Na scenario between two consecutive Na cases differing by 2000 cm−3 over their overlapping fog period. The light blue boxes represent activated particles, and dark blue ones include hydrated particles.
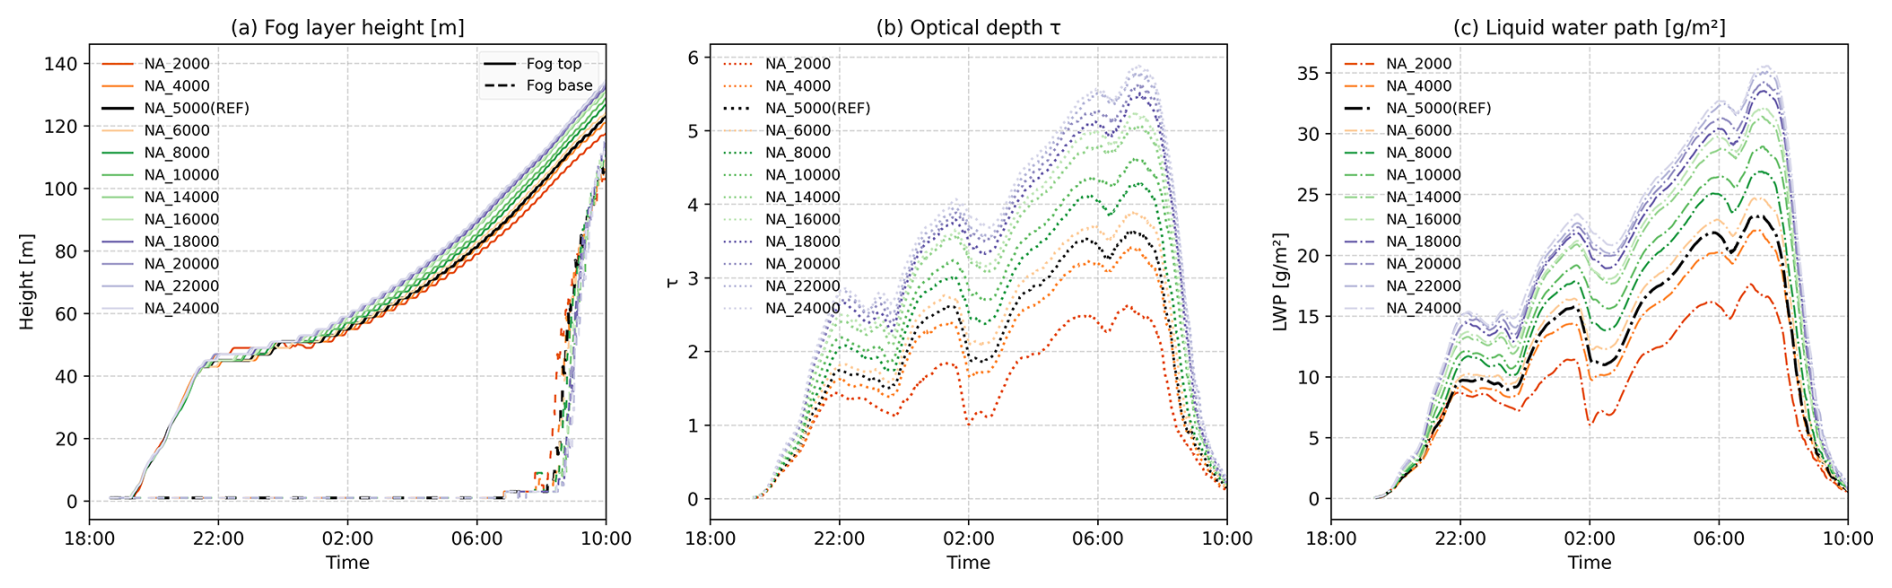
Figure 9Vertical fog properties in AERO_NA experiments: (a) fog layer height (solid lines: fog top, dashed lines: fog base), (b) optical thickness and (c) liquid water path.
3.3 Sensitivity to aerosol chemistry
The response of fog to aerosol chemistry was examined through κ perturbation experiments under different pollution scenarios (see Sect. 2.4.2). With a higher κ, the number concentration of activated droplets (Fig. 10a and c) increases, which in turn leads to a decrease in the visibility (Fig. 10b and d) and an increase in the LWP and optical thickness (not shown) compared to the baseline case. This can be explained by the decrease in the dry activation diameter. However, the sensitivity to κ varies under different pollution scenarios. Overall, the number of activated droplets is more sensitive to κ perturbations under clean conditions, i.e. with lower Na and κ (Fig. 10a). The case with Na=200 cm−3 is an exception. In this case, only short periods meet the fog criterion (visibility ≤1.0 km) and most data points with large relative changes in microphysical parameters are filtered out, resulting in a weaker statistical response of Nc,act to κ perturbations. Except for Na=200 cm−3, the relative changes in Nc,act range from +6.6 % to +7.8 % when κ is increased by 10 % and from −7.3 % to 5.9 % when κ is reduced by 10 %, which is generally higher than the corresponding changes for polluted conditions (+4.0 % to +5.5 % and −5.5 % to −4.2 %, respectively, Fig. 10a). The visibility calculated using only activated droplets (Nc,act) in Eq. (3) shows a similar result (Fig. 10b). However, when hydrated particles are considered, the sensitivity of the total number concentration of droplets to κ perturbations exhibits a different pattern, with greater sensitivity under polluted conditions. For a +10 % κ perturbation, the relative change in total Nc under clean conditions (baseline κ=0.27) is much lower than that in polluted conditions (baseline κ=0.45), ranging from +18.1 % to +33.6 % (Fig. 10c), with a corresponding decrease in visibility of −10.7 % to −16.6 % (Fig. 10d). Under clean conditions, these values are +4.2 % to +15.0 % and −4.4 % to −9.7 %, respectively.
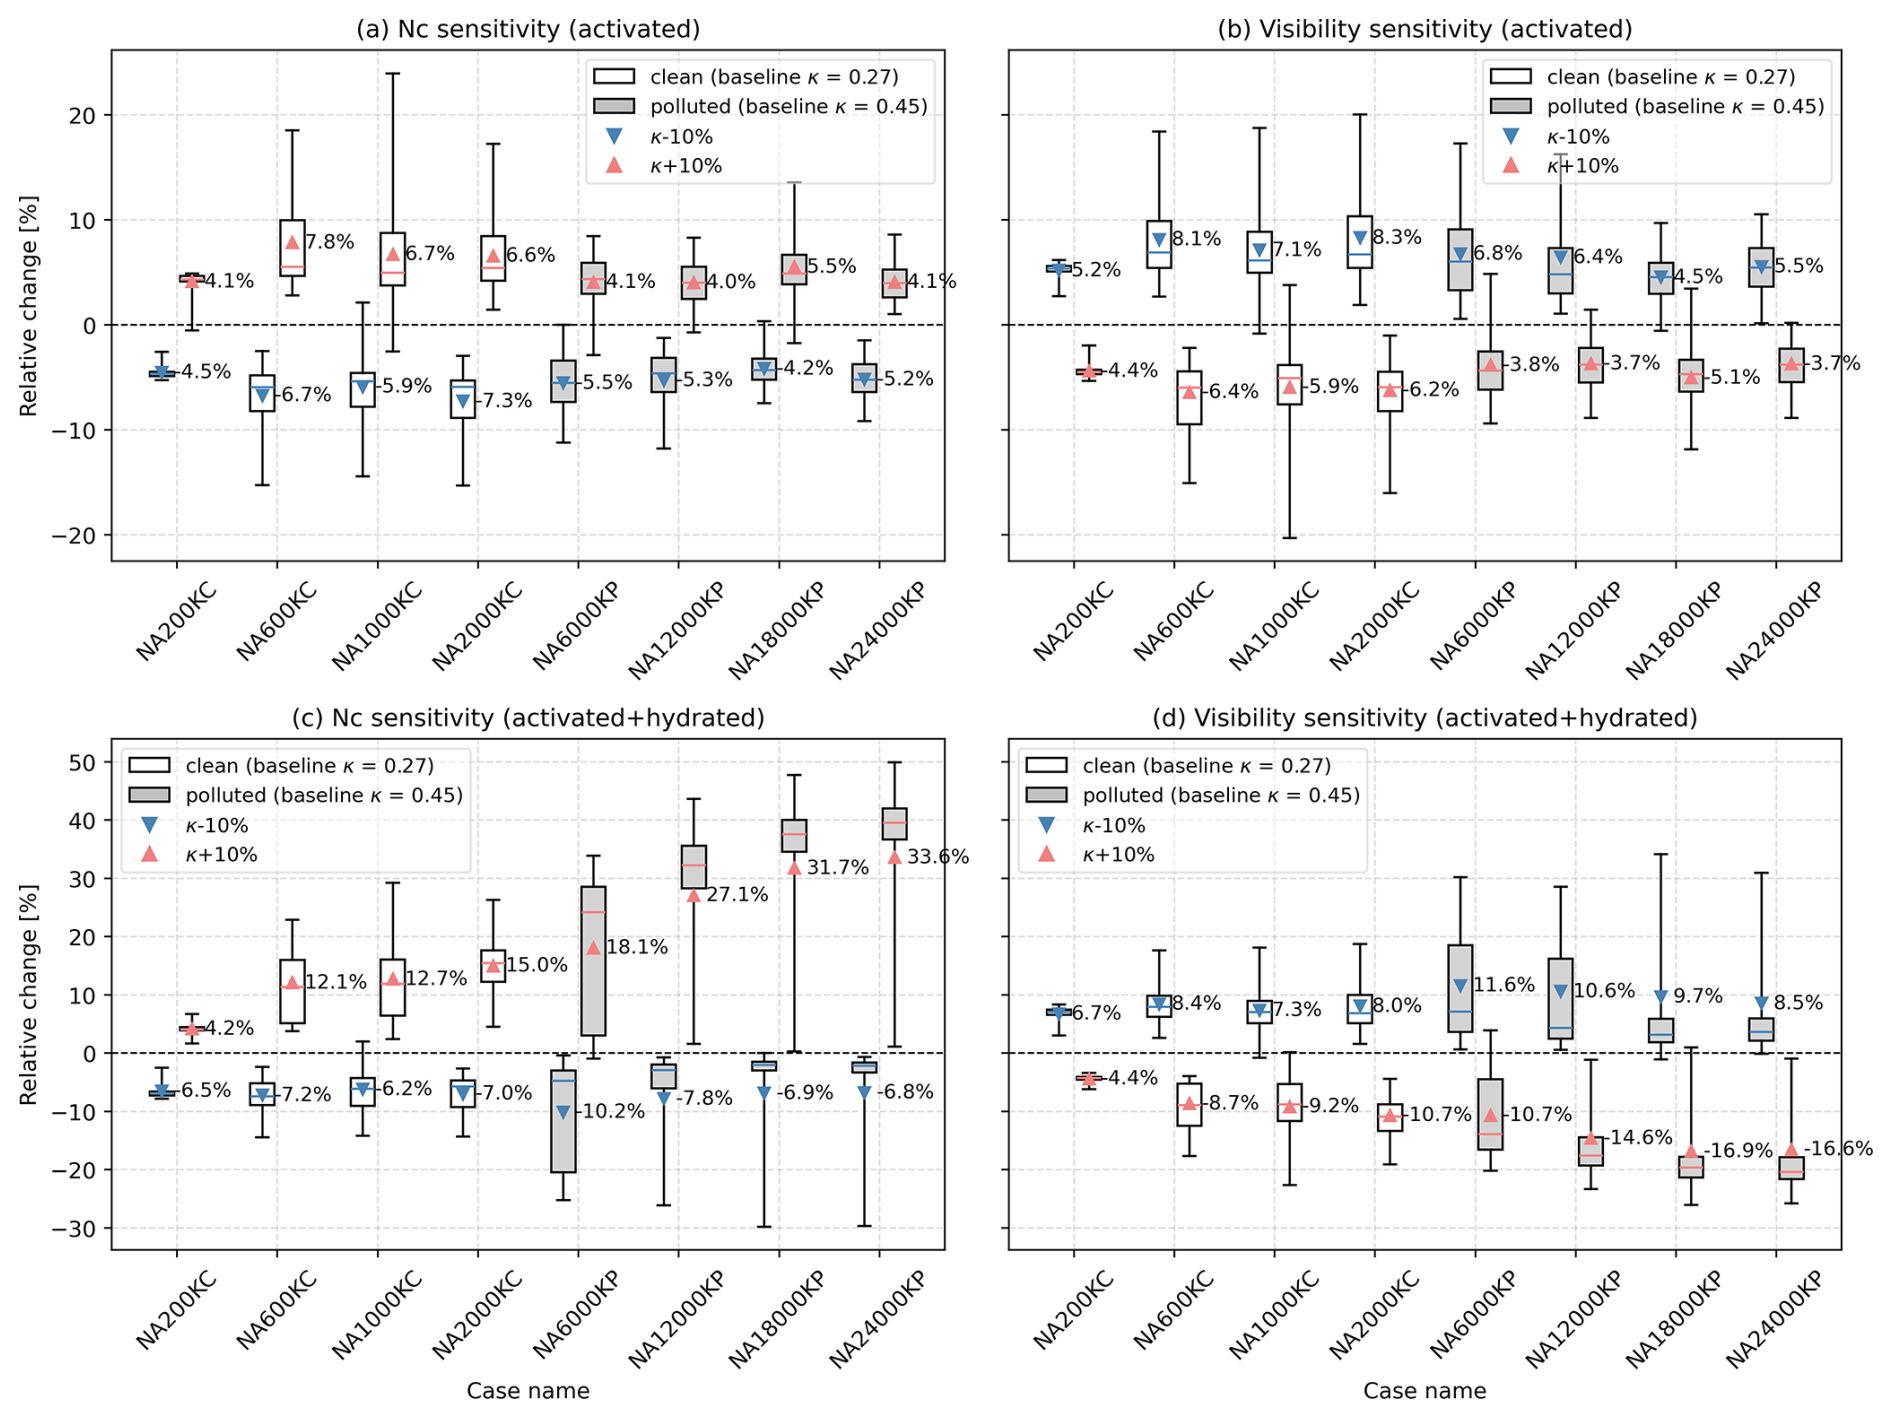
Figure 10Relative change of fog properties to aerosol hygroscopicity parameter perturbations (blue: κ−10 %, red: κ+10 %) under different aerosol loading conditions (white box: clean, gray box: polluted), compared with corresponding base κ cases, where (a) the number of activated droplets Nc,act, (b) visibility parameterized by activated droplets Nc,act, (c) the number of total droplets Nc (activated + hydrated), and (d) visibility parameterized by total Nc. Boxes represent the 25–75th percentiles, whiskers the 5–95th percentiles, solid lines the median, and triangles labeled with numbers indicate the mean.
These results partly support previous studies suggesting that the effect of changes in the chemical composition on the activated number of fog droplets is relatively small compared to the effect of changes in the aerosol size distribution (e.g., Dusek et al., 2006; Mazoyer et al., 2019), particularly under high Na conditions. However, this does not imply that uncertainties in chemical composition can be neglected when hydrated particles are considered; an accurate representation of κ remains crucial, especially for estimating visibility and fog duration. It is also worthwhile to point out that particle composition and size distribution are not decoupled in reality, as both are governed by the sources and atmospheric processing of the emitted particles.
The response in total Nc, and the corresponding visibility, to κ changes is nonlinear, with a much higher sensitivity for positive κ perturbations than for negative ones. This asymmetry arises not only from the nonlinear dependence of aerosol hygroscopic growth and activation on κ perturbations but also from the characteristics of the aerosol size distribution. Taking Na = 12 000 cm−3 as an example, a 10 % increase in κ relative to the baseline reduces the critical activation diameter, resulting in an approximate 4.0 % average increase in activated droplets. At the same time, the hygroscopic growth factor increases by 4.9 %, shifting the wet aerosol spectrum toward larger sizes. Because particles in the accumulation mode are more highly concentrated at smaller sizes, as seen from the lognormal distribution, a large number of fine particles originally just below the 2 µm threshold can exceed it under enhanced hygroscopic growth and are counted into the total Nc. This results in a substantial increase in total Nc (+27.1 %) and, consequently, a sharp decrease in visibility (−14.6 %), given the strong negative correlation between visibility and Nc. In contrast, a 10 % decrease in κ leads to an average reduction in the activated droplets of about 5.3 % and lowers the hygroscopic growth factor by 5.1 %. Given the rapid decline of aerosol number concentration with increasing particle size in the accumulation mode, the wet size distribution resulting from hygroscopic growth scaled by the bulk growth factor retains the same decreasing trend. As the spectrum shifts toward smaller wet sizes with a lower growth factor, only a few particles above the 2 µm threshold fall below it and are excluded from the total Nc. As a result, the reduction in total Nc is relatively limited (−7.8 %), and so is the corresponding increase in visibility (+10.6 %).
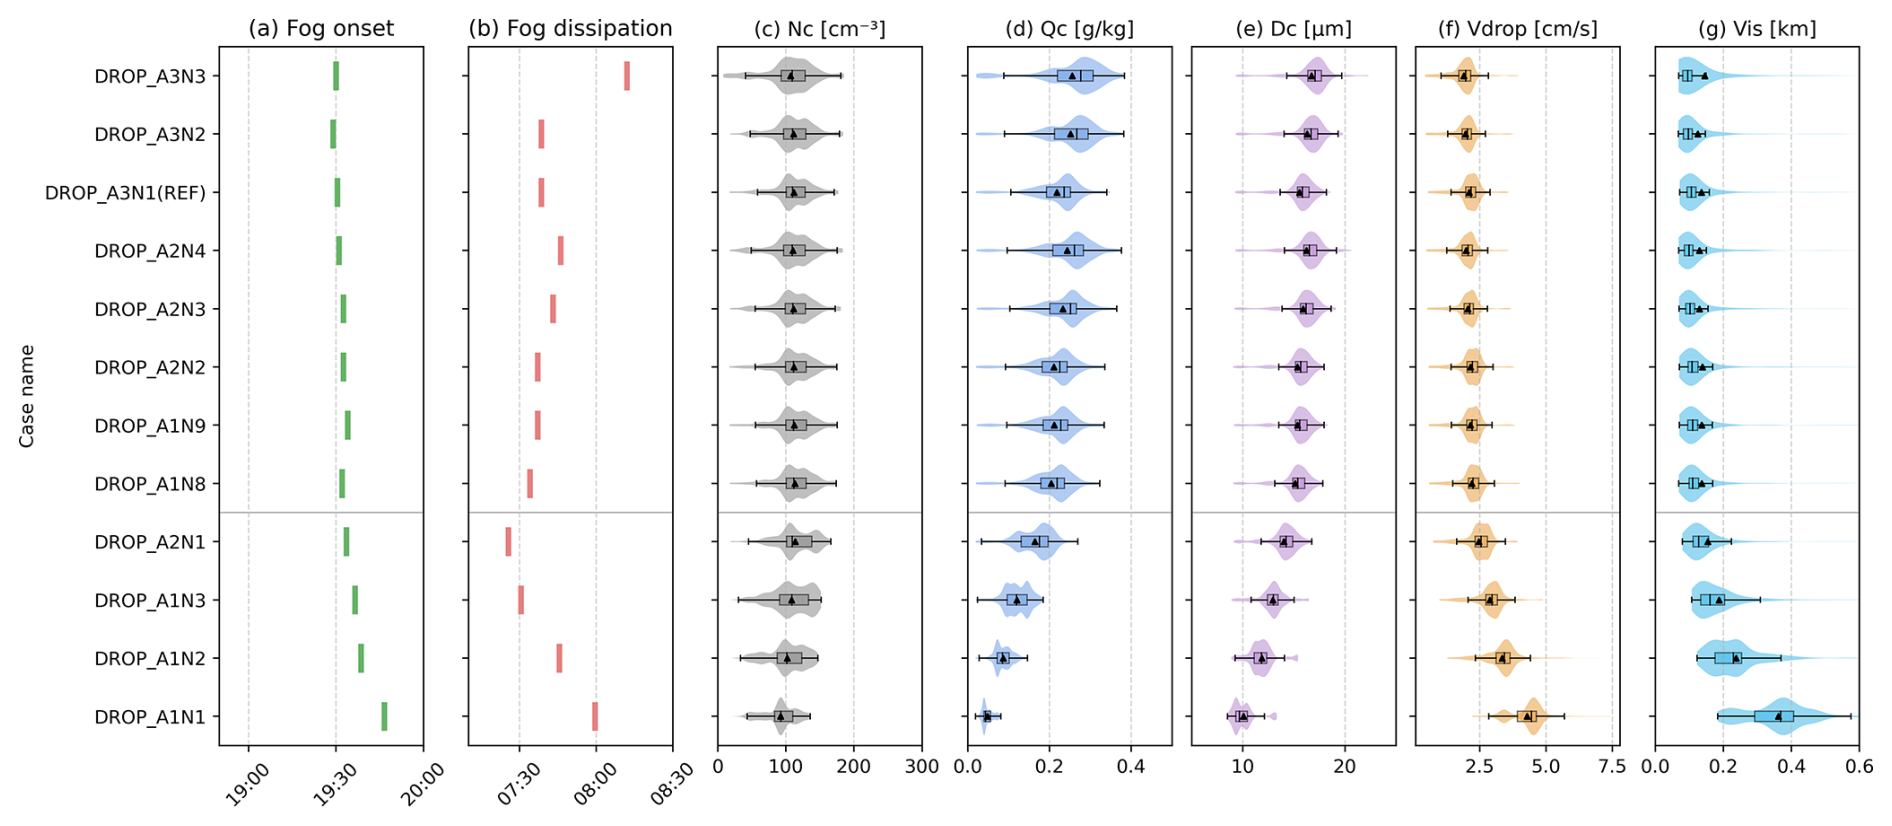
Figure 11Statistical near-surface fog properties in DROP_AN experiments: (a) fog onset time, (b) fog dissipation time, (c) droplet number concentration Nc, (d) liquid water mixing ratio Qc, (e) mean droplet diameter Dc, (f) droplet terminal velocity Vdrop and (g) visibility Vis. Where both activated and hydrated particles are counted in the droplet category. The boxes represent the 25–75th percentiles, whiskers the 5–95th percentiles, the solid line the median, and the black triangle the mean. Shaded areas illustrate the distribution of values. Below the dashed line are narrow-droplet-spectrum cases.
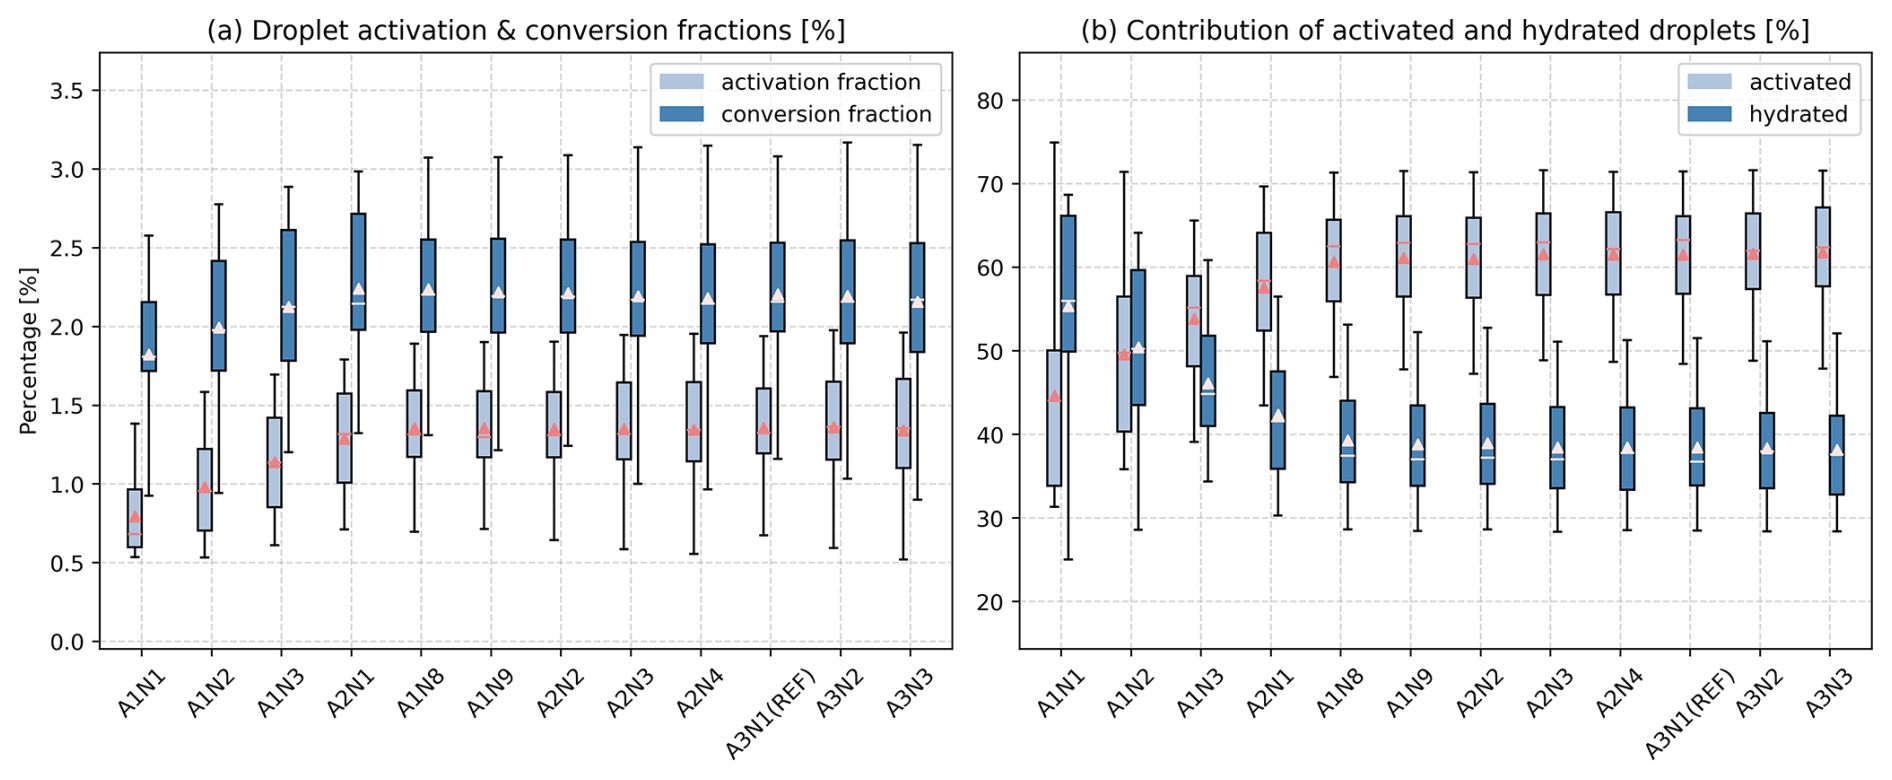
Figure 12Nc-related statistical results in DROP_AN experiments: (a) droplet activation and conversion fraction, (b) contribution of activated and hydrated particles in total Nc, where light blue boxes represent activated particles, and dark blue ones represent hydrated particles.
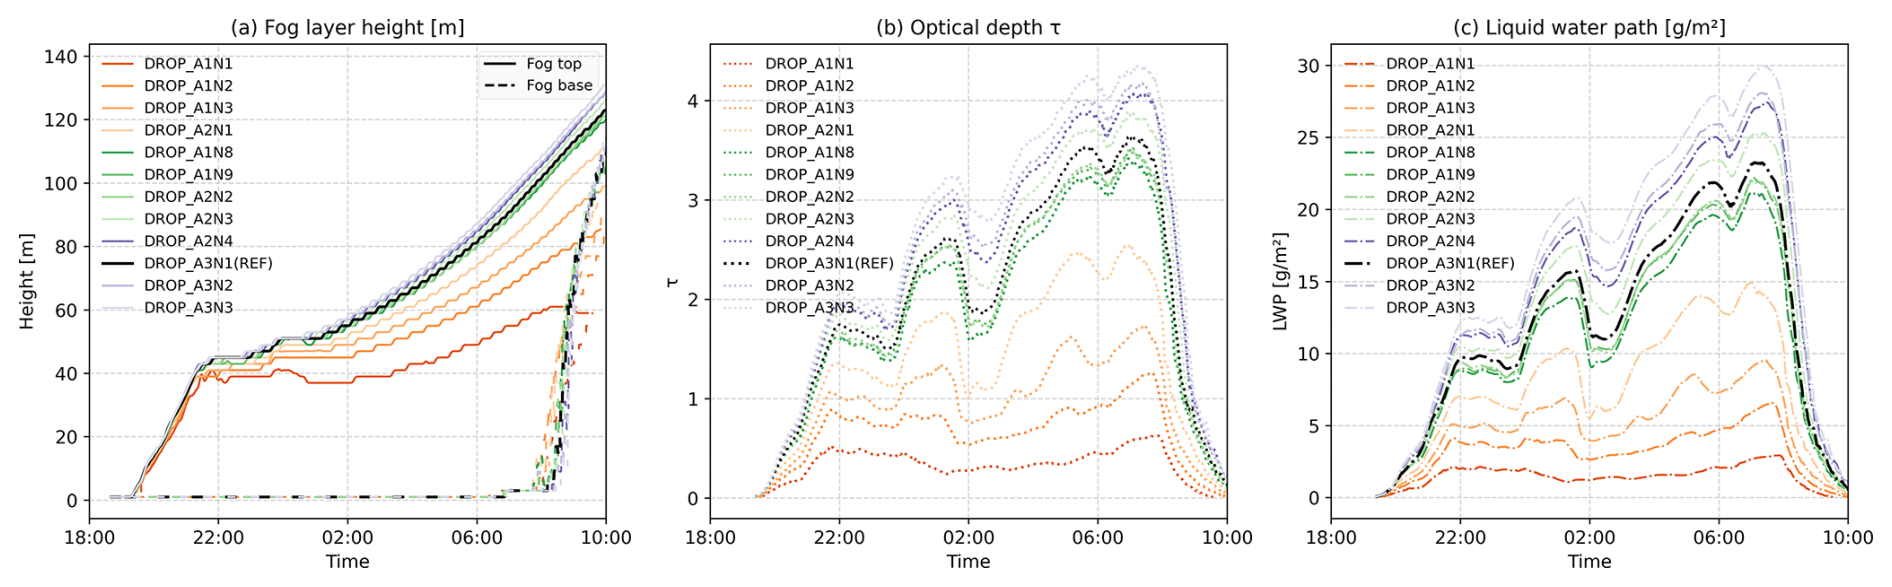
Figure 13Vertical fog properties in DROP_AN experiments: (a) fog layer height (solid lines: fog top, dashed lines: fog base), (b) optical thickness, and (c) liquid water path.
3.4 Sensitivity to droplet microphysics
As mentioned in Sect. 1 and shown in Fig. 3, the generalized gamma distribution exhibits clear limitations in representing the wide spectrum of fog droplet sizes. For simulations with combinations of small shape parameters, such as [1,1], [1,2], [1,3], and [2,1] (hereafter referred to as wide-spectrum cases), the representation of small droplets is reasonable, but the number concentration of large droplets (>30 µm) is overestimated, which increases the bulk mean droplet size and consequently enhances the overall sedimentation rate (Fig. 11f). In particular, the average sedimentation velocity in cases DROP_A1N2 and DROP_A1N1 is about 1.6 and 2.0 times higher, respectively, than in the narrow-spectrum cases. Additionally, in these wide-spectrum simulations, liquid water is distributed more evenly across droplet sizes, making the fog liquid water more sensitive to sedimentation losses. Together, these two factors lead to a significant reduction in total Nc and Qc, and the post-sedimentation droplet population becomes increasingly dominated by hydrated particles (Fig. 12b). Consequently, the mean droplet size is reduced, and near-surface visibility increases (Fig. 11e and g). Fog onset is slightly delayed in the wide-spectrum cases relative to the narrow-spectrum cases, whereas no notable differences are observed among the narrow-spectrum simulations (Fig. 11a). The model does not show a clear correlation between fog dissipation and the prescribed droplet size distribution (Fig. 11b). Also, when increasing Na under the same wide-spectrum parameter setting, no delay in the fog dissipation similar to that shown in the AERO_NA experiments (Fig. 7b) is observed, suggesting that under enhanced sedimentation regimes, the fog lifetime is less sensitive to Na (not shown). Furthermore, in the sensitivity experiments with droplet collision–coalescence enabled, no significant differences are observed across the wide-spectrum cases (not shown). This is likely because the fog droplet sizes are generally relatively small, resulting in very low collision–coalescence efficiency and rendering this process negligible for the overall fog properties.
In terms of vertical structure, for wide-spectrum cases, enhanced sedimentation inhibits fog-top lifting and reduces geometric and optical thickness, and the temporal variability in LWP and τ is smoothed out (Fig. 13). In the DROP_A1N1 case, the maximum fog-top height is about 60 m with a mean LWP of 1.57 g m−2, whereas in the narrow-spectrum reference case DROP_A3N1, the maximum fog-top height reaches about 100 m with a mean LWP of 11.87 g m−2.
A comparison among the narrow-spectrum simulations shows that different parameter combinations lead to variations in the fog optical thickness, where a narrower spectrum produces thicker fog layers and some local fluctuations in the near-surface temporal evolution (Fig. 13). Nevertheless, the overall near-surface microphysical statistics – such as droplet number concentration, liquid water content, and the relative fraction of hydrated and activated droplets – show only small differences (Fig. 11 and 12). This indicates that merely adjusting the generalized gamma distribution parameters is insufficient to address the positive bias in activated droplet number concentration and the liquid water content of large droplets.
Using one-at-a-time sensitivity experiments with prescribed surface forcing and excluding aerosol-radiation interactions, this study isolates and examines cloud microphysical impacts of aerosols and fog droplets on an observed case of wintertime radiation fog in the Po Valley. The results show that an increase in aerosol number concentration generally increases the number of fog droplets, thereby increasing the fog liquid water content, enhancing optical thickness, and reducing visibility. Concurrently, a decrease in the average droplet size weakens sedimentation rates, extending the residence time of droplets and prolonging fog duration by up to 54 min. However, these responses are nonlinear; under high-pollution conditions (i.e., in a supersaturation-limited regime), and when only the effects of aerosols as CCN are considered (i.e. no aerosol-radiation interactions), the sensitivity of fog properties and duration to aerosol number is significantly reduced. Moreover, with higher aerosol loading, the droplet activation fraction decreases, and at Na>10 000 cm−3, the fog is dominated by hydrated aerosols (haze) rather than activated aerosols (fog droplets). Overall, hydrated aerosols contribute about 40 % (Na=5000 cm−3) to 63 % (Na=24 000 cm−3) to the total droplet number.
The chemical composition of the aerosol affects the activation of droplets and the hygroscopic growth of the aerosol mainly through the hygroscopicity parameter κ. Compared with the aerosol size distribution, the influence of κ on droplet activation is relatively weak and is, in agreement with previous studies, more pronounced under clean conditions than under polluted conditions. Nevertheless, unlike most previous fog modelling studies that focused primarily on activated droplets, the explicit representation of aerosol hygroscopic growth in our model reveals that when hydrated particles are considered, variations in aerosol chemical composition and κ substantially influence the total droplet number concentration (i.e., the sum of haze and fog droplets) and visibility. This underscores the importance of accurately representing aerosol chemical composition and accounting for hydrated aerosol particles in visibility prediction and fog forecasting, particularly in polluted environments.
For the simulated range of aerosol number concentrations (Na=2000–24 000 cm−3), the fog droplet budget is primarily governed by sedimentation, condensation/evaporation, and turbulent diffusion, whereas autoconversion and collision–coalescence processes play a minor role. With a careful selection of shape parameters, the generalized gamma distribution represents the observed mean size spectrum of activated droplets reasonably. However, employing different parameter combinations found in the literature, where some produce excessively broad size spectra compared to the observations for the specific case, leads in some cases to substantial underestimation of the fog droplet number, liquid water content, as well as geometric and optical thickness. Furthermore, the observed droplet spectrum, which includes hydrated particles, often exhibits multimodal structures. Given the highlighted importance of hydrated particles, future parameterization schemes could explicitly distinguish between hydrated particles and activated fog droplet populations and allow for multimodal size distributions to better capture key microphysical processes.
Overall, this study offers a preliminary framework for understanding the microphysical impacts of aerosols on haze, fog droplets and fog evolution. However, several limitations in the physical representation of various processes and parameters should be noted. First, the bulk microphysics scheme based on κ–Köhler theory does not fully resolve the size-dependent hygroscopic growth associated with Kelvin effect and thereby tends to underestimate the growth factor and the number of hydrated particles. For models employing bulk schemes, we suggest introducing correction factors based on observed hydrated aerosol spectra to improve the representation of aerosol hygroscopic growth. Second, aerosol-radiation-surface interactions are simplified in the present simulations, where the optical effects of aerosols and their water uptake on boundary-layer thermodynamic structure and surface energy balance are not explicitly considered. The nonlinear coupling between these effects and microphysical processes therefore remains clear, introducing additional uncertainty in the simulated fog evolution and its sensitivity to aerosol concentrations. For regions like the Po Valley, which are characterized by high aerosol loading and frequent wintertime fog events, changes in aerosol emissions may influence both the fog lifecycle and fog occurrence through multiple interacting pathways. In view of this, we will, in our future work, develop the model so that fully couples aerosol microphysical and radiative effects, which should not only improve the representation of individual fog events, but also further our understanding of long-term fog trends and related driving mechanisms.
| Acronym | Description |
|---|---|
| CCN | cloud condensation nuclei |
| ED | effective diameter |
| FAIRARI | Fog and Aerosol Interaction Research Italy |
| LES | Large Eddy Simulation |
| LST | Local Standard Time |
| LWC | liquid water content |
| LWP | liquid water path |
| MIMICA | MISU-MIT Cloud and Aerosol model |
| OAT | one-at-a-time |
| REF | reference simulation |
| RH | relative humidity |
| SPC | San Pietro Capofiume |
| SST | surface skin temperature |
| SSM | surface skin moisture |
| TKE | turbulent kinetic energy |
| Vis | visibility |
The sounding data for San Pietro Capofiume are provided by the University of Wyoming Atmospheric Science Radiosonde Archive (https://weather.uwyo.edu/upperair/sounding.shtml, last access: 10 April 2024). Aerosol data from the FAIRARI campaign are available through the Data Center of the Bolin Center for Climate Research (https://doi.org/10.17043/fairari-2021-2022-3, Neuberger et al., 2026). The LES model output is available at https://doi.org/10.17043/fairari-2021-2022-les2-1 (Ding et al., 2026), and the MIMICA model code can be accessed at https://bitbucket.org/matthiasbrakebusch/mimicav5/src/master (Savre and Brakebusch, 2024).
The supplement related to this article is available online at https://doi.org/10.5194/acp-26-9721-2026-supplement.
Conceptualization: HD, SD, PZ, IR and AMLE; Data curation: HD, AN, RR, FM and AMLE; Formal analysis: HD, AN, RR, FM, KM and ABP; Funding acquisition: SD, IR and AMLE; Investigation: HD, AN, RR, FM, LH, KM, SD, CM, ABP, NM, PZ, IR and AMLE; Methodology: HD, AN, RR, FM, LH, KM, SD, CM, ABP, NM, PZ, IR and AMLE; Project administration: HD, SD, CM, PZ, IR and AMLE; Resources: SD, CM, PZ, IR and AMLE; Software: HD, ABP, NM and AMLE; Supervision: PZ, IR and AMLE; Validation: HD, ABP and NM; Visualization: HD, AN and AMLE; Writing – Original Draft: HD, AN, PZ, IR and AMLE; Writing – Review & Editing: HD, AN, RR, FM, LH, KM, SD, CM, ABP, NM, PZ, IR and AMLE.
At least one of the (co-)authors is a member of the editorial board of Atmospheric Chemistry and Physics. The peer-review process was guided by an independent editor, and the authors also have no other competing interests to declare.
Publisher's note: Copernicus Publications remains neutral with regard to jurisdictional claims made in the text, published maps, institutional affiliations, or any other geographical representation in this paper. The authors bear the ultimate responsibility for providing appropriate place names. Views expressed in the text are those of the authors and do not necessarily reflect the views of the publisher.
Financial support from the European Union’s Horizon 2020 research and innovation programme (Project FORCeS under Grant Agreement 821205), European Research Council (Consolidator Grant INTEGRATE 865799) and Horizon Europe programme (Project CERTAINTY under Grant Agreement 101137680) is gratefully acknowledged. We also acknowledge financial support from the Knut and Alice Wallenberg Foundation through grants for project AtmoRemove (no. 2015.0162), AtmoCLOUD (nos. 2021.0169 and 2021.0298), and CLIVE (no. 2022.0104), as well as from Goran Gustafssons stiftelse and the Swedish Research Council (no. 2020–04158). The computations and data handling in MIMICA were enabled by resources provided by the National Academic Infrastructure for Supercomputing in Sweden (NAISS), partially funded by the Swedish Research Council (no. 2022-06725).
This research has been supported by the EU Horizon 2020 (grant no. 821205), the European Research Council, EU H2020 European Research Council (grant no. 865799), the European Commission, HORIZON EUROPE Framework Programme (grant no. 101137680), the Knut och Alice Wallenbergs Stiftelse (grant nos. 2015.0162, 2021.0169, 2021.0298, and 2022.0104), and the Vetenskapsrådet (grant nos. 2020–04158 and 2022-06725).
The publication of this article was funded by the Swedish Research Council, Forte, Formas, and Vinnova.
This paper was edited by Paulo Ceppi and reviewed by two anonymous referees.
Albrecht, B. A.: Aerosols, cloud microphysics, and fractional cloudiness, Science, 245, 1227–1230, https://doi.org/10.1126/science.245.4923.1227, 1989. a, b
Alduchov, O. A. and Eskridge, R. E.: Improved Magnus form approximation of saturation vapor pressure, J. Appl. Meteorol. Cimatol., 35, 601–609, https://doi.org/10.1175/1520-0450(1996)035<0601:IMFAOS>2.0.CO;2, 1996. a
Bari, D., Bergot, T., and El Khlifi, M.: Numerical study of a coastal fog event over Casablanca, Morocco, Q. J. Roy. Meteorol. Soc., 141, 1894–1905, https://doi.org/10.1002/qj.2494, 2015. a
Bergot, T.: Small-scale structure of radiation fog: a large-eddy simulation study, Q. J. Roy. Meteorol. Soc., 139, 1099–1112, https://doi.org/10.1002/qj.2051, 2013. a, b
Bergot, T. and Koracin, D.: Observation, simulation and predictability of fog: Review and perspectives, Atmosphere, 12, 235, https://doi.org/10.3390/atmos12020235, 2021. a
Bott, A.: On the influence of the physico-chemical properties of aerosols on the life cycle of radiation fogs, Bound.-Lay. Meteorol., 56, 1–31, https://doi.org/10.1016/0021-8502(90)90238-s, 1991. a
Bott, A., Sievers, U., and Zdunkowski, W.: A radiation fog model with a detailed treatment of the interaction between radiative transfer and fog microphysics, J. Atmos. Sci., 47, 2153–2166, https://doi.org/10.1175/1520-0469(1990)047<2153:arfmwa>2.0.co;2, 1990. a
Boutle, I., Price, J., Kudzotsa, I., Kokkola, H., and Romakkaniemi, S.: Aerosol–fog interaction and the transition to well-mixed radiation fog, Atmos. Chem. Phys., 18, 7827–7840, https://doi.org/10.5194/acp-18-7827-2018, 2018. a, b
Boutle, I., Angevine, W., Bao, J.-W., Bergot, T., Bhattacharya, R., Bott, A., Ducongé, L., Forbes, R., Goecke, T., Grell, E., Hill, A., Igel, A. L., Kudzotsa, I., Lac, C., Maronga, B., Romakkaniemi, S., Schmidli, J., Schwenkel, J., Steeneveld, G.-J., and Vié, B.: Demistify: a large-eddy simulation (LES) and single-column model (SCM) intercomparison of radiation fog, Atmos. Chem. Phys., 22, 319–333, https://doi.org/10.5194/acp-22-319-2022, 2022. a, b, c
Brenguier, J.-L., Burnet, F., and Geoffroy, O.: Cloud optical thickness and liquid water path – does the k coefficient vary with droplet concentration?, Atmos. Chem. Phys., 11, 9771–9786, https://doi.org/10.5194/acp-11-9771-2011, 2011. a
Contreras Osorio, S., Martín Pérez, D., Ivarsson, K.-I., Nielsen, K. P., de Rooy, W. C., Gleeson, E., and McAufield, E.: Impact of the Microphysics in HARMONIE-AROME on Fog, Atmosphere, 13, 2127, https://doi.org/10.3390/atmos13122127, 2022. a, b, c
Decesari, S., Sowlat, M. H., Hasheminassab, S., Sandrini, S., Gilardoni, S., Facchini, M. C., Fuzzi, S., and Sioutas, C.: Enhanced toxicity of aerosol in fog conditions in the Po Valley, Italy, Atmos. Chem. Phys., 17, 7721–7731, https://doi.org/10.5194/acp-17-7721-2017, 2017. a, b
Dimitrelos, A., Ekman, A. M. L., Caballero, R., and Savre, J.: A sensitivity study of Arctic air-mass transformation using large Eddy simulation, J. Geophys. Res.-Atmos., 125, e2019JD031738, https://doi.org/10.1029/2019jd031738, 2020. a
Ding, H., Neuberger, A., Ranjan, R., Mattsson, F., Heikkinen, L., Mansour, K., Decesari, S., Mohr, C., Baró Pérez, A., Mastroianni, N., Zieger, P., Riipinen, I., and Ekman, A. M. L.: Large-eddy simulation of droplet and aerosol microphysics role in radiation fog from FAIRARI campaign, Po Valley, February 2022, Dataset version 1, Bolin Centre Database [data set], https://doi.org/10.17043/fairari-2021-2022-les2-1, 2026. a
Dusek, U., Frank, G. P., Hildebrandt, L., Curtius, J., Schneider, J., Walter, S., Chand, D., Drewnick, F., Hings, S., Jung, D., Borrmann, S., and Andreae, M. O.: Size matters more than chemistry for cloud-nucleating ability of aerosol particles, Science, 312, 1375–1378, https://doi.org/10.1126/science.1125261, 2006. a, b
Ekman, A. M. L., Wang, C., Ström, J., and Krejci, R.: Explicit simulation of aerosol physics in a cloud-resolving model: Aerosol transport and processing in the free troposphere, J. Atmos. Sci., 63, 682–696, https://doi.org/10.1175/jas3645.1, 2006. a
Elias, T., Haeffelin, M., Drobinski, P., Gomes, L., Rangognio, J., Bergot, T., Chazette, P., Raut, J.-C., and Colomb, M.: Particulate contribution to extinction of visible radiation: Pollution, haze, and fog, Atmos. Res., 92, 443–454, 2009. a
Elias, T., Dupont, J.-C., Hammer, E., Hoyle, C. R., Haeffelin, M., Burnet, F., and Jolivet, D.: Enhanced extinction of visible radiation due to hydrated aerosols in mist and fog, Atmos. Chem. Phys., 15, 6605–6623, https://doi.org/10.5194/acp-15-6605-2015, 2015. a
Frank, G., Martinsson, B. G., Cederfelt, S.-I., Berg, O. H., Swietlicki, E., Wendisch, M., Yuskiewicz, B., Heintzenberg, J., Wiedensohler, A., Orsini, D., Stratmann, F., Laj, P., and Ricci, L.: Droplet formation and growth in polluted fogs, Contribut. Atmos. Phys., 71, 65–85, 1998. a
Fu, Q. and Liou, K.: Parameterization of the radiative properties of cirrus clouds, J. Atmos. Sci., 50, 2008–2025, https://doi.org/10.1175/1520-0469(1993)050<2008:POTRPO>2.0.CO;2, 1993. a
Fuzzi, S., Facchini, M. C., Orsi, G., Lind, J. A., Wobrock, W., Kessel, M., Maser, R., Jaeschke, W., Enderle, K. H., Arends, B. G., Berner, A., Solly, I., Kruisz, C., Reischl, G., Pahl, S., Kaminski, U., Winkler, P., Ogren, J. A., Noone, K. J., Hallberg, A., Fierlinger-Oberlinninger, H., Puxbaum, H., Marzorati, A., Hansson, H.-C., Wiedensohler, A., Svenningsson, I. B., Martinsson, B. G., Schell, D., and Georgii, H. W.: The Po Valley Fog Experiment 1989, Tellus B, 44, 448–468, https://doi.org/10.3402/tellusb.v44i5.15561, 1992. a
Geoffroy, O., Brenguier, J.-L., and Burnet, F.: Parametric representation of the cloud droplet spectra for LES warm bulk microphysical schemes, Atmos. Chem. Phys., 10, 4835–4848, https://doi.org/10.5194/acp-10-4835-2010, 2010. a
Gultepe, I., Müller, M. D., and Boybeyi, Z.: A new visibility parameterization for warm-fog applications in numerical weather prediction models, J. Appl. Meteorol. Climatol., 45, 1469–1480, https://doi.org/10.1175/jam2423.1, 2006. a, b
Gultepe, I., Tardif, R., Michaelides, S. C., Cermak, J., Bott, A., Bendix, J., Müller, M. D., Pagowski, M., Hansen, B., Ellrod, G., Jacobs, W., Toth, G., and Cober, S. G.: Fog research: A review of past achievements and future perspectives, Pure Appl. Geophys., 164, 1121–1159, https://doi.org/10.1007/978-3-7643-8419-7_3, 2007. a, b, c
Haeffelin, M., Bergot, T., Elias, T., Tardif, R., Carrer, D., Chazette, P., Colomb, M., Drobinski, P., Dupont, E., Dupont, J.-C., Guédalia, D., van der Hage, P. J. H., and Cammas, J.-P.: PARISFOG: Shedding new light on fog physical processes, B. Am. Meteorol. Soc., 91, 767–783, https://doi.org/10.1175/2009bams2671.1, 2010. a
Hamed, A., Joutsensaari, J., Mikkonen, S., Sogacheva, L., Dal Maso, M., Kulmala, M., Cavalli, F., Fuzzi, S., Facchini, M. C., Decesari, S., Mircea, M., Lehtinen, K. E. J., and Laaksonen, A.: Nucleation and growth of new particles in Po Valley, Italy, Atmos. Chem. Phys., 7, 355–376, https://doi.org/10.5194/acp-7-355-2007, 2007. a
Hammer, E., Gysel, M., Roberts, G. C., Elias, T., Hofer, J., Hoyle, C. R., Bukowiecki, N., Dupont, J.-C., Burnet, F., Baltensperger, U., and Weingartner, E.: Size-dependent particle activation properties in fog during the ParisFog 2012/13 field campaign, Atmos. Chem. Phys., 14, 10517–10533, https://doi.org/10.5194/acp-14-10517-2014, 2014. a, b
Heikkinen, L., Äijälä, M., Riva, M., Luoma, K., Dällenbach, K., Aalto, J., Aalto, P., Aliaga, D., Aurela, M., Keskinen, H., Makkonen, U., Rantala, P., Kulmala, M., Petäjä, T., Worsnop, D., and Ehn, M.: Long-term sub-micrometer aerosol chemical composition in the boreal forest: inter- and intra-annual variability, Atmos. Chem. Phys., 20, 3151–3180, https://doi.org/10.5194/acp-20-3151-2020, 2020. a
Hersbach, H., Bell, B., Berrisford, P., Biavati, G., Horányi, A., Muñoz Sabater, J., Nicolas, J., Peubey, C., Radu, R., Rozum, I., Schepers, D., Simmons, A., Soci, C., Dee, D., and Thépaut, J.-N.: ERA5 hourly data on pressure levels from 1940 to present, Copernicus climate change service (c3s) climate data store (cds), 10, 24381, https://doi.org/10.24381/cds.bd0915c6, 2023. a
Igel, A. L. and van den Heever, S. C.: The importance of the shape of cloud droplet size distributions in shallow cumulus clouds. Part II: Bulk microphysics simulations, J. Atmos. Sci., 74, 259–273, https://doi.org/10.1175/jas-d-15-0383.1, 2017. a
Jia, X., Quan, J., Zheng, Z., Liu, X., Liu, Q., He, H., and Liu, Y.: Impacts of anthropogenic aerosols on fog in North China Plain, J. Geophys. Res.-Atmos., 124, 252–265, https://doi.org/10.1029/2018jd029437, 2019. a
Katata, G.: Fogwater deposition modeling for terrestrial ecosystems: A review of developments and measurements, J. Geophys. Res.-Atmos., 119, 8137–8159, https://doi.org/10.1002/2014jd021669, 2014. a
Kokkola, H., Romakkaniemi, S., and Laaksonen, A.: On the formation of radiation fogs under heavily polluted conditions, Atmos. Chem. Phys., 3, 581–589, https://doi.org/10.5194/acp-3-581-2003, 2003. a
Koschmieder, H.: Theorie der horizontalen sichtweite, Beitrage zur Physik der Freien Atmosphare, Meteorol. Z., 12, 3353, 1924. a
Lakra, K. and Avishek, K.: A review on factors influencing fog formation, classification, forecasting, detection and impacts, Rend. Lincei.-Sci. Fis., 33, 319–353, https://doi.org/10.1007/s12210-022-01060-1, 2022. a
Leung, A. C., Gough, W. A., and Butler, K. A.: Changes in fog, ice fog, and low visibility in the Hudson Bay Region: Impacts on aviation, Atmosphere, 11, 186, https://doi.org/10.3390/atmos11020186, 2020. a
Maalick, Z., Kühn, T., Korhonen, H., Kokkola, H., Laaksonen, A., and Romakkaniemi, S.: Effect of aerosol concentration and absorbing aerosol on the radiation fog life cycle, Atmos. Environ., 133, 26–33, https://doi.org/10.1016/j.atmosenv.2016.03.018, 2016. a, b, c
Maronga, B. and Bosveld, F.: Key parameters for the life cycle of nocturnal radiation fog: a comprehensive large-eddy simulation study, Q. J. Roy. Meteorol. Soc., 143, 2463–2480, https://doi.org/10.1002/qj.3100, 2017. a, b
Mazoyer, M., Burnet, F., Denjean, C., Roberts, G. C., Haeffelin, M., Dupont, J.-C., and Elias, T.: Experimental study of the aerosol impact on fog microphysics, Atmos. Chem. Phys., 19, 4323–4344, https://doi.org/10.5194/acp-19-4323-2019, 2019. a, b, c
Mazoyer, M., Burnet, F., and Denjean, C.: Experimental study on the evolution of droplet size distribution during the fog life cycle, Atmos. Chem. Phys., 22, 11305–11321, https://doi.org/10.5194/acp-22-11305-2022, 2022. a
Miles, N. L., Verlinde, J., and Clothiaux, E. E.: Cloud droplet size distributions in low-level stratiform clouds, J. Atmos. Sci., 57, 295–311, https://doi.org/10.1175/1520-0469(2000)057<0295:cdsdil>2.0.co;2, 2000. a
Morrison, H. and Grabowski, W. W.: Comparison of bulk and bin warm-rain microphysics models using a kinematic framework, J. Atmos. Sci., 64, 2839–2861, https://doi.org/10.1175/jas3980, 2007. a, b
Morrison, H. and Grabowski, W. W.: Modeling supersaturation and subgrid-scale mixing with two-moment bulk warm microphysics, J. Atmos. Sci., 65, 792–812, https://doi.org/10.1175/2007JAS2374.1, 2008. a
Neuberger, A., Ranjan, R., Ding, H., Mattsson, F., Haberstock, L., Baumgardner, D., Decesari, S., Ekman, A. M. L., Hughes, D. D., Mohr, C., Paglione, M., Riipinen, I., Rinaldi, M., and Zieger, P.: Importance of hydrated aerosol particles for aerosol-fog relationships in the Italian Po Valley, EGUsphere [preprint], https://doi.org/10.5194/egusphere-2025-5419, 2025a. a, b, c, d, e, f, g, h, i, j
Neuberger, A., Decesari, S., Aktypis, A., Andersen, H., Baumgardner, D., Bianchi, F., Busetto, M., Cai, J., Cermak, J., Dipu, S., Ekman, A. M. L., Fuzzi, S., Gramlich, Y., Haslett, S. L., Heikkinen, L., Joutsensaari, J., Kaltsonoudis, C., Kangasluoma, J., Krejci, R., Lupi, A., Marinoni, A., Matrali, A., Mattsson, F., Mohr, C., Nenes, A., Paglione, M., Pandis, S. N., Patel, A., Riipinen, I., Rinaldi, M., Steimer, S. S., Stolzenburg, D., Sulo, J., Vasilakopoulou, C. N., and Zieger, P.: From Molecules to Droplets: The Fog and Aerosol Interaction Research Italy (FAIRARI) 2021/22 Campaign, B. Am. Meteorol. Soc., 106, E23–E50, https://doi.org/10.1175/bams-d-23-0166.1, 2025b. a, b, c, d, e, f, g, h, i
Neuberger, A., Decesari, S., Aktypis, A., Andersen, H., Baumgardner, D., Bianchi, F., Busetto, M., Cai, J., Cermak, J., Dipu, S., Ekman, A., Fuzzi, S., Gramlich, Y., Haslett, S. L., Heikkinen, L., Joutsensaari, J., Kaltsonoudis, C., Kangasluoma, J., Krejci, R., Lupi, A., Marinoni, A., Matrali, A., Mattsson, F., Mohr, C., Nenes, A., Paglione, M., Pandis, S. N., Patel, A., Riipinen, I., Rinaldi, M., Steimer, S. S., Stolzenburg, D., Sulo, J., Vasilakopoulou, C. N., and Zieger, P.: The fog and aerosol interaction research Italy (FAIRARI) campaign, November 2021 to May 2022. Dataset version 3, Bolin Centre Database [data set], https://doi.org/10.17043/fairari-2021-2022-3, 2026. a
Noone, K. J., Ogren, J. A., Hallberg, A., Heintzenberg, J., Ström, J., Hansson, H.-C., Svenningsson, B., Wiedensohler, A., Fuzzi, S., Facchini, M. C., Arends, B. G., and Berner, A.: Changes in aerosol size- and phase distributions due to physical and chemical processes in fog, Tellus B, 44, 489–504, https://doi.org/10.3402/tellusb.v44i5.15563, 1992. a, b
Paglione, M., Gilardoni, S., Rinaldi, M., Decesari, S., Zanca, N., Sandrini, S., Giulianelli, L., Bacco, D., Ferrari, S., Poluzzi, V., Scotto, F., Trentini, A., Poulain, L., Herrmann, H., Wiedensohler, A., Canonaco, F., Prévôt, A. S. H., Massoli, P., Carbone, C., Facchini, M. C., and Fuzzi, S.: The impact of biomass burning and aqueous-phase processing on air quality: a multi-year source apportionment study in the Po Valley, Italy, Atmos. Chem. Phys., 20, 1233–1254, https://doi.org/10.5194/acp-20-1233-2020, 2020. a
Petters, M. D. and Kreidenweis, S. M.: A single parameter representation of hygroscopic growth and cloud condensation nucleus activity, Atmos. Chem. Phys., 7, 1961–1971, https://doi.org/10.5194/acp-7-1961-2007, 2007. a
Pope, N. H. and Igel, A. L.: Identifying Important Microphysical Properties and Processes for Marine Fog Forecasts, Mon. Weather Rev., 151, 2427–2441, https://doi.org/10.1175/mwr-d-22-0294.1, 2023. a
Price, J.: Radiation fog. Part I: observations of stability and drop size distributions, Bound.-Lay. Meteorol., 139, 167–191, https://doi.org/10.1007/s10546-010-9580-2, 2011. a, b
Riipinen, I., Talvinen, S., Chassaing, A., Georgakaki, P., Li, X., Pérez Garcia-Pando, C., Bergman, T., Kommula, S., Proske, U., Gkouvousis, A., Tsimpidi, A., Chatziparaschos, M., Neuberger, A., Karydis, V., Calderón, S., Romakkaniemi, S., Partridge, D., Khadir, T., Dada, L., Van Noije, T., Decesari, S., Seland, O., Zieger, P., Bender, F., Carslaw, K., Cermak, J., Costa-Surós, M., Ageitos, M., Gramlich, Y., Haugvaldstad, O., Holopainen, E., Hoose, C., Jorba, O., Kakavas, S., Kanakidou, M., Kokkola, H., Krejci, R., Kühn, T., Kulmala, M., Le Sager, P., Makkonen, R., Manavi, S., Mentel, T., Milousis, A., Myriokefalitakis, S., Nenes, A., Nieminen, T., Pandis, S., Patoulias, D., Petäjä, T., Quaas, J., Regayre, L., Scholz, S., Schulz, M., Skyllakou, K., Sousse, R., Stier, P., Thomas, M., Villinger, J., Virtanen, A., Wyser, K., and Ekman, A. M. L.: Treatment of key aerosol and cloud processes in Earth System Models – Recommendations from the FORCeS Project, Tellus B, 78, 1–66, https://doi.org/10.16993/tellusb.1883, 2026. a
Rose, D., Nowak, A., Achtert, P., Wiedensohler, A., Hu, M., Shao, M., Zhang, Y., Andreae, M. O., and Pöschl, U.: Cloud condensation nuclei in polluted air and biomass burning smoke near the mega-city Guangzhou, China – Part 1: Size-resolved measurements and implications for the modeling of aerosol particle hygroscopicity and CCN activity, Atmos. Chem. Phys., 10, 3365–3383, https://doi.org/10.5194/acp-10-3365-2010, 2010. a
Savre, J., Ekman, A. M. L., and Svensson, G.: Technical note: Introduction to MIMICA, a large-eddy simulation solver for cloudy planetary boundary layers, J. Adv. Model. Earth Syst., 6, 630–649, https://doi.org/10.1002/2013MS000292, 2014. a, b
Savre, J. and Brakebusch, M.: MIMICA LES model v5, Bitbucket [code], https://bitbucket.org/matthiasbrakebusch/mimicav5/src/master (last access: 3 June 2025), 2024. a
Schwarz, M., Savre, J., Sudhakar, D., Quaas, J., and Ekman, A. M. L.: The Transition from Aerosol-to Updraft-Limited Susceptibility Regime in Large-Eddy Simulations with Bulk Microphysics, Tellus B, 76, https://doi.org/10.16993/tellusb.94, 2024. a
Schwenkel, J. and Maronga, B.: Large-eddy simulation of radiation fog with comprehensive two-moment bulk microphysics: impact of different aerosol activation and condensation parameterizations, Atmos. Chem. Phys., 19, 7165–7181, https://doi.org/10.5194/acp-19-7165-2019, 2019. a
Seifert, A. and Beheng, K. D.: A double-moment parameterization for simulating autoconversion, accretion and selfcollection, Atmos. Res., 59, 265–281, https://doi.org/10.1016/S0169-8095(01)00126-0, 2001. a, b
Seifert, A. and Beheng, K. D.: A two-moment cloud microphysics parameterization for mixed-phase clouds. Part 1: Model description, Meteorol. Atmos. Phys., 92, 45–66, https://doi.org/10.1007/s00703-005-0112-4, 2006. a, b
Seinfeld, J. H. and Pandis, S. N.: Atmospheric chemistry and physics: from air pollution to climate change, John Wiley & Sons, 2016. a
Stokes, R. H. and Robinson, R. A.: Interactions in Aqueous Nonelectrolyte Solutions. I. Solute-Solvent Equilibria, The J. Phys. Chem., 70, 2126–2131, https://doi.org/10.1021/j100879a010, 1966. a
Stolaki, S., Haeffelin, M., Lac, C., Dupont, J.-C., Elias, T., and Masson, V.: Influence of aerosols on the life cycle of a radiation fog event. A numerical and observational study, Atmos. Res., 151, 146–161, https://doi.org/10.1016/j.atmosres.2014.04.013, 2015. a, b, c, d
Stull, R. B.: An Introduction to Boundary Layer Meteorology, Kluwer Academic Publishers, Dordrecht, https://doi.org/10.1007/978-94-009-3027-8, 1988. a
Twomey, S.: The influence of pollution on the shortwave albedo of clouds, J. Atmos. Sci., 34, 1149–1152, https://doi.org/10.1175/1520-0469(1977)034<1149:tiopot>2.0.co;2, 1977. a, b
Wainwright, C., Chang, R. Y.-W., and Richter, D.: Aerosol activation in radiation fog at the atmospheric radiation program Southern Great Plains site, J. Geophys. Res.-Atmos., 126, e2021JD035358, https://doi.org/10.1029/2021jd035358, 2021. a
Wang, Y., Lu, C., Niu, S., Lv, J., Jia, X., Xu, X., Xue, Y., Zhu, L., and Yan, S.: Diverse dispersion effects and parameterization of relative dispersion in urban fog in eastern China, J. Geophys. Res.-Atmos., 128, e2022JD037514, https://doi.org/10.1029/2022jd037514, 2023. a
Wobrock, W., Schell, D., Maser, R., Kessel, M., Jaeschke, W., Fuzzi, S., Facchini, M. C., Orsi, G., Marzorati, A., Winkler, P., Arends, B. G., and Bendix, J.: Meteorological characteristics of the Po Valley fog, Tellus B, 44, 469–488, https://doi.org/10.3402/tellusb.v44i5.15562, 1992. a
Wurtz, J., Bouniol, D., Vié, B., and Lac, C.: Evaluation of the AROME model's ability to represent ice crystal icing using in situ observations from the HAIC 2015 field campaign, Q. J. Roy. Meteorol. Soc., 147, 2796–2817, https://doi.org/10.1002/qj.4100, 2021. a
Yan, S., Zhu, B., Huang, Y., Zhu, J., Kang, H., Lu, C., and Zhu, T.: To what extents do urbanization and air pollution affect fog?, Atmos. Chem. Phys., 20, 5559–5572, https://doi.org/10.5194/acp-20-5559-2020, 2020. a, b
Yan, S., Zhu, B., Zhu, T., Shi, C., Liu, D., Kang, H., Lu, W., and Lu, C.: The effect of aerosols on fog lifetime: Observational evidence and model simulations, Geophys. Res. Lett., 48, e2020GL61803, https://doi.org/10.1029/2020gl091156, 2021. a
Zhang, X., Musson-Genon, L., Dupont, E., Milliez, M., and Carissimo, B.: On the influence of a simple microphysics parametrization on radiation fog modelling: A case study during parisfog, Bound.-Lay. Meteorol., 151, 293–315, https://doi.org/10.1007/s10546-013-9894-y, 2014. a