
the Creative Commons Attribution 4.0 License.
the Creative Commons Attribution 4.0 License.
 | 06 Jul 2026
Marine cloud brightening of cumulus clouds: from the sprayer to the cloud
Johannes Kainz
Daniel P. Harrison
Marine cloud brightening (MCB) is a suggested solar radiation management approach to mitigate global warming by increasing the reflectance of clouds through the emission of additional aerosols. While stratocumulus are considered the preferred target for MCB, the present study investigates trade-wind cumulus clouds, which may be the dominant cloud type for certain regional MCB deployments. In this study, high-resolution large-eddy simulations with detailed Lagrangian cloud microphysics are used to assess the role of different aerosol sprayer heights on the efficacy of MCB. The study indicates that near-surface sprayers are the optimal placement, as they facilitate the most efficient dispersion of aerosol within the boundary layer, which increases the fraction of clouds affected by the sprayed aerosols, as well as the transport of the sprayed aerosols into the developing clouds, resulting in a higher number of cloud droplets developing from the sprayed aerosols.
- Article
(3528 KB) - Full-text XML
- BibTeX
- EndNote


The proposed solar radiation management (SRM) approach Marine cloud brightening (MCB) aims to enhance cloud reflectance by modifying cloud microphysical properties with the aim to increase Earth's albedo and hence counter global warming (Latham, 2002; Latham et al., 2012; Feingold et al., 2024). Artificial cloud condensation nuclei (CCN) are introduced into clouds, redistributing liquid water onto a greater number of smaller droplets, thereby increasing the ability of clouds to reflect short-wave radiation back into space (Twomey, 1974, 1977). This approach has been predominantly studied for marine stratocumulus clouds, which are particularly susceptible to MCB due to their relatively small vertical extent and high cloud fraction (Wood, 2021; Zhang and Feingold, 2023).
The regional application of MCB is suggested to protect high-value local ecosystems from the adverse effects of global warming, such as the intensification and increased frequency of marine heatwaves affecting the Great Barrier Reef (GBR) in Australia. A proposed strategy to mitigate coral bleaching, a phenomenon triggered by heat stress, is to cool the reef by increasing cloud reflectance through a deployment of MCB, thereby reducing the solar radiation absorbed by the ocean (Harrison, 2024). In contrast to the original concept of MCB targeted at stratocumulus clouds, the GBR is dominated by scattered shallow cumulus clouds, where many findings for stratocumulus clouds may not apply.
To evaluate the feasibility and effectiveness of MCB under these conditions, we conduct high-resolution large-eddy simulations (LESs) with a detailed Lagrangian cloud microphysics model (LCM) (Hoffmann et al., 2015). The primary focus is on the sprayed CCN transport, which are suggested to be injected into the lower, cloud-free marine boundary layer from spraying apparatus mounted on boats. Another deployment strategy suggests the use of drones, to spray directly within the cloud layer (Claudel et al., 2024). Thus, we test three different sprayer heights: a sprayer positioned near the surface, a sprayer near the cloud base, and a sprayer positioned at the top of the cloud layer. By leveraging the unique capability of the LCM to track individual aerosol particles, we quantify the transport of sprayed CCN to the clouds and examine how the sprayer height influences this process.
This study is organized as follows. First, the simulation setup including necessary model improvements and environmental conditions of the simulated case are discussed. Secondly, the results are analyzed and discussed with special emphasis on the cloud microphyiscal response to spraying in various heights, the plume dispersion, and the activation rate based on the sprayer position. Finally, the study is summarized and discussed.
For this MCB study, a coupled modeling approach is applied. The dynamical core is the LES model System for Atmospheric Modeling (SAM) (Khairoutdinov and Randall, 2003), two-way coupled with LCM cloud microphysics (Hoffmann et al., 2017; Hoffmann and Feingold, 2019).
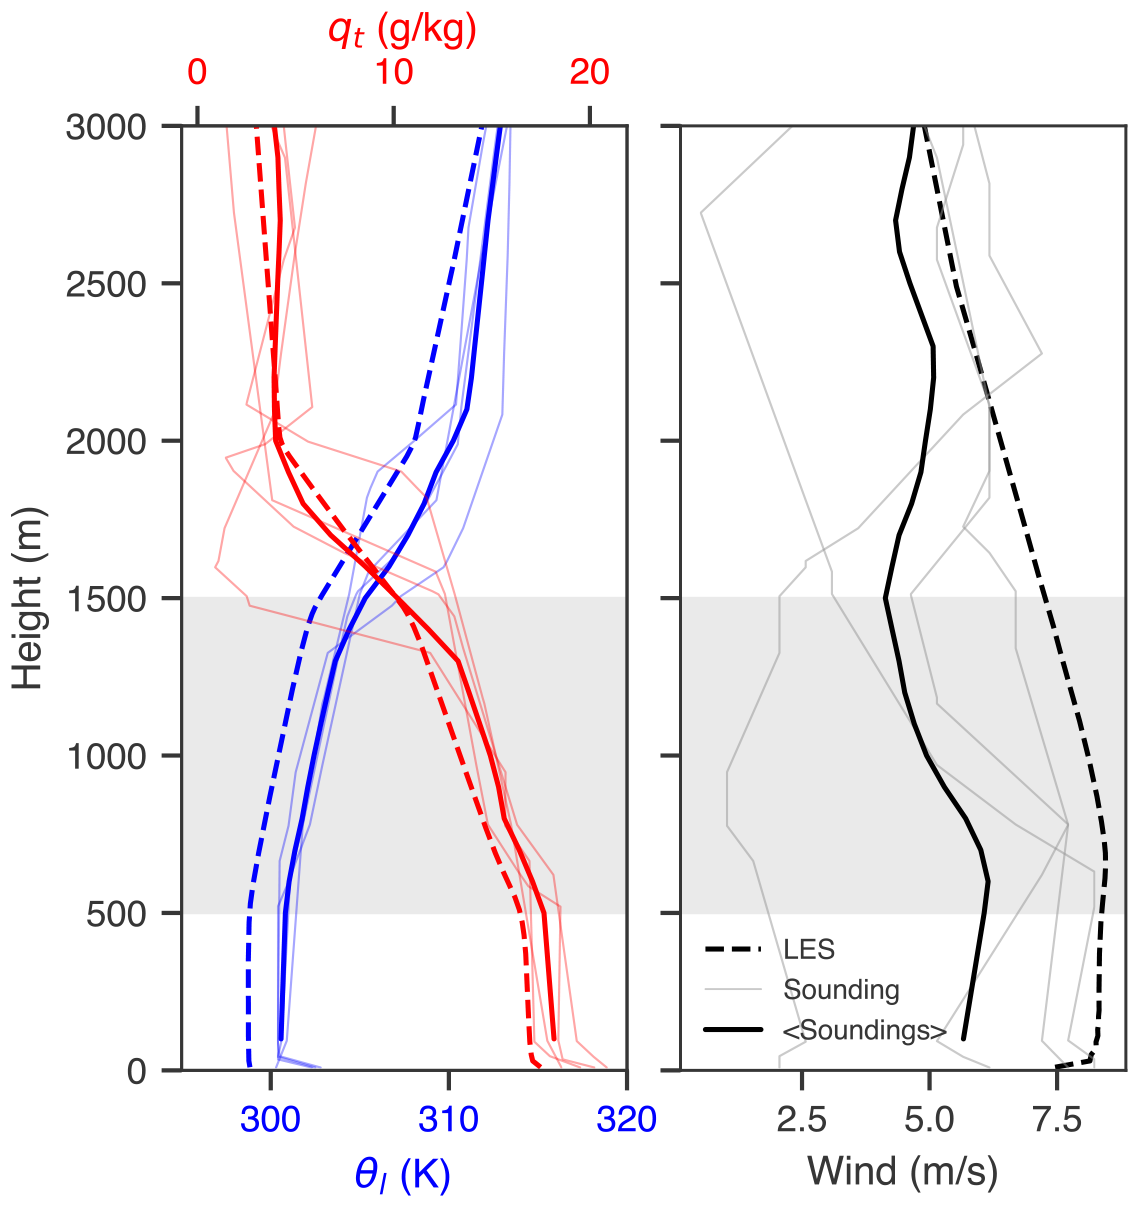
Figure 1The left panel displays the domain-averaged profiles of liquid water potential temperature θl (K) (blue) and the total water mixing ratio qt (red). The right panel shows the mean horizontal wind. Thin lines depict data from individual soundings, thick straight lines show the average of the soundings, and the dashed lines show the LES domain-averaged data. Shaded grey areas mark the cloud layer.
A non-precipitating trade-wind cumulus case is simulated, based on the seminal BOMEX intercomparison case (Siebesma et al., 2003). The environmental setup of the BOMEX case resembles trade-wind cumulus conditions frequently found over the GBR (Eckert et al., 2023). Figure 1 shows four soundings from Willis Island, located upwind of the central GBR, from 10–12 December 2022. Especially the thermodynamic quantities agree well with the domain-averaged LESs results.
The BOMEX case also specifies various large-scale forcings, which, among other things, represent radiative cooling. Accordingly, our simulations do not apply a radiative transfer code.
The LES modeling domain measures 20 480 m × 5120 m × 20 480 m in the two horizontal (x and y) and vertical (z) directions, respectively, with the aerosol sprayer positioned in the center of the short edge of the x–y-plane, with the long edge aligned parallel to the mean wind direction. This domain configuration enables plume analysis up to an hour downwind.
The applied grid spacing (40 m × 40 m × 20 m) reflects a compromise between resolving boundary-layer turbulence and maintaining a sufficiently large domain to follow the aerosol plume downwind and to run the required ensemble for three sprayer altitudes. Recent LES work by Dhandapani et al. (2025) on MCB plume transport in marine stratocumulus demonstrated that plume statistics and radiative proxies are sensitive to the horizontal grid spacing. Previous LES studies on cumulus cloud size distributions suggest that even moderately coarse grid spacings (up to 100 m) represent the largest clouds well (e.g., Neggers et al., 2003). Since the largest clouds exhibit the strongest radiative forcing, we believe the results for different sprayer heights are qualitatively robust, though minor changes may occur for finer grid spacings.
The LCM represents cloud microphysics by simulating Lagrangian computational particles, each representing a multitude of real aerosol particles or cloud droplets with identical properties, e.g., water mass and aerosol mass. Condensation and evaporation of wetted aerosols and cloud droplets is represented by solving the diffusion equation for each LCM particle individually (Hoffmann et al., 2015). Moreover, the particles experience sedimentation (Beard, 1976). To maintain the identity of sprayed CCN, collectional growth was disabled, and is also not expected due to the relatively high droplet concentrations. It is important to note that the LCM treats all hydrometeors in a uniform manner. The categorization into aerosol particles and cloud droplets is undertaken solely during the analysis process. Additionally, the LCM also provides the ability to track sprayed aerosols and cloud droplets, which enables a straight-forward way to infer some effects of the spraying on the simulated clouds. For more details on the implementation of the LCM, see Hoffmann et al. (2015).
In each LES gridbox, 50 LCM particles are placed, representing the lognormally distributed background aerosol of a concentration of 200 cm−3, a geometric mean aerosol radius of 50 nm, and a geometric standard deviation of 1.25, representing typical marine conditions found over the GBR (Horchler et al., 2025; Braga et al., 2025). Sprayed LCM particles are placed in a predefined gridbox with a rate of 5 LCM particles per timestep, similar to Prabhakaran et al. (2023), but with a higher number of LCM particles added per gridbox and timestep. The sprayed aerosols are also lognormally distributed with a geometric mean radius of sprayed aerosols of 40 nm, a geometric standard deviation of 2.0, and a seeding rate of 1014 aerosol particles per second. The aerosol initial wet radius is chosen corresponding to 3.5 % NaCl in sea water. These parameters are specifically chosen to represent the current technological feasibility of potential MCB sprayers (Hernandez-Jaramillo et al., 2023). However, it should be noted that this current state of technology is not yet matching the theoretically proposed ideal spraying parameters, especially a spraying rate of 1015 particles per second (cf. Wood, 2021).
Three distinct simulation setups are performed, each corresponding to a different aerosol sprayer altitude: one at the sea surface (30 m), another slightly above the cloud base (810 m), and a third near the cloud top (1810 m). These positions are representative for a surface, a cloud-base, and a cloud-top sprayer. A six-hour spin-up period precedes the injection of aerosols, followed by one hour of simulation time that is used for analysis. We avoid longer analysis because the plume would interfere with itself due to the cyclic boundary conditions. Each setup comprises ten ensemble members, each with slightly perturbed initial thermodynamic conditions, to mitigate the limited time for analysis of the sprayed clouds and the natural variability in the cumulus cloud field.
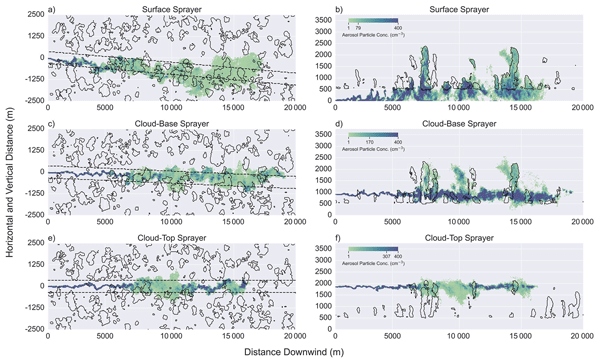
The qualitative behavior of the three different sprayer heights is displayed in Fig. 2, showing a snapshot from the first ensemble run for each scenario. A top view is compared to a profile cut, with colors indicating the average sprayed aerosol concentration, and continuous black lines encircling the clouds. While the top view averages the aerosol concentration over the entire vertical column, the horizontal averaging is restricted to the region between the dashed black lines indicated in the left column, which follow the mean wind and hence the center of the plume for each sprayer height.
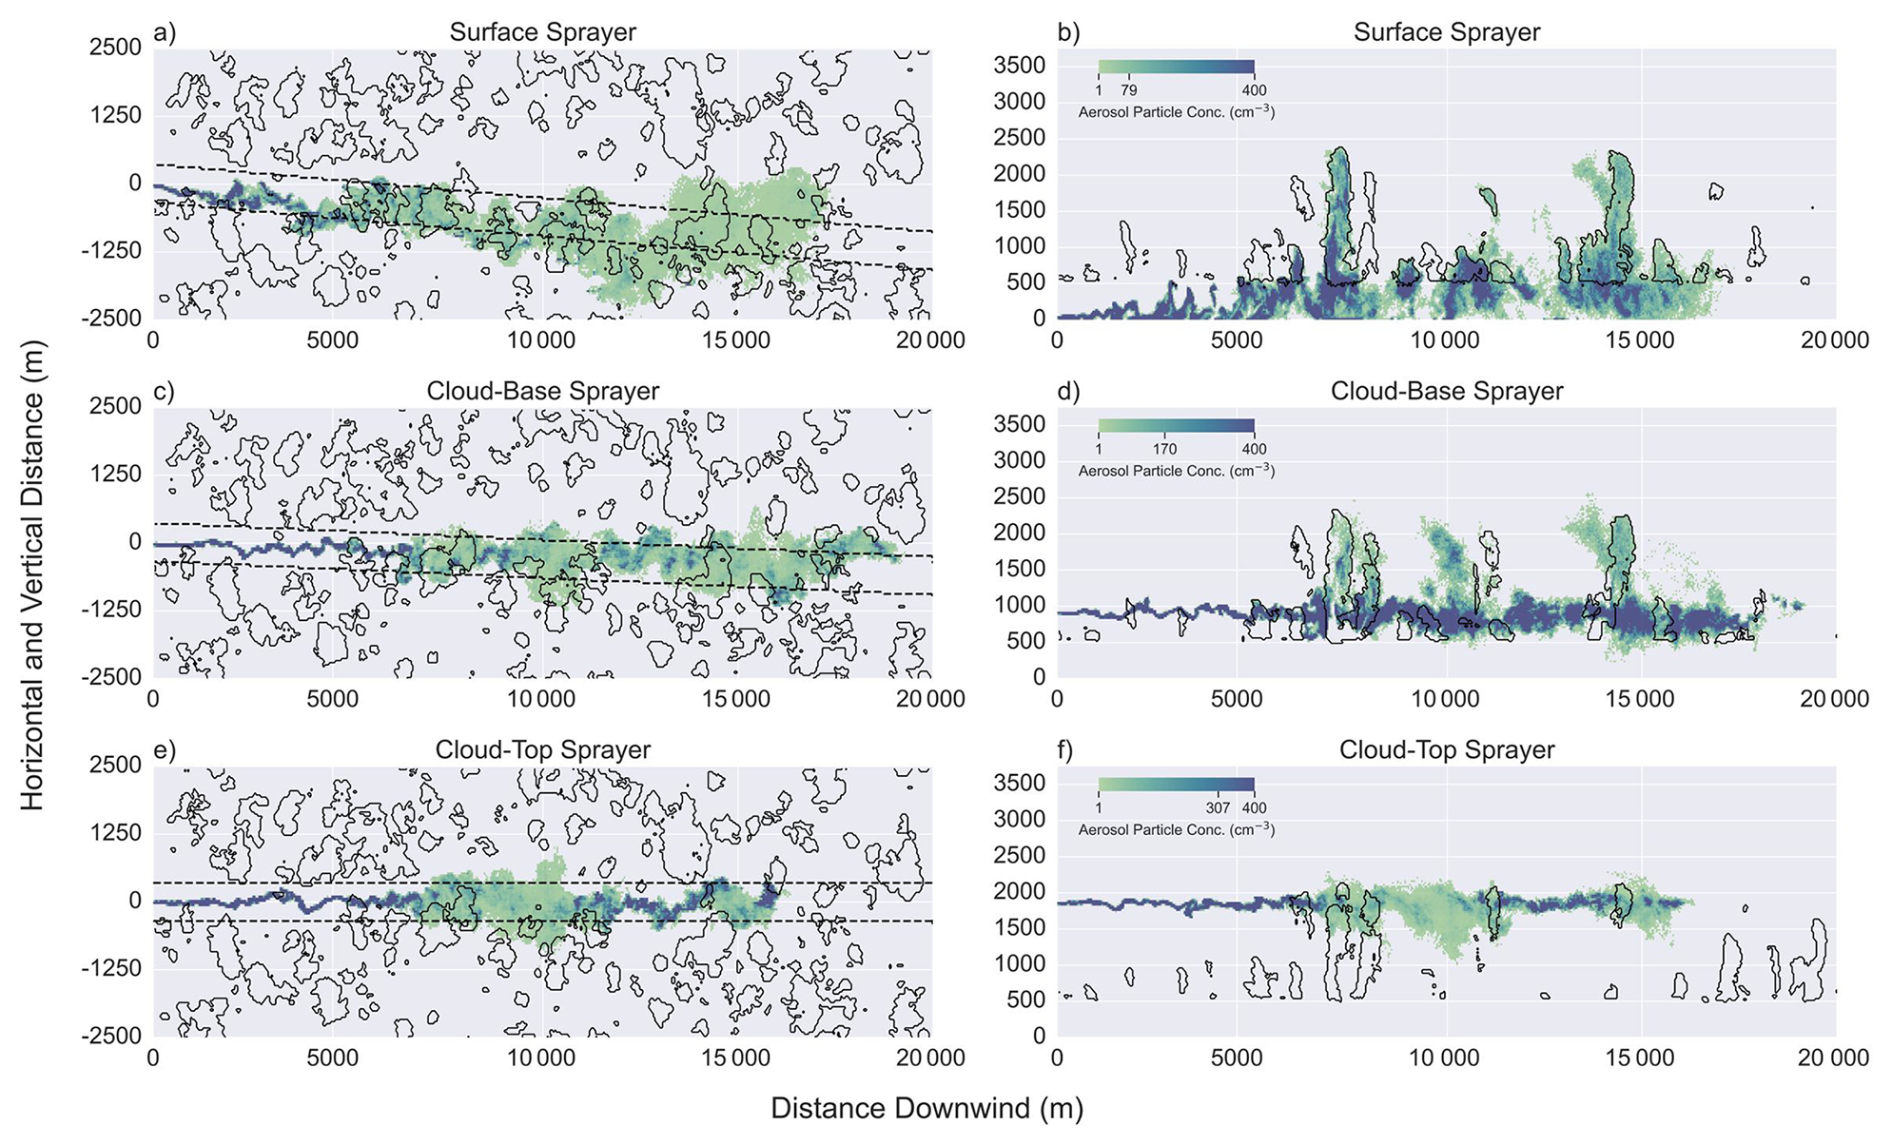
Figure 2Horizontal (left column) and vertical (right column) cross-sections of the average sprayed aerosol concentration (green-blue) and cloud location (black contours) for a surface sprayer (a, b), cloud-base sprayer (c, d), and cloud-top sprayer (e, f). The concentrations are averaged over the entire vertical axis in case of the horizontal cross-sections, while the vertical cross-sections use the volume between the dashed lines shown in the left column. The mean concentration of the horizontal-cross section is indicated by a single tick within the color bar. The cross-sections show the plume dispersion in the cumulus cloud field 38 min after activating the aerosol sprayer.
In Fig. 2a, c, and e one sees that the height of the sprayer and thus the sprayed aerosol do not substantially affect the overall morphology of the cumulus cloud field. This is to be expected because adjustments to changes in the entrainment rate in response to an increase in aerosol tend to require much more time to be effective (e.g., Glassmeier et al., 2021; Chen et al., 2025). Nonetheless, the development of the plume changes substantially with the sprayer height. First, the increasing static stability depletes turbulence with height (Figs. 1 and 4), which reduces the horizontal expansion of the aerosol plume sprayed at greater heights. In addition, the horizontal wind slows down with height (Fig. 1), which reduces the distance the plume travels in a fixed time period. Due to the resultant lower dilution, higher sprayed aerosol concentrations are simulated for higher altitude sprayers.
Figure 2b, d, and f show the importance of clouds for the vertical transport of the sprayed aerosol. Whenever the plume interacts with a cloud, the sprayed aerosol experiences strong vertical transport and is rapidly mixed throughout the cloud volume. Particularly, aerosol sprayed in the sub-cloud layer benefit from updrafts that transport the aerosols to the base of developing cumulus clouds, as can be seen by the overlapping cloud contours and plume regions of the two large clouds at 7000 and 14 500 m distance downwind (Fig. 2b).
3.1 Cloud Optical Response
We assess the relative cloud radiative effect (rCRE) (Betts, 2007) to determine the efficiency of MCB (Hoffmann and Feingold, 2021). The rCRE can be approximated as the product of the cloud albedo Ac and cloud fraction fc,
Assuming overhead sun, we determine
(e.g., Bohren, 1987), with g the asymmetry parameter and
where n(r,z) is the particle size distribution, Qext the extinction coefficient, λ the wavelength, r the particle radius, LWPc the vertically integrated liquid water content (liquid water path), and Nc the droplet number concentration. We use λ=500 nm, representative of the bulk of solar shortwave radiation. The inclusion of (1−g) accounts for the increased backward scattering for small particles (Kokhanovsky, 2004).
We show Ac along LWPc and Nc in the first three columns of Fig. 3, followed by fc in the right-most column to give a comprehensive overview of the parameters determining the rCRE for different sprayer heights (rows). We determine these quantities from cloudy columns with τc≥1, with fc being the fraction of cloudy columns of the entire domain.
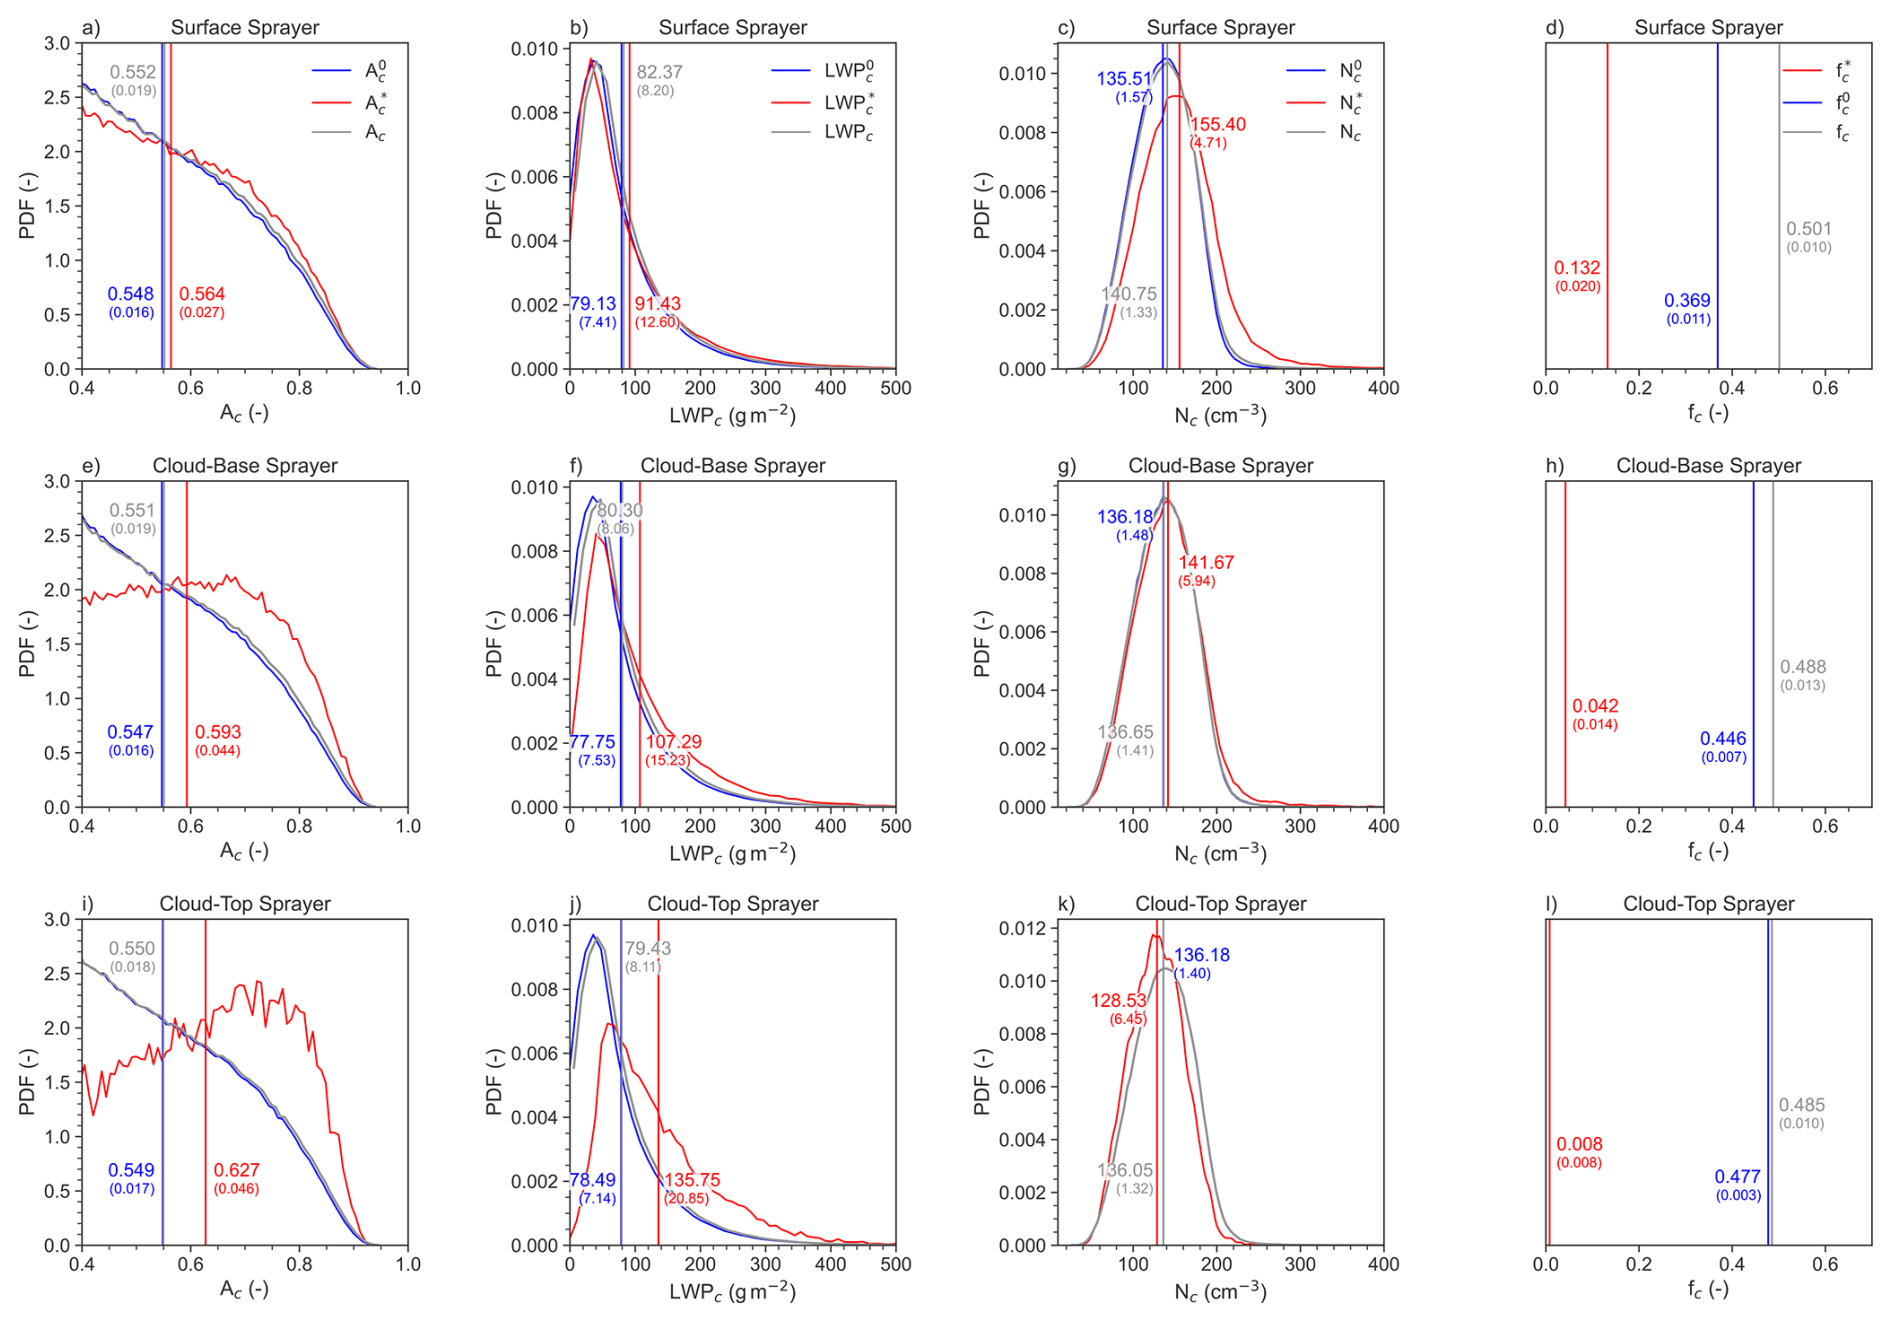
Figure 3The first three columns show probability density functions (PDFs) of cloud albedo Ac, liquid water path (LWPc), and droplet number concentration (Nc) in cloudy columns for the different sprayer heights (rows). The right-most column shows the corresponding cloud fractions (fc). Vertical gray, red, and blue lines indicate the ensemble mean for all cloudy columns (no superscript) and cloudy columns affected by the sprayed aerosol (asterisk superscript) or not (zero superscript), respectively. The ensemble means' numerical values are indicated in the plot, followed by the ensemble spread in parentheses. The ensemble spread is determined from the respective mean values of each ensemble member. The considered data is from between 20 and 50 min after the sprayer was activated.
Ac for all clouds (gray lines, no superscript), sprayed clouds (red lines, asterisk superscript), and non-sprayed clouds (blue, 0 superscript) is displayed in Fig. 3a, e, and i. A cloud is considered sprayed when there is at least one sprayed LCM particle in a vertical column. As one expects, Ac of the unsprayed clouds is largely unaffected by the sprayer height, and the sprayed clouds seem to exhibit larger average Ac (indicated by vertical lines). Interestingly, Ac for sprayed clouds increases with sprayer height. What causes this behavior?
Figure 3b, f, and j present the LWPc for different sprayer heights. We see that the LWPc peaks around 50 g m−2 for all clouds, with a long tail towards high values, depicting rare deep clouds. For the surface sprayer, LWPc in the sprayed clouds is nearly unchanged compared to all clouds, indicating that clouds of all sizes are affected by the sprayer. In contrast, higher sprayers primarily impact deeper, high-LWPc clouds, while the LWPc of all clouds is similar to the lower sprayer heights. This indicates that the increase in the average LWPc in sprayed clouds is not due to the spraying creating deeper clouds but due to the sprayed aerosol interacting preferentially with deeper clouds.
Figure 3c, g, and k show Nc. The intended increase in Nc is most pronounced for the surface sprayer. As we will discuss in Sect. 3.3., this is due to a higher probability of sprayed aerosols to activate to cloud droplets if they enter the clouds through the cloud base (surface sprayer) than by lateral entrainment (higher sprayers) (Hoffmann et al., 2015; Oh et al., 2023). In fact, the sprayed-cloud Nc barely changes for higher sprayers compared to the non-sprayed clouds, and even slightly decreases for the highest sprayer, which might be due to the stronger dilution of deeper clouds.
The behavior of LWPc and Nc with sprayer height indicates that the increase in Ac for the surface sprayer is mainly due to an increase in Nc, the main mechanism of MCB (Latham et al., 2012). The increase in Ac for higher sprayers, however, is due to the sprayed aerosol primarily interacting with deeper and hence higher LWPc clouds, and is therefore not a result of MCB.
Figure 3d, h, and l show that the area fraction of clouds affected by the plume, , decreases with sprayer altitude. As already indicated for Fig. 2 and further discussed in Sect. 3.2 below, the decrease in is due to weaker turbulence limiting plume dispersion for higher sprayers.
How does this affect the rCRE? Assuming that fc remains unchanged due to spraying (cf. 3d, h, and l), the resultant change in the rCRE due to spraying is
Based on this metric, the surface sprayer shows the largest brightening [d(rCRE) = 0.0021], while it decreases with height [d(rCRE) = 0.0019 and d(rCRE) = 0.0006]. Compared to the base rCRE = 0.2766, the change is, however, small. We will discuss how to increase d(rCRE) in Sect. 4.
3.2 Plume Dispersion
A comprehensive understanding of plume propagation is important for optimizing the deployment of MCB, as has been discussed recently by Dhandapani et al. (2025), who simulated a single surface sprayer's plume dispersion for MCB deployment in stratocumulus, using LESs with a bulk microphysics scheme. In the trade-wind cumulus region, a well-mixed, decoupled sub-cloud layer exists between the ocean surface and cloud base (here at 500 m), with a conditionally stable cloud layer above, followed by an unconditionally stable free troposphere (here >1500 m), as indicated by the temperature profile in Fig. 1. The increasing stability with height depletes turbulence (Siebesma et al., 2003; Stull, 1988). The vertical profile of turbulence kinetic energy (TKE) in this shallow cumulus environment reflects the combined influence of surface forcing, buoyancy, and stratification (Fig. 4). Near the surface, TKE production is high due to strong mechanical generation from shear and convective turbulence driven by surface heating, resulting in vigorous mixing in the sub-cloud layer. With height, mechanical production gradually declines as the influence of the surface weakens. Within the cloud layer, TKE stays constant due to buoyancy production associated with latent heat release during condensation, enhancing turbulent mixing within the clouds. Above the cloud tops, TKE diminishes where turbulence is dampened by the stable stratification. This vertical structure underlies the observed plume dispersion patterns.
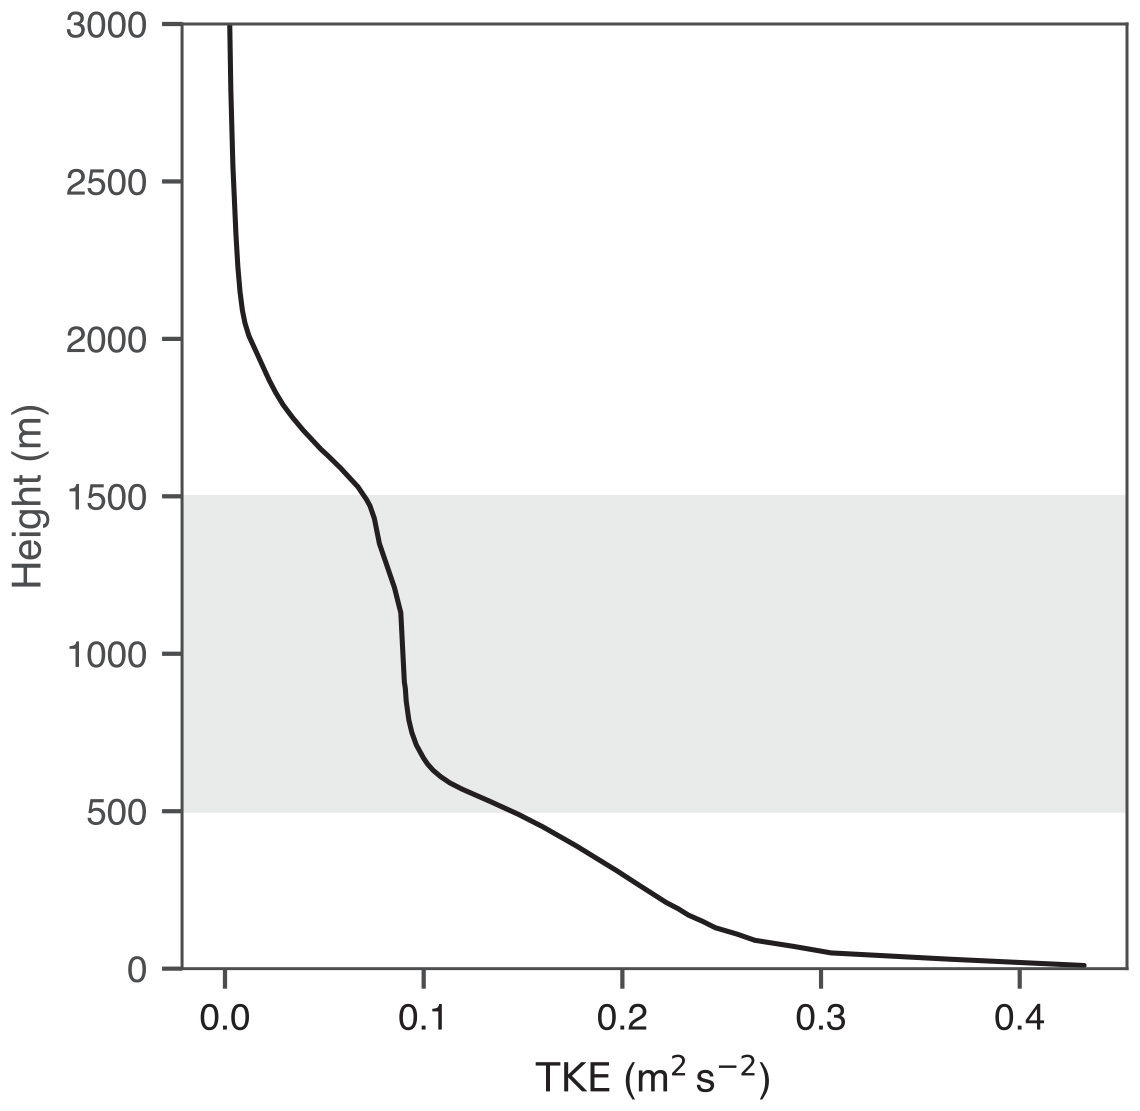
Figure 4The domain-averaged vertical profile of the TKE from the LES simulations is shown. Shaded grey areas mark the cloud layer.
The development of the mean horizontal plume width and the corresponding minima and maxima are shown in Fig. 5a, b, and c. The sub-cloud layer experiences the strongest turbulent dispersion, evident by the rapid increase in mean plume width downwind of the surface sprayer (Fig. 5a), while the dispersion is clearly slower at higher levels (Fig. 5b and c), reflecting the aformentioned role of turbulence in widening the aerosol plume (Fig. 4).
Figure 5d, e, and f show the vertical plume dispersion. While the plume emitted by the surface sprayer remains for some time in the sub-cloud layer, it reaches the cloud layer (on average) about 5000 m downwind of the sprayer. In the cloud layer, the plume quickly disperses in the vertical by clouds lifting the aerosols up to 1800 m. This vertical transport within the cloud layer is similar for higher sprayers. However, the transport of aerosol from the higher sprayers to the sub-cloud layer is slow, indicating that a large fraction of the aerosol sprayed from higher sprayers remains in the cloud layer.
The dispersion patterns for the three sprayer heights suggest that surface sprayers are the most effective for seeding a larger region, while cloud-top sprayers are the least efficient. This is attributed to more extensive horizontal dispersion at lower altitudes, allowing aerosols to be entrained into multiple updrafts over a broader region, which is in good agreement with the result from Fig. 3d, h, and l, which show that the highest is found for the surface sprayer.
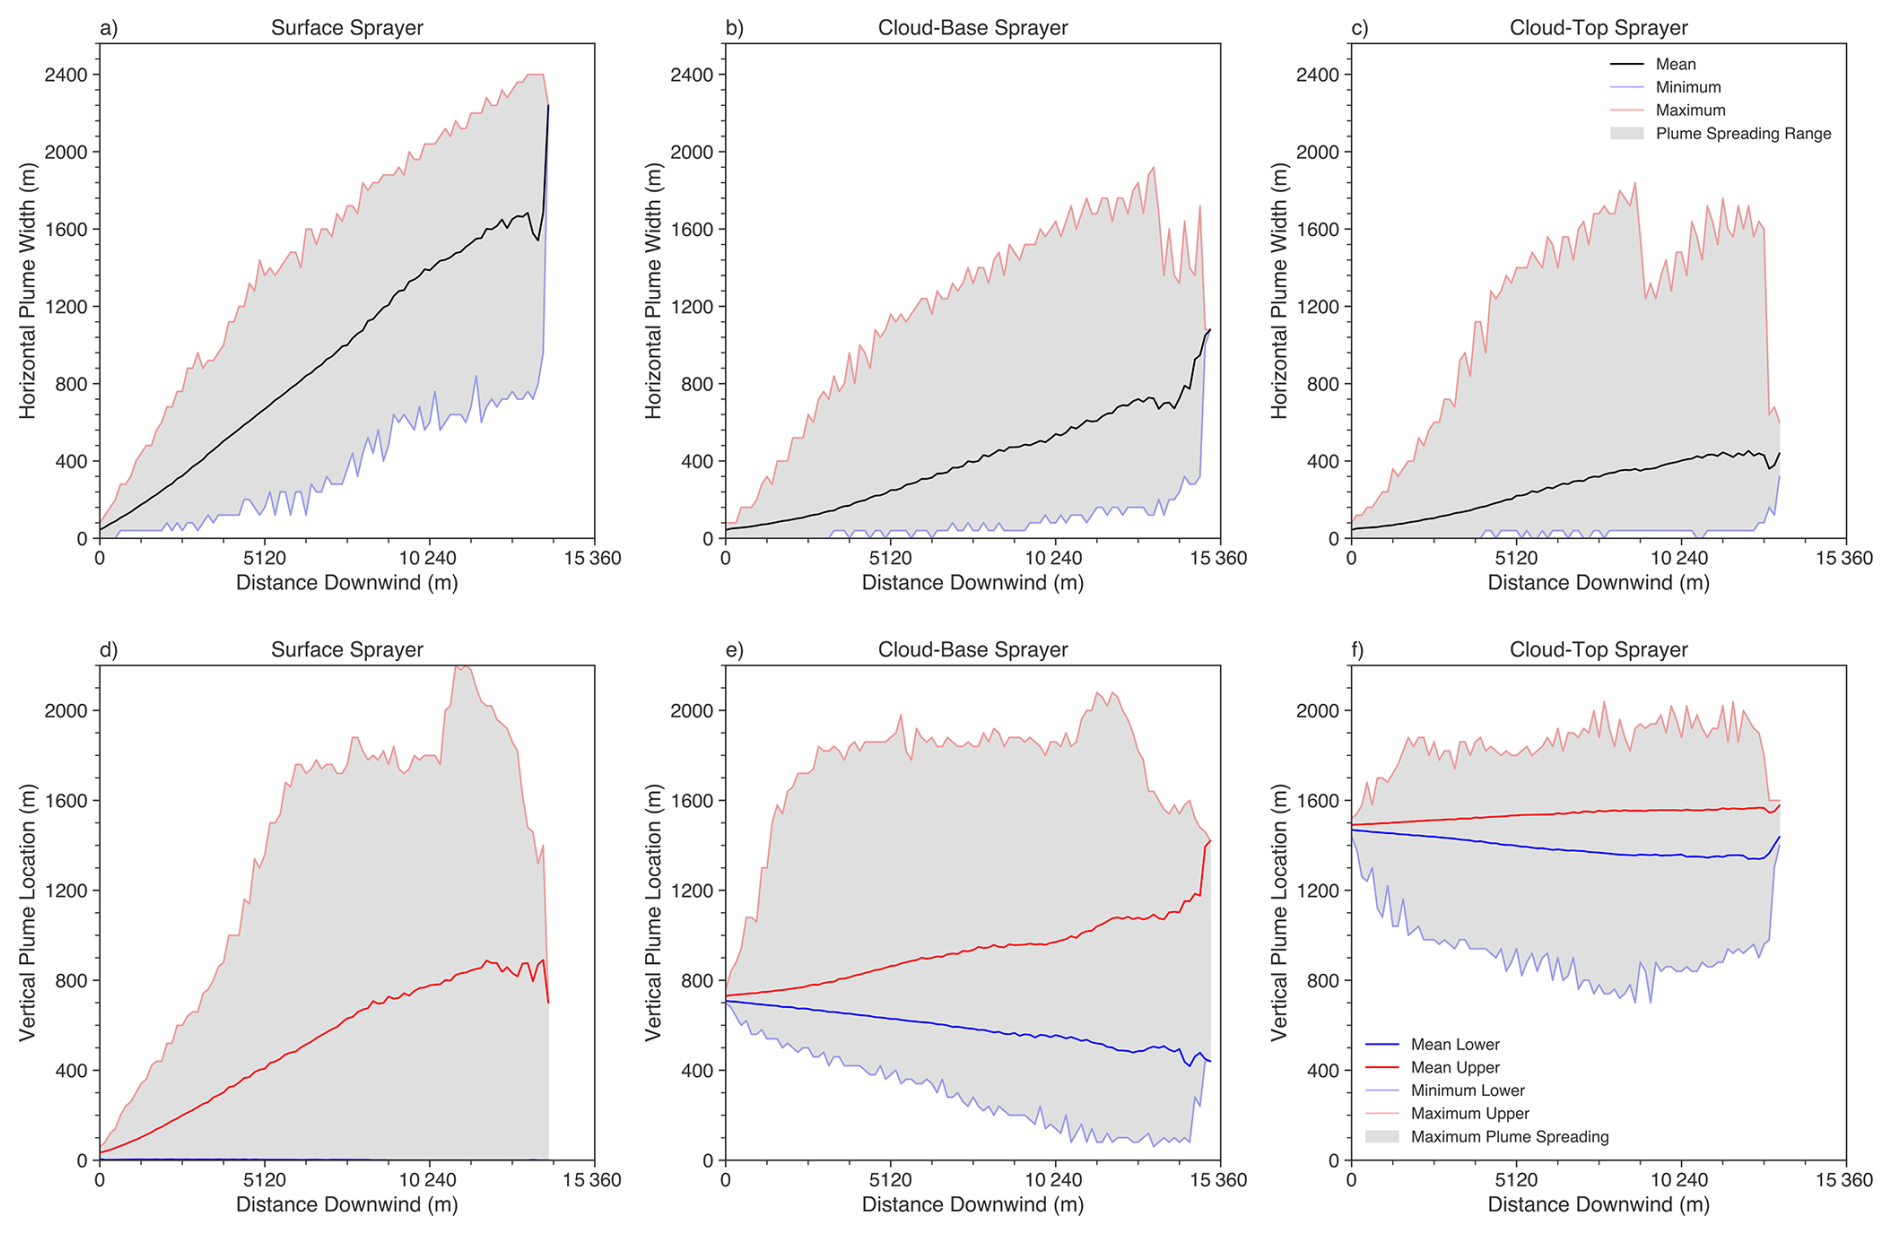
Figure 5For three sprayer heights, the plume dispersion in the horizontal plane (upper panels) and vertical plane (lower panels) are displayed. For the horizontal extension the mean plume width (black) and its maximum (red) and minimum (blue) extent are shown as a function of the distance to the sprayer. For the vertical extent the mean upper (red) and mean lower (blue) height relative to the sea surface, as well as the maximum upper (pale red) and minimum lower (pale blue) height are shown. The ensemble data is averaged over 35 min, with the tip of the plume (first 15 % of the streamwise development) excluded to prevent a bias due to its lower horizontal development.
3.3 Activation Rate
In Fig. 6, the fraction of sprayed aerosols that are activated to cloud droplets is displayed for the surface sprayer (green), the cloud-base sprayer (orange), and the cloud-top sprayer (blue). Only regions with sprayed aerosols inside the cloud (liquid water content > 0.01 g m−3) are considered.
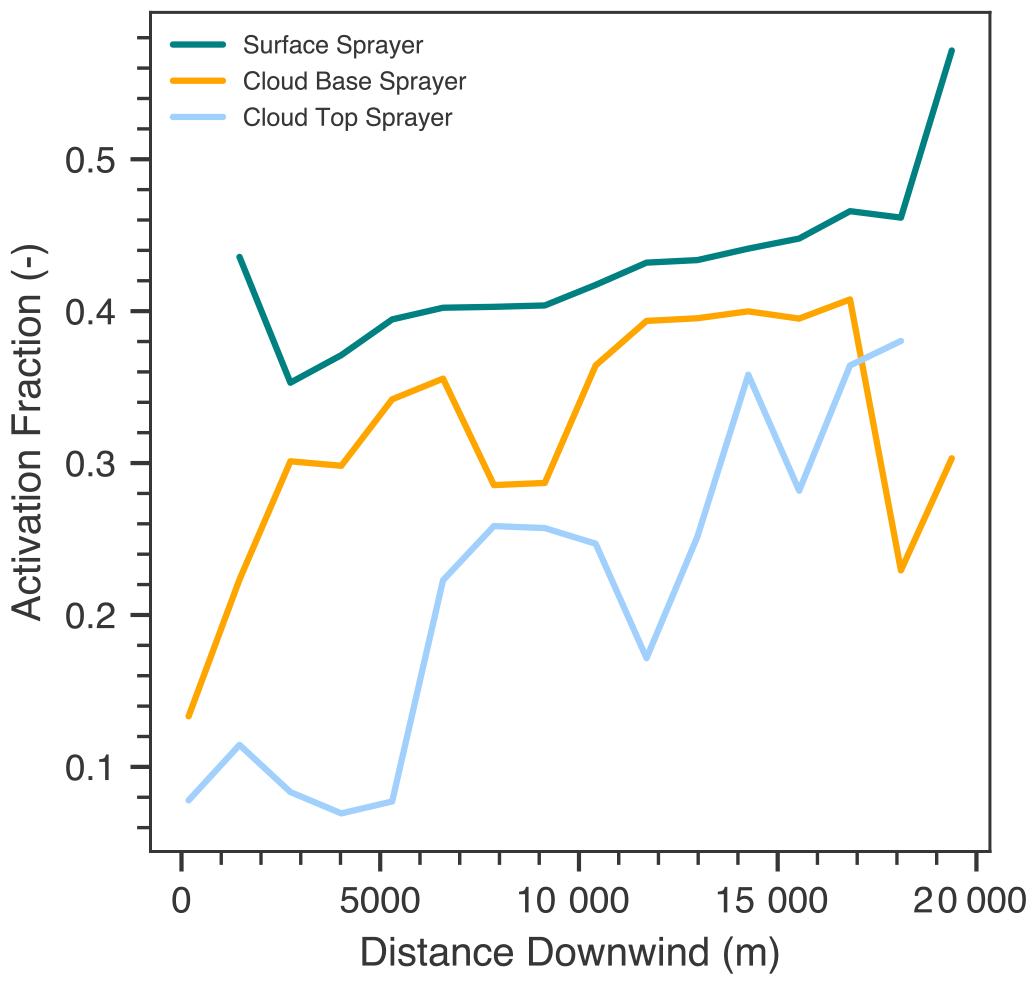
Figure 6The averaged sprayed aerosol activation fraction for the surface sprayer (green), cloud-base sprayer (orange) and cloud-top sprayer (blue) are displayed as a function of the distance from the sprayer.
The surface sprayer leads to the highest activation fraction, while the higher sprayers in the cloud layer tend to show an overall reduced activation fraction. As indicated by Figs. 2 and 5 d, e, and f, aerosols emitted from the surface sprayer enter the cloud through the cloud base, where the largest supersaturations occur, enabling a large fraction of aerosols to activate to cloud droplets. For higher sprayers, the way to activation is primarily through lateral entrainment. Because supersaturations are significantly lower for this pathway (Hoffmann et al., 2015; Oh et al., 2023), activation is not as effective as for the surface sprayer.
Why does the activation fraction increase with distance to the sprayer? While the fraction of aerosols transported from higher sprayers into the sub-cloud layer increases with distance to the sprayer (Fig. 5e and f), more aerosols can activate at cloud base and the activation fraction of higher sprayers increases, just as for the surface sprayer. At the same time, the aerosol plume dilutes (Fig. 5), which decreases the competition for water vapor during activation, which also allows more aerosol particles to activate (Hernandez-Jaramillo et al., 2023).
Marine cloud brightening (MCB) is a proposed strategy to mitigate the effects of global warming by increasing the reflectance of clouds. This strategy is based on increasing the number concentration of cloud droplets by adding additional aerosols (Latham et al., 2012; Feingold et al., 2024). While prior studies predominantly centered on marine stratocumulus clouds due to their heightened susceptibility to MCB (e.g., Dhandapani et al., 2025; Hoffmann and Feingold, 2021), this study investigates MCB for trade-wind cumulus clouds to evaluate its potential for cooling small, high-value sites such as the Great Barrier Reef (GBR) in Australia, as recently proposed by Condie et al. (2021) and Harrison (2024).
To address open points regarding this proposed strategy, we performed high-resolution large-eddy simulations with detailed Lagrangian cloud microphysics. The impact of a single aerosol sprayer, placed at three heights, on a shallow cumulus field has been analyzed, showing that MCB is generally applicable under such conditions. The choice of sprayer height has a substantial impact on the increase of the cloud albedo of the region affected by the sprayed aerosol, with the surface sprayer resulting in the largest increase in the relative cloud radiative effect (rCRE). There are two main reasons for this:
-
Surface aerosol spraying benefits from the strongest plume dispersion, caused by more vigorous turbulence in the sub-cloud layer. In contrast, higher sprayers experience reduced plume dispersion due to weaker turbulence, leading to a smaller sprayed cloud fraction.
-
Aerosols introduced at the surface exhibit the highest activation fraction, that is the concentration of activated droplets produced from sprayed aerosols, as they are transported into clouds through their base by updrafts connecting sub-cloud and cloud layer. The strong supersaturations experienced at cloud base result in a great number of newly formed cloud droplets, which is the primary mechanism driving cloud brightening (Latham et al., 2012). In contrast, aerosols introduced at higher altitudes primarily enter clouds by lateral entrainment, where lower supersaturations limit their ability to activate, reducing the effectiveness of the seeding process (Hoffmann et al., 2015; Oh et al., 2023).
Thus, the increase in the rCRE is strongest for surface sprayers, which seed a larger fraction of the cloud field and enhance cloud reflectivity through more efficient aerosol activation. Mid- and high-altitude sprayers show reduced efficiency due to limited plume dispersion and lower seeding effectiveness. These findings indicate that for cumulus environments, surface sprayers offer the most viable MCB deployment strategy.
Our results emphasize the importance of optimizing aerosol injection strategies for effective MCB implementation in cumulus regions. As our study focused on the first 50 min after spraying, future studies should further investigate the long-term interactions between sprayed clouds and broader atmospheric processes to refine deployment methodologies and assess their climate impact. Furthermore, stronger injection rates of aerosols should be discussed, as we simulated the current technological state of the art, but not the theoretically suggested spraying rate, which is a factor of 10 larger than the rate tested here. Assuming a linear relationship between aerosol concentration and droplet activation, Nc could increase to cm−3 for clouds affected by the surface sprayer. From Eqs. (2) and (3), we get
which yields , and an increase in rCRE of d(rCRE) = 0.0044 compared to the 0.0021 shown in this study, assuming the same . Multiplied with a typical value for the average clear-sky shortwave surface irradiance of about 250 W m−2 for the examined region of the globe (e.g., Gilgen et al., 1998), the corresponding (absolute) cloud radiative effect (CRE) increases from 0.5 to 1.1 W m−2. While this represents a doubling from the initial d(rCRE) for the surface sprayer, it is still small compared to the base rCRE = 0.2711 (CRE = 67.8 W m−2). This indicates that spraying a larger fraction of clouds should be considered as important as the increase of cloud reflectance of individual clouds for MCB of cumulus clouds.
All data produced for this study is publicly available via the Zenodo repository https://doi.org/10.5281/zenodo.17011767 (Kainz et al., 2025).
JK and FH conceived the original conceptualization of the presented work. JK, DPH, and FH contributed to the discussions and interpretation of the results. JK wrote the original draft and DPH and FH contributed to the review and editing. FH provided the funding acquisition and project administration.
The contact author has declared that none of the authors has any competing interests.
Publisher's note: Copernicus Publications remains neutral with regard to jurisdictional claims made in the text, published maps, institutional affiliations, or any other geographical representation in this paper. The authors bear the ultimate responsibility for providing appropriate place names. Views expressed in the text are those of the authors and do not necessarily reflect the views of the publisher.
The authors acknowledge the Gauss Centre for Supercomputing e.V. for providing computing time on the GCS Supercomputer SuperMUC-NG at the Leibniz Supercomputing Centre (LRZ). The soundings were supplied by University of Wyoming (http://www.weather.uwyo.edu/upperair/sounding.shtml, last access: 24 June 2026). The authors thank Jung-Sub Lim for the implementation of the sprayed particle tracking algorithm.
This research has been supported by the Deutsche Forschungsgemeinschaft (grant nos. HO 6588/1-1 and HO 6588/3-1) and the Great Barrier Reef Foundation (grant no. Reef Restauration and Adaptation Program). The Reef Restoration and Adaptation Program is funded by the partnership between the Australian Governments Reef Trust and the Great Barrier Reef Foundation.
The article processing charges for this open-access publication were covered by the Freie Universität Berlin.
This paper was edited by Ivy Tan and reviewed by Michael Diamond and Chandru Dhandapani.
Beard, K. V.: Terminal Velocity and Shape of Cloud and Precipitation Drops Aloft, J. Atmos. Sci., 33, 851–864, https://doi.org/10.1175/1520-0469(1976)033<0851:TVASOC>2.0.CO;2, 1976. a
Betts, A. K.: Coupling of water vapor convergence, clouds, precipitation, and land-surface processes, J. Geophys. Res.-Atmos., 112, https://doi.org/10.1029/2006JD008191, 2007. a
Bohren, C. F.: Multiple scattering of light and some of its observable consequences, Am. J. Phys., 55, 524–533, https://doi.org/10.1119/1.15109, 1987. a
Braga, R. C., Rosenfeld, D., Hernandez, D., Medcraft, C., Efraim, A., Moser, M., Lucke, J., Doss, A., and Harrison, D.: Cloud processing dominates the vertical profiles of aerosols in marine air masses over the Great Barrier Reef, Atmos. Res., 315, 107928, https://doi.org/10.1016/j.atmosres.2025.107928, 2025. a
Chen, Y.-S., Prabhakaran, P., Hoffmann, F., Kazil, J., Yamaguchi, T., and Feingold, G.: Magnitude and timescale of liquid water path adjustments to cloud droplet number concentration perturbations for nocturnal non-precipitating marine stratocumulus, Atmos. Chem. Phys., 25, 6141–6159, https://doi.org/10.5194/acp-25-6141-2025, 2025. a
Claudel, C., Lockley, A., Hoffmann, F., and Xia, Y.: Marine-cloud brightening: an airborne concept, Environmental Research Communications, 6, 035020, https://doi.org/10.1088/2515-7620/ad2f71, 2024. a
Condie, S. A., Anthony, K. R. N., Babcock, R. C., Baird, M. E., Beeden, R., Fletcher, C. S., Gorton, R., Harrison, D., Hobday, A. J., Plagányi, É. E., and Westcott, D. A.: Large-scale interventions may delay decline of the Great Barrier Reef, Roy. Soc. Open Sci., 8, 201296, https://doi.org/10.1098/rsos.201296, 2021. a
Dhandapani, C., Kaul, C. M., Pressel, K. G., Blossey, P. N., Wood, R., and Kulkarni, G.: Sensitivities of Large Eddy Simulations of Aerosol Plume Transport and Cloud Response, J. Adv. Model. Earth Sy., 17, e2024MS004546, https://doi.org/10.1029/2024MS004546, 2025. a, b, c
Eckert, C., Monteforte, K. I., Harrison, D. P., and Kelaher, B. P.: Exploring Meteorological Conditions and Microscale Temperature Inversions above the Great Barrier Reef through Drone-Based Measurements, Drones, 7, https://doi.org/10.3390/drones7120695, 2023. a
Feingold, G., Ghate, V. P., Russell, L. M., Blossey, P., Cantrell, W., Christensen, M. W., Diamond, M. S., Gettelman, A., Glassmeier, F., Gryspeerdt, E., Haywood, J., Hoffmann, F., Kaul, C. M., Lebsock, M., McComiskey, A. C., McCoy, D. T., Ming, Y., Mülmenstädt, J., Possner, A., Prabhakaran, P., Quinn, P. K., Schmidt, K. S., Shaw, R. A., Singer, C. E., Sorooshian, A., Toll, V., Wan, J. S., Wood, R., Yang, F., Zhang, J., and Zheng, X.: Physical science research needed to evaluate the viability and risks of marine cloud brightening, Science Advances, 10, eadi8594, https://doi.org/10.1126/sciadv.adi8594, 2024. a, b
Gilgen, H., Wild, M., and Ohmura, A.: Means and trends of shortwave irradiance at the surface estimated from global energy balance archive data, J. Climate, 11, 2042–2061, https://doi.org/10.1175/1520-0442(1998)011<2042:MATOSI>2.0.CO;2, 1998. a
Glassmeier, F., Hoffmann, F., Johnson, J. S., Yamaguchi, T., Carslaw, K. S., and Feingold, G.: Aerosol-cloud-climate cooling overestimated by ship-track data, Science, 371, 485–489, https://doi.org/10.1126/science.abd3980, 2021. a
Harrison, D.: An Overview of Environmental Engineering Methods for Reducing Coral Bleaching Stress, CNC Press, https://doi.org/10.1201/9781003320425, 2024. a, b
Hernandez-Jaramillo, D. C., Harrison, L., Kelaher, B., Ristovski, Z., and Harrison, D. P.: Evaporative Cooling Does Not Prevent Vertical Dispersion of Effervescent Seawater Aerosol for Brightening Clouds, Environ. Sci. Technol., 57, 20559–20570, https://doi.org/10.1021/acs.est.3c04793, 2023. a, b
Hoffmann, F. and Feingold, G.: Entrainment and Mixing in Stratocumulus: Effects of a New Explicit Subgrid-Scale Scheme for Large-Eddy Simulations with Particle-Based Microphysics, J. Atmos. Sci., 76, 1955–1973, https://doi.org/10.1175/JAS-D-18-0318.1, 2019. a
Hoffmann, F. and Feingold, G.: Cloud Microphysical Implications for Marine Cloud Brightening: The Importance of the Seeded Particle Size Distribution, J. Atmos. Sci., 78, 3247–3262, https://doi.org/10.1175/JAS-D-21-0077.1, 2021. a, b
Hoffmann, F., Raasch, S., and Noh, Y.: Entrainment of aerosols and their activation in a shallow cumulus cloud studied with a coupled LCM–LES approach, Atmos. Res., 156, 43–57, https://doi.org/10.1016/j.atmosres.2014.12.008, 2015. a, b, c, d, e, f
Hoffmann, F., Noh, Y., and Raasch, S.: The route to raindrop formation in a shallow cumulus cloud simulated by a Lagrangian cloud model, J. Atmos. Sci., 74, 2125–2142, https://doi.org/10.1175/JAS-D-16-0220.1, 2017. a
Horchler, E. J., Alroe, J., Harrison, L., Cravigan, L., Harrison, D. P., and Ristovski, Z. D.: Measurement report: Aerosol and cloud nuclei properties along the Central and Northern Great Barrier Reef – impact of continental emissions, Atmos. Chem. Phys., 25, 10075–10087, https://doi.org/10.5194/acp-25-10075-2025, 2025. a
Kainz, J., Harrison, D., and Hoffmann, F.: Marine Cloud Brightening of Cumulus Clouds: From the Sprayer to the Cloud, Zenodo [data set], https://doi.org/10.5281/zenodo.17011767, 2025. a
Khairoutdinov, M. F. and Randall, D. A.: Cloud resolving modeling of the ARM summer 1997 IOP: Model formulation, results, uncertainties, and sensitivities, J. Atmos. Sci., 60, 607–625, https://doi.org/10.1175/1520-0469(2003)060<0607:CRMOTA>2.0.CO;2, 2003. a
Kokhanovsky, A.: Optical properties of terrestrial clouds, Earth-Sci. Rev., 64, 189–241, https://doi.org/10.1016/S0012-8252(03)00042-4, 2004. a
Latham, J.: Amelioration of global warming by controlled enhancement of the albedo and longevity of low-level maritime clouds, Atmos. Sci. Lett., 3, 52–58, https://doi.org/10.1006/asle.2002.0099, 2002. a
Latham, J., Bower, K., Choularton, T., Coe, H., Connolly, P., Cooper, G., Craft, T., Foster, J., Gadian, A., Galbraith, L., et al.: Marine cloud brightening, Philos. T. R. Soc. A, 370, 4217–4262, https://doi.org/10.1098/rsta.2012.0086, 2012. a, b, c, d
Neggers, R. A., Jonker, H. J., and Siebesma, A.: Size statistics of cumulus cloud populations in large-eddy simulations, J. Atmos. Sci., 60, 1060–1074, https://doi.org/10.1175/1520-0469(2003)60<1060:SSOCCP>2.0.CO;2, 2003. a
Oh, D., Noh, Y., and Hoffmann, F.: Paths From Aerosol Particles to Activation and Cloud Droplets in Shallow Cumulus Clouds: The Roles of Entrainment and Supersaturation Fluctuations, J. Geophys. Res.-Atmos., 128, e2022JD038450, https://doi.org/10.1029/2022JD038450, 2023. a, b, c
Prabhakaran, P., Hoffmann, F., and Feingold, G.: Evaluation of Pulse Aerosol Forcing on Marine Stratocumulus Clouds in the Context of Marine Cloud Brightening, J. Atmos. Sci., 80, 1585–1604, https://doi.org/10.1175/JAS-D-22-0207.1, 2023. a
Siebesma, A. P., Bretherton, C. S., Brown, A., Chlond, A., Cuxart, J., Duynkerke, P. G., Jiang, H., Khairoutdinov, M., Lewellen, D., Moeng, C.-H., Sanchez, E., Stevens, B., and Stevens, D. E.: A Large Eddy Simulation Intercomparison Study of Shallow Cumulus Convection, J. Atmos. Sci., 60, 1201–1219, https://doi.org/10.1175/1520-0469(2003)60<1201:ALESIS>2.0.CO;2, 2003. a, b
Stull, R. B.: An Introduction to Boundary Layer Meteorology, Kluwer Academic Publishers, https://doi.org/10.1007/978-94-009-3027-8, 1988. a
Twomey, S.: Pollution and the planetary albedo, Atmos. Environ., 8, 1251–1256, https://doi.org/10.1016/0004-6981(74)90004-3, 1974. a
Twomey, S.: The influence of pollution on the shortwave albedo of clouds, J. Atmos. Sci., 34, 1149–1152, https://doi.org/10.1175/1520-0469(1977)034<1149:TIOPOT>2.0.CO;2, 1977. a
Wood, R.: Assessing the potential efficacy of marine cloud brightening for cooling Earth using a simple heuristic model, Atmos. Chem. Phys., 21, 14507–14533, https://doi.org/10.5194/acp-21-14507-2021, 2021. a, b
Zhang, J. and Feingold, G.: Distinct regional meteorological influences on low-cloud albedo susceptibility over global marine stratocumulus regions, Atmos. Chem. Phys., 23, 1073–1090, https://doi.org/10.5194/acp-23-1073-2023, 2023. a