the Creative Commons Attribution 4.0 License.
the Creative Commons Attribution 4.0 License.
 | 02 Jul 2026
Drivers of diurnal and seasonal dynamics of triple oxygen isotopes in atmospheric water vapor and precipitation at a Mediterranean forest site
Claudia Voigt
Christine Vallet-Coulomb
Clément Piel
Joana Sauze
Ilja M. Reiter
Jean-Philippe Orts
Françoise Chalié
Christophe Cassou
Irène Xueref-Remy
Anne Alexandre
Triple oxygen isotopes are powerful tracers of hydrological processes, yet their variability in atmospheric water vapor and the underlying controls remain poorly understood. We present a one-year record of triple oxygen and hydrogen isotopes of atmospheric water vapor (, d-excessV, 17O-excessV) measured below, within and above a downy oak forest canopy at the AnaEE platform O3HP in the French Mediterranean. This vapor dataset is complemented by isotopic data of precipitation (, d-excessP, 17O-excessP) and groundwater, as well as monthly observations of stomatal conductance and transpiration. Seasonal variations in 17O-excessV and d-excessV likely reflect changing evaporative conditions at oceanic moisture sources. d-excessP and 17O-excessP show a similar seasonal pattern, enhanced by summer rain re-evaporation. However, no clear isotopic differences were observed in vapor or precipitation derived from different oceanic source regions and weather regimes, likely due to frequent mixing of multiple moisture sources. Diurnal variations in 17O-excessV and d-excessV reflect a combination of vegetation-related processes, including local evapotranspiration. However, the impact of evapotranspiration was not evident at daily timescales. Although precipitation often deviates from isotopic equilibrium with near-surface atmospheric water vapor at the event scale due to incomplete equilibration and rain re-evaporation, equilibrium water vapor reliably approximates the near-surface isotopic composition of atmospheric water vapor at annual scale. Our results highlight the potential of 17O-excess for understanding water exchange between the land and the atmosphere, regardless of climatic and vegetation conditions. They enhance the mechanistic interpretation of precipitation isotopes, which is essential for reliable paleoclimate reconstructions.
- Article
(17532 KB) - Full-text XML
- BibTeX
- EndNote


The analysis of triple oxygen isotopes (16O, 17O, 18O) has become an important tool in the study of the hydrological cycle. The secondarily derived 17O-excess parameter [, with ] complements the traditional d-excess [] in the assessment of hydrological processes. In contrast to d-excess, 17O-excess is only weakly affected by temperature (Barkan and Luz, 2005) and, therefore, insignificantly influenced by condensation and Rayleigh distillation during rainout (Xia et al., 2023). Hence, variations of 17O-excess are mainly driven by diffusive fractionation processes that make it a valuable tracer for climate conditions during evaporation, mainly atmospheric relative humidity (RH) (Alexandre et al., 2018, 2019; Gázquez et al., 2018, 2023; Outrequin et al., 2021; Surma et al., 2015, 2018). Moreover, the 17O-excess of surface waters can be used for identifying if a lake receives continuous surface or subsurface inflow (Surma et al., 2015, 2018), mixing processes between evaporated and unevaporated waters (Voigt et al., 2021), quantifying lake hydrological balance (Pierchala et al., 2021; Voigt et al., 2025) and tracing water exchange at the soil-plant-atmosphere interface (Landais et al., 2006; Li et al., 2017; Voigt et al., 2023). However, little is known about the variability of 17O-excess in atmospheric water vapor and the processes driving it.
Comprehensive knowledge of these processes is essential for constraining the water cycle at the soil-plant-atmosphere interface and for isotope-enabled hydrological modeling. So far, measurements of 17O-excess in atmospheric water vapor have been restricted to discrete samples collected by cryogenic distillation and limited to a handful of studies. Data from atmospheric water vapor over the Southern Ocean (Uemura et al., 2010), continental atmospheric water vapor over northern Greenland (Landais et al., 2012) and a tropical island (Uechi and Uemura, 2019) suggest the potential of 17O-excess to trace changes in relative humidity at the oceanic moisture sources. However, mixing of air masses from different sources, terrestrial moisture recycling, raindrop re-evaporation and local sublimation can alter 17O-excess of continental atmospheric water vapor and associated precipitation (Arellano et al., 2024; Aron et al., 2021; Giménez et al., 2021; He et al., 2021; Landais et al., 2010, 2012; Liang et al., 2024; Ranjan et al., 2021; Surma et al., 2021; Voarintsoa, 2025; Zhang et al., 2025). The respective impact of these processes, inherent to the water cycle, on the 17O-excess and d-excess of precipitation has been recently theorized by Xia et al. (2023). In addition, under certain conditions, stratospheric intrusions can significantly increase the 17O-excess of atmospheric water vapor (Lin et al., 2013).
Here, we quantify the variability in 17O-excess of atmospheric water vapor and precipitation in a French Mediterranean forest ecosystem across seasonal, monthly and daily scales, and assess its key driving processes. The triple oxygen and hydrogen isotopic composition of atmospheric water vapor (δ17O, δ18O, δ2H, 17O-excess and d-excess) was continuously measured over one year using a cavity ring-down spectrometer (CRDS) at multiple heights – below, within and above a deciduous Mediterranean oak forest canopy. Additionally, we analyzed the triple oxygen and hydrogen isotopic composition of precipitation samples collected at quasi-event scale over the sampling period. Meteorological parameters and vegetation phenology, stomatal conductance and transpiration were monitored throughout the oak forest's growing season (live foliage). We quantified oceanic moisture sources and associated evaporative conditions over the ocean and identified eight synoptic patterns that describe synoptic atmospheric variability over the course of the year. We discuss key processes that control the triple oxygen isotopic variability of atmospheric water vapor and precipitation across timescales at the study site. We further examine the hypothesis of isotopic equilibrium between atmospheric water vapor and precipitation, which is often used in surface iso-hydrological models (e.g., Arnault et al., 2021).
2.1 Study site, meteorological and vegetation measurements
The AnaEE (European Research Infrastructure “Analyses and Experimentation on Ecosystems”) in natura facility O3HP (Oak Observatory of the Upper-Provence Observatory) is situated in a deciduous Mediterranean forest about 70 km inland, north of Marseille (France) at an altitude of 680 m above sea level (43.935° N, 5.711° E, Fig. 1a). The forest is dominated by downy oak (Quercus pubescens Willd.) with co-dominant Montpellier maple (Acer monspessulanum L., 25 % of canopy leaf mass). The tree canopy height is between 2 and 6 m. In the understory, typical sub-Mediterranean grasses, forbs, and shrubs are present. In 2021, the stand density was about 3550 trees per hectare with a stand basal area 18.8 m2 ha−1, an average leaf area index of about 2 m2 m−2, ranging between 1 and 3 m2 m−2, and a canopy gap fraction of about 25 % (LAI-2000, LI-COR Inc., Nebraska, USA). In February 2021, a 5.5 m2 plot of the C3 grass species Festuca arundinacea Schreb. was set up in the understory of the forest (Voigt et al., 2023).
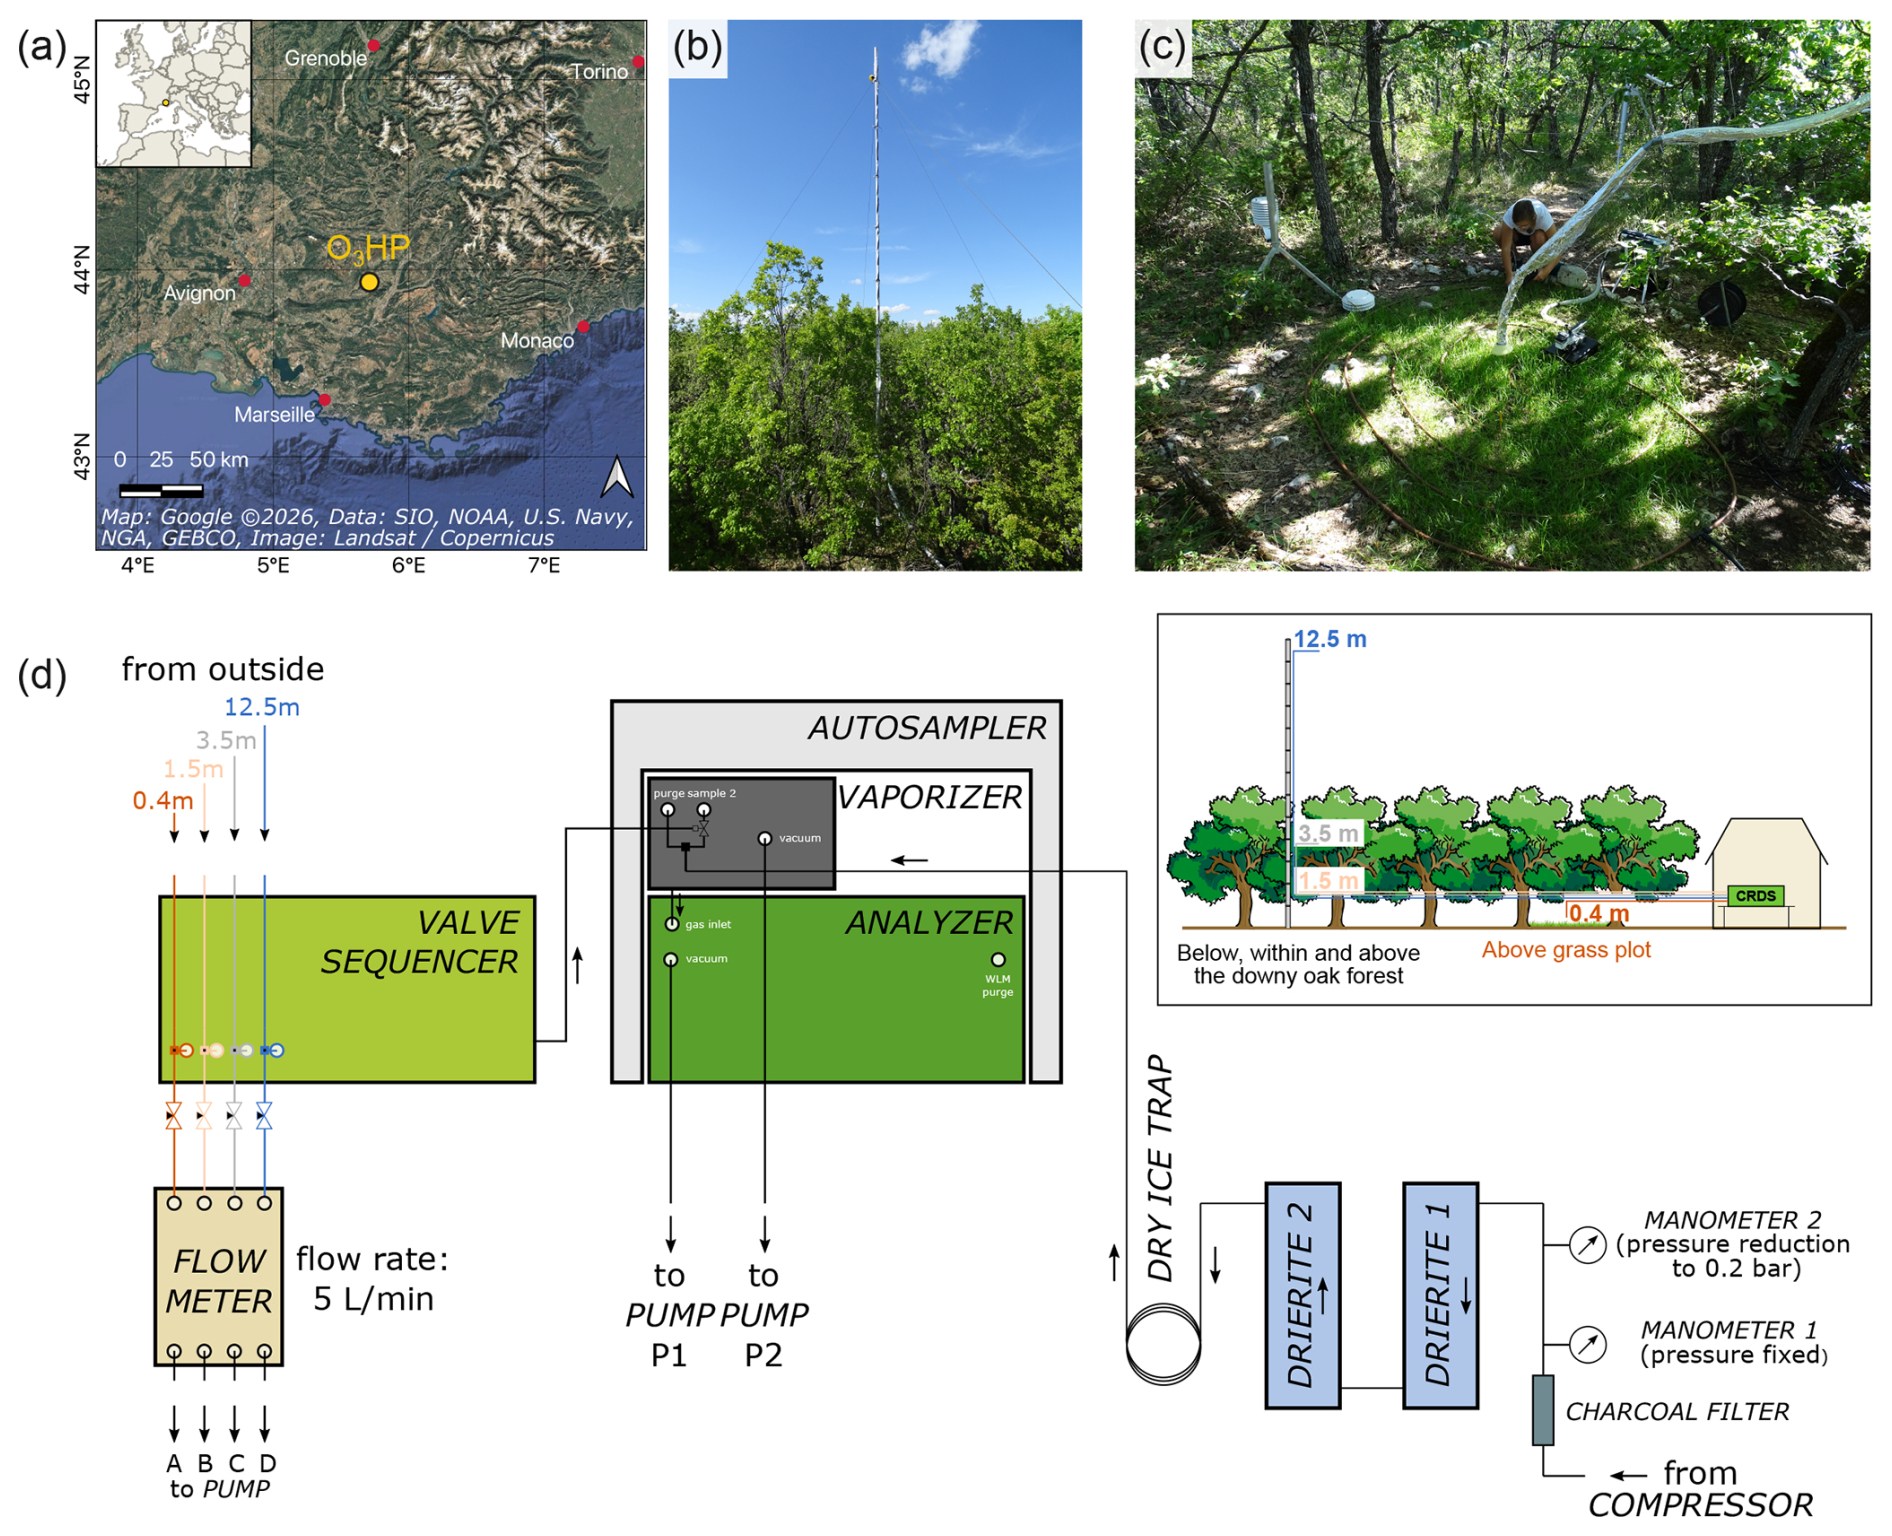
Figure 1(a) Location of the study site O3HP. (Map: Google © 2026, Data: SIO, NOAA, U.S. Navy, NGA, GEBCO, Image: Landsat / Copernicus), (b) Mast installed within the downy oak forest canopy, equipped with intake lines for continuous atmospheric water vapor isotopic sampling. (Photo: C. Voigt). (c) Grass plot in the forest understory instrumented with micro-climate and atmospheric isotopic measurement systems (Photo: A. Alexandre). (d) Schematic illustration of the experimental setup. The solenoid valve behind the vaporizer allowed switching between the valve sequencer used for atmospheric water vapor measurements and the dry air stream provided by the combination of compressed air, drierite columns and the dry ice trap used for weekly calibrations. See text for detailed description.
The following climate parameters were measured on the experimental site: global solar radiation at 6 m above ground (LI-200, LI-COR Biosciences Inc., Nebraska, USA), precipitation amount (15189 H, LAMBRECHT meteo GmbH, Göttingen, Germany), RH and atmospheric temperature (Tair) at 0.6 m height next to the grass plot and at 1.5, 1.9, 4.4 and 6.15 m height in the oak forest canopy (HMP155, Vaisala Oyj, Vantaa, Finland). Furthermore, we used RH and wind speed measured at 10 m height and Tair measured at 10, 50 and 100 m height on the on-site ICOS Tower. Each parameter was extracted in hourly resolution from the COOPERATE database (Reiter et al., 2015).
Photos of the forest canopy were taken every day from a fixed point to provide information on the oak phenology. Stomatal conductance (gs) and transpiration were continuously measured on a single oak leaf in the sun-crown of the canopy using a gas exchange system (Li-6400 XT, LI-COR Inc., Nebraska, USA) over 24 h in the early, middle and last stage of the oak growing season (on 22–23 June, 27–28 August and 22–23 October, respectively). Simultaneously, the spatial variability of gs, was assessed by hourly gs measurements on the abaxial side of 18 oak leaves in the shade- and sun-crown of six different trees (i.e. 3 leaves per tree), using a porometer (AP4, Delta-T Devices LTD, Cambridge, UK).
2.2 Isotopic monitoring of groundwater, precipitation and atmospheric water vapor
All isotopic data presented herein are expressed in delta-notation and normalized on the Vienna Standard Mean Ocean Water – Standard Light Antarctic Precipitation (VSMOW-SLAP) scale. Throughout this study, δ-values, δ′-values, and d-excess are reported in per mil (10−3, ‰), while 17O-excess is reported in per meg (i.e., 0.001 ‰). The isotopic compositions of atmospheric water vapor and precipitation are denoted by the subscripts V and P, respectively.
Figure 1 illustrates the experimental setup for in-situ isotopic monitoring of atmospheric water vapor. The inlets of four -inch wide PFA tubes (PFA-T4-062-100, Swagelok, Ohio, US) were positioned at 0.4 m above the grass plot, and at 1.5, 3.5, and 12.5 m above ground level (m a.g.l.) – below, within and above the downy oak forest canopy, respectively. From bottom to top, the tubes were approximately of 11.5, 15, 20, and 32 m length. Each tube was continuously pumped at a flow rate of ∼5 L min−1 using oil-free diaphragm pumps. Along the entire length, the tubing was insulated and heated to 40–50 °C using self-regulating heat wire to prevent condensation. A funnel covered by a net was placed at each inlet for protection from rain and suction of insects and large aerosol particles. A split of each line was passed to a 16-Port Distribution Manifold (A0311; Picarro Inc., California, USA) coupled to a high-precision vaporizer (A0211, Picarro Inc., California, USA) and a CRDS (L2140-i; Picarro Inc., California, USA). The instrument was installed in an air-conditioned building on the experimental site and was operated in 17O Dual Liquid/Vapor mode. It subsampled air from a selected tube with a flow rate of about 35 mL min−1 for 70 min before switching to the next tube. During data processing, the first 10 min of each line measurement were discarded to minimize memory effects, and the remaining 60 min were averaged. Such long integration times were necessary to achieve high precision in 17O-excess (see below). From January to May 2021, measurements were alternated between the two tubes positioned at 0.4 m above the grass plot and 12.5 m above the forest canopy, resulting in 9–10 measurements per height and day. From June to December 2021, measurements were alternated between all four heights, resulting in 4–5 measurements per height and day.
The calibration protocol of atmospheric water vapor isotopic data is described in detail in Voigt et al. (2023). Three liquid water standards that covered the expected isotopic range of atmospheric water vapor at the study site were analyzed weekly using an autosampler system (A0325, Picarro Inc., California, USA) coupled to the high-precision vaporizer and the analyzer (Fig. 1). The liquid standards were injected in a dry air stream, produced by a lubricated mobile air compressor (MONTECARLO FC2, ABAC air compressors, Italy) and further dried using two drierite columns and a dry ice trap. Using dry ambient air instead of synthetic air as carrier gas for calibration of atmospheric water vapor isotopic measurements is crucial to avoid any potential matrix effect (Voigt et al., 2022). From January to May, standards were analyzed at four water mixing ratios (3000, 7000, 11 000 and 17 000 ppmv) to assess temporal variability of the mixing ratio dependency. As the observed dependency remained consistent over time, measurements from June to November were conducted only at 11 000 ppmv for VSMOW-SLAP normalization. The mixing ratio dependency functions for the three liquid standards were determined based on three higher-resolved water mixing ratio dependency assessments performed in May 2021, October 2021 and January 2022. From the end of November to December, standards were additionally analyzed at 5000 ppmv as atmospheric water mixing ratios were low. For details on the run architectures see Table A1.
For calibration, raw δ17O, δ18O and δ2H of the liquid standards from four consecutive runs (four weeks) were averaged and subsequently corrected to the water mixing ratio of the measured atmospheric water vapor described by a hyperbolic-linear function:
where δ denotes δ17O, δ18O or δ2H (in ‰), and H2O is the measured water mixing ratio (in ppmv) of the standard (std) and the atmosphere (atm), respectively. The coefficients a, b and c describe the mixing ratio dependency functions and are specific for δ17O, δ18O and δ2H and for each standard (Table A2). The mixing ratio corrected values of the standards with the lowest and the highest isotopic values were then used for two-point calibration on VSMOW-SLAP scale, while the third standard with an intermediate isotopic composition served as quality control. The standard deviation of the calibrated quality control standard over the experimental period (n=41) was 0.01 ‰, 0.02 ‰, 0.1 ‰, 5 per meg and 0.1 ‰ for δ17O, δ18O, δ2H, 17O-excess, and d-excess, respectively.
The precision of raw isotopic data was estimated from Allan deviation analysis of 24 h in-situ measurements of atmospheric water vapor at O3HP in June 2021. While the optimal integration time for δ17O, δ18O, δ2H and d-excess is on the order of a few minutes, the Allan deviation of 17O-excess reaches a minimum (∼7 per meg) at an averaging time of about 1 h (Fig. A1). To assess the precision of calibrated data, a Monte Carlo simulation was applied following Voigt et al. (2022). In 100 000 iterations, random normally distributed values were generated accounting for the standard deviations of (i) raw , and 17O-excessV, (ii) the coefficients of the mixing ratio dependency functions of each standard (Table A2) and (iii–iv) the measured and reference values of δ18O, δ2H and 17O-excess of the two standards. In each iteration, raw atmospheric values were calibrated following the above-described procedure.
The Monte Carlo simulation was run for 2 min integration intervals for δ18O, δ2H and d-excess and for 1 h integration intervals for 17O-excess. Over 2 min intervals, the raw Allan deviations were 0.11 ‰ for δ18O, 0.65 ‰ for δ2H and 0.5 ‰ for d-excess, yielding simulated standard deviations of calibrated 2 min mean values of 0.12 ‰, 1.2 ‰ and 1.6 ‰, respectively. Over 1 h intervals, the raw Allan deviations were 0.2 ‰ for δ17O, 0.4 ‰ for δ18O, 2.5 ‰ for δ2H, 7 per meg for 17O-excess and 1.6 ‰ for d-excess, yielding simulated standard deviations of calibrated 1 h mean values of approximately ±0.2 ‰, ±0.4 ‰, ±2.7 ‰ and ±15 per meg, and ±4.2 ‰ for δ17O, δ18O, δ2H, 17O-excess, and d-excess, respectively. For consistency, all isotopic tracers were integrated over 1 h, which also determined the frequency of alternation between measurement heights. This is limited by the resolution achievable for 17O-excess. The simulated standard deviations account for both the measurement precision and the natural variability in the isotopic composition of atmospheric water vapor over the integration interval.
Precipitation was collected in an evaporation-free rainfall collector (Rain Sampler 1, Palmex d.o.o., Zagreb, Croatia; Gröning et al., 2012), sampled monthly from June 2019 to December 2020 and on an event-based interval in 2021. The latter resulted in two snow and 53 rain samples. In addition, an on-site well, an underground spring, two springs in the village Saint-Michel-l'Observatoire and the nearby river Largue were sampled seasonally between May 2020 and October 2021 to constrain the isotopic composition of groundwater. The triple oxygen and hydrogen isotopic composition of precipitation, river, well and spring samples was determined using a second Picarro L2140-i CRDS, operated in 17O-High Precision mode at CEREGE (Aix-en-Provence, France). The measurement protocol was described in detail previously (Vallet-Coulomb et al., 2021). The external reproducibility of a quality control standard (1 SD, n=10) measured along with the samples in each sequence was ±0.02 ‰, ±0.04 ‰, ±0.3 ‰ and ±5 per meg, and ±0.1 ‰ for δ17O, δ18O, δ2H, 17O-excess, and d-excess, respectively.
To evaluate the significance of monthly variability in the isotopic compositions of precipitation and atmospheric water vapor, we performed pairwise comparisons of monthly values using Student's t-test, and applied a Bonferroni correction (Bland and Altman, 1995). For each pair of months, we compared the average isotopic composition (δ-values) with their standard deviations to determine statistically significant differences.
2.3 Assessment of isotopic (dis)equilibrium between atmospheric water vapor and precipitation
The isotopic composition of water vapor in isotopic equilibrium with precipitation (hereafter equilibrium water vapor) is estimated from:
where RVeq is the isotopic ratio in water vapor in equilibrium with precipitation, RP is the measured isotopic ratio in precipitation and αeq,l-v is the liquid-vapor equilibrium isotopic fractionation factor. We used temperature-dependent equilibrium fractionation factors for and from Majoube (1971). The equilibrium fractionation factor for was derived from (Barkan and Luz, 2005). We used Tair measured on the ICOS tower at 10 m a.g.l. Note that using Tair measured at other heights between 0.4–100 m a.g.l. does not significantly influence the results.
Like Graf et al. (2019), we denote the differences between equilibrium water vapor and atmospheric water vapor measured at 12.5 m a.g.l. as:
A negative value of (Δd-excessVeq-V, Δ17O-excessVeq-V) indicates that δ18O (d-excess, 17O-excess) of precipitation is lower than expected from isotopic equilibrium with near-surface atmospheric water vapor. Inversely, positive values of (Δd-excessVeq-V, Δ17O-excessVeq-V) indicate that precipitation has higher δ18O (d-excess, 17O-excess) compared to the expected equilibrium value.
2.4 Weather regimes, air mass back trajectory analysis and oceanic moisture source identification
Synoptic atmospheric variability over Europe can be characterized using weather regimes (Cassou, 2008; Cassou et al., 2005; Michelangeli et al., 1995; Vautard, 1990). Previous studies have demonstrated strong positive correlations between and and the NAO index in the temperate and Mediterranean area (Baldini et al., 2008; Field, 2010; Deininger et al., 2016; Zannoni et al., 2019). In addition, Zannoni et al. (2019) reported a negative correlation between both d-excessV and d-excessP and the NAO index at a coastal lagoon in Venice. These correlations are strongest in central Europe but are often weaker in mountainous and circum-Mediterranean regions, where local orographic effects and moisture recycling modify the isotopic composition of precipitation (Baldini et al., 2008).
Here, we identify the dominant weather regimes during the study period to assess whether these relationships persist. This may be of interest for paleoclimate reconstructions of NAO circulation patterns based on isotopic records. To this end, large-scale atmospheric circulation fields for the North-Atlantic-European region (20–80° N and 80° W–30° E) were obtained from the European Centre for the Medium-Range Weather Forecasts (ECMWF) ERA5 reanalysis data and classified over 1989–2022. The classification was based on daily-averaged 500 hPa geopotential height (Z500) fields, interpolated onto a 2.5°×2.5° grid and clustered using the k-means algorithm (Hersbach et al., 2020). Each day was assigned to a specific weather regime based on the criterion of minimum Euclidian distance.
To identify oceanic moisture sources of the local atmospheric water vapor, backward trajectory analysis was performed using the Hybrid Single Particle Lagrangian Integrated Trajectory model (HYSPLIT) (Stein et al., 2015). Meteorological input data were obtained from the Global Data Assimilation System (GDAS) dataset at a spatial resolution of 1°×1°. As most of the atmospheric moisture resides in the lowermost 2000 m a.g.l. (Bershaw et al., 2012), back-trajectories were initiated at 1500 m a.g.l. Note that back-trajectories initiated at 500 and 3000 m showed similar paths. Trajectories were computed hourly throughout 2021 extending 168 h (7 d) backward. This resulted in a total of 8760 trajectories covering 365 measurement days.
Moisture uptake zones were quantified using a Lagrangian moisture source diagnostic following Sodemann et al. (2008). Along each backward trajectory, positive increments in specific humidity (Δq>0) calculated at 6 h intervals were interpreted as moisture uptake from the underlying surface. Each uptake location was assigned to the midpoint of the corresponding trajectory segment. Only uptake events exceeding 0.2 g kg−1 and occurring below 1.5 times the planetary boundary layer height were considered in order to reduce the influence of numerical noise and restrict moisture contributions to boundary-layer exchange processes. Each uptake event was weighted by its relative contribution to the final specific humidity at the study site. If a decrease in specific humidity (Δq<0), interpreted as precipitation loss, occurred downstream of one or more uptake events, the contributions of the preceding uptakes were proportionally reduced to account for moisture removal. This procedure yields, for each trajectory, the fractional contribution of a grid cell to q at the study site.
In order to assess the potential relation between the isotopic composition of atmospheric water vapor at the study site and its oceanic moisture source region, we applied a modified Concentration Weighted Trajectory (CWT) approach. A spatial grid of 1°×1° resolution was defined over the study domain. Instead of weighting the isotopic composition measured at the study site by the residence time in each grid cell, as done by Salamalikis et al. (2015), we weighted it by the previously derived fractional moisture contribution τ(ij)k of the corresponding hourly trajectory. The isotopic signature assigned to each grid cell (i,j) was computed as:
where Ck is the isotopic composition (δ18O, d-excess, or 17O-excess) measured upon arrival of trajectory k at the study site, and fijk is the fractional moisture contribution of grid cell (i,j) to trajectory k. Thus, Cij represents the moisture-contribution-weighted isotopic composition associated with evaporation from grid cell (i,j). For precipitation, all air mass back-trajectories of hours during which rain was detected on-site were compiled and weighted by rainfall amount.
For regional interpretation, we aggregated grid cells into eight predefined source regions after Sodemann and Zuber (2010): NW = Northwest North Atlantic, NE = Northeast North Atlantic, SW = Southwest North Atlantic, SE = Southeast North Atlantic, A = Arctic and Nordic Seas, CE = Central Europe, MW = Western Mediterranean, ME = Eastern Mediterranean. To focus on oceanic moisture sources, only grid cells located over ocean surfaces were considered. Continental areas were masked using the GLDAS Land/Sea Mask Dataset at 1° resolution (NASA/GES DISC, 2026).
2.5 Climate conditions and isotopic composition of the atmospheric water vapor at the oceanic moisture sources
Monthly averages of sea surface temperature (SST), Tair and dew point temperature at 2 m above the ocean surface (Tdew) were obtained from ERA5 hourly data for the region spanning 20–70° N latitude and −50–40° E longitude (Hersbach et al., 2020). RH over the ocean was derived from Tair and Tdew and subsequently normalized to SST (RHSST).
The triple oxygen and hydrogen isotopic composition of water vapor evaporated from the ocean was estimated using a simple evaporation model (Craig and Gordon, 1965), assuming that all water vapor above the ocean is derived from local evaporation (i.e. the closure assumption; Merlivat and Jouzel, 1979). Seawater δ18O and d-excess values were taken from the CISE-LOCEAN seawater isotopic database (waterisotopes-CISE-LOCEAN, 2025) and range from 0.3 ‰–1.3 ‰ and −0.9 ‰ to −2.3 ‰, respectively. For 17O-excess of seawater, the global average value of −5 per meg from the only existing compilation is used (Luz and Barkan, 2010). The turbulence coefficient is an empirical parameter that quantifies the contribution of molecular diffusion to the total kinetic fractionation during evaporation. Several studies have attempted to constrain this parameter empirically (e.g., Pfahl and Wernli, 2008; Uemura et al., 2010; Zannoni et al., 2022) and to develop theoretical frameworks (Horita et al., 2008; Xia et al., 2023; Dütsch et al., 2026). The turbulence coefficient has been adjusted to 0.33, which is at the upper end of previously reported values for open-ocean evaporation (see, e.g., Gat, 1996; Pfahl and Wernli, 2008; Uemura et al., 2010; Dütsch et al., 2026). Lower turbulence coefficients correspond to lower kinetic fractionation during evaporation and therefore lower d-excess and 17O-excess values in the evaporated water vapor.
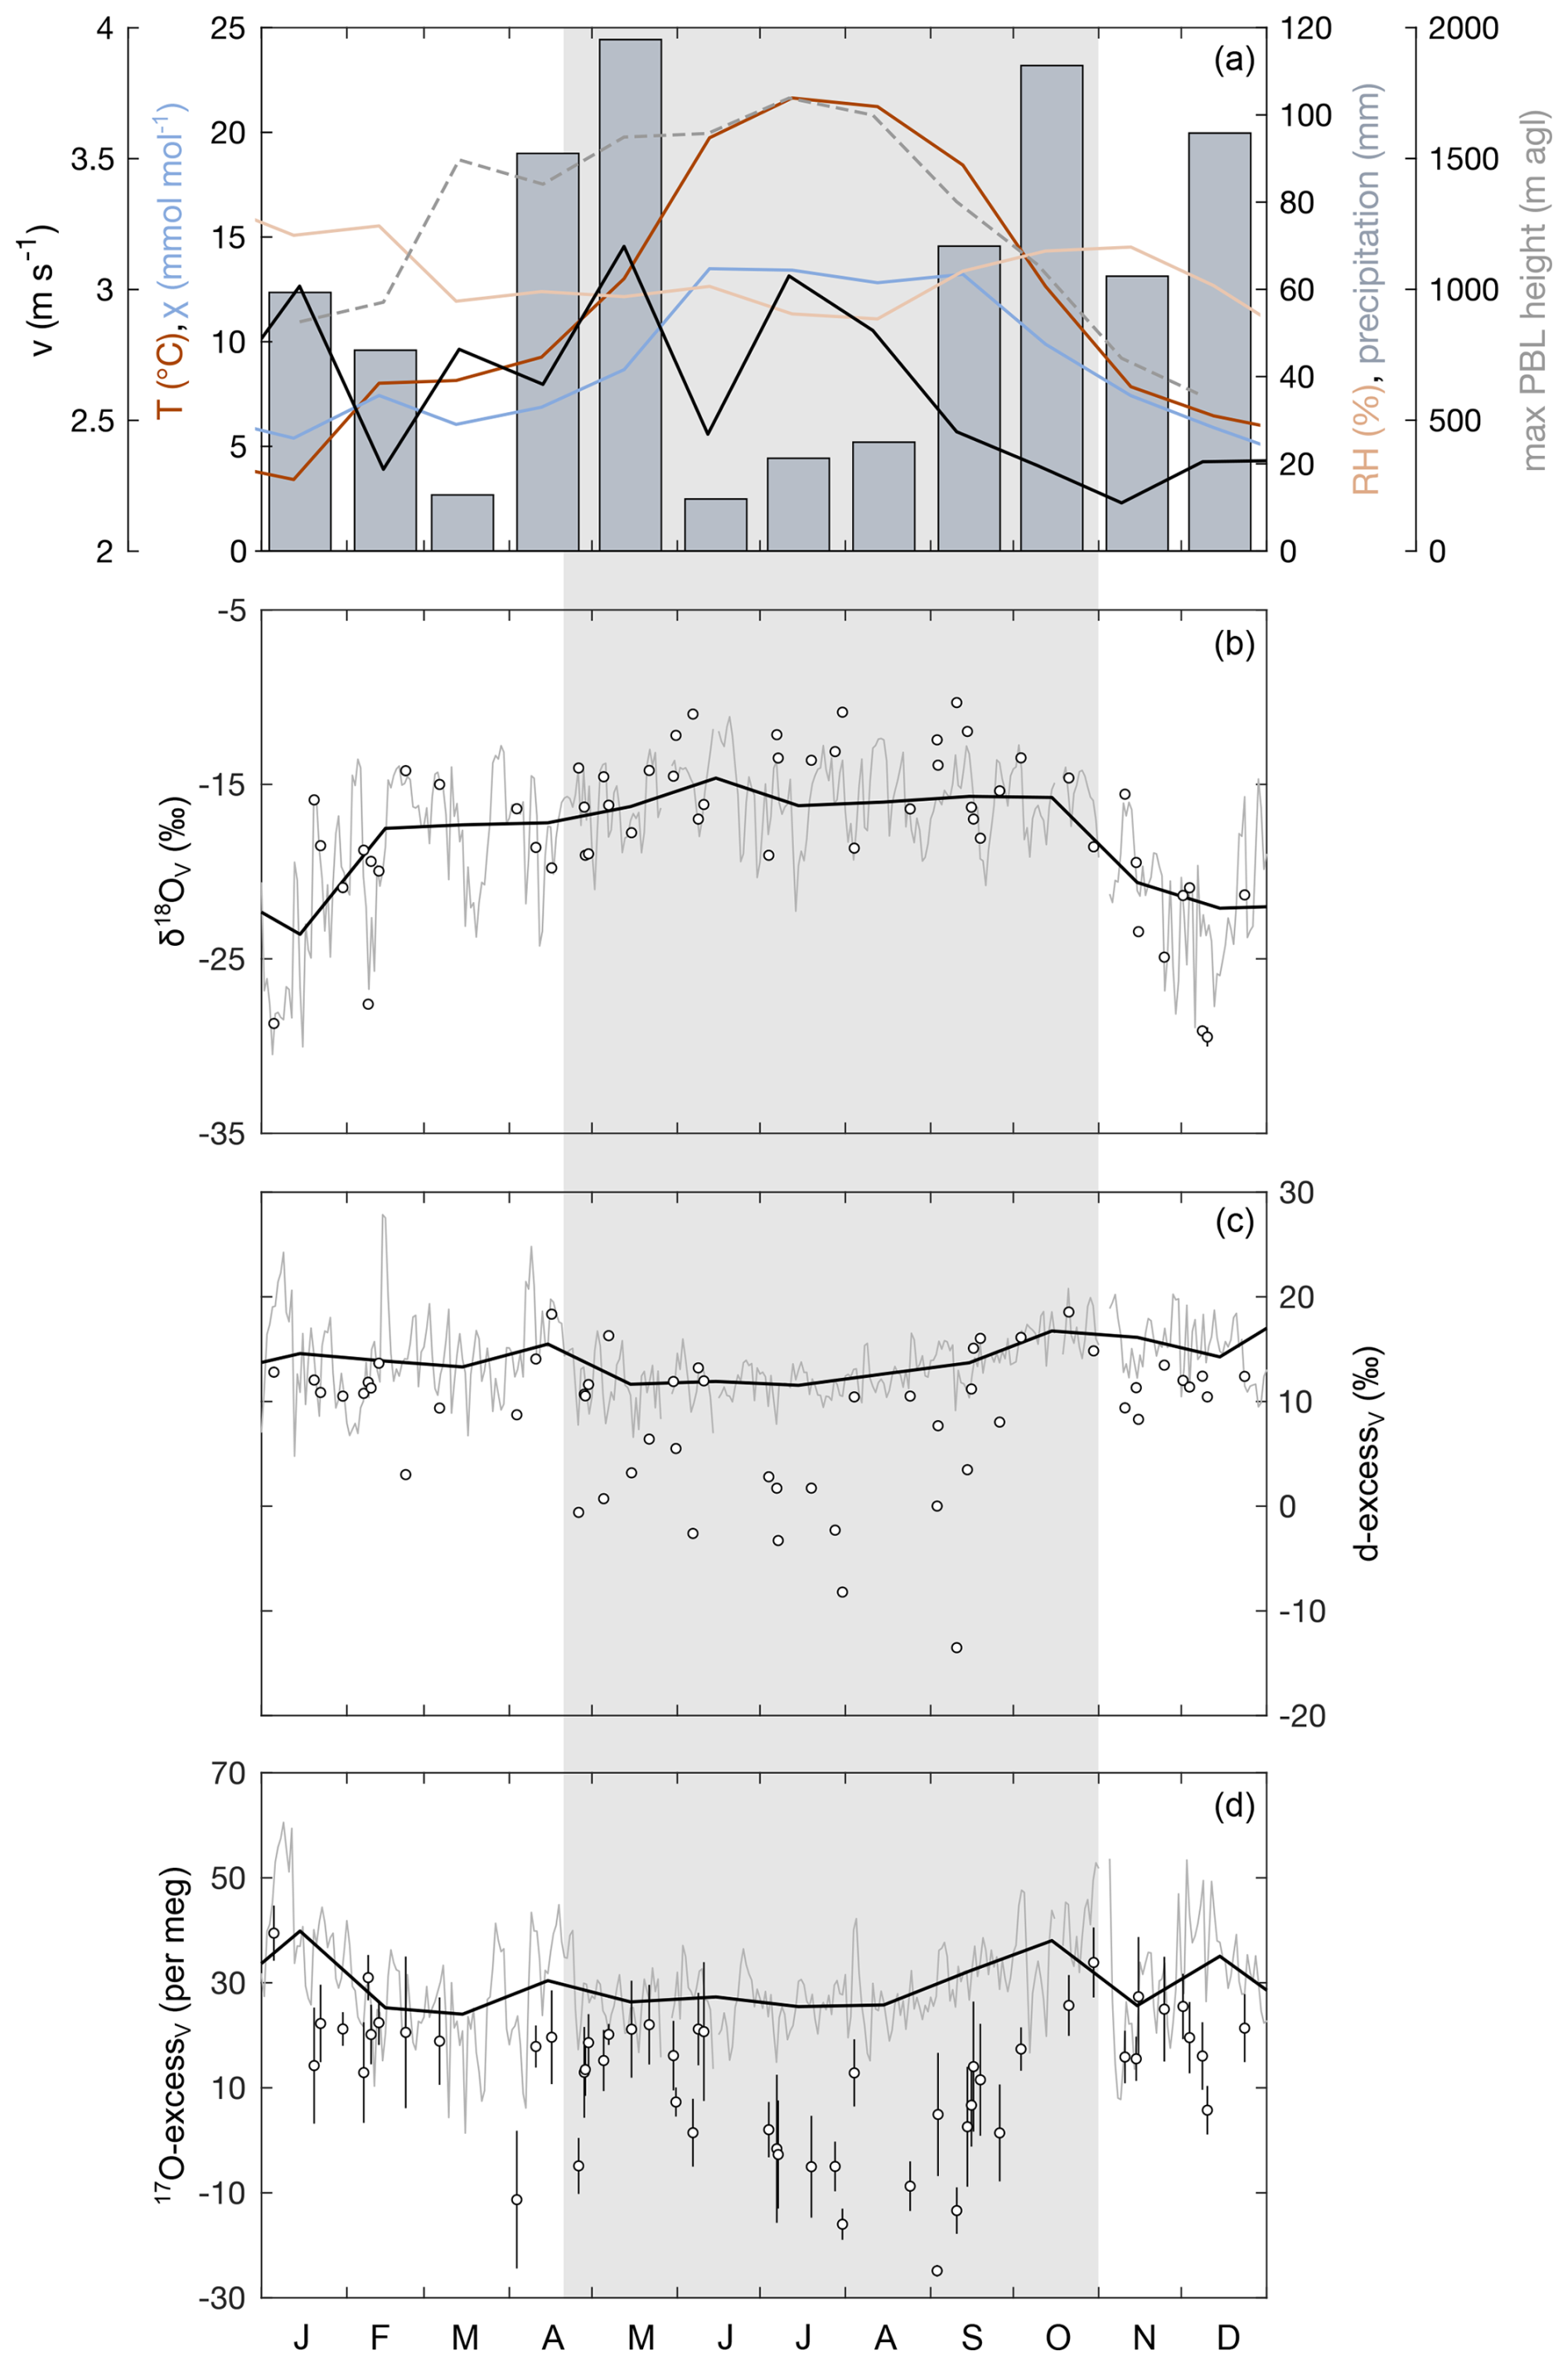
Figure 2Time series of meteorological data and the isotopic composition of atmospheric water vapor measured at 12.5 m a.g.l. and estimated from isotopic equilibrium with precipitation in 2021. (a) Monthly precipitation amount and monthly average temperature (Tair), atmospheric water mixing ratio (χ), wind speed (v), and relative humidity (RH) measured at 10 m a.g.l. The grey dashed line shows the monthly average maximum planetary boundary layer height for the 0.25°×0.25° grid field covering the study site (Guo et al., 2024). (b–d) Solid lines represent daily (grey) and monthly (black) average isotopic composition of atmospheric water vapor measured at 12.5 m a.g.l. Circles show the isotopic composition of water vapor estimated from isotopic equilibrium with event-based precipitation samples using Tair observed at 10 m a.g.l. Note that the error bars for δ18O and d-excess are smaller than symbol size. The grey shaded area marks the oak forest growing season.
3.1 Variability of local meteorological parameters, phenology, stomatal conductance and transpiration
In 2021, annual average Tair and RH at O3HP were 12 °C and 63 %, respectively. The annual precipitation was 730 mm, which is about 150 mm lower than the average annual precipitation from 2008–2020 (Reiter et al., 2015). As typical for a Mediterranean climate, more than 70 % of precipitation occurred from April to May and from September to December, while summer months were the driest (Fig. 2a). The monthly atmospheric water mixing ratio (χ) ranged from 7 mmol mol−1 in winter to 22 mmol mol−1 in summer. Despite the increase in χ during summer, the lowest monthly average RH was recorded in August (53 %), while the highest monthly average RH was observed in February (75 %), due to higher monthly average Tair in summer (JJA, 21 °C) than in winter (DJF; 6 °C). The daily average maximum planetary boundary layer height increased from 600 m a.g.l. in December to 1700 m a.g.l. in July. The average wind speed at 10 m height over daily mean values was 2.6 ± 1.1 m s−1 in 2021. One to eight windy days (daily average wind speed >4 m s−1; Obermann et al., 2018) were observed per month. Windy days are mostly indicative for Mistral conditions – a strong northerly wind typical of the Provence region – and occurred most frequently in winter and spring.
In 2021, daytime average χ was 2 to 6 mmol mol−1 higher than at night. Daytime average Tair was 6 to 16 °C higher than at night, while average RH increased by 26 % to 50 % from day to night. The largest day-night differences occurred near the ground and in summer (Figs. B1–B3). During the day, χ and Tair were highest near the ground, whereas RH was vertically homogenous (Figs. B1–B3). At night, the vertical gradient in Tair and χ weakened. Nighttime cooling resulted in higher RH that decreased from the surface to 10 m a.g.l. (Figs. B1–B3).
The first oak buds appeared in mid-April 2021. The oak leaves matured in May and senesced in November. Their stomatal conductance and transpiration followed the diurnal cycle of global solar radiation and RH (Fig. B4). During the three separate days of continuous measurement, daytime stomatal conductance and transpiration ranged from 20–60 mmol mol−1 and 0.5–1.8 mmol mol−1, respectively. During the night, transpiration and stomatal conductance were always lower than 20 mmol mol−1 and 0.1 mmol mol−1, respectively. Transpiration was highest at the beginning of the growing season in June, and the lowest in August, mainly due to lower oak leaf stomatal conductance in response to water stress (high vapor pressure deficit).
3.2 Isotopic composition of precipitation and groundwater
The annual amount-weighted average isotopic values of precipitation in 2021 were −7.5 ‰ ± 2.3 ‰ for , −48.1 ‰ ± 20.2 ‰ for , 11.6 ‰ ± 3.5 ‰ for d-excessP and 27 ± 9 per meg for 17O-excessP (Fig. 3). These values are close to those obtained for 2020 and indistinguishable from those obtained for the whole precipitation dataset from June 2019 to December 2021 (Table B1). The springs, the well and the river Largue sampled seasonally between December 2020 and October 2021 showed little spatial and seasonal isotopic variability (Table B1) and averaged to −7.3 ‰ ± 0.5 ‰ for δ18O, −47.0 ‰ ± 3.6 ‰ for δ2H, 11.2 ‰ ± 0.6 ‰ for d-excess and 29 ± 5 per meg for 17O-excess. These values coincide with the annual amount-weighted average isotopic composition of precipitation.
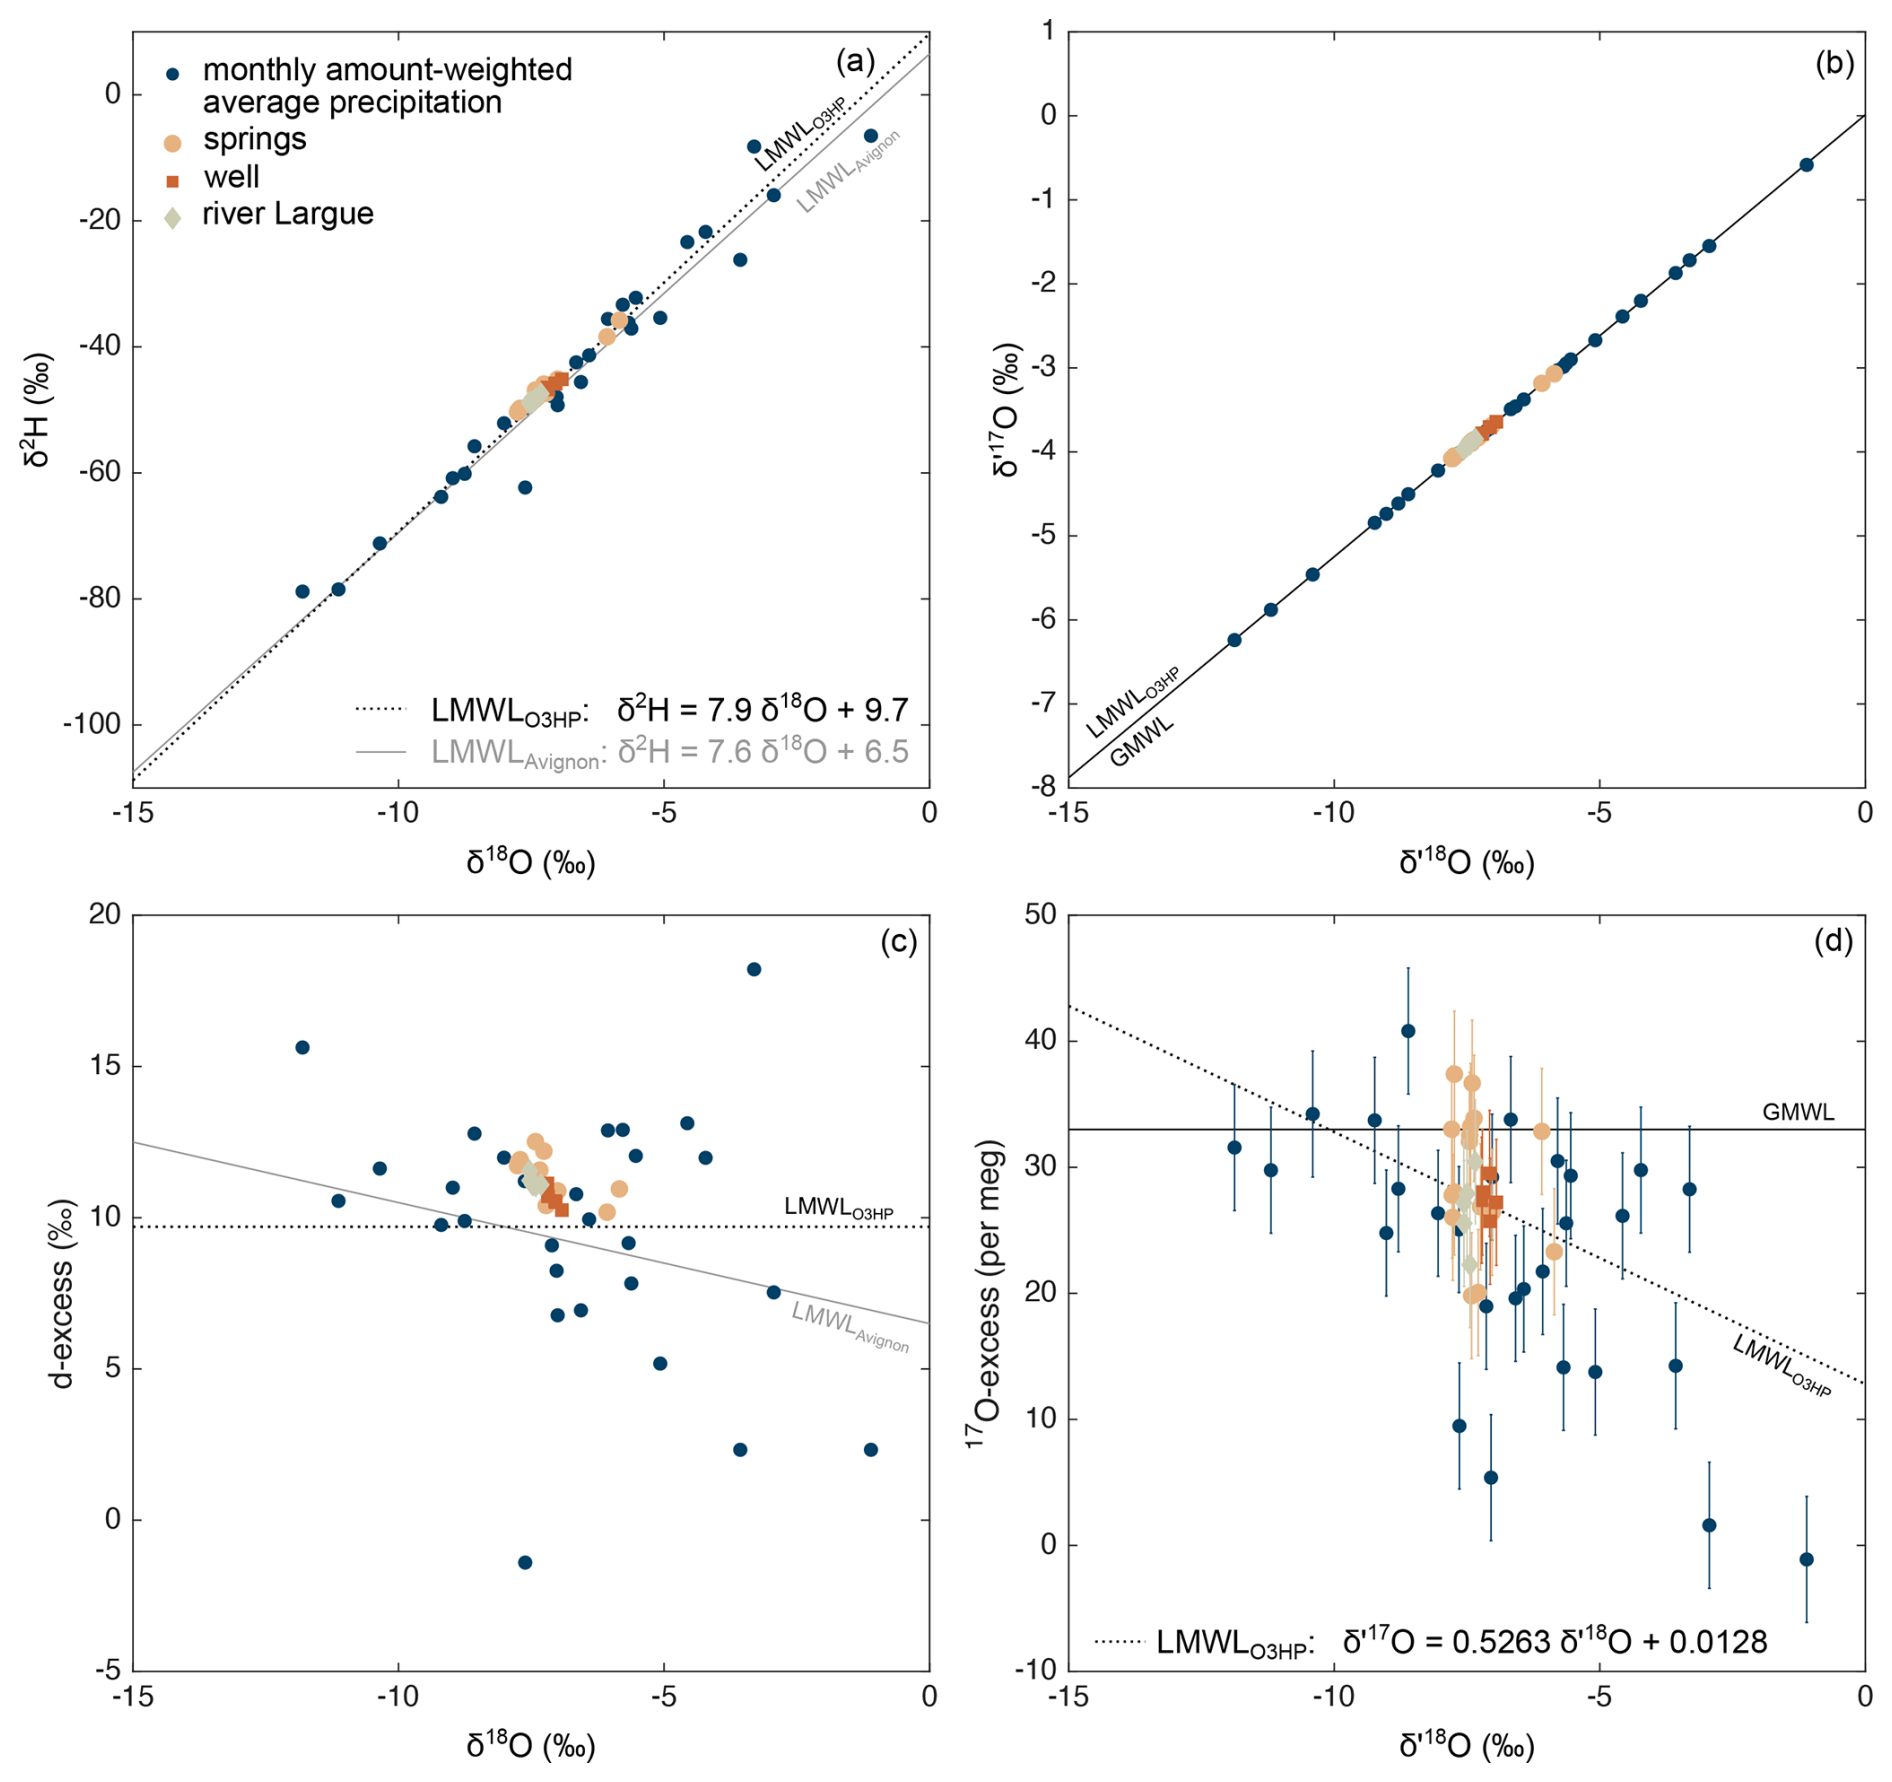
Figure 3(a) δ2H vs. δ18O, (b) δ′17O vs δ′18O, (c) d-excess vs. δ18O and (d) 17O-excess vs. δ′18O of local meteoric waters collected in this study. Blue circles represent the monthly amount-weighted average isotopic composition of precipitation collected at O3HP between June 2019 and December 2021. Pale orange circles, orange squares and grey diamonds show the isotopic composition of samples taken from springs, a well and the nearby river Largue in the surroundings of the study site (Table B1). The linear regression line through precipitation isotopic data from 2020 and 2021 is indicated by the black dotted line. In addition, (a) and (c) show the local meteoric water line (LMWL) of Avignon for comparison (data derived from the global network of isotopes in precipitation (GNIP) database; IAEA/WMO, 2025). No 17O-excess data was available for the Avignon dataset. Therefore, (b) and (d) show the global meteoric water line (GMWL) for comparison. Note that error bars of δ17O, δ18O, δ2H and d-excess are smaller than symbol size.
Monthly amount-weighted average isotopic values of precipitation varied between −11.8 ‰ and −1.1 ‰ for , between −78.8 ‰ and −6.5 ‰ for , between −1.4 ‰ and 18.2 ‰ for d-excessP and between 1 per meg and 41 per meg for 17O-excessP (Table B1). In general, monthly values of and were low in winter and varied in their upper range from spring to autumn. Inversely, monthly values of d-excessP and 17O-excessP were low in summer and tended to higher values in autumn and winter.
The isotopic values of event-based rain samples ranged from −18.4 ‰ to −0.2 ‰ for , from −142.5 ‰ to −7.8 ‰ for , from −13.0 ‰ to 20.5 ‰ for d-excessP and from −15 per meg to 51 per meg for 17O-excessP (Table B1). The two snow samples had the lowest (−22.3 ‰ and −18.4 ‰, respectively) and (−162.9 ‰ and −142.5 ‰, respectively) of the whole data set, while d-excessP (15.6 ‰ and 4.0 ‰) and 17O-excessP (68 per meg and 17 per meg) were variable. The seasonal variability of 17O-excessP was generally higher than its variability from one event to another. In contrast, variability of and d-excessP was often higher on event-scale than on seasonal scale (Student's t-test).
Linear regression through monthly amount-weighted average precipitation data for 2020 and 2021 (n=22) gives (Fig. 3):
In the δ2H-δ18O system, the slope of the regression line is indistinguishable from that for Avignon GNIP station (IAEA/WMO, 2025), located 70 km to the west of our study site (Fig. 3). It is close to that of the global meteoric water line (GMWL) (8; Rozanski et al., 1993), but higher than the range of previously reported values for the western Mediterranean area (7.15–7.56; Celle-Jeanton et al., 2001; Giménez et al., 2021; Saighi, 2005). In the δ′17O-δ′18O system, the slope of the regression line is lower than that of the GMWL (0.528; Luz and Barkan, 2010; Terzer-Wassmuth et al., 2023) but similar to the value obtained for temperate and intertropical areas (0.5265; Sharp et al., 2018; Terzer-Wassmuth et al., 2023). Notably, the slope of the regression line varies strongly from 2020 to 2021 for both the δ2H-δ18O system (7.3–8.5) and the δ′17O-δ′18O system (0.5254–0.5271). A longer precipitation isotopic record is required to establish a robust local meteoric water line for the study site.
3.3 Isotopic composition of atmospheric water vapor
The annual average isotopic composition of atmospheric water vapor at 12.5 m a.g.l. was −17.7 ‰ ± 2.8 ‰ for , −128.1 ‰ ± 21.9 ‰ for , 13.8 ‰ ± 1.7 ‰ for d-excessV and 30 ± 5 per meg for 17O-excessV, and indistinguishable from that measured at lower heights. Similar to precipitation, and were low in winter (−23.6 ‰ and −174.2 ‰, respectively) and high from spring to autumn, peaking in June (−14.6 ‰ and −105.2 ‰, respectively) (Table B2). Values of d-excessV were high in October and November (>16 ‰) and low from May to July (<12 ‰). In contrast, 17O-excessV varied little throughout the year (from 24 per meg to 40 per meg). Low values (25–27 per meg) were recorded between May and August 2021, while highest values were observed in December (35 per meg) and January (40 per meg).
Day-to-day isotopic variability of atmospheric water vapor was high (up to 9.3 ‰, 16.0 ‰ and 27 per meg for , d-excessV and 17O-excessV, respectively) and exceeded monthly and seasonal variability for d-excessV and 17O-excessV (Fig. 2). There is no statistically significant difference in the daily average isotopic composition of atmospheric water vapor on rainy and non-rainy days, indicating that precipitation had no significant influence on the isotopic composition of near-surface atmospheric water vapor on daily and monthly scale.
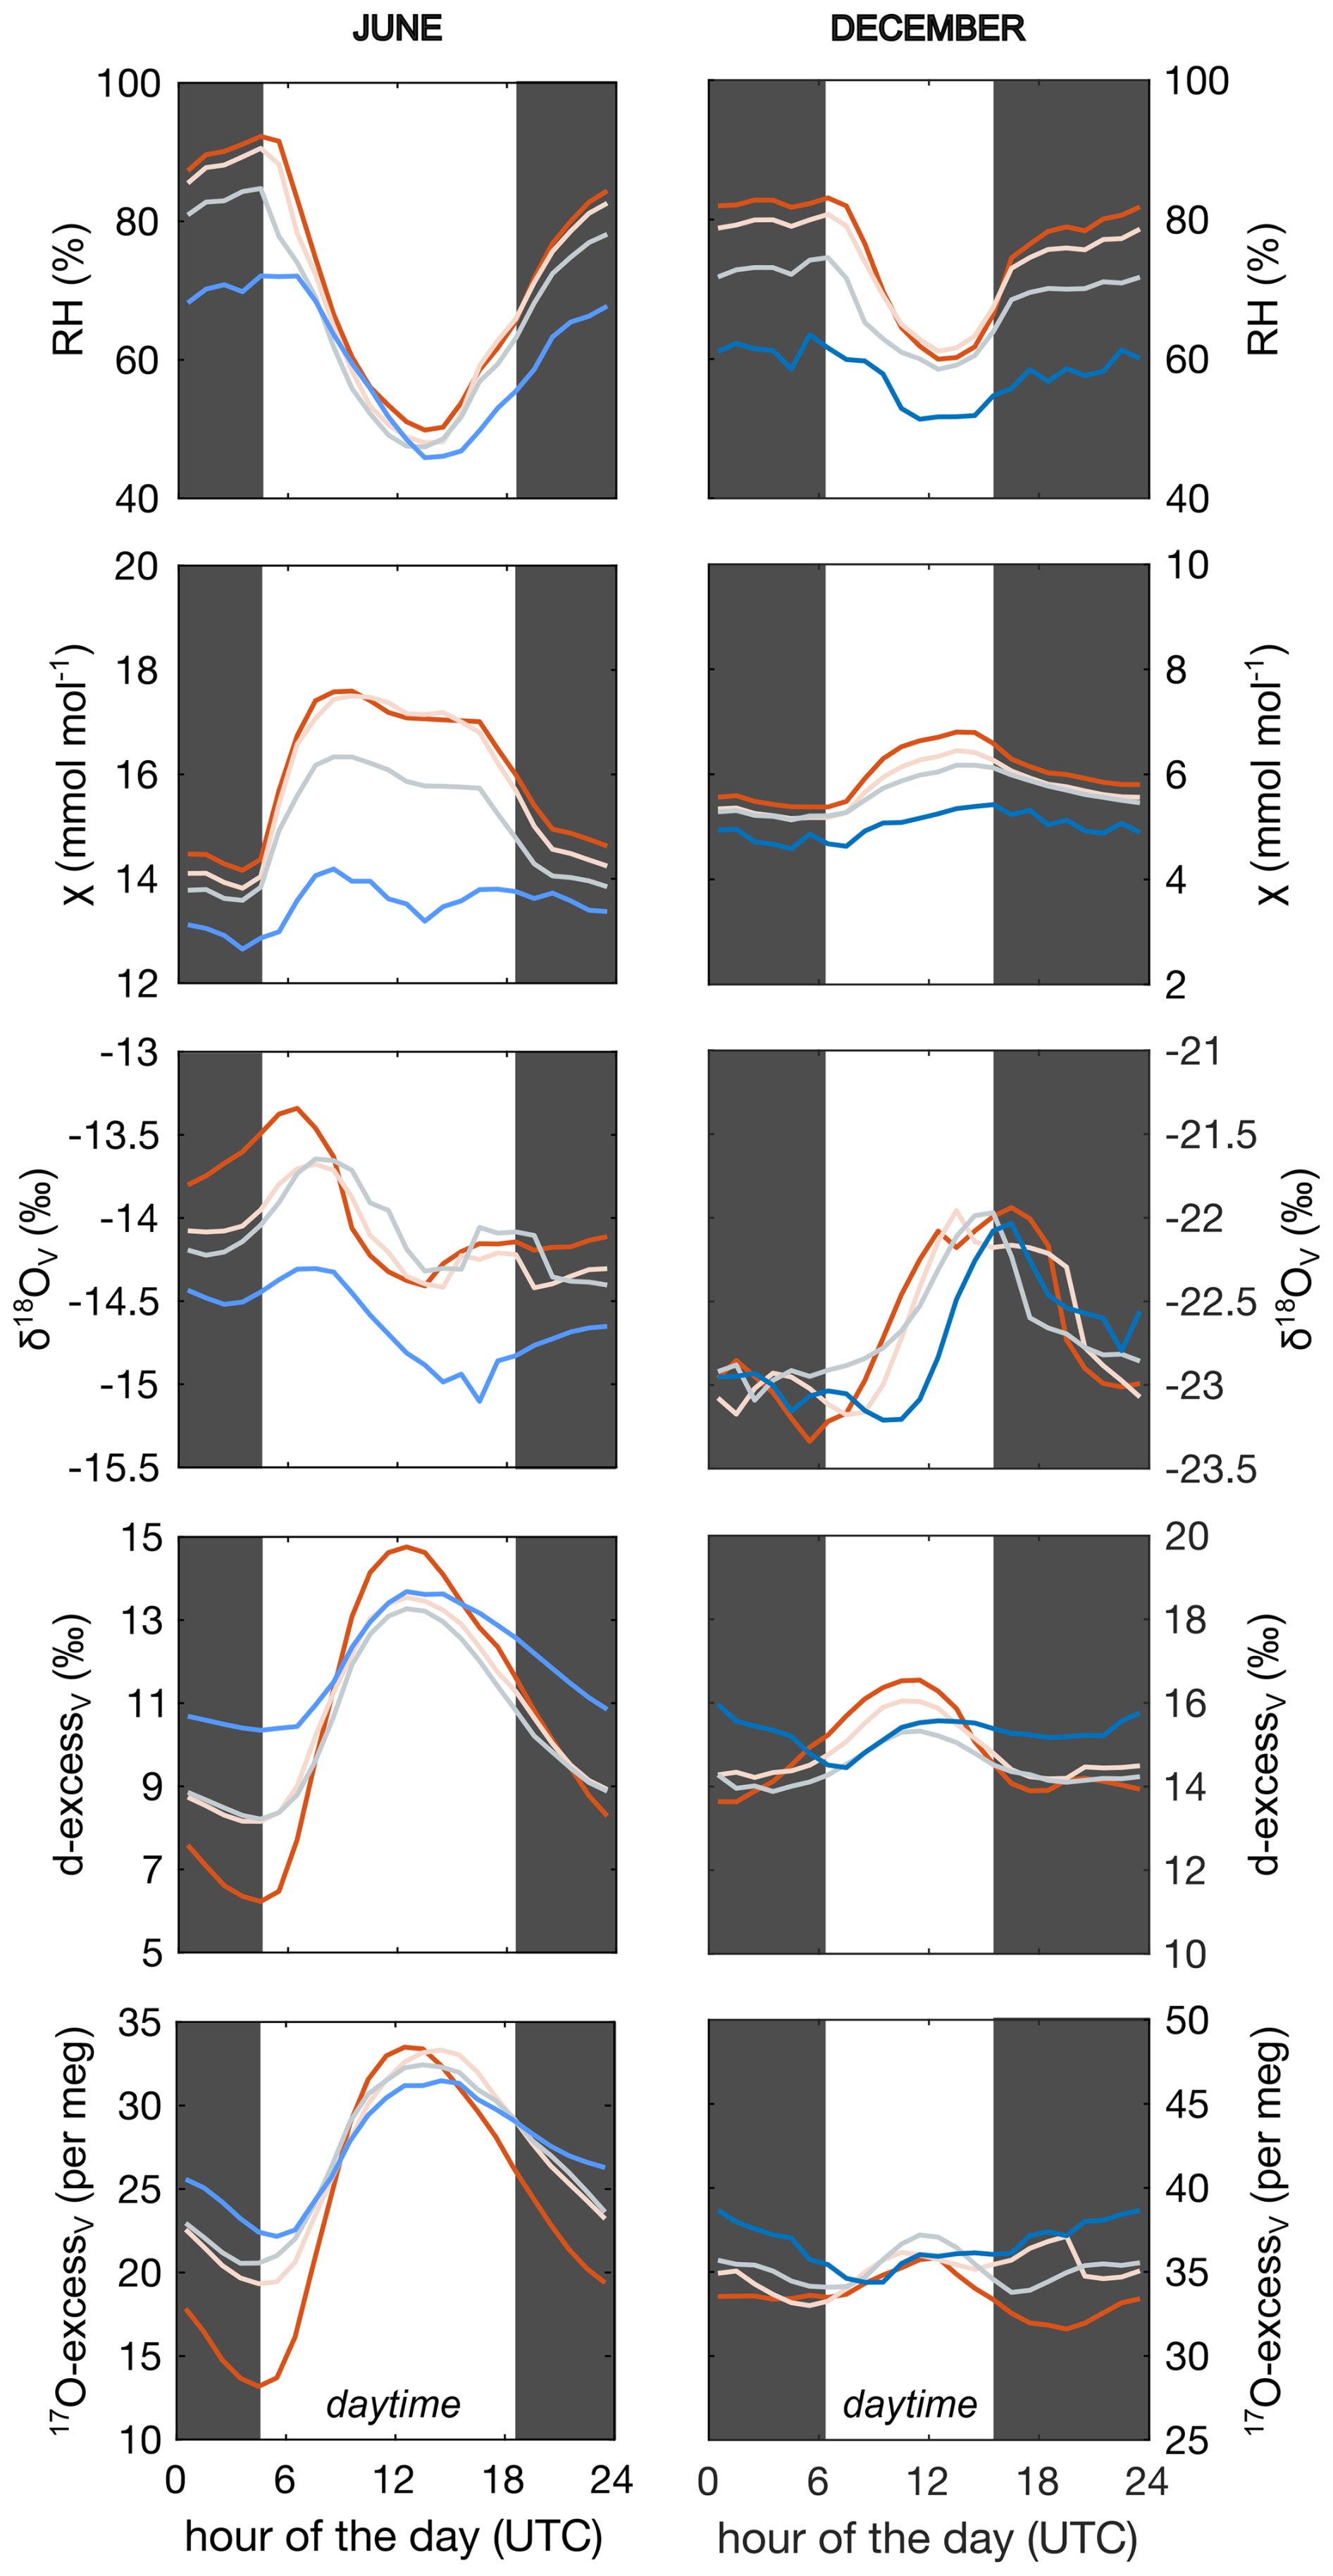
Figure 4Monthly average daily cycle of relative humidity (RH), atmospheric water mixing ratio (χ) and , d-excessV and 17O-excessV of atmospheric water vapor at different measurements heights: above the grass plot (0.4 m a.g.l.; red), and below (1.5 m a.g.l.; pale), within (3.5 m a.g.l.; grey) and above (12.5 m a.g.l., blue) the oak forest canopy. The left panels show monthly averages for June 2021, while the right panels show monthly averages for December 2021. For December, only the period from 1–25 December is included due to the lack of isotopic data at 0.4, 1.5 and 3.5 m after this date. Grey shaded areas represent night-time periods. Note that the vertical axes for June and December use similar scales but with different offsets.
Diurnal patterns of d-excessV and 17O-excessV changed from a season to another (Figs. B6 and B7). They can be illustrated by two examples (Fig. 4): In June, the month with the most active leaf gas exchange in the Mediterranean (Bartsch et al., 2020), d-excessV and 17O-excessV were lowest at sunset and highest at noon, coinciding at noon with minimum RH, maximum transpiration and maximum χ measured under the forest canopy. In December, a month characterized by the absence of alive tree foliage and transpiration and a thin planetary boundary layer, the amplitude of the diurnal cycle was three times lower than in June for the d-excessV and more than 15 times lower for the 17O-excessV. Diurnal isotopic patterns were consistent for different heights, but the magnitude of variations decreased with distance from ground. Vertical isotopic gradients were generally stronger during night, in line with limited atmospheric turbulent convection (Fig. B5).
3.4 Isotopic (dis)equilibrium between precipitation and near-surface atmospheric water vapor
Figure 5 presents the relationship between the measured isotopic composition of near-surface atmospheric water vapor and that expected from isotopic equilibrium with precipitation. Following the framework of Graf et al. (2019), deviations from isotopic equilibrium can indicate cloud-dominated conditions resulting from incomplete equilibration between falling raindrops and ambient water vapor, or evaporation-dominated conditions associated with sub-cloud rain re-evaporation.
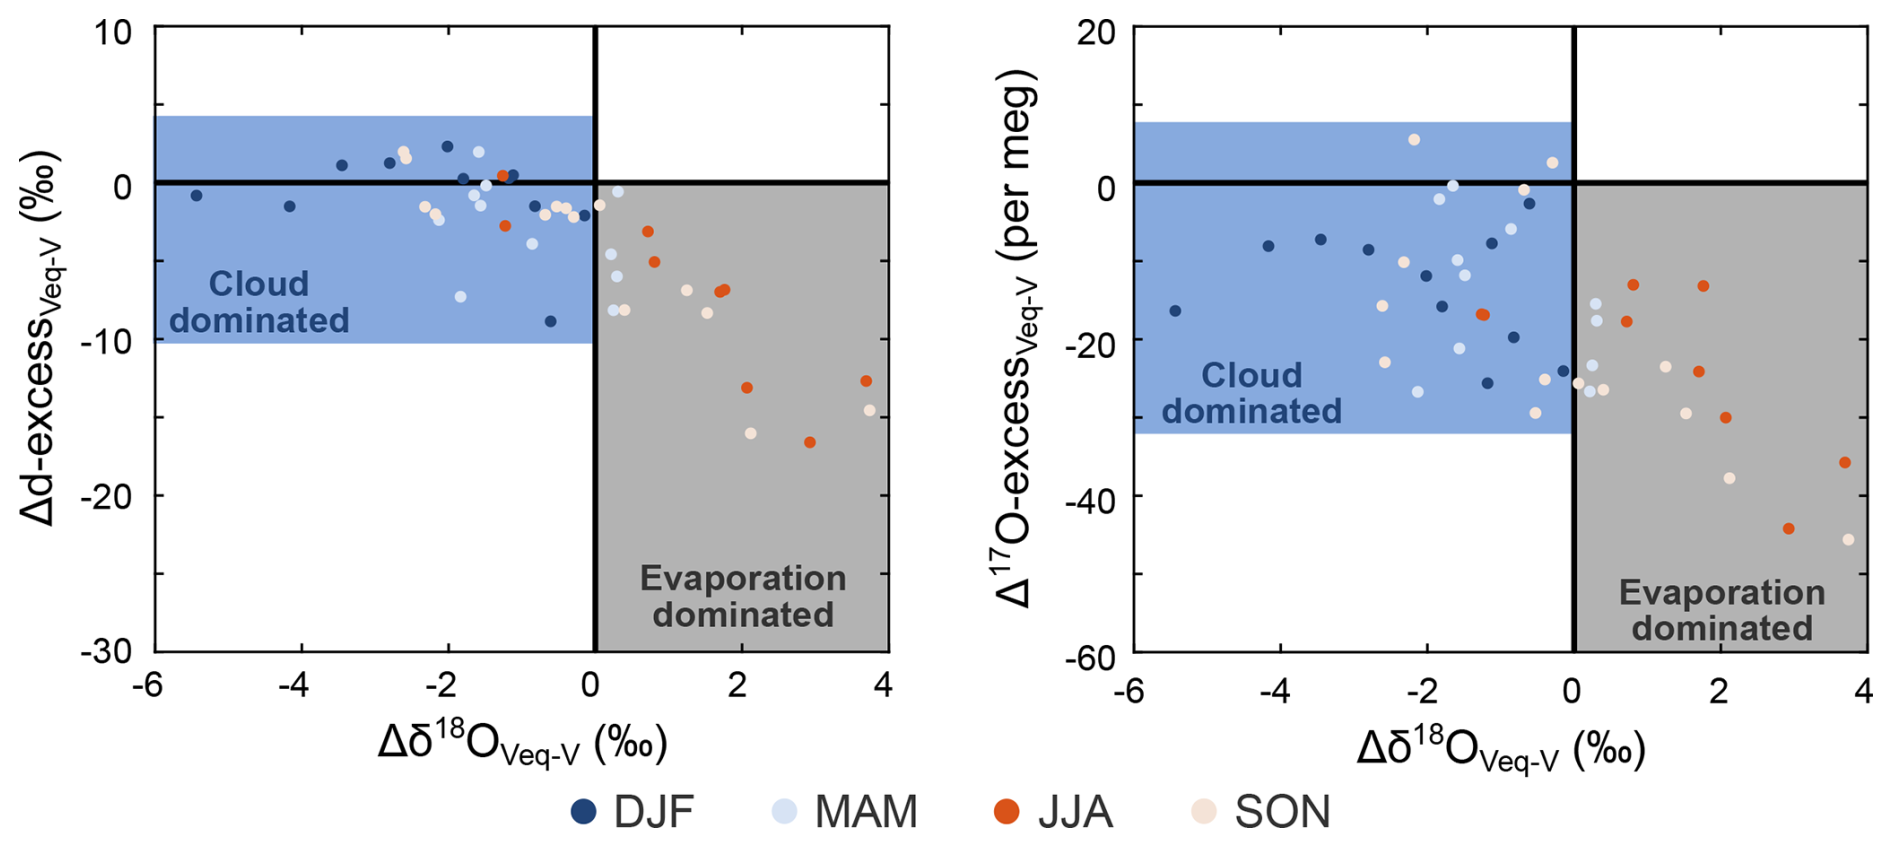
Figure 5Isotopic difference (Δ) between water vapor estimated from isotopic equilibrium with precipitation (Veq) and amount-weighted atmospheric water vapor measured at 12.5 m above ground level (V) for each precipitation event in 2021. Data is coloured according to season. The blue-shaded area indicates samples for which the equilibration between precipitation and near-surface atmospheric water vapor is likely incomplete. Precipitation samples that correspond to data falling within the grey-shaded area are likely affected by re-evaporation during fall through the air column.
In winter, spring and late autumn, was up to 5.5 ‰ lower than , while in summer was up to 3.7 ‰ higher than . Values of d-excessVeq were generally close to d-excessV in winter, but up to 16 ‰ lower than d-excessV during the oak growing season. Values of 17O-excessVeq were slightly lower than 17O-excessV in winter (∼15 per meg) and up to 44 per meg lower during the oak growing season (Fig. 5).
However, on annual scale, (−17.8 ‰ ± 2.8 ‰), (−128.3 ‰ ± 21.9 ‰) and d-excessV (13.8 ‰ ± 1.7 ‰) were similar to their values expected from isotopic equilibrium with precipitation (−17.8 ‰ ± 2.7 ‰, −130.1 ‰ ± 21.6 ‰ and 12.3 ‰ ± 3.1 ‰, respectively). In contrast, 17O-excessV (30 ± 5 per meg) was in annual average 14 per meg higher than 17O-excessVeq (16 ± 10 per meg).
3.5 Relationships between meteorological parameters, phenology, stomatal conductance, transpiration and the isotopic compositions of atmospheric water vapor and precipitation
Monthly average was strongly correlated with Tair and χ (r2=0.67 and 0.63, respectively). In contrast, d-excessV was only weakly correlated with these variables (r2=0.26 and 0.29, respectively), and 17O-excessV showed no significant relationship (Fig. B8). There was no correlation between the monthly average isotopic composition of atmospheric water vapor and RH or wind speed.
Hourly means of , d-excessV and 17O-excessV averaged by month (Figs. B6 and B7) were strongly correlated with RH, Tair and transpiration during the oak forest growing season (r2>0.55, >0.73 and >0.64, respectively). Correlations between 17O-excessV and d-excessV were also strong during the oak forest growing season (r2=0.52–0.93), peaking in June, whereas they were not correlated in winter.
For precipitation, monthly average and d-excessP were weakly correlated with χ, Tair and RH (), whereas 17O-excessP showed stronger correlations with these variables (). No correlation was observed between the monthly average isotopic composition of precipitation and precipitation amount.
At the event scale, and 17O-excessP remained weakly correlated with Tair (r2=0.41 and 0.43, respectively) and χ (r2=0.34 and 0.29, respectively), while d-excessP showed little or no correlation (r2<0.23) (Fig. B9). Event-based isotopic values of precipitation showed no correlation with RH or precipitation amount.
3.6 Relationships between moisture sources and the isotopic composition of atmospheric water vapor and precipitation
The moisture source contributions for atmospheric water vapor and precipitation are illustrated in Figs. C1 and C2. For atmospheric water vapor, the NE North Atlantic (33 %) and the Western Mediterranean (29 %) are the dominant moisture sources for our study site (Table C1). For precipitation, most of the moisture is derived from the Western Mediterranean (41 %), followed by the NE North Atlantic (25 %) and the SE North Atlantic (18 %) (Table C2). Changes in the relative contributions of each moisture source over the year are illustrated in Figs. C3 and C4 for atmospheric water vapor and precipitation, respectively.
The isotopic compositions of atmospheric water vapor and precipitation clustered by moisture sources were generally similar (Tables C1 and C2). In particular, d-excess and 17O-excess of atmospheric water vapor or precipitation coming from the North Atlantic sectors and the Western Mediterranean were not significantly different.
We also compared the monthly average isotopic composition of atmospheric water vapor observed at O3HP with those estimated above the four oceanic moisture sources (Fig. 6). The latter shows seasonal isotopic variability which co-varies with SST and RHSST. Interestingly, from July to December, RHSST over the Mediterranean Sea is systematically lower than over the NE North Atlantic but does not differ from RHSST over the SE North Atlantic. For all sources, is higher and d-excessV and 17O-excessV are lower in summer than in winter. A similar seasonal trend is evident in the isotopic composition of the water vapor observed at O3HP (Fig. 6). However, the values at O3HP were 3 ‰–11 ‰ lower than those estimated for the ocean sources. In contrast, the d-excessV at O3HP was of the same order of magnitude as that over the ocean sources, while the observed 17O-excessV was slightly higher (by 11 ± 5 per meg).
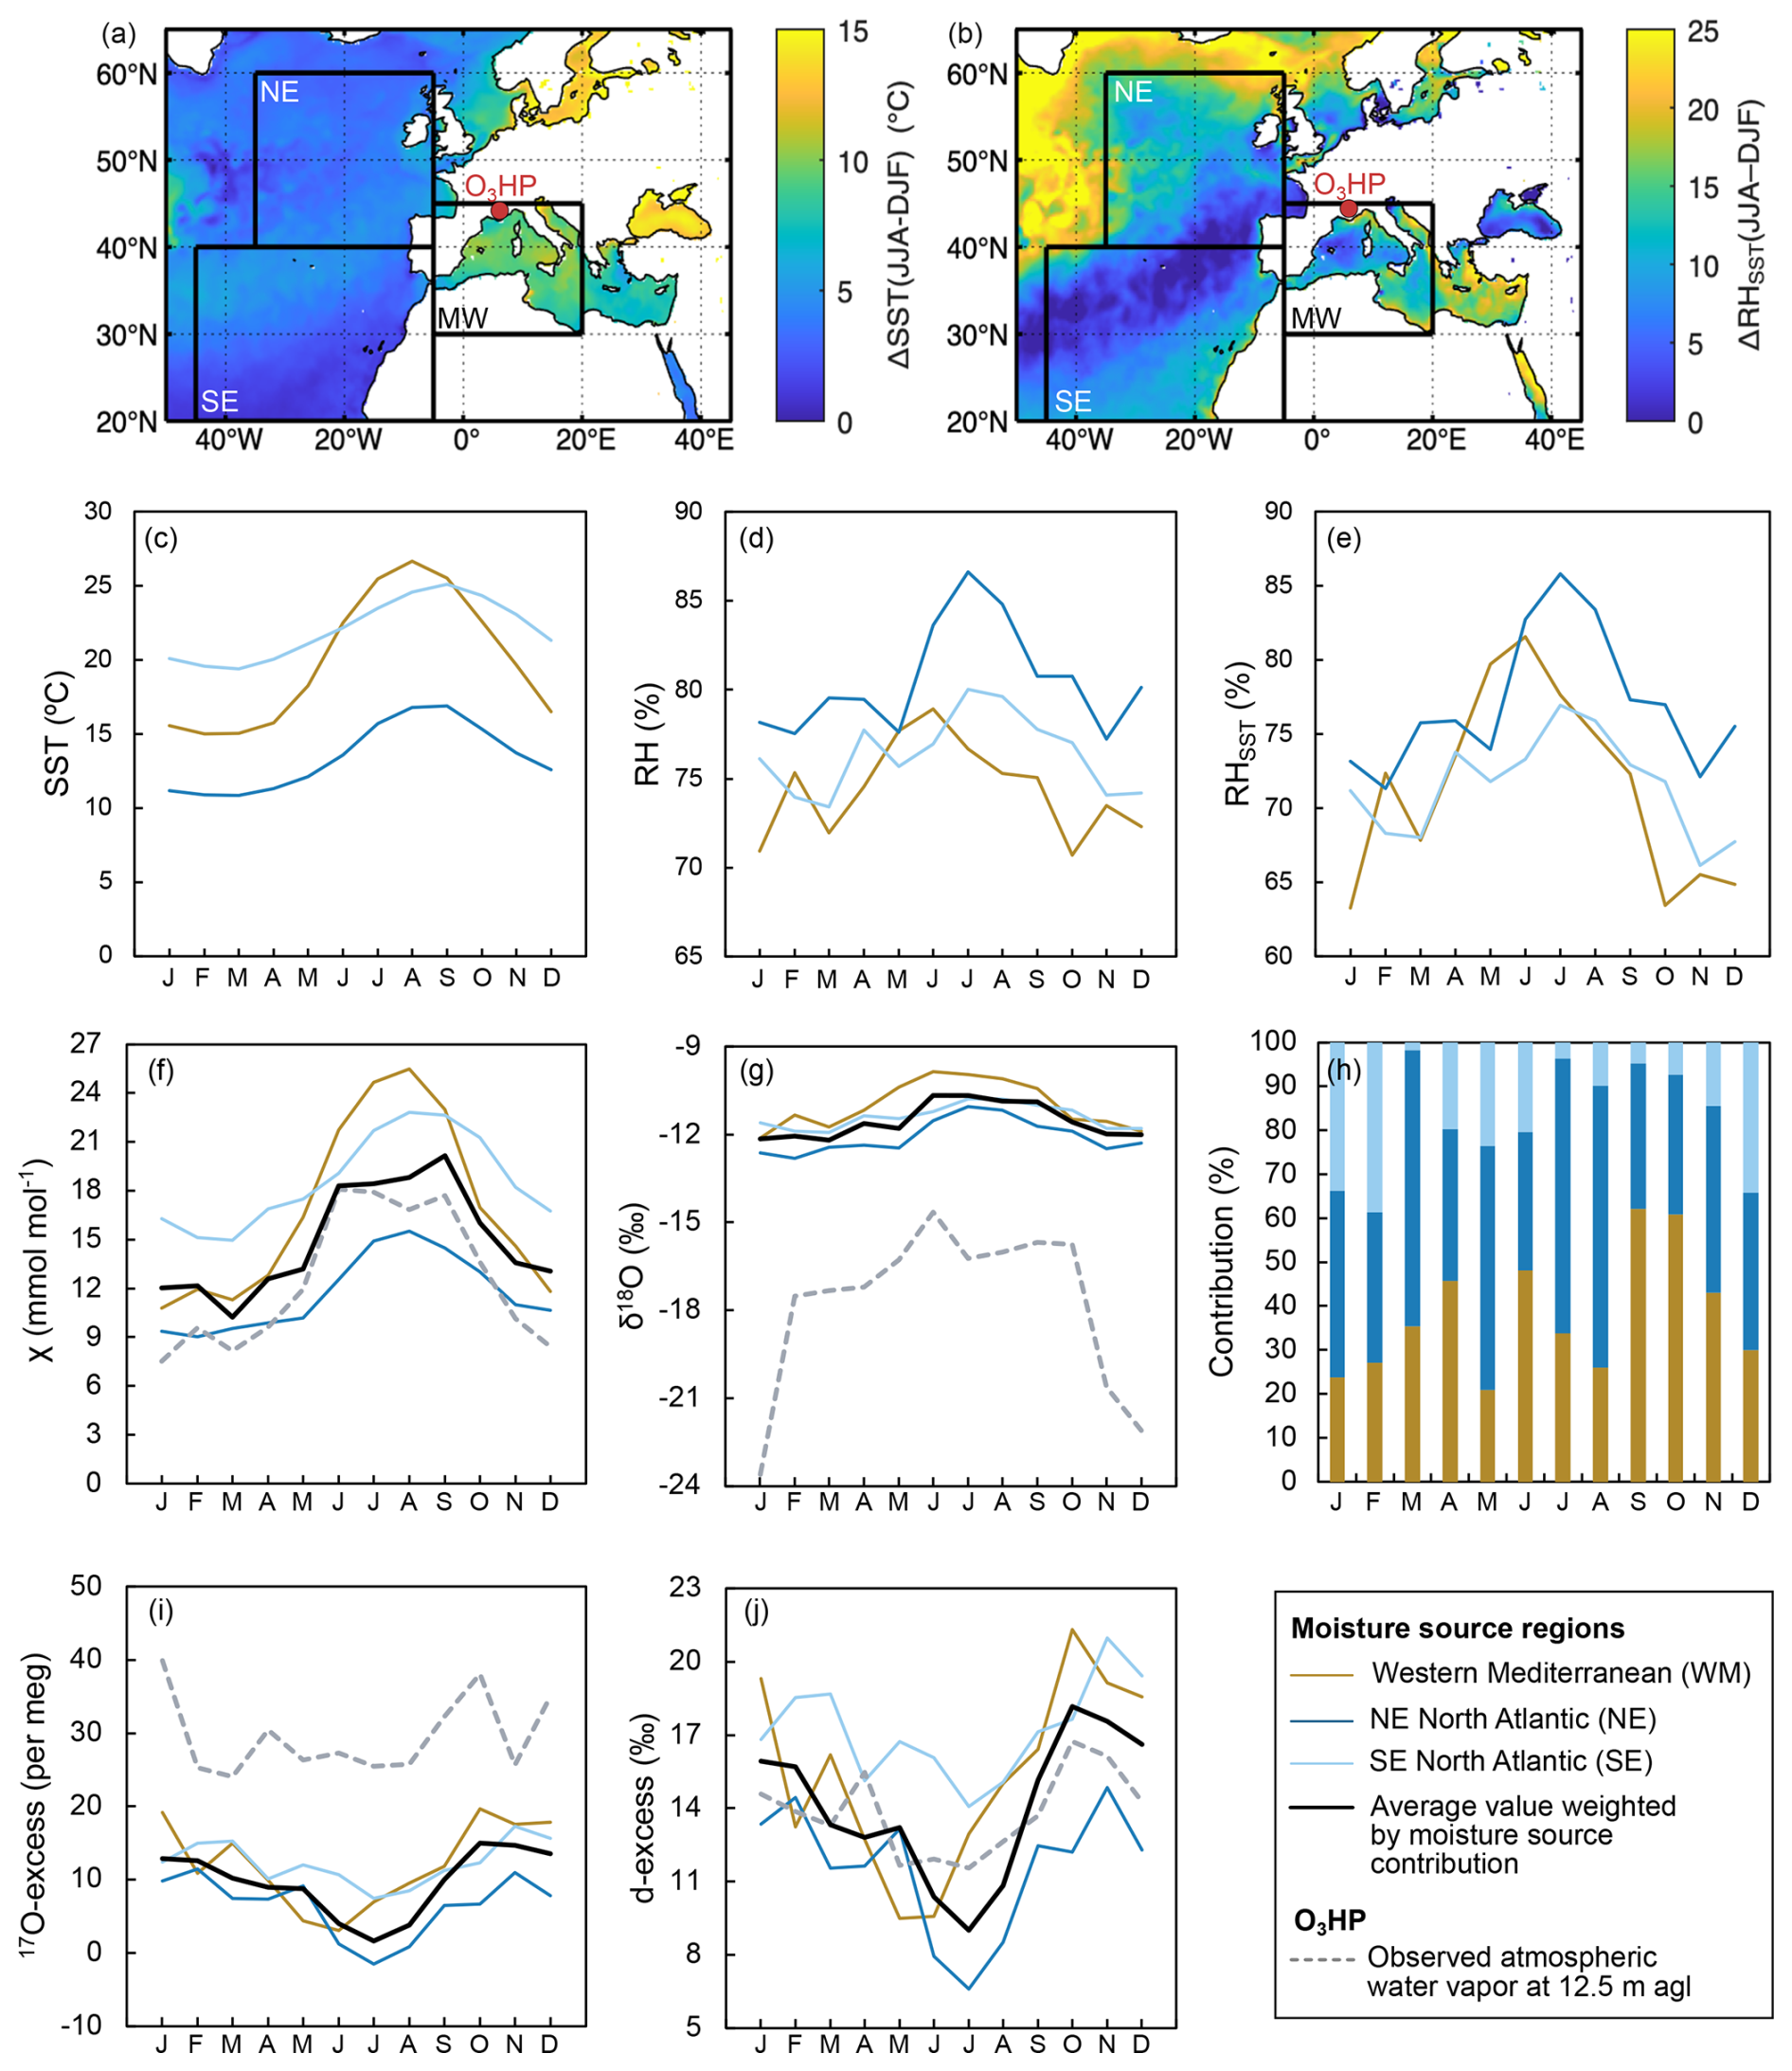
Figure 6Seasonal and monthly variation in the isotopic composition of atmospheric water vapor measured at O3HP compared with climate parameters and isotopic composition of atmospheric water vapor at the three main oceanic moisture sources. (a, b) Spatial variability of the difference between summer (JJA) and winter (DJF) sea surface temperature (SST) and relative humidity normalized to SST (RHSST) in 2021. Data derived from ERA5 Reanalysis (Hersbach et al., 2020). The red circle indicates the location of the study site. (c–e) Monthly average SST, relative humidity above the ocean (RH) and RHSST obtained from the ERA5 reanalysis dataset (Hersbach et al., 2020) for 2021. (f–j) Monthly average of atmospheric water mixing ratio (χ), relative contribution of the three moisture sources obtained from Lagrangian moisture source diagnostic (Sect. 3.6), , d-excessV and 17O-excessV measured at O3HP at 12.5 m a.g.l. (dashed line) and estimated above the three main oceanic moisture sources (solid lines). See Sect. 2.5 for more details on how the isotopic composition of water vapor over each moisture source is estimated.
3.7 Relationship between weather regimes and the isotopic compositions of atmospheric water vapor and precipitation
Four weather regimes were identified for wintertime (November–March) 2021 in the North Atlantic area: the negative North Atlantic Oscillation (NAO−), the positive North Atlantic Oscillation (NAO+), the Scandinavian Blocking regime, and the Atlantic Ridge regime (Fig. C5). The Atlantic Ridge and NAO− regimes were dominant, whereas NAO+ occurred only sporadically. In summer 2021 (May–September), the NAO−, Icelandic Low, Atlantic Low, and Scandinavian Blocking/NAO+ regimes were identified. The Blocking/NAO+ regime was clearly the dominant, followed by NAO−. Precipitation occurred most frequent during NAO− phases (Fig. C6c and d). The isotopic compositions of water vapor and precipitation grouped by weather regime did not show significant differences (Fig. C6).
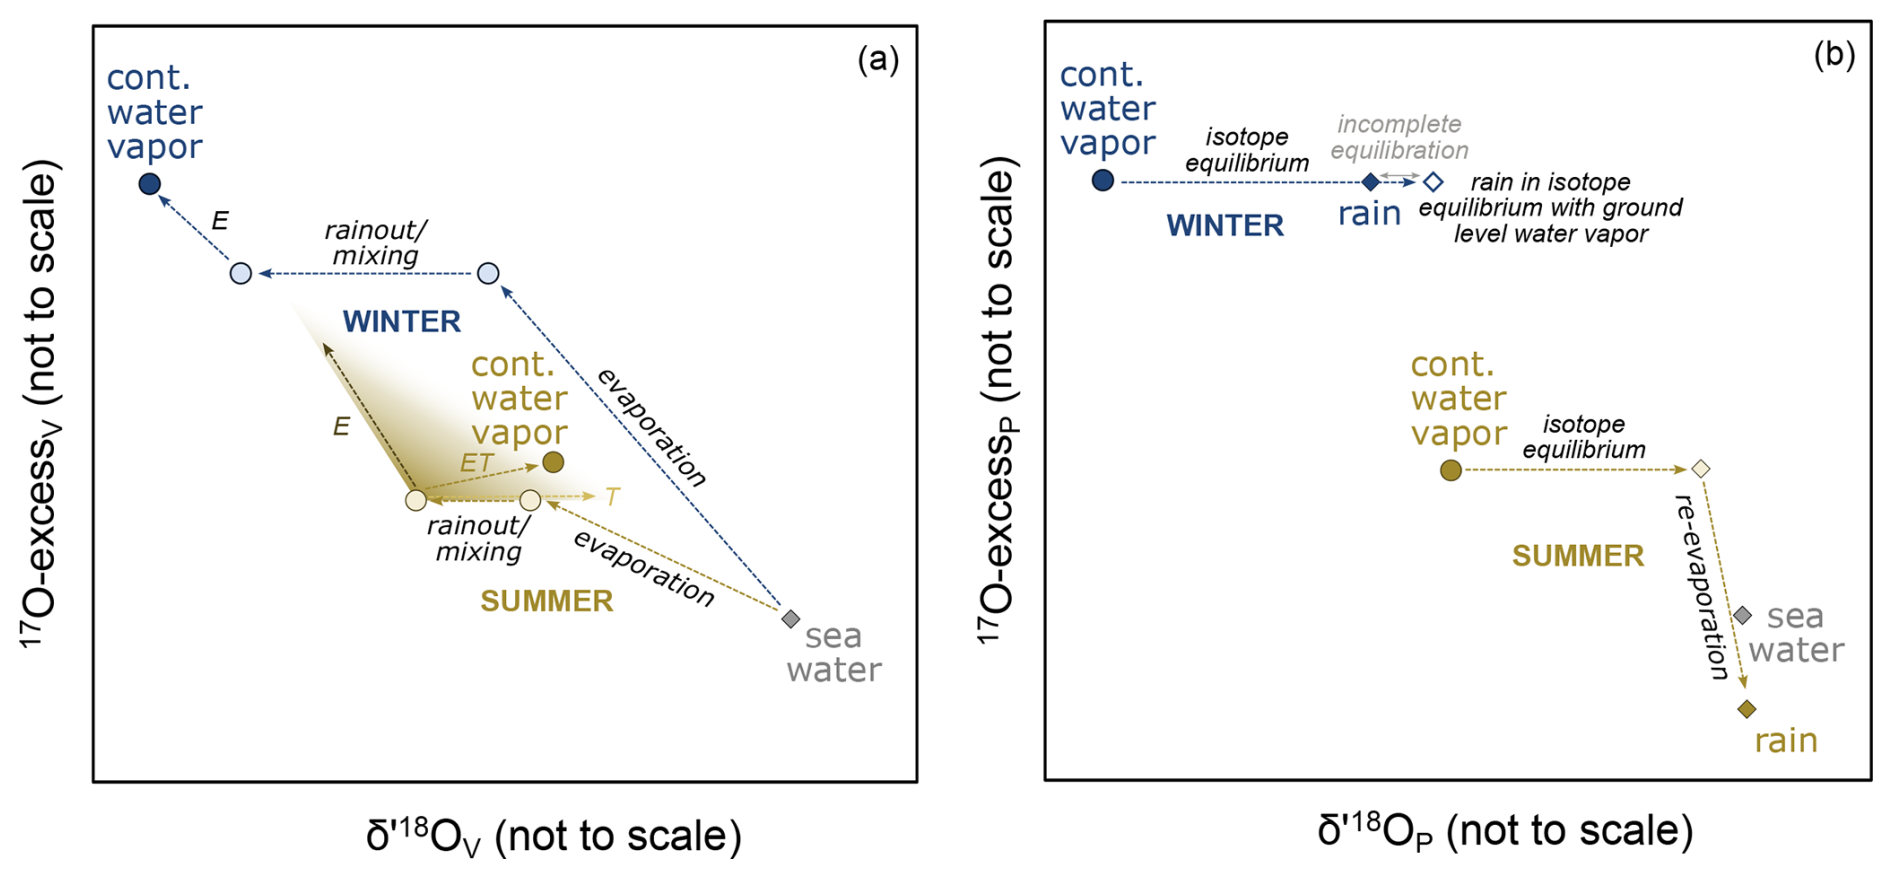
Figure 7Synthesis of the effect of ocean evaporation, rainout, air mass mixing, continental moisture recycling (ET) resulting from evaporation (E) and plant transpiration (T), and post formation precipitation processes in winter (blue) and summer (yellow) on the triple oxygen isotopic composition of (a) atmospheric water vapor and (b) precipitation (see Sect. 4 for further details).
The isotopic compositions of atmospheric water vapor and precipitation are determined by the evaporative conditions at the oceanic moisture sources, eventually modified by processes occurring during atmospheric transport and precipitation formation. These processes include progressive rainout, mixing of air masses from different sources, and the regional or local recycling of moisture through evapotranspiration from soil, plant and open surface waters. Locally, equilibration of raindrops with surrounding atmospheric water vapor and sub-cloud re-evaporation during falling can modify the isotopic composition of precipitation. In convective storms, vertical diffusion and mixing can additionally occur. The isotopic effects of these processes are physically well understood and have been modelled with differing degrees of complexity (Risi et al., 2012; Tremoy et al., 2014; Galewsky et al., 2016, and references therein; Xia et al., 2022, 2023). They are summarized in Fig. 7. However, little is known about the combined effects of these factors on the triple oxygen isotopic composition in atmospheric water vapor and precipitation, as long-term records are still scarce for precipitation and non-existent for water vapor. Our long-term monitoring of the triple oxygen and hydrogen isotopic composition of atmospheric water vapor and precipitation at the O3HP site allows us to assess the combined effect of these processes across different time scales. Further, the isotopic differences observed between the measured atmospheric water vapor and that estimated from isotopic equilibrium with precipitation are discussed.
4.1 Evaporative conditions at the oceanic moisture sources
The three principle oceanic moisture sources show lower RHSST during winter than in summer, resulting in stronger kinetic fractionation during evaporation from the ocean and higher d-excessV and 17O-excessV in the evaporated water vapor in winter than in summer (Fig. 6). This seasonal change predicted for water vapor over the oceanic moisture sources is also visible in the d-excessV measured at O3HP and to a lesser extent in the 17O-excessV. This consistency suggests that seasonal changes in evaporative conditions at the oceanic moisture sources contribute to seasonal changes in d-excessV and 17O-excessV at the study site. This is in agreement with previous interpretations of the triple oxygen isotopic composition of water vapor and precipitation (Affolter et al., 2015; Landais et al., 2012; Merlivat and Jouzel, 1979; Pfahl and Sodemann, 2014; Tian et al., 2018; Uechi and Uemura, 2019). However, with regard to , seasonal changes in the evaporative conditions at the oceanic moisture sources are limited to 1.5 ‰ and cannot explain the ∼7 ‰ seasonal variations observed at the study site. This indicates that is likely modified by further fractionation processes.
In previous studies, evaporative conditions at the moisture sources were invoked to explain d-excessP in precipitation from the Western Mediterranean (∼14 ‰) to be higher than in precipitation from the NE North Atlantic (∼10 ‰) (Casellas et al., 2019; Celle-Jeanton et al., 2001; Cruz-San Julian et al., 1992; Delattre et al., 2015; Natali et al., 2021). Theoretical predictions indeed show that d-excessV over NE North Atlantic is about 3.7 ‰ lower than over Western Mediterranean due to higher RHSST (Fig. 6). Similarly, 17O-excess of water vapor evaporated from the Western Mediterranean is predicted to be ∼6 per meg higher than from the NE North Atlantic, although the magnitude remains within measurement precision. However, d-excess and 17O-excess measured in atmospheric water vapor and precipitation at O3HP grouped by their primary moisture source (NE North Atlantic vs. Mediterranean) were not significantly different. Several factors may have contributed to diminish the isotopic contrast between these source regions, including frequent mixing of moisture from multiple sources, local orographic and boundary-layer dynamics or moisture recycling during atmospheric transport (Aemisegger et al., 2014; Natali et al., 2022).
4.2 Rayleigh distillation during air mass transport
Along the air mass trajectory, the water vapor undergoes Rayleigh distillation due to the progressive rainout. Rainout is forced by a decrease in temperature, accompanied by a decrease of χ and leads to a decrease of , and and subsequent precipitation (Dansgaard, 1964; Galewsky et al., 2016). Rayleigh distillation explains why the monthly average is systematically lower than at the oceanic moisture sources (Fig. 6). Furthermore, enhanced rainout along the longer transport distance from the North Atlantics likely explain why the derived from the NE North Atlantic is 1 ‰–3 ‰ lower than from the Western Mediterranean (Delattre et al., 2015; Natali et al., 2021).
In contrast, Rayleigh distillation has limited impact on d-excessV and 17O-excessV as, by definition, these parameters are weakly sensitive to equilibrium isotopic fractionation (Merlivat and Jouzel, 1979; Xia et al., 2023). In mid-latitudes Rayleigh distillation is expected to cause up to 3 ‰ changes in d-excessV, with the direction of change depending on the season and the degree of distillation (Xia et al., 2022). The effect should not exceed a 5 per meg increase for 17O-excessV (Xia et al., 2023). Nevertheless, enhanced rainout along transport pathways from the North Atlantic may have attenuated potential moisture source differences in d-excessV and 17O-excessV.
4.3 Terrestrial moisture recycling
On a daily scale, χ, d-excessV and 17O-excessV are higher and is lower during the day (with a peak in the afternoon) than at night. Such a day-night pattern has been reported for d-excessV across diverse environments, including forests, grasslands, wetlands, agricultural areas and urban regions (Berkelhammer et al., 2013; Delattre et al., 2015; Welp et al., 2012) and attributed to several processes, including entrainment of the residual layer or air from the lower free troposphere in the boundary layer (Lai and Ehleringer, 2011; Simonin et al., 2014), local evapotranspiration fluxes (Huang and Wen, 2014; Simonin et al., 2014; Welp et al., 2012; Zhao et al., 2014; Delattre et al., 2015), and dewfall evaporation (Bastrikov et al., 2014; Berkelhammer et al., 2013). The fact that the observed day-night pattern in d-excessV and 17O-excessV is more pronounced during the forest growth period and most pronounced near surface (Fig. 4) supports the key influence of surface-atmosphere processes. Assuming that the soil water has an isotopic composition close to that of precipitation, soil water evaporation decreases and increases d-excessV and 17O-excess during the day (Craig and Gordon, 1965; Rothfuss et al., 2021; Fig. 7). Plant transpiration, which is assumed to be non-fractionating relative to soil water (Galewsky et al., 2016, and references therein) increases but has little impact on d-excessV and 17O-excessV (Fig. 7). In total, net evapotranspiration affects , with the direction and magnitude depending on the relative contributions of evaporation and transpiration, whereas d-excessV and 17O-excessV are elevated only when evaporation is substantial (Fig. 7). Entrainment of a remnant of the convective boundary layer of the previous day, with a high d-excessV and 17O-excessV used by evapotranspiration, may amplify the increase in d-excessV and 17O-excessV in the morning (Lai and Ehleringer, 2011; Simonin et al., 2014, Griffis et al., 2016; Welp et al., 2012). Entrainment of the lower free troposphere may also occur. However, the low water vapor mixing ratio of the free troposphere (<4000 ppmv) likely limits its influence on the isotopic composition of atmospheric water vapor. During the night, when RH is high, water exchange between plant water subjected to incomplete stomata closure, or evaporated surface soil waters, and the atmospheric water vapor can increase and decrease d-excessV (Berkelhammer et al., 2013; Bastrikov et al., 2014; Lai and Ehleringer, 2011; Simonin et al., 2014; Welp et al., 2012) and 17O-excessV. The combination of all these factors likely contributes to the observed day-night pattern in , d-excessV and 17O-excessV. While evapotranspiration contributes to diurnal isotopic variability, opposing daytime and nighttime responses diminish its imprint at monthly timescales. Consequently, local vegetation-driven moisture recycling does not appear to leave a strong isotopic imprint on atmospheric water vapor and precipitation at our site.
4.4 Mixing between air masses
The mixing of air masses from different origins frequently occurs during atmospheric transport. The mixing of two air masses with different but similar 17O-excessV and d-excessV results in a decrease in 17O-excessV, while d-excessV remains largely unchanged. The effect on 17O-excessV differs from that on d-excessV due to its logarithmic (non-linear) δ′ notation (Li et al., 2015; Aron et al., 2021; Leuenberger and Ranjan, 2021). The decrease in 17O-excessV due to mixing is however small, representing only 3 per meg for a difference of 10 ‰ between two air masses with the same water content (Xia et al., 2023). As isotopic differences in atmospheric water vapor observed between the oceanic moisture sources are small, mixing of air masses from different oceanic sources is unlikely to significantly alter the isotopic composition of atmospheric water vapor observed at the O3HP site.
4.5 Precipitation formation, raindrop re-evaporation, and isotopic (dis)equilibrium with atmospheric water vapor
Liquid precipitation forms in isotopic equilibrium with atmospheric water vapor at cloud height, while ice formation may be accompanied by an additional kinetic effect due to supersaturation of water vapor (Dütsch et al., 2017; Xia et al., 2023). Vapor at cloud height is typically depleted in heavy isotopes compared to near-surface atmospheric water vapor due to Rayleigh fractionation processes (Giménez et al., 2021, and references therein; Salmon et al., 2019; Sodemann et al., 2017). As raindrops fall through the air column, they continuously exchange water molecules with the surrounding vapour and equilibrate isotopically. This is the basis for the isotopic equilibrium assumption between precipitation and near-surface atmospheric water vapor. During precipitation events in dry atmosphere or during convective storms in warm atmosphere additional fractionation processes can occur. Rain re-evaporation in dry atmosphere increases and decreases d-excessP and 17O-excessP (Fig. 5). During convective storms, multiple processes, including vertical diffusion, mixing, and rain re-evaporation can influence the isotopic composition of precipitation (Risi et al., 2012; Tremoy et al., 2014; Xia et al., 2022).
At O3HP during winter months, is slightly higher than and the two snowfall events have the largest (−12.3 ‰) (Fig. 5). These differences suggest that at ground level is higher than at the height of rain formation, and that equilibration during raindrop falling is incomplete. Indeed, equilibration rates are hampered under cold conditions, and no equilibration occurs between vapor and solid (Graf et al., 2019). Incomplete equilibration can also occur when low χ in the atmosphere is associated with strong vertical isotopic gradients in atmospheric water vapor, when drops are large or precipitation forms at high altitude (Graf et al., 2019; Penchenat et al., 2020). This incomplete equilibration has little effect on d-excessP (average deviation −0.8 ‰ ± 3.0 ‰) due to the generally small vertical gradients of d-excessV in the lowermost troposphere (Salmon et al., 2019; Sodemann et al., 2017). Notably, in winter, 17O-excessP is always close to 17O-excessV rather than 10–15 per meg lower as expected from isotopic equilibrium (Fig. 5). The reason for this offset remains unclear so far.
During spring and summer months, the systematic correlation between , Δd-excessVeq-V and Δ17O-excessVeq-V (Fig. 5) suggests the impact of below-cloud rain re-evaporation. Rain re-evaporation has been found to occur under unsaturated conditions in mid-latitude to tropical regions (Aemisegger et al., 2015; Aemisegger and Sjolte, 2018; Graf et al., 2019; Landais et al., 2010; Mercer et al., 2020). Indeed, positive values at O3HP occur when RH is lower than 90 %. Convective storms occurring in summer in the Mediterranean area can strengthen this correlation. The fact that there are no isotopic differences in atmospheric water vapor between rainy and non-rainy days (data not shown) implies that sub-cloud rain re-evaporation does not significantly affect near-surface atmospheric water vapor. The contribution of plant transpiration and soil evaporation to the near-surface atmospheric water vapor may emphasize the isotopic disequilibrium between precipitation and atmospheric water vapor during daytime in summer (cf. Sect. 4.3).
At annual scale, the opposing winter and summer monthly values at our study site effectively cancel each other out, so that closely approximates (cf., Voigt et al., 2023). However, this may differ depending on the environmental setting. Significant deviations from isotopic equilibrium at annual scale were observed in monsoonal areas due to rain re-evaporation (Desphande et al., 2010; Landais et al., 2010; Wen et al., 2010), convective activity (Risi et al., 2012; Tremoy et al., 2014; Xia et al., 2022) or in environments with seasonal precipitation, where the isotopic composition of precipitation is not representative for annual average atmospheric water vapor (Tsujimura et al., 2007; Voigt et al., 2021).
4.6 Effect of the weather regimes
The absence of correlation between the weather regimes and the isotopic composition of vapor and precipitation is probably due to the combined influence of multiple moisture sources weakly isotopically contrasted as presented in Sect. 3.6. In addition, local moisture recycling may further modify the isotopic signal of atmospheric water vapor and, thus, precipitation, as previously suggested for the circum-Mediterranean region (Baldini et al., 2008). However, opposing day–night vegetation-related isotopic variations that largely cancel each other out on the monthly scale, indicate a limited net influence of local moisture recycling. It is also possible that the isotopic composition of near-surface atmospheric water vapor differs slightly from that at the precipitation formation height due to ground roughness, convection, mixing processes in the planetary boundary layer (Griffis et al., 2016; Salmon et al., 2019; Tada et al., 2021).
4.7 Accuracy of 17O-excessV measurements
Although monthly average d-excessv measured at the O3HP is close to estimated d-excessv at the oceanic moisture sources, as expected from Rayleigh distillation, monthly average 17O-excessV is systematically higher by about 15 per meg. This inconsistency may result from an inaccurate 17O-excess average value used for sea water (−5 per meg) in the calculation of 17O-excessV above the oceanic moisture sources. To date, the dataset of 17O-excess in seawater is limited (Lin et al., 2021; Luz and Barkan, 2010), so that estimates of oceanic 17O-excessV are not very accurate. Uncertainty in the turbulence coefficient may also contribute to the mismatch between observed 17O-excessV and model predictions. Increasing the turbulence coefficient reduces the offset but simultaneously worsens the agreement for d-excessV and contradicts previous studies (e.g., Gat, 1996; Pfahl and Wernli, 2008; Uemura et al., 2010, Dütsch et al., 2026). It therefore cannot, by itself, explain the discrepancy. More likely, the closure assumption during ocean evaporation does not fully represent actual isotopic fractionation. For example, aerodynamic conditions over oceans and mixing of water vapor from other sources into the marine boundary layer can decouple 17O-excess and d-excess signals (Xia et al., 2023).
A calibration artifact caused by inaccuracies in the mixing ratio dependency functions or a weak matrix effect cannot be completely excluded. However, it is unlikely, as the quality control standard was routinely measured and accurately calibrated (Sect. 2.2). In any case, such effects would introduce systematic biases and would not alter the main conclusions presented here.
This study provides a unique dataset of the triple oxygen and hydrogen isotopic composition of atmospheric water vapor and precipitation in a Mediterranean oak forest ecosystem, highlighting seasonal and diurnal variability and their underlying drivers. Our findings demonstrate the potential of 17O-excess as a complementary tracer for disentangling fractionation processes and providing complementary hydrological insights.
The Western Mediterranean, The NE North Atlantic and the SE North Atlantic are identified as the principal moisture sources for vapor and precipitation at the study site. Theoretically predicted seasonal variations in d-excessV and 17O-excessV over these oceanic moisture sources, driven by changes in RHSST, are preserved in the atmospheric water vapor observed at the study site. In contrast, is only weakly influenced by source conditions and mainly reflects Rayleigh distillation during air mass transport. Monthly values of , d-excessP and 17O-excessP show a similar seasonal pattern to atmospheric water vapor but are modified in summer due to sub-cloud rain re-evaporation.
Despite these source-related controls on d-excessV and 17O-excessV, neither tracer clearly discriminates oceanic moisture source regions or weather regimes at monthly scale, likely due to weak isotopic contrasts between the oceanic moisture sources and frequent mixing of moisture from multiple sources. This result contrasts with previous studies that attributed higher d-excessP from Western Mediterranean sources compared to the North Atlantic sources to enhanced kinetic fractionation during evaporation, driven by lower RHSST (Casellas et al., 2019; Celle-Jeanton et al., 2001; Cruz-San Julian et al., 1992; Delattre et al., 2015; Natali et al., 2021). On the other hand, we do observe lower from North Atlantic sources compared to the Western Mediterranean sources, consistent with earlier observations (Casellas et al., 2019; Celle-Jeanton et al., 2001; Cruz-San Julian et al., 1992; Delattre et al., 2015; Natali et al., 2021). This difference is likely related to enhanced rainout along the longer air mass transport pathway from the North Atlantic. Overall, these findings imply that long-term precipitation isotopic records of precipitation preserved in Mediterranean continental paleoclimate archives should be interpreted with caution when inferring shifts in moisture source regions.
On the diurnal scale, our results demonstrate that 17O-excessV exhibits a similar diurnal pattern as observed previously for d-excessV in different environmental settings. Increases in 17O-excessV and d-excessV during daytime likely reflect the combination of vegetation-related processes, including soil water and dewfall evaporation, plant transpiration and entrainment of a remnant of the convective boundary layer of the previous day. Nighttime decreases in both tracers likely result from continued isotopic exchange between leaf water, evaporated surface soil water, and ambient water vapor. These findings highlight the strong control of local evapotranspiration processes on sub-daily variability of 17O-excessV and d-excessV. However, such effects are not evident in monthly 17O-excessV and d-excessV as opposing day- and nighttime contributions largely offset each other at the daily scale. This study opens new avenues for investigating land-atmosphere water exchange across diverse climates, vegetation types and timescales.
At the process scale, summer precipitation shows strong coupling between , 17O-excessP and d-excessP, indicating rain re-evaporation. In contrast, negative values in winter suggest incomplete isotopic equilibration with ambient vapor. Although precipitation often deviates from isotopic equilibrium with near-surface atmospheric water vapor at the event scale, equilibrium water vapor reliably approximates the near-surface isotopic composition of atmospheric water vapor at monthly or annual scale. These findings have important consequences (1) for reconstructing the isotopic composition of atmospheric water vapor to constrain hydrological models of evaporative fractionation when direct measurements are not available, and (2) for simulating the isotopic composition of precipitation in isotope-enabled climate models. Our results support the robustness of reconstructions assuming isotopic equilibrium at annual scales in this climate context. However, at daily- to event scales, accurate reconstruction of the isotopic composition of atmospheric water vapor and simulation of rainfall formation require accounting for post-condensation processes, such as raindrop re-evaporation and rain-vapor equilibration during raindrop fall through the atmospheric column. When process scale dynamics are targeted, simultaneous measurements of triple oxygen and hydrogen isotopes in precipitation and atmospheric water vapor are essential across diverse environmental settings to further constrain and improve the representation of these processes in isotope-enabled models.
Table A1Run architectures used for calibrations of atmospheric water vapor measurements.
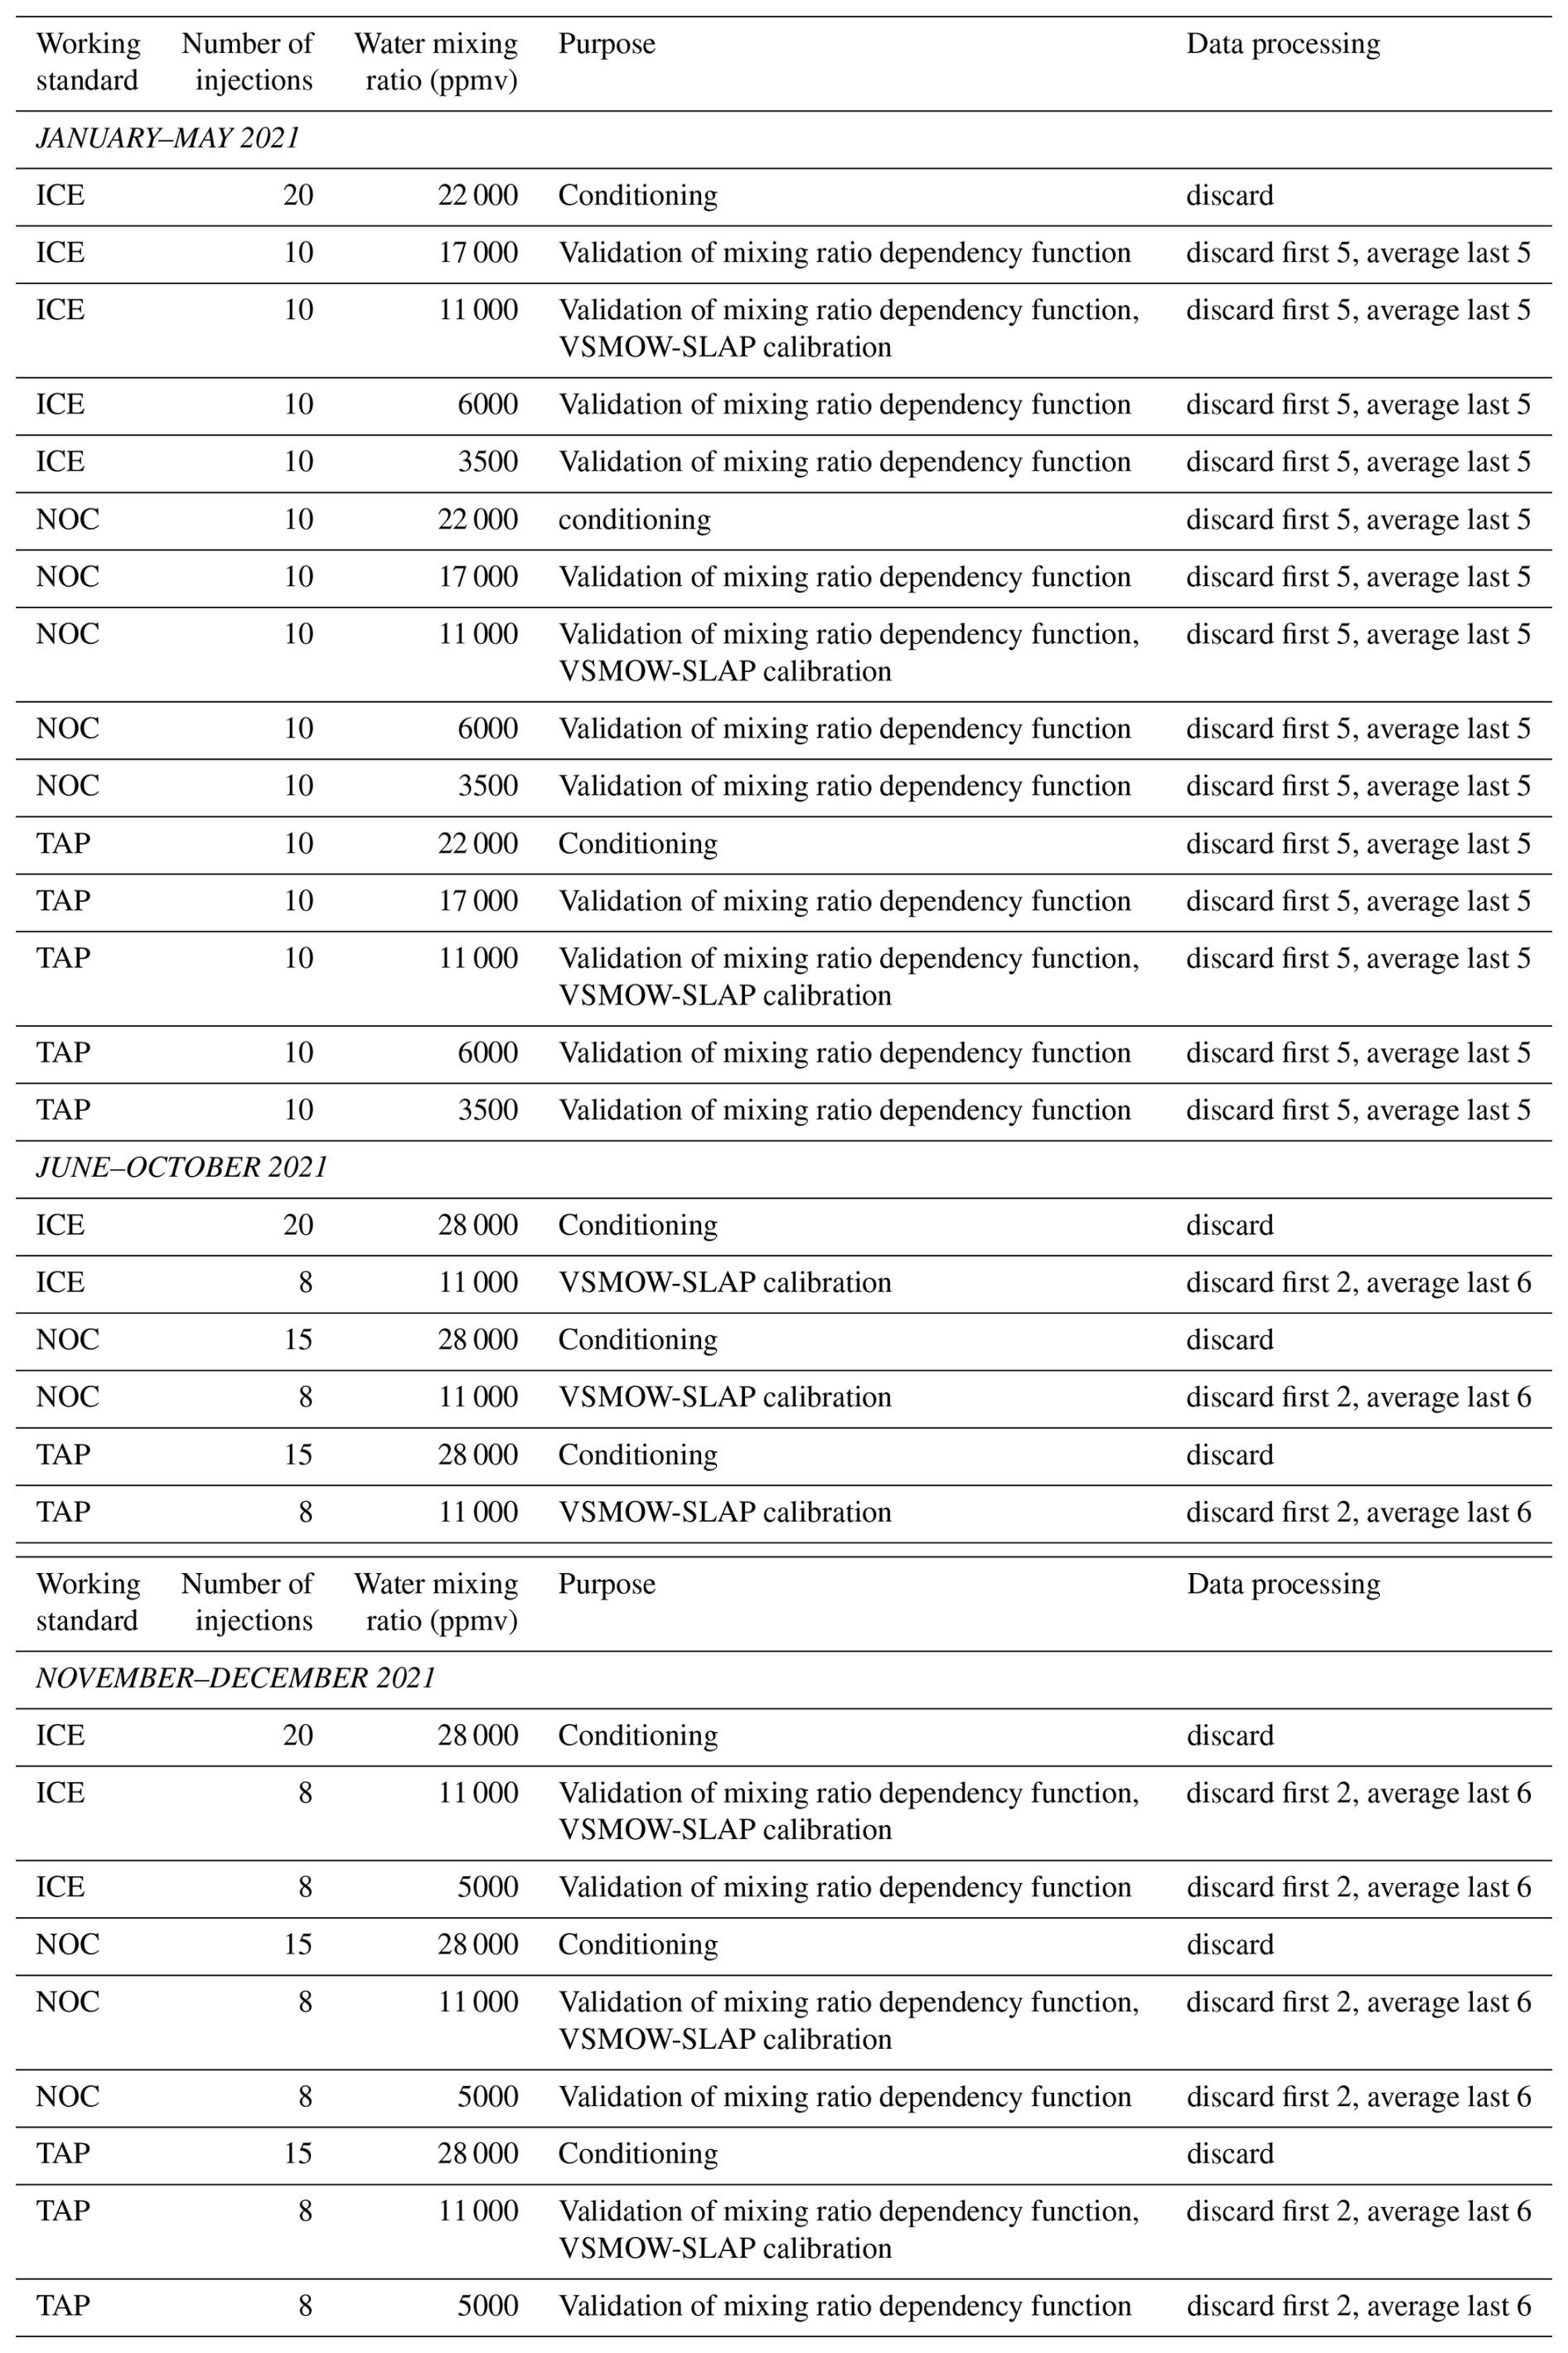
Table A2Means (AV) and standard deviations (SD) of coefficients of mixing ratio dependency functions for δ17O, δ18O and δ2H of the three used standards (ICE: , , ; NOC: , , ; TAP: , , ). The mixing ratio dependency functions have the form and are determined relative to a water mixing ratio of 10 000 ppmv. In addition, the coefficients of determination (R2) and the root mean square errors (RMSE) of the functions are given.
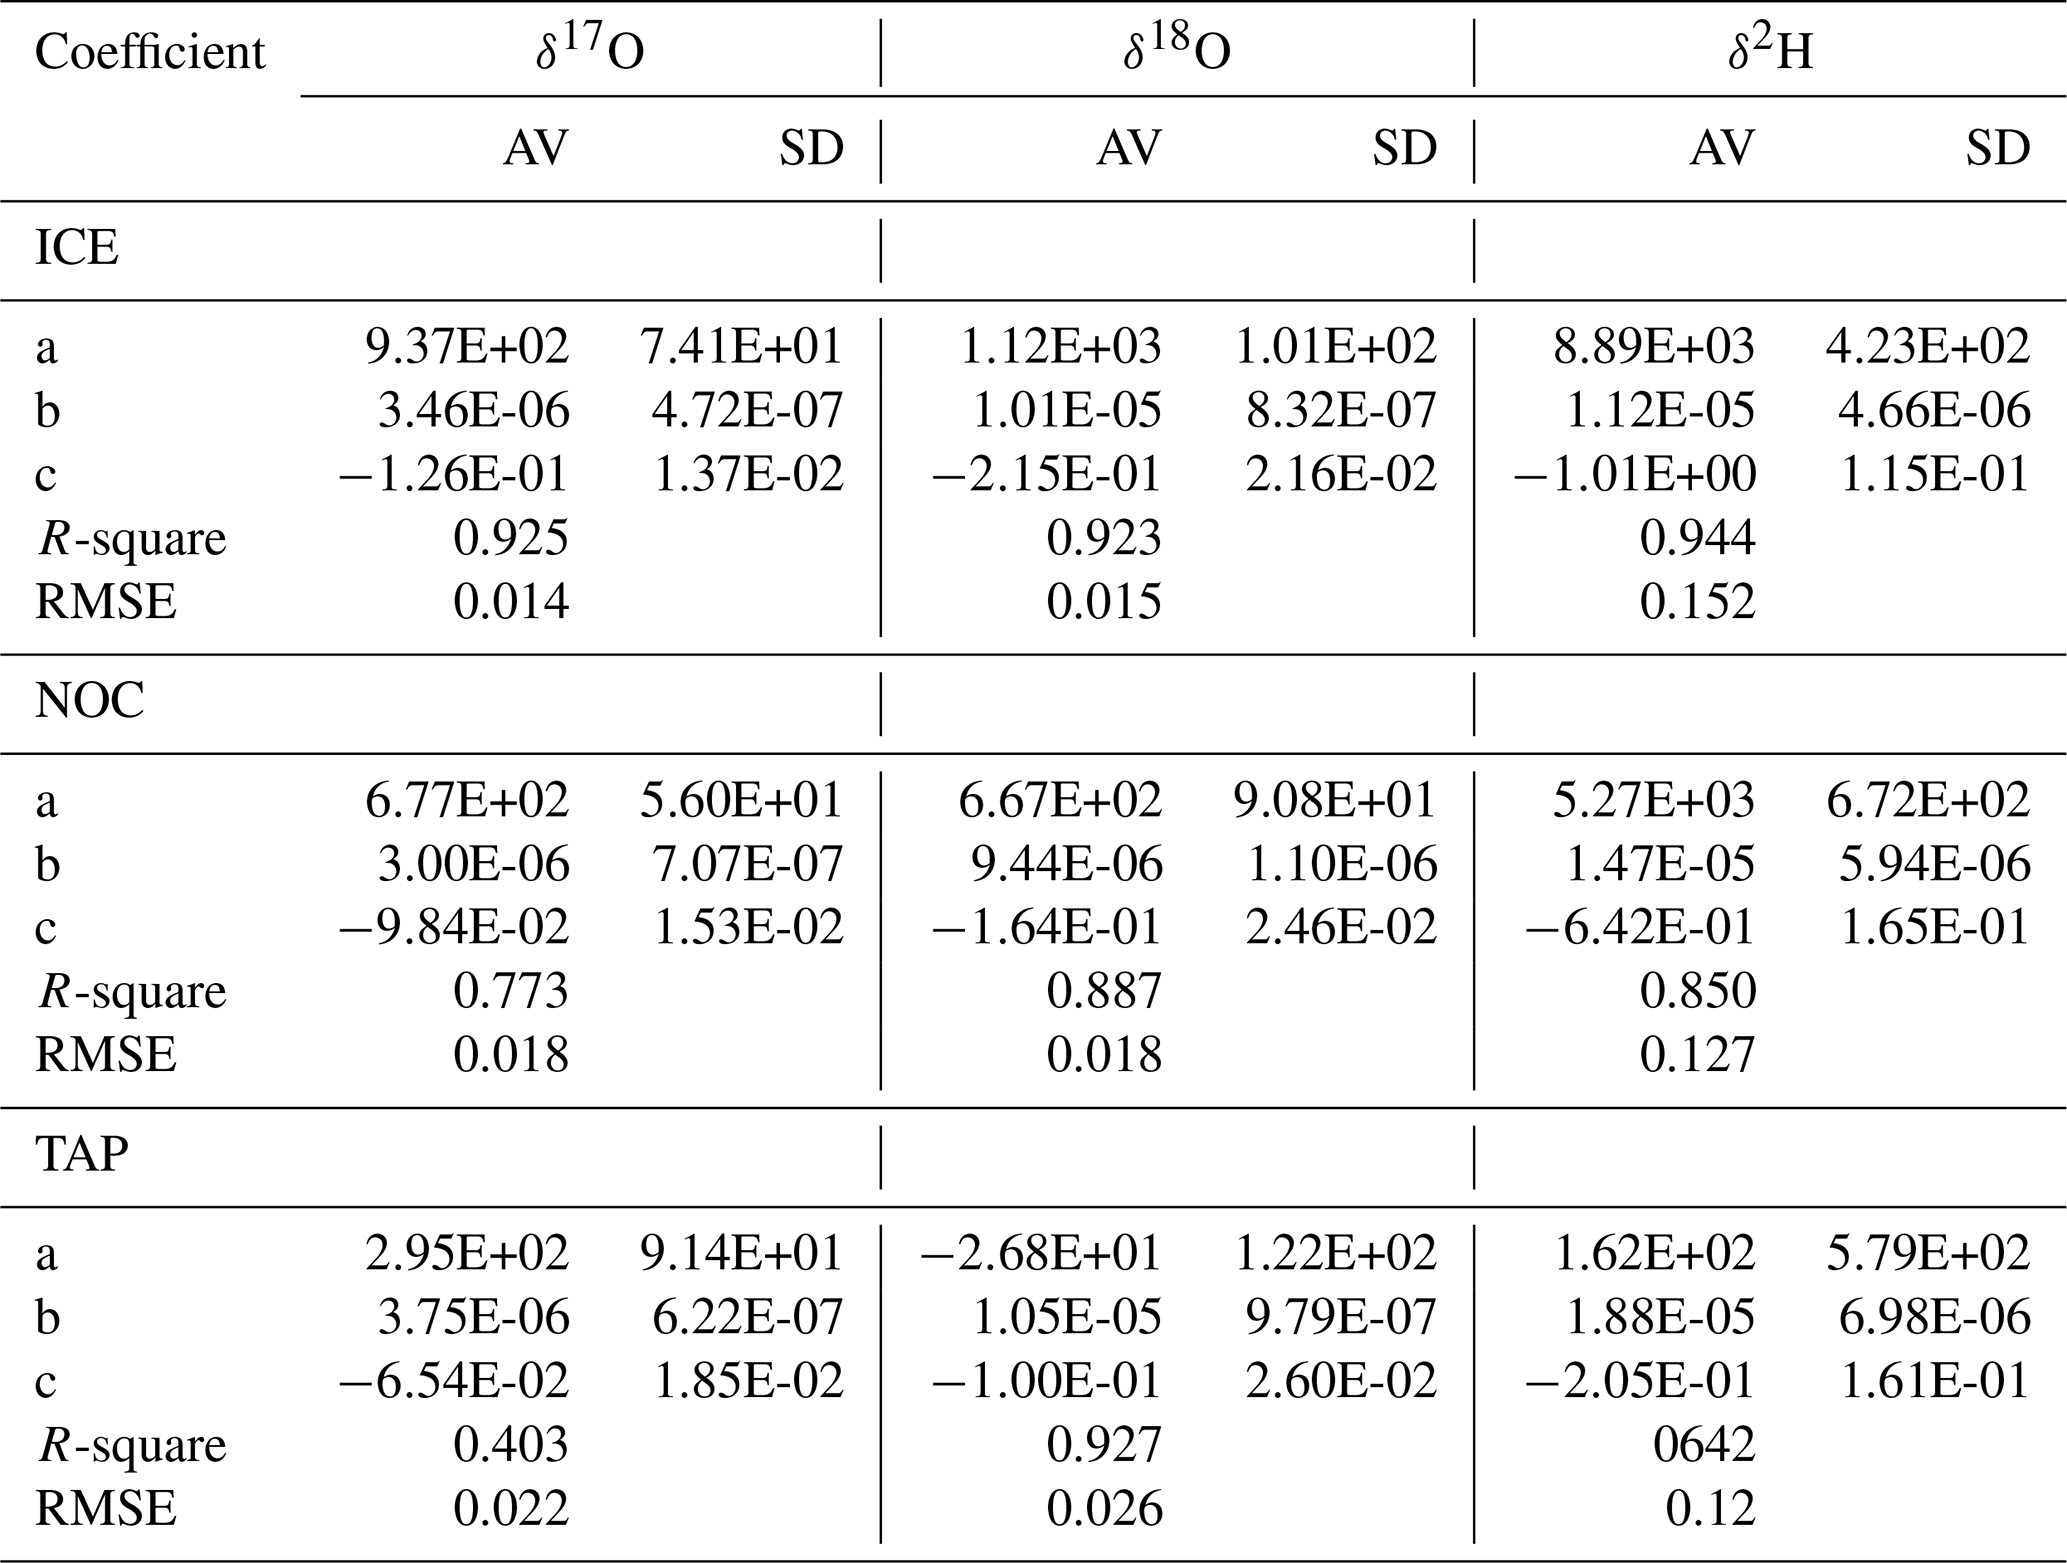
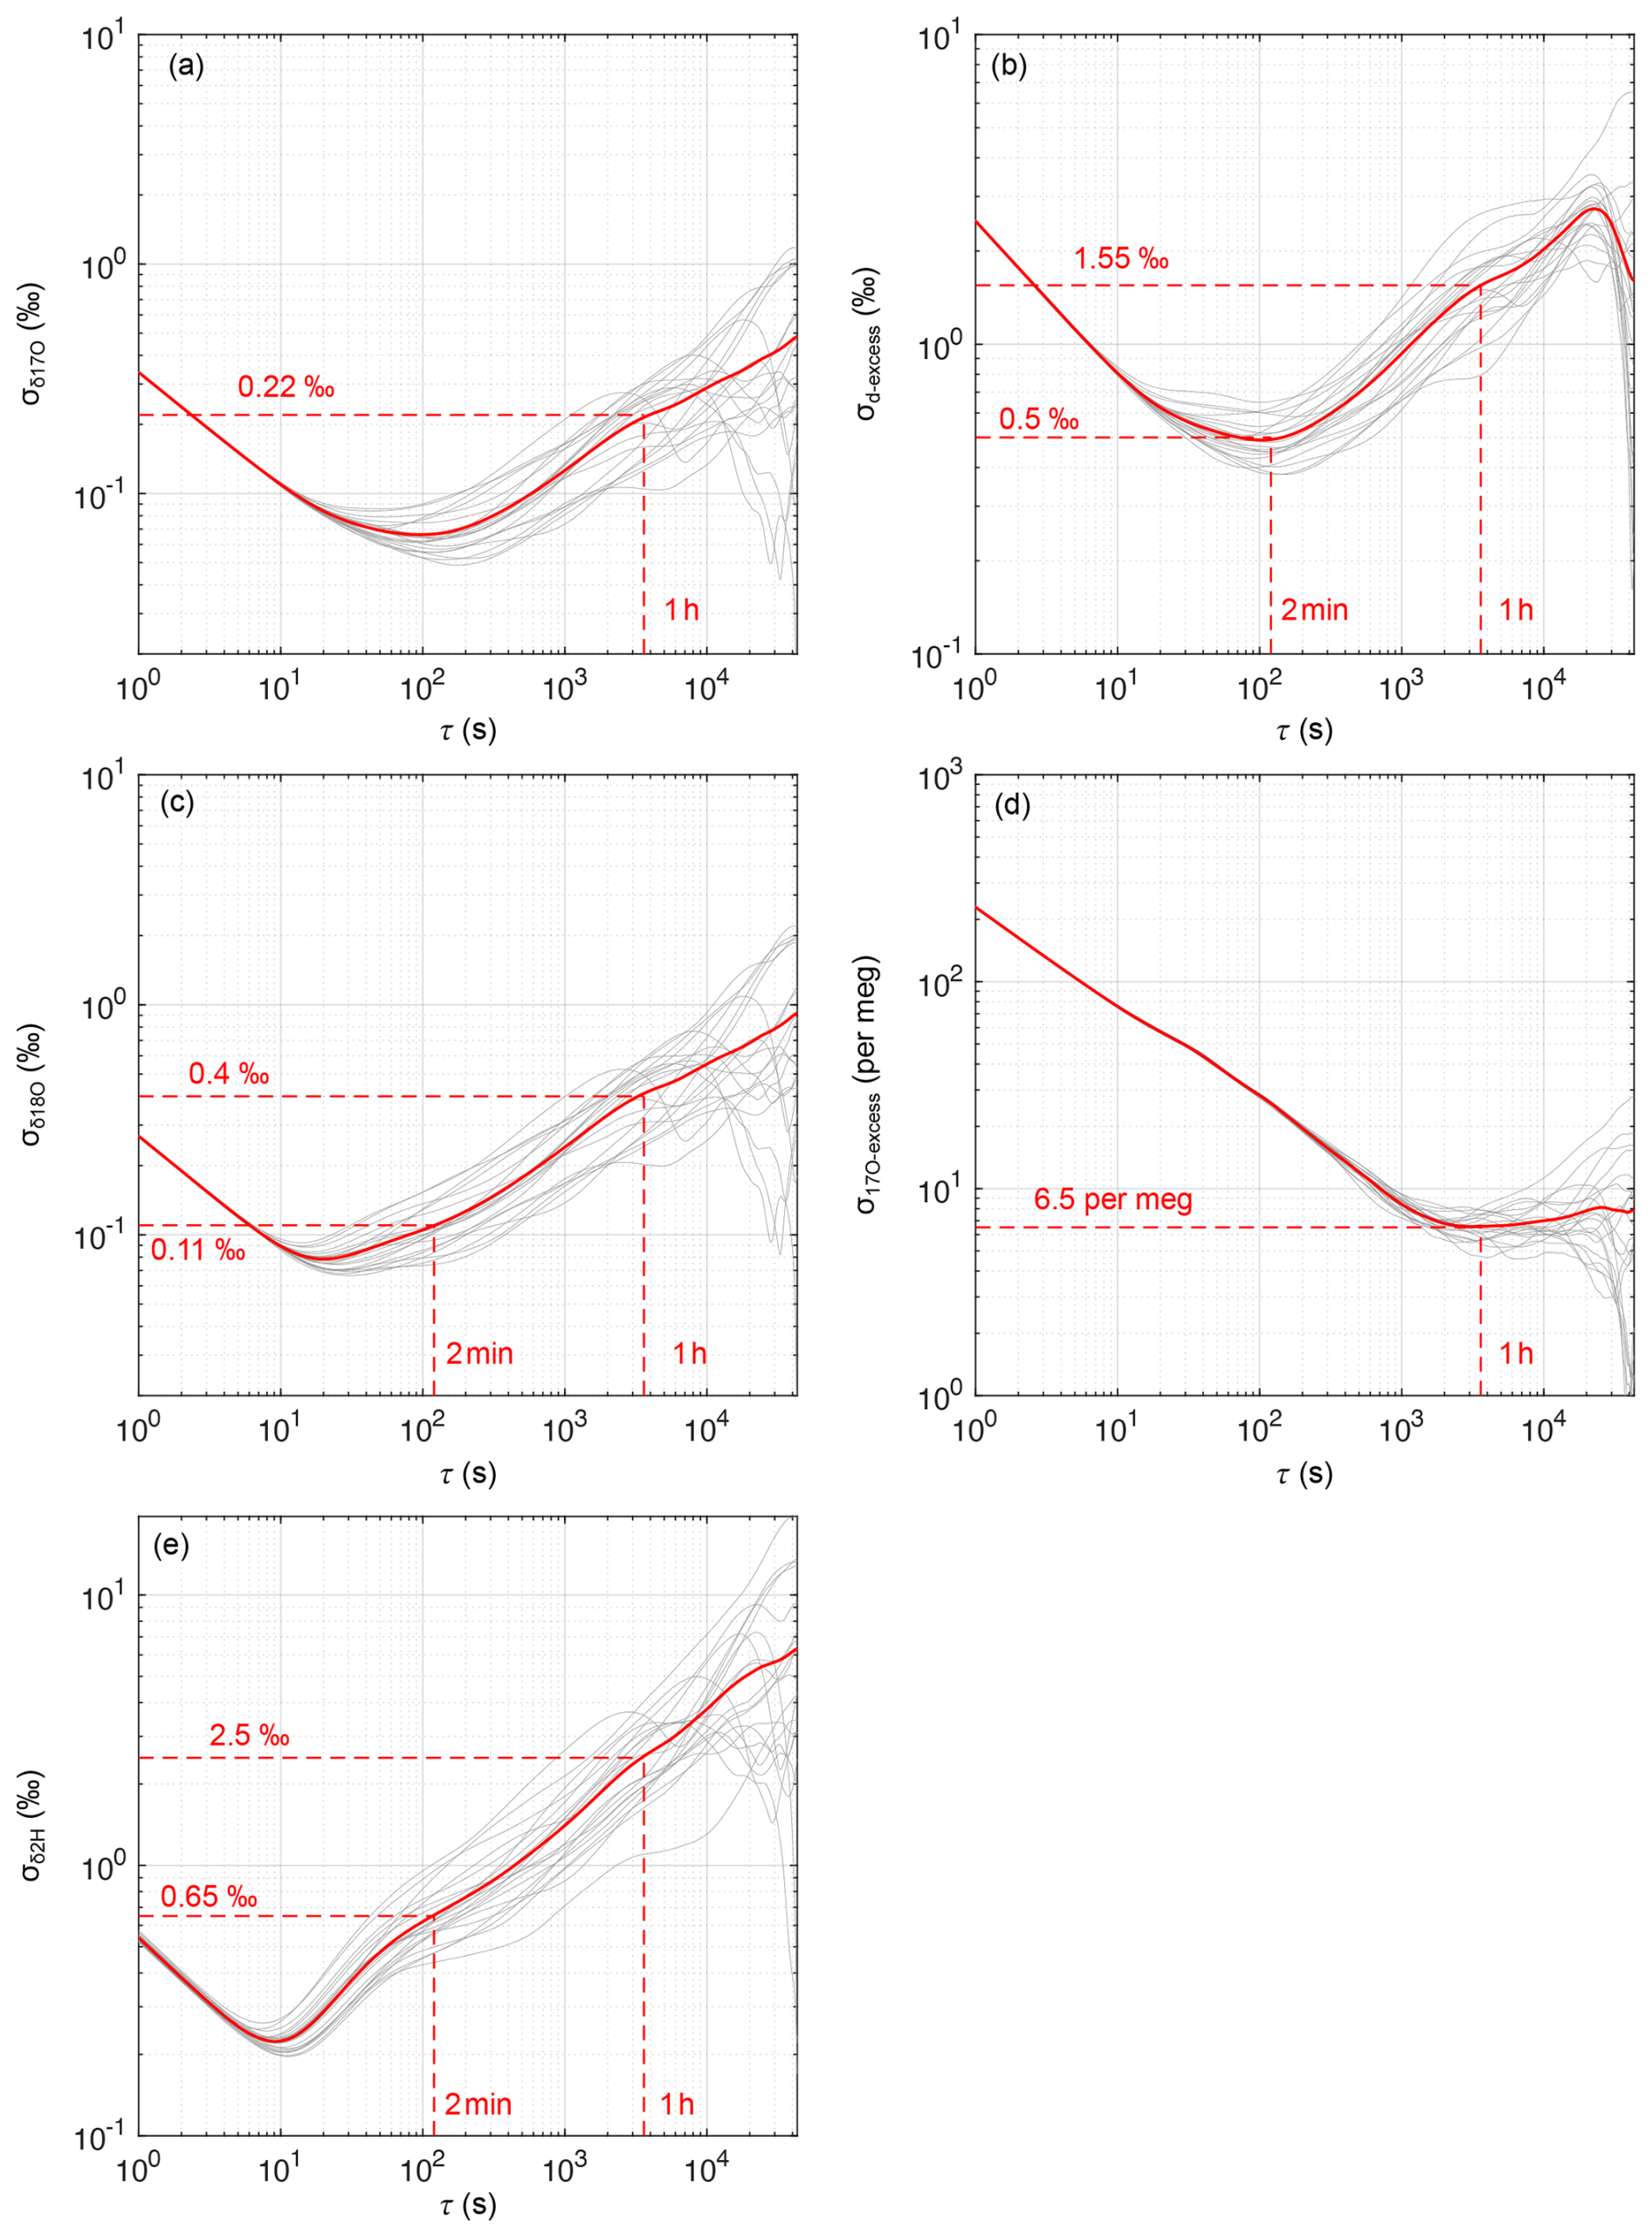
Figure A1Allan deviations σ for (a) δ17O, (c) δ18O, (e) δ2H, (b) d-excess and (d) 17O-excess for 24 h records of atmospheric water vapor at O3HP gathered between 1 June 2021 and 30 June 2021. The red solid curve illustrates the mean Allan deviations. Dashed lines and associated numbers indicate the Allan deviation for 1 h and 2 min averaging time, respectively.
Table B1Sample name, sample type, sampling date and isotopic composition of meteoric waters collected in this study. Samples from springs, wells and rivers in the surroundings of the study site were collected seasonally. Precipitation was collected monthly from June 2019 to December 2020, but on quasi-event scale in 2021. Given isotopic values for precipitation in 2021 represent amount-weighted monthly averages. In addition, the amount-weighted average isotopic values and standard deviations for precipitation in 2020, 2021 and over the whole dataset are given.
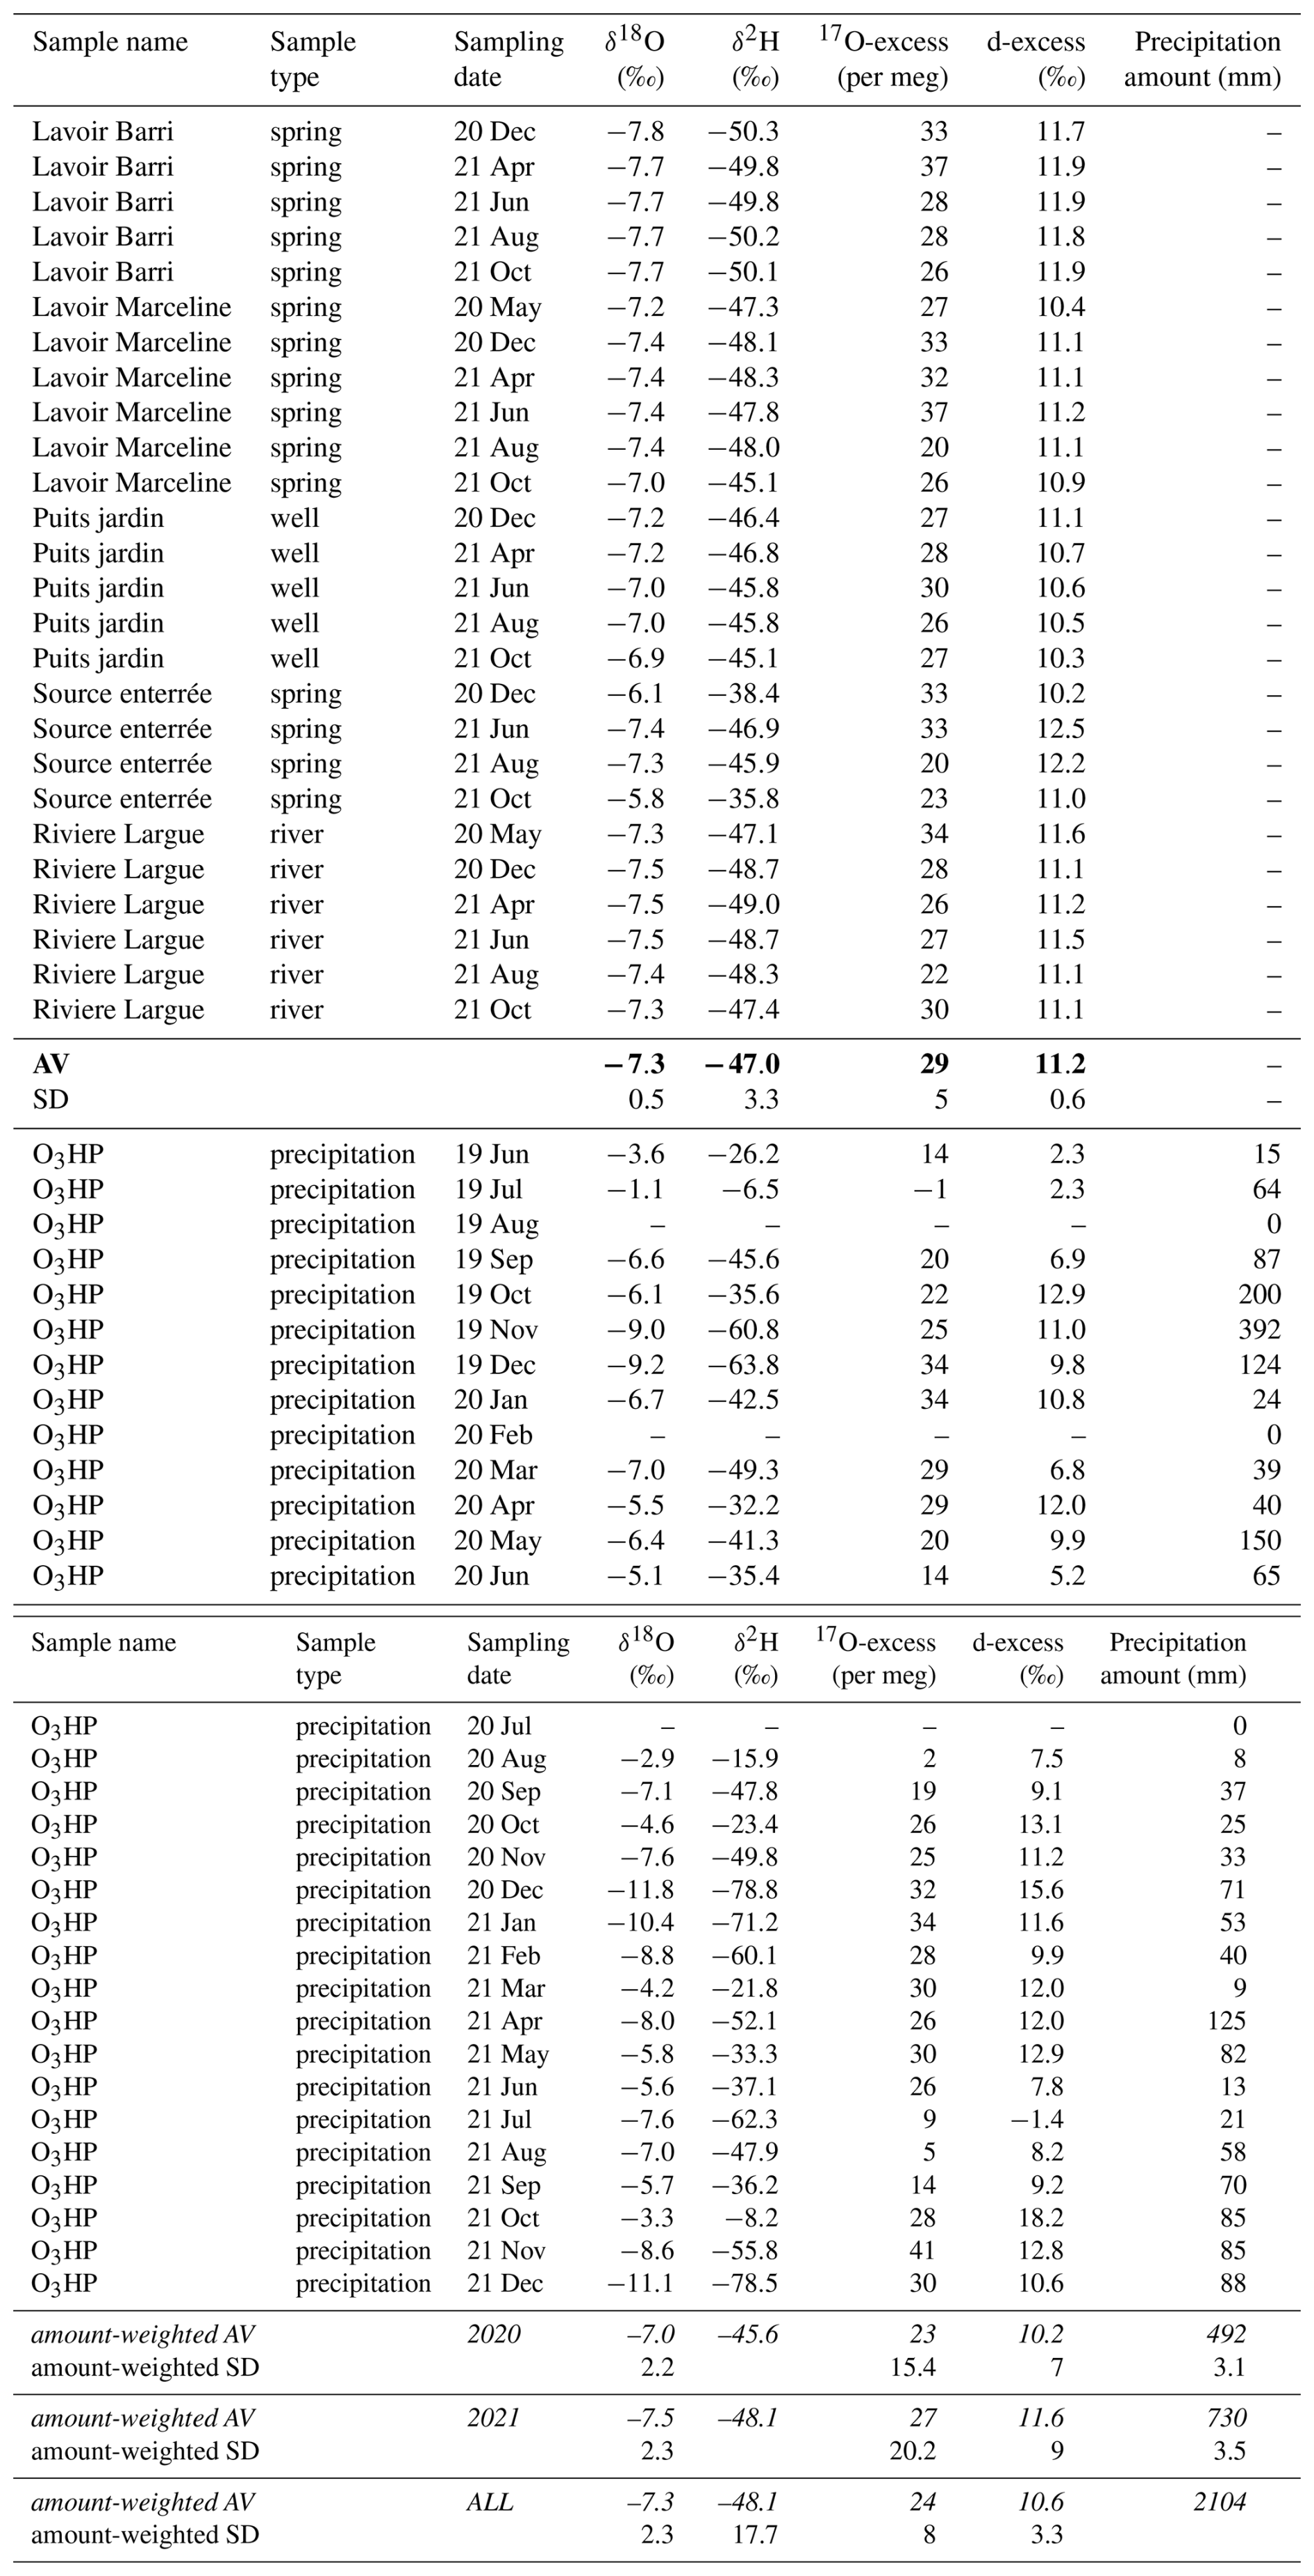
Table B2Monthly and annual average isotopic composition of atmospheric water vapor at 12.5 m a.g.l. (V) and water vapor estimated from isotopic equilibrium with monthly amount-weighted precipitation data (Veq) for the period from January to December 2021.
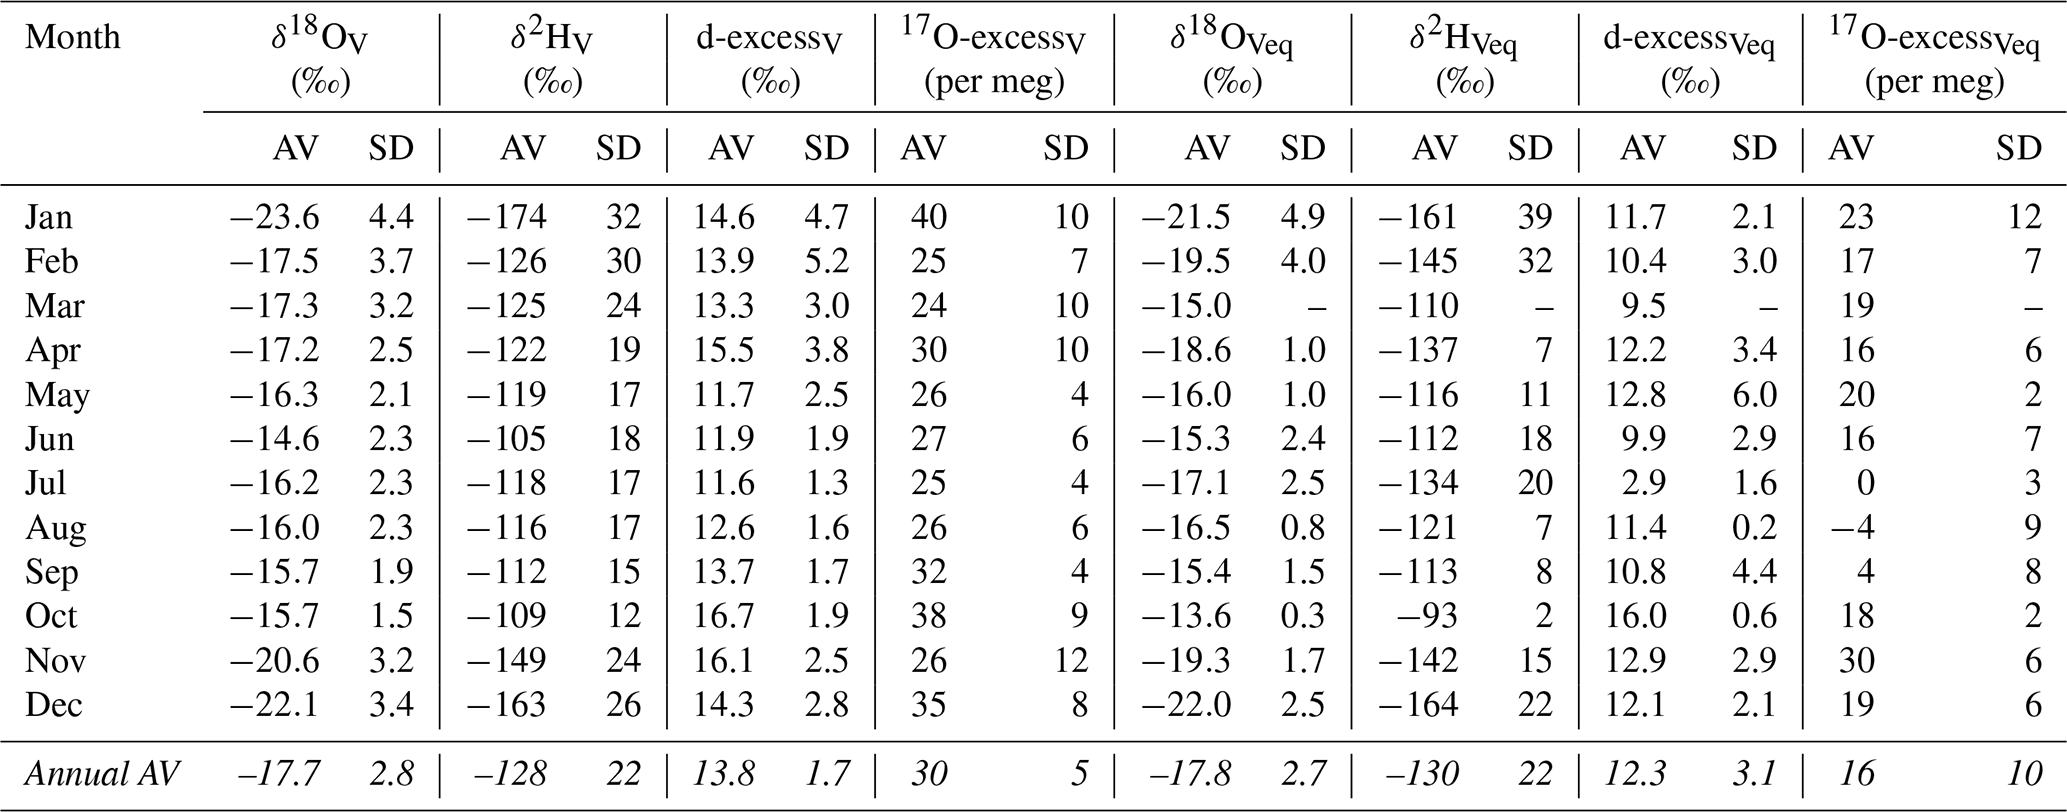
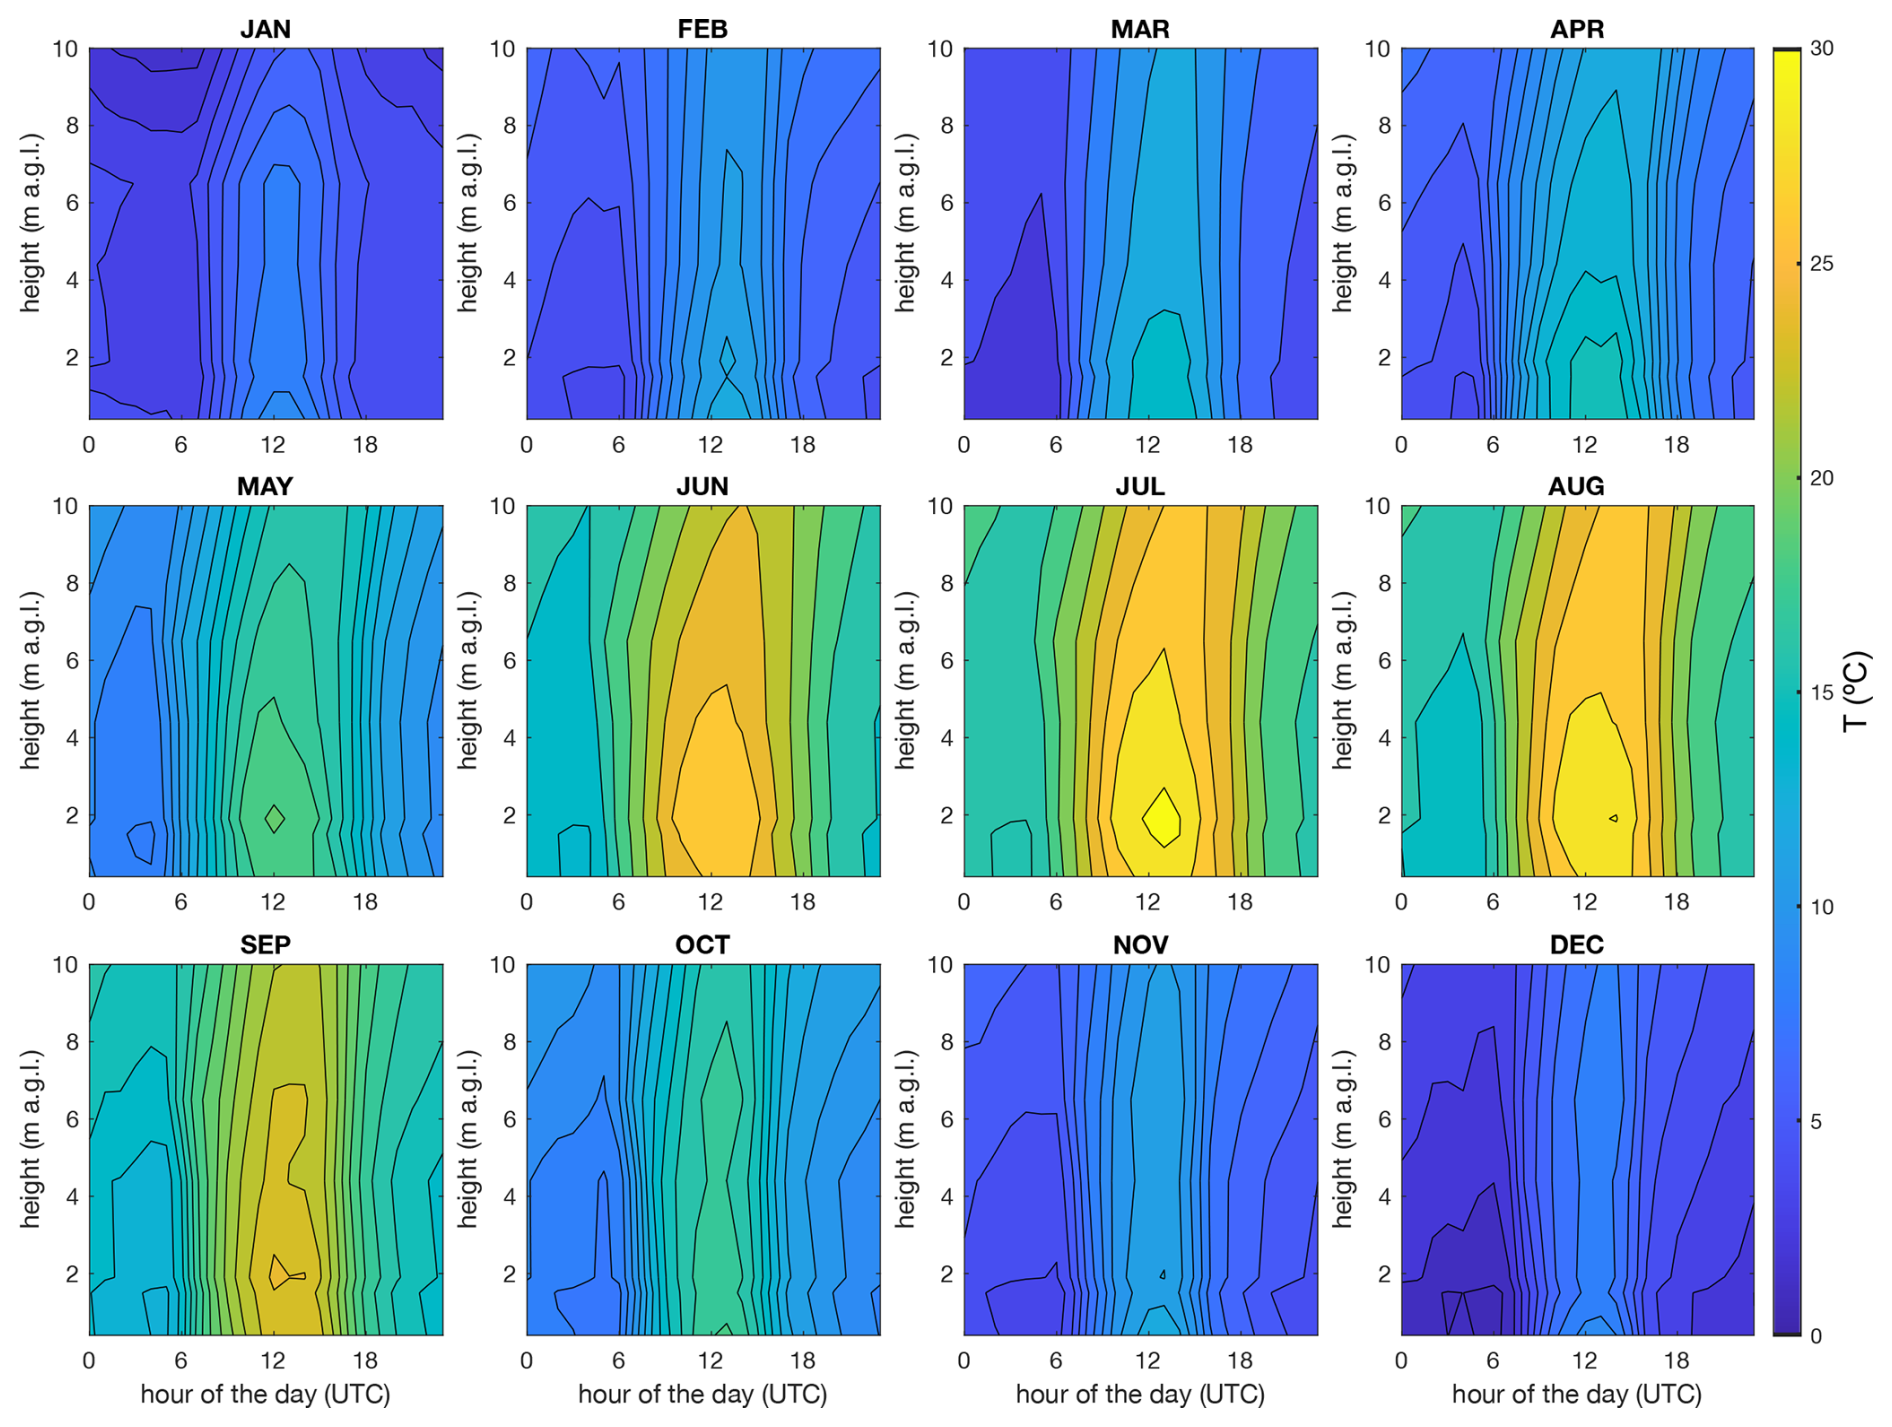
Figure B1Monthly average variability of atmospheric temperature in the near-surface atmosphere over the day. Temperature measurements at 0.4, 1.5, 1.9, 4.4, 6.15 and 10 m a.g.l. were obtained from the O3HP database (Reiter et al., 2015). Data were linearly interpolated between measurement heights, and the hourly means were computed for each month.
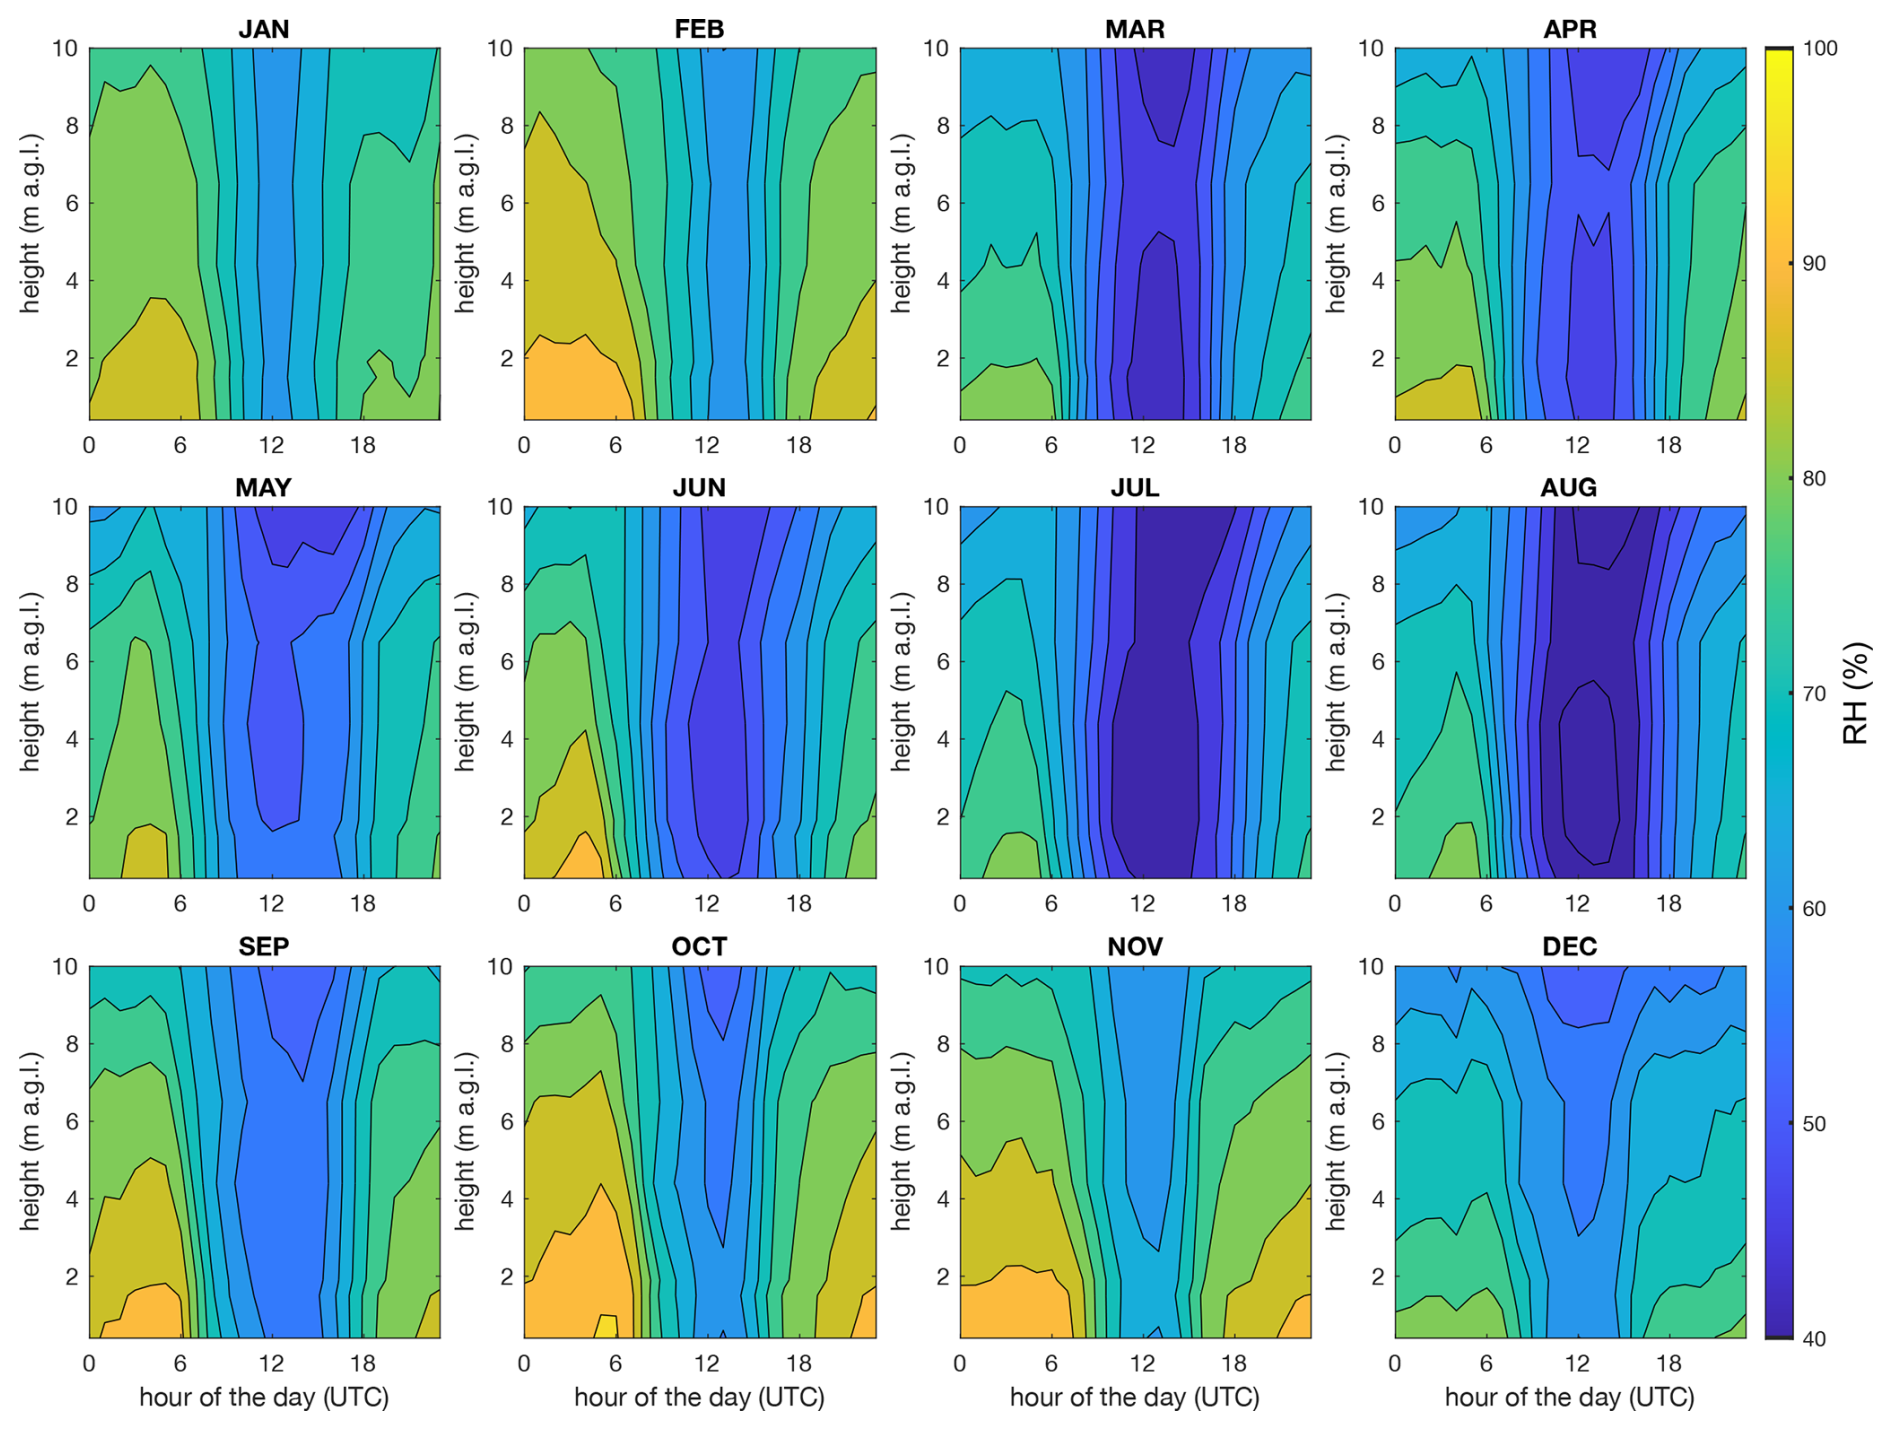
Figure B2Monthly average variability of atmospheric relative humidity in the near-surface atmosphere over the day. Relative humidity measurements at 0.4, 1.5, 1.9, 4.4, 6.15 and 10 m a.g.l. were obtained from the O3HP database (Reiter et al., 2015). Data were linearly interpolated between measurement heights, and the hourly means were computed for each month.
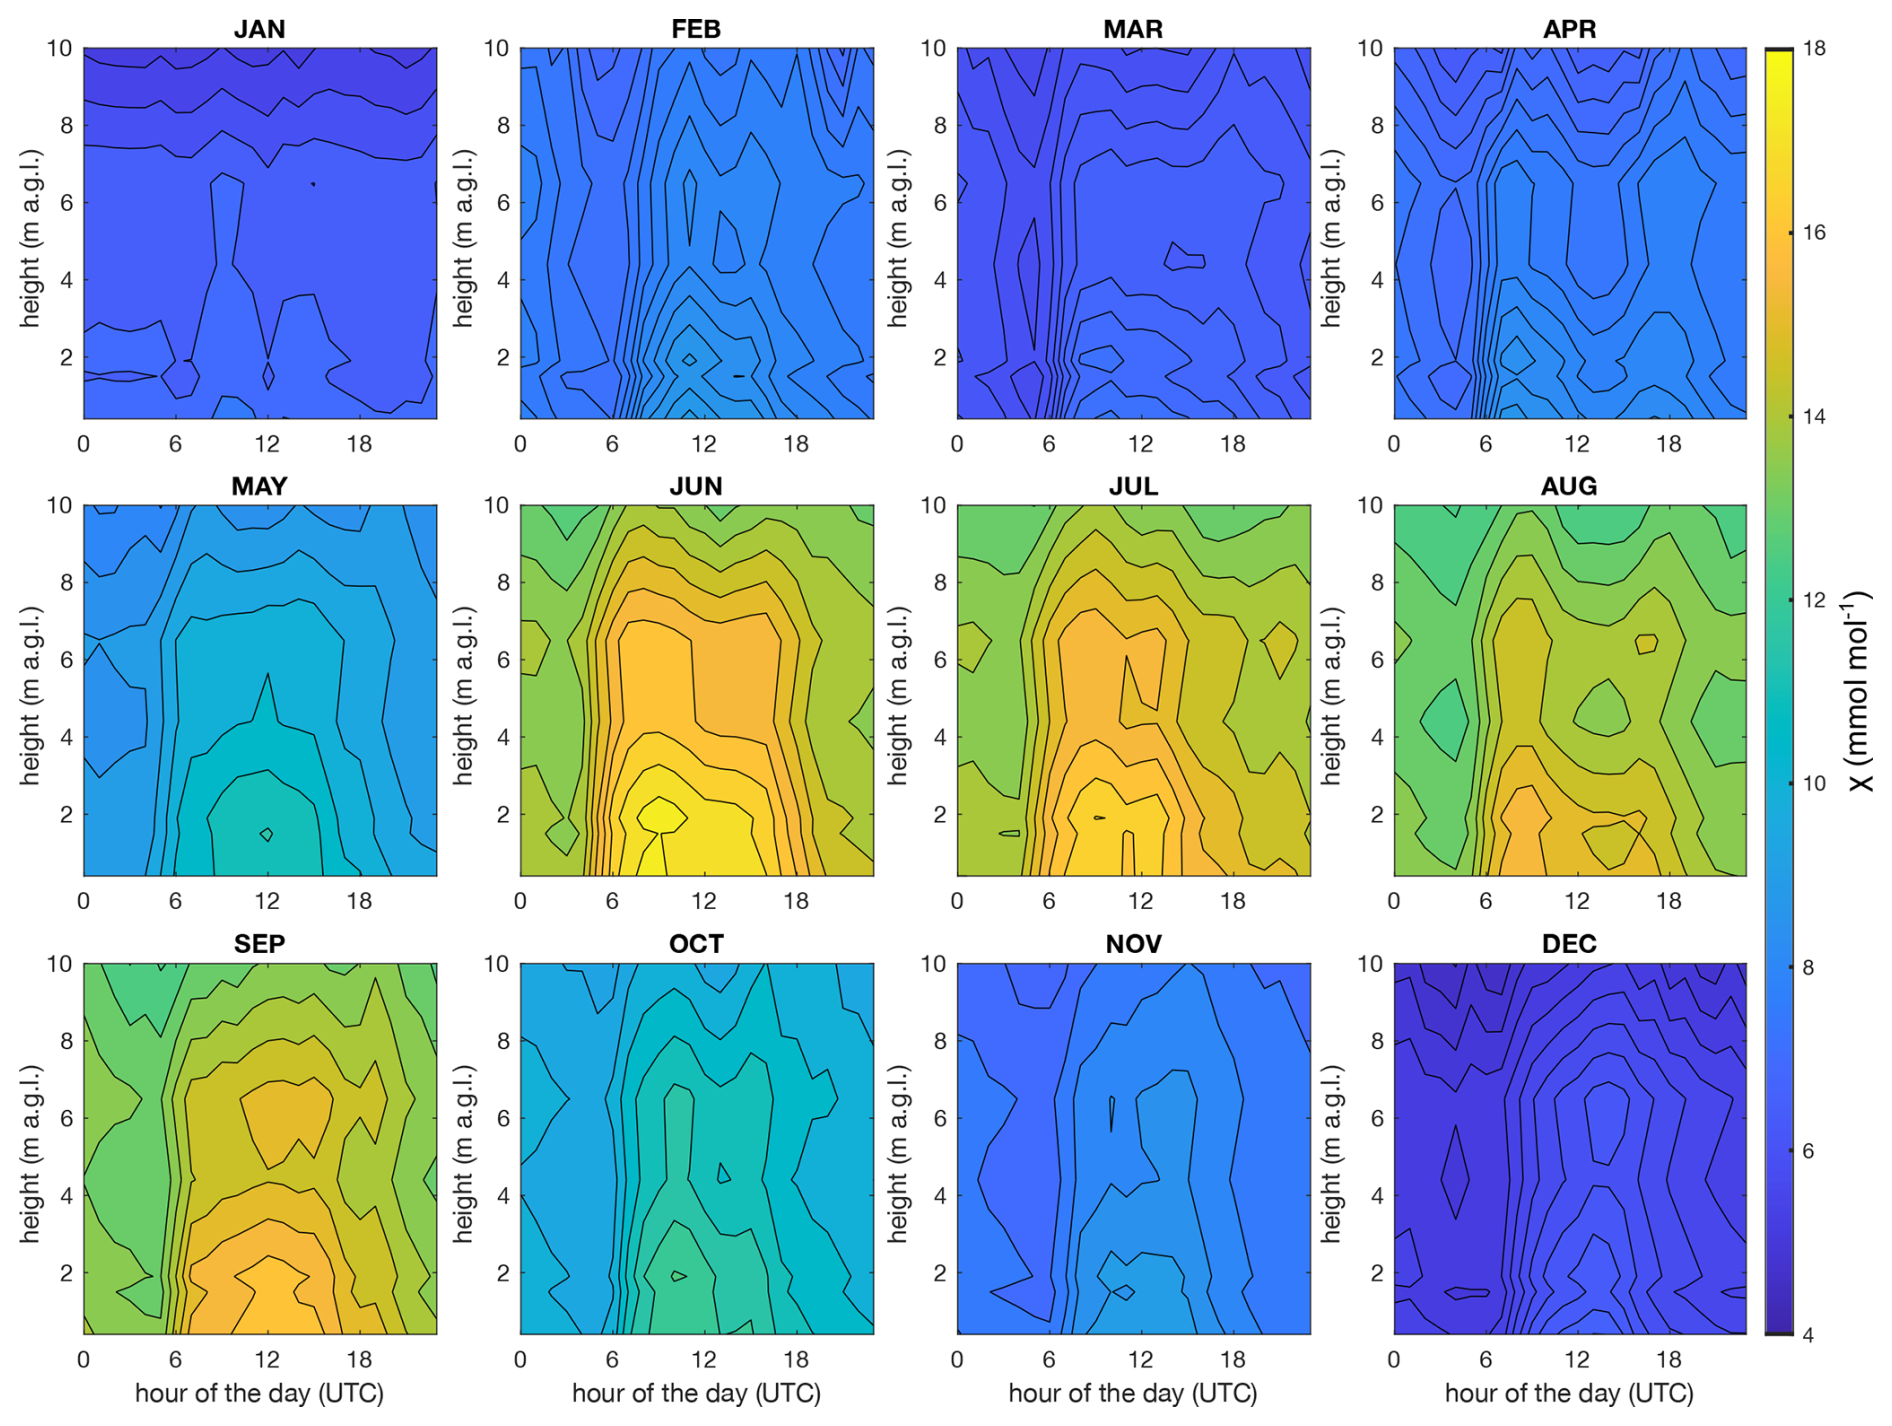
Figure B3Monthly average variability of the atmospheric water mixing ratio in the near-surface atmosphere over the day. Measurements of atmospheric temperature and relative humidity at 0.4, 1.5, 1.9, 4.4, 6.15, and 10 m a.g.l. were obtained from the O3HP database (Reiter et al., 2015). The atmospheric water mixing ratio was calculated from these data, linearly interpolated between heights, and averaged hourly for each month.
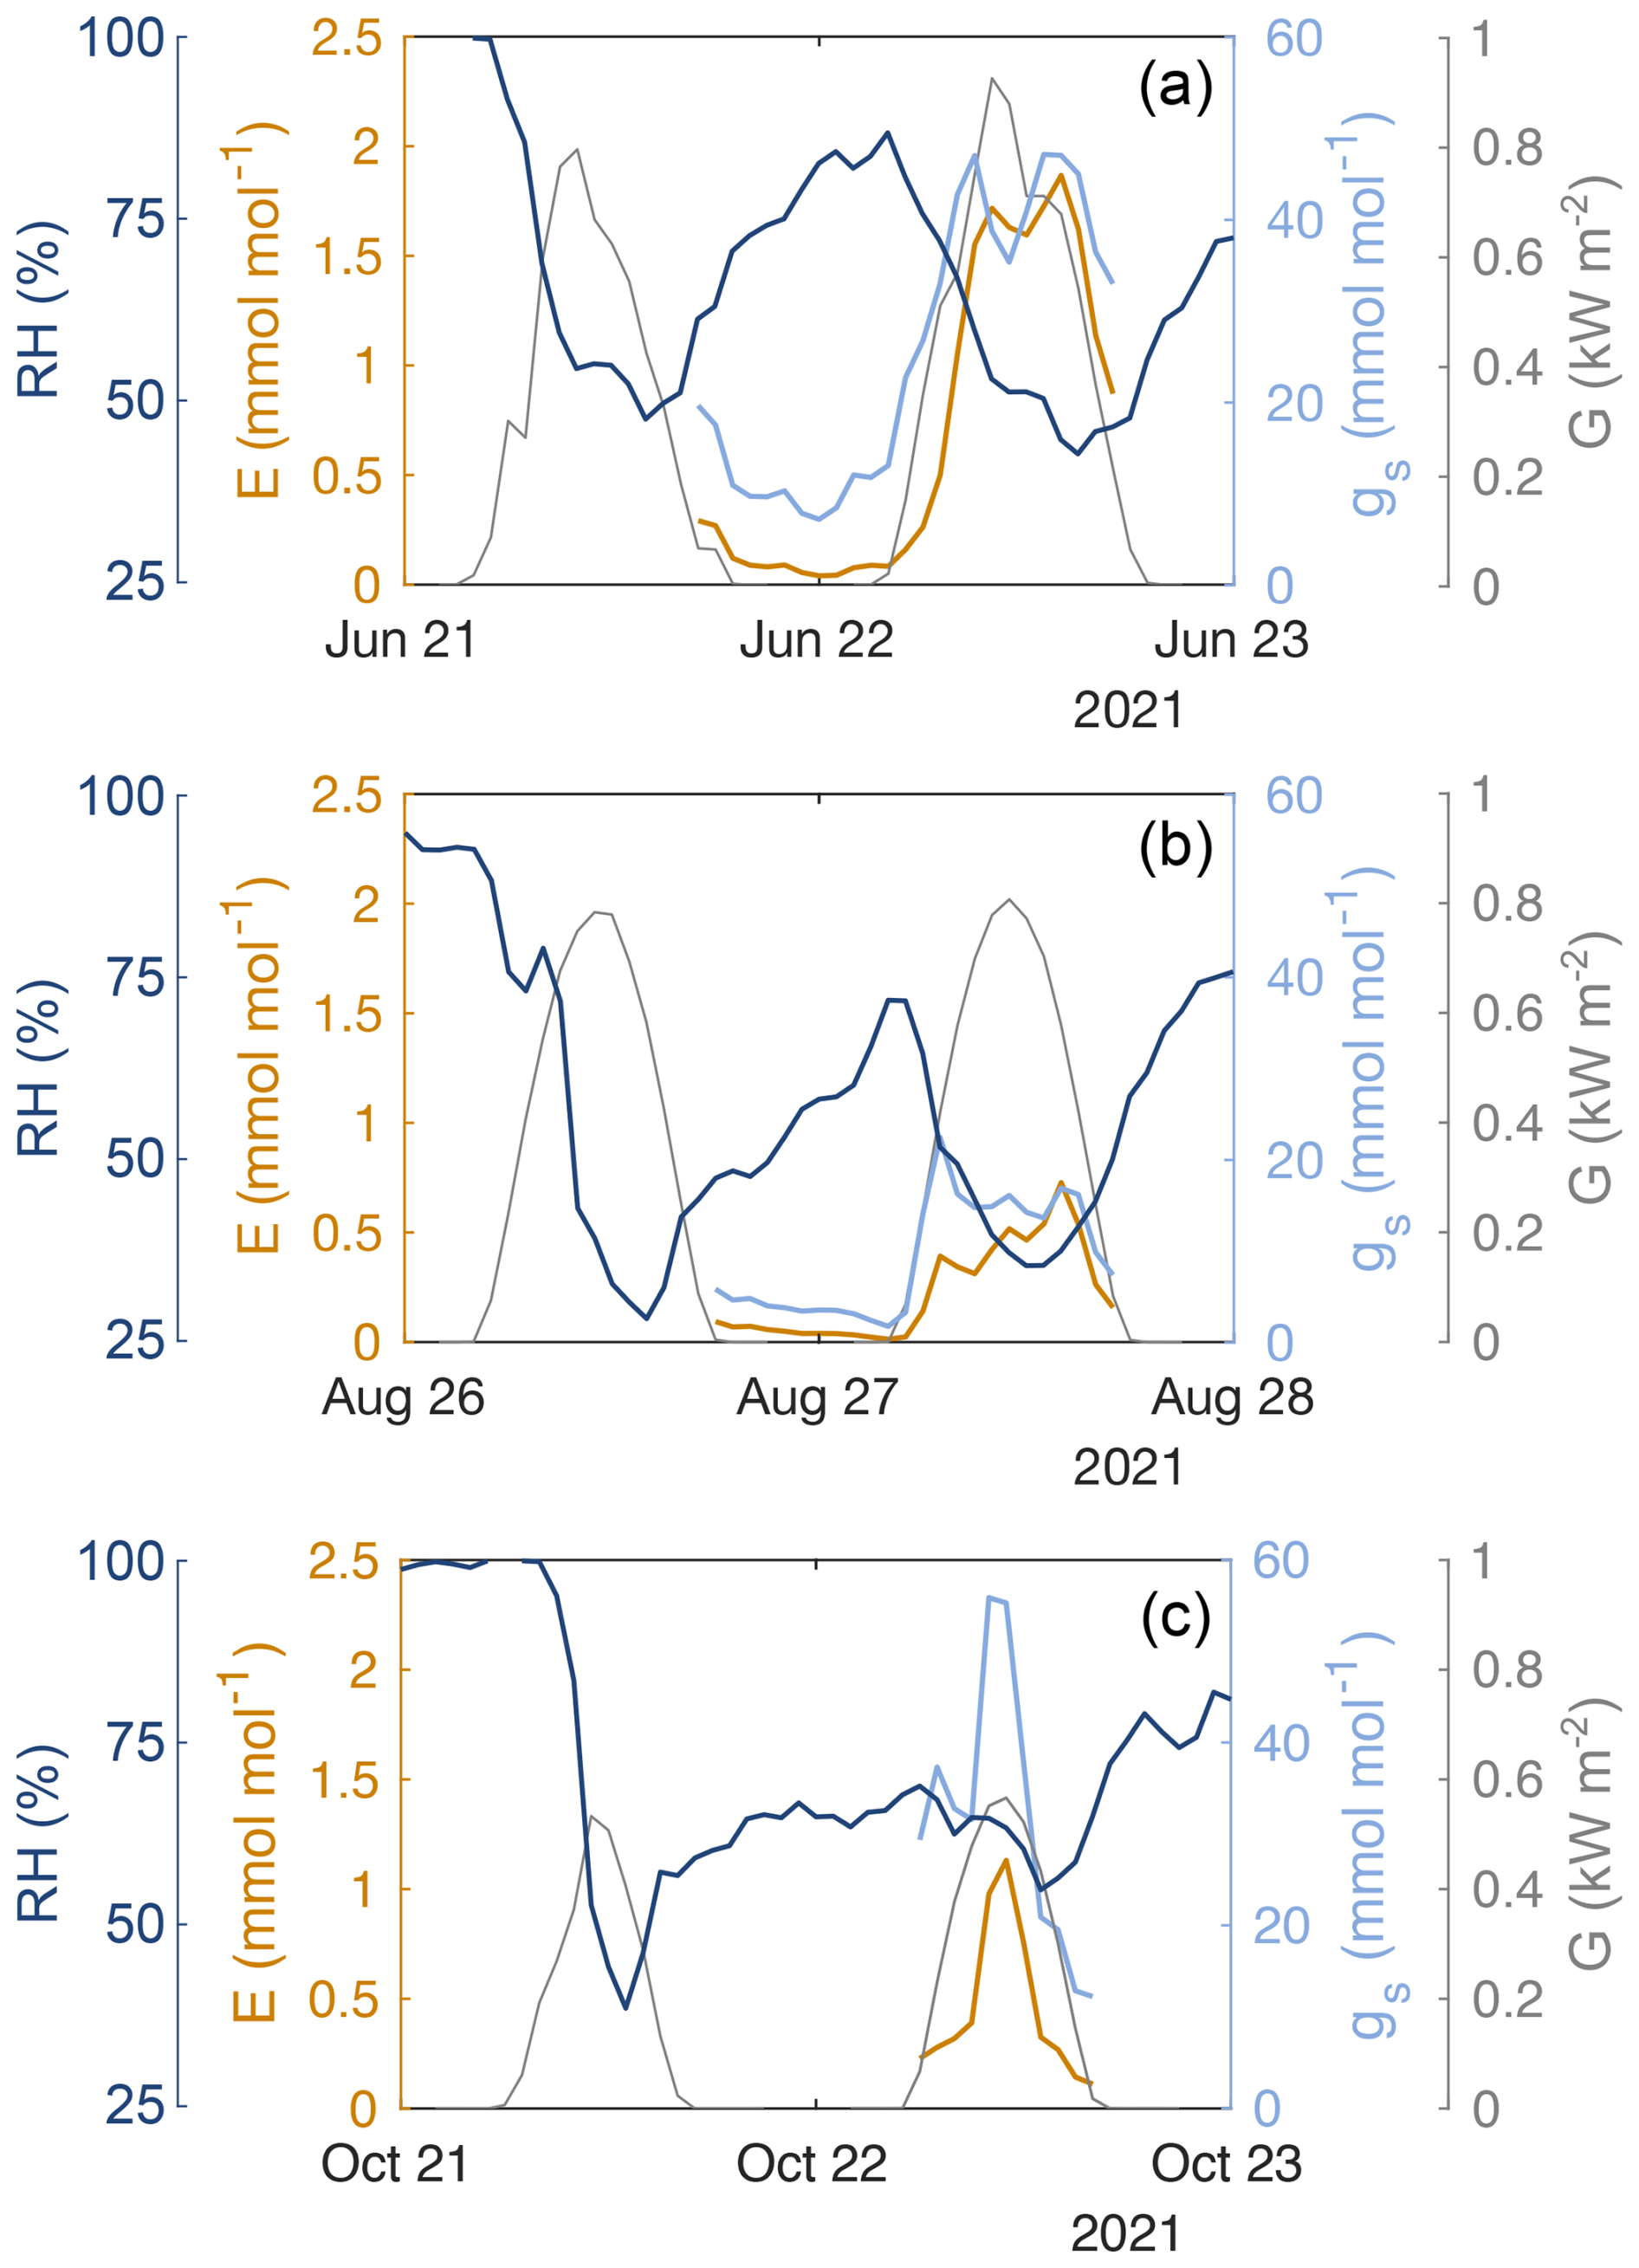
Figure B4Diurnal evolution of transpiration (E) and stomatal conductance (gs) of individual oak leaves in the sun-crown of the forest canopy in different stages of the oak forest growing season: (a) early stage, (b) dry stage, (c) last stage. The diurnal cycle of global solar radiation (G, grey curve) and relative humidity (RH) are shown for comparison.
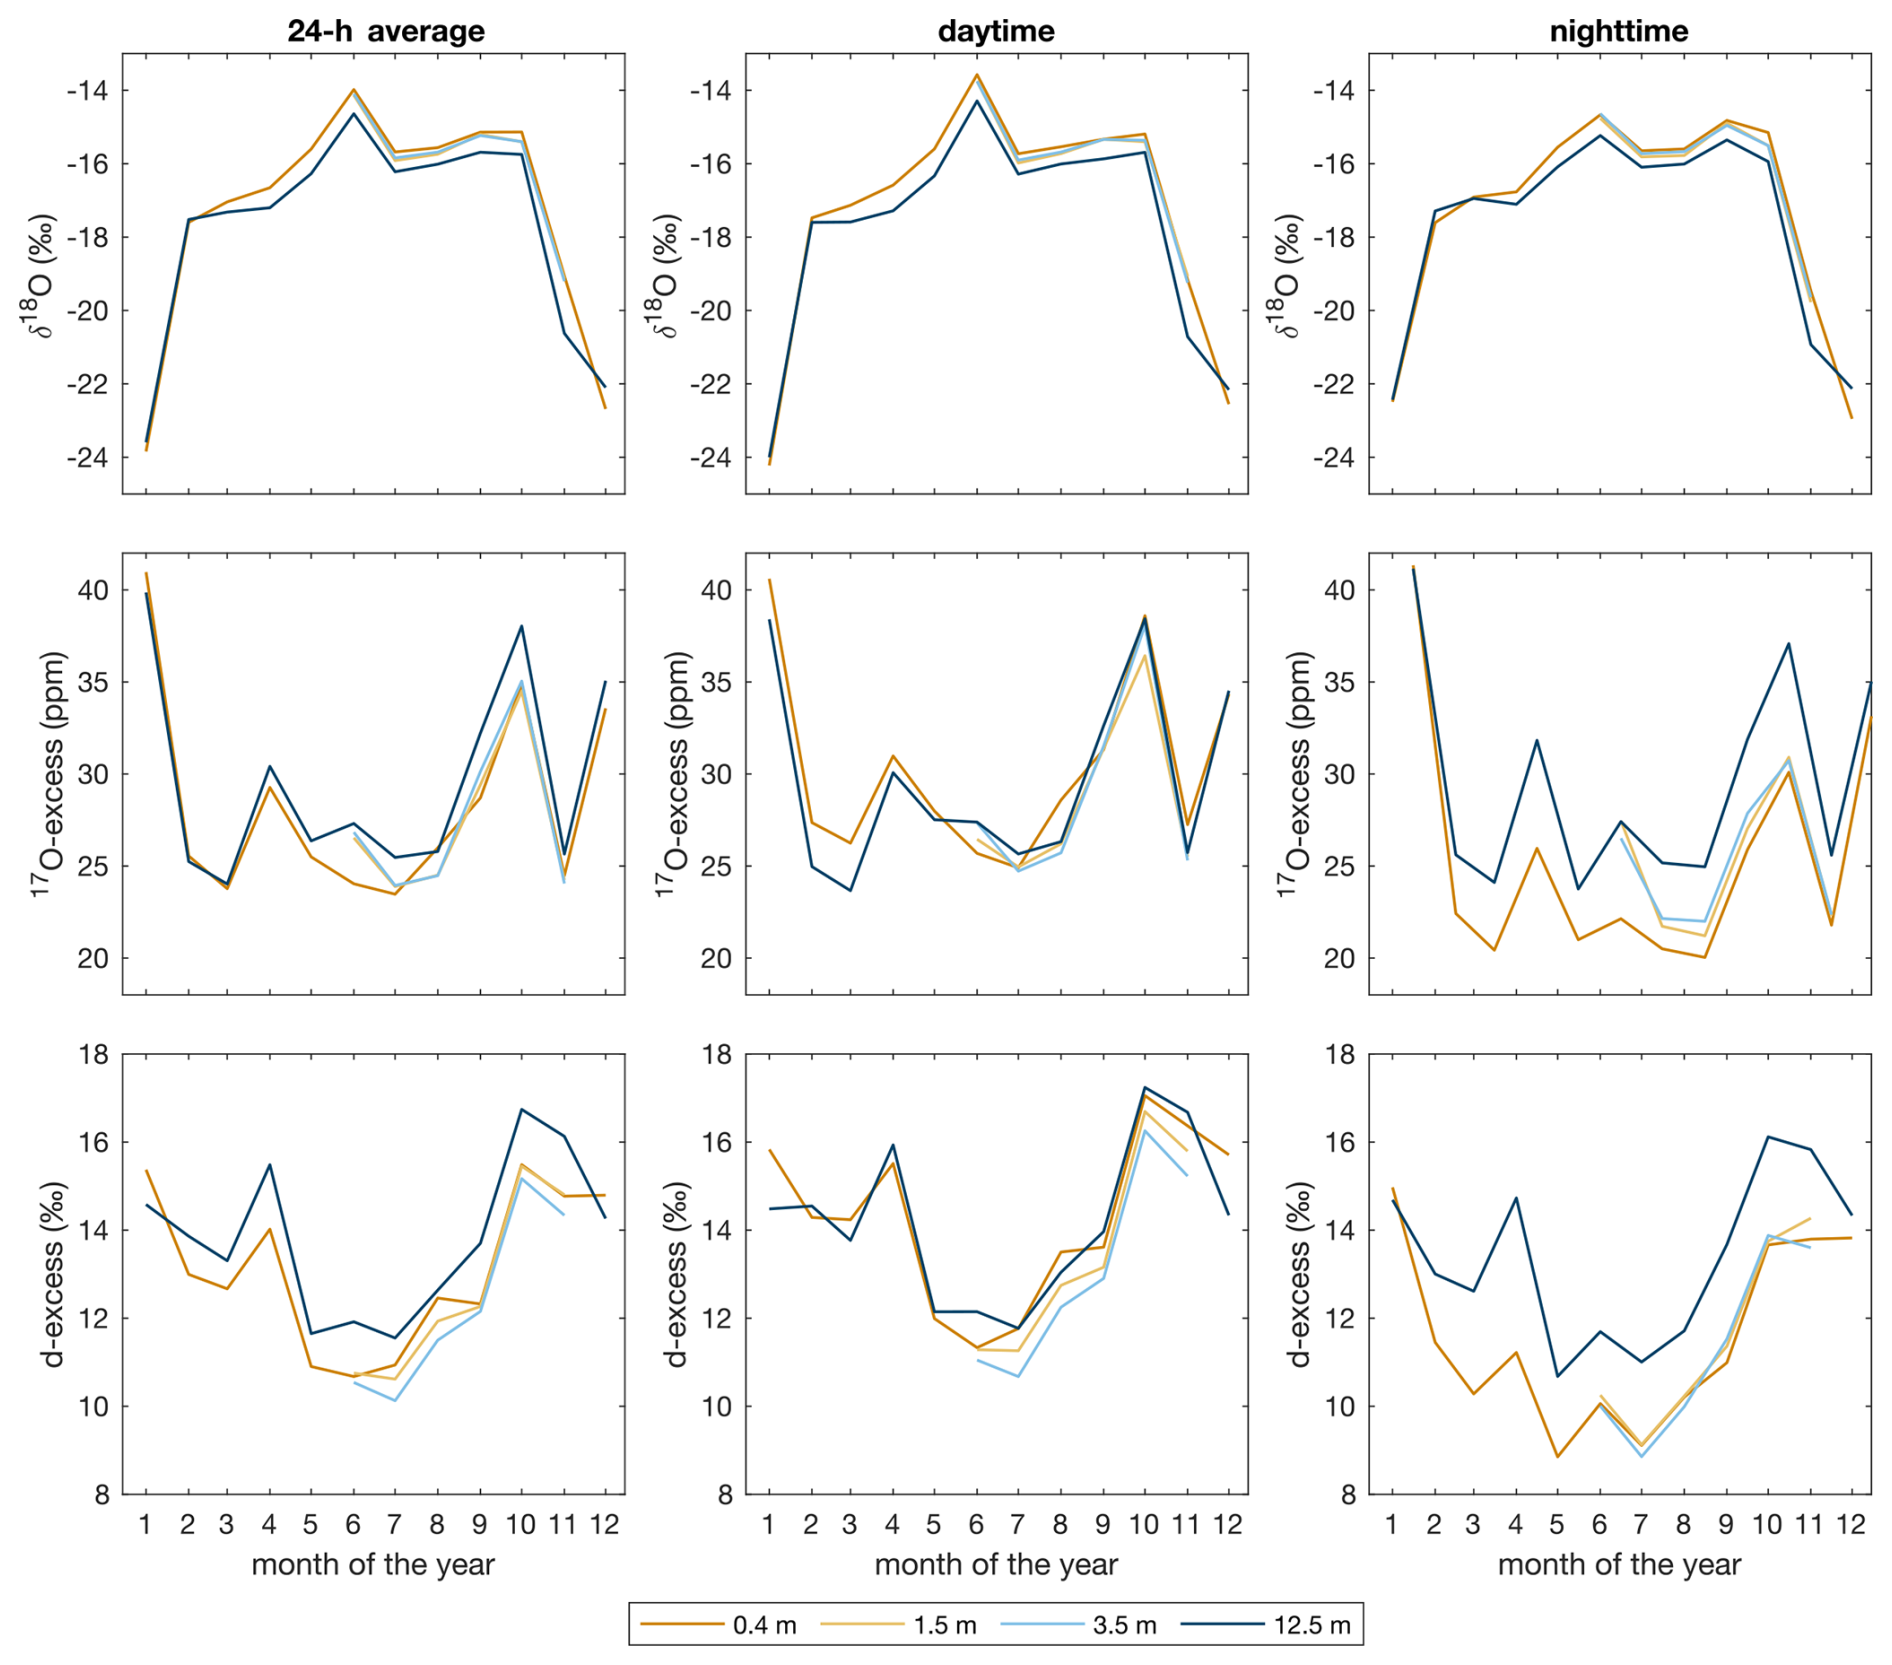
Figure B5Monthly average of δ18O, 17O-excess and d-excess of atmospheric water vapor at different heights above ground level (a.g.l.) in 2021 for daily, daytime and night-time conditions. Atmospheric water vapor at 1.5 and 3.5 m a.g.l. was monitored continuously only from June to November 2021, in relation to the oak forest growing season. Therefore, for these heights no isotopic data is available from January to May and December 2021.
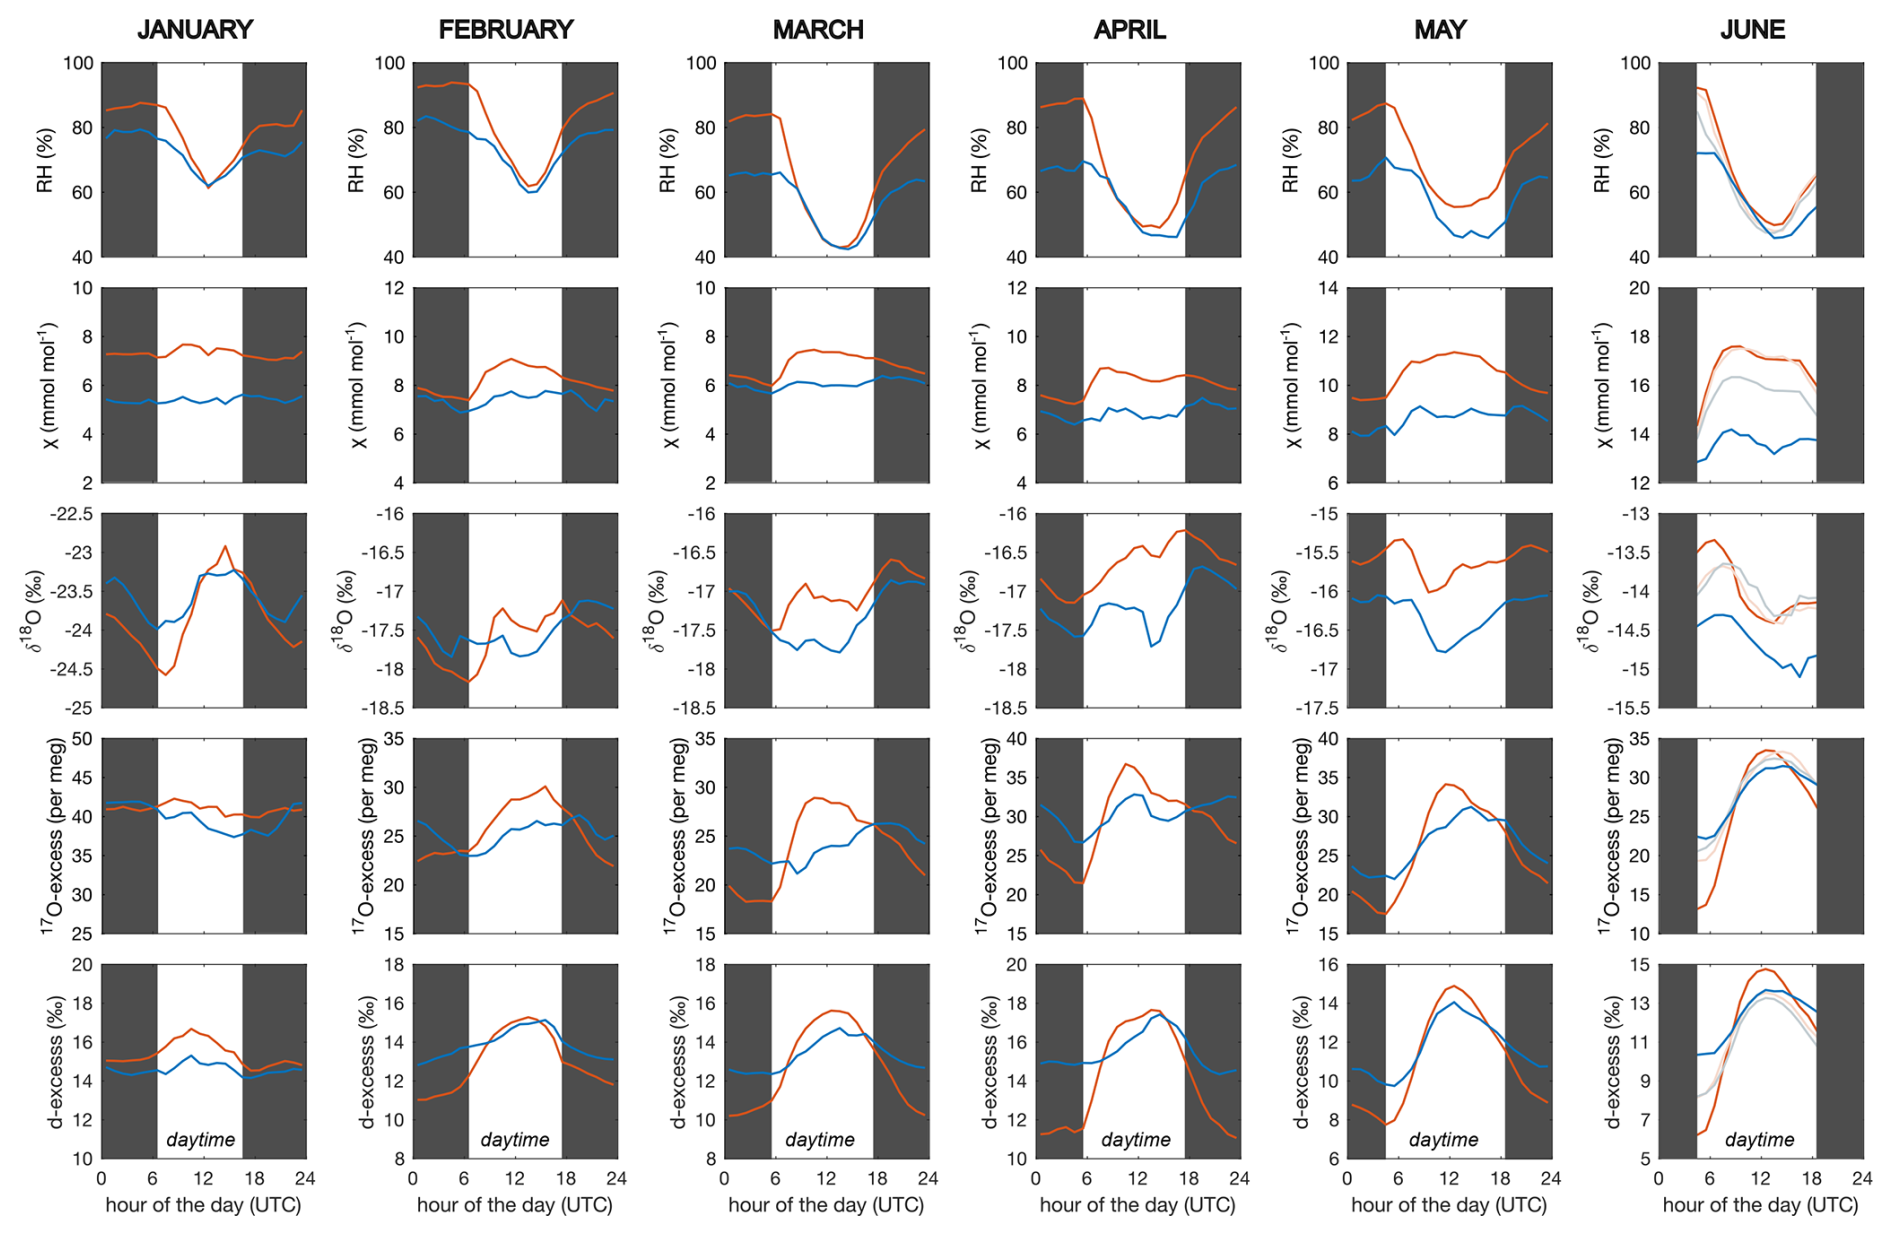
Figure B6Monthly average diurnal cycle of relative humidity (RH), atmospheric water mixing ratio (χ) and δ18O, d-excess and 17O-excess of atmospheric water vapor at different measurements heights above the grass plot (red) and below (pale), within (grey) and above (blue) the oak forest canopy for January to June 2021. The grey shaded areas indicate the night-time periods.
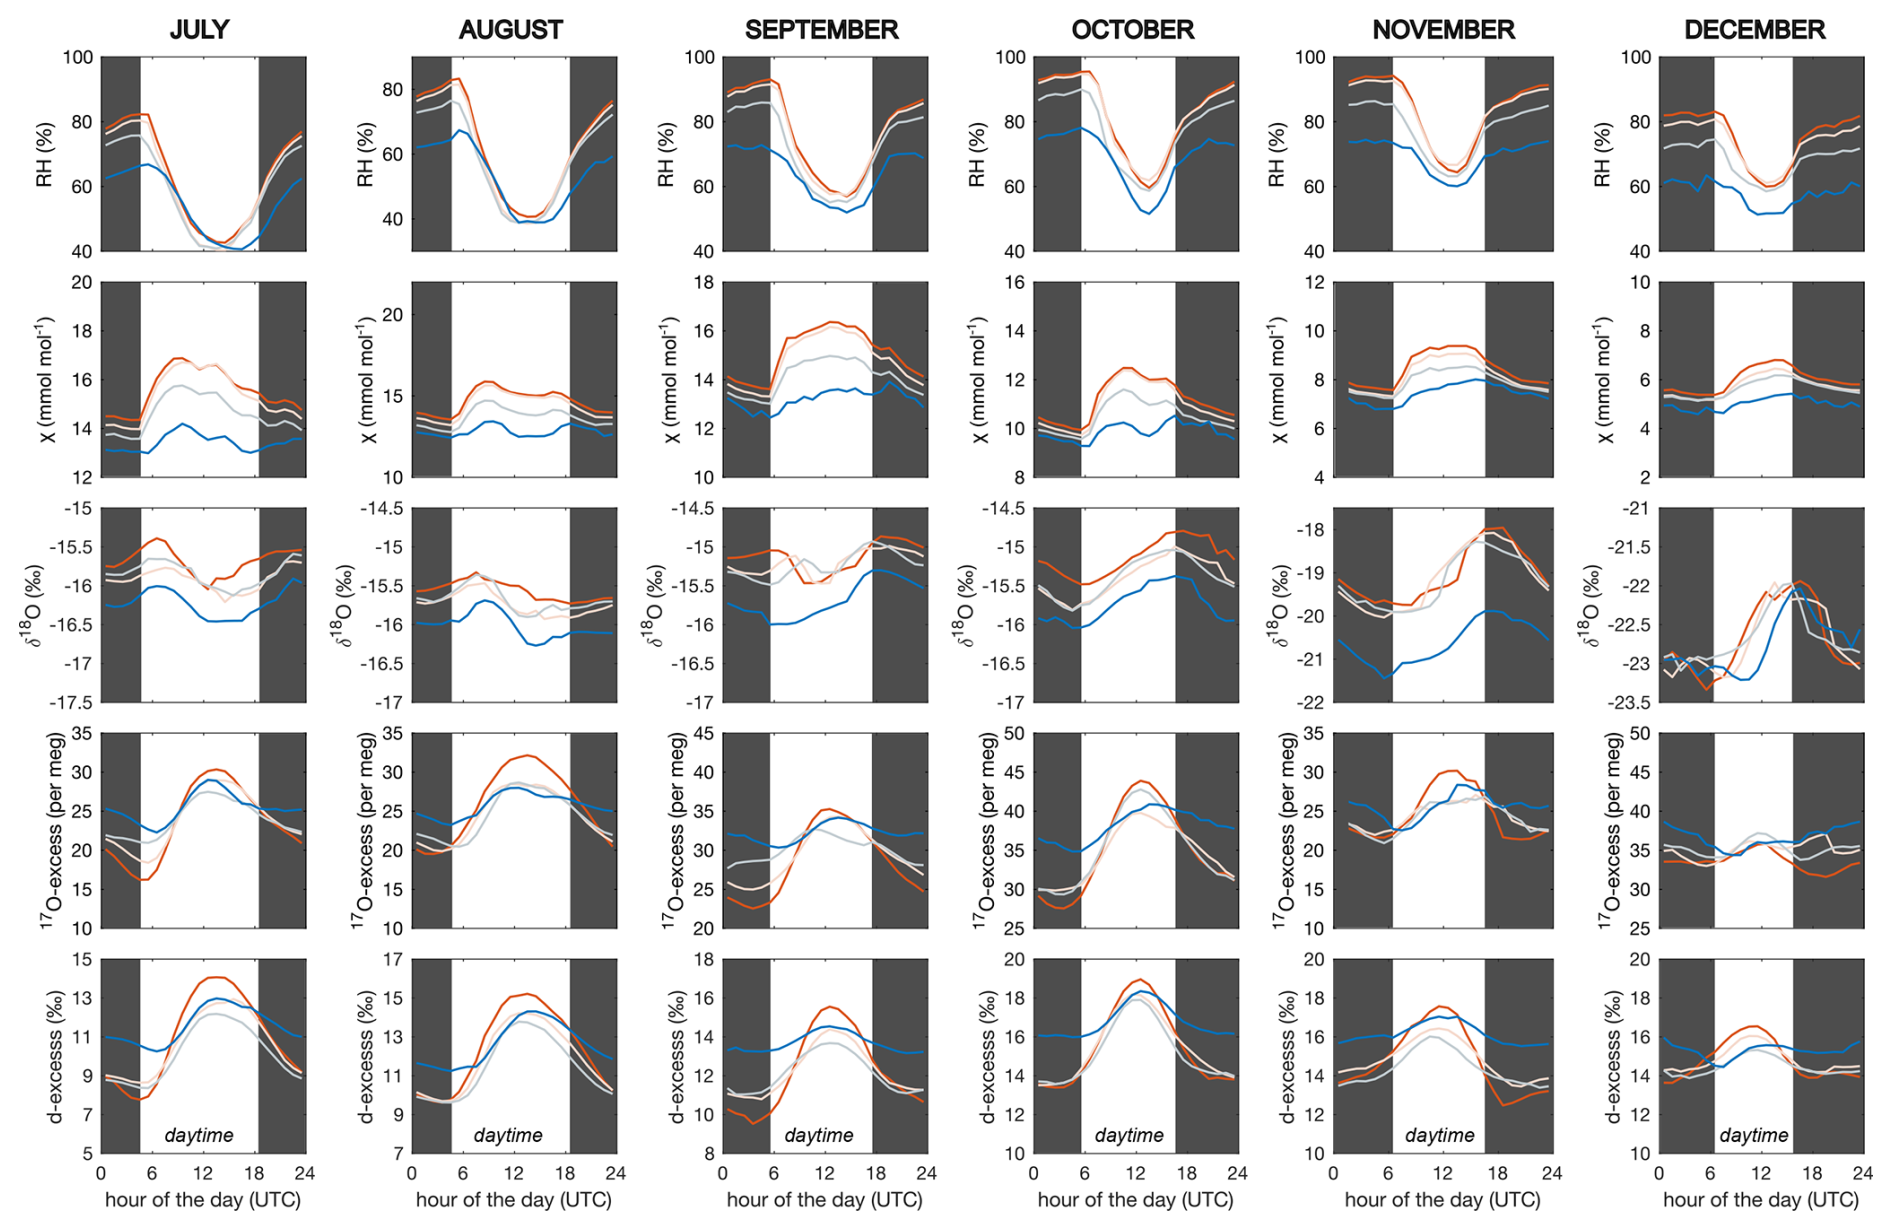
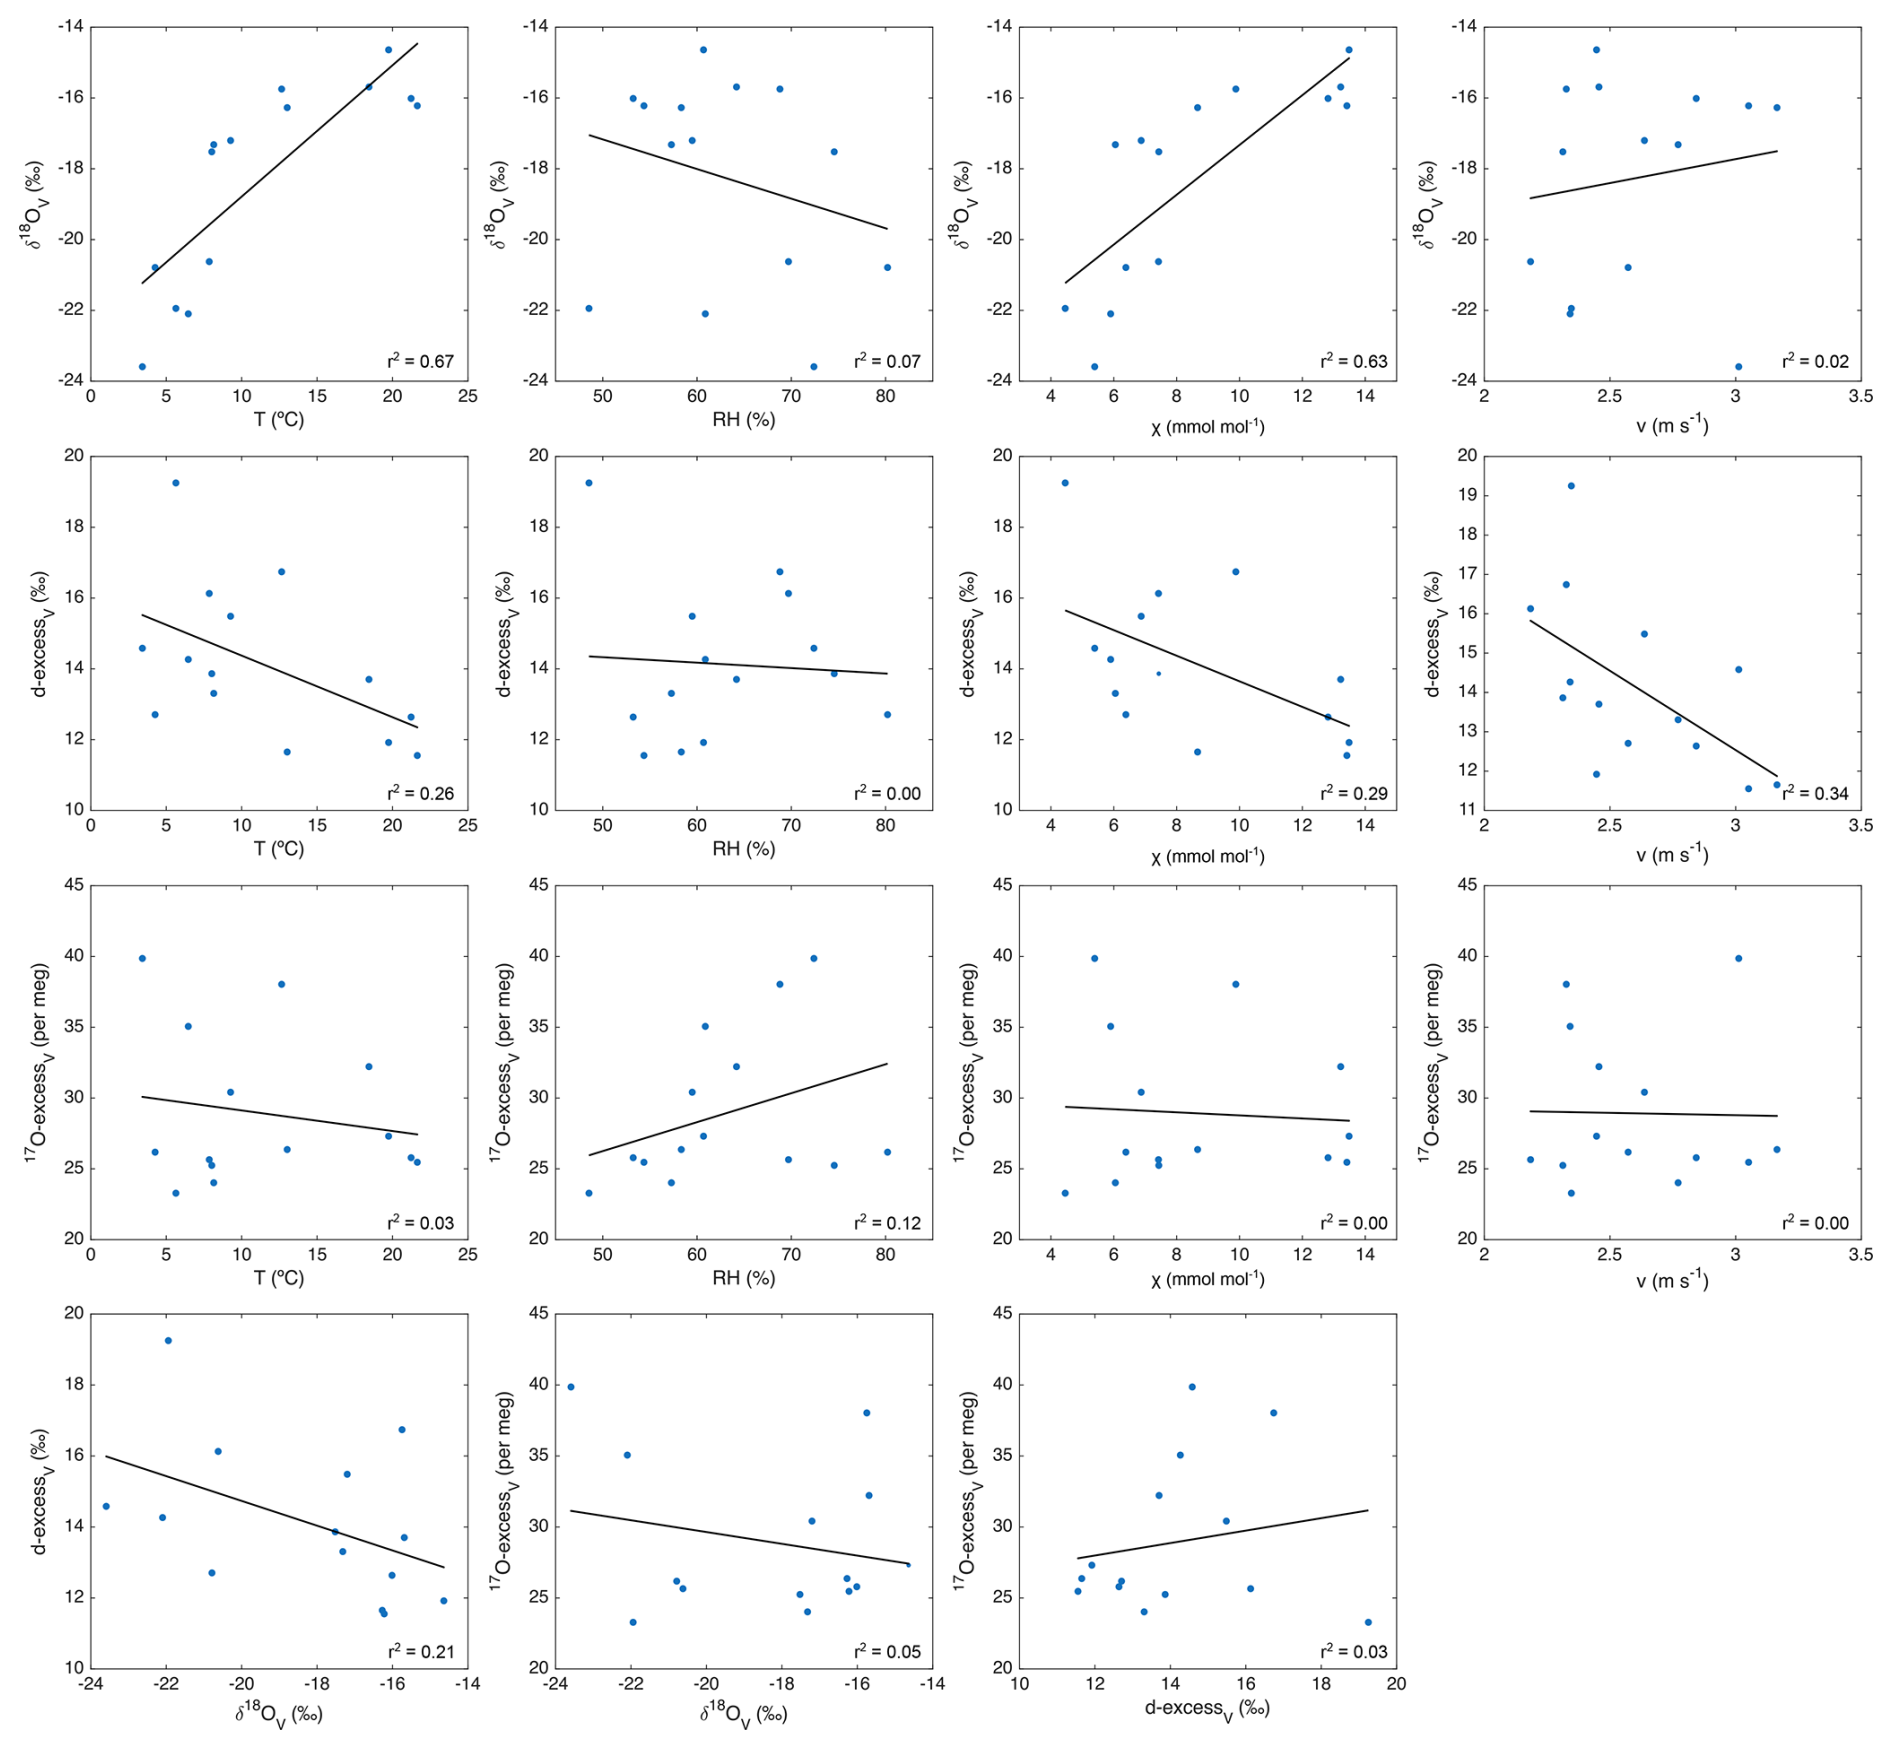
Figure B8Correlations observed between monthly average δ18O, d-excess and 17O-excess of atmospheric water vapor measured at 12.5 m a.g.l. and relative humidity (RH), atmospheric temperature (Tair), the atmospheric water mixing ratio (χ) and wind speed (v) at 10 m a.g.l.
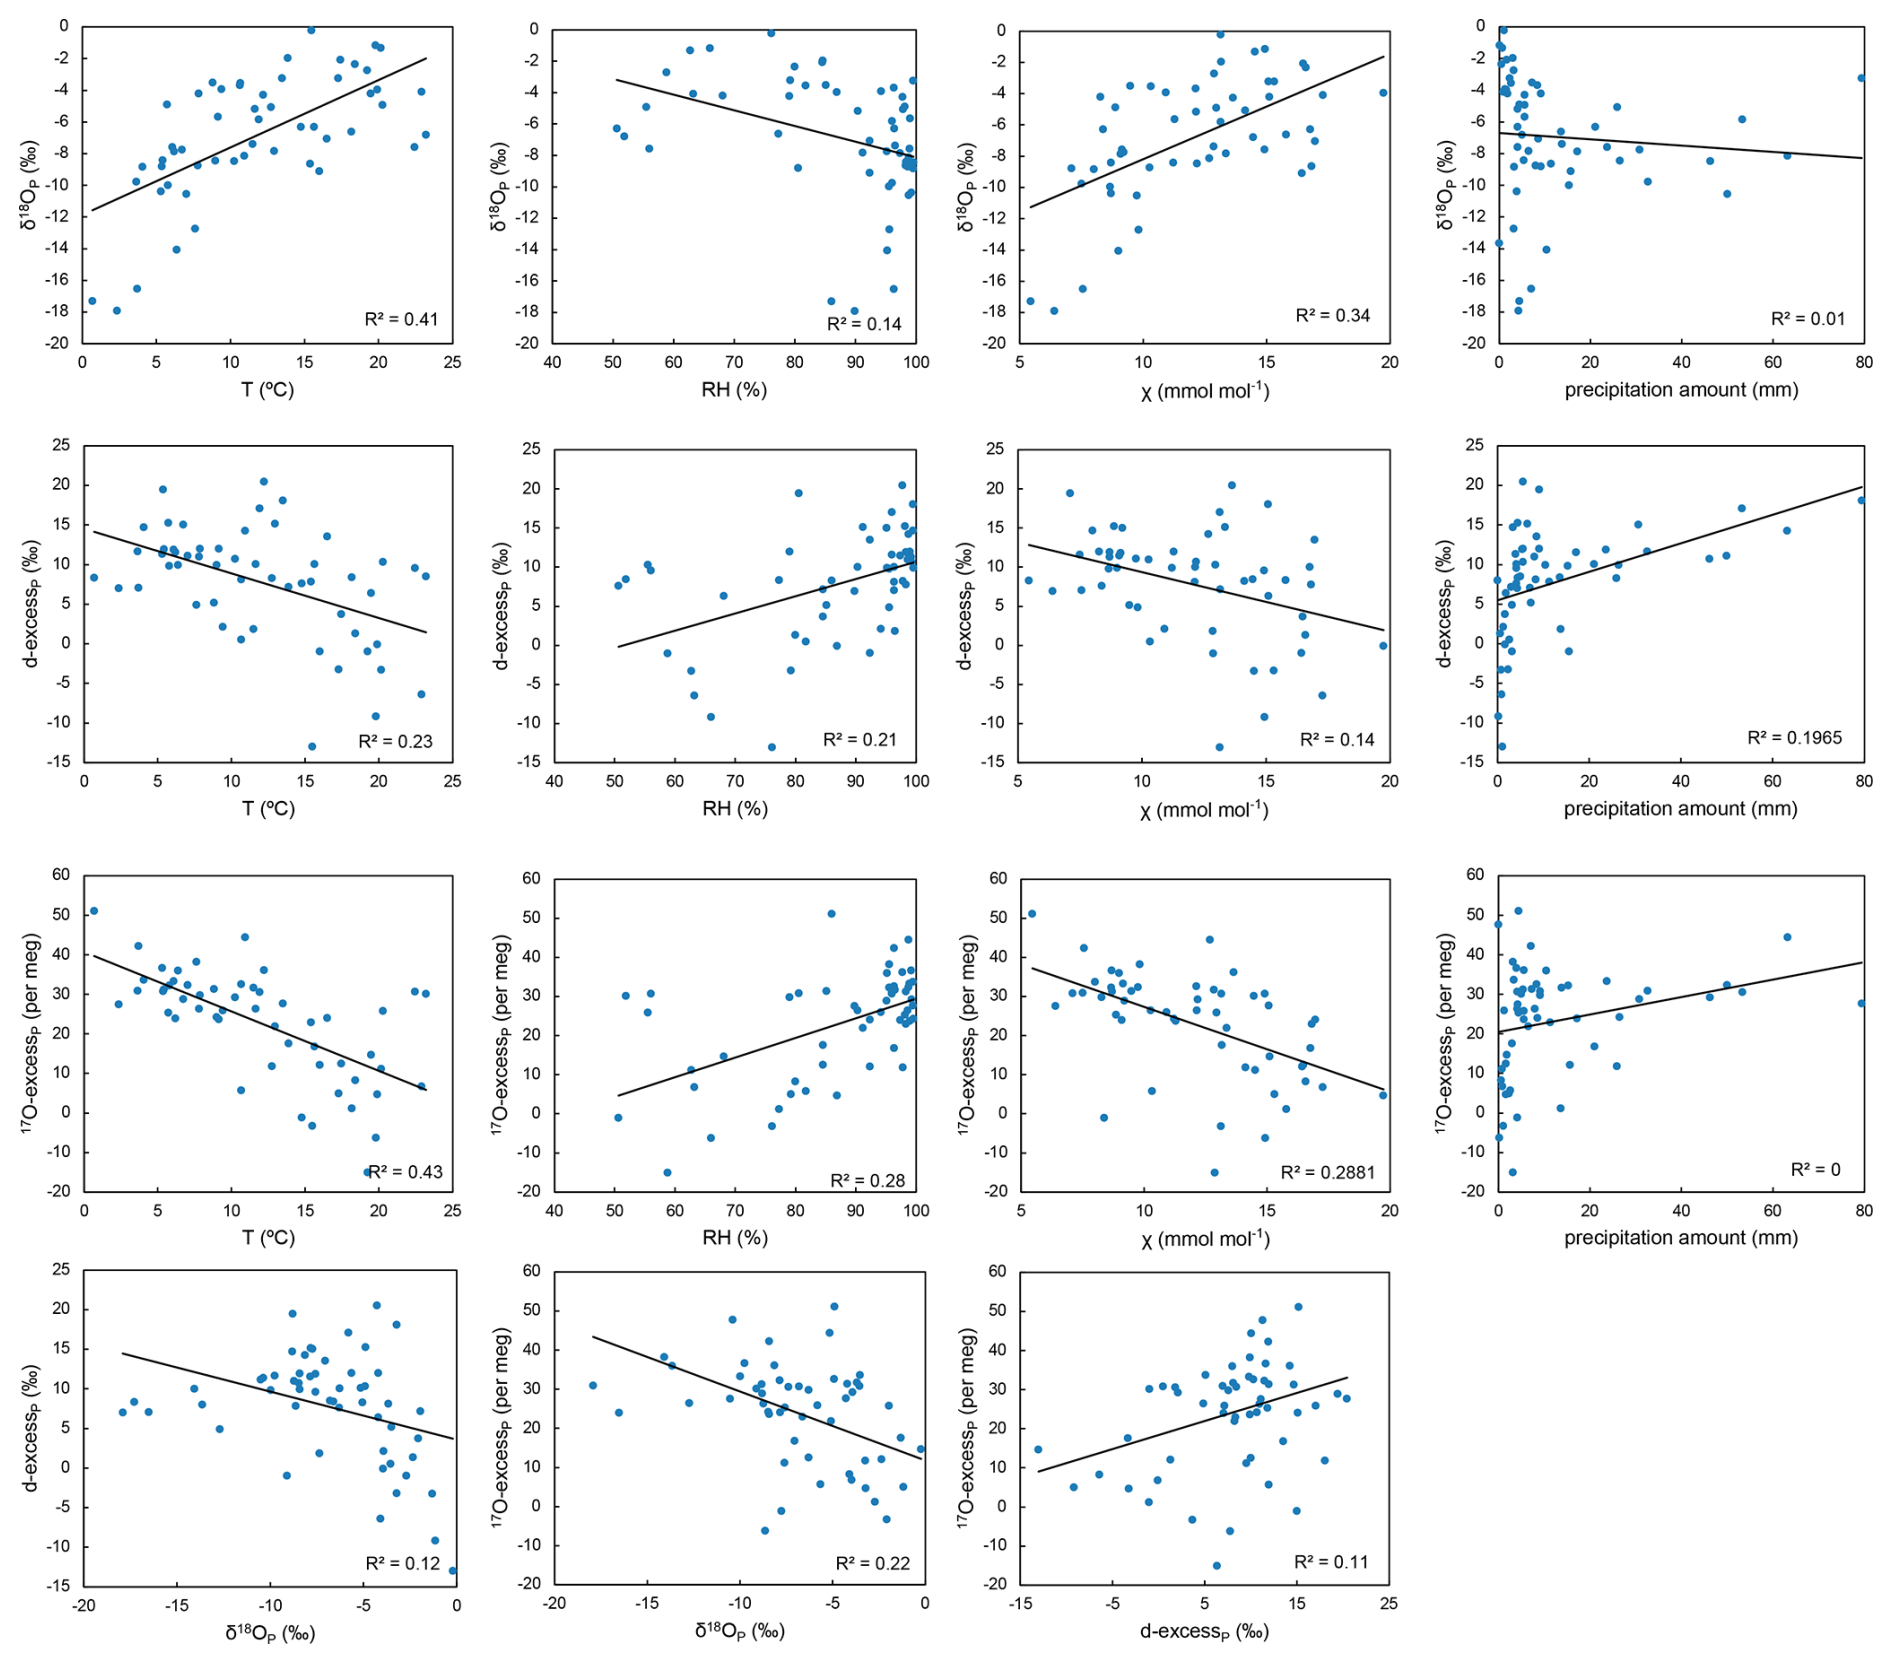
Figure B9Correlations observed between event-based δ18O, d-excess and 17O-excess of precipitation and relative humidity (RH), atmospheric temperature (Tair), the atmospheric water mixing ratio (χ) and precipitation amount.
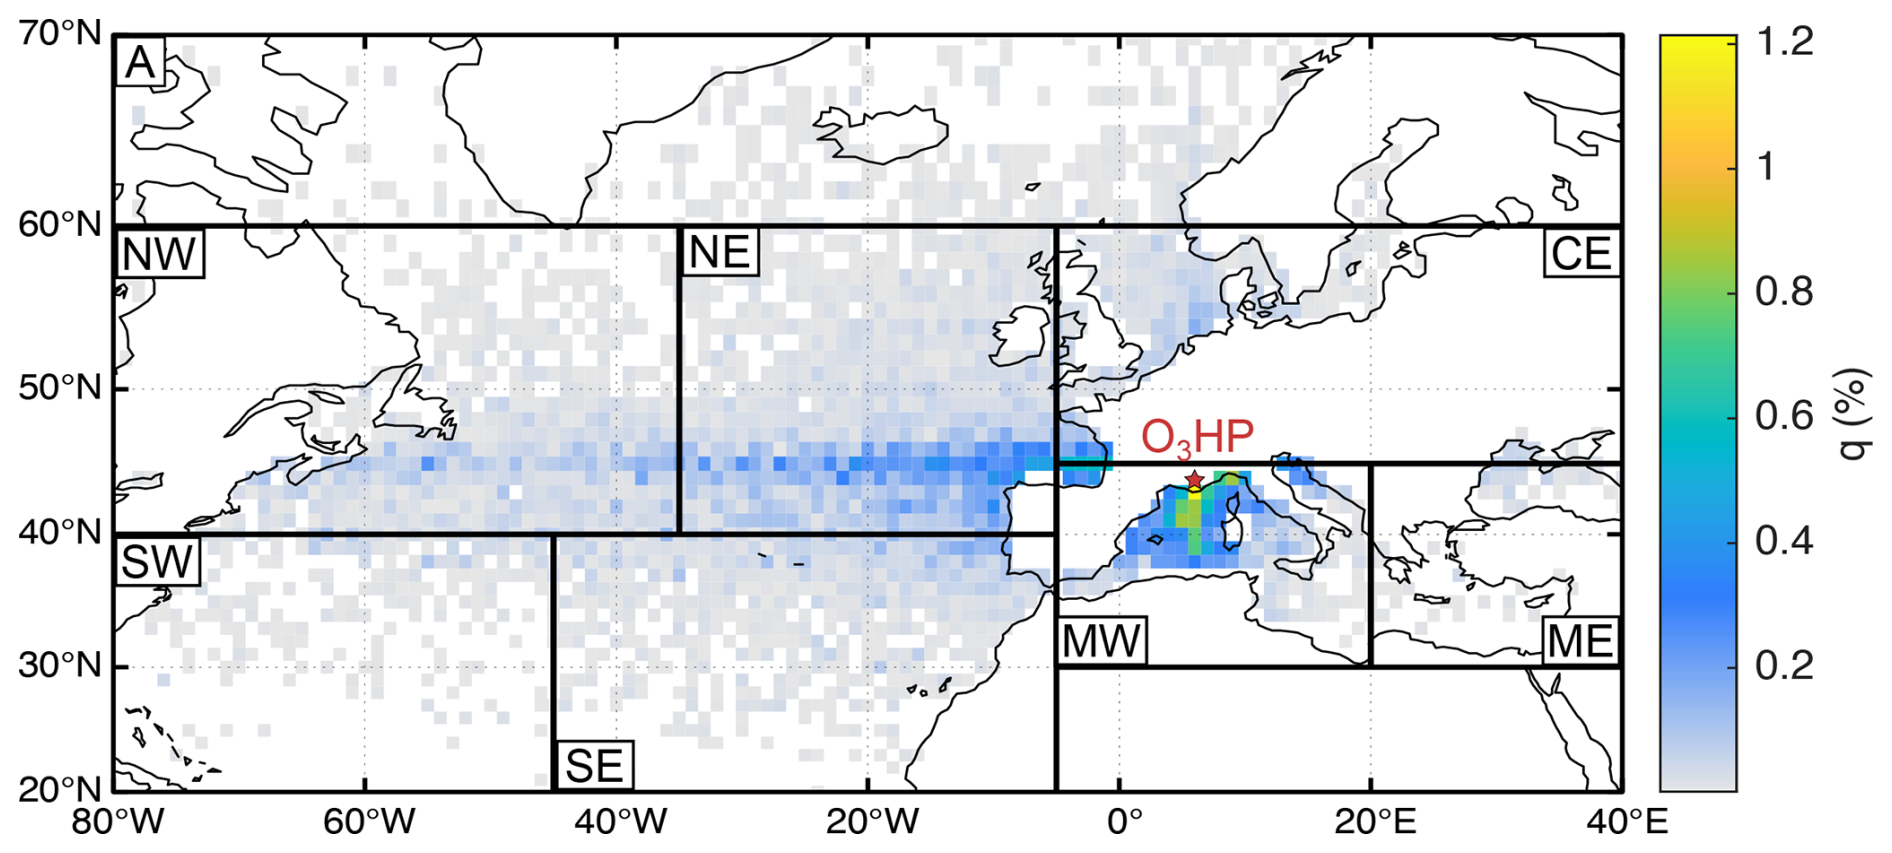
Figure C1Annual mean oceanic moisture source contributions to atmospheric water vapor at O3HP. Shading: Relative contribution of evaporation from respective grid cell to the final specific humidity of each trajectory.
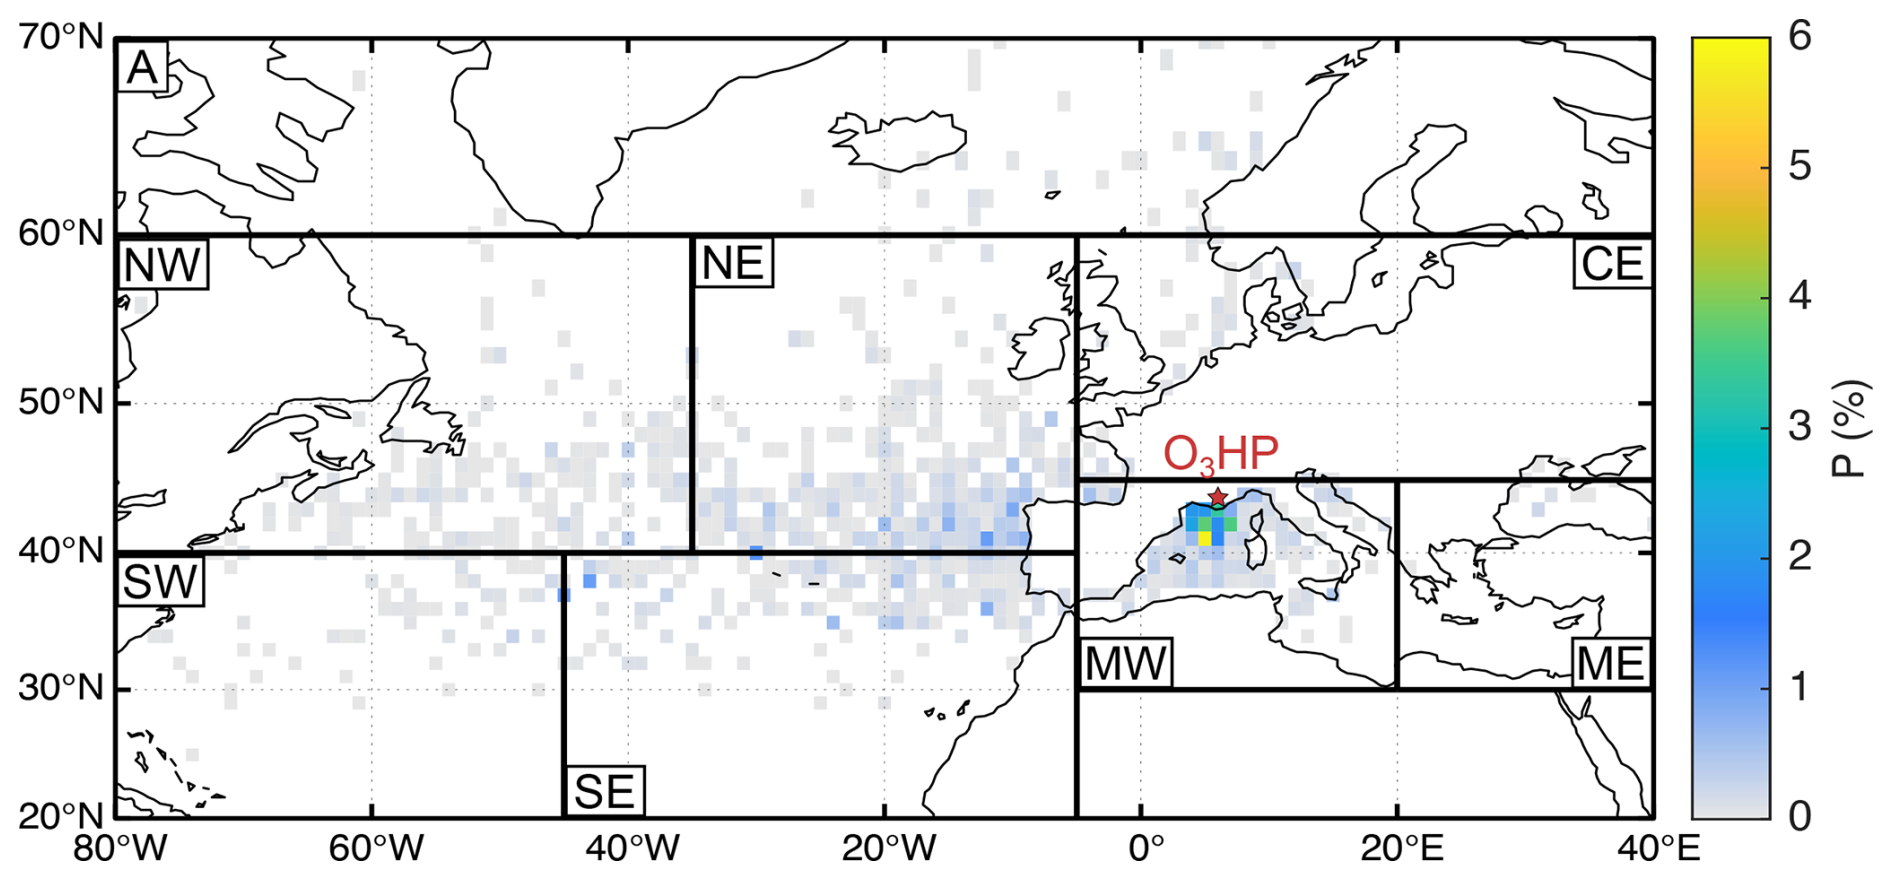
Figure C2Annual mean oceanic moisture source contributions to precipitation at O3HP. Shading: Relative contribution of evaporation from respective grid cell to diagnosed precipitation at O3HP.
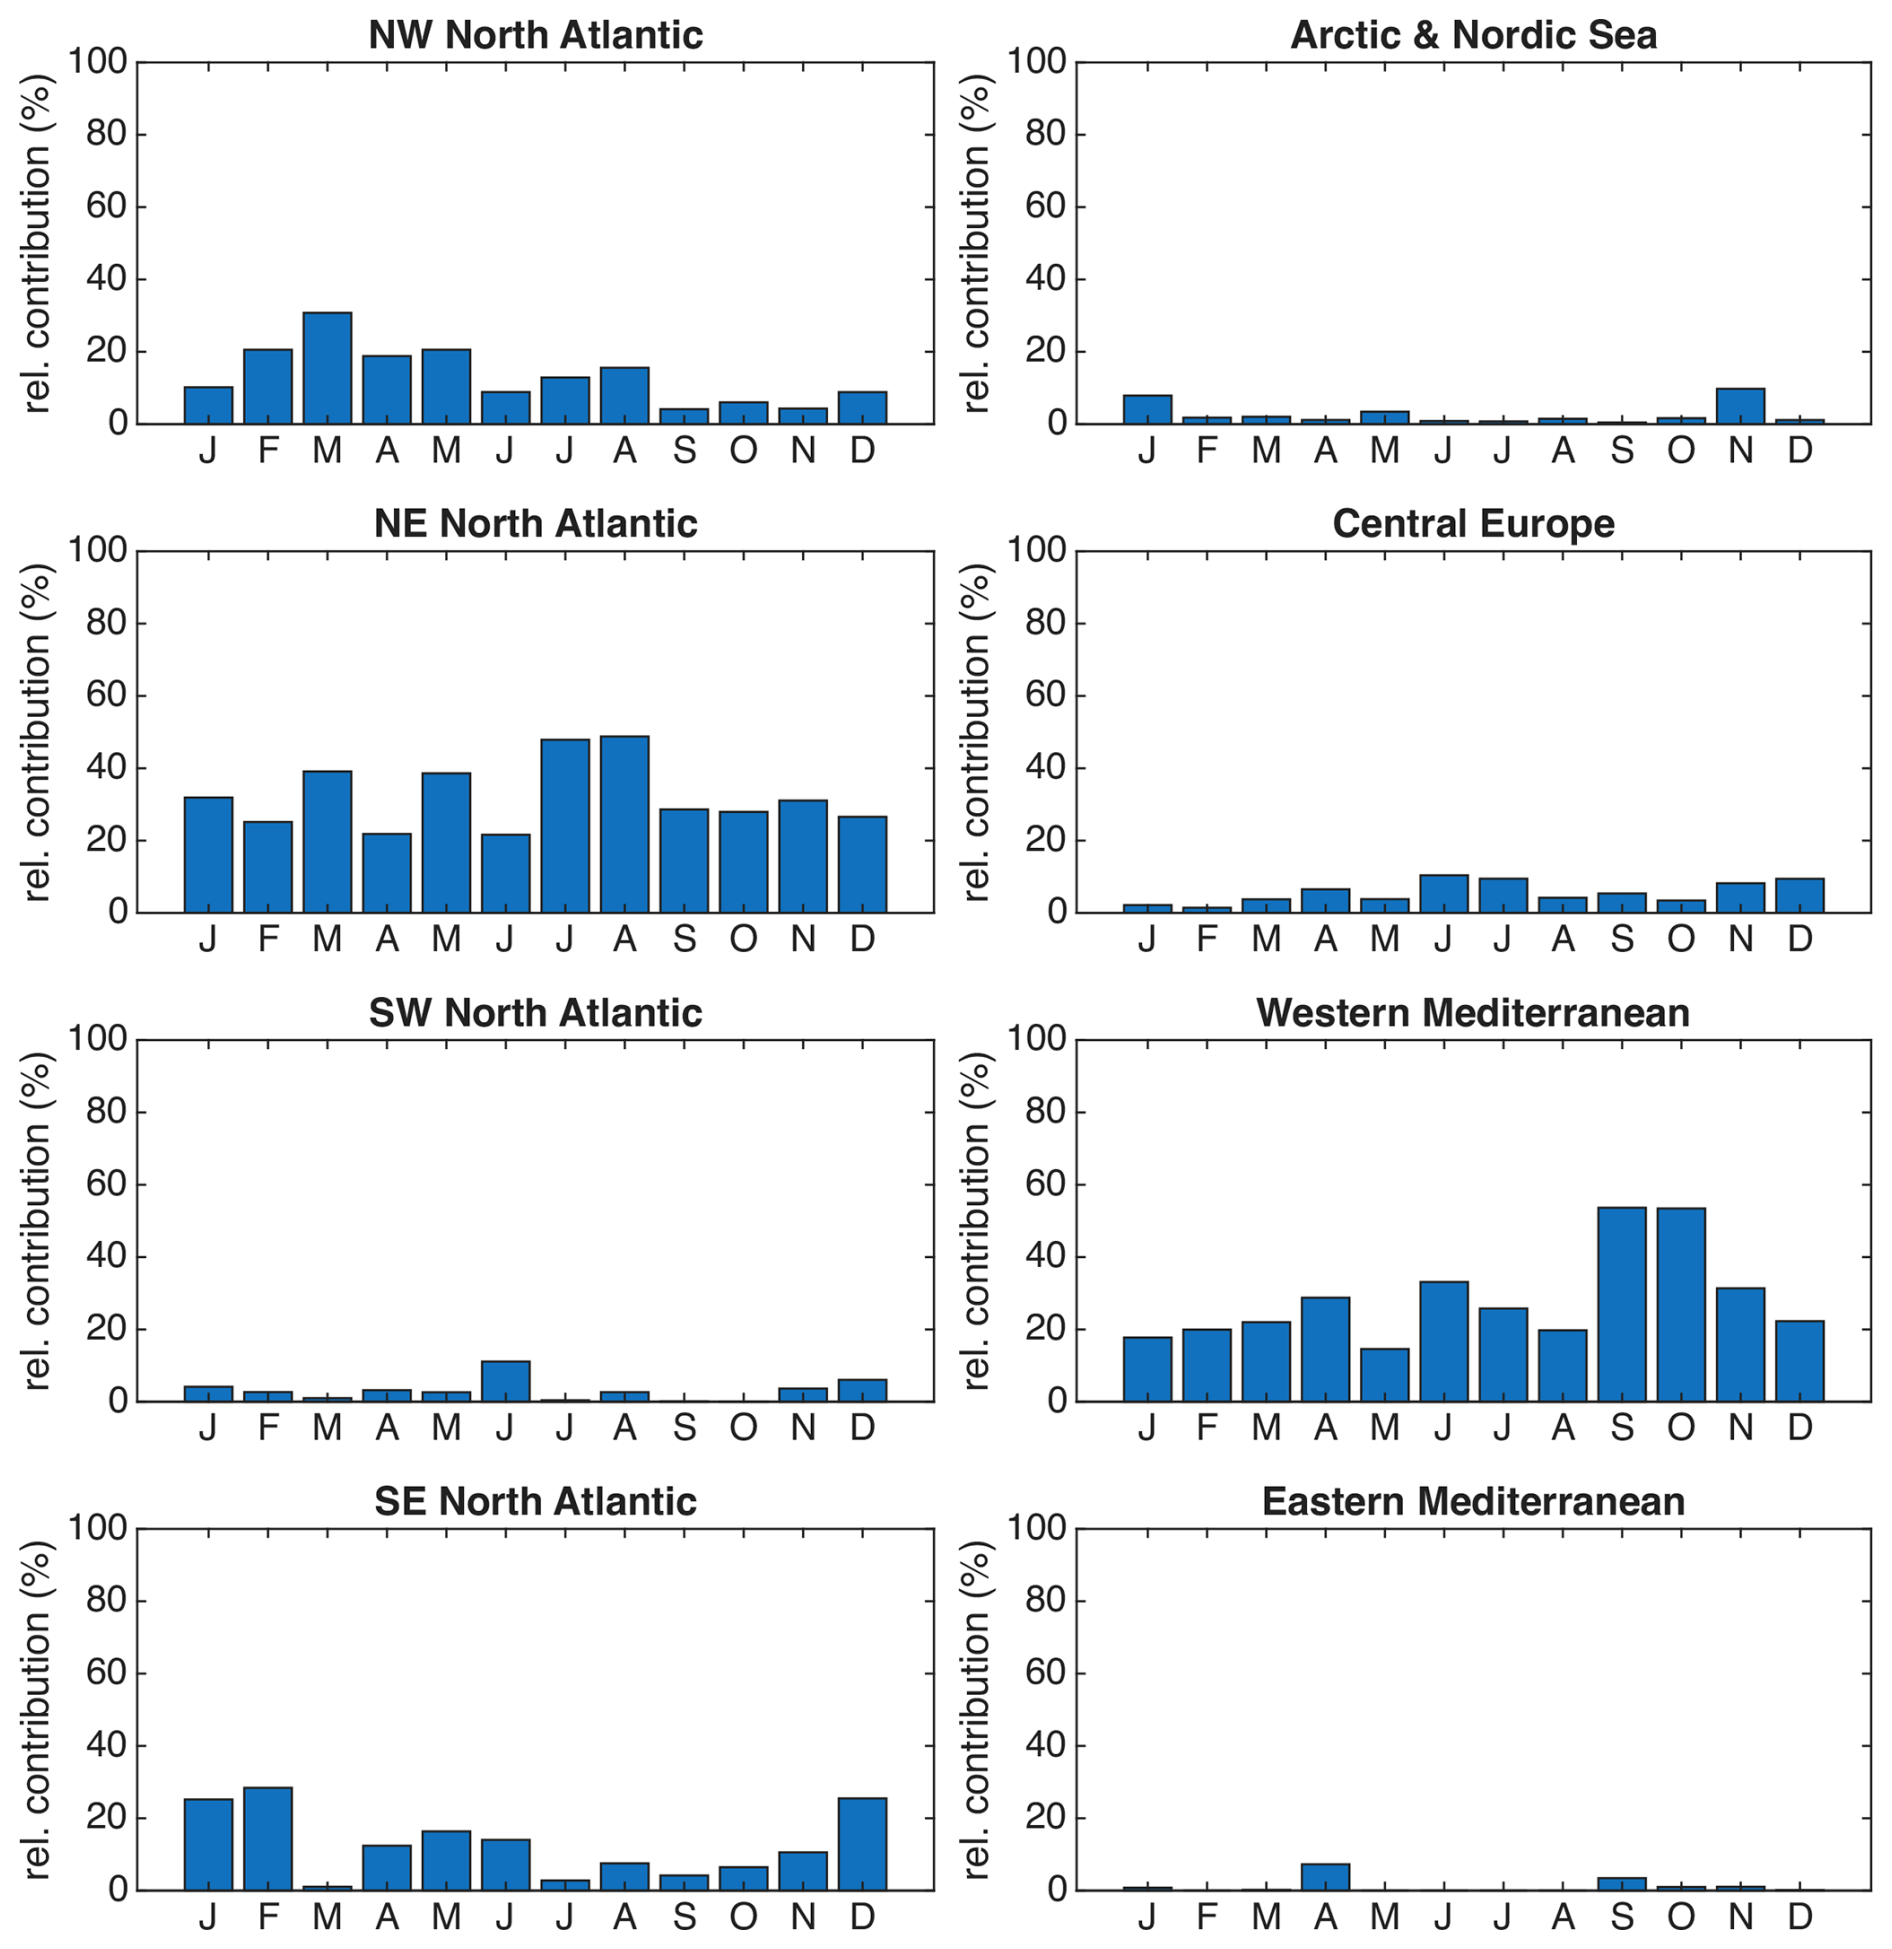
Figure C3Relative contributions from the eight oceanic moisture source regions (% of final specific humidity).
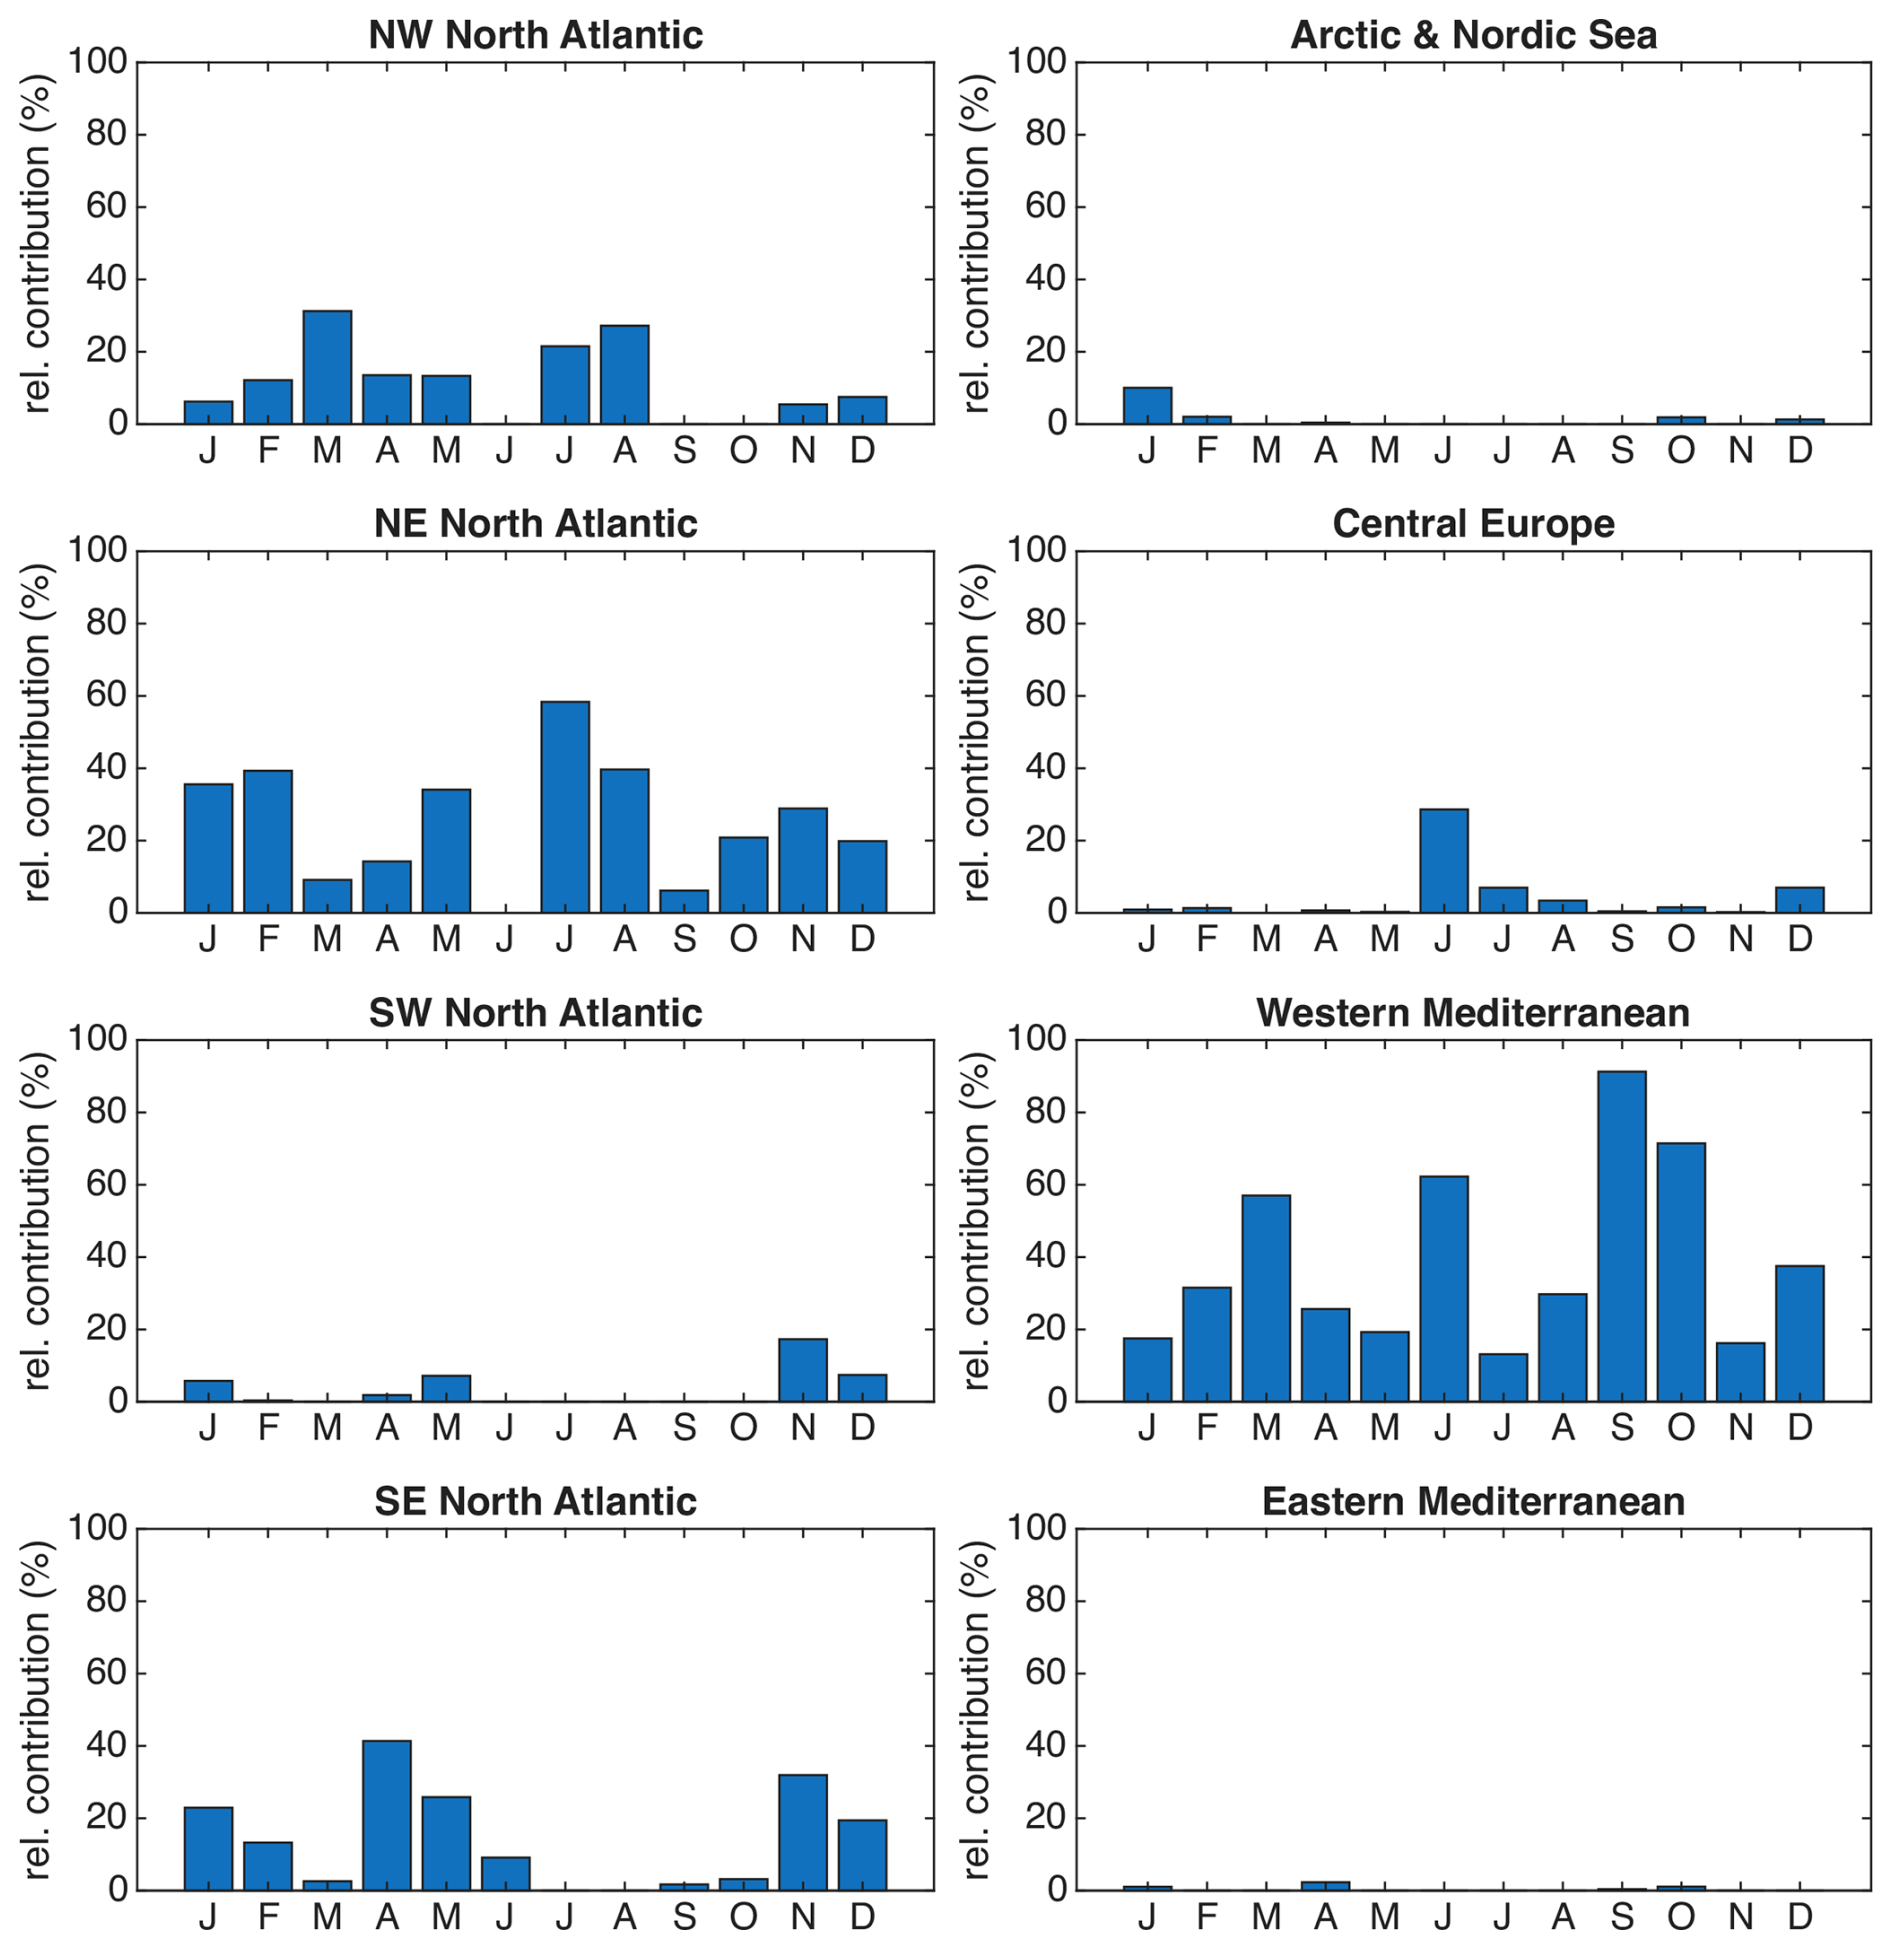
Figure C4Relative contributions from the eight oceanic moisture source regions (% of accounted precipitation).
Table C1Isotopic composition of atmospheric water vapor derived from the eight defined oceanic moisture source regions.
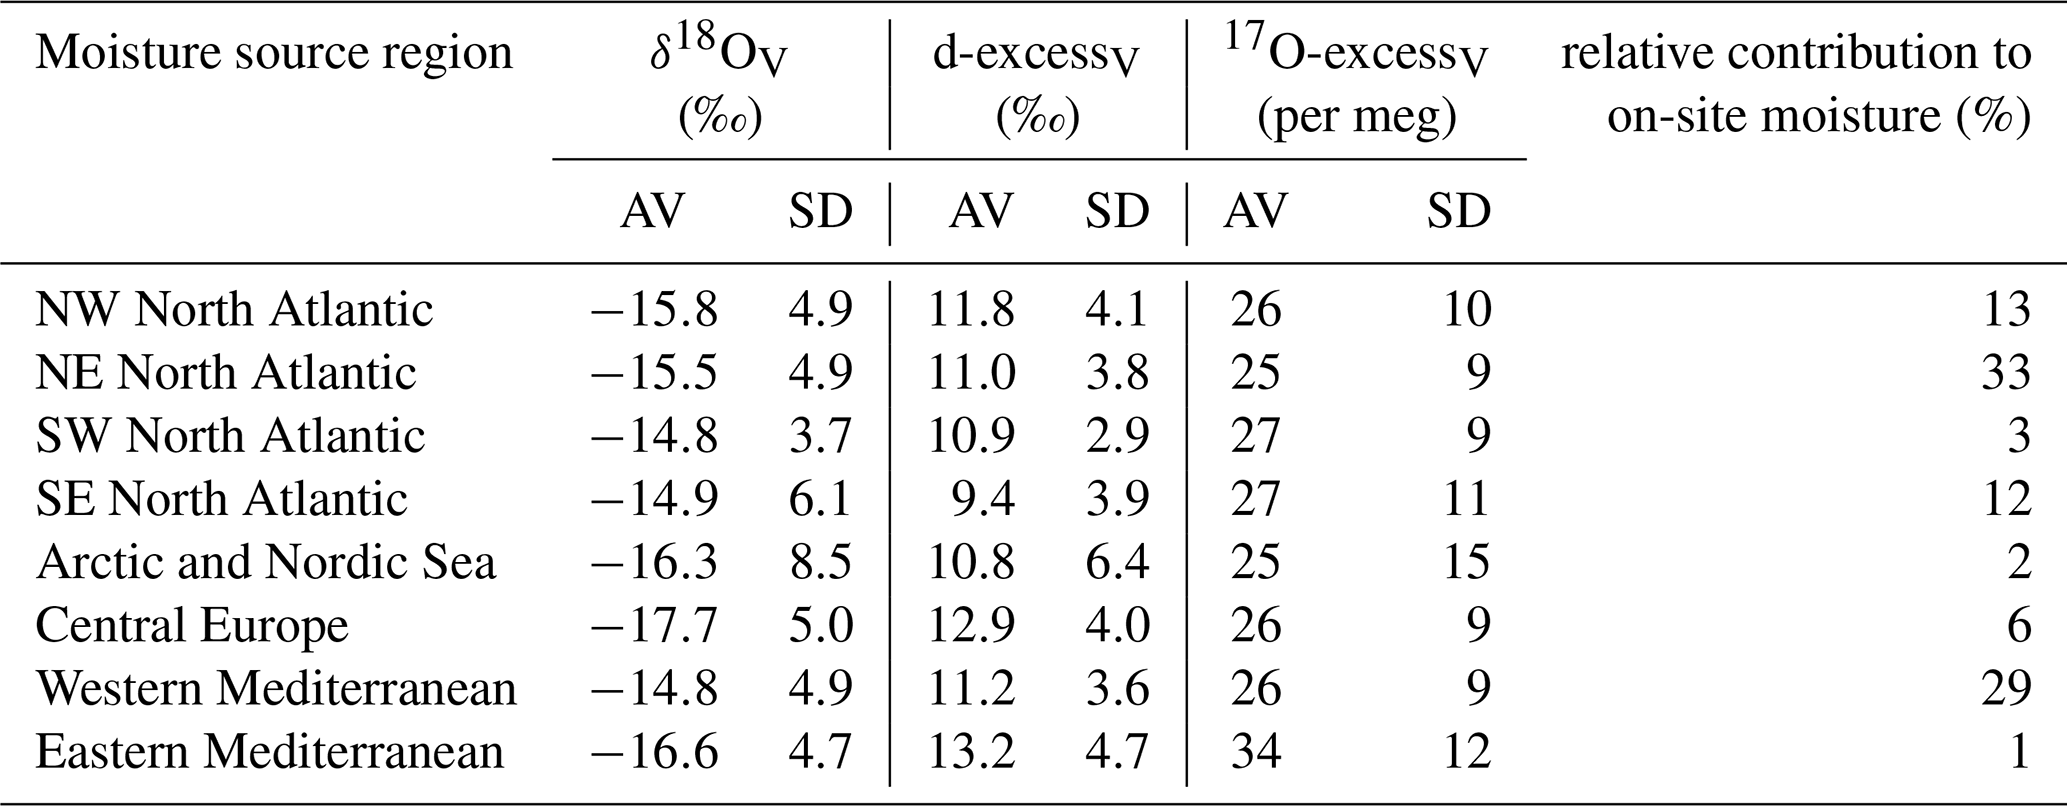
Table C2Isotopic composition of precipitation derived from the eight defined oceanic moisture source regions.
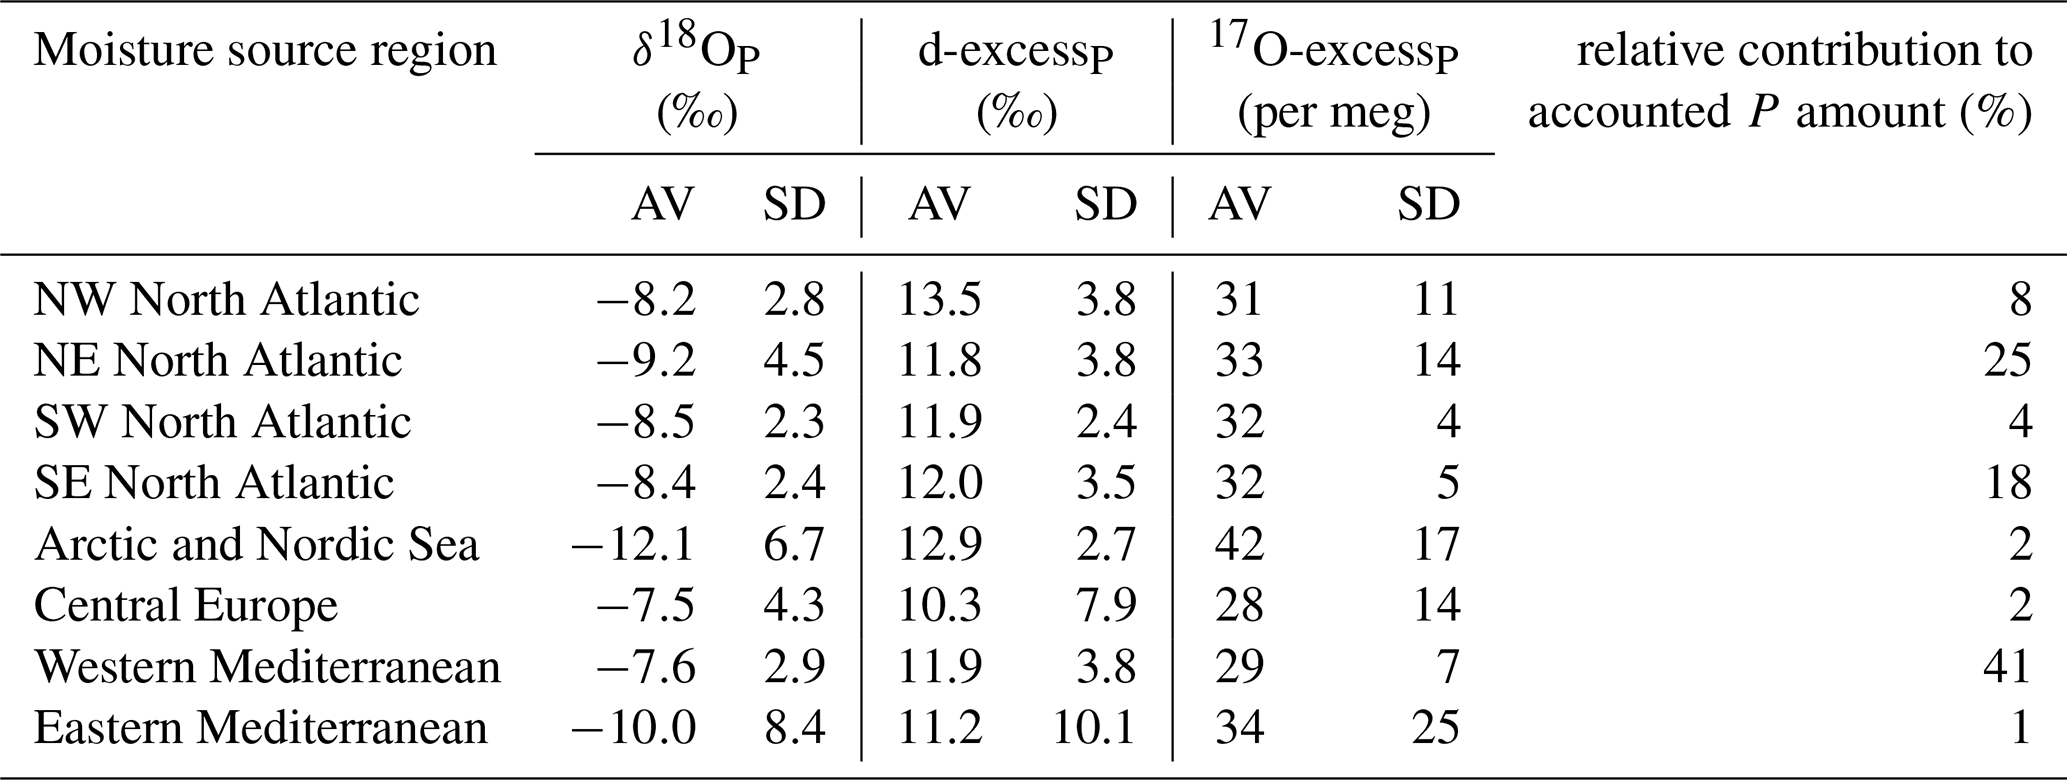
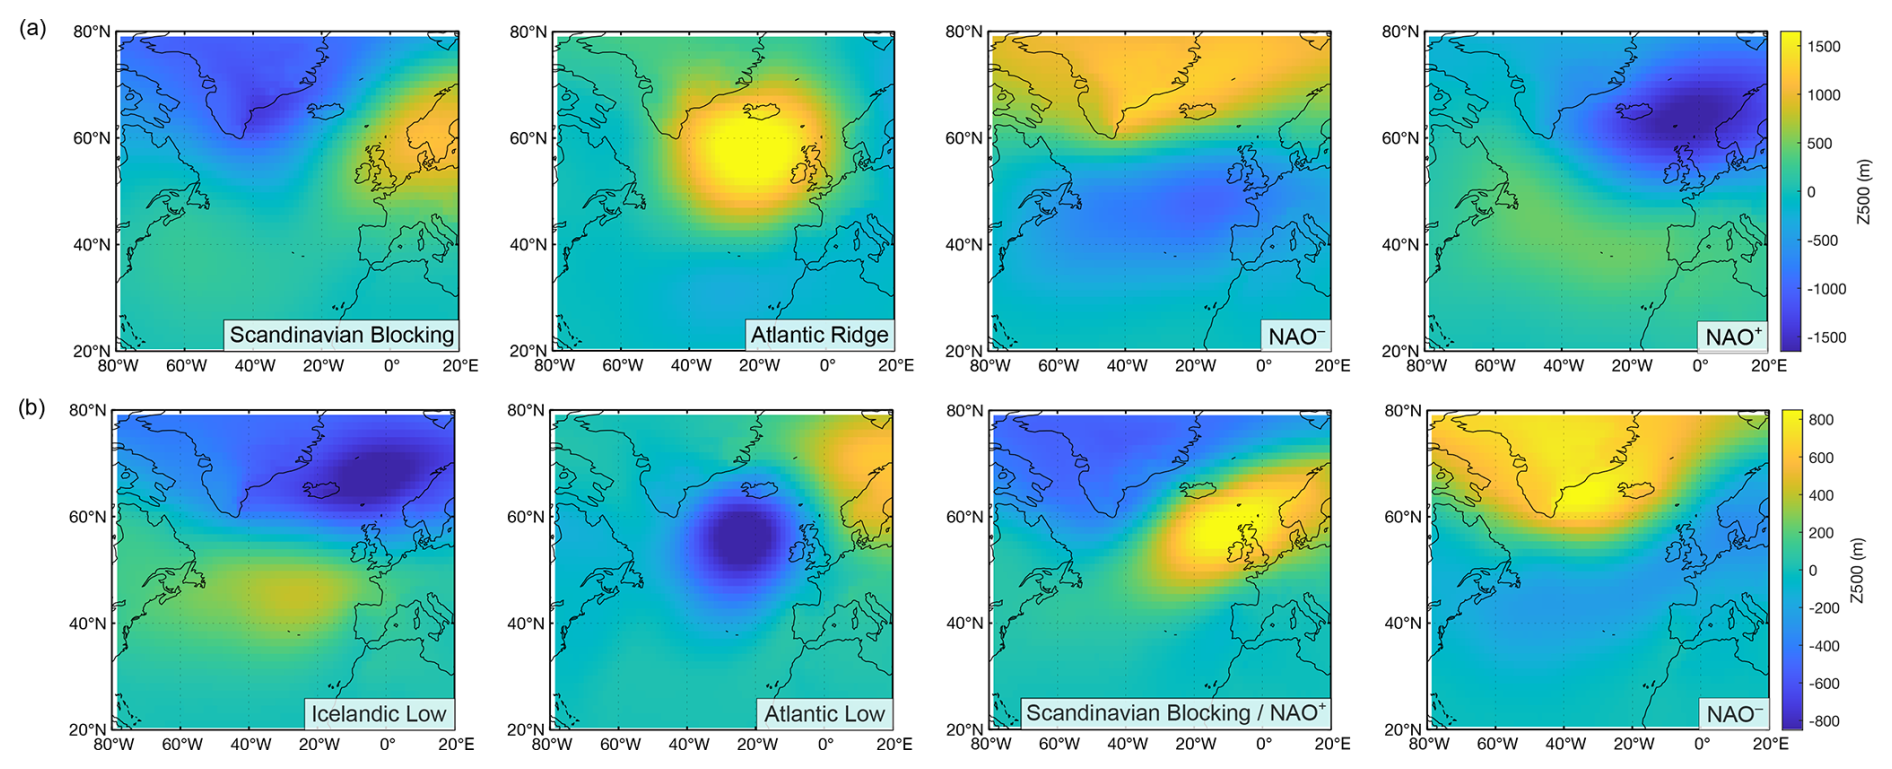
Figure C5Centroids of (a) the four wintertime and (b) the four summertime weather regimes obtained from daily anomalous geopotential height at the 500 hPa altitude (Z500, colour) from the European Centre for the Medium-Range Weather Forecasts (ECMWF) ERA5 reanalysis over 1989–2022. In winter, the Atlantic Ridge regime is associated with a high-pressure system over the Atlantic Ocean, driving strong northwesterly winds (Mistral) and resulting in cool, dry conditions in the Mediterranean region (Vautard, 1990). The NAO− regime emerges when the Icelandic low shifts southward, displacing the Atlantic jet stream to lower latitudes and inducing southerly winds that bring warmer, wetter conditions to the Mediterranean (Cassou et al., 2004). In contrast, the NAO+ regime is characterized by a strong pressure gradient between the Icelandic Low and the Azores High, promoting westerly to northwesterly winds and generally dry conditions in the Mediterranean (Cassou et al., 2004). The Scandinavian Blocking regime involves a persistent anticyclone over the Scandinavian Peninsula, preventing low pressure systems reaching Europe and leads to north-easterly winds across the western Mediterranean. In summer, the Blocking/NAO+ regime resembles a blocking-like pattern, with a high-pressure anomaly over Scandinavia and the North Sea. The Atlantic Low is dominated by a low-pressure system over the North Atlantic, accompanied by weaker positive anomalies extending toward Scandinavia, facilitating the advection of warm air masses from northern Africa and the Mediterranean basin (Cassou et al., 2005). The summer NAO− regime is characterized by a low-pressure anomaly over the British Isles and a strong high-pressure anomaly over Greenland, while the Icelandic Low regime displays a dipole pattern with a low-pressure anomaly between Iceland and Scandinavia and a weak high-pressure anomaly over the North Atlantic.
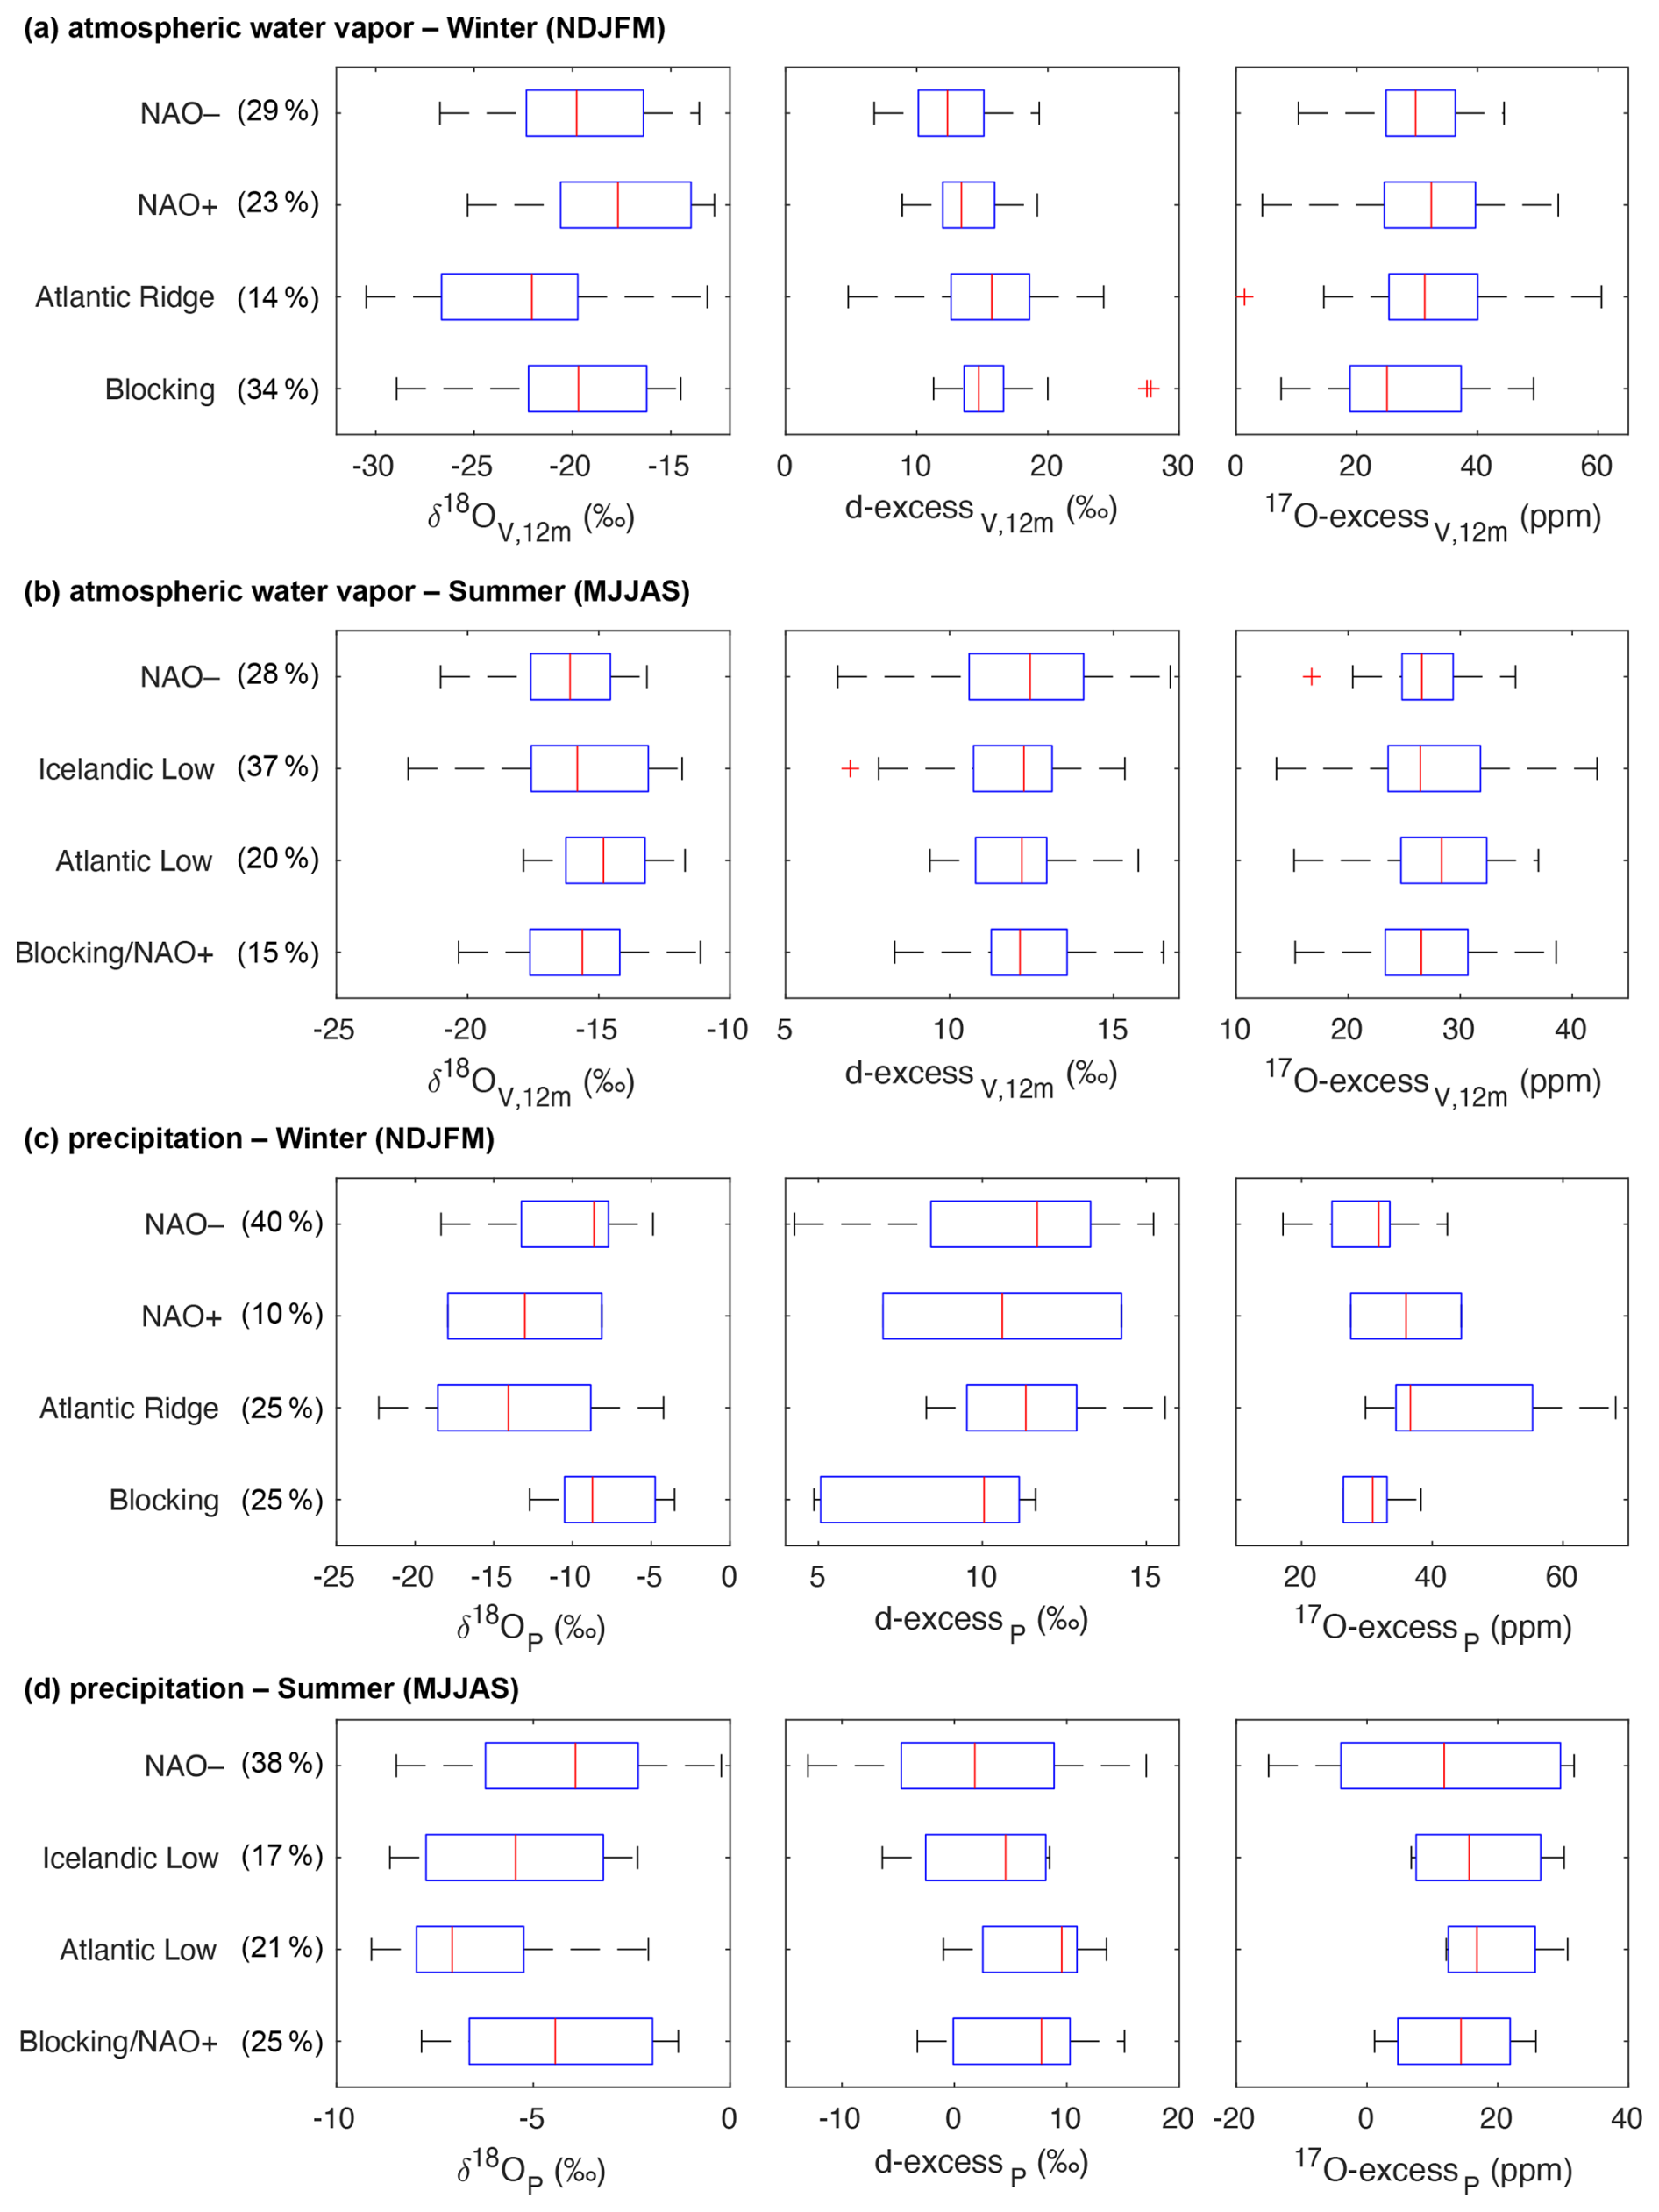
Figure C6Box plots of isotopic compositions of (a, b) atmospheric water vapor and (c, d) precipitation for the four wintertime and the four summertime weather regimes. The red center mark indicates the median, and the lower and upper ends of the box indicate the 25th and 75th percentiles, respectively. The whiskers extend to the most extreme data points that are not considered outliers, and outliers are represented individually by the “+” marker symbol. The numbers in brackets behind the weather regime names indicate (a, b) the percentage of occurrence and (c, d) the total precipitation amount of each weather regime.
The dataset of isotopic atmospheric water vapor and quasi-event-based precipitation samples is available at https://doi.org/10.5281/zenodo.20639179 (Voigt, 2026a). The code used for the assessment of precision of calibrated atmospheric water vapor isotopic data is available at https://doi.org/10.5281/zenodo.19854015 (Voigt, 2026b). The code used for the quantitative moisture source analysis is available at https://doi.org/10.5281/zenodo.19855037 (Voigt, 2026c).
CV, CVC, AA and CP designed the experiments and CV, IMR, JPO and AA carried them out. CV developed the model code and performed the data analysis. FC did the statistical analysis. CC performed the classification of weather regimes. IXR provided meteorological data from the ICOS tower. CV prepared the manuscript with contributions from all co-authors.
The contact author has declared that none of the authors has any competing interests.
Publisher's note: Copernicus Publications remains neutral with regard to jurisdictional claims made in the text, published maps, institutional affiliations, or any other geographical representation in this paper. The authors bear the ultimate responsibility for providing appropriate place names. Views expressed in the text are those of the authors and do not necessarily reflect the views of the publisher.
This study was conducted in the framework of the HUMI-17 project led by Anne Alexandre and supported by the ANR (ANR-17-CE01-0002-01), CNRS FR3098 ECCOREV, LABEX OT-Med, and OSU-Pytheas. It benefited from the CNRS resources allocated to the French ECOTRONS Research Infrastructure, from the Occitanie Region and FEDER investments as well as from the state allocation “Investissement d'Avenir” AnaEE-France ANR-11-INBS-0001.
This research has been supported by the Agence Nationale de la Recherche (grant nos. ANR-17-CE01-0002-01 and ANR-11-INBS-0001). Claudia Voigt was supported by the European Commission, HORIZON EUROPE Framework Programme (grant no. 101063961).
This paper was edited by Franziska Aemisegger and reviewed by Lisa Welp and one anonymous referee.
Aemisegger, F. and Sjolte, J.: A climatology of strong large-scale ocean evaporation events. Part II: Relevance for the deuterium excess signature of the evaporation flux, J. Climate, 31, 7313–7336, https://doi.org/10.1175/JCLI-D-17-0592.1, 2018.
Aemisegger, F., Pfahl, S., Sodemann, H., Lehner, I., Seneviratne, S. I., and Wernli, H.: Deuterium excess as a proxy for continental moisture recycling and plant transpiration, Atmos. Chem. Phys., 14, 4029–4054, https://doi.org/10.5194/acp-14-4029-2014, 2014.
Aemisegger, F., Spiegel, J. K., Pfahl, S., Sodemann, H., Eugster, W., and Wernli, H.: Isotope meteorology of cold front passages: A case study combining observations and modelling, Geophys. Res. Lett., 42, 5652–5660, https://doi.org/10.1002/2015GL063988, 2015.
Affolter, S., Häuselmann, A. D., Fleitmann, D., Häuselmann, P., and Leuenberger, M.: Triple isotope (δD, δ17O, δ18O) study on precipitation, drip water and speleothem fluid inclusions for a Western Central European cave (NW Switzerland), Quaternary Sci. Rev., 127, 73–89, https://doi.org/10.1016/j.quascirev.2015.08.030, 2015.
Alexandre, A., Landais, A., Vallet-Coulomb, C., Piel, C., Devidal, S., Pauchet, S., Sonzogni, C., Couapel, M., Pasturel, M., Cornuault, P., Xin, J., Mazur, J.-C., Prié, F., Bentaleb, I., Webb, E., Chalié, F., and Roy, J.: The triple oxygen isotope composition of phytoliths as a proxy of continental atmospheric humidity: insights from climate chamber and climate transect calibrations, Biogeosciences, 15, 3223–3241, https://doi.org/10.5194/bg-15-3223-2018, 2018.
Alexandre, A., Webb, E., Landais, A., Piel, C., Devidal, S., Sonzogni, C., Couapel, M., Mazur, J.-C., Pierre, M., Prié, F., Vallet-Coulomb, C., Outrequin, C., and Roy, J.: Effects of leaf length and development stage on the triple oxygen isotope signature of grass leaf water and phytoliths: insights for a proxy of continental atmospheric humidity, Biogeosciences, 16, 4613–4625, https://doi.org/10.5194/bg-16-4613-2019, 2019.
Arellano, L. N., Beverly, E. J., Voarintsoa, N. R. G., Skinner, C. B., Schauer, A. J., and Steig, E. J.: Triple oxygen isotope variability of precipitation in a tropical mountainous region, Geochim. Cosmochim. Ac., 385, 1–15, https://doi.org/10.1016/j.gca.2024.09.024, 2024.
Arnault, J., Jung, G., Haese, B., Fersch, B., Rummler, T., Wei, J., Zhang, Z., and Kunstmann, H.: A Joint Soil-Vegetation-Atmospheric Modeling Procedure of Water Isotopologues: Implementation and Application to Different Climate Zones With WRF-Hydro-Iso, J. Adv. Model. Earth Sy., 13, e2021MS002562, https://doi.org/10.1029/2021MS002562, 2021.
Aron, P. G., Levin, N. E., Beverly, E. J., Huth, T. E., Passey, B. H., Pelletier, E. M., Poulsen, C. J., Winkelstern, I. Z., and Yarian, D. A.: Triple oxygen isotopes in the water cycle, Chem. Geol., 565, 120026, https://doi.org/10.1016/j.chemgeo.2020.120026, 2021.
Baldini, L. M., McDermott, F., Foley, A. M., and Baldani, J. U. L.: Spatial variability in the European winter precipitation δ18O-NAO relationship: Implications for reconstructing NAO-mode climate variability in the Holocene, Geophys. Res. Lett., 35, L04709, https://doi.org/10.1029/2007GL032027, 2008.
Barkan, E. and Luz, B.: High precision measurements of and ratios in H2O, Rapid Commun. Mass Sp., 19, 3737–3742, https://doi.org/10.1002/rcm.2250, 2005.
Bartsch, S., Stegehuis, A. I., Boissard, C., Lathière, J., Peterschmitt, J. Y., Reiter, I. M., Gauquelin, T., Baldy, V., Genesio, L., Matteucci, G., Fernandez, C., and Guenet, B.: Impact of precipitation, air temperature and abiotic emissions on gross primary production in Mediterranean ecosystems in Europe, Eur. J. For. Res., 139, 111–126, https://doi.org/10.1007/s10342-019-01246-7, 2020.
Bastrikov, V., Steen-Larsen, H. C., Masson-Delmotte, V., Gribanov, K., Cattani, O., Jouzel, J., and Zakharov, V.: Continuous measurements of atmospheric water vapour isotopes in western Siberia (Kourovka), Atmos. Meas. Tech., 7, 1763–1776, https://doi.org/10.5194/amt-7-1763-2014, 2014.
Berkelhammer, M., Hu, J., Bailey, A., Noone, D., Still, C. J., Barnard, H., Gochis, D., Hsiao, G. S., Rahn, T., and Turnipseed, A.: The nocturnal water cycle in an open-canopy forest, J. Geophys. Res.-Atmos., 118, 10225–10242, https://doi.org/10.1002/jgrd.50701, 2013.
Bershaw, J., Penny, S. M., and Garzione, C. N.: Stable isotopes of modern water across the Himalaya and eastern Tibetan Plateau: Implications for estimates of paleoelevation and paleoclimate, J. Geophys. Res.-Atmos., 117, 1–18, https://doi.org/10.1029/2011JD016132, 2012.
Bland, J. M. and Altman, D. G.: Multiple significance tests: the Bonferroni method, Brit. Med. J., 310, 170, https://doi.org/10.1136/bmj.310.6973.170, 1995.
Casellas, E., Latron, J., Cayuela, C., Bech, J., Udina, M., Sola, Y., Lee, K. O., and Llorens, P.: Moisture origin and characteristics of the isotopic signature of rainfall in a Mediterranean mountain catchment (Vallcebre, eastern Pyrenees), J. Hydrol., 575, 767–779, https://doi.org/10.1016/j.jhydrol.2019.05.060, 2019.
Cassou, C.: Intraseasonal interaction between the Madden-Julian Oscillation and the North Atlantic Oscillation, Nature, 455, 523–527, https://doi.org/10.1038/nature07286, 2008.
Cassou, C., Hurrell, J. W., and Deser, C.: North Atlantic Winter Climate Regimes: Spatial Asymmetry, Stationarity with Time, and Oceanic Forcing, J. Climate, 17, 1055–1068, https://doi.org/10.1175/1520-0442(2004)017<1055:NAWCRS>2.0.CO;2, 2004.
Cassou, C., Terray, L., and Phillips, A. S.: Tropical Atlantic Influence on European Heat Waves, J. Climate, 18, 2805–2811, https://doi.org/10.1175/JCLI3506.1, 2005.
Celle-Jeanton, H., Travi, Y., and Blavoux, B.: Isotopic typology of the precipitation in the Western Mediterranean region at the three different time scales, Geophys. Res. Lett., 28, 1215–1218, https://doi.org/10.1029/2000GL012407, 2001.
Craig, H. and Gordon, L. I.: Deuterium and oxygen 18 variations in the ocean and the marine atmosphere, in: Stable Isotopes in Oceanographic Studies and Paleotemperatures, edited by: E. Tongiorgi, Consiglio Nazionale delle Ricerche Laboratorio du Geologia Nucleare, Pisa, Italy, 9–130, http://yncenter.sites.yale.edu/sites/default/files/shen_jing_jan_2013.pdf (last access: 29 June 2026), 1965.
Cruz-San Julian, J., Araguas-Araguas, L., Rozanski, K., Benavente, J., Cardenal, J., Hidalgo, M. C., Garcia-Lopez, S., Martinez-Garrido, J. C., Moral, F., and Olias, M.: Sources of precipitation over South-Eastern Spain and groundwater recharge. An isotopic study, Tellus B, 44, 226–236, https://doi.org/10.1034/j.1600-0889.1992.t01-2-00005.x, 1992.
Dansgaard, W.: Stable isotopes in precipitation, Tellus, 16, 436–468, https://doi.org/10.3402/tellusa.v16i4.8993, 1964.
Deininger, M., Werner, M., and McDermott, F.: North Atlantic Oscillation controls on oxygen and hydrogen isotope gradients in winter precipitation across Europe; implications for palaeoclimate studies, Clim. Past, 12, 2127–2143, https://doi.org/10.5194/cp-12-2127-2016, 2016.
Delattre, H., Vallet-Coulomb, C., and Sonzogni, C.: Deuterium excess in the atmospheric water vapour of a Mediterranean coastal wetland: regional vs. local signatures, Atmos. Chem. Phys., 15, 10167–10181, https://doi.org/10.5194/acp-15-10167-2015, 2015.
Desphande, R. D., Maurya, A. S., Kumar, B., Sarkar, A., and Gupta, S. K.: Rain-vapor interaction and vapor source identification using stable isotopes from semiarid western India, J. Geophys. Res.-Atmos., 115, D23311, https://doi.org/10.1029/2010JD014458, 2010.
Dütsch, M., Pfahl, S., and Sodemann, H.: The impact of nonequilibrium and equilibrium fractionation on two different deuterium excess definitions, J. Geophys. Res.-Atmos., 122, 12732–12746, https://doi.org/10.1002/2017JD027085, 2017.
Dütsch, M., Fairall, C. W., Blossey, P. N., and Fiorella, R. P.: A new theoretical framework for parameterizing nonequilibrium fractionation during evaporation from the ocean, J. Adv. Model. Earth Syst., 18, e2025MS005229, https://doi.org/10.1029/2025MS005229, 2026.
Field, R. D.: Observed and modeled controls on precipitation δ18O over Europe: From local temperature to the Northern Annular Mode, J. Geophys. Res., 115, D12101, https://doi.org/10.1029/2009JD013370, 2010.
Galewsky, J., Steen-Larsen, H. C., Field, R. D., Worden, J., Risi, C., and Schneider, M.: Stable isotopes in atmospheric water vapor and applications to the hydrologic cycle, Rev. Geophys., 54, 809–865, https://doi.org/10.1002/2015RG000512, 2016.
Gat, J. R.: Oxygen and Hydrogen Isotopes in the Hydrologic Cycle, Annu. Rev. Earth Pl. Sc., 24, 225–262, https://doi.org/10.1146/annurev.earth.24.1.225, 1996.
Gázquez, F., Morellón, M., Bauska, T., Herwartz, D., Surma, J., Moreno, A., Staubwasser, M., Valero-Garcés, B., Delgado-Huertas, A., and Hodell, D. A.: Triple oxygen and hydrogen isotopes of gypsum hydration water for quantitative paleo-humidity reconstruction, Earth Planet. Sc. Lett., 481, 177–188, https://doi.org/10.1016/j.epsl.2017.10.020, 2018.
Gázquez, F., Jiménez-Espejo, F., Rodríguez-Rodríguez, M., Martegani, L., Voigt, C., Ruíz-Lara, D., Moreno, A., Valero-Garcés, B., Morellón, M., and Martín-Puertas, C.: Roman water management impacted the hydrological functioning of wetlands during drought periods, Sci. Rep.-UK, 13, 18815, https://doi.org/10.1038/s41598-023-46010-5, 2023.
Giménez, R., Bartolomé, M., Gázquez, F., Iglesias, M., and Moreno, A.: Underlying Climate Controls in Triple Oxygen (16O, 17O, 18O) and Hydrogen (1H, 2H) Isotopes Composition of Rainfall (Central Pyrenees), Front. Earth Sci., 9, 633698, https://doi.org/10.3389/feart.2021.633698, 2021.
Graf, P., Wernli, H., Pfahl, S., and Sodemann, H.: A new interpretative framework for below-cloud effects on stable water isotopes in vapour and rain, Atmos. Chem. Phys., 19, 747–765, https://doi.org/10.5194/acp-19-747-2019, 2019.
Griffis, T. J., Wood, J. D., Baker, J. M., Lee, X., Xiao, K., Chen, Z., Welp, L. R., Schultz, N. M., Gorski, G., Chen, M., and Nieber, J.: Investigating the source, transport, and isotope composition of water vapor in the planetary boundary layer, Atmos. Chem. Phys., 16, 5139–5157, https://doi.org/10.5194/acp-16-5139-2016, 2016.
Gröning, M., Lutz, H. O., Roller-Lutz, Z., Kralik, M., Gourcy, L., and Pöltenstein, L.: A simple rain collector preventing water re-evaporation dedicated for δ18O and δ2H analysis of cumulative precipitation samples, J. Hydrol., 448–449, 195–200, https://doi.org/10.1016/j.jhydrol.2012.04.041, 2012.
Guo, J., Zhang, J., Shao, J., Chen, T., Bai, K., Sun, Y., Li, N., Wu, J., Li, R., Li, J., Guo, Q., Cohen, J. B., Zhai, P., Xu, X., and Hu, F.: A merged continental planetary boundary layer height dataset based on high-resolution radiosonde measurements, ERA5 reanalysis, and GLDAS, Earth Syst. Sci. Data, 16, 1–14, https://doi.org/10.5194/essd-16-1-2024, 2024.
He, S., Jackisch, D., Samanta, D., Yi, P. K. Y., Liu, G., Wang, X., and Goodkin, N. F.: Understanding Tropical Convection Through Triple Oxygen Isotopes of Precipitation From the Maritime Continent, J. Geophys. Res.-Atmos., 126, e2020JD033418, https://doi.org/10.1029/2020JD033418, 2021.
Hersbach, H., Bell, B., Berrisford, P., Hirahara, S., Horányi, A., Muñoz-Sabater, J., Nicolas, J., Peubey, C., Radu, R., Schepers, D., Simmons, A., Soci, C., Abdalla, S., Abellan, X., Balsamo, G., Bechtold, P., Biavati, G., Bidlot, J., Bonavita, M., De Chiara, G., Dahlgren, P., Dee, D., Diamantakis, M., Dragani, R., Flemming, J., Forbes, R., Fuentes, M., Geer, A., Haimberger, L., Healy, S., Hogan, R. J., Hólm, E., Janisková, M., Keeley, S., Laloyaux, P., Lopez, P., Lupu, C., Radnoti, G., de Rosnay, P., Rozum, I., Vamborg, F., Villaume, S., and Thépaut, J. N.: The ERA5 global reanalysis, Q. J. Roy. Meteor. Soc., 146, 1999–2049, https://doi.org/10.1002/qj.3803, 2020.
Horita, J., Rozanski, K., and Cohen, S.: Isotope effects in the evaporation of water: a status report of the Craig–Gordon model, Isot. Environ. Health Stud., 44, 23–49, https://doi.org/10.1080/10256010801887174, 2008.
Huang, L. and Wen, X.: Temporal variations of atmospheric water vapor δD and δ18O above an arid artificial oasis cropland in the Heihe River Basin, J. Geophys. Res.-Atmos., 119, 11456–11476, https://doi.org/10.1002/2014JD021891, 2014.
IAEA/WMO: The Global Network of Isotopes in Precipitation database, https://www.iaea.org/services/networks/gnip, last access: 26 November 2025.
Lai, C. T. and Ehleringer, J. R.: Deuterium excess reveals diurnal sources of water vapor in forest air, Oecologia, 165, 213–223, https://doi.org/10.1007/s00442-010-1721-2, 2011.
Landais, A., Barkan, E., Yakir, D., and Luz, B.: The triple isotopic composition of oxygen in leaf water, Geochim. Cosmochim. Ac., 70, 4105–4115, https://doi.org/10.1016/j.gca.2006.06.1545, 2006.
Landais, A., Risi, C., Bony, S., Vimeux, F., Descroix, L., Falourd, S., and Bouygues, A.: Combined measurements of 17Oexcess and d-excess in African monsoon precipitation: Implications for evaluating convective parameterizations, Earth Planet. Sc. Lett., 298, 104–112, https://doi.org/10.1016/j.epsl.2010.07.033, 2010.
Landais, A., Steen-Larsen, H. C., Guillevic, M., Masson-Delmotte, V., Vinther, B., and Winkler, R.: Triple isotopic composition of oxygen in surface snow and water vapor at NEEM (Greenland), Geochim. Cosmochim. Ac., 77, 304–316, https://doi.org/10.1016/j.gca.2011.11.022, 2012.
Leuenberger, M. C. and Ranjan, S.: Disentangle Kinetic From Equilibrium Fractionation Using Primary (δ17O, δ18O, δD) and Secondary (Δ17O, dex) Stable Isotope Parameters on Samples From the Swiss Precipitation Network, Front. Earth Sci., 9, 598061, https://doi.org/10.3389/feart.2021.598061, 2021.
Li, S., Levin, N. E., and Chesson, L. A.: Continental scale variation in 17O-excess of meteoric waters in the United States, Geochim. Cosmochim. Ac., 164, 110–126, https://doi.org/10.1016/j.gca.2015.04.047, 2015.
Li, S., Levin, N. E., Soderberg, K., Dennis, K. J., and Caylor, K. K.: Triple oxygen isotope composition of leaf waters in Mpala, central Kenya, Earth Planet. Sc. Lett., 468, 38–50, https://doi.org/10.1016/j.epsl.2017.02.015, 2017.
Liang, Q. S., Sha, L. J., Li, J. Y., Zhang, J., Wang, X. J., Zhou, S. L., Lin, F. Y., Xue, Y. X., Duan, R., He, Y. T., Li, H. Y., Wang, C. Y., Liu, B., Hou, Y. K., Chen, C. J., Cheng, H., and Li, T. Y.: Seasonal Variations and Controls on Triple Oxygen and Hydrogen Isotopes in Precipitation – A Case Study From Monitoring in Southwest China, J. Geophys. Res.-Atmos., 129, e2023JD040654, https://doi.org/10.1029/2023JD040654, 2024.
Lin, Y., Clayton, R. N., Huang, L., Nakamura, N., and Lyons, J. R.: Oxygen isotope anomaly observed in water vapor from Alert, Canada and the implication for the stratosphere, P. Natl. Acad. Sci. USA, 110, 15608–15613, https://doi.org/10.1073/pnas.1313014110, 2013.
Lin, Y., Wu, N., Ta, K., Landais, A., and Peng, X.: Triple Oxygen Isotopic Compositions of Ocean Water from the Mariana Trench, ACS Earth Space Chem., 5, 3087–3096, https://doi.org/10.1021/acsearthspacechem.1c00187, 2021.
Luz, B. and Barkan, E.: Variations of and in meteoric waters, Geochim. Cosmochim. Ac., 74, 6276–6286, https://doi.org/10.1016/j.gca.2010.08.016, 2010.
Majoube, M.: Fractionnement en oxygène 18 et en deutérium entre l'eau et sa vapeur, J. Chim. Phys., 68, 1423–1436, https://doi.org/10.1051/jcp/1971681423, 1971.
Mercer, J. J., Liefert, D. T., and Williams, D. G.: Atmospheric vapour and precipitation are not in isotopic equilibrium in a continental mountain environment, Hydrol. Process., 34, 3078–3101, https://doi.org/10.1002/hyp.13775, 2020.
Merlivat, L. and Jouzel, J.: Global climatic interpretation of the deuterium-oxygen 18 relationship for precipitation, J. Geophys. Res., 84, 5029–5033, https://doi.org/10.1029/JC084iC08p05029, 1979.
Michelangeli, P.-A., Vautard, R., and Legras, B.: Weather regimes: Recurrence and Quasi Stationarity, J. Atmos. Sci., 52, 1237–1256, https://doi.org/10.1175/1520-0469(1995)052<1237:WRRAQS>2.0.CO;2, 1995.
NASA/GES DISC: GLDAS Land/Sea Mask Dataset, 1° resolution, Global Land Data Assimilation System (GLDAS), based on MOD44W MODIS water mask (Carroll et al., 2009), https://ldas.gsfc.nasa.gov/gldas/vegetation-class-mask (last access: 19 March 2026), 2026.
Natali, S., Baneschi, I., Doveri, M., Giannecchini, R., Selmo, E., and Zanchetta, G.: Meteorological and geographical control on stable isotopic signature of precipitation in a western Mediterranean area (Tuscany, Italy): Disentangling a complex signal, J. Hydrol., 603, 126944, https://doi.org/10.1016/j.jhydrol.2021.126944, 2021.
Natali, S., Doveri, M., Giannecchini, R., Baneschi, I., and Zanchetta, G.: Is the deuterium excess in precipitation a reliable tracer of moisture sources and water resources fate in the western Mediterranean? New insights from Apuan Alps (Italy), J. Hydrol., 614, 128497, https://doi.org/10.1016/j.jhydrol.2022.128497, 2022.
Obermann, A., Bastin, S., Belamari, S., Conte, D., Gaertner, M. A., Li, L., and Ahrens, B.: Mistral and Tramontane wind speed and wind direction patterns in regional climate simulations, Clim. Dynam., 51, 1059–1076, https://doi.org/10.1007/s00382-016-3053-3, 2018.
Outrequin, C., Alexandre, A., Vallet-Coulomb, C., Piel, C., Devidal, S., Landais, A., Couapel, M., Mazur, J.-C., Peugeot, C., Pierre, M., Prié, F., Roy, J., Sonzogni, C., and Voigt, C.: The triple oxygen isotope composition of phytoliths, a new proxy of atmospheric relative humidity: controls of soil water isotope composition, temperature, CO2 concentration and relative humidity, Clim. Past, 17, 1881–1902, https://doi.org/10.5194/cp-17-1881-2021, 2021.
Penchenat, T., Vimeux, F., Daux, V., Cattani, O., Viale, M., Villalba, R., Srur, A., and Outrequin, C.: Isotopic Equilibrium Between Precipitation and Water Vapor in Northern Patagonia and Its Consequences on Estimate, J. Geophys. Res.-Biogeo., 125, e2019JG005418, https://doi.org/10.1029/2019JG005418, 2020.
Pfahl, S. and Sodemann, H.: What controls deuterium excess in global precipitation?, Clim. Past, 10, 771–781, https://doi.org/10.5194/cp-10-771-2014, 2014.
Pfahl, S. and Wernli, H.: Air parcel trajectory analysis of stable isotopes in water vapor in the eastern Mediterranean, J. Geophys. Res.-Atmos., 113, 1–16, https://doi.org/10.1029/2008JD009839, 2008.
Pierchala, A., Rozanski, K., Dulinski, M., and Gorczyca, Z.: Triple-isotope mass balance of mid-latitude, groundwater controlled lake, Sci. Total Environ., 814, 151935, https://doi.org/10.1016/j.scitotenv.2021.151935, 2021.
Ranjan, S., Ramanathan, A. L., Keesari, T., Singh, V. B., Kumar, N., Pandey, M., and Leuenberger, M. C.: Triple Water Vapour–Isotopologues Record from Chhota Shigri, Western Himalaya, India: A Unified Interpretation based on δ17O, δ18O, δD and Comparison to Meteorological Parameters, Front. Earth Sci., 8, 1–16, https://doi.org/10.3389/feart.2020.599632, 2021.
Reiter, I. M., Castagnoli, G., and Rotereau, A.: COOPERATE database [data set], https://cooperate.eccorev.fr/db (last access: 10 January 2022), 2015.
Risi, C., Noone, D., Worden, J., Frankenberg, C., Stiller, G., Kiefer, M., Funke, B., Walker, K., Bernath, P., Schneider, M., Bony, S., Lee, J., Brown, D., and Sturm, C.: Process-evaluation of tropospheric humidity simulated by general circulation models using water vapor isotopic observations: 2. Using isotopic diagnostics to understand the mid and upper tropospheric moist bias in the tropics and subtropics, J. Geophys. Res.-Atmos., 117, D05304, https://doi.org/10.1029/2011JD016623, 2012.
Rothfuss, Y., Quade, M., Brüggemann, N., Graf, A., Vereecken, H., and Dubbert, M.: Reviews and syntheses: Gaining insights into evapotranspiration partitioning with novel isotopic monitoring methods, Biogeosciences, 18, 3701–3732, https://doi.org/10.5194/bg-18-3701-2021, 2021.
Rozanski, K., Araguás-Araguás, L., and Gonfiantini, R.: Isotopic Patterns in Modern Global Precipitation, in: Climate Change in Continental Isotopic Records, vol. 78, edited by: Swart, K., Lohmann, K. C., Mckenzie, J., and Savin, S., 1–36, https://doi.org/10.1029/gm078p0001, 1993.
Saighi, O.: Isotopic composition of precipitation from Algiers and Assekrem, in: Isotopic composition of precipitation in the Mediterranean Basin in relation to air circulation patterns and climate: final report of a coordinated research project, 2000–2004, edited by: International Atomic Energy Agency, Vienna, Austria, 5–17, ISBN 92-0-105305-3, 2005.
Salamalikis, V., Argiriou, A. A., and Dotsika, E.: Stable isotopic composition of atmospheric water vapor in Patras, Greece: A concentration weighted trajectory approach, Atmos. Res., 152, 93–104, https://doi.org/10.1016/j.atmosres.2014.02.021, 2015.
Salmon, O. E., Welp, L. R., Baldwin, M. E., Hajny, K. D., Stirm, B. H., and Shepson, P. B.: Vertical profile observations of water vapor deuterium excess in the lower troposphere, Atmos. Chem. Phys., 19, 11525–11543, https://doi.org/10.5194/acp-19-11525-2019, 2019.
Sharp, Z. D., Wostbrock, J. A. G., and Pack, A.: Mass-dependent triple oxygen isotope variations in terrestrial materials, Geochem. Perspect. Lett., 7, 27–31, https://doi.org/10.7185/geochemlet.1815, 2018.
Simonin, K. A., Link, P., Rempe, D., Miller, S., Oshun, J., Bode, C., Dietrich, W. E., Fung, I., and Dawson, T. E.: Vegetation induced changes in the stable isotope composition of near surface humidity, Ecohydrology, 7, 936–949, https://doi.org/10.1002/eco.1420, 2014.
Sodemann, H. and Zuber, E.: Seasonal and inter-annual variability of the moisture sources for Alpine precipitation during 1995–2002, Int. J. Climatol., 30, 947–961, https://doi.org/10.1002/joc.1932, 2010.
Sodemann, H., Schwierz, C., and Wernli, H.: Interannual variability of Greenland winter precipitation sources: Lagrangian moisture diagnostic and North Atlantic Oscillation influence, J. Geophys. Res.-Atmos., 113, 1–17, https://doi.org/10.1029/2007JD008503, 2008.
Sodemann, H., Aemisegger, F., Pfahl, S., Bitter, M., Corsmeier, U., Feuerle, T., Graf, P., Hankers, R., Hsiao, G., Schulz, H., Wieser, A., and Wernli, H.: The stable isotopic composition of water vapour above Corsica during the HyMeX SOP1 campaign: insight into vertical mixing processes from lower-tropospheric survey flights, Atmos. Chem. Phys., 17, 6125–6151, https://doi.org/10.5194/acp-17-6125-2017, 2017.
Stein, A. F., Draxler, R. R., Rolph, G. D., Stunder, B. J. B., Cohen, M. D., and Ngan, F.: NOAA's HYSPLIT atmospheric transport and dispersion modeling system, B. Am. Meteorol. Soc., 96, 2059–2077, https://doi.org/10.1175/BAMS-D-14-00110.1, 2015.
Surma, J., Assonov, S., Bolourchi, M. J., and Staubwasser, M.: Triple oxygen isotope signatures in evaporated water bodies from the Sistan Oasis, Iran, Geophys. Res. Lett., 42, 8456–8462, https://doi.org/10.1002/2015GL066475, 2015.
Surma, J., Assonov, S., Herwartz, D., Voigt, C., and Staubwasser, M.: The evolution of 17O-excess in surface water of the arid environment during recharge and evaporation, Sci. Rep.-UK, 8, 1–10, https://doi.org/10.1038/s41598-018-23151-6, 2018.
Surma, J., Assonov, S., and Staubwasser, M.: Triple Oxygen Isotope Systematics in the Hydrologic Cycle, Rev. Mineral. Geochem., 86, 401–428, https://doi.org/10.2138/rmg.2021.86.12, 2021.
Tada, M., Yoshimura, K., and Toride, K.: Improving weather forecasting by assimilation of water vapor isotopes, Sci. Rep.-UK, 11, 18067, https://doi.org/10.1038/s41598-021-97476-0, 2021.
Terzer-Wassmuth, S., Araguás-Araguás, L. J., Wassenaar, L. I., and Stumpp, C.: Global and local meteoric water lines for and the spatiotemporal distribution of Δ′17O in Earth's precipitation, Sci. Rep.-UK, 13, 19056, https://doi.org/10.1038/s41598-023-45920-8, 2023.
Tian, C., Wang, L., Kaseke, K. F., and Bird, B. W.: Stable isotope compositions (δ2H, δ18O and δ17O) of rainfall and snowfall in the central United States, Sci. Rep., 8, 6712, https://doi.org/10.1038/s41598-018-25102-7, 2018.
Tremoy, G., Vimeux, F., Soumana, S., Souley, I., Risi, C., Favreau, G., and Oï, M.: Clustering mesoscale convective systems with laser-based water vapor δ18O monitoring in niamey (Niger), J. Geophys. Res., 119, 5079–5103, https://doi.org/10.1002/2013JD020968, 2014.
Tsujimura, M., Sasaki, L., Yamanaka, T., Sugimoto, A., Li, S. G., Matsushima, D., Kotani, A., and Saandar, M.: Vertical distribution of stable isotopic composition in atmospheric water vapor and subsurface water in grassland and forest sites, eastern Mongolia, J. Hydrol., 333, 35–46, https://doi.org/10.1016/j.jhydrol.2006.07.025, 2007.
Uechi, Y. and Uemura, R.: Dominant influence of the humidity in the moisture source region on the 17O-excess in precipitation on a subtropical island, Earth Planet. Sc. Lett., 513, 20–28, https://doi.org/10.1016/j.epsl.2019.02.012, 2019.
Uemura, R., Barkan, E., Abe, O., and Luz, B.: Triple isotope composition of oxygen in atmospheric water vapor, Geophys. Res. Lett., 37, 1–4, https://doi.org/10.1029/2009GL041960, 2010.
Vallet-Coulomb, C., Couapel, M., and Sonzogni, C.: Improving memory effect correction to achieve high precision analysis of δ17O, δ18O δ2H, 17O-excess and d-excess in water using cavity ring-down laser spectroscopy, Rapid Commun. Mass Sp., 35, e9108, https://doi.org/10.1002/rcm.9108, 2021.
Vautard, R.: Multiple weather regimes over the North Atlantic: Analysis of Precursors and Successors, Mon. Weather Rev., 118, 2056–2081, https://doi.org/10.1175/1520-0493(1990)118<2056:MWROTN>2.0.CO;2, 1990.
Voarintsoa, N. R. G.: A 3.5-year rainfall isotope records from northwestern Madagascar featuring 17Oexcess and implication for paleoclimate research, Appl. Geochem., 184, 106335, https://doi.org/10.1016/j.apgeochem.2025.106335, 2025.
Voigt, C.: Triple oxygen and hydrogen isotope data of atmospheric water vapor and precipitation in 2021 at the AnaEE platform O3HP in the French Mediterranean, Zenodo [data set], https://doi.org/10.5281/zenodo.20639179, 2026a.
Voigt, C.: Monte Carlo simulation to determine the precision of calibrated isotope data of atmospheric water vapor (Version 1), Zenodo [code], https://doi.org/10.5281/zenodo.19854015, 2026b.
Voigt, C.: Quantitative moisture source analysis for O3HP 2021, Zenodo [code], https://doi.org/10.5281/zenodo.19855037, 2026c.
Voigt, C., Herwartz, D., Dorador, C., and Staubwasser, M.: Triple oxygen isotope systematics of evaporation and mixing processes in a dynamic desert lake system, Hydrol. Earth Syst. Sci., 25, 1211–1228, https://doi.org/10.5194/hess-25-1211-2021, 2021.
Voigt, C., Vallet-Coulomb, C., Piel, C., and Alexandre, A.: 17O-excess and d-excess of atmospheric water vapor measured by cavity ring-down spectrometry: Evidence of a matrix effect and implication for the calibration procedure, Rapid Commun. Mass Spectrom., 36, e9227, https://doi.org/10.1002/rcm.9227, 2022.
Voigt, C., Alexandre, A., Reiter, I. M., Orts, J.-P., Vallet-Coulomb, C., Piel, C., Mazur, J.-C., Aleman, J. C., Sonzogni, C., Miche, H., and Ogée, J.: Examination of the parameters controlling the triple oxygen isotope composition of grass leaf water and phytoliths at a Mediterranean site: a model–data approach, Biogeosciences, 20, 2161–2187, https://doi.org/10.5194/bg-20-2161-2023, 2023.
Voigt, C., Gázquez, F., Martegani, L., Sánchez Villanueva, A. I., Medina, A., Jiménez-Espinosa, R., Jiménez-Millán, J., and Rodríguez-Rodríguez, M.: How seasonal hydroclimate variability drives the triple oxygen and hydrogen isotope composition of small lake systems in semiarid environments, Hydrol. Earth Syst. Sci., 29, 1783–1806, https://doi.org/10.5194/hess-29-1783-2025, 2025.
waterisotopes-CISE-LOCEAN: Water isotopes of sea water analyzed since 1998 at LOCEAN, SEANOE [data set], https://doi.org/10.17882/71186, 2025.
Welp, L. R., Lee, X., Griffis, T. J., Wen, X. F., Xiao, W., Li, S., Sun, X., Hu, Z., Val Martin, M., and Huang, J.: A meta-analysis of water vapor deuterium-excess in the midlatitude atmospheric surface layer, Global Biogeochem. Cy., 26, 1–12, https://doi.org/10.1029/2011GB004246, 2012.
Wen, X. F., Zhang, S. C., Sun, X., Yu, G., and Lee, X.: Water vapor and precipitation isotope ratios in Beijing, China, J. Geophys. Res.-Atmos., 115, D01103, https://doi.org/10.1029/2009JD012408, 2010.
Xia, Z., Welker, J. M., and Winnick, M. J.: The Seasonality of Deuterium Excess in Non-Polar Precipitation, Global Biogeochem. Cy., 36, e2021GB007245, https://doi.org/10.1029/2021GB007245, 2022.
Xia, Z., Surma, J., and Winnick, M. J.: The response and sensitivity of deuterium and 17O-excess parameters in precipitation to hydroclimate processes, Earth-Sci. Rev., 242, 104432, https://doi.org/10.1016/j.earscirev.2023.104432, 2023.
Zannoni, D., Steen-Larsen, H. C., Stenni, B., Dreossi, G., and Rampazzo, G.: Synoptic to mesoscale processes affecting the water vapor isotopic daily cycle over a coastal lagoon, Atmos. Environ., 197, 118–130, https://doi.org/10.1016/j.atmosenv.2018.10.032, 2019.
Zannoni, D., Steen-Larsen, H. C., Peters, A. J., Wahl, S., Sodemann, H., and Sveinbjörnsdóttir, A. E.: Non-equilibrium fractionation factors for and 18O/16O during oceanic evaporation in the north-west Atlantic region, J. Geophys. Res.-Atmos., 127, e2022JD037076, https://doi.org/10.1029/2022JD037076, 2022.
Zhang, Y., Legrande, A. N., Goodkin, N., Nusbaumer, J., He, S., Schmidt, G. A., and Wang, X.: Exploring Precipitation Triple Oxygen Isotope Dynamics: Insights from GISS-E2.1 Simulations, J. Adv. Model. Earth Sy., 17, e2024MS004509, https://doi.org/10.1029/2024MS004509, 2025.
Zhao, L., Wang, L., Liu, X., Xiao, H., Ruan, Y., and Zhou, M.: The patterns and implications of diurnal variations in the d-excess of plant water, shallow soil water and air moisture, Hydrol. Earth Syst. Sci., 18, 4129–4151, https://doi.org/10.5194/hess-18-4129-2014, 2014.