the Creative Commons Attribution 4.0 License.
the Creative Commons Attribution 4.0 License.
 | 30 Jun 2026
El Niño meets elevated Tibetan Plateau snow cover: independent and synergistic effects on the winter PM2.5 dipole pattern in China
Xiaorui Zhang
Yuyang Han
Siyu Chen
Xiadong An
Chen Sheng
Wansuo Duan
Qinglong You
Xingyue Hao
Ziqi Qiu
Zhihan Zhang
Zicheng Zhuang
Snow cover over the Tibetan Plateau (TP) plays a vital role in shaping regional and large-scale atmospheric circulation through snow-albedo feedbacks. However, its influence on fine particulate matter (PM2.5) pollution in China remains unclear. This study reveals that winter PM2.5 variability in China is controlled by both anthropogenic emissions and large-scale atmospheric circulation. Large-scale circulation creates a north-south dipole pattern over eastern China, which is mainly contributed by El Niño and snow cover over the northern TP. Observational data and model simulations confirm that El Niño mainly impacts PM2.5 in southern China by enhancing moisture transport and wet scavenging, while increased snow cover over the northern TP independently promotes accumulation and hygroscopic growth of aerosols in northern China. Moreover, El Niño and TP snow cover interact synergistically, particularly during their positive phases, intensifying circulation anomalies linked to the PM2.5 dipole. These findings emphasize the importance of cryospheric and oceanic variability in influencing winter air quality and offer valuable insights for improving seasonal prediction of air pollution in China.
- Article
(9082 KB) - Full-text XML
-
Supplement
(2078 KB) - BibTeX
- EndNote


Over the past two decades, rapid industrialization, urbanization, and the resulting rise in energy consumption have caused frequent and severe fine particulate matter (PM2.5) pollution in China (Huang et al., 2014; Wu et al., 2024; Friedlingstein et al., 2022; Gao et al., 2020). Although stringent clean air regulations introduced since 2013 have resulted in a marked nationwide decline in PM2.5 concentrations, heavy pollution episodes still commonly occur in major urban clusters, particularly during the winter months (Wang et al., 2020). Chronic exposure to elevated PM2.5 levels significantly raises the risks of lung cancer as well as respiratory and cardiovascular diseases (Apte et al., 2015; Lin et al., 2018; Xiao et al., 2023). Beyond health impacts, severe haze events degrade visibility and adversely affect human well-being, tourism, transportation safety, and regional economic activities (Berman et al., 2019; Zhou et al., 2018).
PM2.5 originates from both direct emissions and secondary formation from gaseous precursors (Huang et al., 2014). In China, anthropogenic emissions largely drive the long-term trends in PM2.5 (Xiao et al., 2021; Zhang and Gao, 2026), and reductions in emissions have been crucial to recent improvements in air quality (Gao et al., 2020). Nevertheless, meteorological factors strongly influence PM2.5 variability on daily, seasonal, and interannual timescales by affecting pollutant emissions, transport, dispersion, removal, and chemical production (Xiao et al., 2021; Zhai et al., 2019; Chen et al., 2020). For instance, enhanced wind speeds during winter associated with cold air outbreaks from Siberia can lower PM2.5 concentrations by as much as 28 µg m−3 for every 1 m s−1 increase in wind speed (Zhang et al., 2022; Huang et al., 2021). Additionally, high relative humidity favors aerosol hygroscopic growth and secondary formation, particularly in northern China, where PM2.5 exhibits greater hygroscopicity when concentrations exceed 90 µg m−3 in winter (Cheng et al., 2015; Huang et al., 2014).
Emerging evidence suggests that meteorological conditions conducive to severe air pollution are closely linked to large-scale climate patterns (Zhang et al., 2025; Gao et al., 2023). El Niño-Southern Oscillation (ENSO), the primary ocean-atmosphere coupled climate signal near the equator, has been extensively shown to influence winter PM2.5 pollution in China (An et al., 2023; Xie et al., 2022). Previous studies have shown that ENSO can significantly intensify early winter PM2.5 levels over the Beijing-Tianjin-Hebei (BTH) region by inducing atmospheric teleconnections that generate anticyclonic circulation anomalies over Northeast Asia, which suppress ventilation and favor pollutant accumulation (Zhao et al., 2022). Consistently, El Niño years are associated with increased winter PM2.5 concentrations over BTH and decreased levels over the Pearl River Delta (PRD) (Xie et al., 2022; An et al., 2022). In addition, PM2.5 variability in China has also been connected to other major climate modes, including Arctic sea ice fluctuations and the Pacific Decadal Oscillation (An et al., 2023; Zhang et al., 2025; Yin et al., 2021).
The Tibetan Plateau (TP) is a distinctive high-altitude region notable for its extensive and persistent snow cover (Li et al., 2018; Yao et al., 2012). Owing to its high albedo, emissivity, and low thermal conductivity, the snow cover significantly influences surface energy balance and atmospheric heating across the TP (Barnett et al., 1988; Yao et al., 2015). Changes in snow cover on the TP can markedly affect thermal state of the plateau and influence regional and broader atmospheric circulation patterns through snow-albedo feedbacks (Li et al., 2018; You et al., 2020). Previous studies have documented the impacts of TP snow cover on the East Asian monsoon, precipitation in South and East Asia, and the frequency of landfalling typhoons in China (Jia et al., 2021; Chen et al., 2021; You et al., 2020; Xie et al., 2005; Yao et al., 2019). However, the influence of TP snow cover on PM2.5 pollution over China remains largely unexplored.
In this study, we demonstrate that, alongside ENSO, snow cover over the northern Tibetan Plateau independently influences winter PM2.5 variability in China. Using a combination of empirical orthogonal function (EOF) analysis, statistical methods, and sensitivity simulations, we illustrate the physical mechanisms underlying the associations with both El Niño and TP snow cover. Additionally, synergistic diagnostic and composite analyses are used to examine how El Niño and TP snow cover jointly influence circulation patterns associated with PM2.5 in China. These findings provide new insights into the roles of cryospheric and oceanic variability in shaping winter air quality in China and carry important implications for enhancing seasonal predictions of PM2.5 pollution.
2.1 Data
Snow cover data were obtained from the National Oceanic and Atmospheric Administration (NOAA) Climate Data Record (Robinson et al., 2012), provided by the Rutgers University Global Snow Lab. This original weekly snow dataset, with a horizontal resolution of 25 km, spans from October 1966 to the present. In this study, the snow data were averaged into monthly means and regridded to 2°×2° grids.
Satellite-derived daily ground-level PM2.5 concentrations over China were obtained from the Long-term Gap-free High-resolution Air Pollutants concentration dataset (LGHAP) version 2 (Bai et al., 2024). The LGHAP PM2.5 data, covering 2005–2021, have a spatial resolution of 1 km and were developed by integrating satellite retrievals, ground-based observations, and numerical simulations through machine learning methods. Validation against observations from the China National Environmental Monitoring Center (CNEMC) indicates strong reliability, with a high correlation coefficient of 0.95 and a root mean square error (RMSE) of 12.03 µg m−3, supporting its suitability for long-term spatiotemporal analysis (Bai et al., 2024).
Meteorological variables including sea surface temperature (SST), geopotential height, zonal and meridional winds at 200 hPa, 500 hPa and the surface, relative humidity, precipitation, planetary boundary layer height, surface sensible heat flux, surface latent heat flux, surface net long-wave radiation flux, surface net short-wave radiation flux, top net long-wave radiation flux, top net short-wave radiation flux, and snow albedo at a spatial resolution of 0.25°×0.25° were obtained from the European Centre for Medium-Range Weather Forecasts (ECMWF) ERA5 dataset (Zhang et al., 2022; You et al., 2020; Hersbach et al., 2020). The monthly sea ice concentration data, with a horizontal resolution of 1.0°×1.0° was provided by Met Office Hadley Centre. The winter El Niño indices during 2005–2021 were retrieved from NOAA.
To examine the atmospheric response to snow cover anomalies, the total atmospheric column heat source (Q1), was calculated as, following by Zhao and Chen (2001),
where SH denotes surface sensible heat flux, Rnet represents net atmospheric column radiation, and LP is latent heat released through condensation.
Anthropogenic emissions of sulfur dioxide (SO2) and nitrogen oxides (NOx) for the period 2005–2021 were obtained from the Multi-resolution Emission Inventory for China (MEIC) (Wu et al., 2024).
2.2 Statistical methods
The interannual spatiotemporal variability of winter PM2.5 concentrations over China during 2005–2021 was analyzed using EOF decomposition. The first two EOF modes were emphasized, as they were well separated from higher-order modes based on the North test (North et al., 1982).
To diagnose the propagation characteristics of atmospheric Rossby waves, the horizontal wave activity flux (WAF) was computed using the formulation based on the conservation of wave-activity momentum (Takaya and Nakamura, 2001):
where ψ denotes the geostrophic stream function, and subscripts represent partial derivatives. U corresponds to the horizontal wind vector, whereas u and v indicate its zonal and meridional components, respectively. W represents the two-dimensional Rossby wave activity flux.
To assess whether a synergistic effect exists between the influences of Niño 1+2 index and Tibetan Plateau snow cover (TPSC) on winter PM2.5 variability, the statistical diagnostic method proposed by Li et al. (2019) was applied. The Niño 1+2 and TPSC indices were classified into positive (+), neutral (0), and negative (−) phases based on ±0.5 standard deviations. The combinations of Niño 1+2 and TPSC phases are summarized in Table 1.
Table 1The combinations of different phases of the winter Niño 1+2 and TPSC during 1979–2021.
2.3 CESM model experiments
The Community Earth System Model version 2.1.3 (CESM v2.1.3) was employed to investigate how circulation patterns and PM2.5 concentrations respond to SST and snow cover anomalies. The model was configured with a horizontal resolution of 0.94°×1.25° and 70 vertical layers (Gent et al., 2011), using the FWHIST component. The atmospheric processes were simulated using the Community Atmosphere Model version 6, while chemical and land processes were represented by the Whole Atmosphere Community Climate Model version 6 (Gettelman et al., 2019). The aerosol microphysical and chemical processes in CESM have been extensively developed and validated in previous studies (Gettelman et al., 2019; Danabasoglu et al., 2020; Liu et al., 2021). We assessed CESM's ability to reproduce observed surface air temperature, relative humidity, and PM2.5 concentrations in the control simulation (CESMctrl), as shown in Fig. S1 in the Supplement. The results demonstrate that CESMctrl generally captures the spatial patterns and interannual variability of these variables. Quantitatively, the mean fractional biases (MFBs) and mean fractional errors (MFEs) for PM2.5 fall within the widely adopted model performance criteria of ±60 % for MFB and below +75 % for MFE (Boylan and Russell, 2006), indicating acceptable simulation skill. CESM reproduces meteorological variables better than aerosol concentrations, which are subject to larger uncertainties arising from emission inputs, chemical processing, and aerosol-cloud interactions (Liu et al., 2021; Danabasoglu et al., 2020).
SST was prescribed to isolate the effects of SST forcing. CESMctrl was forced with monthly varying climatological SSTs. Two additional sensitivity experiments were conducted: (1) CESMElNiño, in which composite winter SST anomalies associated with Niño 1+2 were imposed; and (2) CESMTPSC, in which surface albedo over the northern Tibetan Plateau (86–94° E, 35–40° N) was set to a minimum of 0.8 to represent enhanced snow cover conditions (Cohen and Rind, 1991), following Wang et al. (2021). Specifically, when the model-simulated albedo falls below 0.8, it is reset to 0.8 to represent increased snow cover over the northern Tibetan Plateau. Grid points where albedo already exceeds this threshold retain their original values. All simulations covered the period from November 2010 to February 2011, during which both Niño 1+2 and TPSC were in neutral phases (Table 1). Surface PM2.5 concentrations were derived from the model output by extracting the lowest vertical level of the simulated three-dimensional PM2.5 field. Given the uncertainties in CESM-simulated PM2.5 concentrations, model outputs are interpreted in terms of the direction and spatial pattern of PM2.5 changes rather than their absolute magnitudes. Statistical significance was evaluated using daily model output during the winter simulation period.
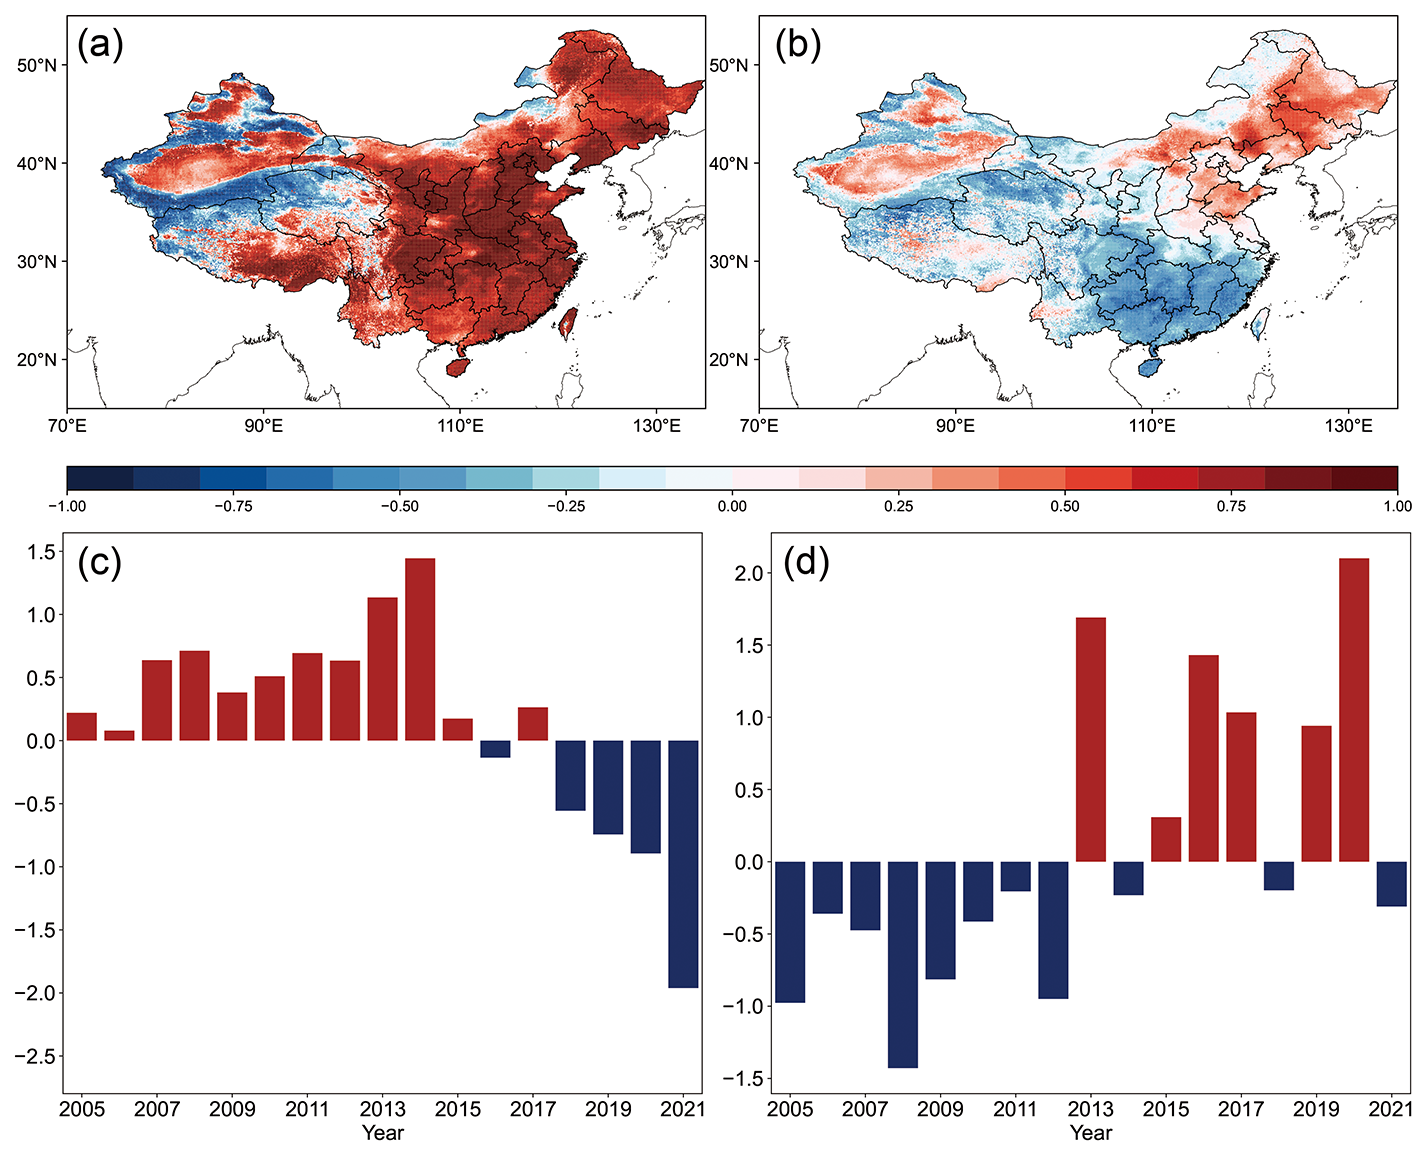
Figure 1Spatial patterns of (a) EOF1, and (b) EOF2. Interannual variations of standardized (c) PC1 and (d) PC2 during winter from 2005 to 2021.
3.1 Major modes of winter PM2.5 concentrations over China
Figure 1 presents the leading two EOF modes of winter PM2.5 concentrations over China. Both modes are distinctly separated according to the North test, indicating their statistical robustness. The dominant mode (EOF1), accounting for 56.2 % of the total variance, exhibits a spatially coherent pattern characterized by uniformly elevated PM2.5 concentrations across eastern China. The corresponding normalized principal component (PC1) shows a pronounced increase from 2005 to 2013, followed by a marked decline after 2014. This temporal evolution closely mirrors trends in anthropogenic emissions, with rapid growth in energy consumption and emissions during 2005–2013 while the introduction of stringent clean air policies since 2013. Quantitatively, PC1 is almost perfectly correlated with regional mean PM2.5 concentrations (R=0.99) and also shows strong correlations with anthropogenic NOx and SO2 emissions (R=0.70 and 0.71, respectively). These relationships indicate that EOF1 primarily represents the influence of anthropogenic emission variability on winter PM2.5 over eastern China.
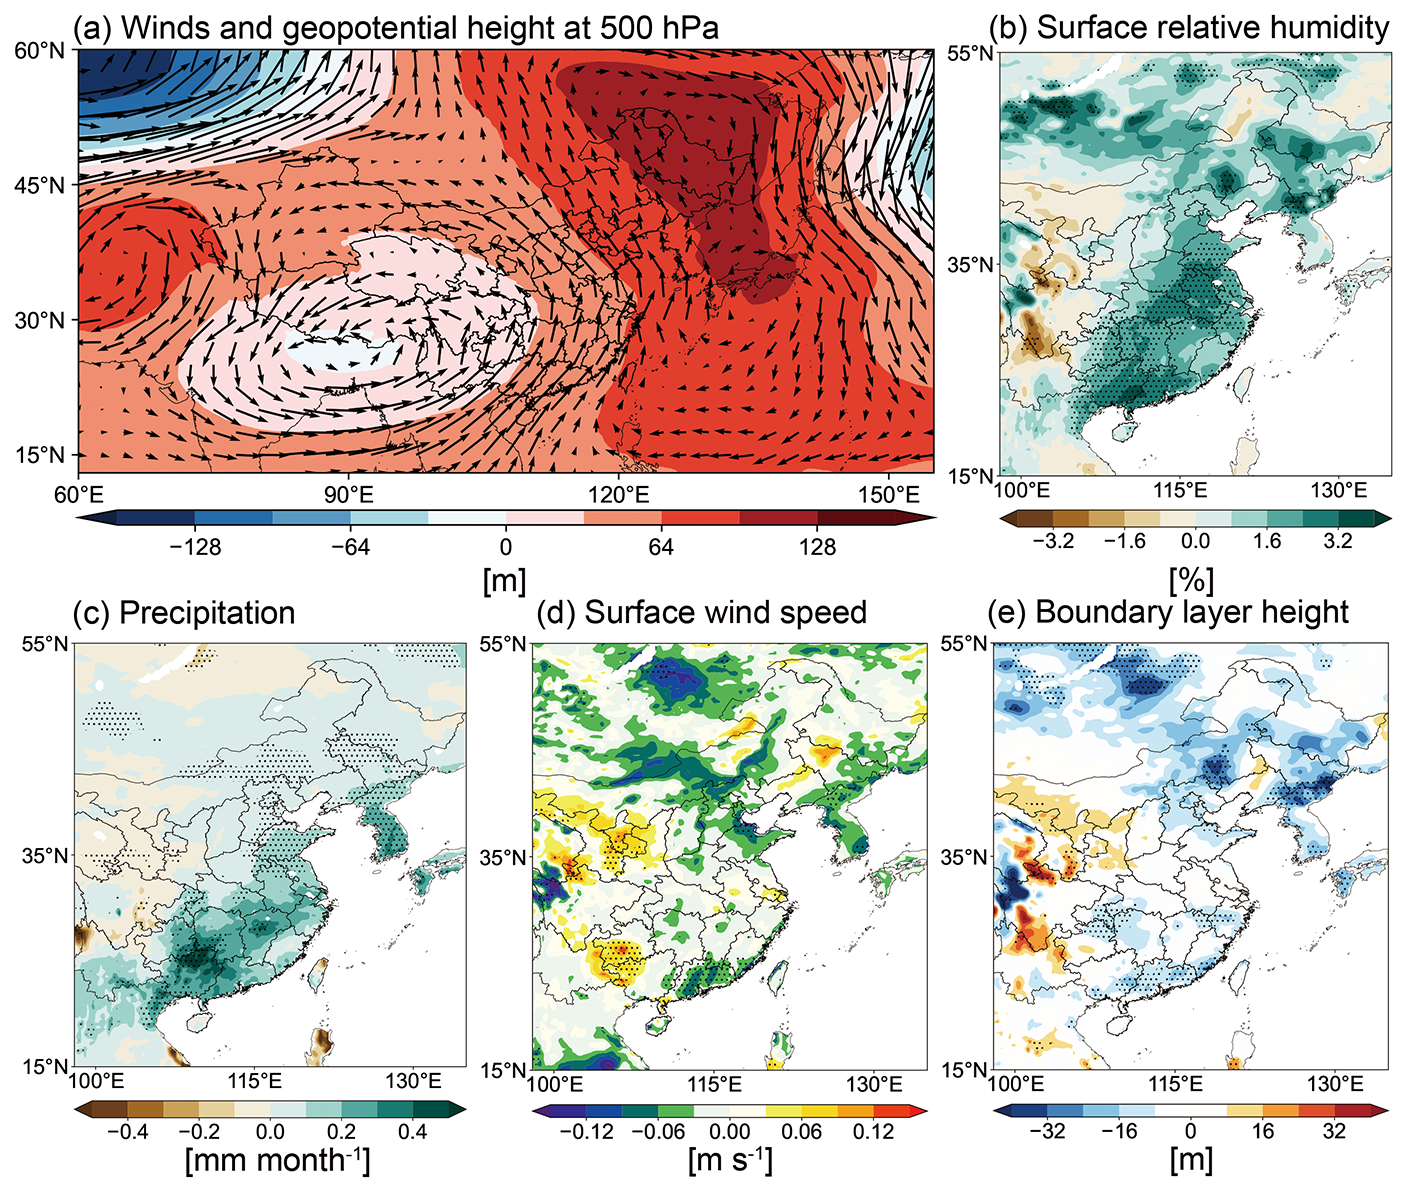
Figure 2Anomalies of (a) geopotential height (m, shading) and wind fields (m s−1, vector) at 500 hPa, (b) relative humidity at 1000 hPa (%), (c) total precipitation (mm per month), (d) surface wind speed (m s−1), and (e) planetary boundary layer height (m) during winter over 2005–2021 obtained by regression upon normalized PC2. Dotted areas represent statistical significance with 95 % confidence according to Student's t test.
EOF2, accounting for 13.2 % of the total variance, reveals a pronounced north-south dipole pattern in winter PM2.5 concentrations over eastern China, characterized by positive anomalies in northern China and negative anomalies in southern China. PC2 displays strong interannual variability, with predominantly negative values before 2012 and mainly positive values during 2013–2020. We examined the correlations between PC2 and anthropogenic SO2 and NOx emissions across eastern, northern, and southern China. The correlation coefficients between PC2 and SO2 (NOx) emissions are −0.31 (−0.01), −0.37 (0.07), and −0.33 (−0.11) in eastern, northern, and southern China, respectively. None of these correlations are statistically significant, and critically, they exhibit no north-south dipole structure that could mirror the EOF2 pattern. This confirms that the spatially heterogeneous emission controls do not drive the EOF2 dipole structure. To elucidate the meteorological conditions underlying the EOF2 dipole structure, regression maps of atmospheric circulation and meteorological fields onto the normalized PC2 are shown in Fig. 2. At the 500 hPa level, a pronounced anticyclonic circulation anomaly is observed over northeastern China and Japan, accompanied by a weaker cyclonic anomaly over the southern Tibetan Plateau. This configuration induces anomalous southerly flow across eastern China. In southern China, these southerly winds transport humid air from the South China Sea, enhancing precipitation by approximately 0.2 mm per month and promoting wet removal of PM2.5. In contrast, over northern China, the southerly anomalies weaken atmospheric ventilation, as reflected by reduced surface wind speeds (−0.05 m s−1) and a suppressed planetary boundary layer height (−30 m), favoring pollutant accumulation and increasing PM2.5 levels. As a result, anomalous southerly flow exerts opposite influences on winter PM2.5 concentrations in northern and southern China, which is consistent with previous findings (Zhang et al., 2022; An et al., 2022). These results confirm that EOF2 dipole pattern primarily reflects large-scale meteorological forcing rather than anthropogenic emission variability.
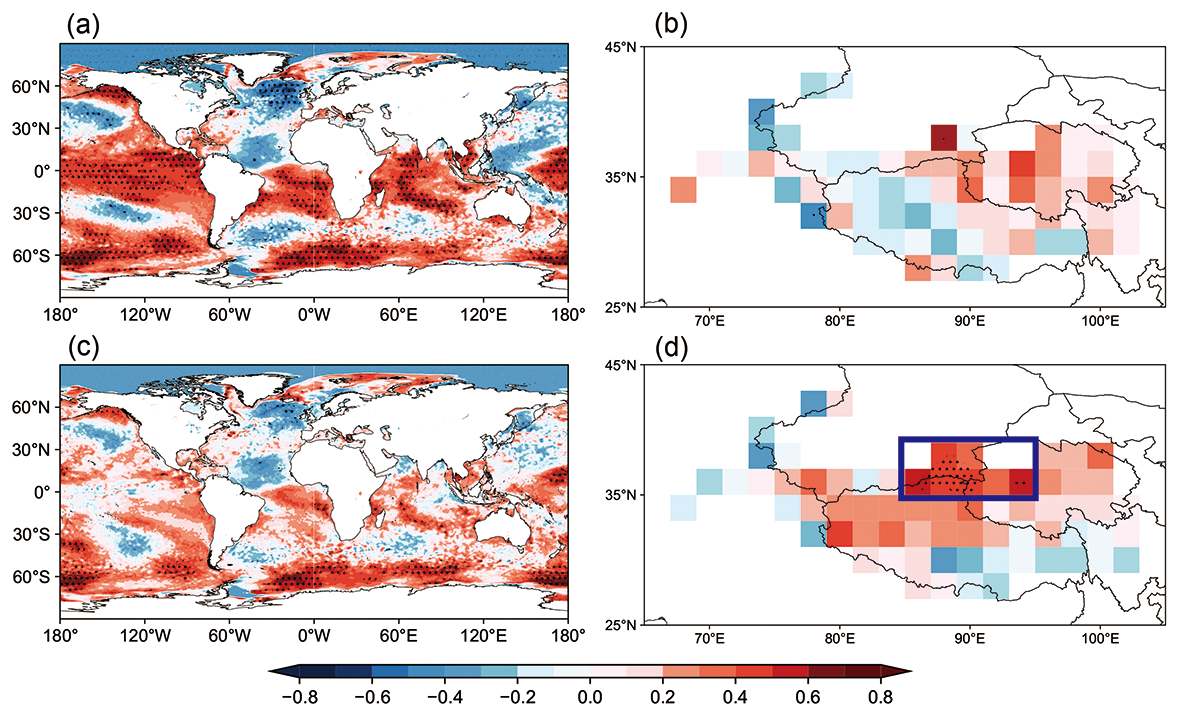
Figure 3Correlation and partial correlation patterns of PC2 with (a, c) winter SST and (b, d) Tibetan Plateau snow cover, with the influence of Niño 1+2 removed. Dotted areas represent statistical significance with 95 % confidence according to Student's t test.
To further elucidate the large-scale climate drivers underlying the EOF2 mode, correlation analyses were performed between PC2 and winter SST anomalies (Fig. 3). Strong correlations are found over the central and eastern equatorial Pacific, indicating a close linkage with ENSO, consistent with its well-documented influence on East Asian climate (Zhao et al., 2022; Xie et al., 2022). The correlation coefficients between PC2 and the Niño 1+2, Niño 3, and Niño 3.4 indices are 0.53, 0.51, and 0.51, respectively (all significant at the 95 % confidence level). Significant correlations are also identified between PC2 and SST anomalies in the Southern Hemisphere, resembling the pattern associated with the Antarctic Oscillation (AAO). The correlation coefficient between PC2 and the AAO index reaches −0.48 (P<0.05). To isolate the ENSO contribution, partial correlation analysis was performed by removing the ENSO signal with Niño 1+2 index, which exhibits the strongest correlation with PC2. After excluding the ENSO signal, the SST-PC2 relationship over the Northern Hemisphere becomes statistically insignificant (Fig. 3c). Consistently, the partial correlation between PC2 and the AAO index decreases to −0.22 and is no longer significant (P>0.1), attributed to the strong coupling between ENSO and the AAO (Han et al., 2017). Although Arctic sea ice has been reported to influence PM2.5 pollution in China (An et al., 2023; Yin et al., 2021; Zhang et al., 2025), no significant correlation is detected between Arctic sea ice and PC2 (Fig. S2). In contrast, snow cover over the northern Tibetan Plateau becomes significantly correlated with PC2 after the ENSO signal is removed (Fig. 3d), suggesting that Tibetan Plateau snow anomalies exert an additional and independent modulation of the north-south dipole pattern of winter PM2.5 over eastern China.
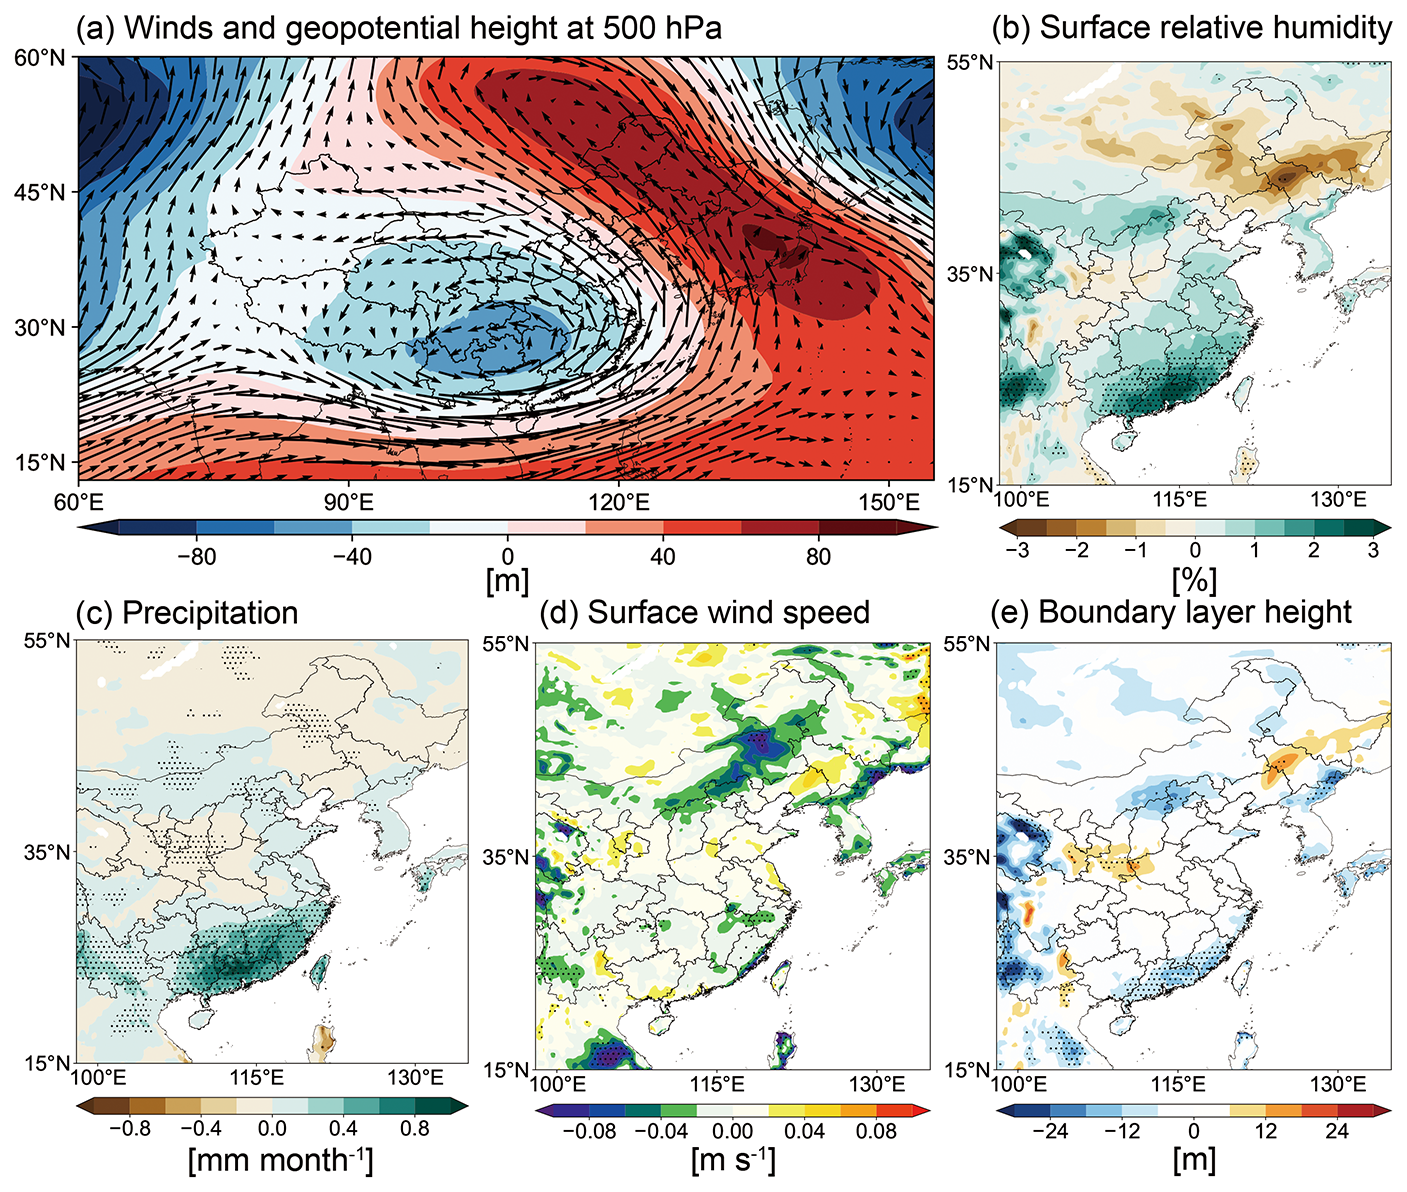
Figure 4Anomalies of (a) geopotential height (m, shading) and wind fields (m s−1, vector) at 500 hPa, (b) relative humidity at 1000 hPa (%), (c) total precipitation (mm per month), (d) surface wind speed (m s−1), and (e) planetary boundary layer height (m) during winter over 1979–2021 obtained by regression upon normalized Niño 1+2 index. Dotted areas represent statistical significance with 95 % confidence according to Student's t test.
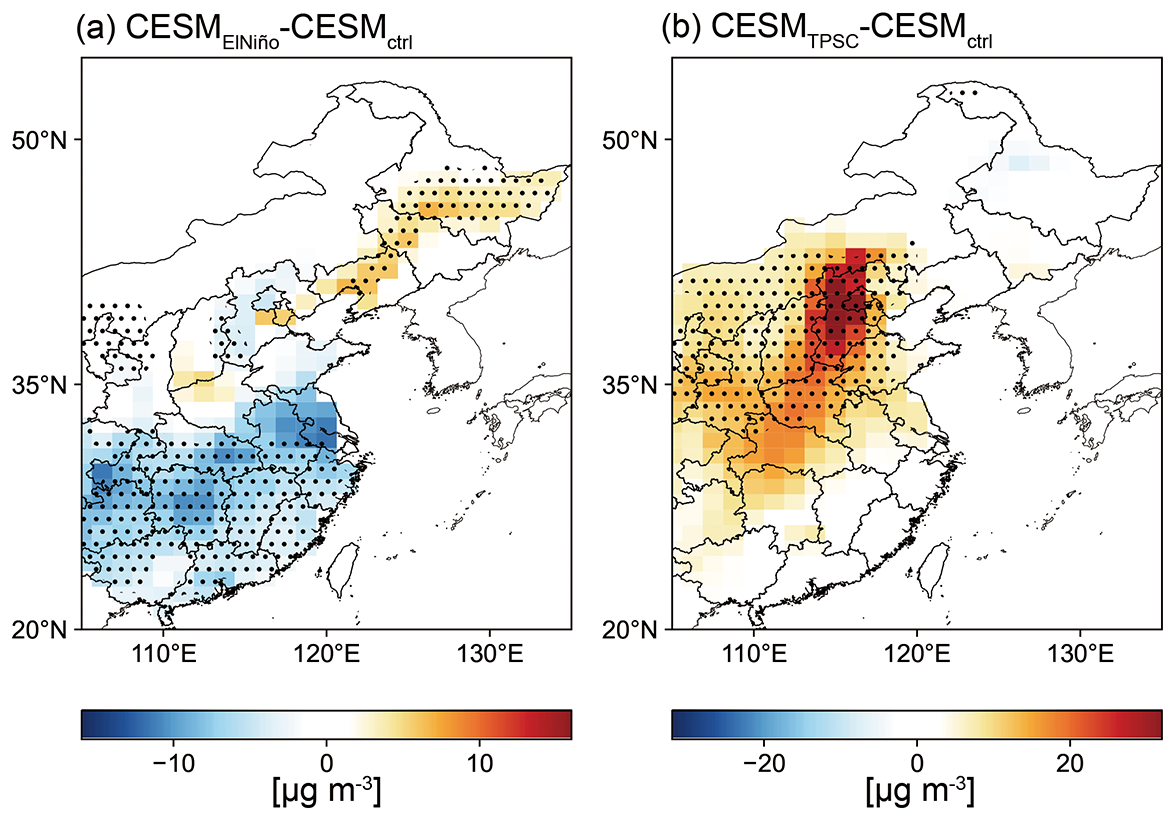
Figure 5CESM simulated responses of horizontal distribution of near-surface PM2.5 concentration (µg m−3) over eastern China during winter to (a) Niño 1+2, and (b) higher albedo forcing over the northern TP. Dotted areas indicate responses that are significant at the 95 % confidence level based on a two-tailed Student's t test applied to daily simulated anomalies during the winter period.
3.2 Impacts of El Niño on winter PM2.5 over China
As noted above, PC2 exhibits the strongest correlation with the Niño 1+2 index and also shows statistically significant correlations with other Niño indices. El Niño-related warming of the tropical Pacific can trigger a Rossby wave propagating into East Asia. This induces a strong negative and weak positive geopotential anomaly over South and North of China, respectively, which closely resembles the wave train regressed by PC2 (Fig. S3). Figure 4 illustrates the regression patterns of meteorological conditions onto the normalized Niño 1+2 index. During strong El Niño winters, positive geopotential height anomalies emerge over the western Pacific (Fig. 4a), favoring southwesterly flow over southern China and southeasterly flow over northern China. As a result, moisture transport from adjacent oceans into southern China is enhanced, leading to a significant increase in relative humidity exceeding 2 % over the PRD (Fig. 4b) and increased precipitation of approximately 0.4 mm per month (Fig. 4c). The more humid conditions promote wet scavenging of aerosols, thereby reducing PM2.5 concentrations in southern China. In contrast, over northern China, the anomalous southeasterly winds, which are opposite to the prevailing northwesterly flow, partly weaken near-surface wind speeds (Fig. 4d). Similar meteorological conditions are also found for Niño 3.4 index (Fig. S4). This meteorological contrast induced by El Niño supports the observed north-south dipole pattern of winter PM2.5 over eastern China identified in EOF2.
To further verify the role of El Niño-like SST anomalies, sensitivity simulations were conducted by imposing warm SST anomalies associated with the Niño 1+2 index (Fig. S5). Figure 5a shows the differences between the CESMElNiño and CESMctrl experiments, which isolate the atmospheric and PM2.5 response to El Niño forcing. Consistent with the statistical analysis, the imposed El Niño-like SST pattern strengthens the western Pacific subtropical high, induces anomalous southerly winds over eastern China, and enhances moisture transport into southern China (Fig. S6a, b). Consequently, surface PM2.5 concentrations decrease markedly in southern China, with reductions of approximately 12 µg m−3 over the Sichuan Basin and 6 µg m−3 over the Yangtze River Delta (Fig. 5a). In contrast, PM2.5 concentrations increase slightly over northeastern China by about 3 µg m−3, further confirming the El Niño-driven north-south dipole structure captured by EOF2.
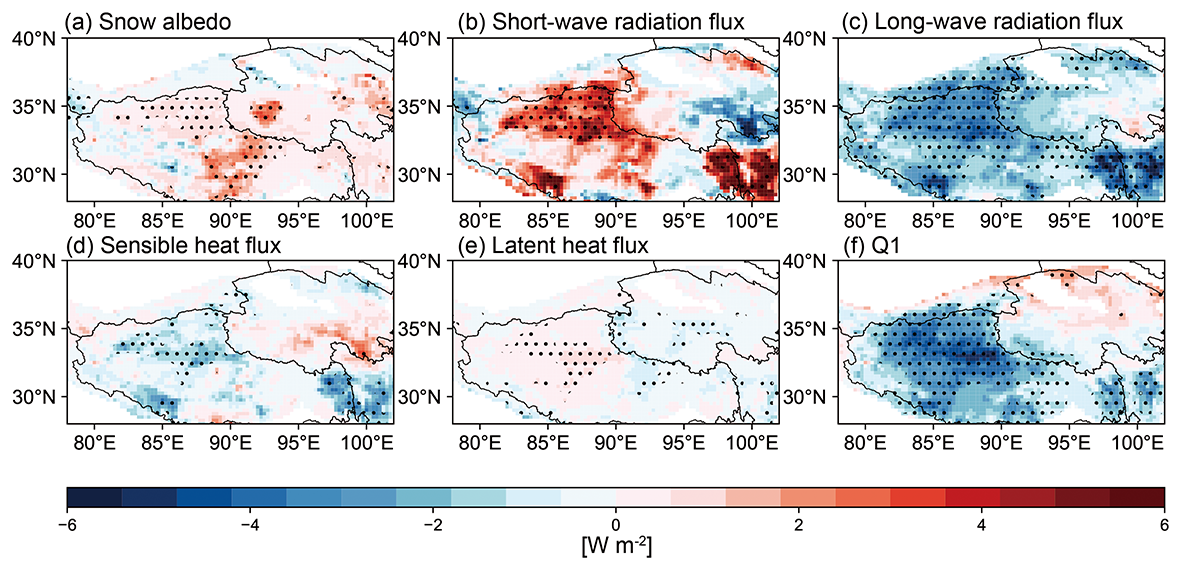
Figure 6Anomalies for (a) snow albedo (dimensionless, multiplied by 100), (b) top net short-wave radiation flux (W m−2), (c) top net long-wave radiation flux (W m−2), (d) surface sensible heat flux (W m−2), (e) surface latent heat flux (W m−2), (f) total atmospheric column heat source (W m−2) during winter over 1979–2021 obtained by regression upon normalized TPSC index. Dotted areas represent statistical significance with 95 % confidence according to Student's t test.
3.3 Impacts of TP snow anomalies on winter PM2.5 over China
After excluding the ENSO signal, PC2 remains significantly correlated with snow cover over the northern TP (Fig. 3d), indicating that interannual variability in winter PM2.5 over China is also modulated by TP snow anomalies. To quantify this relationship, we define a Tibetan Plateau Snow Cover (TPSC) index as the wintertime area-averaged snow cover over the northern TP (86–94° E, 35–40° N), described by the blue box in Fig. 3d. The TPSC index associated snow albedo exhibits pronounced interannual variability throughout 1979–2021, with notably elevated values in recent years (Fig. S7). The correlation coefficient between the Niño 1+2 index and the TPSC index is −0.28 (p>0.24), indicating that the linear dependence between the two predictors is weak and statistically insignificant. To formally evaluate the degree of multicollinearity among PC2, Niño 1+2, and TPSC, we computed the Variance Inflation Factor (VIF) for each variable. The resulting VIF values are 1.87, 1.90, and 1.47, respectively, all well below the commonly adopted threshold of 5 (O'Brien, 2007), confirming that multicollinearity does not pose a meaningful threat to the robustness of the partial correlation results. Partial correlation analysis reveals a significant positive correlation between the TPSC index and PC2 (r=0.49, p<0.05). In contrast, no statistically significant relationship emerges when a domain-wide TP snow cover index is employed, suggesting that the dynamically relevant snow signal is regionally confined to the northern TP rather than reflecting a plateau-wide forcing.
Figure 6 illustrates anomalies in surface heat fluxes and the total atmospheric column heat source regressed onto the TPSC index. Enhanced snow cover over the northern TP increases snow albedo by approximately 0.02, leading to an increase in upward shortwave radiation exceeding 4 W m−2 through the snow-albedo feedback. Meanwhile, a reduction of about 3 W m−2 in upward longwave radiation is observed over the northern TP, driven by lower surface temperatures associated with reduced short-wave radiation absorption by the surface. In contrast, anomalies in sensible and latent heat fluxes remain weak (<1 W m−2). As a consequence, a pronounced cooling effect on the atmospheric column is found over the northern TP, exceeding 5 W m−2.
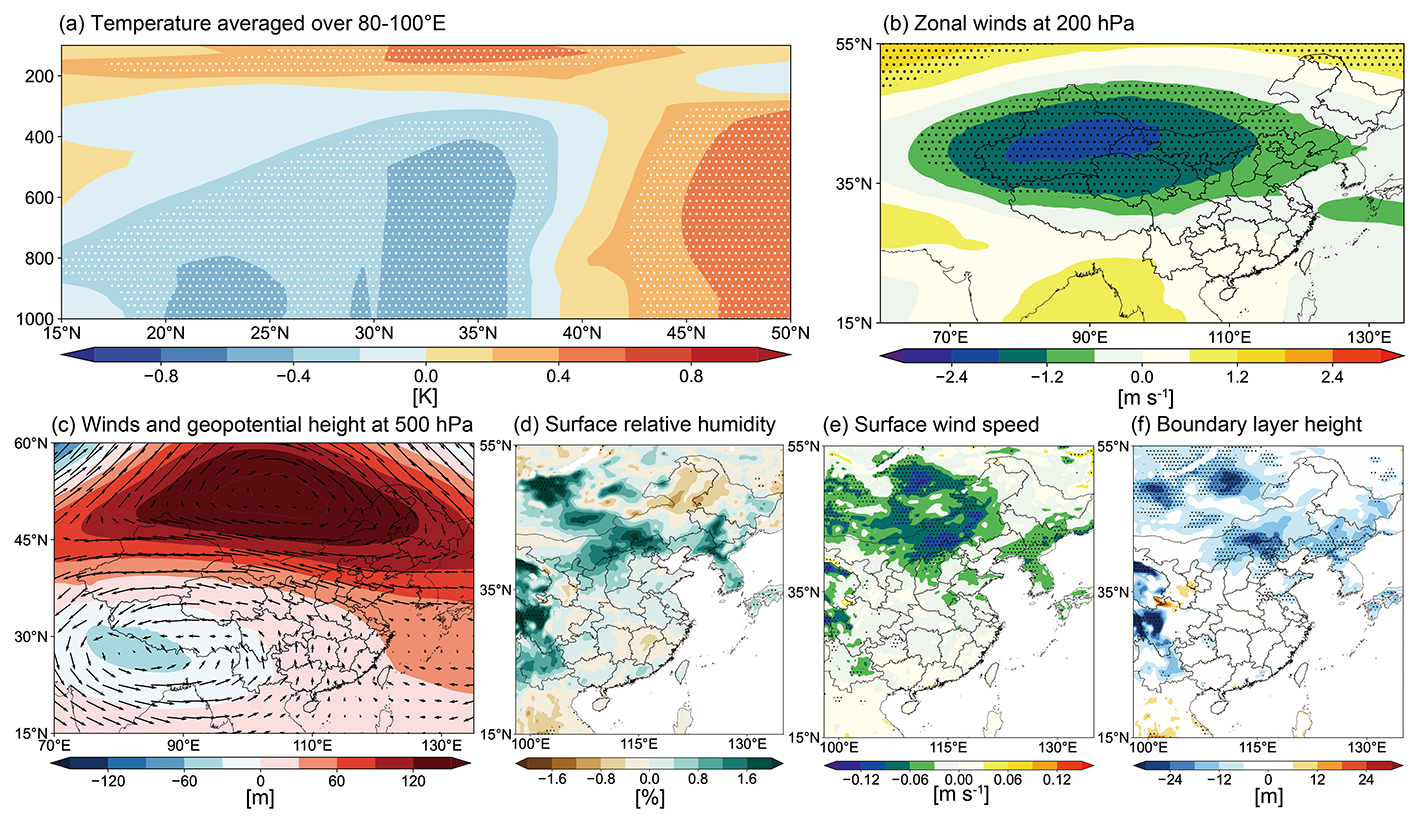
Figure 7Anomalies for (a) pressure-longitude cross sections averaged over 80–100° E of temperature (K), (b) zonal wind speeds at 200 hPa (m s−1), (c) geopotential height (m, shading) and wind fields (m s−1, vector) at 500 hPa, (d) relative humidity at 1000 hPa (%), (e) surface wind speed (m s−1), and (f) planetary boundary layer height (m) during winter over 1979–2021 obtained by regression upon normalized TPSC index. Dotted areas represent statistical significance with 95 % confidence according to Student's t test.
The cooling effect over TP modulates the meridional temperature gradient and weakens the subtropical westerly jet north of the Plateau (Fig. 7a). Associated with enhanced snow cover, 200 hPa zonal wind speeds are reduced by up to 15 m s−1, inducing an anomalous anticyclonic circulation over northern China (Fig. 7b, c). Under the influence of positive geopotential height anomalies, near-surface wind speeds decrease by more than 0.1 m s−1, and the planetary boundary layer height is reduced by approximately 15 m. These stagnant conditions favor pollutant accumulation, while concurrently elevated surface relative humidity enhances aerosol hygroscopic growth (Fig. 7d), together contributing to increased PM2.5 concentrations over northern China.
Because TP snow cover is itself influenced by local temperature, precipitation, and large-scale circulation variability, the statistical relationship may overestimate its impact on meteorological conditions and PM2.5. To assess the causal impact of TP snow cover, we performed a targeted CESM experiment (CESMTPSC) in which surface albedo over the northern TP (86–94° E, 35–40° N) was prescribed with a minimum value of 0.8. Surface albedo represents the reflectivity of the land surface, integrating contributions from all surface components including snow, soil, and vegetation. A minimum value of 0.8 was imposed to simulate persistent high snow cover conditions, consistent with the characteristically high reflectivity of snow-dominated surfaces (Cohen and Rind, 1991). The CESM results reproduce a coherent cooling response over the northern TP and a corresponding weakening of the subtropical westerly jet, which leads to increases in surface relative humidity and reductions in both planetary boundary layer height and near-surface wind speed over northern China (Fig. S6), supporting positive PM2.5 anomalies over the BTH (Fig. 5b). These modeled responses are consistent with the observational regression analysis, reinforcing the physical credibility of the identified snow-forcing mechanism.
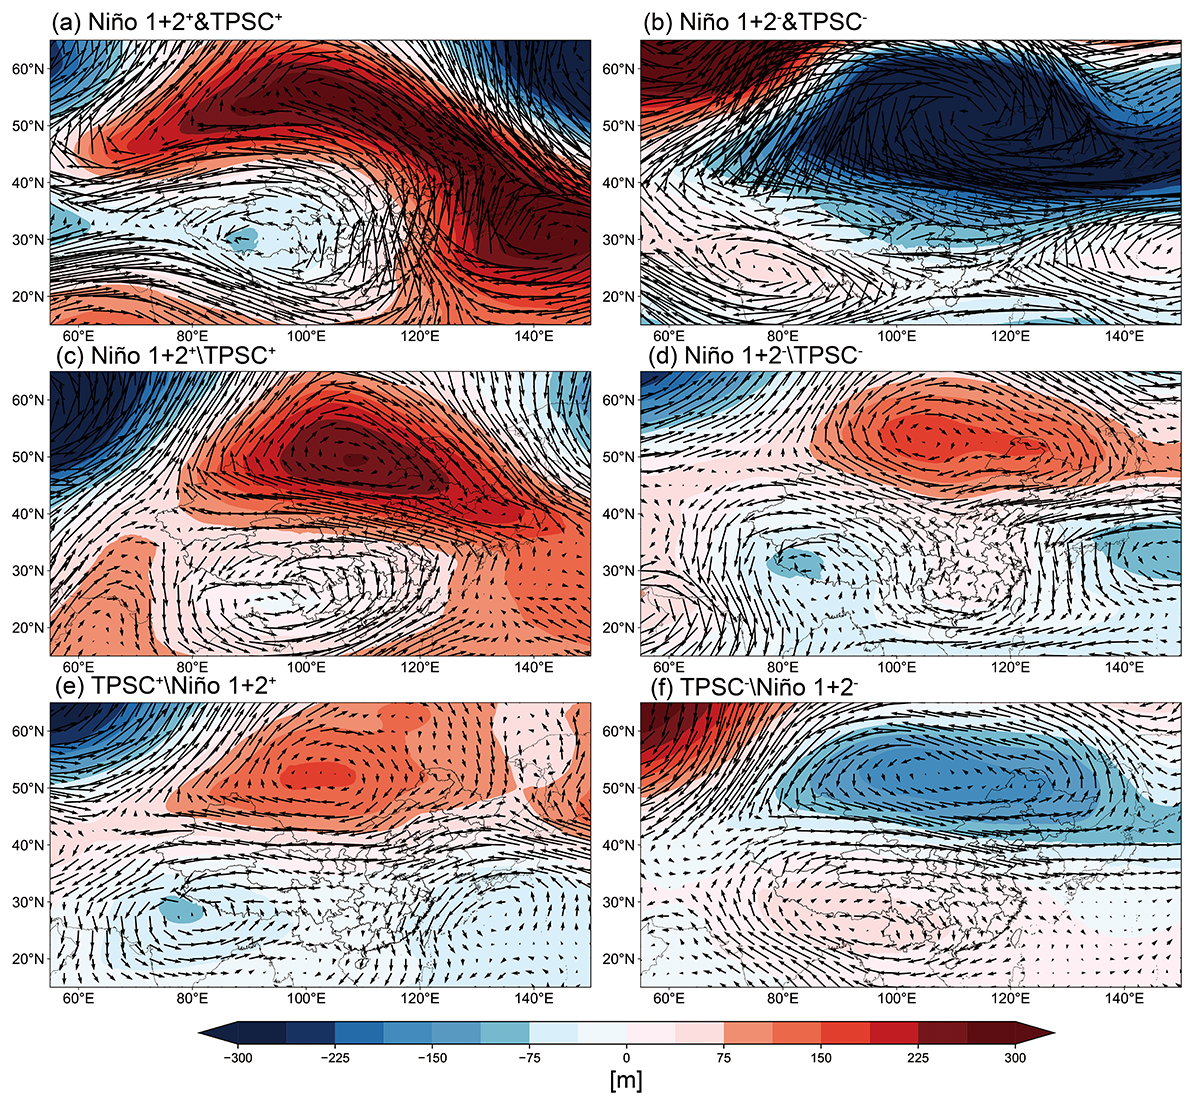
Figure 8Composite of the geopotential height (m, shading) and wind fields (m s−1, vector) at 500 hPa for (a) Niño 1+2+&TPSC+, (b) Niño 1+2−&TPSC−, (c) Niño 1+2TPSC+, (d) Niño 1+2TPSC−, (e) TPSCNiño 1+2+, and (f) TPSCNiño 1+2−.
3.4 Synergistic effects of El Niño and elevated TP snow cover on winter PM2.5 in China
The individual impacts of El Niño and the TP snow cover on winter PM2.5 in China have been confirmed, however, whether these two factors exert synergistic effects remains unclear. Following Li et al. (2019), we disentangle their respective and combined influences on circulation patterns associated with PM2.5 pollution. We focus on atmospheric circulation rather than PM2.5 concentrations directly, as meteorological variables are available over a longer period (1979–2021), whereas PM2.5 observations are limited to 2005–2021.
Composite geopotential height anomalies for different combinations of Niño 1+2 and TPSC phases are shown in Fig. 8. Following Li et al. (2019), the symbol “&” denotes years when two indices occur simultaneously in the specified phase (e.g., “Niño 1+2+&TPSC+” indicates years when both Niño 1+2 and TPSC are positive), whereas the symbol “\” denotes years when only the first index is in the specified phase while the second index is not (e.g., “Niño 1+2TPSC+” indicates years when Niño 1+2 is positive but TPSC is neutral or negative). During Niño 1+2+&TPSC+ (Niño 1+2−&TPSC−) years, strong positive (negative) geopotential height anomalies develop over northern China and the western Pacific, accompanied by negative (positive) anomalies over the TP. This circulation configuration strongly favors the north-south dipole pattern of winter PM2.5 over eastern China (Fig. 8a, b).
By contrast, during Niño 1+2TPSC+ or TPSCNiño 1+2+ years, similar circulation structures emerge but with substantially weaker anomaly amplitudes (Fig. 8c, e). Notably, during Niño 1+2TPSC+ years, El Niño also induces a negative geopotential height anomaly located over TP (Fig. 8c), similar to the impacts of TP snow (Fig. 7a). Previous studies confirmed that winter El Niño has positive impacts on TP snow by increasing storm activity and resultant snowfall (Shaman and Tziperman, 2005), which reinforce snow-albedo feedbacks and strengthen the associated circulation response. This process amplifies both the spatial extent and magnitude of circulation anomalies in Niño 1+2+&TPSC+, indicating significant synergistic effects of El Niño and TP snow cover during their positive phases.
During Niño 1+2TPSC− years, positive geopotential height anomalies are observed over Northeast Asia (Fig. 8d), which appear inconsistent with the regression results (Fig. 4a). This discrepancy arises because the Niño 1+2TPSC− composite includes three years with neutral TPSC conditions and four years with positive TPSC anomalies (Table 1). As a result, the circulation pattern is partly influenced by positive TPSC signals and exhibits geopotential height features resembling those associated with TPSC+ years (Fig. 8e). This inconsistency reflects a methodological limitation related to the small sample size inherent in the phase-classification approach (Li et al., 2019). Although geopotential height anomalies during Niño 1+2−&TPSC− years are stronger than those in &TPSCNiño 1+2− years, suggesting that simultaneous negative phases of Niño 1+2 and TPSC may also interact synergistically to enhance the circulation response, the synergistic effect is more robust and dynamically coherent during their positive phases. Therefore, we primarily conclude that Niño 1+2 and TP snow cover interact synergistically when both are in their positive phases.
This study reveals that winter PM2.5 variability across China is governed by a combination of anthropogenic emissions and large-scale climate variability. The leading EOF mode reflects the dominant role of emission changes, capturing the rapid increase in PM2.5 before 2013 and a sharp decline due to stringent clean air policies. In contrast, the second mode highlights a circulation-driven north-south dipole pattern over eastern China, underscoring the critical role of atmospheric circulation in redistributing PM2.5.
Previous studies have established that ENSO can significantly modulate winter PM2.5 over China through atmospheric teleconnections. For instance, higher (lower) winter PM2.5 concentrations are observed over BTH (PRD) during El Niño years (Xie et al., 2022; An et al., 2022; Zhao et al., 2022). While these studies have identified a north-south dipole structure in PM2.5 and emphasized the role of ENSO, the effect of ENSO on northern China PM2.5 remains debated (Zhao et al., 2022), with its influence being more robustly established over southern China. Our results are broadly consistent with these findings and further clarify that El Niño primarily modulates winter PM2.5 through large-scale circulation anomalies that enhance moisture transport and wet scavenging in southern China, while its effect on northern China ventilation is comparatively weaker and less definitive.
Beyond ENSO, we identify that elevated snow cover over the northern TP increases snow albedo and cools the atmospheric column via snow-albedo feedbacks, weakening the subtropical westerly jet and inducing anticyclonic anomalies over northern China. These circulation changes promote stagnant conditions and enhance aerosol hygroscopic growth, increasing PM2.5 concentrations in northern China. This represents a previously underexplored pathway by which cryospheric anomalies influence surface air quality (Chen et al., 2021; You et al., 2020; Yao et al., 2019), thereby broadening current understanding of how climate modes regulate aerosol distributions. Importantly, El Niño and TP snow cover do not act independently. During their concurrent positive phases, circulation anomalies over East Asia are amplified, leading to a more pronounced north-south PM2.5 dipole. Specifically, El Niño exerts a dominant control over PM2.5 variability in southern China, whereas TP snow cover plays a more decisive role in northern China.
Several limitations of this study should be acknowledged.The relatively short PM2.5 observational limits constrains the robustness of statistical relationships at longer timescales. In addition, the idealized albedo perturbation in the CESMTPSC experiment does not explicitly simulate snow depth, density, or melting processes, which may lead to an overestimation of snow forcing strength compared to realistic conditions. Moreover, the CESM sensitivity experiments are based on a single-winter simulation, preventing a rigorous assessment of statistical significance in the presence of internal atmospheric variability. The model results are therefore interpreted as qualitative sensitivity tests that support the directionality of the identified mechanisms rather than as quantitative estimates of forced responses. Nevertheless, the consistency between EOF analysis, regression diagnostics, and targeted model experiments increases confidence in our main conclusions. Our results suggest that, in addition to anthropogenic emissions, ENSO and TP snow cover are dominant climate factors, modulating winter PM2.5 variability in China. These insights offer promising potential for enhancing seasonal prediction of winter air quality and informing PM2.5 pollution management strategies.
The meteorological Reanalysis are from ERA5 reanalysis data (https://cds.climate.copernicus.eu/datasets, last access: 25 June 2026). Snow cover data is obtained from https://doi.org/10.7289/V5N014G9 (Robinson et al., 2012). MEIC anthropogenic emissions can be found from http://meicmodel.org.cn (last access: 25 June 2026). Satellite derived ground-level PM2.5 data is from https://doi.org/10.5281/zenodo.8313613 (Bai and Li, 2023).
The supplement related to this article is available online at https://doi.org/10.5194/acp-26-9207-2026-supplement.
This study was conceived by MG and XZ. XZ, YH and SC conducted simulations. XA, CS, WD, XC and QY assisted with the discussion and commented on the paper. XH, ZQ, Z, Zhang and Z, Zhuang. assisted with data collections and statistical analysis. All authors contributed to the final interpretation and writing of the manuscript with major contributions by MG and XZ.
The contact author has declared that none of the authors has any competing interests.
Publisher's note: Copernicus Publications remains neutral with regard to jurisdictional claims made in the text, published maps, institutional affiliations, or any other geographical representation in this paper. The authors bear the ultimate responsibility for providing appropriate place names. Views expressed in the text are those of the authors and do not necessarily reflect the views of the publisher.
This study was supported by the grants from the National Natural Science Foundation of China (Project No. 42322902 and 42375095), Key Laboratory of Urban Meteorology, China Meteorological Administration (Project No. LUM-2025-12), the Research Grants Council of the Hong Kong Special Administrative Region, China (Project Nos. C2002-22Y, HKBU12201023, and HKBU12202824), and National Key Research and Development Programs of China (No. 2022YFC3700103).
This paper was edited by Zhonghua Zheng and reviewed by two anonymous referees.
An, X., Wang, F., Sheng, L., and Li, C.: Pattern of wintertime southern rainfall and northern pollution over eastern China: The role of the strong eastern Pacific El Niño, J. Climate, 35, 7259–7273, 2022.
An, X., Chen, W., Sheng, L., Li, C., and Ma, T.: Synergistic effect of El Niño and Arctic sea-ice increment on wintertime Northeast Asian anomalous anticyclone and its corresponding PM2.5 pollution, J. Geophys. Res.-Atmos., 128, e2022JD037840, 2023.
Apte, J. S., Marshall, J. D., Cohen, A. J., and Brauer, M.: Addressing global mortality from ambient PM2.5, Environ. Sci. Technol., 49, 8057–8066, 2015.
Bai, K. and Li, K.: LGHAP v2: Global daily 1-km gap-free PM2.5 grids (2020), Zenodo [data set], https://doi.org/10.5281/zenodo.8313613, 2023.
Bai, K., Li, K., Shao, L., Li, X., Liu, C., Li, Z., Ma, M., Han, D., Sun, Y., Zheng, Z., Li, R., Chang, N.-B., and Guo, J.: LGHAP v2: a global gap-free aerosol optical depth and PM2.5 concentration dataset since 2000 derived via big Earth data analytics, Earth Syst. Sci. Data, 16, 2425–2448, https://doi.org/10.5194/essd-16-2425-2024, 2024.
Barnett, T., Dümenil, L., Schlese, U., and Roeckner, E.: The effect of Eurasian snow cover on global climate, Science, 239, 504–507, 1988.
Berman, J. D., Burkhardt, J., Bayham, J., Carter, E., and Wilson, A.: Acute air pollution exposure and the risk of violent behavior in the United States, Epidemiology, 30, 799–806, 2019.
Boylan, J. W. and Russell, A. G.: PM and light extinction model performance metrics, goals, and criteria for three-dimensional air quality models, Atmos. Environ., 40, 4946–4959, 2006.
Chen, Z., Wu, R., and Wang, Z.: Impact of autumn-winter Tibetan Plateau snow cover anomalies on the East Asian Winter Monsoon and its interdecadal change, Front. Earth Sci., 9, 699358, https://doi.org/10.3389/feart.2021.699358, 2021.
Chen, Z., Chen, D., Zhao, C., Kwan, M.-P., Cai, J., Zhuang, Y., Zhao, B., Wang, X., Chen, B., and Yang, J.: Influence of meteorological conditions on PM2.5 concentrations across China: A review of methodology and mechanism, Environ. Int., 139, 105558, https://doi.org/10.1016/j.envint.2020.105558, 2020.
Cheng, Y., He, K.-B., Du, Z.-Y., Zheng, M., Duan, F.-K., and Ma, Y.-L.: Humidity plays an important role in the PM2.5 pollution in Beijing, Environ. Pollut., 197, 68–75, 2015.
Cohen, J. and Rind, D.: The effect of snow cover on the climate, J. Climate, 4, 689–706, 1991.
Danabasoglu, G., Lamarque, J. F., Bacmeister, J., Bailey, D., DuVivier, A., Edwards, J., Emmons, L., Fasullo, J., Garcia, R., and Gettelman, A.: The community earth system model version 2 (CESM2), J. Adv. Model. Earth Sy., 12, e2019MS001916, https://doi.org/10.1029/2019ms001916, 2020.
Friedlingstein, P., Jones, M. W., O'Sullivan, M., Andrew, R. M., Bakker, D. C. E., Hauck, J., Le Quéré, C., Peters, G. P., Peters, W., Pongratz, J., Sitch, S., Canadell, J. G., Ciais, P., Jackson, R. B., Alin, S. R., Anthoni, P., Bates, N. R., Becker, M., Bellouin, N., Bopp, L., Chau, T. T. T., Chevallier, F., Chini, L. P., Cronin, M., Currie, K. I., Decharme, B., Djeutchouang, L. M., Dou, X., Evans, W., Feely, R. A., Feng, L., Gasser, T., Gilfillan, D., Gkritzalis, T., Grassi, G., Gregor, L., Gruber, N., Gürses, Ö., Harris, I., Houghton, R. A., Hurtt, G. C., Iida, Y., Ilyina, T., Luijkx, I. T., Jain, A., Jones, S. D., Kato, E., Kennedy, D., Klein Goldewijk, K., Knauer, J., Korsbakken, J. I., Körtzinger, A., Landschützer, P., Lauvset, S. K., Lefèvre, N., Lienert, S., Liu, J., Marland, G., McGuire, P. C., Melton, J. R., Munro, D. R., Nabel, J. E. M. S., Nakaoka, S.-I., Niwa, Y., Ono, T., Pierrot, D., Poulter, B., Rehder, G., Resplandy, L., Robertson, E., Rödenbeck, C., Rosan, T. M., Schwinger, J., Schwingshackl, C., Séférian, R., Sutton, A. J., Sweeney, C., Tanhua, T., Tans, P. P., Tian, H., Tilbrook, B., Tubiello, F., van der Werf, G. R., Vuichard, N., Wada, C., Wanninkhof, R., Watson, A. J., Willis, D., Wiltshire, A. J., Yuan, W., Yue, C., Yue, X., Zaehle, S., and Zeng, J.: Global Carbon Budget 2021, Earth Syst. Sci. Data, 14, 1917–2005, https://doi.org/10.5194/essd-14-1917-2022, 2022.
Gao, M., Wang, F., Ding, Y., Wu, Z., Xu, Y., Lu, X., Wang, Z., Carmichael, G. R., and McElroy, M. B.: Large-scale climate patterns offer preseasonal hints on the co-occurrence of heat wave and O3 pollution in China, P. Natl. Acad. Sci. USA, 120, e2218274120, https://doi.org/10.1073/pnas.2218274120, 2023.
Gao, M., Liu, Z., Zheng, B., Ji, D., Sherman, P., Song, S., Xin, J., Liu, C., Wang, Y., Zhang, Q., Xing, J., Jiang, J., Wang, Z., Carmichael, G. R., and McElroy, M. B.: China's emission control strategies have suppressed unfavorable influences of climate on wintertime PM2.5 concentrations in Beijing since 2002, Atmos. Chem. Phys., 20, 1497–1505, https://doi.org/10.5194/acp-20-1497-2020, 2020.
Gent, P. R., Danabasoglu, G., Donner, L. J., Holland, M. M., Hunke, E. C., Jayne, S. R., Lawrence, D. M., Neale, R. B., Rasch, P. J., and Vertenstein, M.: The community climate system model version 4, J. Climate, 24, 4973–4991, 2011.
Gettelman, A., Mills, M., Kinnison, D., Garcia, R., Smith, A., Marsh, D., Tilmes, S., Vitt, F., Bardeen, C., and McInerny, J.: The whole atmosphere community climate model version 6 (WACCM6), J. Geophys. Res.-Atmos., 124, 12380–12403, 2019.
Han, T., Wang, H., and Sun, J.: Strengthened relationship between the Antarctic Oscillation and ENSO after the mid-1990s during austral spring, Adv. Atmos. Sci., 34, 54–65, 2017.
Hersbach, H., Bell, B., Berrisford, P., Hirahara, S., Horányi, A., Muñoz-Sabater, J., Nicolas, J., Peubey, C., Radu, R., and Schepers, D.: The ERA5 global reanalysis, Q. J. Roy. Meteor. Soc., 146, 1999–2049, 2020.
Huang, R.-J., Zhang, Y., Bozzetti, C., Ho, K.-F., Cao, J.-J., Han, Y., Daellenbach, K. R., Slowik, J. G., Platt, S. M., and Canonaco, F.: High secondary aerosol contribution to particulate pollution during haze events in China, Nature, 514, 218–222, 2014.
Huang, W., Yu, Y., Yin, Z., Chen, H., and Gao, M.: Appreciable role of stratospheric polar vortex in the abnormal diffusion of air pollutant in North China in 2015/2016 winter and implications for prediction, Atmos. Environ., 259, 118549, https://doi.org/10.1016/j.atmosenv.2021.118549, 2021.
Jia, X., Zhang, C., Wu, R., and Qian, Q.: Influence of Tibetan Plateau autumn snow cover on interannual variations in spring precipitation over southern China, Clim. Dynam., 56, 767–782, 2021.
Li, J., Zheng, F., Sun, C., Feng, J., and Wang, J.: Pathways of influence of the Northern Hemisphere mid-high latitudes on East Asian climate: a review, Adv. Atmos. Sci., 36, 902–921, 2019.
Li, W., Guo, W., Qiu, B., Xue, Y., Hsu, P.-C., and Wei, J.: Influence of Tibetan Plateau snow cover on East Asian atmospheric circulation at medium-range time scales, Nat. Commun., 9, 4243, https://doi.org/10.1038/s41467-018-06762-5, 2018.
Lin, H., Wang, X., Qian, Z. M., Guo, S., Yao, Z., Vaughn, M. G., Dong, G., Liu, T., Xiao, J., and Li, X.: Daily exceedance concentration hours: A novel indicator to measure acute cardiovascular effects of PM2.5 in six Chinese subtropical cities, Environ. Int., 111, 117–123, 2018.
Liu, Y., Dong, X., Wang, M., Emmons, L. K., Liu, Y., Liang, Y., Li, X., and Shrivastava, M.: Analysis of secondary organic aerosol simulation bias in the Community Earth System Model (CESM2.1), Atmos. Chem. Phys., 21, 8003–8021, https://doi.org/10.5194/acp-21-8003-2021, 2021.
North, G. R., Bell, T. L., Cahalan, R. F., and Moeng, F. J.: Sampling errors in the estimation of empirical orthogonal functions, Mon. Weather Rev., 110, 699–706, 1982.
O'Brien, R. M.: A caution regarding rules of thumb for variance inflation factors, Qual. Quant., 41, 673–690, 2007.
Robinson, D. A., Estilow, T. W., and NOAA CDR Program: NOAA Climate Data Record (CDR) of Northern Hemisphere (NH) Snow Cover Extent (SCE), Version 1, NOAA National Centers for Environmental Information [data set], https://doi.org/10.7289/V5N014G9, 2012.
Shaman, J. and Tziperman, E.: The effect of ENSO on Tibetan Plateau snow depth: A stationary wave teleconnection mechanism and implications for the South Asian monsoons, J. Climate, 18, 2067–2079, 2005.
Takaya, K. and Nakamura, H.: A formulation of a phase-independent wave-activity flux for stationary and migratory quasigeostrophic eddies on a zonally varying basic flow, J. Atmos. Sci., 58, 608–627, 2001.
Wang, Y., Gao, W., Wang, S., Song, T., Gong, Z., Ji, D., Wang, L., Liu, Z., Tang, G., and Huo, Y.: Contrasting trends of PM2.5 and surface-ozone concentrations in China from 2013 to 2017, Natl. Sci. Rev., 7, 1331–1339, 2020.
Wang, Z., Wu, R., Chen, Z., Zhu, L., Yang, K., Liu, K., and Yang, Y.: Decreasing influence of summer snow cover over the Western Tibetan Plateau on East Asian precipitation under global warming, Front. Earth Sci., 9, 787971, https://doi.org/10.3389/feart.2021.787971, 2021.
Wu, N., Geng, G., Xu, R., Liu, S., Liu, X., Shi, Q., Zhou, Y., Zhao, Y., Liu, H., Song, Y., Zheng, J., Zhang, Q., and He, K.: Development of a high-resolution integrated emission inventory of air pollutants for China, Earth Syst. Sci. Data, 16, 2893–2915, https://doi.org/10.5194/essd-16-2893-2024, 2024.
Xiao, Q., Zheng, Y., Geng, G., Chen, C., Huang, X., Che, H., Zhang, X., He, K., and Zhang, Q.: Separating emission and meteorological contributions to long-term PM2.5 trends over eastern China during 2000–2018, Atmos. Chem. Phys., 21, 9475–9496, https://doi.org/10.5194/acp-21-9475-2021, 2021.
Xiao, X., Liu, R., Yu, Y., Zhang, Z., Knibbs, L. D., Jalaludin, B., Morawska, L., Dharmage, S. C., Heinrich, J., and Papatheodorou, S.: Evidence of interactive effects of late-pregnancy exposure to air pollution and extreme temperature on preterm birth in China: a nationwide study, Environ. Res. Lett., 18, 094017, https://doi.org/10.1088/1748-9326/aceb0b, 2023.
Xie, B., Yang, Y., Wang, P., and Liao, H.: Impacts of ENSO on wintertime PM2.5 pollution over China during 2014–2021, Atmospheric and Oceanic Science Letters, 15, 100189, https://doi.org/10.1016/j.aosl.2022.100189, 2022.
Xie, L., Yan, T., Pietrafesa, L. J., Karl, T., and Xu, X.: Relationship between western North Pacific typhoon activity and Tibetan Plateau winter and spring snow cover, Geophysical research letters, 32, L16703, https://doi.org/10.1029/2005GL023237, 2005.
Yao, T., Thompson, L., Yang, W., Yu, W., Gao, Y., Guo, X., Yang, X., Duan, K., Zhao, H., and Xu, B.: Different glacier status with atmospheric circulations in Tibetan Plateau and surroundings, Nat. clim. Change, 2, 663–667, 2012.
Yao, T., Wu, F., Ding, L., Sun, J., Zhu, L., Piao, S., Deng, T., Ni, X., Zheng, H., and Ouyang, H.: Multispherical interactions and their effects on the Tibetan Plateau's earth system: a review of the recent researches, Natl. Sci. Rev., 2, 468–488, 2015.
Yao, T., Xue, Y., Chen, D., Chen, F., Thompson, L., Cui, P., Koike, T., Lau, W. K.-M., Lettenmaier, D., and Mosbrugger, V.: Recent third pole's rapid warming accompanies cryospheric melt and water cycle intensification and interactions between monsoon and environment: Multidisciplinary approach with observations, modeling, and analysis, B. Am. Meteor. Soc., 100, 423–444, 2019.
Yin, Z., Zhou, B., Chen, H., and Li, Y.: Synergetic impacts of precursory climate drivers on interannual-decadal variations in haze pollution in North China: A review, Sci. Total Environ., 755, 143017, https://doi.org/10.1016/j.scitotenv.2020.143017, 2021.
You, Q., Wu, T., Shen, L., Pepin, N., Zhang, L., Jiang, Z., Wu, Z., Kang, S., and AghaKouchak, A.: Review of snow cover variation over the Tibetan Plateau and its influence on the broad climate system, Earth-Sci. Rev., 201, 103043, https://doi.org/10.1016/j.earscirev.2019.103043, 2020.
Zhai, S., Jacob, D. J., Wang, X., Shen, L., Li, K., Zhang, Y., Gui, K., Zhao, T., and Liao, H.: Fine particulate matter (PM2.5) trends in China, 2013–2018: separating contributions from anthropogenic emissions and meteorology, Atmos. Chem. Phys., 19, 11031–11041, https://doi.org/10.5194/acp-19-11031-2019, 2019.
Zhang, X. and Gao, M.: Unveiling future individual and compound heat and air pollution extremes in China: insights for mitigation, B. Am. Meteor. Soc., BAMS-D-25-0333.0331, https://doi.org/10.1175/BAMS-D-25-0333.1, 2026.
Zhang, X., Gao, M., and Carmichael, G. R.: Foreseeable Co-occurring O3 and PM2.5 Pollution in Eastern China Driven by Climate Teleconnections, ACS Environmental Au, 5, 625–635, 2025.
Zhang, X., Xiao, X., Wang, F., Brasseur, G., Chen, S., Wang, J., and Gao, M.: Observed sensitivities of PM2. 5 and O3 extremes to meteorological conditions in China and implications for the future, Environ. Int., 168, 107428, https://doi.org/10.1016/j.envint.2022.107428, 2022.
Zhao, P. and Chen, L.: Climatic features of atmospheric heat source/sink over the Qinghai-Xizang Plateau in 35 years and its relation to rainfall in China, Sci. China Ser. D, 44, 858–864, 2001.
Zhao, W., Chen, S., Zhang, H., Wang, J., Chen, W., Wu, R., Xing, W., Wang, Z., Hu, P., and Piao, J.: Distinct impacts of ENSO on haze pollution in the Beijing–Tianjin–Hebei region between early and late winters, J. Climate, 35, 687–704, 2022.
Zhou, B., Qu, H., Du, X., Yang, B., and Liu, F.: Air quality and inbound tourism in China, Tourism Analysis, 23, 159–164, 2018.